
Mechanisms of Selected Anionic Dye Removal by Clinoptilolite


1
Department of Chemistry, California State University, Sacramento, 6000 J Street, Sacramento, CA 95819, USA
2
Department of Geosciences, University of Wisconsin–Parkside, 900 Wood Road, Kenosha, WI 53144, USA
*
Authors to whom correspondence should be addressed.
Crystals 2022, 12(5), 727; https://0-doi-org.brum.beds.ac.uk/10.3390/cryst12050727
Submission received: 18 April 2022
/
Revised: 12 May 2022
/
Accepted: 16 May 2022
/
Published: 19 May 2022
(This article belongs to the Special Issue Feature Papers on "Hybrid and Composite Crystalline Materials" 2021-2022)
Abstract
:The extensive use of color dyes in modern society has resulted in serious concerns of water contamination. Many organic dyes bear charges; thus, materials of opposite charges have been tested for sorptive removal. However, the results from several studies also showed that anionic dyes methyl orange (MO) and alizarin red S (ARS) could be removed from water using minerals of negative charges, but the mechanisms were not addressed. In this study, negatively charged clinoptilolite was tested for its removal of anionic dyes MO and ARS from water under different physico-chemical conditions and to investigate the mechanism of Mo and ARS removal. The sorption capacities were 166 and 92 mmol/kg for MO and ARS, respectively, confirming the uptake of anionic dyes on negatively charged framework silicates. The influence of solution pH and ionic strength on MO removal was minimal, indicating the strong affinity of anionic dyes for clinoptilolite in comparison to other inorganic species. It was speculated that the N in the dimethyl group may bear a partial positive charge, which may have a net electrostatic attraction to the negatively charged mineral surfaces for MO sorption. For ARS, sorption may involve hydrogen bonding formation between the dye and the clinoptilolite. Moreover, under the experimental conditions, the MO molecules form dimers in solution via dimeric π-π interactions. Thus, the sorption of the dimers or aggregation of the MO monomers and dimers on clinoptilolite surface was attributed to additional MO removal, as suggested by molecular dynamic simulations. The speculation was supported by FTIR analyses and molecular dynamic simulations. As such, negatively charged Earth materials may be used as sorbents for the removal of certain anionic dyes via sorption, a new perspective for the innovative use of Earth materials.
1. Introduction
The extensive use of color dyes in modern society has resulted in their widespread contamination of surface water in different parts of the world. As such, the effective removal of dyes from wastewater has become an urgent issue. Dye removal could be mechanistically divided into sorptive removal and degradative removal. For sorptive removal, the affinity of the dyes for the sorbent surface and the interaction mechanisms are the important factors for consideration. For degrative removal, effective yet inexpensive catalysts, fast reaction rate, and reduced toxicity of the degradation products are the key influencing parameters.
The fundamentals of dyes are the key factors for removal efficacy. Dyes can be divided into cationic, zwitterionic, and anionic dyes based on the net charges when dissolved in solution. Methyl orange (MO) is a water soluble anionic azo dye extensively used in several industries including textile, paper, printing, and food industries, but it also has carcinogenicity, genotoxicity, and mutagenicity [1]. It is stable and not easily degraded [2]. As such, its sorptive removal may be more promising. Due to its net negative charges in solution, layered double hydroxides (LDH) that bear positive charges on the surface were studied for its removal [3]. Similarly, alizarin red S (ARS) is also an anionic dye. It has been used for decades to evaluate calcium-rich deposits by cells in culture [4]. Again, due to its negative charges for ARS, LDH was studied for its removal of ARS [5].
In addition to the dye fundamentals, the sorbent materials are also important in sorptive removal of dyes from solution. Earth materials, mostly clay minerals and zeolites, were extensively evaluated for the removal of emerging contaminants from water, due to their vast reserve, large specific surface area (SSA), and high cation exchange capacity (CEC). However, due to similar charges between the anionic dyes and negatively charged sorbents, modifications were often made. For example, montmorillonite (MT) was modified with a cationic surfactant hexadecyltrimethylammonium (HDTMA) to increase ARS sorption [6] or was intercalated with chitosan or modified with cationic surfactant to drastically increase MO sorption [7,8,9,10,11]. Similarly, zeolite was also modified by cationic surfactants to enhance MO sorption [12,13,14]. Composite materials of zeolite with other metals or organics fabricated into nanofibrous materials also showed drastic MO sorption [15,16]. However, these modifications would drastically increase the material costs.
Opposite to the modification to reverse surface charge, MO removal by negatively charged raw clay minerals was also reported. Overall, they were made of illite and mixtures of illite and kaolinite, with the MO removal slightly lower than the CEC values [17,18,19]. In addition, swelling clay minerals also showed significant MO sorption [20,21,22]. To the extreme, MO sorption on ulexite, a boron mineral, can reach 1477.6 mg/g [23]. In addition to batch study, MO removal by MT and acid-activated MT was evaluated from fixed bed experiments. The MO removal capacity increased up to 8 times, while the sorption rate decreased by 2–4 times after acid activation [24].
Similar to negatively charged phyllosilicates, zeolite, a negatively charged framework silicate synthesized from fly ash, was evaluated for the removal of MO under different types of modifications, primarily using cationic surfactants [25,26,27,28]. Separately, simultaneous MO and safranin-T (ST) removal by synthetic NaX zeolite also showed great promise, but the test was somehow problematic, as the amount of MO and ST input was much higher than the NaX zeolite at the value of 250 mL of 5 mg/L solution to 1 mg of NaX [29]. Zeolite was also evaluated for MO degradation after being doped by Ag and in the presence of borohydride, with 50% of MO degraded in 43 min [30]. MO removal using artificial zeolites beads, which were used for the removal of heavy metal via the ionic exchange process and then treated with 1.0 M HCl, reached a capacity of about 100 mg/g [31]. Still, neither chemical composition nor the types of zeolites were specified in their study.
As zeolite is a group of tectosilicates and clinoptilolite is a species of the zeolite group, the research on dye, particularly anionic dye removal by clinoptilolite, is limited. The sorption of an anionic dye amido black 10B on clinoptilolite resulted in a capacity of 11 mg/kg, in contrast to 55 mg/kg for a cationic dye safranine T sorption on the same mineral [32]. Clinoptilolite showed a sorption capacity of 0.9 mmol/kg for anionic dye direct red 23 after being acid-modified [33]. Significant MO decolorization by CuS-incorporated clinoptilolite was observed [34]. The sorption of three anionic dyes Everzol Black B, Everzol Red 3BS, and Everzol Yellow 3RS H/C on clinoptilolite was up to 0.35 mg/g, but the mechanism of the dye removal was not discussed [35]. The sorption of an anionic dye Congo red (CR) on raw and Fe3+-grafted clinoptilolite showed a reversal of zeta potential to positive after grafting and resulted in a CR sorption capacity of 37 mg/g, in comparison to 17 mg/g (about 24 mmol/kg) on raw clinoptilolite [36]. The significant amounts of dye sorption on raw clinoptilolite were attributed to the electrostatic attraction between the protonated SiO4 surfaces and the negative charges of CR [36]. In contrast to MO, few reports were made for ARS removal by zeolite. An SSZ-13 zeolite synthesized from coal bottom ash showed ARS removal with a capacity of 210 mg/g [37].
Although several studies were conducted on MO removal using negatively charged Earth materials [17,18,19,20,21,22], the mechanisms of MO removal were mostly not addressed. By common perception, MO should be repulsed from the negatively charged mineral surface. However, the MO sorption data in the literature [17,18,19,20,21,22,32,33,34,35] attracted our attention to elucidate the MO removal mechanism using negatively charged Earth materials. As such, our goals were (1) to evaluate framework clinoptilolite as the sorbent for the removal of anionic using MO and ARS under different physico-chemical conditions; (2) to characterize sorbents after equilibrated with different amounts of MO and ARS; and (3) to address the mechanism of MO and ARS sorption on clinoptilolite using instrumental characterization and molecular dynamic simulation; and (4) to shed a light on future studies and applications using Earth materials for the removal of certain types of organic anions from water.
2. Materials and Methods
2.1. Materials
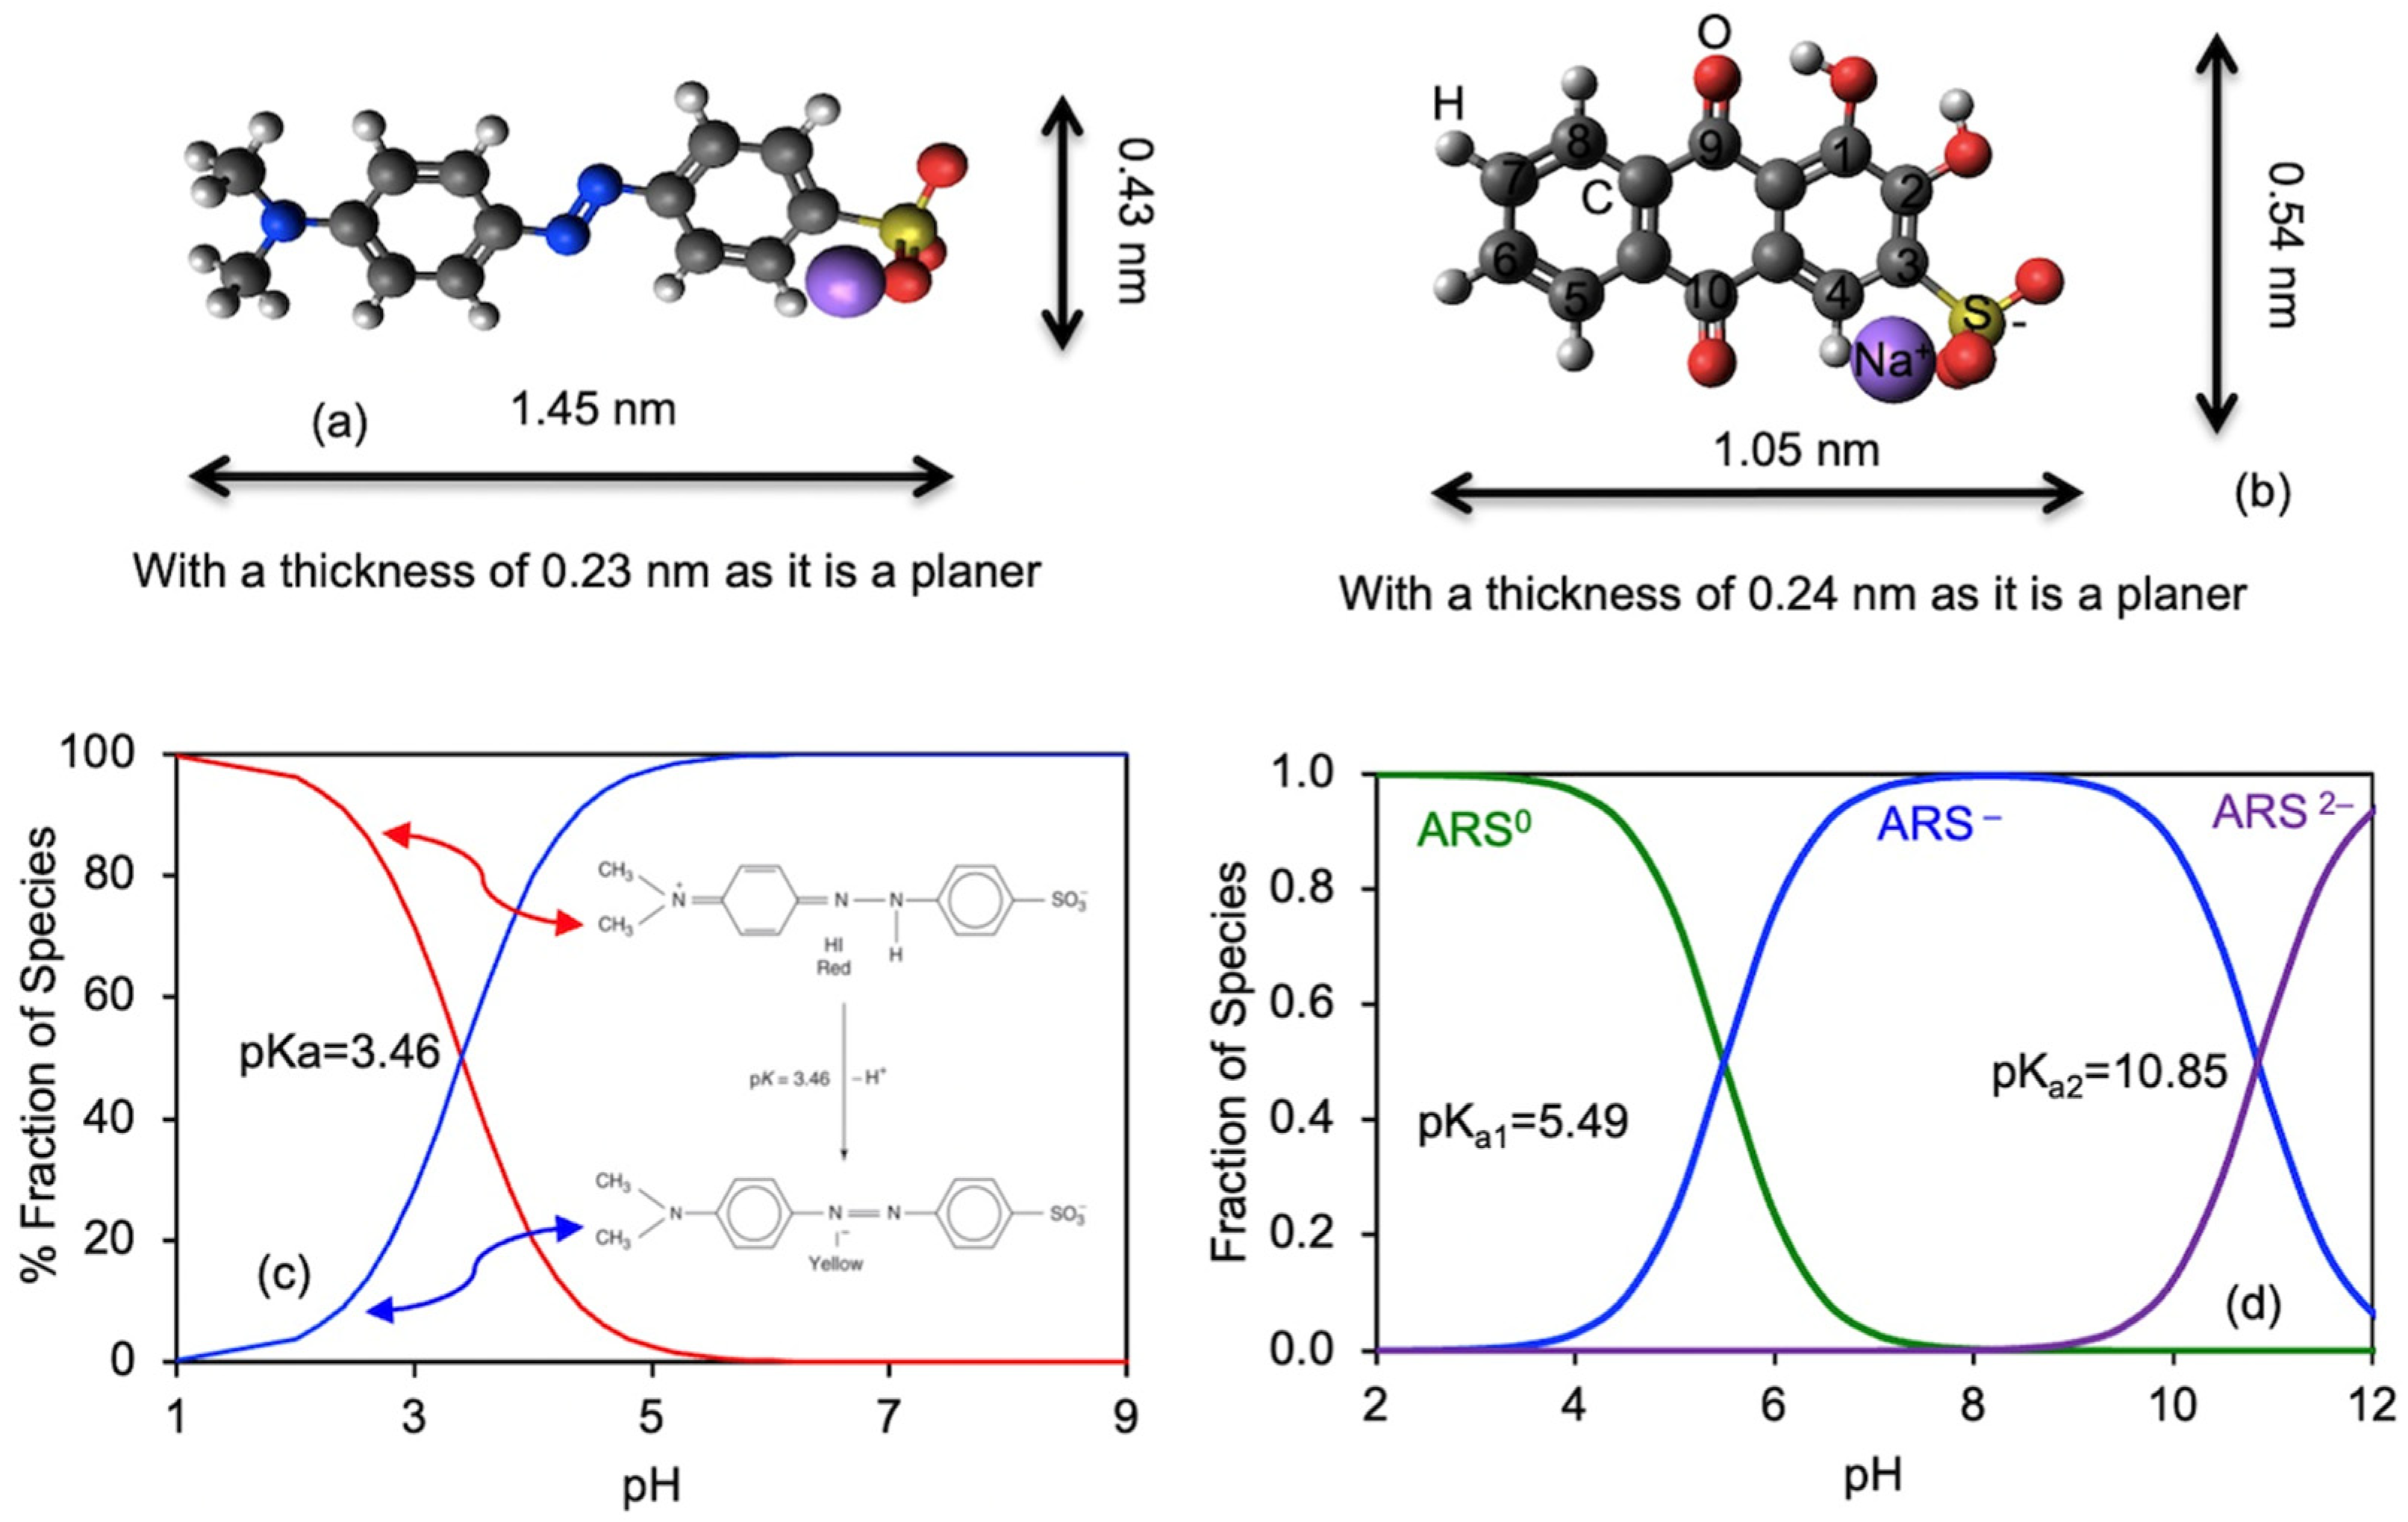
The MO (called Orange III, helianthine) used has an IUPAC name of sodium; 4-[[4-(dimethylamino)phenyl]diazenyl]benzenesulfonate, a formula of C14H14N3NaO3S, and a CAS# of 547-58-0. The ARS used has an IUPAC name of 3,4-dihydroxy-9,10-dioxo-9,10-dihydroanthracene-2-sulfonic acid and a CAS # of 130-223. Both are certified ACS grade and were purchased from Fisher Scientific (Hampton, NH, USA). Their molecular structures and pH speciation diagrams are illustrated in Figure 1. Both are in the Na+ form with a formula mass of 327.33 g/mol for MO and 360.28 g/mol for ARS. The MO has a melting point of 300 °C and is water soluble [38]. It has a pKa value of 3.47 [39], below which the nitrogen bound to the dimethyl group is protonated and positively charged (Figure 1c) and the solution is red; while above, the nitrogen is deprotonated and the solution is yellow in color [40]. The ARS is also water soluble, with a solubility of 77 g/L [41]. Its melting point is about 145 °C based on thermal gravity analyses [42]. It changes color with solution pH from yellow to orange (pH 2–5), orange to red (pH 5–9) and red to purple (pH 9–11) [43]. It has pKa values of 5.49 and 10.85 [44].
The clinoptilolite used was provided by St. Cloud Mine in Winston, NM, USA. It is commercially available and its material characterization has been extensively carried out. It has a particle size less than 200 mesh (0.074 mm), an SSA value of 15.7 m2/g, and an external CEC (ECEC) value of 90 meq/kg [45].
2.2. Sorption Experiments
For all the studies, 0.1 g (for MO study) or 0.2 g (for ARS study) of clinoptilolite and 10 mL of dye solution were mixed in 50 mL centrifuge tubes. The initial concentrations varied from 0.01 to 2.0 mM for the isotherm study and 1.0 mM for all the other studies. For the pH study, the solution pH was periodically checked and adjusted to close to the values of 2 to 11 at equilibrium. For the ionic strength study, the ionic strengths of the solution were set at 0.001, 0.01, 0.1, and 1.0 M NaCl by mixing 5.0 mL of 2.0 mM dye solution with 5.0 mL of 0.001, 0.02, 0.2 and 2.0 M NaCl, respectively. For the temperature study, the samples were equilibrated at 23, 33, 43, and 53 °C. The mixtures were shaken for 24 h at 150 rpm for all the experiments, except for the kinetic study, in which 0.1, 0.25, 0.5, 1.0, 2.0, 4.0, 8.0, and 24.0 h were used. Duplicates were run under each experimental condition. After equilibrium, the mixtures were centrifuged for 10 min at 3500 rpm, followed by filtering the supernatants with 0.45 µm syringe filters and then analyzed for equilibrium dye concentrations using UV–Vis methods.
2.3. Instrumental Analyses
The maximum UV–Vis absorbance of MO was found at 464 nm [46]. Meanwhile, the MO dimer had a maximum UV–Vis absorbance at 463 nm under unprotonated form with zero acidity and the isosbestic point was found at 480 nm [47]. This wavelength was used in the current study. Proper dilution was carried out to make the final absorbance values less than 1.00. For ARS, the peaks were different under different equilibrium solution pHs. As such, it was analyzed at 420 nm for pHs up to 8, and 530 between pH 8 and 11. The calibrations were made using pH values of 3, 5, 7, 9, and 11 using both wavelengths and the equilibrium ARS concentrations were determined by measuring the equilibrium pH and using the calibrations corresponding to the pH.
For FTIR analyses, a Shimadzu 8100 spectrometer equipped with a quartz ATR was used and the samples were scanned from 400 to 4000 cm–1 with a resolution of 4 cm–1. For the X-ray diffraction analyses, a Shimadzu 6100 X-ray diffractometer with a Ni filtered CuKα radiation at 30 kV and 40 mA was used. The samples were scanned from 5–45° or 5–55° (2θ) at a scanning speed of 2°/min for the samples after MO and ARS sorption.
2.4. Molecular Dynamic Simulations
Molecular dynamic simulation was performed using Materials Studio 6.0 software (BIOVIA, San Diego, CA, USA) with the ‘FORCITE” module to investigate the interactions between the dyes and clinoptilolite surfaces to speculate the potential configurations of sorbed dye molecules and the mechanisms of interaction on different crystallographic faces. The unit cell parameters of the clinoptilolite were a = 1.769 nm; b = 1.790 nm; c = 0.741 nm; and β = 116.3°. The supercells were built with 2a × 4c; 2b × 4c; and 2a × 2b. The numbers of dye molecules used for the simulation were based on the sorption capacity of the dye from the isotherm study and the SSA of the clinoptilolite. The simulation was run at 298 K and the constructed model was optimized geometrically.
3. Results
3.1. Isotherms of MO and ARS Sorption
The isotherm study was conducted first to determine the sorption capacity and to set the initial concentrations for other studies. The measurement of 24 h was used for the isotherm study to ensure that equilibrium could be reached and the kinetic results confirmed that 24 h was sufficient (see later). The data were fitted to Freundlich, Langmuir, and Temkin models and plotted in Figure 2a,b. For MO, the Langmuir isotherm model resulted in the best fit to the experimental data, with an r2 value of 0.929 in comparison to 0.784 and 0.868 for the Freundlich and Temkin fits, respectively. For ARS, the Langmuir isotherm model resulted in the best fit to the experimental data, with an r2 value of 0.995 in comparison to 0.70 and 0.79 for the Freundlich and Temkin fits, respectively. The Langmuir equation is expressed as
where CL and CS are dye concentration in solution (mmol/L) and amount sorbed on clinoptilolite (mmol/kg) at equilibrium and Sm (mmol/kg) and KL (L/mmol) are the Langmuir parameters indicating the capacity of dye sorption on and affinity of dye for clinoptilolite. Equation (1) can be transformed into a linear form to calculate the fitted parameters from linear regression and is demonstrated by the following equation:
For MO, the fitted Sm and KL values were 166 mmol/kg, or 54 mg/g, and 24 L/mmol, respectively. The Sm value was almost twice the ECEC value of 90 meq/kg for the clinoptilolite [45]. In comparison, the Sm values of MO sorption were 82 to 181 mg/g on some Morocco clays, with their CEC values of 9–171 meq/kg [17], 13.7 mg/g on a different Morocco clay mainly made of kaolinite [18], and 113 mg/g on another Morocco clay made of kaolinite and smectite with a CEC value of 253 meq/kg [19]. All these clay minerals bear negative charges on their surfaces. For ARS, the fitted Sm and KL values were 92 mmol/kg, or 32 mg/g, and 129 L/mmol, respectively. In comparison, the ARS sorption on SSZ-13 zeolite converted from coal bottom ash showed an Sm value of 210 mg/g, or about 580 mmol/kg [37]. The results from the isotherm study confirmed previous studies of MO sorption on negatively charged clay minerals [17,18,19] and suggested that, in addition to phyllosilicates, framework silicates zeolites are also good candidates for the sorptive removal of anionic dye MO and ARS from solution. As such, other physico-chemical conditions that affect MO and ARS sorption need to be evaluated and detailed mechanisms of MO and ARS uptake on negatively charged mineral surfaces need to be addressed.
The separation factor (RL) was used to estimate a solute sorption toward an adsorbent by
where C0 (mmol/L) is the initial solute concentration. The value of RL would be an indication of the nature of solute sorption with favorable sorption when 0 < RL < 1, linear sorption when RL = 1, and unfavorable sorption when RL > 1 [48]. For MO, the RL values in the isotherm study were all <0.4, and 0.05 when an initial concentration of 1.0 mM was used for all the other studies, suggesting a favorable uptake of MO on the clinoptilolite, which is confirmed in the thermodynamic study of MO sorption by the negative values of free energy for MO sorption (see later). Similarly, for ARS, the RL values in the isotherm study were all < 0.04, and 0.01 when an initial concentration of 1.0 mM was used for all the other studies, also suggesting a favorable uptake of ARS on the clinoptilolite.
3.2. Kinetics of MO and ARS Sorption
At an initial concentration of 1.0 mM, the sorption of MO and ARS on the clinoptilolite was fast, reaching equilibrium at about 4 h for MO and less than an hour for ARS (Figure 2c,d). The data were fitted to several kinetic models including first order, pseudo-second order, and intraparticle diffusion (Figure 2c,d) and the pseudo-second order kinetics fitted the experimental best based on the comparison of r2 values. It has the form of
It can be re-arranged into a linear form, which is demonstrated by the following equation:
Furthermore, the parameters can be determined by Equation (5) linearly. In the above equations, k (kg/mmol/h) is the rate constant and kqe2 (mmol/kg/h) is the initial rate of dye sorption on clinoptilolite, qt and qe (mmol/kg) are the amounts of dye sorbed at time t and at equilibrium. The fitted qe values were 92 and 50 mmol/kg for MO and ARS sorption on the clinoptilolite, respectively, with the coefficient of determination r2 = 0.999. The initial rates kqe2 and the rate constants k for MO and ARS sorption on the clinoptilolite were 400 and 670 mmol/kg/h and 0.05 and 0.3 kg/mmol/h, respectively. In comparison, the qe values were 96 and 76 mmol/kg and the kqe2 values were 595 and 213 mmol/kg/h for TB and SO sorption from a single solution on the same clinoptilolite, respectively, ref. [49] and the k and qe values for TB sorption on a clinoptilolite were about 200 g/mol/s and 90 mmol/kg [50]. The similar qe and kqe2 values again confirmed the capability of negatively charged Earth minerals to sorb anionic dyes MO and ARS and suggested that similar mechanisms might play a significant role in the sorption of anionic dye MO and ARS vs. cationic dyes TB and SO, further suggesting the need for mechanism study of anionic dye sorption by clinoptilolite.
3.3. Solution pH, Ionic Strength, and Temperature Effects on MO and ARS Sorption
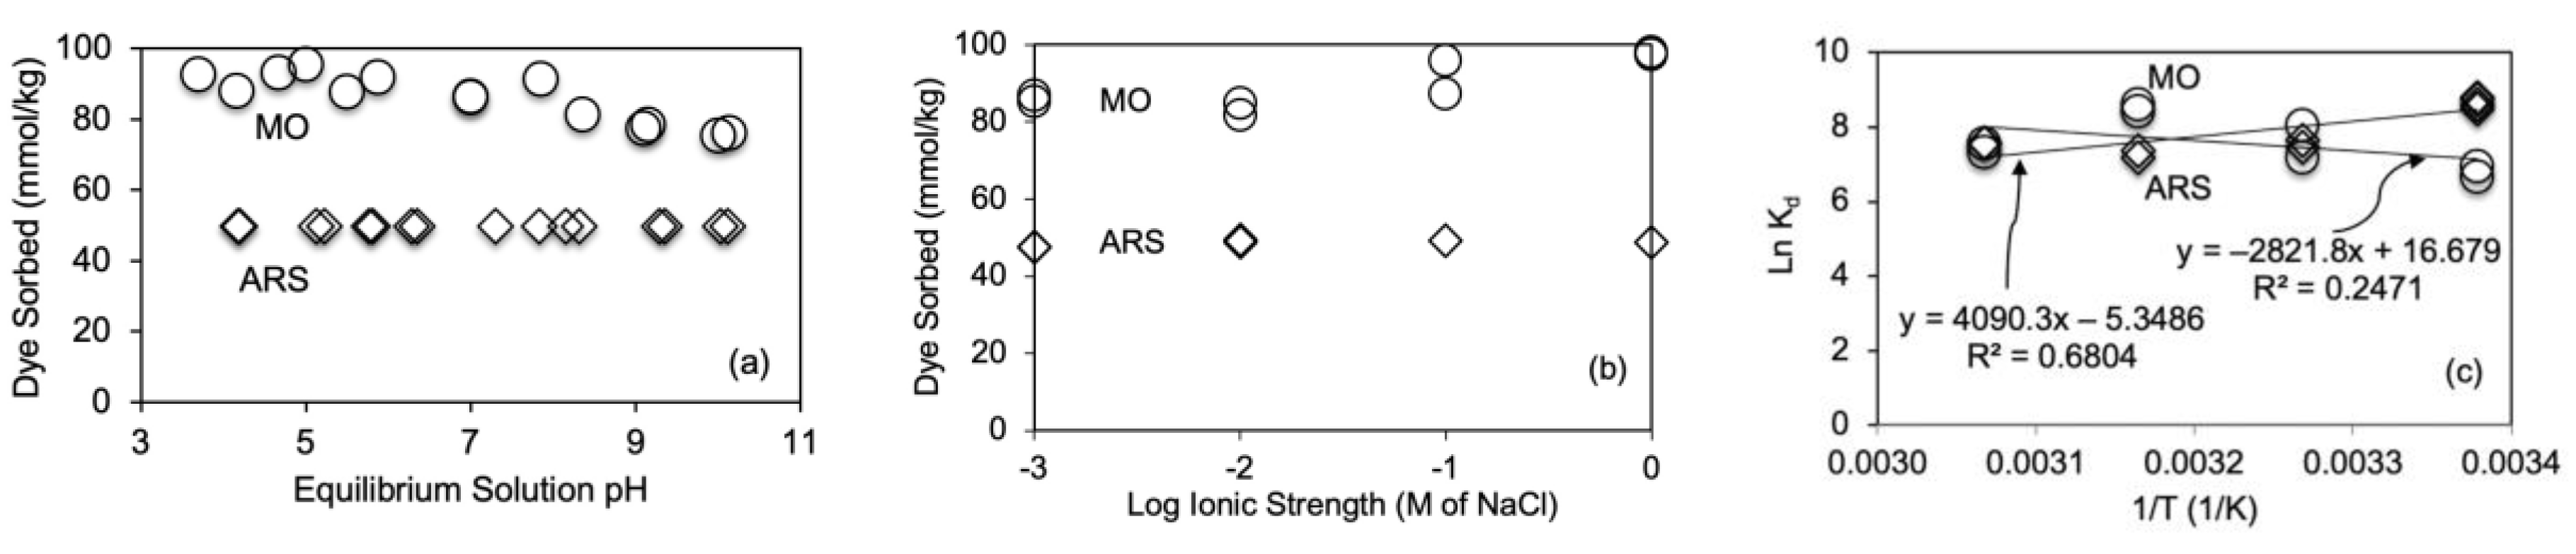
The sorption of MO showed a slightly decreasing trend as the equilibrium solution pH increased (Figure 3a), suggesting a slight competing effect between OH– and MO under high pH conditions. In addition, the net surface charge for clinoptilolite was due to permanent surface charge produced from isomorphic substitution in tetrahedral sites of Si4+ by Al3+, with some originating from the pH-dependent surface charges due to surface protonation (under low pH) and deprotonation (under high pH). For ARS, its removal remained the same at 50 mmol/kg under different equilibrium pH conditions. This is opposite to a previous observation that sorption of ARS on SSZ-13 zeolite decreased from 100 to 20 mg/g as solution pH increased from 3 to 10 [37]. The influence of solution ionic strength on MO and ARS sorption was also minute (Figure 3b), suggesting that the influence of present inorganic cation Na+ and anion Cl– is small for MO and ARS sorption, even though the concentrations were as high as 1.0 M. A similar observation was noticed for cationic dyes TB and SO sorption on the same clinoptilolite [49]. Temperature-wise, MO sorption on clinoptilolite was endothermic, resulting in more MO sorbed under higher temperatures, in contrast to exothermic for ARS sorption (Figure 3c). The thermodynamic parameters of solute sorption are related to the distribution coefficient Kd by
where Kd is the ratio of solute sorbed on solids to the equilibrium solute concentration in solution, ΔH and ΔS are the changes in enthalpy and entropy after MO uptake, R is the gas constant, and T is the temperature in K. ΔH and ΔS can be used to solve the free energy ΔG of solute uptake by
The calculated thermodynamic parameters of MO sorption using Equations (6) and (7) are listed in Table 1, in which the ∆G values were in the ranges of –18 to –22 kJ/mol, reflecting physical sorption, similar to the MO sorption values of –14 to –18 kJ/mol on MT-CT [7], –16 to –19 kJ/mol on nanoparticles of a synthetic zeolite NaA/CuO [12], and −14 to −15 on artificial zeolite [31]. The ∆G value was about 8–10 kJ/mol for MO sorption on a Morocco clay [18] and was only 0.2–0.9 kJ/mol on a bentonite from Algeria [22]. For the same clinoptilolite, the ∆G values were in the ranges of –18 to –24 and –12 to –18 kJ/mol for TB and SO sorption [49]. Thus, MO removal from solution by clinoptilolite was spontaneous and endothermic in nature, due to its negative ∆G and positive ∆H values. The relatively small values of ∆G reflected MO sorption that was mostly physical instead of chemical. Opposite to MO, ARS sorption resulted in negative ∆H values, although ∆G values are similar but of opposite trends.
3.4. XRD and FTIR Analyses
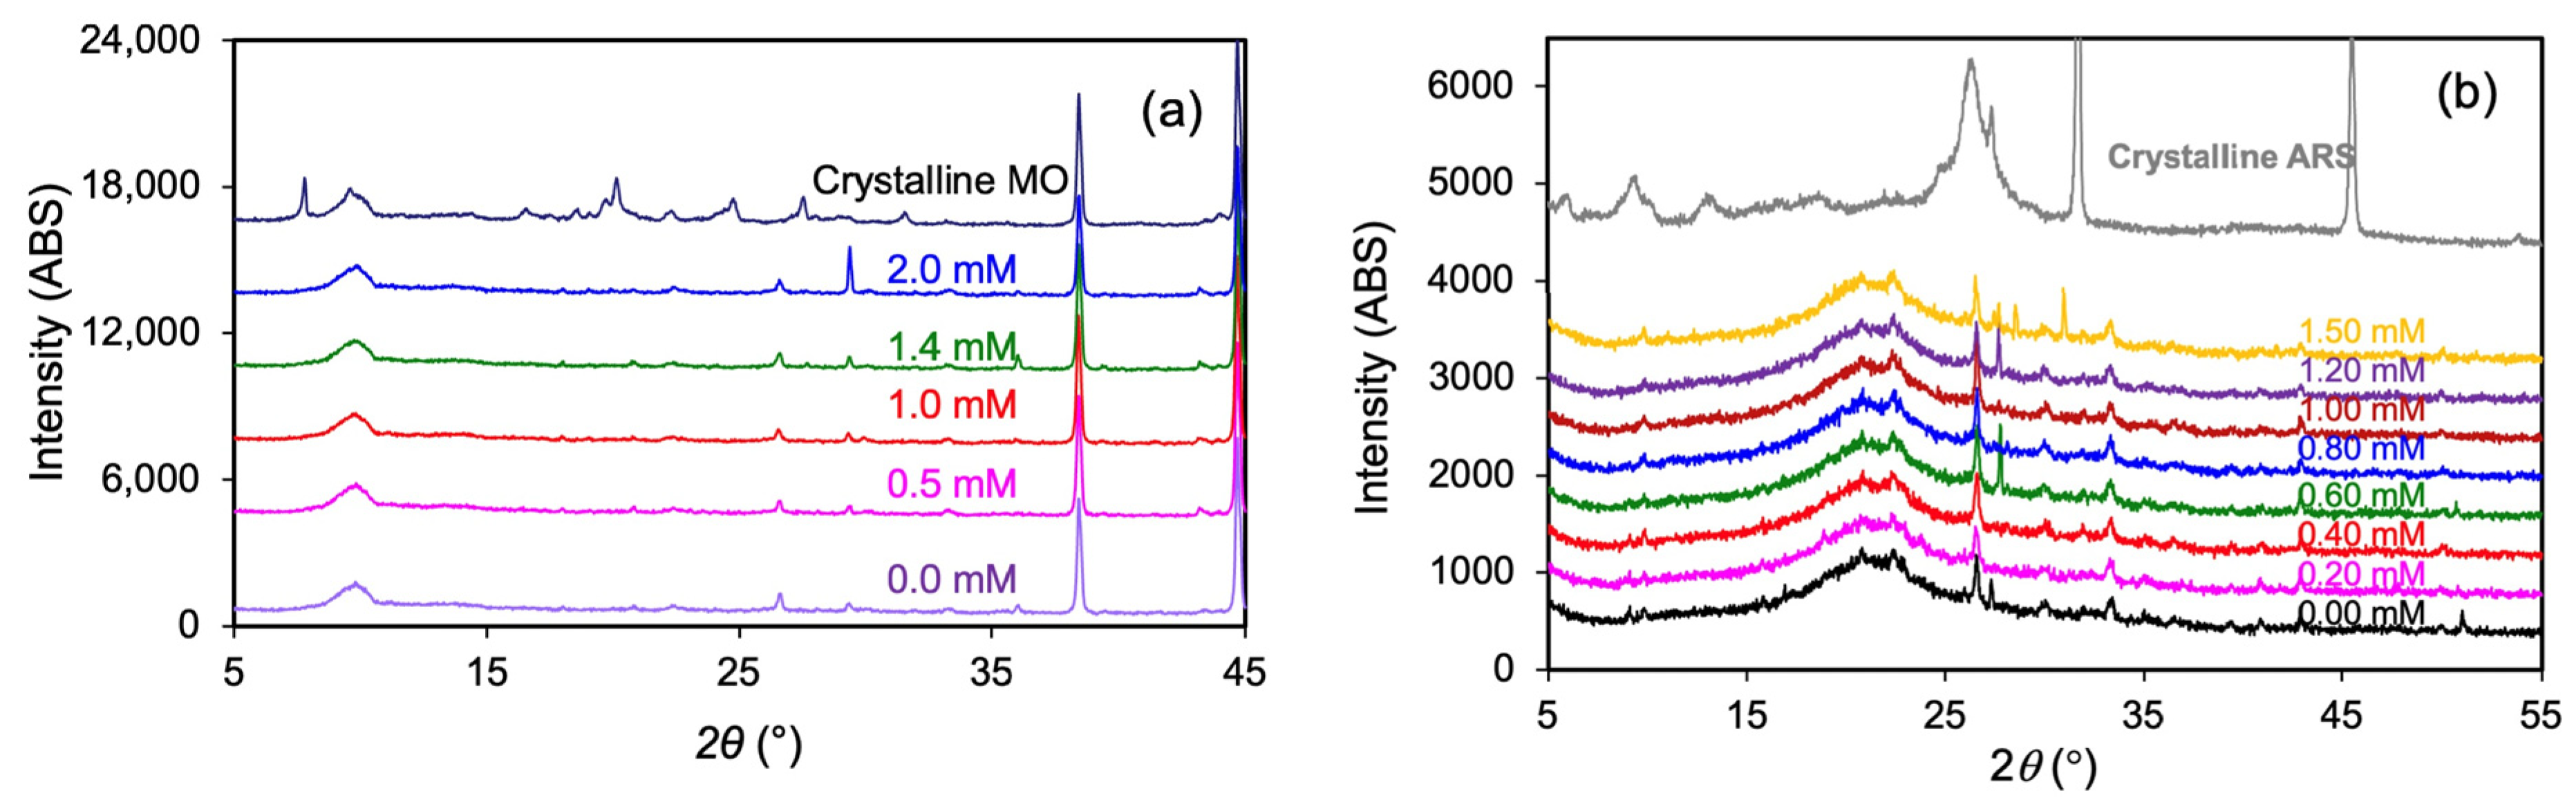
The XRD results of clinoptilolite before and after MO and ARS sorption showed no change in peak locations (Figure 4a). This suggested that MO sorption was on the external surfaces of clinoptilolite. It must be noted that due to the smaller sample size, a micro sample holder made of aluminum was used. As such, the strong peaks at 38.25° and 44.26° (2θ) for the samples with MO sorption were from [111] and [200] diffractions of aluminum [51]. In addition, no peaks corresponding to crystalline MO appeared for the clinoptilolite samples after MO sorption, suggesting that the removal of MO from solution was via sorption instead of precipitation/recrystallization of MO from solution. For crystalline ARS, the peaks at 26.38, 31.72, and 45.44° were to reflections of crystallographic faces [−304], [222], and [–434] [42]. Similarly, the XRD patterns of clinoptilolite after ARS sorption also showed no change in peak locations (Figure 4b), suggesting external surfaces were responsible for ARS uptake. The sample holder was changed to glass to prevent the aluminum peaks. However, the amorphous hump around 20–25° was due to the glass sample holder.
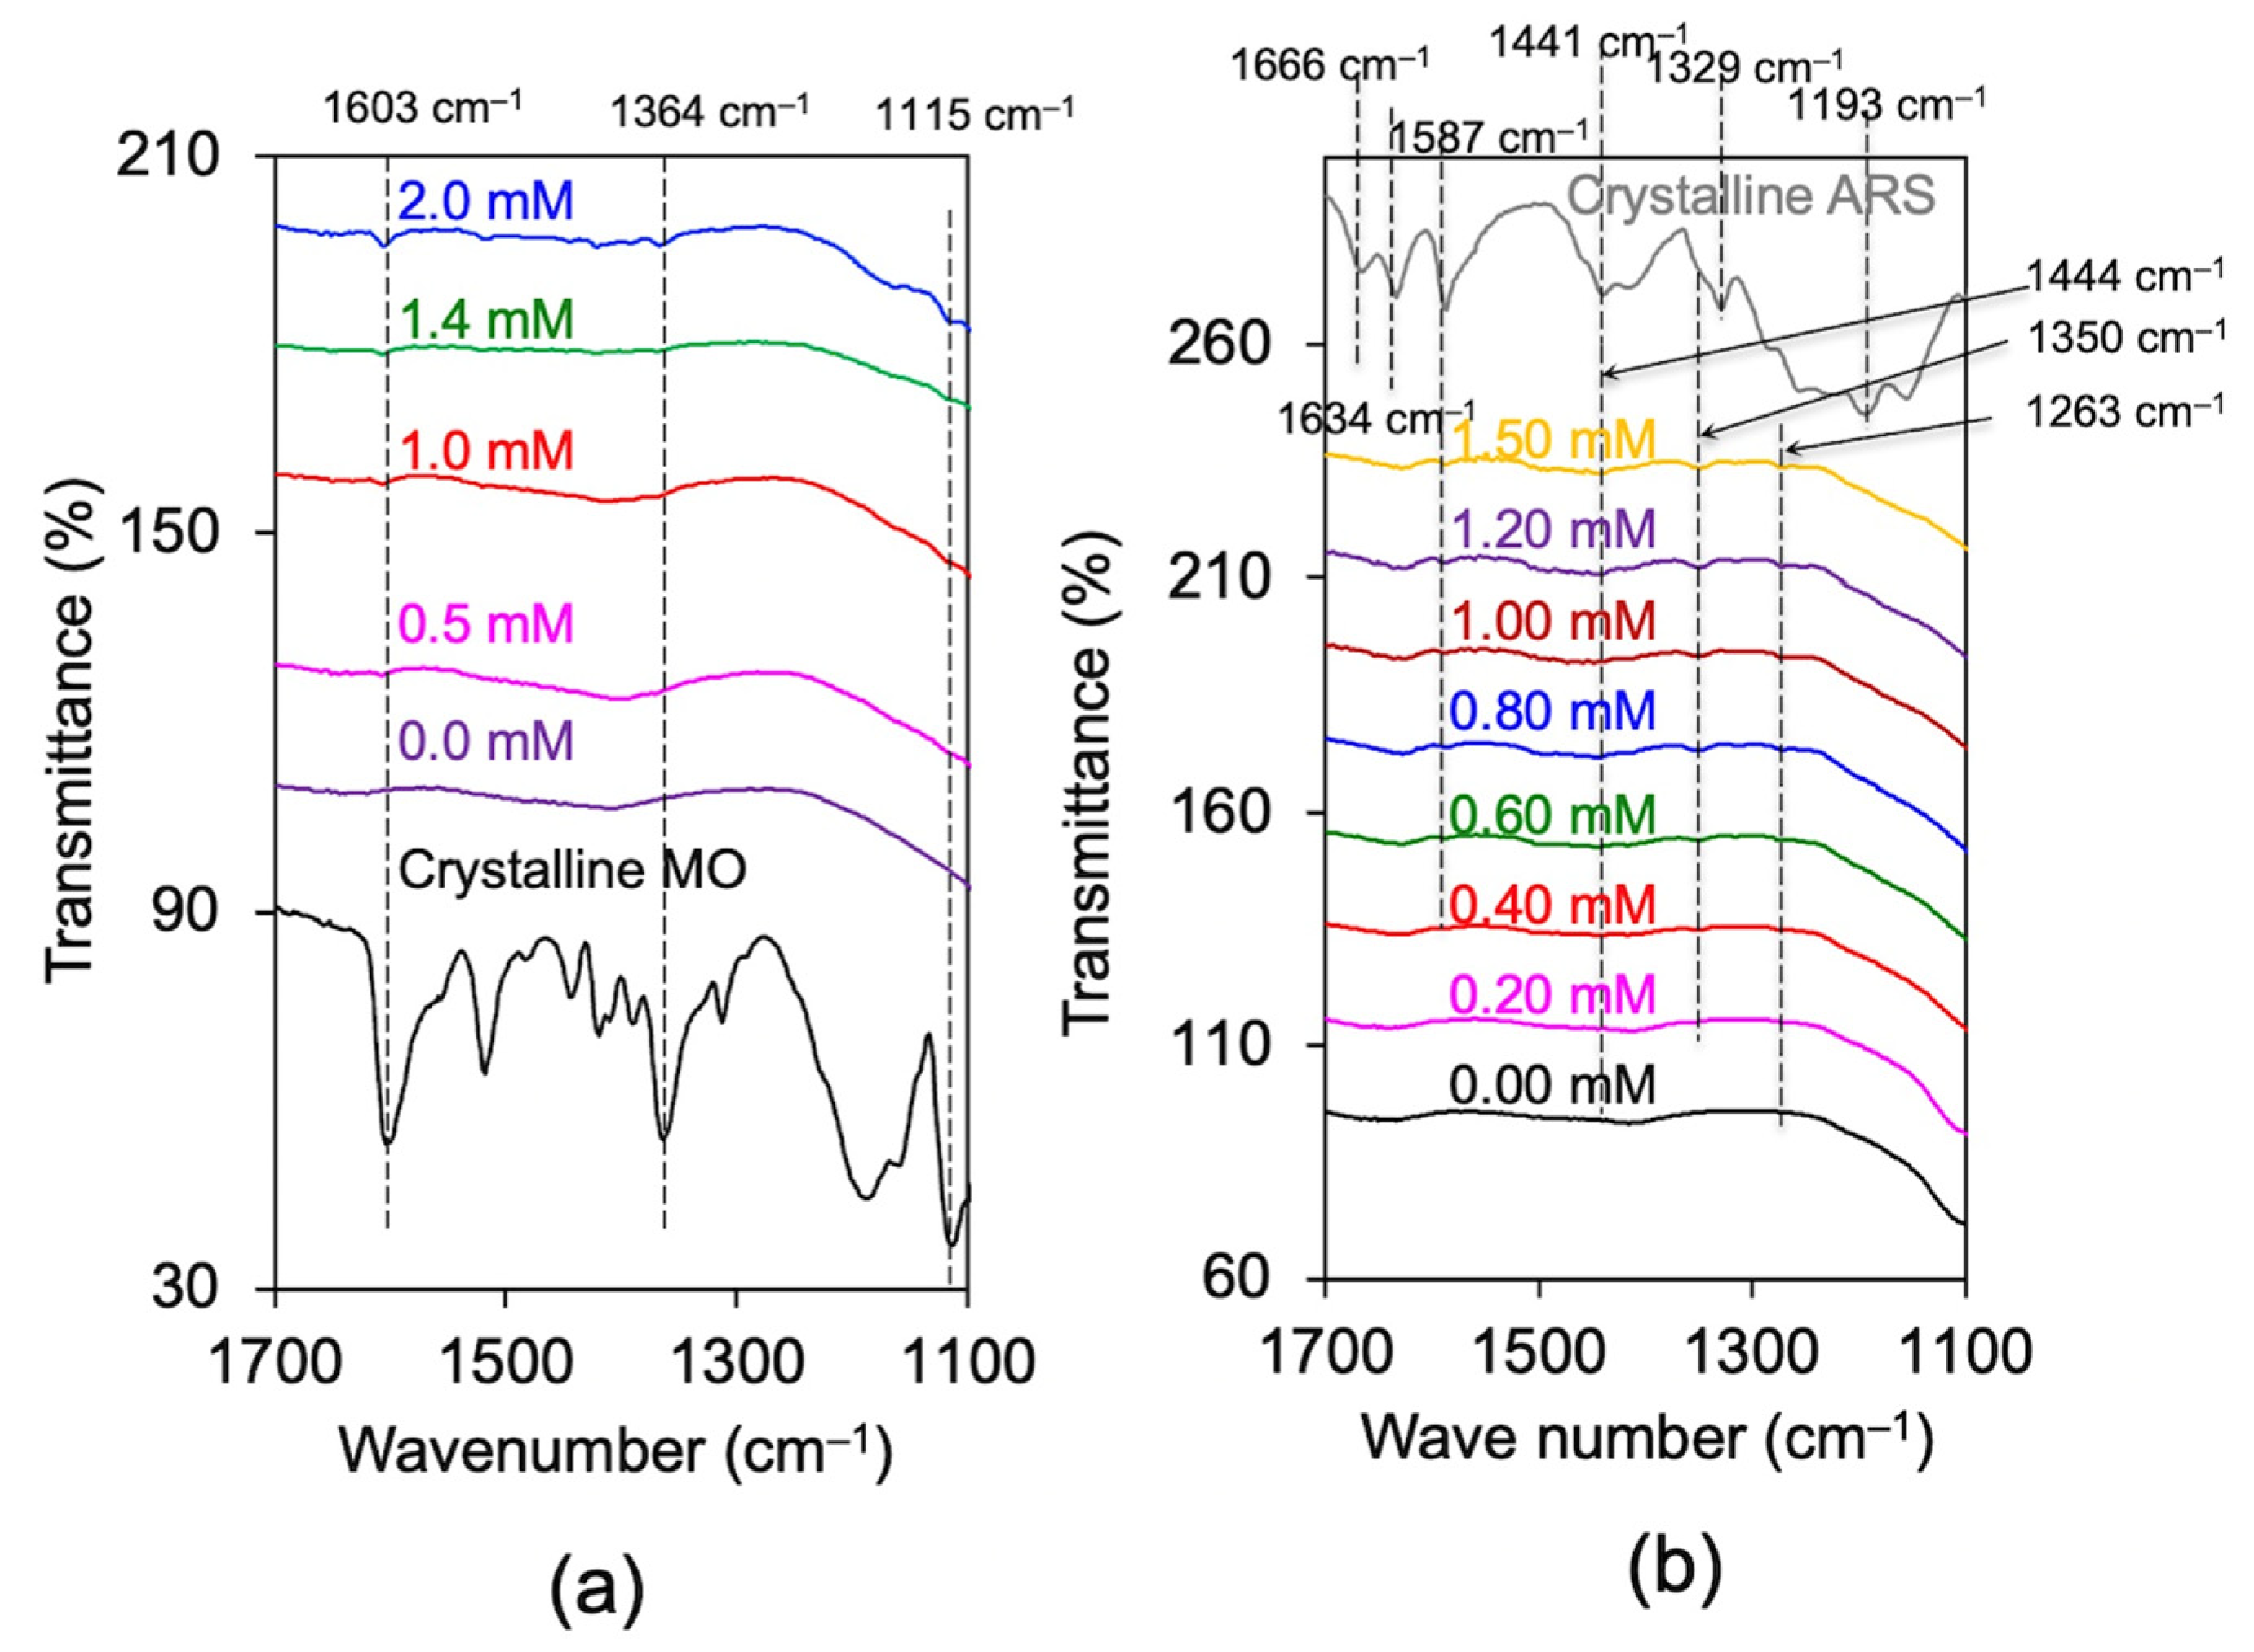
In the FTIR spectra of MO, the –C=C– stretching was observed at 1599 cm–1, the –S=O stretching was observed at 1119.5 cm–1, and the –C=N stretching was observed at 1313.7 cm–1 [40]. In a different study, the bands at 2910, 1519, 1355, and 1115 cm–1 were attributed to –CH3, C=C, C–N, and S=O, respectively [11]. In addition, the bands for νCC vibrations were located at 1606 and 1519 cm–1 and a band located at 1366 cm–1 was assigned to the azo group νN=N vibration [52]. In this study, the –C=C– stretching was observed was at 1603 cm–1, the –C=N band was observed at 1364 cm–1, and the –S=O stretching was observed at 1115 cm–1 (Figure 5a). After sorption, the –C=C– band shifted to 1607 cm–1 and the –C=N stretching shifted to 1371 cm–1 (Figure 5a), suggesting participation of N for the interaction of MO with the clinoptilolite surface and dimeric π-π interactions between MO molecules.
For ARS, the bands at 1634, 1590, 1546, and 1499 cm–1 were assigned to ν (10-C=O), ν (9-C=O), ν (Ar C=C), and ν (C–O), respectively, while the bands at 1191 cm–1 were due to νas(SO3) [53]. In this study, the first two bands were located at 1634, 1587 cm–1 and the νas(SO3) band was located at 1193 cm–1 (Figure 5b). After ARS sorption, the 1193 cm–1 shifted to 1263 cm–1, suggesting participation of SO3 for ARS sorption on clinoptilolite. Alternatively, the bands at 1666, 1635, 1590, 1441, and 1329 cm–1 were assigned to (10-C=O), ν (9-C=O), ν (Ar C=C), ν (Ar C=C), and ν (2-C–O), respectively, while the band at 1236 cm–1 was assigned to hydrous SO3 [54]. The 1329 cm–1 band shifted to 1350 cm–1 and the 1236 cm–1 band shifted to 1263 cm–1 after ARS sorption on clinoptilolite (Figure 5b), suggesting ligand participation of O attached to C2 (Figure 1b) and O on SO3 with Ca2+ on clinoptilolite surfaces.
3.5. Molecular Dynamic Simulation
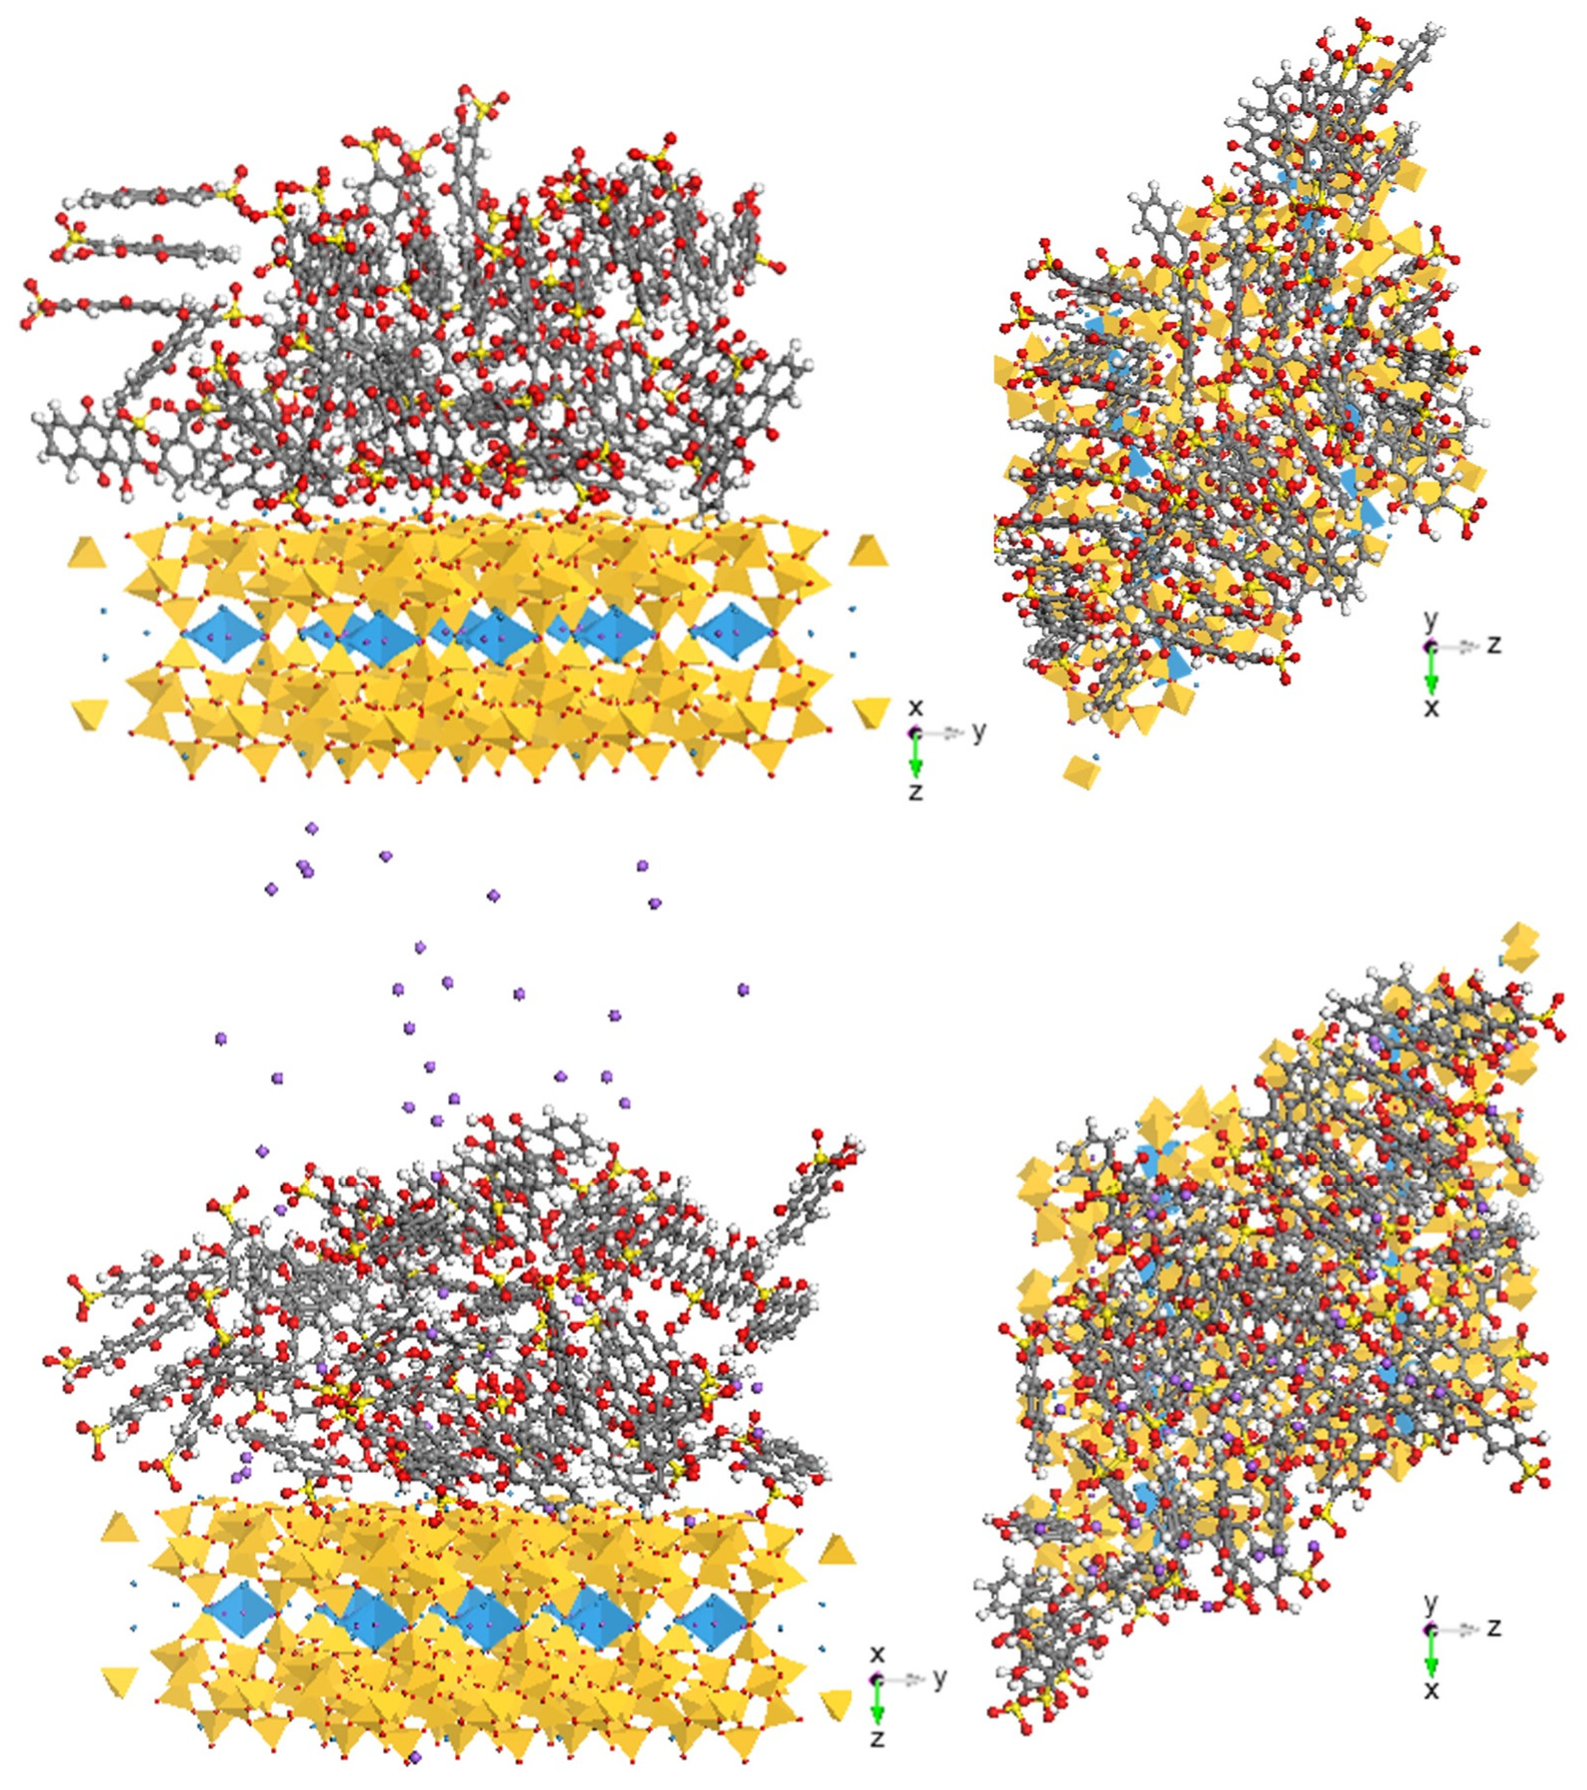
The simulation of MO sorption on crystallographic ac direction is illustrated in Figure 6 and the bc and ab directions can be accessed in the Supplementary Materials (Figures S1 and S2). Due to limited SSA, the aggregation of MO monomers and dimers is anticipated if all the sorbed MO is on the external surfaces of the clinoptilolite. On the other hand, as the dimension of MO is 1.54 by 0.43 by 0.23 nm (Figure 1a) and the channel sizes of the 10-member (tetrahedron) ring and 8-member ring parallel to c crystal direction are 0.44 by 0.72 and 0.41 by 0.47 nm, respectively, and the 8-member ring parallel to a direction is 0.4 by 0.55 nm [55], it is possible that the MO could penetrate the channels of the clinoptilolite. However, the simulation did not have the function to allow molecules to penetrate the internal channel. Furthermore, the kinetic study results showed equilibrium at about 4 h (Figure 2b), also suggesting limited penetrability. As such, the extensive aggregation of MO monomers and dimers indeed showed up on all the different surfaces and the function of added Na+ as counterion did not affect the aggregation of MO monomers and dimers much. The confirmation of MO aggregation on clinoptilolite surface may suggest that molecular self-association played an important role in MO removal from solution and onto solid surfaces, such as phyllosilicates, in previous studies [17,18,19] and tectosilicates in this study.
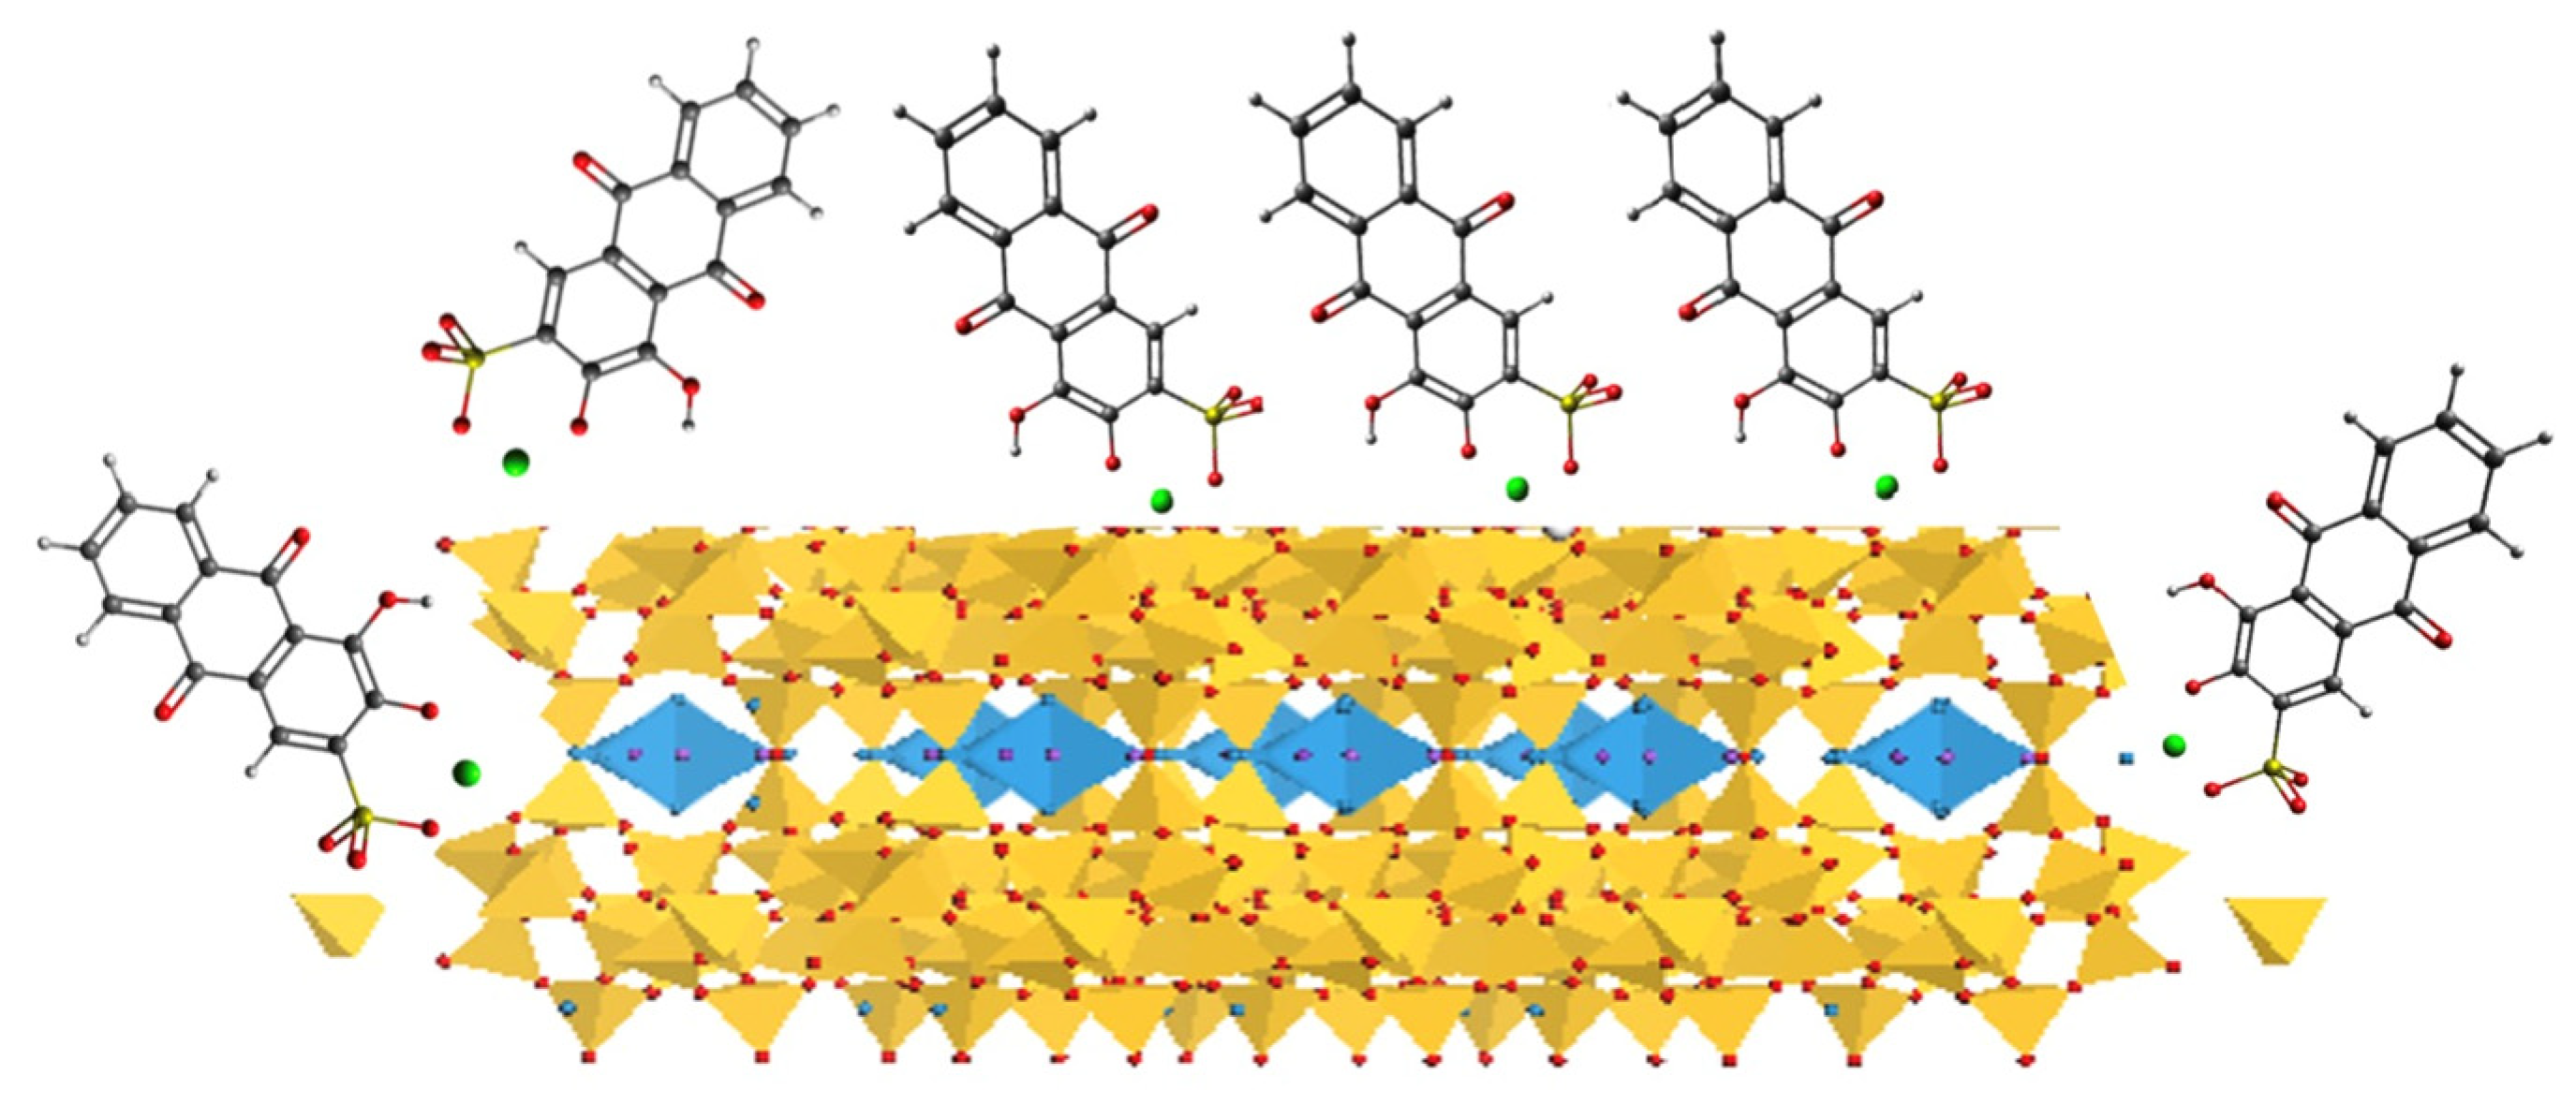
The simulation of ARS sorption on crystallographic ac direction is illustrated in Figure 7. Again, due to limited SSA, the aggregation of ARS is also anticipated if all the sorbed ARS is on the external surfaces of the clinoptilolite. The dimension of ARS is 1.05 by 0.54 by 0.24 nm (Figure 1b). Thus, it is also possible that the ARS could penetrate the channels of the clinoptilolite. In addition, the kinetic study results showed equilibrium was reached in less than an hour (Figure 2d), also suggesting limited penetrability. As such, similar to MO, the extensive aggregation of ARS indeed showed up on clinoptilolite surfaces and the function of counterion Na+ did not affect ARS aggregation. The SSA of the zeolite for ARS sorption in the previous study [44] was only 7.8 m2/g, half of the SSA of the clinoptilolite in this study and the ARS sorption capacity was 580 mmol/kg [44], in comparison to 92 mmol/kg in this study. The simulation from this study already showed extensive aggregation. Thus, if molecular dynamic simulation was carried out for ARS sorption for the previous study [44], the aggregation of ARS on the zeolite surface would be more than 10 times higher.
3.6. Discussion
The possible pathways for MO sorption on crosslinked quaternized chitosan/bentonite composites may include electrostatic interaction and hydrogen bonding [9]. Furthermore, the possible mechanism of MO sorption on immobilized CS-MT could be mainly attributed to electrostatic, n–π stacking, dipole–dipole hydrogen bonding interactions [11].
Mikheev et al. [47] pointed out that the ground state of MO consists of supra-molecular dimers MO2, which, in aqueous low-acidic solutions, are reversibly protonated with the formation of di- and tri-protonated forms that can dissociate into diprotonated monomers as the acidity increases. In addition, the nitrogen atom of the azo group loses one sp2 electron and bares a positive charge, resulting in the polarization of the N=N π bond and the positive charge is partially delocalized into the aromatic ring to form the cation of a phenylaminyl type [50]. The zwitterionic forms are the most stable of the MO structures [56]. As such, the N-dimethyl group may bear a positive charge that might have electrostatic interactions with negatively charged mineral surfaces. As such, it is no surprise that negatively charged minerals, such as kaolinite, illite, MT, and zeolite, were evaluated for the removal of MO in past studies. In this study, the MO sorption on clinoptilolite was also confirmed, with an MO sorption capacity close to twice of the ECEC value of the mineral, suggesting that, in addition to electrostatic interactions between the partially positively charged N dimethyl group and the negatively charged clinoptilolite surfaces, MO dimers played an important role in MO sorption and aggregation on clinoptilolite.
It was found that MO was almost completely dimerized above 0.2 mM and underwent further aggregation above 1 mM [57]. A dimer constant of 9200 was reported for 25 °C [57]. The dimerization constant KD is defined as
where [M] and [D] are the MO monomer and dimer concentrations, respectively. At the highest initial MO concentration of 2.0 mM, the initial monomer and dimer concentrations would be 0.3 and 0.85 mM. Even under the lowest initial concentration of 0.1 mM, 0.05 mM was in monomer form and the rest were in dimer form. The much higher initial MO dimer concentration would result in a significant amount of MO dimer sorption on zeolite from a solution chemistry perspective.
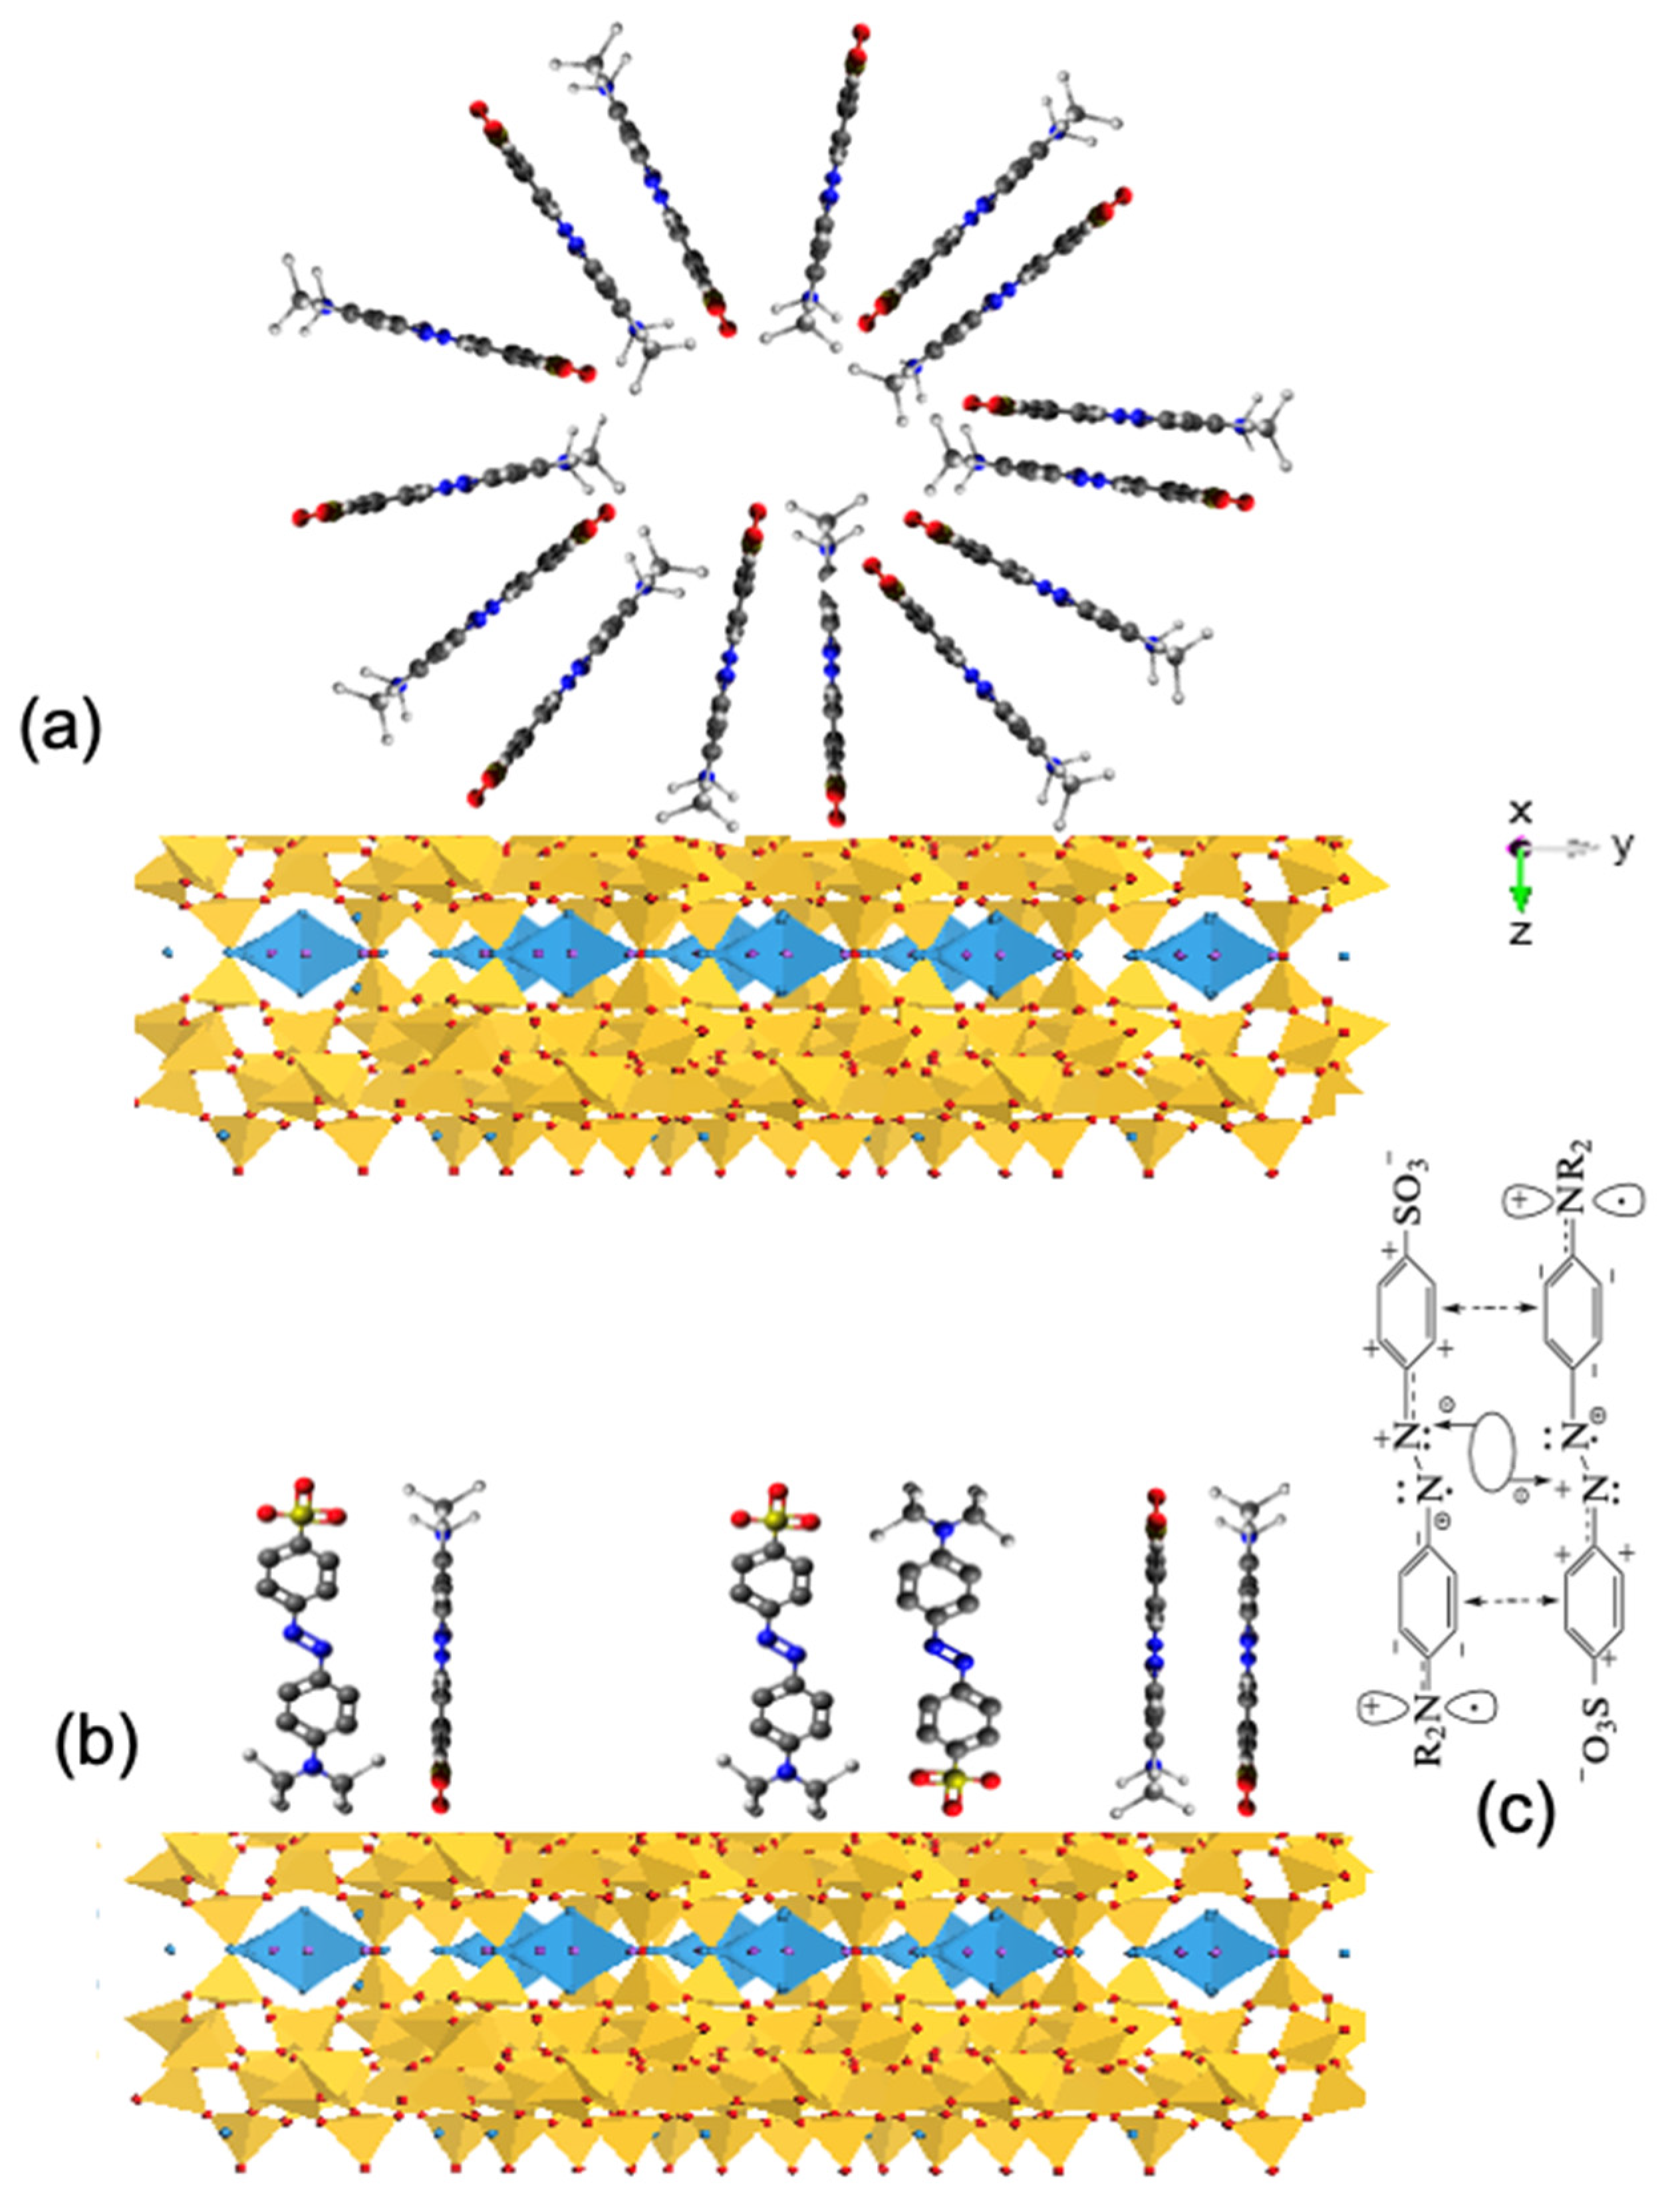
The extreme high MO and MB sorption was found on metal–organic frameworks (MOFs) made of zirconium–metalloporphyrin [58]. Moreover, a sorption isotherm study showed that MO has a higher affinity for polycations poly (ethylenimine hydrochloride) (PEI), through complexation via the formation of MO dimers [59]. As such, it is no surprise that MO could sorb extensively on certain mineral surfaces that are negatively charged, either through interactions with N or via dimeric π-π interactions. The kinetic results showed that equilibrium could be reached in 4 h (Figure 2b). The time period may reflect the MO aggregation on clinoptilolite surfaces, which is confirmed in the molecular dynamic study. The mechanism of ARS sorption on zeolite was mainly attributed to the electrostatic interactions between the sulfonate group SO3– and the metal oxides on the surface of zeolite and partially positively charged –NH3+ and negatively charged mineral surfaces, but the CEC value of the zeolite was not mentioned [37]. However, with a sorption capacity of 580 mmol/kg [37], just electrostatic interactions alone may not be enough to explain this, and ARS molecular aggregations on the zeolite surface must have also happened. In this study, the ECEC value was 90 meq/kg [44], while the MO sorption capacity was 166 mmol/kg, almost twice of the ECEC value; thus, aggregation of MO on the mineral surfaces must be responsible for the additional MO sorption uptake (Figure 8a), in addition to the monomer and dimer sorption (Figure 8b,c).
Previous results showed that ARS sorbed more on apatite than on calcite, but the quantitative values were not provided, nor the mechanism of ARS sorption [60]. For ARS sorption in clinoptilolite, the capacity was 92 mmol/kg, about the same as the ECEC of the mineral. However, the FTIR results showed a significant shift of 2-C–O and SO3, suggesting ligand formation of ARS with the external exchangeable cation Ca2+ on clinoptilolite surfaces (Figure 9). In addition, ARS may form dimers in the presence of Ca2+ using O on C9 and C1 (Figure 1b) [61]. However, it is not a traditional dimer and no dimer constant was reported after an extensive internet search. Instead, the dimer was considered as Ca2+ bridging two ARS via complexation or ligand formation [61]. The simulation showed extensive ARS aggregation. Some may show dimeric features (Figure 7). Thus, it is possible that such ARS dimers bridged by Ca2+ on the external exchangeable site of clinoptilolite may also occur on clinoptilolite surfaces.
4. Conclusions
In this study, the sorptive removal of an anionic dye methyl orange (MO) and alizarin red s (ARS) by the negatively charged framework silicate clinoptilolite was assessed under different physico-chemical conditions. The repulsive interactions between negatively charged mineral surfaces and negatively charged solutes should prevent the net uptake of MO or ARS on clinoptilolite. The results from this study showed the solid uptake of MO and ARS, both of which are anionic dyes, on negatively charged clinoptilolite surfaces. The results further confirmed several literature reports that showed MO sorption on different types of clay minerals and presented a new perspective of using Earth materials for the removal of emerging contaminants. Based on the fact that the amount of MO removed was 166 mmol/kg, close to twice of the external cation exchange capacity of the mineral, it was speculated that the N in the dimethyl group may bear a partial positive charge, resulting in a net attractive interaction with the clinoptilolite surfaces. Moreover, the MO molecules formed dimers in solution under the experimental concentrations via dimeric π-π interactions. These interactions may account for the high MO sorption capacity beyond the ECEC value of the clinoptilolite. FTIR analyses and molecular dynamic simulation supported the proposed dual mechanisms. As such, negatively charged Earth materials could serve as sorbents for the removal of certain types of anionic dyes, such as MO, via sorption. For ARS, its removal capacity was 92 mmol/kg, close to the external cation exchange capacity of the mineral. As the major exchangeable cation of the mineral is Ca2+, the ligand formation between O on the second C, as well as O with SO3 and the Ca2+ on clinoptilolite surfaces, was responsible for ARS uptake. In addition, aggregations and dimer formations on the mineral surfaces are anticipated, as revealed by molecular dynamic simulations. This is a new perspective to extend the use of Earth materials for the removal of emerging contaminants from water. Future studies using Earth materials for water remediation should also be extended to certain types of anionic organic species.
Supplementary Materials
The following are available online at https://0-www-mdpi-com.brum.beds.ac.uk/article/10.3390/cryst12050727/s1: Videos S1–S8. They are movie clips for MO sorption on clinoptilolite along a, b, and c crystallographic directions in the presence and absence of Na+ at MO sorption capacity as indicated by file names and ARS sorption on clinoptilolite along b crystallographic direction. Also available online are Figure S1: Molecular dynamic simulation showing MO uptake in the absence (top) and presence (bottom) of counterion Na+ on the bc plane of zeolite projected along c (left) and a (right) directions; and Figure S2: Molecular dynamic simulation showing MO uptake in the absence (top) and presence (bottom) of counterion Na+ on the ab plane of zeolite projected along b (left) and c (right) directions.
Author Contributions
Conceptualization, Z.L.; methodology, Z.L.; software, X.W.; validation, Z.L.; formal analysis, K.C. and J.B.; investigation, K.C. and J.B.; resources, Z.L.; data curation, Z.L. and X.W.; writing—original draft preparation, Z.L.; writing—review and editing, X.W.; visualization, Z.L. and X.W.; supervision, Z.L.; project administration, Z.L.; funding acquisition, Z.L. All authors have read and agreed to the published version of the manuscript.
Funding
This research was funded by a SPARK grant provided by Wisys under the funding code of T210025.
Institutional Review Board Statement
Not applicable.
Informed Consent Statement
Patient consent was waived, as the materials used were raw materials.
Data Availability Statement
Available upon request.
Conflicts of Interest
The authors declare no conflict of interest.
References
- Hanafi, M.F.; Sapawe, N. A review on the water problem associate with organic pollutants derived from phenol, methyl orange, and remazol brilliant blue dyes. Mater. Today: Proceedings 2020, 31, A141–A150. [Google Scholar]
- Hosseini, S.; Khan, M.A.; Malekbala, M.R.; Cheah, W.; Choong, T.S. Carbon coated monolith, a mesoporous material for the removal of methyl orange from aqueous phase: Adsorption and desorption studies. Chem. Eng. J. 2011, 171, 1124–1131. [Google Scholar] [CrossRef]
- Jamshidi, E.; Manteghi, F. Methyl Orange Adsorption by Fe2O3@ Co-Al-Layered Double Hydroxide. Proceedings 2019, 41, 64. [Google Scholar]
- Gregory, C.A.; Gunn, W.G.; Peister, A.; Prockop, D.J. An Alizarin red-based assay of mineralization by adherent cells in culture: Comparison with cetylpyridinium chloride extraction. Anal. Biochem. 2004, 329, 77–84. [Google Scholar] [CrossRef]
- Al-Salihi, K.J.; Alfatlawi, W.R. Synthesis and characterization of low-cost adsorbent and used for Alizarin yellow GG and alizarin Red S dyes removal from aqueous solutions. In IOP Conference Series: Materials Science and Engineering; IOP Publishing: Bristol, UK, 2021; Volume 1094, p. 012175. [Google Scholar]
- Biglari, H.; RodríguezíCouto, S.; Khaniabadi, Y.O.; Nourmoradi, H.; Khoshgoftar, M.; Amrane, A.; Vosoughi, M.; Esmaeili, S.; Heydari, R.; Mohammadi, M.J.; et al. Cationic surfactant-modified clay as an adsorbent for the removal of synthetic dyes from aqueous solutions. Int. J. Chem. Reactor Eng. 2018, 16, 20170064. [Google Scholar] [CrossRef]
- Umpuch, C.; Sakaew, S. Removal of methyl orange from aqueous solutions by adsorption using chitosan intercalated montmorillonite. Songklanakarin J. Sci. Technol. 2013, 35, 451–459. [Google Scholar]
- Kang, S.; Qin, L.; Zhao, Y.; Wang, W.; Zhang, T.; Yang, L.; Rao, F.; Song, S. Enhanced removal of methyl orange on exfoliated montmorillonite/chitosan gel in presence of methylene blue. Chemosphere 2020, 238, 124693. [Google Scholar] [CrossRef]
- Hu, P.; Zhang, L.; Wang, J.; Huang, R. Removal of methyl orange from aqueous solution with crosslinked quaternized chitosan/bentonite composite. Desal. Water Treat. 2017, 80, 370–379. [Google Scholar] [CrossRef]
- Ahmad, S.; Yasin, K. Removal of organic pollutants by using surfactant modified Bentonite. J. Chem. Soc. Pakistan 2018, 40, 447. [Google Scholar]
- Bahrudin, N.N.; Nawi, M.A.; Jawad, A.H.; Sabar, S. Adsorption characteristics and mechanistic study of immobilized chitosan-montmorillonite composite for methyl orange removal. J. Polymers Environ. 2020, 28, 1901–1913. [Google Scholar] [CrossRef]
- Yu, X.H.; Lü, H.L.; Zhou, G.W.; Zhou, L.G.; Zhang, Y.C. Absorption of methyl orange by modified fly zeolites. Adv. Mater. Res. 2012, 476, 1365–1369. [Google Scholar] [CrossRef]
- Xing, X.; Chang, P.H.; Lv, G.; Jiang, W.T.; Jean, J.S.; Liao, L.; Li, Z. Ionic-liquid-crafted zeolite for the removal of anionic dye methyl orange. J. Taiwan Inst. Chem. Eng. 2016, 59, 237–243. [Google Scholar] [CrossRef]
- Yang, Y.; Yang, J.; Du, Y.; Li, C.; Wei, K.; Lu, J.; Chen, W.; Yang, L. Preparation and characterization of cationic water-soluble pillar [5] arene-modified zeolite for adsorption of methyl orange. ACS Omega 2019, 4, 17741–17751. [Google Scholar] [CrossRef] [PubMed] [Green Version]
- Mekatel, E.H.; Amokrane, S.; Aid, A.; Nibou, D.; Trari, M. Adsorption of methyl orange on nanoparticles of a synthetic zeolite NaA/CuO. Comptes Rendus Chim. 2015, 18, 336–344. [Google Scholar] [CrossRef]
- Habiba, U.; Siddique, T.A.; Lee, J.J.L.; Joo, T.C.; Ang, B.C.; Afifi, A.M. Adsorption study of methyl orange by chitosan/polyvinyl alcohol/zeolite electrospun composite nanofibrous membrane. Carbohydr. Polym. 2018, 191, 79–85. [Google Scholar] [CrossRef]
- Elmoubarki, R.; Mahjoubi, F.Z.; Tounsadi, H.; Moustadraf, J.; Abdennouri, M.; Zouhri, A.; El Albani, A.; Barka, N. Adsorption of textile dyes on raw and decanted Moroccan clays: Kinetics, equilibrium and thermodynamics. Water Res. Ind. 2015, 9, 16–29. [Google Scholar] [CrossRef]
- Assimeddine, M.; Abdennouri, M.; Barka, N.; Rifi, E.; Sadiq, M. Physicochemical characterization of Moroccan natural clays and the study of their adsorption capacity for the methyl orange and methylene blue removal from aqueous solution. J. Environ. Treat. Tech. 2020, 8, 1258–1267. [Google Scholar]
- Laaziz, A.; Kouda, I.; Barhoun, A.; Draoui, K. Kinetic, isotherm and thermodynamic study of methyl orange adsorption on raw clay from north of Morocco. J. Environ. Treat. Tech. 2021, 9, 675–685. [Google Scholar]
- Leodopoulos, C.; Doulia, D.; Gimouhopoulos, K.; Triantis, T.M. Single and simultaneous adsorption of methyl orange and humic acid onto bentonite. Appl. Clay Sci. 2012, 70, 84–90. [Google Scholar] [CrossRef]
- Bendaho, D.; Ainad, D.T.; Djillali, B. Removal of anionic dye by natural Algerian montmorillonite. J. Environ. Anal. Chem. 2015, 2, 2380–2391. [Google Scholar] [CrossRef]
- Bellifa, A.; Makhlouf, M.; Boumila, Z.H. Comparative study of the adsorption of methyl orange by bentonite and activated carbon. Acta Phys. Pol. A 2017, 132, 466–468. [Google Scholar] [CrossRef]
- Hacıosmanoğlu, G.G.; Genç, S.; Can, Z.S. Efficient removal of methyl orange from aqueous solutions using ulexite. Environ. Technol. Innovation 2021, 22, 101466. [Google Scholar] [CrossRef]
- Teng, M.Y.; Lin, S.H. Removal of methyl orange dye from water onto raw and acid activated montmorillonite in fixed beds. Desalination 2006, 201, 71–81. [Google Scholar] [CrossRef]
- Das, S.; Barman, S.; Thakur, R. Removal of methyl orange and mythelene blue dyes from aqueous solution using low cost adsorbent zeolite synthesized from fly ash. J. Environ. Sci. Engineer. 2012, 54, 472–480. [Google Scholar]
- Al-Dahri, T.; AbdulRazak, A.A.; Khalaf, I.H.; Rohani, S. Response surface modeling of the removal of methyl orange dye from its aqueous solution using two types of zeolite synthesized from coal fly ash. Mater. Express 2018, 8, 234–244. [Google Scholar] [CrossRef]
- Radoor, S.; Karayil, J.; Jayakumar, A.; Parameswaranpillai, J.; Siengchin, S. Efficient removal of methyl orange from aqueous solution using mesoporous ZSM-5 zeolite: Synthesis, kinetics and isotherm studies. Colloids Surf. A 2021, 611, 125852. [Google Scholar] [CrossRef]
- Mirzaei, D.; Zabardasti, A.; Mansourpanah, Y.; Sadeghi, M.; Farhadi, S. Efficacy of Novel NaX/MgO–TiO2 Zeolite Nanocomposite for the Adsorption of Methyl Orange (MO) Dye: Isotherm, Kinetic and Thermodynamic Studies. J. Inorg. Organomet. Polym. Mater. 2020, 30, 2067–2080. [Google Scholar] [CrossRef]
- Das, S.; Barman, S. Studies on removal of Safranine-T and methyl orange dyes from aqueous solution using NaX zeolite synthesized from fly ash. Int. J. Sci. Environ. Technol. 2013, 2, 735–747. [Google Scholar]
- Abidin, A.Z.; Bakar, N.A.; Ng, E.P.; Tan, W.L. Rapid degradation of methyl orange by Ag doped zeolite X in the presence of borohydride. J. Taibah Univ. Sci. 2017, 11, 1070–1079. [Google Scholar] [CrossRef]
- Bensalah, J.; Habsaoui, A.; Abbou, B.; Kadiri, L.; Lebkiri, I. Adsorption of the anionic dye methyl orange on used artificial zeolites: Kinetic study and modeling of experimental data. Mediterranean J. Chem. 2019, 9, 311–316. [Google Scholar] [CrossRef] [Green Version]
- Qiu, M.; Qian, C.; Xu, J.; Wu, J.; Wang, G. Studies on the adsorption of dyes into clinoptilolite. Desal. 2009, 243, 286–292. [Google Scholar] [CrossRef]
- Ebrahimi, R.; Maleki, A.; Shahmoradi, B.; Rezaee, R.; Daraei, H.; Safari, M.; Zandsalimi, Y.; Bahmani, P.; Harkaranahalli Puttaiah, S. Organic dye removal from aqueous media by using acid modified Clinoptilolite. J. Adv. Environ. Health Res. 2018, 6, 118–127. [Google Scholar]
- Nezamzadeh-Ejhieh, A.; Moazzeni, N. Sunlight photodecolorization of a mixture of Methyl Orange and Bromocresol Green by CuS incorporated in a clinoptilolite zeolite as a heterogeneous catalyst. J. Ind. Engineer. Chem. 2013, 19, 1433–1442. [Google Scholar] [CrossRef]
- Armağan, B.; Turan, M.; Özdemir, O.; Çelik, M.S. Color removal of reactive dyes from water by clinoptilolite. J. Environ. Sci. Health, Part A 2004, 39, 1251–1261. [Google Scholar] [CrossRef] [PubMed]
- Akgül, M. Enhancement of the anionic dye adsorption capacity of clinoptilolite by Fe3+-grafting. J. Hazard. Mater. 2014, 267, 1–8. [Google Scholar] [CrossRef] [PubMed]
- Gollakota, A.R.; Munagapati, V.S.; Volli, V.; Gautam, S.; Wen, J.C.; Shu, C.M. Coal bottom ash derived zeolite (SSZ-13) for the sorption of synthetic anion Alizarin Red S (ARS) dye. J. Hazard. Mater. 2021, 416, 125925. [Google Scholar] [CrossRef]
- Alghamdi, A.A.; Al-Odayni, A.B.; Saeed, W.S.; Almutairi, M.S.; Alharthi, F.A.; Aouak, T.; Al-Kahtani, A. Adsorption of azo dye methyl orange from aqueous solutions using alkali-activated polypyrrole-based graphene oxide. Molecules 2019, 24, 3685. [Google Scholar] [CrossRef] [Green Version]
- Sandberg, R.G.; Henderson, G.H.; White, R.D.; Eyring, E.M. Kinetics of acid dissociation-ion recombination of aqueous methyl orange. J. Phys. Chem. 1972, 76, 4023–4025. [Google Scholar] [CrossRef]
- Barbosa, J. Indicators|Acid–Base, In Encyclopedia of Analytical Science, 2nd ed.; Reference Module in Chemistry, Molecular Sciences and Chemical Engineering; Elsevier: Amsterdam, The Netherlands, 2005; pp. 360–371. [Google Scholar]
- Fayazi, M.; Ghanei-Motlagh, M.; Taher, M.A. The adsorption of basic dye (Alizarin red S) from aqueous solution onto activated carbon/γ-Fe2O3 nano-composite: Kinetic and equilibrium studies. Mater. Sci. Semicond. Processing 2015, 40, 35–43. [Google Scholar] [CrossRef]
- El-Nahass, M.M.; Zeyada, H.M.; El-Ghamaz, N.A.; Awed, A.S. Structural investigation, thermal analysis and AC conduction mechanism of thermally evaporated alizarin red S thin films. Optik 2018, 170, 304–313. [Google Scholar] [CrossRef]
- Mukherjee, T.; Rahaman, M. Removal of Alizarin Red S dye from aqueous solution by electrocoagulation process. Int. J. Res. Eng. Appl. Manag. (IJREAM) 2018, 4, 287–290. [Google Scholar] [CrossRef]
- Lemlikchi, W.; Sharrock, P.; Fiallo, M.; Nzihou; Mecherri, M.O. Hydroxyapatite and Alizarin sulfonate ARS modeling interactions for textile dyes removal from wastewaters. Procedia Eng. 2014, 83, 378–385. [Google Scholar] [CrossRef]
- Li, Z.; Bowman, R.S. Counterion effects on the sorption of cationic surfactant and chromate on natural clinoptilolite. Environ. Sci. Technol. 1997, 31, 2407–2412. [Google Scholar] [CrossRef]
- Nandini, R.; Vishalakshi, B. A study of interaction of methyl orange with some polycations. E-J. Chem. 2012, 9, 1–14. [Google Scholar] [CrossRef]
- Mikheev, Y.A.; Guseva, L.N.; Ershov, Y.A. Transformations of methyl orange dimers in aqueous–acid solutions, according to UV–Vis spectroscopy data. Russian J. Phys. Chem. A 2017, 91, 1896–1906. [Google Scholar] [CrossRef]
- Tanhaei, B.; Ayati, A.; Iakovleva, E.; Sillanpää, M. Efficient carbon interlayered magnetic chitosan adsorbent for anionic dye removal: Synthesis, characterization and adsorption study. Int. J. Biol. Macromol. 2020, 164, 3621–3631. [Google Scholar] [CrossRef]
- Shi, Y.; Wang, X.; Wang, X.; Carlson, K.; Li, Z. Removal of toluidine blue and safranin O from single and binary solutions using zeolite. Crystals 2021, 11, 1181. [Google Scholar] [CrossRef]
- Alpat, S.K.; Özbayrak, Ö.; Alpat, Ş.; Akçay, H. The adsorption kinetics and removal of cationic dye, Toluidine Blue O, from aqueous solution with Turkish zeolite. J. Hazard. Mater. 2008, 151, 213–220. [Google Scholar] [CrossRef]
- Endler, I.; Höhn, M.; Matthey, B.; Zálešák, J.; Keckes, J.; Pitonak, R. Powder Diffraction Data of Aluminum-Rich FCC-Ti1−xAlxN Prepared by CVD. Coatings 2021, 11, 683. [Google Scholar] [CrossRef]
- Murcia, J.J.; Hidalgo, M.C.; Navío, J.A.; Araña, J.; Doña-Rodríguez, J.M. Correlation study between photo-degradation and surface adsorption properties of phenol and methyl orange on TiO2 Vs platinum-supported TiO2. Appl. Catal. B Environ. 2014, 150, 107–115. [Google Scholar] [CrossRef] [Green Version]
- Chin, Y.P.; Raof, S.F.A.; Sinniah, S.; Lee, V.S.; Mohamad, S.; Manan, N.S.A. Inclusion complex of Alizarin Red S with β-cyclodextrin: Synthesis, spectral, electrochemical and computational studies. J. Mole. Struct. 2015, 1083, 236–244. [Google Scholar] [CrossRef]
- Legan, L.; Retko, K.; Ropret, P. Vibrational spectroscopic study on degradation of alizarin carmine. Microchem. J. 2016, 127, 36–45. [Google Scholar] [CrossRef]
- Mansouri, N.; Rikhtegar, N.; Panahi, H.A.; Atabi, F.; Shahraki, B.K. Porosity, characterization and structural properties of natural zeolite-clinoptilolite-as a sorbent. Environ. Protect. Eng. 2013, 39, 139–152. [Google Scholar] [CrossRef]
- de Oliveira, H.P.; Oliveira, E.G.L.; de Melo, C.P. Aggregation of methyl orange probed by electrical impedance spectroscopy. J. Colloid Interface Sci. 2006, 303, 444–449. [Google Scholar] [CrossRef]
- Kendrick, K.L.; Gilkerson, W.R. The state of aggregation of methyl orange in water. J. Solut. Chem. 1987, 16, 257–267. [Google Scholar] [CrossRef]
- Li, H.; Cao, X.; Zhang, C.; Yu, Q.; Zhao, Z.; Niu, X.; Sun, X.; Liu, Y.; Ma, L.; Li, Z. Enhanced adsorptive removal of anionic and cationic dyes from single or mixed dye solutions using MOF PCN-222. RSC Adv. 2017, 7, 16273–16281. [Google Scholar] [CrossRef] [Green Version]
- Vleugels, L.F.; Domańska, I.; Voets, I.K.; Tuinier, R. On the driving forces for complexation of methyl orange with polycations. J. Colloid Interface Sci. 2017, 491, 141–150. [Google Scholar] [CrossRef]
- Somasundaran, P.; Zhang, L. Reagent Adsorption on Phosphates. Crit. Rev. 2000, 7, 1562–1572. [Google Scholar]
- Myers, H.M. Calcium (II)-mediated doubling of Alizarin adsorption in vitro. Arch. Oral Biol. 1981, 26, 537–539. [Google Scholar] [CrossRef]
Figure 1.
Molecular structure of MO (a) and ARS (b) and their pH speciation diagrams (c,d).

Figure 2.
Isotherm study of MO (a) and ARS (b) and kinetic study of MO (c) and ARS (d) sorption on zeolite.
Figure 2.
Isotherm study of MO (a) and ARS (b) and kinetic study of MO (c) and ARS (d) sorption on zeolite.

Figure 3.
Influence of equilibrium solution pH (a), ionic strength (b), and temperature (c) on MO and ARS sorption on clinoptilolite.
Figure 3.
Influence of equilibrium solution pH (a), ionic strength (b), and temperature (c) on MO and ARS sorption on clinoptilolite.

Figure 4.
XRD patterns of clinoptilolite after MO (a) and ARS (b) sorption from different initial concentrations.
Figure 4.
XRD patterns of clinoptilolite after MO (a) and ARS (b) sorption from different initial concentrations.

Figure 5.
FTIR spectra of zeolite in the wave number of 1100–1700 cm–1 after MO (a) and ARS (b) sorption from different initial concentrations.
Figure 5.
FTIR spectra of zeolite in the wave number of 1100–1700 cm–1 after MO (a) and ARS (b) sorption from different initial concentrations.

Figure 6.
Molecular dynamic simulation showing MO uptake in the absence (top) and presence (bottom) of counterion Na+ on the ac plane of clinoptilolite projected along a (left) and b (right) directions. For MO: red: O; blue: N; grey: C; white: H; purple: Na+. For clinoptilolite: the blue diamonds in the channels are hydrated exchangeable cations with octahedral coordination.

Figure 7.
Molecular dynamic simulation showing ARS uptake in the absence (top) and presence (bottom) of counterion Na+ on the ac plane of zeolite projected along a (left) and b (right) directions. For ARS: red: O; yellow: S; grey: C; white: H; purple: Na+.
Figure 7.
Molecular dynamic simulation showing ARS uptake in the absence (top) and presence (bottom) of counterion Na+ on the ac plane of zeolite projected along a (left) and b (right) directions. For ARS: red: O; yellow: S; grey: C; white: H; purple: Na+.

Figure 8.
Hypothetical aggregations of MO (a) and dimer sorption of MO (b) on clinoptilolite surfaces and illustration of dimer interactions (c).
Figure 8.
Hypothetical aggregations of MO (a) and dimer sorption of MO (b) on clinoptilolite surfaces and illustration of dimer interactions (c).

Figure 9.
Complexation of ARS with Ca2+ on clinoptilolite surfaces.


Table 1.
Thermodynamic parameters of ARS and MO sorption on clinoptilolite.
| Dyes | ∆G (kJ/mol) | ∆H | ∆S | |||
|---|---|---|---|---|---|---|
| 296 K | 306 K | 316 K | 326 K | (kJ/mol) | (kJ/mol/K) | |
| MO | −17.6 | −19.0 | −20.4 | −21.7 | 23.5 | 0.14 |
| ARS | −20.8 | −20.4 | −19.9 | −19.5 | −34.0 | −0.05 |
Publisher’s Note: MDPI stays neutral with regard to jurisdictional claims in published maps and institutional affiliations. |
© 2022 by the authors. Licensee MDPI, Basel, Switzerland. This article is an open access article distributed under the terms and conditions of the Creative Commons Attribution (CC BY) license (https://creativecommons.org/licenses/by/4.0/).
Share and Cite
MDPI and ACS Style
Wang, X.; Baker, J.; Carlson, K.; Li, Z. Mechanisms of Selected Anionic Dye Removal by Clinoptilolite. Crystals 2022, 12, 727. https://0-doi-org.brum.beds.ac.uk/10.3390/cryst12050727
AMA Style
Wang X, Baker J, Carlson K, Li Z. Mechanisms of Selected Anionic Dye Removal by Clinoptilolite. Crystals. 2022; 12(5):727. https://0-doi-org.brum.beds.ac.uk/10.3390/cryst12050727
Chicago/Turabian StyleWang, Xisen, Jessica Baker, Kristen Carlson, and Zhaohui Li. 2022. "Mechanisms of Selected Anionic Dye Removal by Clinoptilolite" Crystals 12, no. 5: 727. https://0-doi-org.brum.beds.ac.uk/10.3390/cryst12050727
Note that from the first issue of 2016, this journal uses article numbers instead of page numbers. See further details here.