Article

Evaluation of the Characteristics of Cholesteric Liquid Crystal Diffuser Element Applied in Multi-Focal Display Architectures

1
EuroLCDs, LV-3602 Ventspils, Latvia
2
LightSpace Technologies, LV-2167 Marupe, Latvia
3
Department of Physics, University of Gothenburg, 41296 Gothenburg, Sweden
4
Innovidis AB, 40010 Gothenburg, Sweden
*
Author to whom correspondence should be addressed.
Submission received: 2 May 2022 / Revised: 17 May 2022 / Accepted: 18 May 2022 / Published: 20 May 2022
(This article belongs to the Special Issue Optical Field Modulation Based on Liquid Crystals and Beyond)

Abstract

:
Solid-state multi-focal and volumetric technologies highlight the future of 3D-display development. One of the most convenient implementations of multi-focal 3D displays are stacks of transparent liquid crystal displays. In this work, the core element is dissected—a switching optical diffuser element based on cholesteric liquid crystals, playing the role of a transparent display. In the present study, high-speed synchronized optical spectroscopy is used. We analyzed the kinetic and electro-optical characteristics of the diffuser element, the operation of which is based on the switching between diffuse and transparent states of this element. The underlying aim of this study was to investigate ways to improve some of these characteristics. It has been found that the transient peak in the optical transmission during field-off state, which is reducing the intensity of the light scattered by the diffuser element, is likely not associated to the assumed formation of the transient planar state. As the origin of this peak, we suggest a transient state possessing uniform lying helix structure, formed due the material flow taking place in the cell during relaxation of the liquid crystal. The role of the contacting surface’s pre-tilt angle in the switching process of the liquid crystal diffuser was established.

1. Introduction

Three-dimensional (3D) displays of the future will certainly have to overcome the limitations of currently common stereoscopic 3D displays—ones used for virtual and augmented reality. It could be said that the main shortcoming of single-focal plane stereo displays is the lack of consistency between vergence and accommodation depth cues—in other words, a viewer must fixate accommodation at a single distance. This brings about the well-known vergence–accommodation conflict [1], which can manifest differently for different people but most commonly is associated with eye strain, blurry vision and generally contributing to what is known as “cyber-sickness” [2,3].
A very promising solution for enabling consistent accommodation within a 3D scene presented by a stereoscopic display is a solid-state multi-focal display [4]. While implementations with varifocal lenses have been demonstrated [5,6], a solid-state solution is typically regarded as preferable. For the solid-state implementation, a stack of transparent displays is needed. Previously, it was believed that such a candidate would be a transparent OLED display [7,8]; nevertheless, endeavors from researchers and manufacturers have yet to succeed to the extent that is needed. One of the main drawbacks is optical haze, which prevents the formation of screen stacks and generation of high-quality images. Some solutions to improve light extraction from a single-layer OLED display have been proposed [9,10], but these are not feasible for a display stack.
Thus, a viable alternative (the concept of which was demonstrated in the early 2000s) is a solid-state volumetric technology based on fast-switching optical diffuser elements [11,12]. The early implementation was based on a polymer-dispersed liquid crystal (PDLC) of the cholesteric type. Under applied voltage, exceeding a certain threshold Vth, the cholesteric LC loses its helical molecular order and transitions into a field-induced nematic homeotropic state (H), having high transparency and low haze values. Upon the removal of the applied voltage, the structure collapses back to the focal-conic state (FC) [13]. The addition of a polymer network helped with the FC domain formation and generally improved light scattering properties in the diffuse state. Nonetheless, the presence of a polymer network within a diffuser element interfered with the incident light in the transparent state, leading to unwanted haze when looking at the diffuser element off axis. In terms of switching characteristics, polymer networks also tend to slow down the transition between the optical states, which is crucial for multi-focal and volumetric display architectures reliant on a time-sequential switching between multiple stacked diffusers.
To overcome these limitations, a diffuser composition without the addition of a stabilizing polymer network in the liquid crystal bulk was developed. A polymer-free liquid crystal (PFLC) cell works similarly to a polymer-dispersed liquid crystal (PDLC) cell in a time-sequential display scenario. Instead of polymer networks facilitating the scattering of light, the relatively short-lived transient super-scattering state is utilized. This state is characterized by a fine-domain structure of the focal-conic (FC) texture, which is not stable for long periods [14] but more than sufficient for time scales required by time-sequential switching in a volumetric display.
The aim of this work was to investigate and improve the switching characteristics and optical performance of PFLC diffuser elements, designed specifically for multi-focal display applications. The underlying motivation is to gain a better understanding of switching dynamics and possibilities to optimize and improve switching characteristics and/or optical performance further, to better suit the needs of multi-focal head-mounted display architecture.

2. Materials and Methods

2.1. Experimental Cells Fabrication

First, 5 cm × 6 cm PFLC cells with corresponding cell gaps of 4–25 μm were prepared using two 0.55 mm thick plane parallel glass substrates separated by divinylbenzene spacers (represented by circles in Figure 1). Spacer density did not have any influence on working principle, except to ensure the cell gap and spacer density were between 50 and 150 pcs/mm2. Spacerless devices were not possible to obtain due to physical restraints.
The cell substrates’ inner surfaces were coated with thin transparent conductive film of indium thin oxide (ITO) with sheet resistance of 80 Ω/□. On top of the ITO transparent electrode, an alignment layer promoting planar or homeotropic (vertical) alignment was deposited. Alignment materials were supplied by Nissan Chemical Industries Ltd., Tokyo, Japan. Deposition of the alignment layer was made by flexo-printing method according to supplier instructions using flexo-printing mask and machine from Nakan Techno Co., Chiba, Japan. For promoting a planar alignment (0°) of the liquid crystal, the polyimide SE-7992 was used, whereas for homeotropic alignment (90°) the polyimide SE-5661 was used. Before assembling the cells, the alignment layer promoting planar alignment was unidirectionally rubbed to obtain preferred direction of alignment. For comparison, alignment layers of SiO2 were prepared either by physical vapor deposition (PVD) from Si targets in oxygen atmosphere or by oblique evaporation of SiO2. The former was unidirectionally rubbed whereas the latter was tilted with a high pretilt angle (~27°), thus, encouraging the needed alignment.
The experimental cells were assembled in industrial LCD manufacturing line by using one drop fill (ODF) technology. Nematic liquid crystal mixture with properties similar to commercially available Merck E44 was doped with optical dopant having high helical twisting power. Dopant concentrations are higher than used for PDLC cells, and to ensure precise mixing ratio, doping agents were initially dissolved in acetone, mixed with liquid crystal mixture and refluxed for several hours to remove any acetone residue. Doped LC mixtures are stable over time and for given LC operational temperature range. Electrical connections were attached to an ITO layer by means of ultrasonic soldering to keep the contact resistance low. The display stack for 3D application was laminated from four PFLC units using optically clear adhesive WR5500 from Kyoritsu Chemicals, Mugenjin, Japan. Outer surfaces of the stack were coated with 4-layer broad-band antireflective coating.

2.2. Electro-Optical Response Characterization

Electro-optical response study was performed by 3-laser beam system (wavelengths: 635 nm, 532 nm, 450 nm) or, if specifically noted, using white LED. The light transmitted through the cell was measured by a photodiode and a computer-controlled lock-in amplifier. The photodiode detector FDS100 (ThorLabs, Newton, NJ, USA.) was placed at a distance of 162 mm from the cell, the corresponding collection angle was 9.18°. Keysight Infinii Vision 2000 X series oscilloscope or Ocean Optics Flame T UV-VIS spectrometer was used for data acquisition. Spectrometer was synchronized to the driver according to the experimental setup, see Figure 2.
Haze measurements were carried out using CHN Spec Haze Meter TH-100 and similar electronics for cell driving.

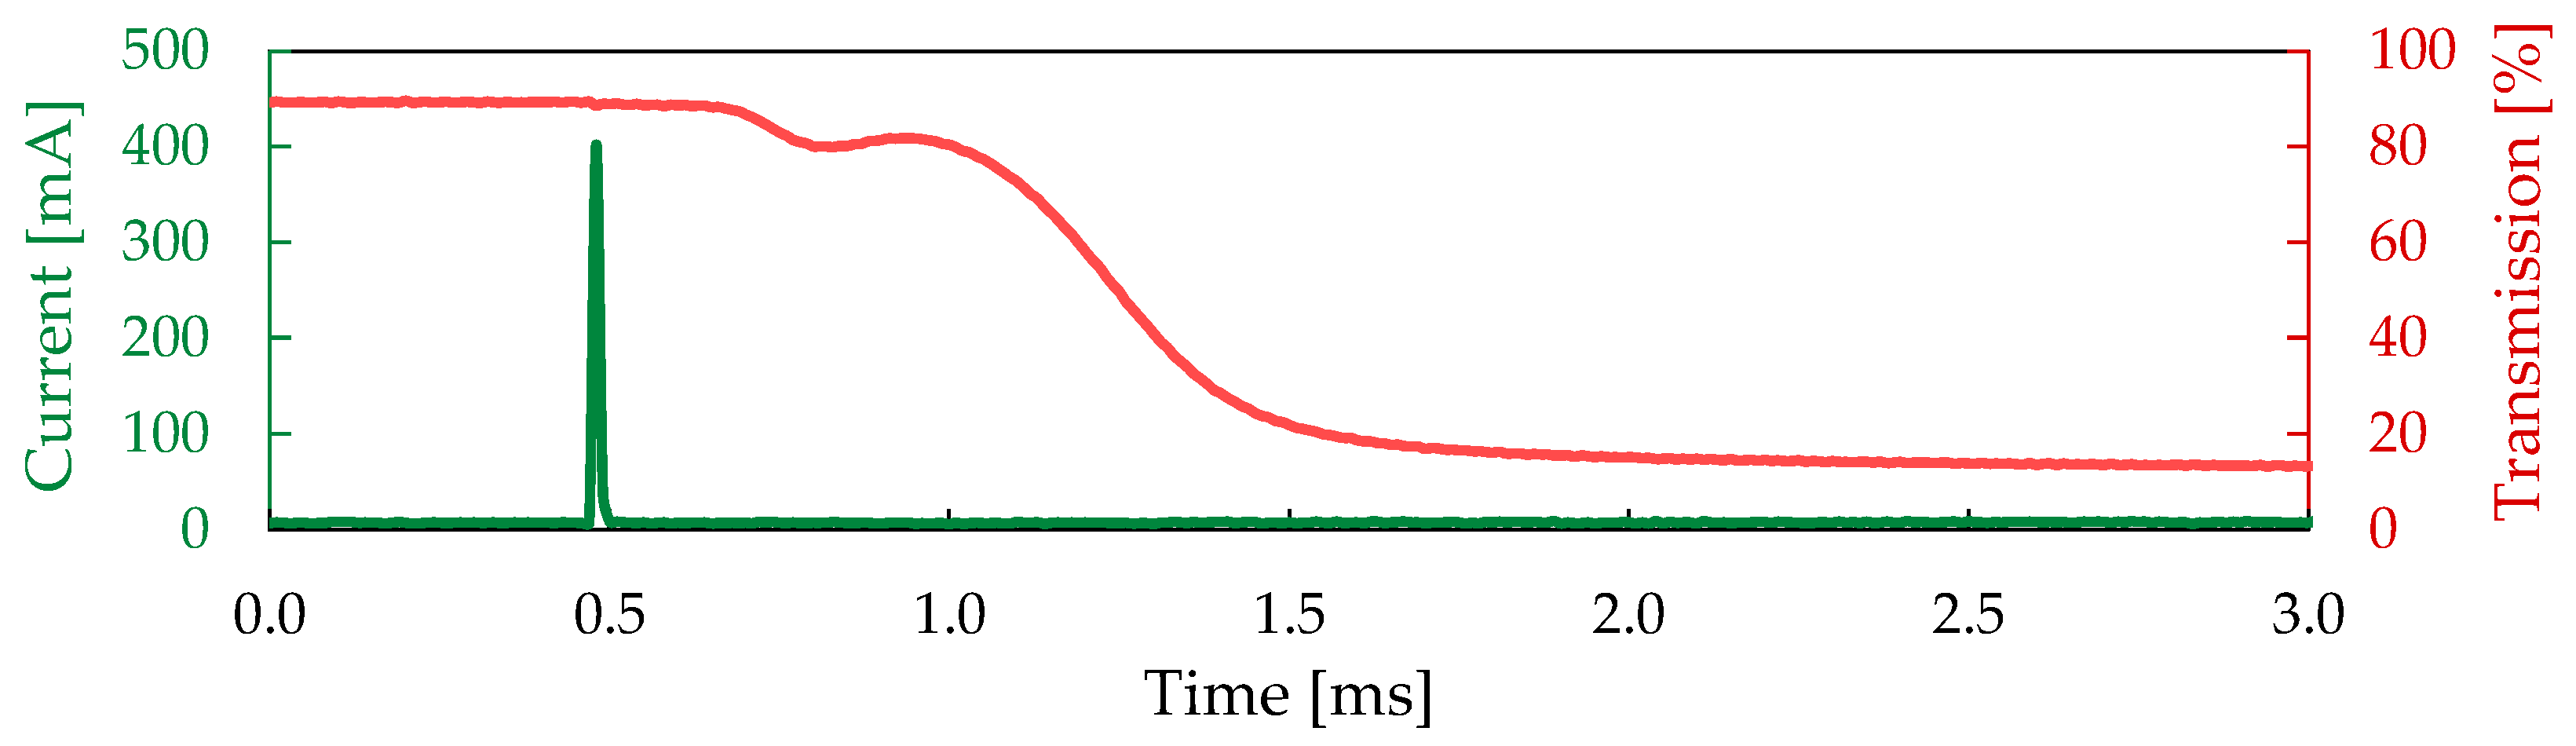
2.3. Driving of the Experimental Cells

A programmed voltage waveform from the lock-in built-in function generator was amplified and then applied to the electrodes in the cells, see Figure 3. If not noted specifically, 0.1 ms overdrive length pulse was used to facilitate faster switching. Drive voltage was supplied for 8.33 ms with similar 0-volt period, making it a 60 Hz 50% duty cycle drive signal.

3. PFLC Electro-Optical Characterization

3.1. Comparison of PDLC and PFLC

Replacement of PDLC cells in the volumetric display architecture with PFLC cells can be considered an evolutionary step for the volumetric display [14]. The polymer network in the bulk of the cholesteric liquid crystal in the PFLC cell is absent while based on the same LC and chiral dopant. A faster overall switching and particularly shorter fall-time, as well as improved scattering properties, are observed, see Figure 4. These effects can largely be attributed to differences in the cholesteric pitch, as in the PDLC cells, a cholesteric liquid crystal with a relatively long cholesteric pitch is used, whereas in PFLC cells, the concentration of a chiral agent is high, thus, resulting in a very short pitch (<0.5 mm).
For common cholesteric liquid crystals, the critical field for field-induced transition from FC state to the H state, for liquid crystal with positive dielectric anisotropy, i.e., Δ ε > 0, is given by [13]:
E c = π p 0 · K 22 ε 0 Δ ε   ,  
where p0 is the helical pitch at zero field, K22 is the twist elastic constant, Δ ε is the dielectric anisotropy and ε 0 is vacuum permittivity. As we can see from Equation (1), a decrease in the pitch from 10 µm to 0.4 µm will raise the threshold electric field intensity 25-times, requiring higher driving voltages and additional countermeasures against dielectric breakdown of the cell [15].

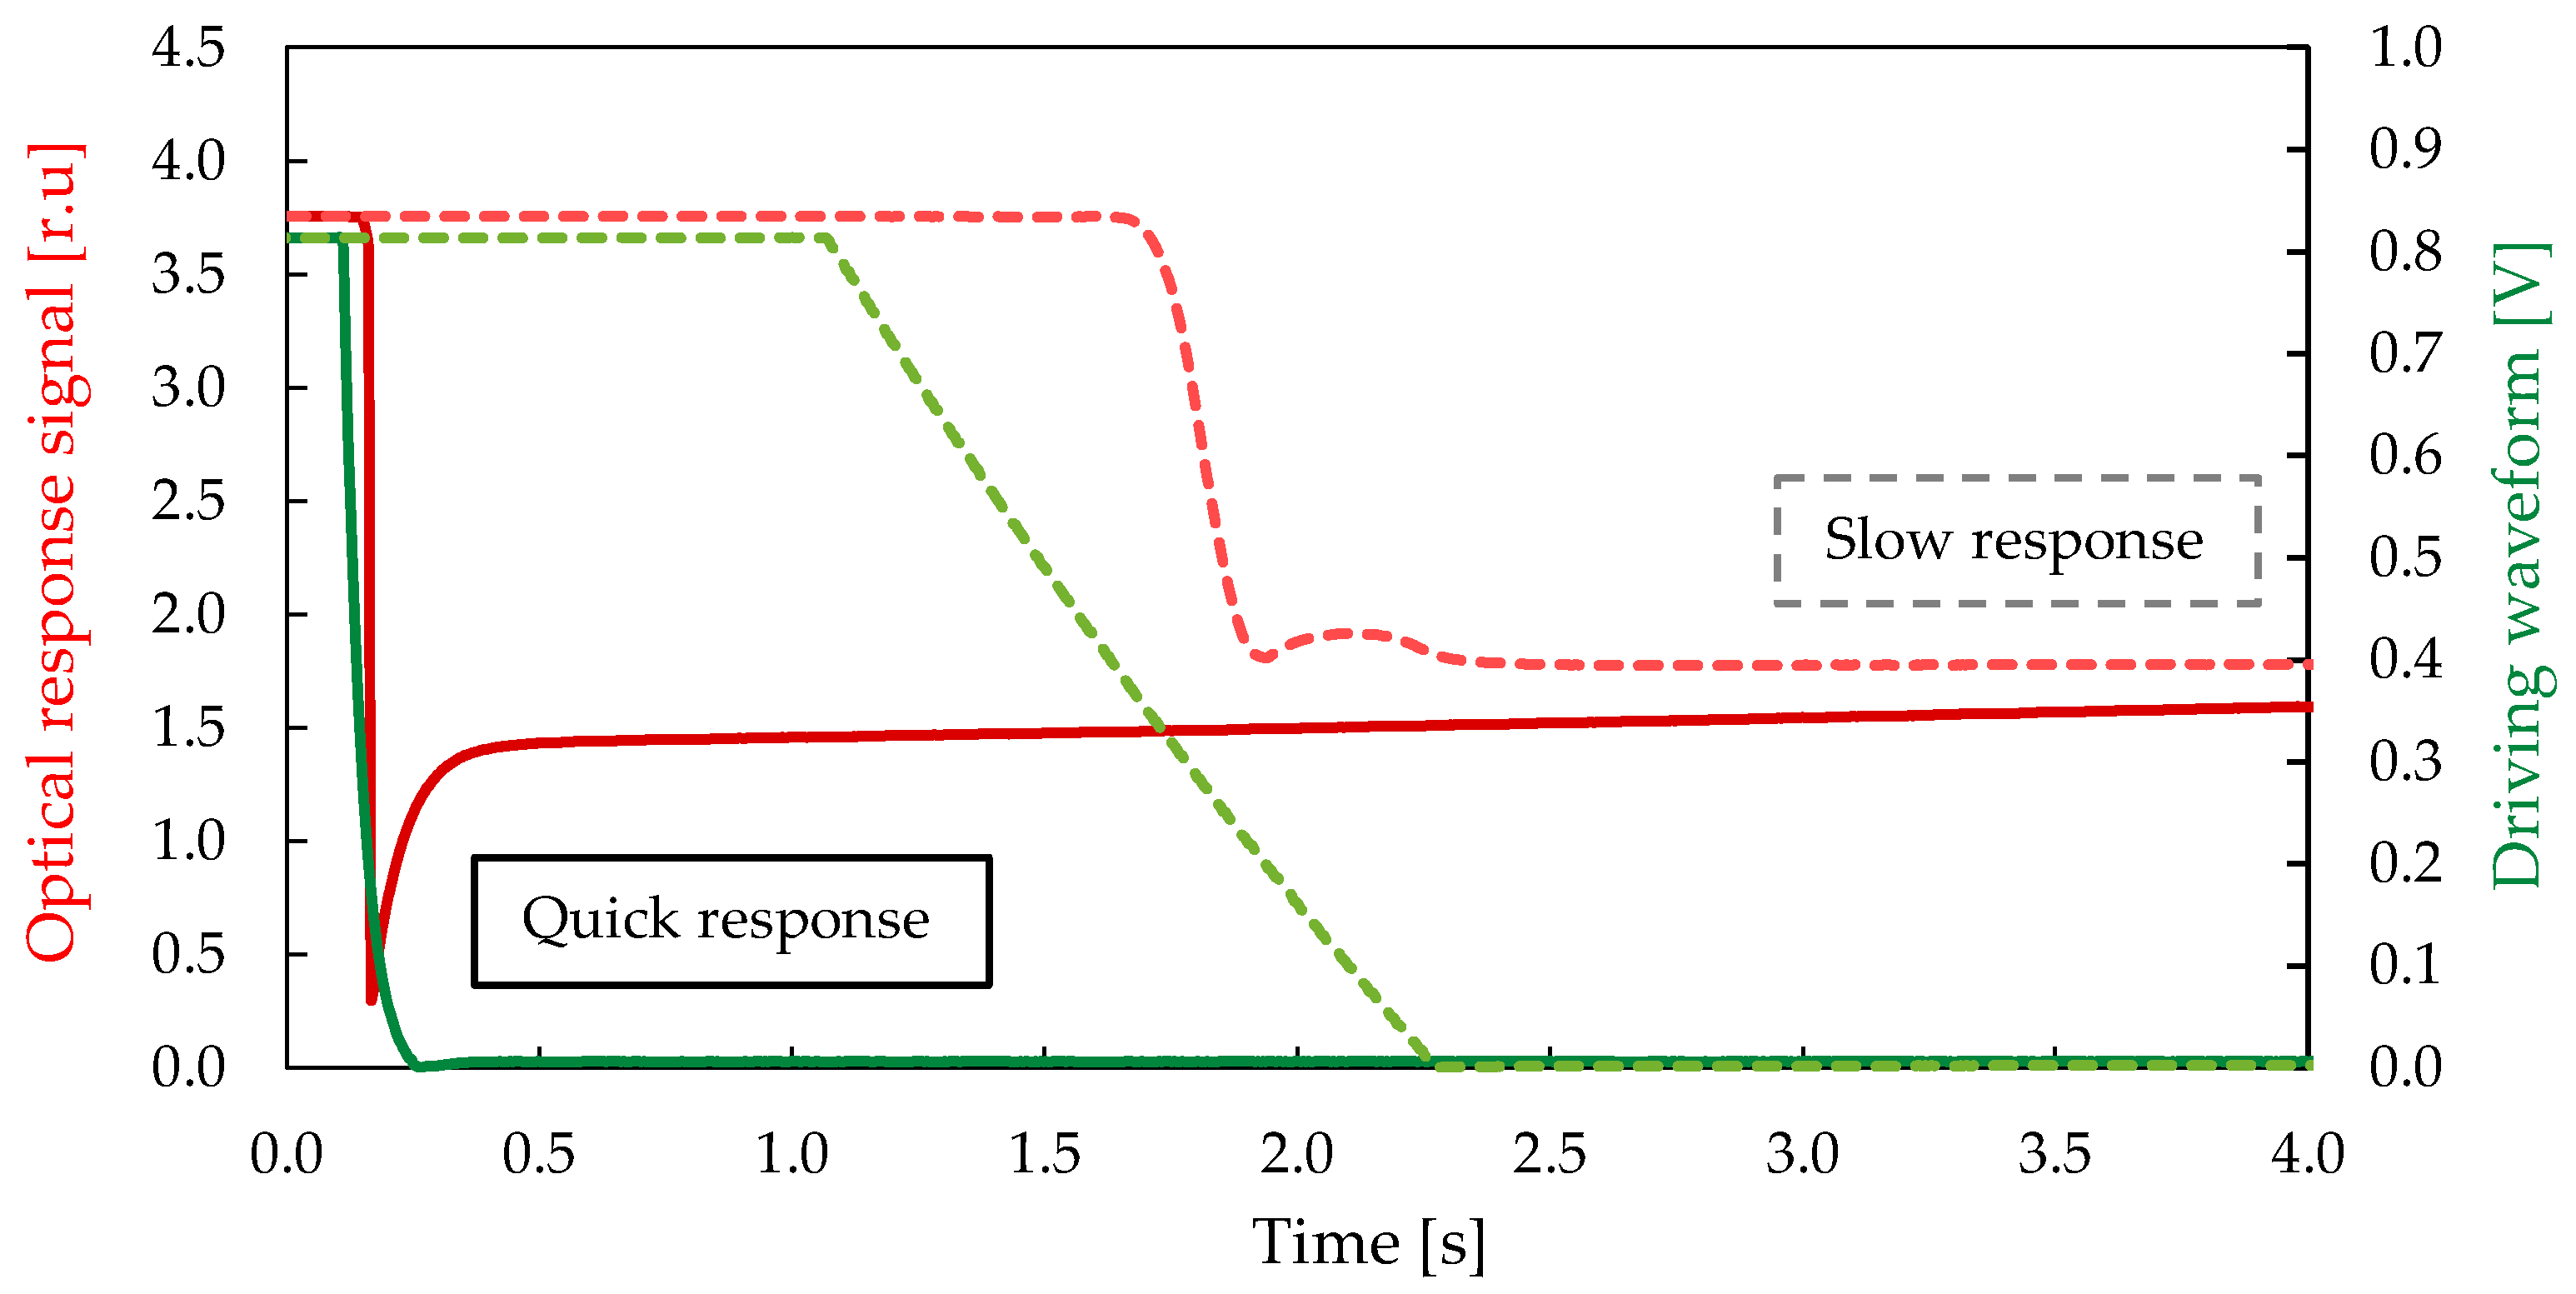
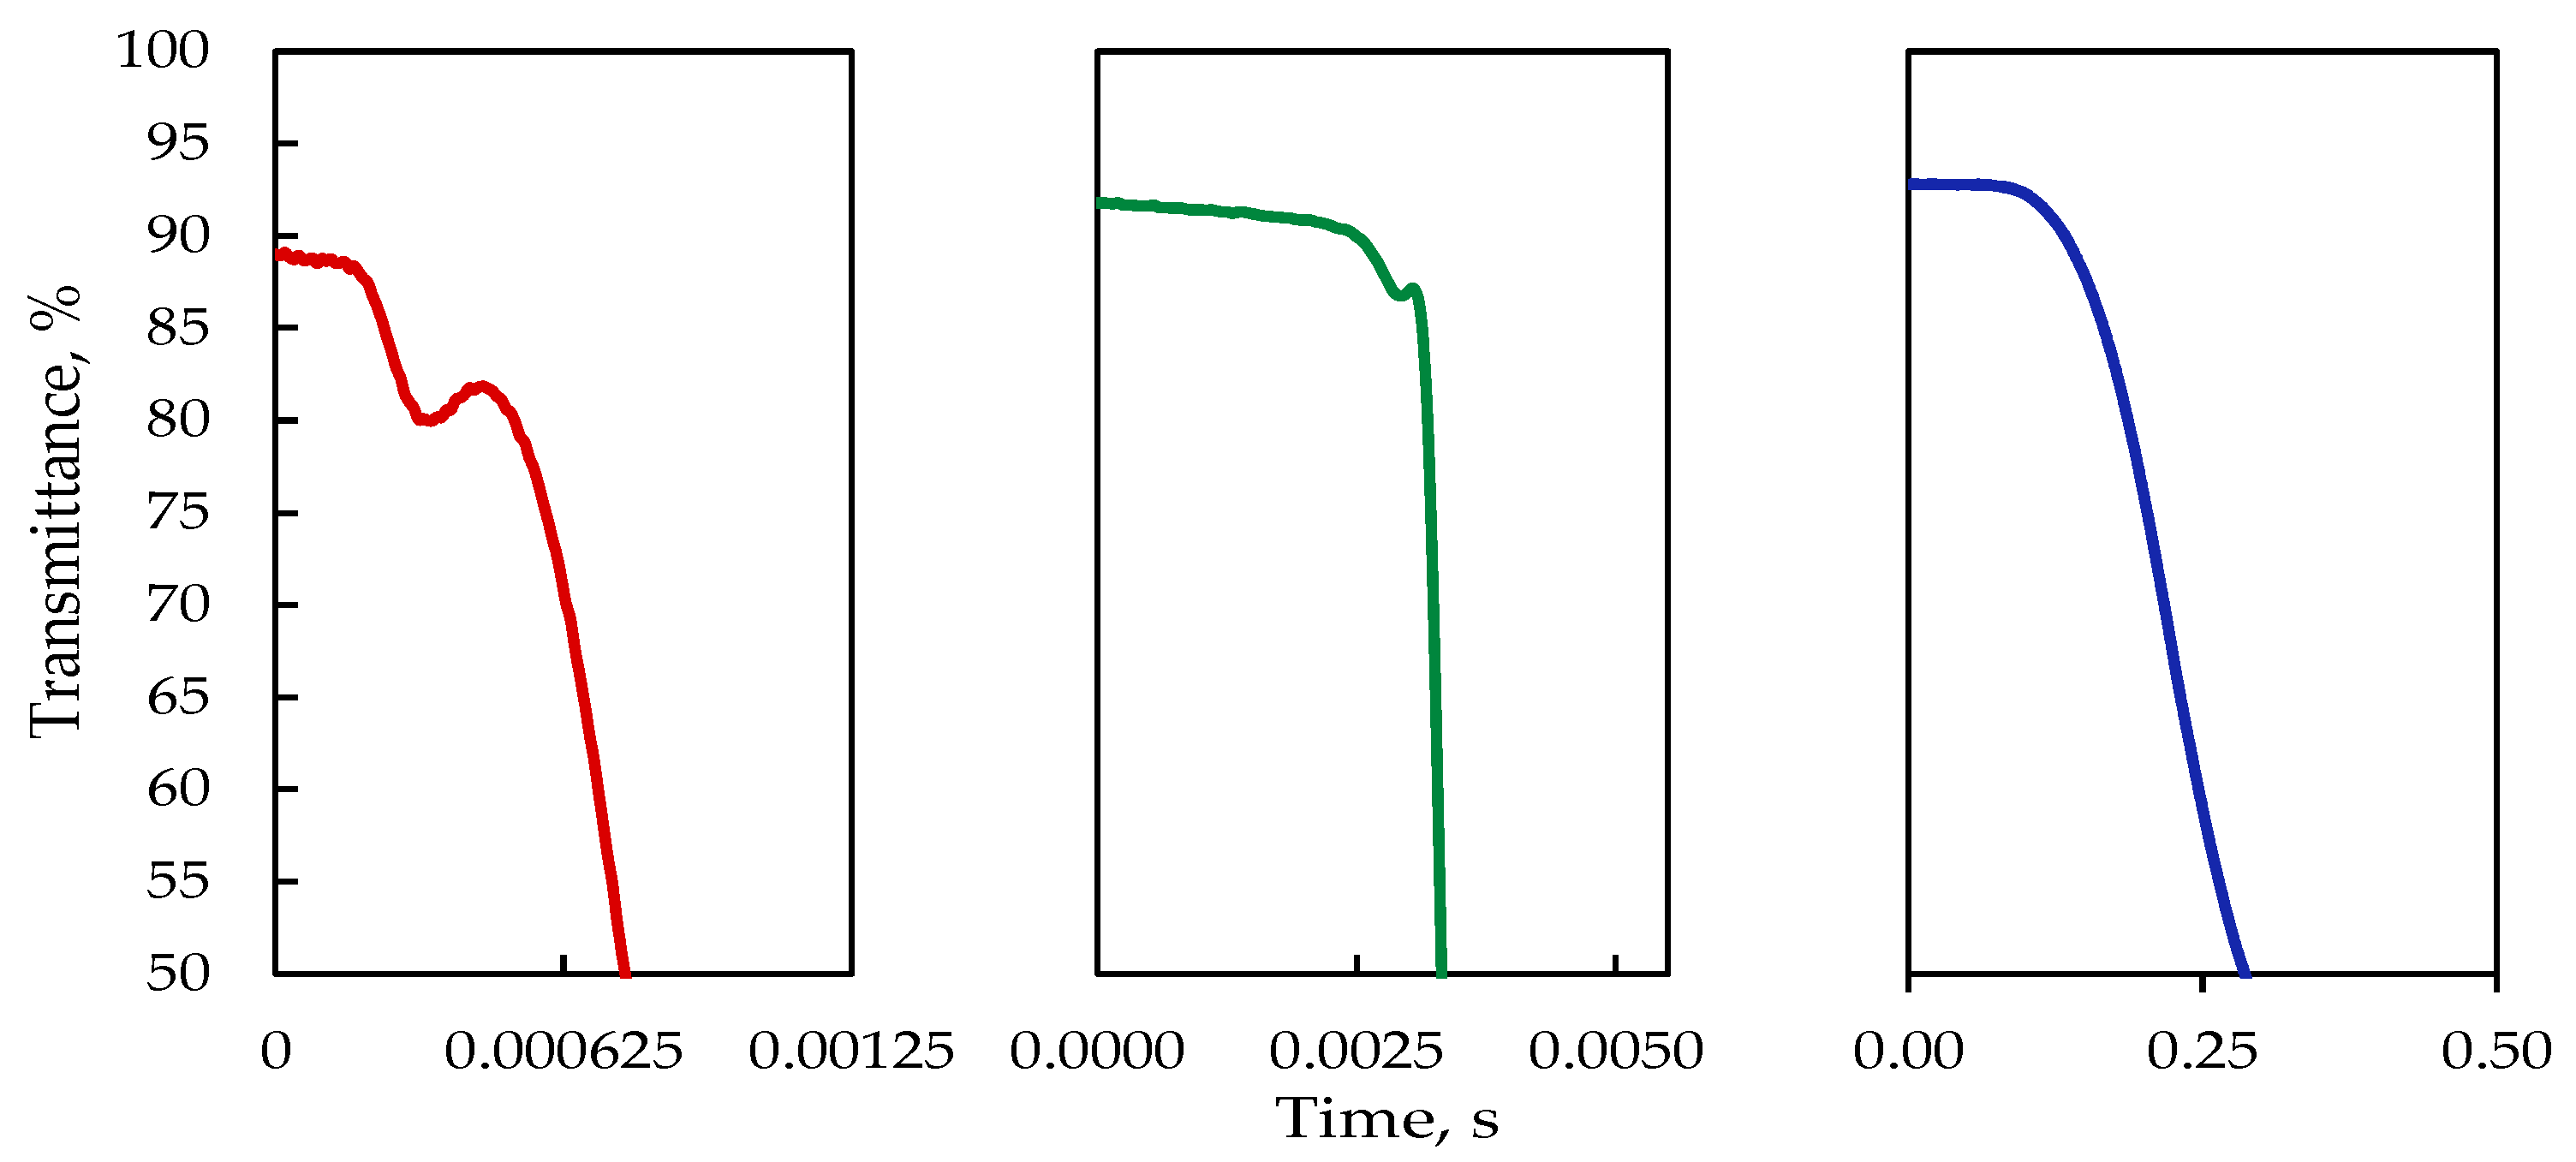
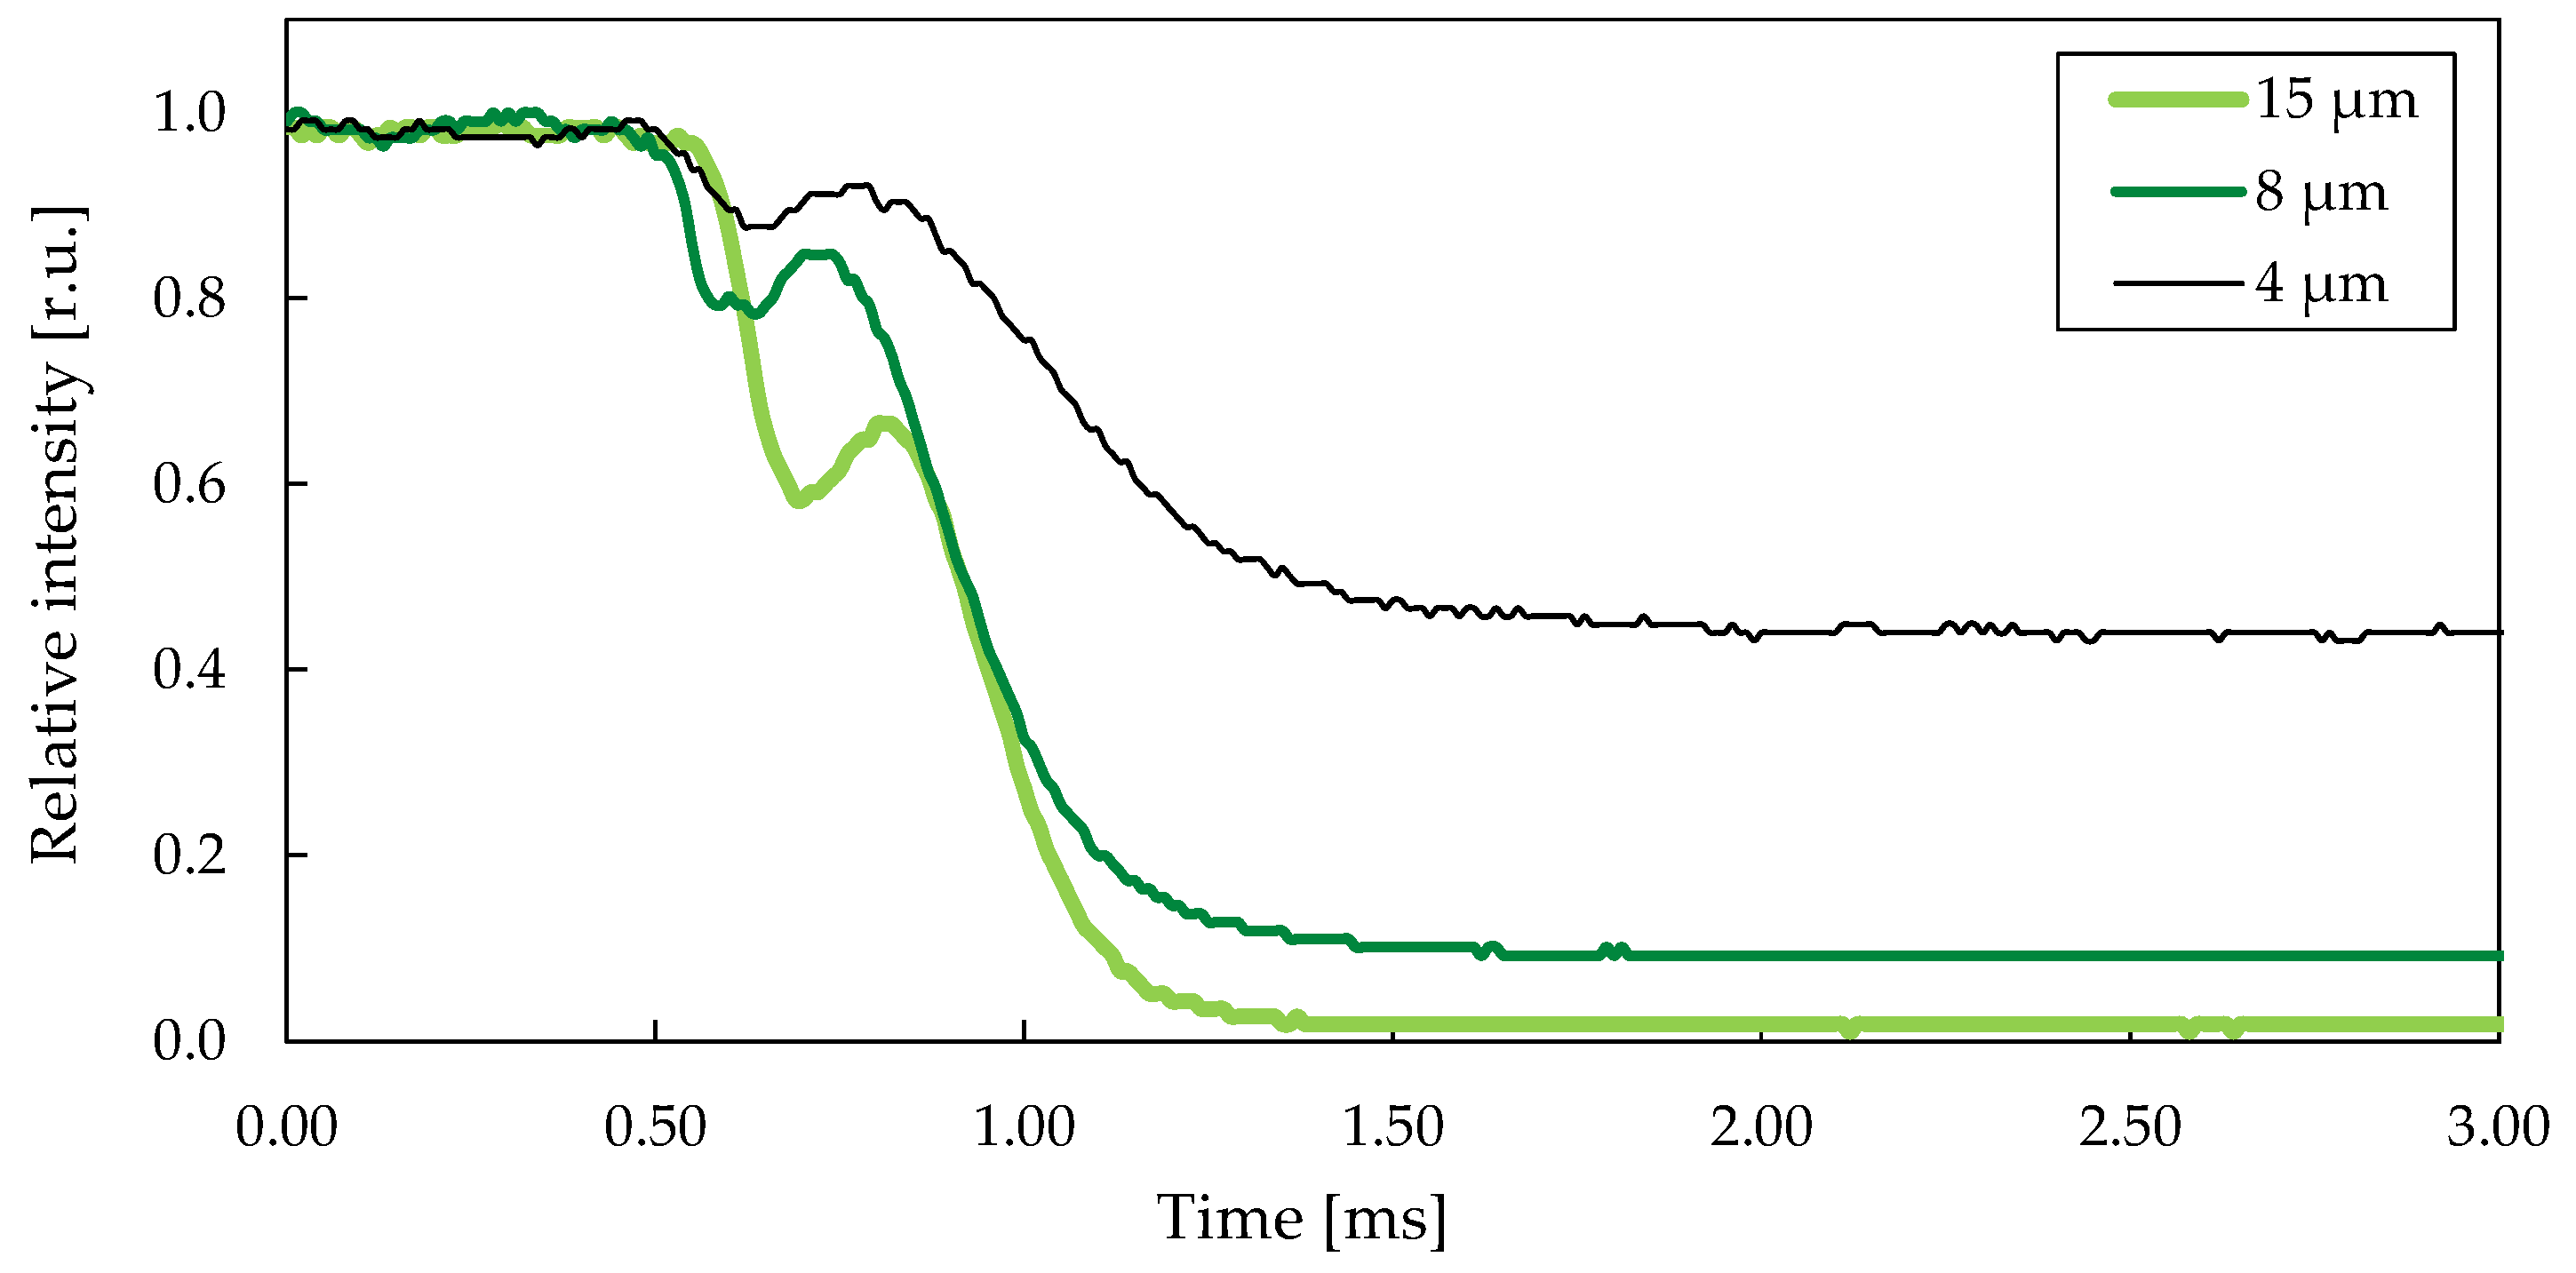
3.2. Fall and Rise Time

For typical long-pitch cholesteric LC crystal cells, the switching behavior depends on the driving voltage. Increasing the voltage, the rise time shortens but the fall time becomes longer. In contrast, for short-pitch PFLC cells, the fall time is virtually independent of the driving voltage, see Figure 5.
Rise time or the time for the transition from the FC to H state (with fully unwound cholesteric helix) can be controlled by the applied electric field. According to [16], the rise time is given by
τ r a i s e = γ d 2 K 22 π 2 [ ( V 2 | V t h 2 ) 1 ]   ,  
where γ is the rotational viscosity, d is the cell gap, K22 is the twist elastic constant, V is the driving voltage and Vth is the threshold voltage. As seen from Equation (2), the rise time depends on the applied voltage and can be minimized by selecting the cholesteric liquid crystal with the lowest possible rotational viscosity (at a given normal working temperature) and high K22.
Indeed, increasing the driving voltage reduces the time of transition from the FC state to H state (see Figure 5); however, it also increases risk that the LC cell will undergo electrical breakdown, especially when the threshold voltage is already high. The field value at which the dielectric breakdown occurs depends on the liquid crystal material and the overall quality of the given cell. Typically, dielectric breakdown has been observed to occur at applied electric field to the cell of about 10 to 25 V/μm [17]. Thus, all experiments described are performed at a driving voltage U d r i v e = c e l l   g a p 10   V / μ m and an overdrive voltage of U o v e r d r i v e = c e l l   g a p 20   V / μ m unless otherwise noted (see top half of Figure 3). With suitable dielectric-breakdown prevention measures, driving voltage can be increased a few times and rise time accelerated to 600 μs.
However, this is not possible for a fall time of a transition from the transparent H state to the FC state, as it depends on the particular LC material’s formulation (will not be addressed here) and the active switching area of a diffuser element, but for a given element, not much can be done to change this time (time taken for the diffuser to undergo a change in transmittance from 90% to 10% of its full range). With the external field removed, the LC relaxes back to its FC state. Higher temperatures can facilitate this process but, assuming most applications require the display to work at room temperature, such an approach is highly limited.
During the relaxation process from H to FC state, the liquid crystal undergoes bulk structural changes, due to the restoration of helical molecular order and formation of transient structures, as well as due to the material flow accompanying these changes. This process is considered as nucleation at seeds, present on the solid surface of the confining substrates [18,19], or at the cell spacers and disinclination lines are generated during the relaxation.
The transition from H to FC state is approximately given by [13]:
T H t F C = γ L K 22 ,  
where L is average linear distance between nucleation seeds. As it was shown in [18,19], the relaxation process strongly depends on the surface-anchoring conditions.
As mentioned above, the relaxation process also depends on the properties of the liquid crystal material. For instance, increasing a concentration of dopant will change a helical pitch po, thus, storing more elastic energy in shortening the cholesteric pitch; as a result, the fall time decreases. However, there is a maximum workable concentration, after which the switching time starts to increase, whereas the light-scattering power starts to decrease due to viscosity of the cholesteric, which increases with the dopant concentration, see Figure 6. Obviously, dopants with high helical twisting power (HTP) are preferred, as this allows lower concentrations to be used. S-5011 dopant has one of the highest HTPs.
Measurements of LC resistivity reveals that the ion contamination is very low, LC having resistivity of 1017 Ω∙cm, and it is not affected by the addition of a doping agent.

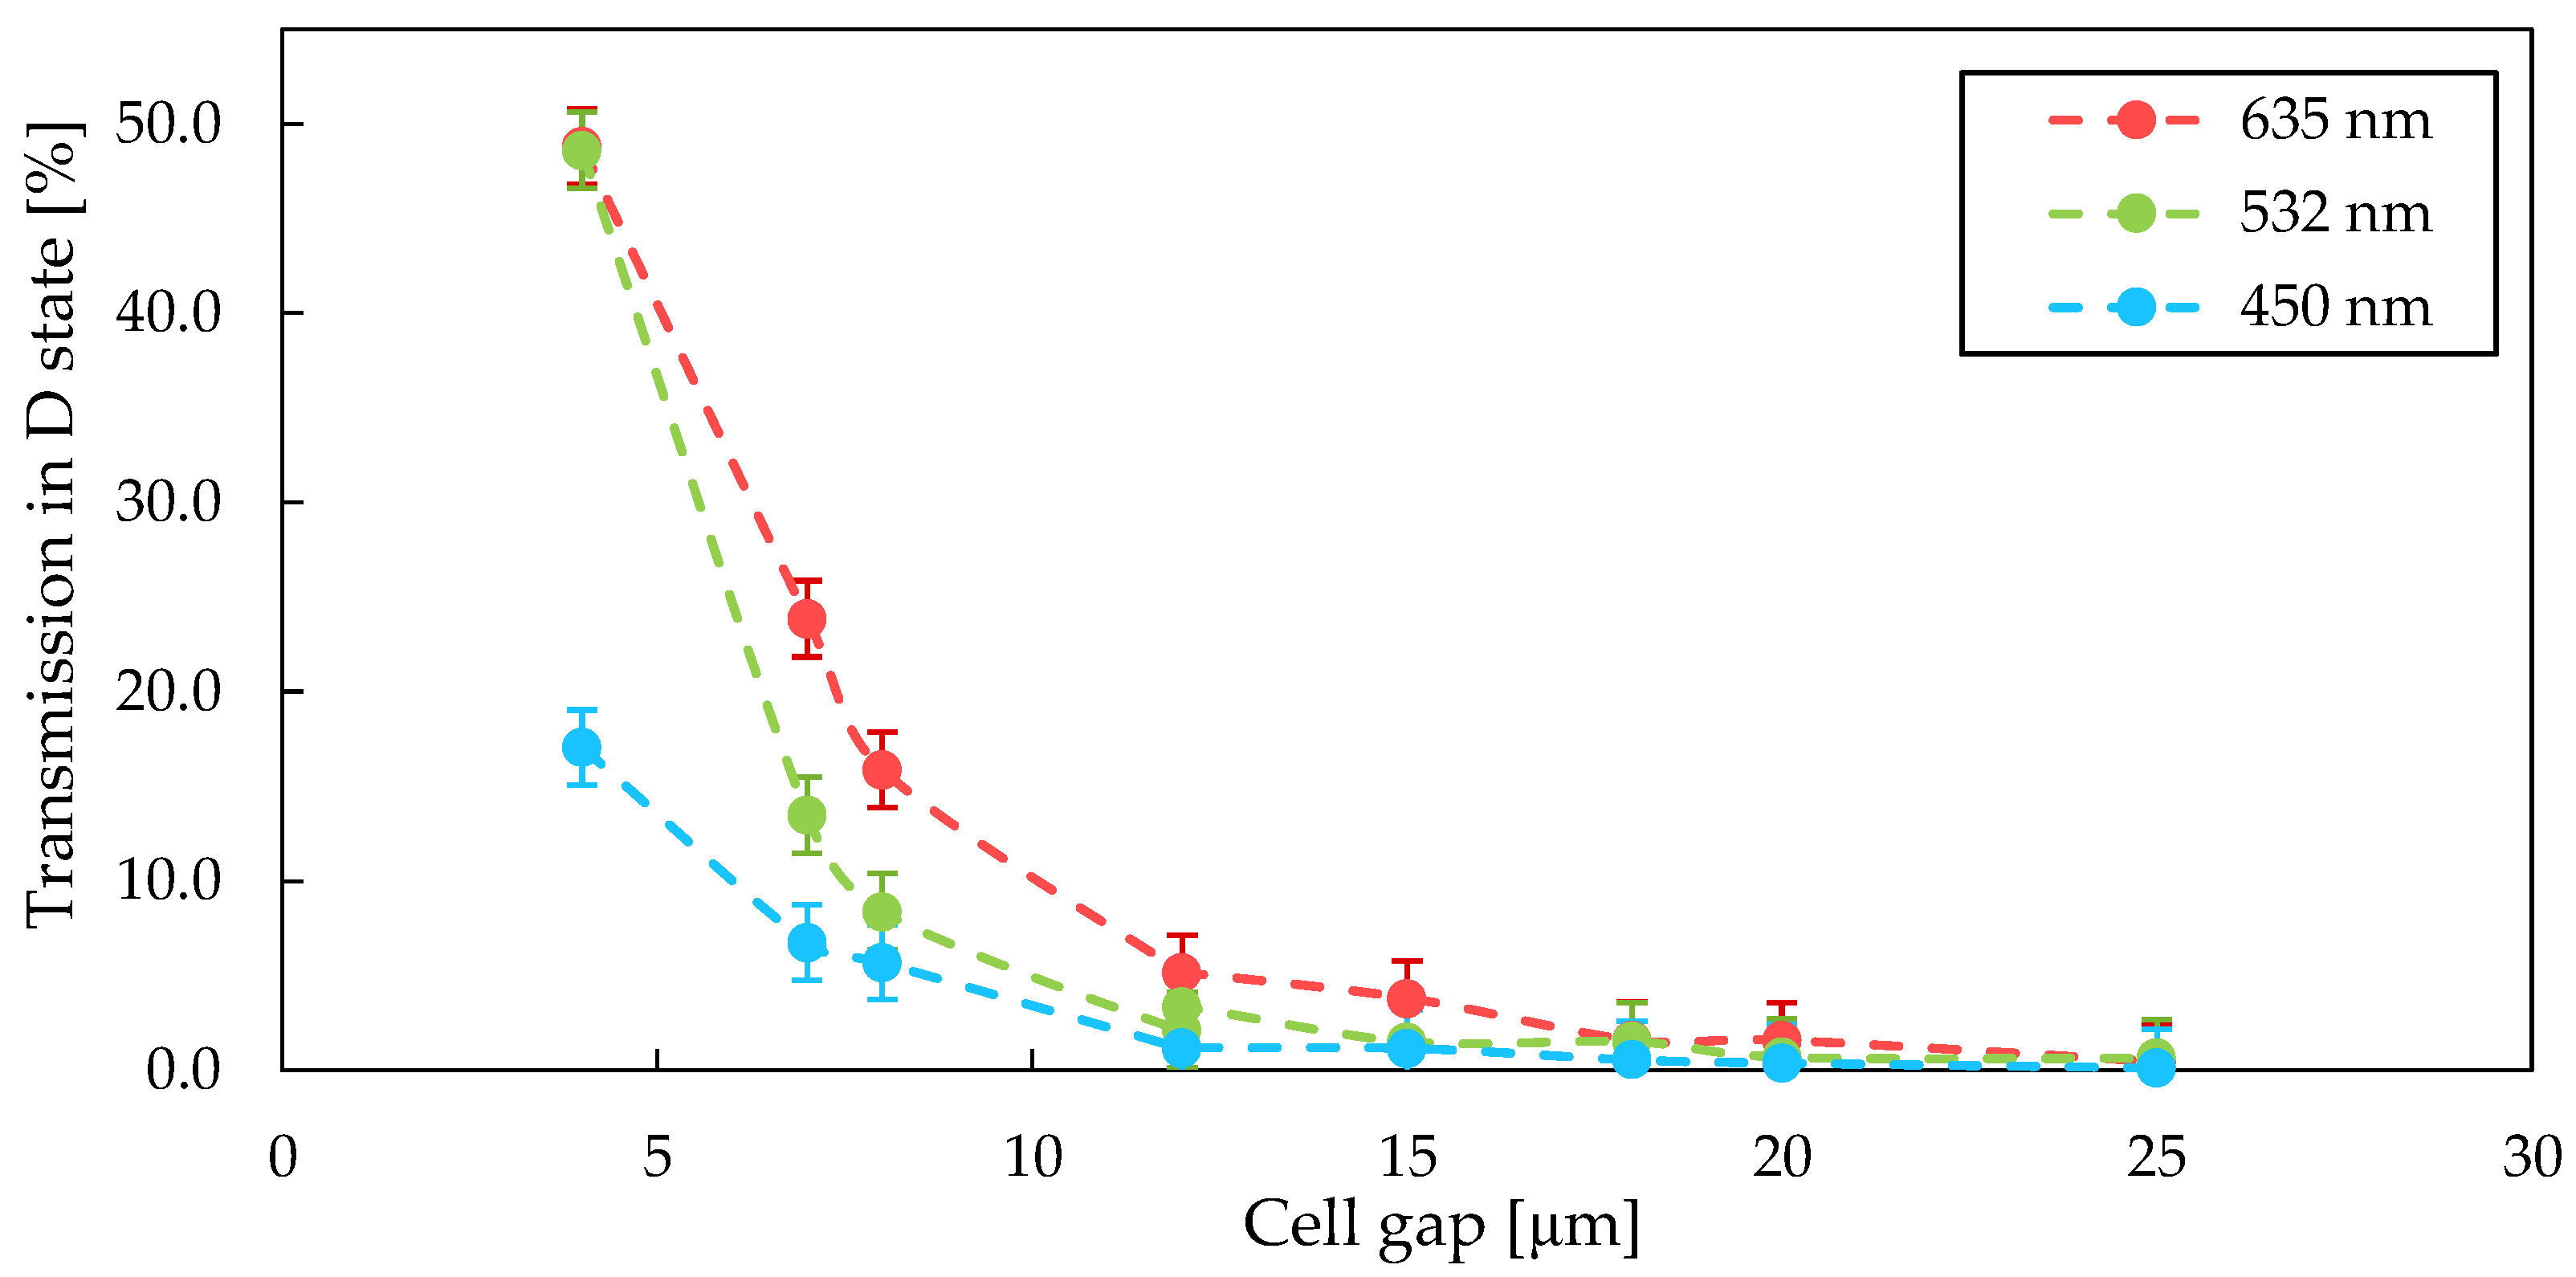
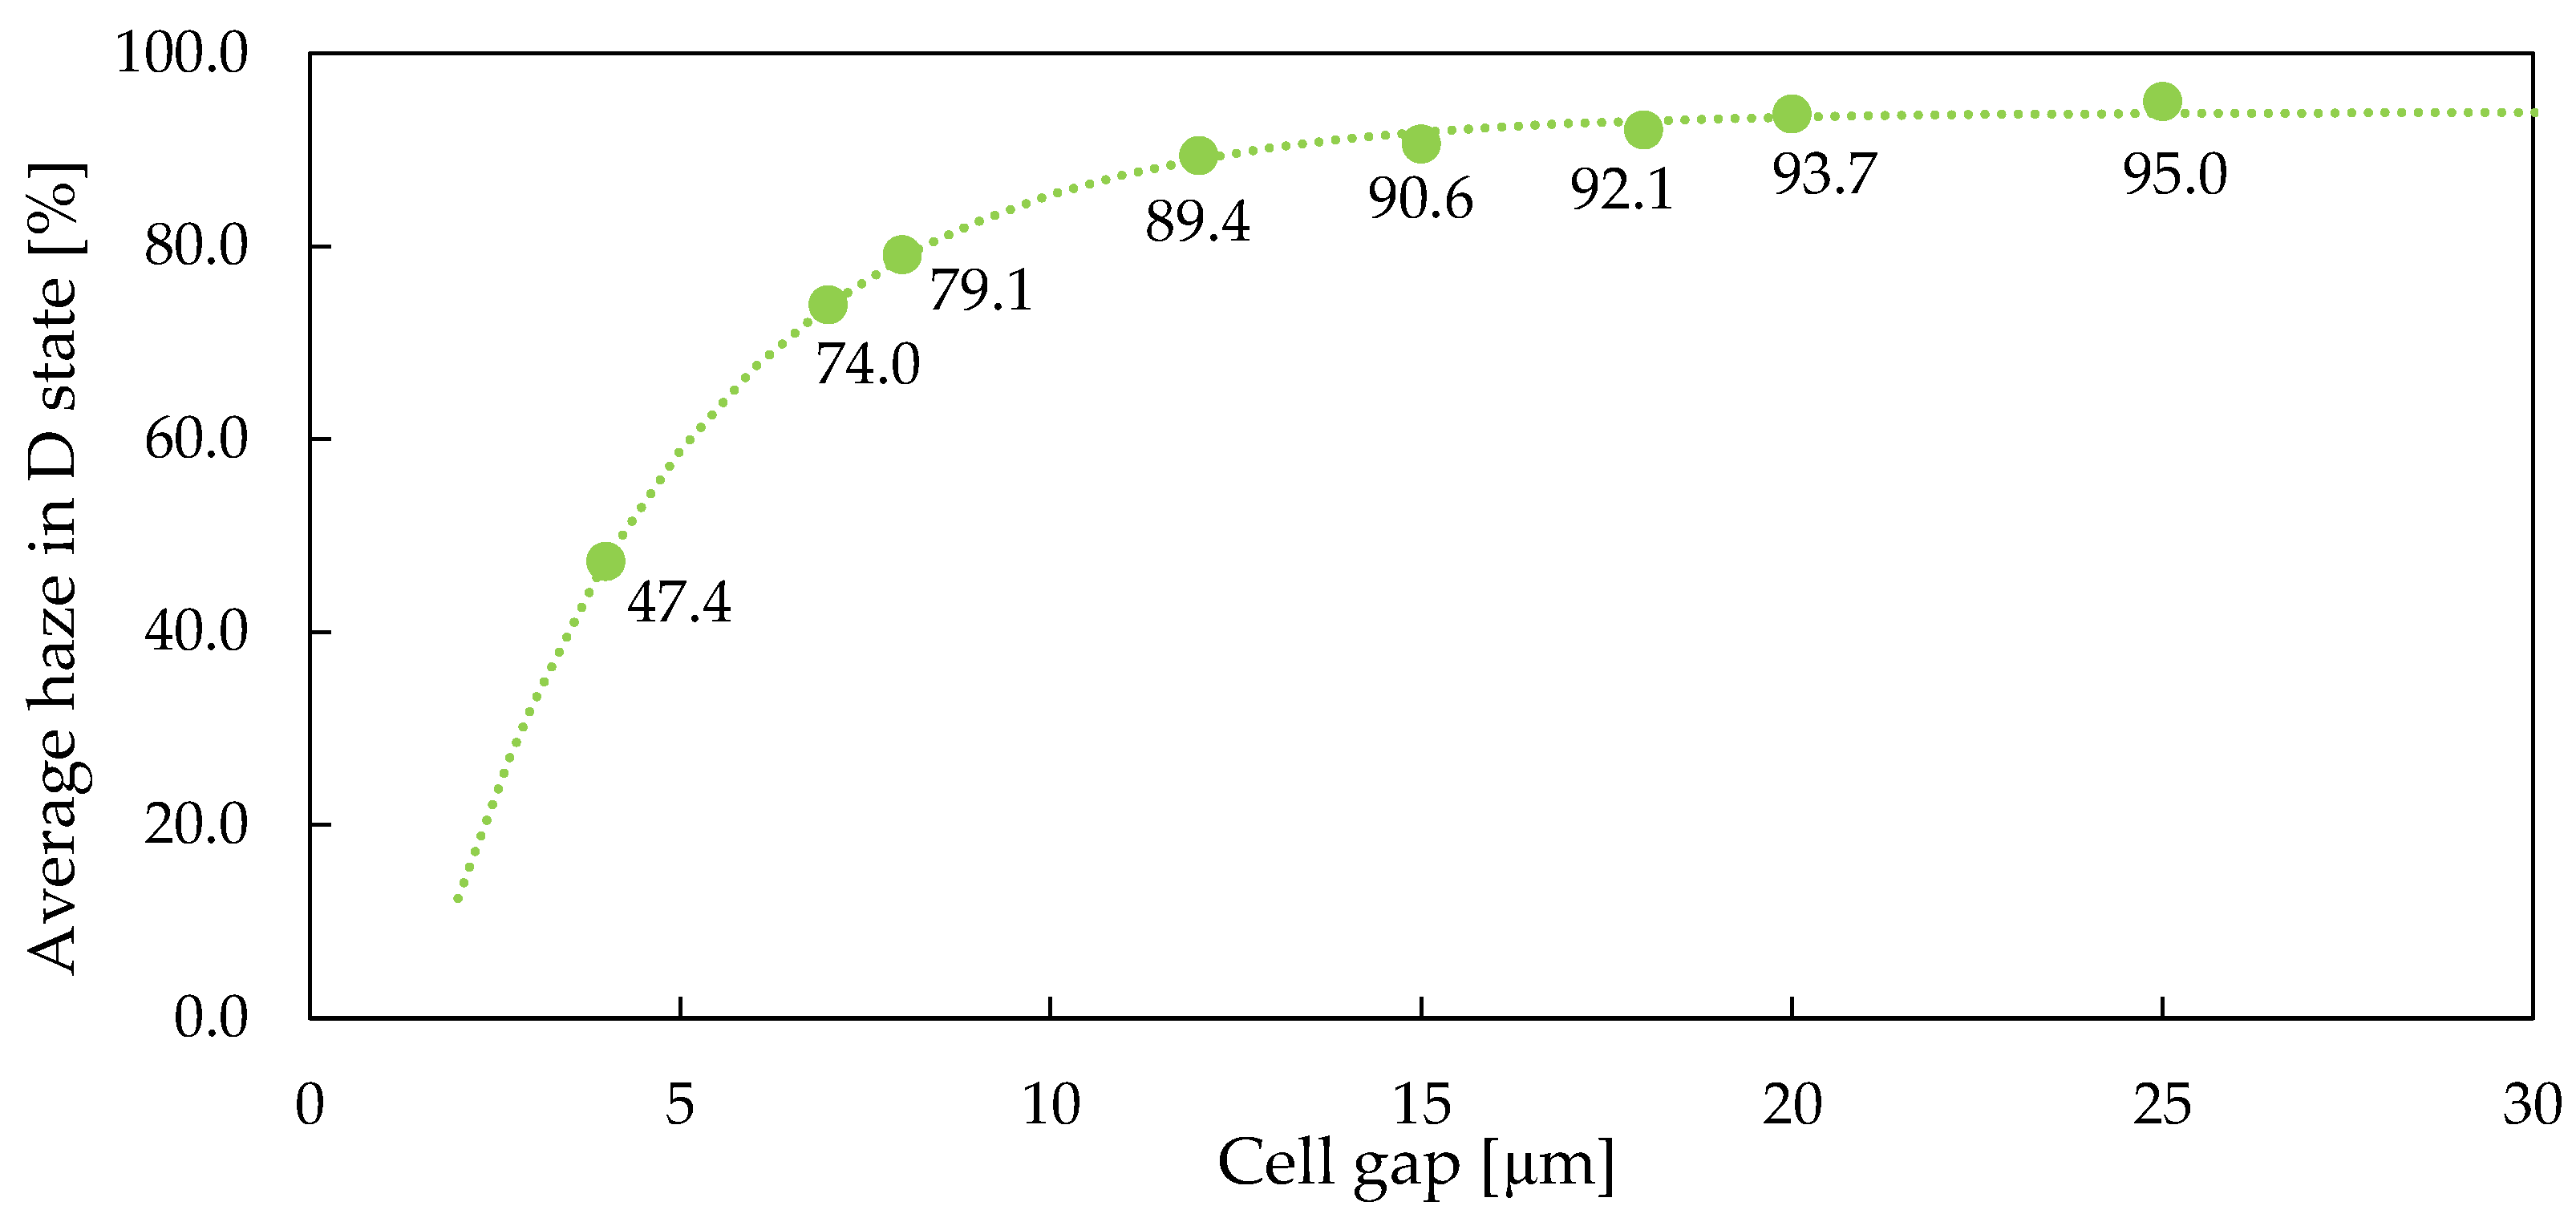
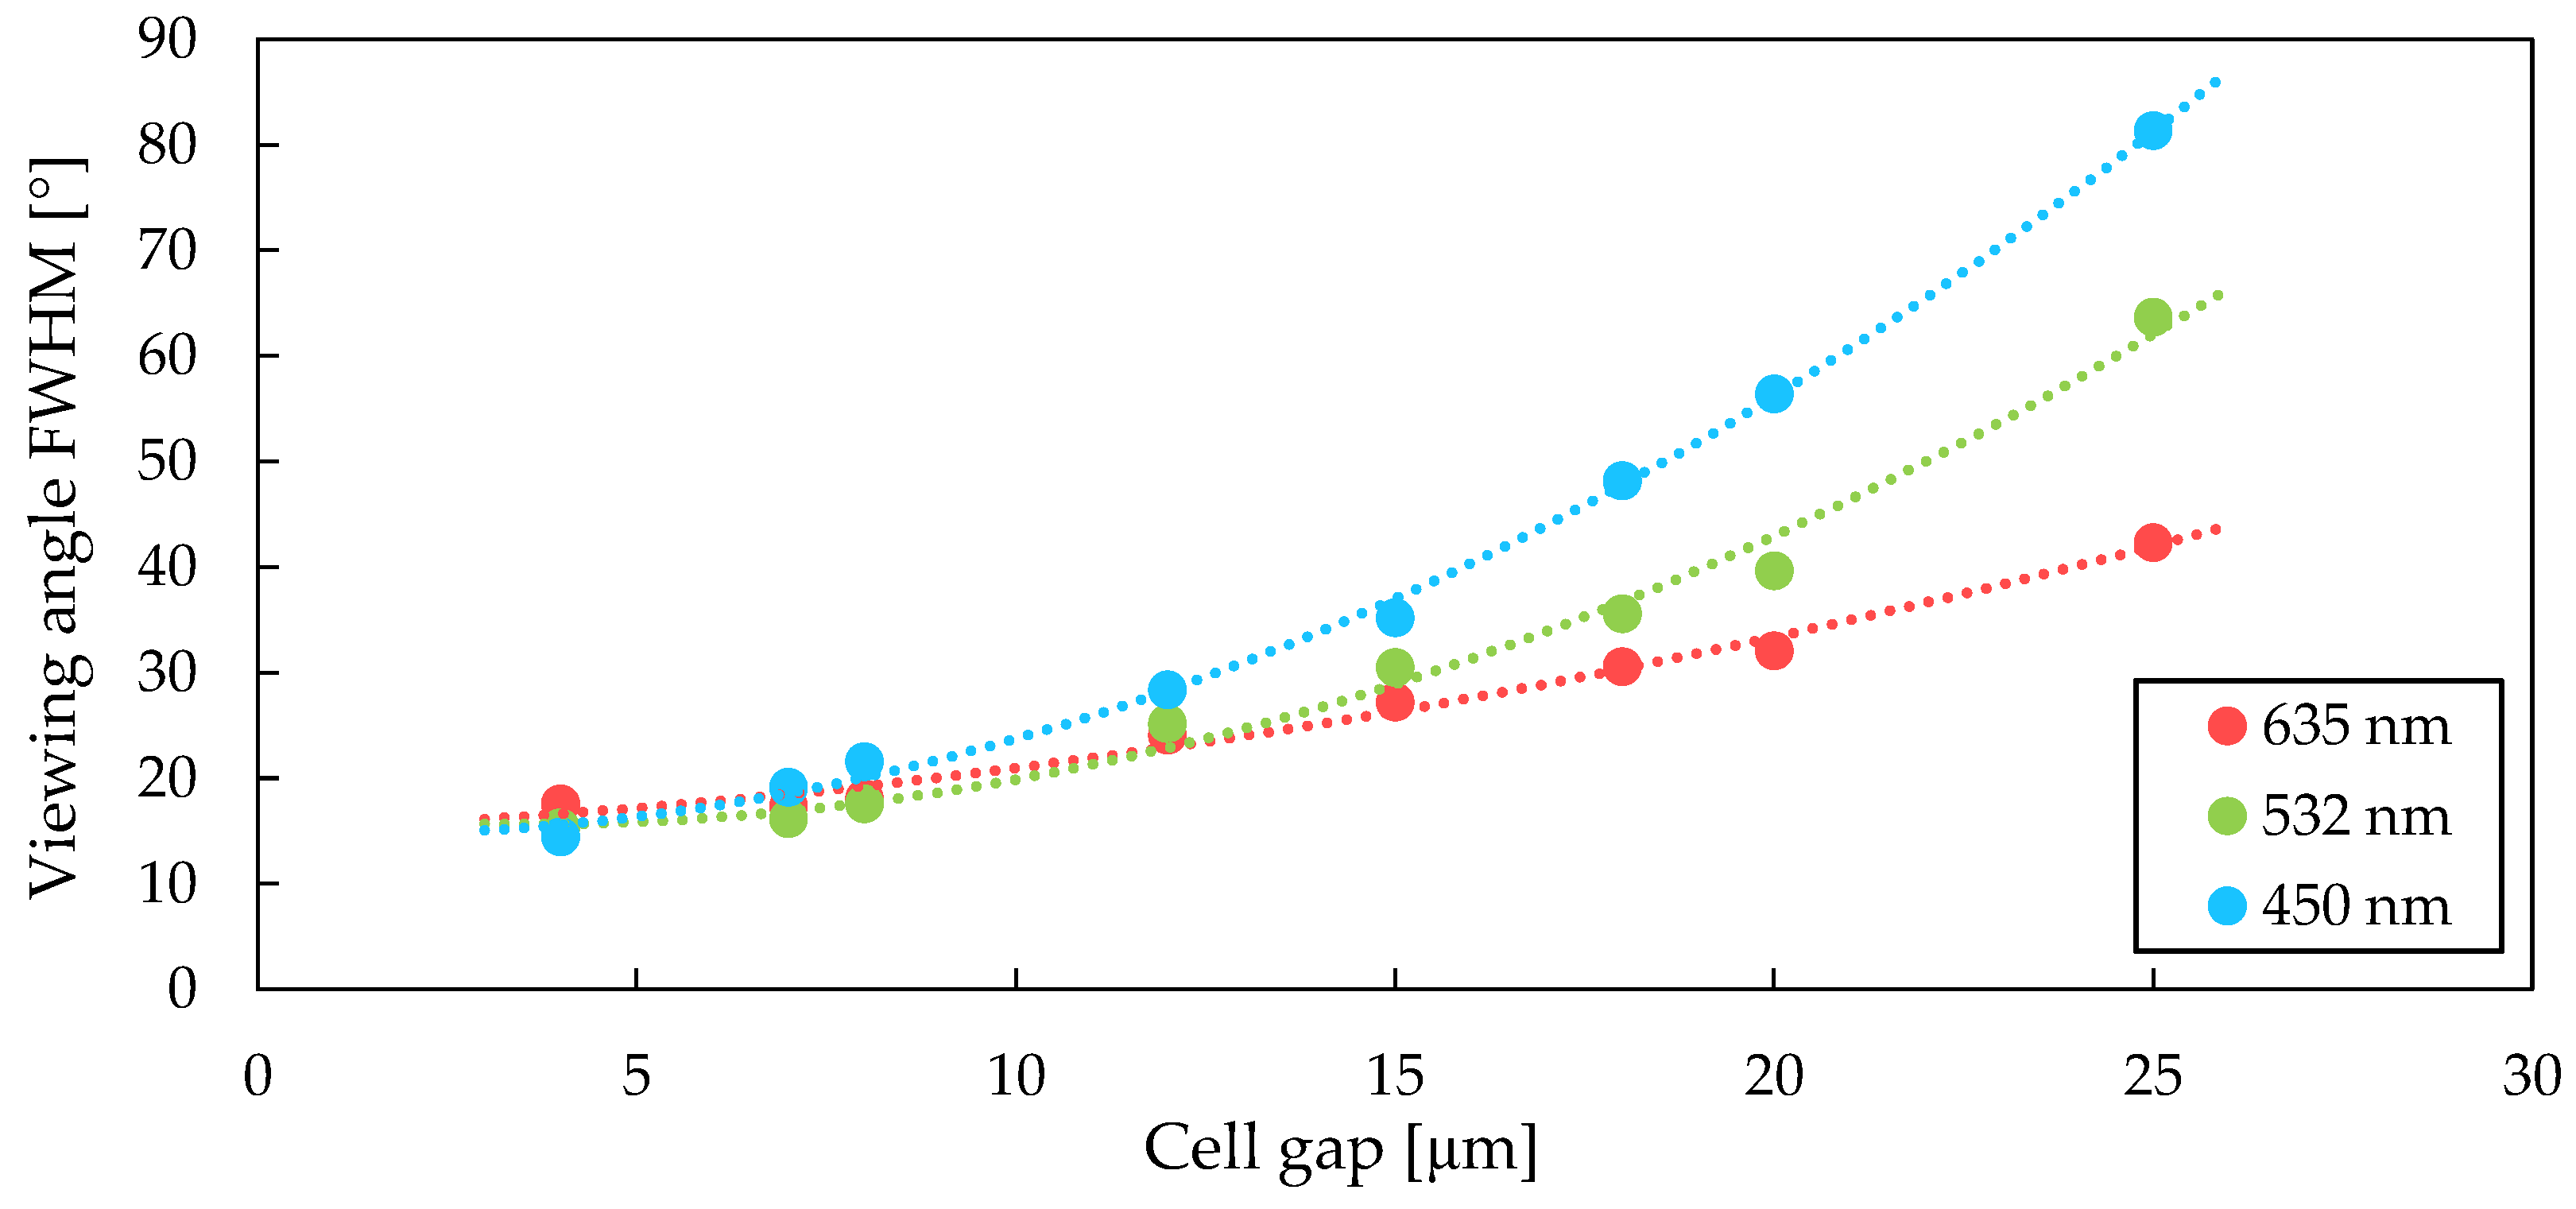
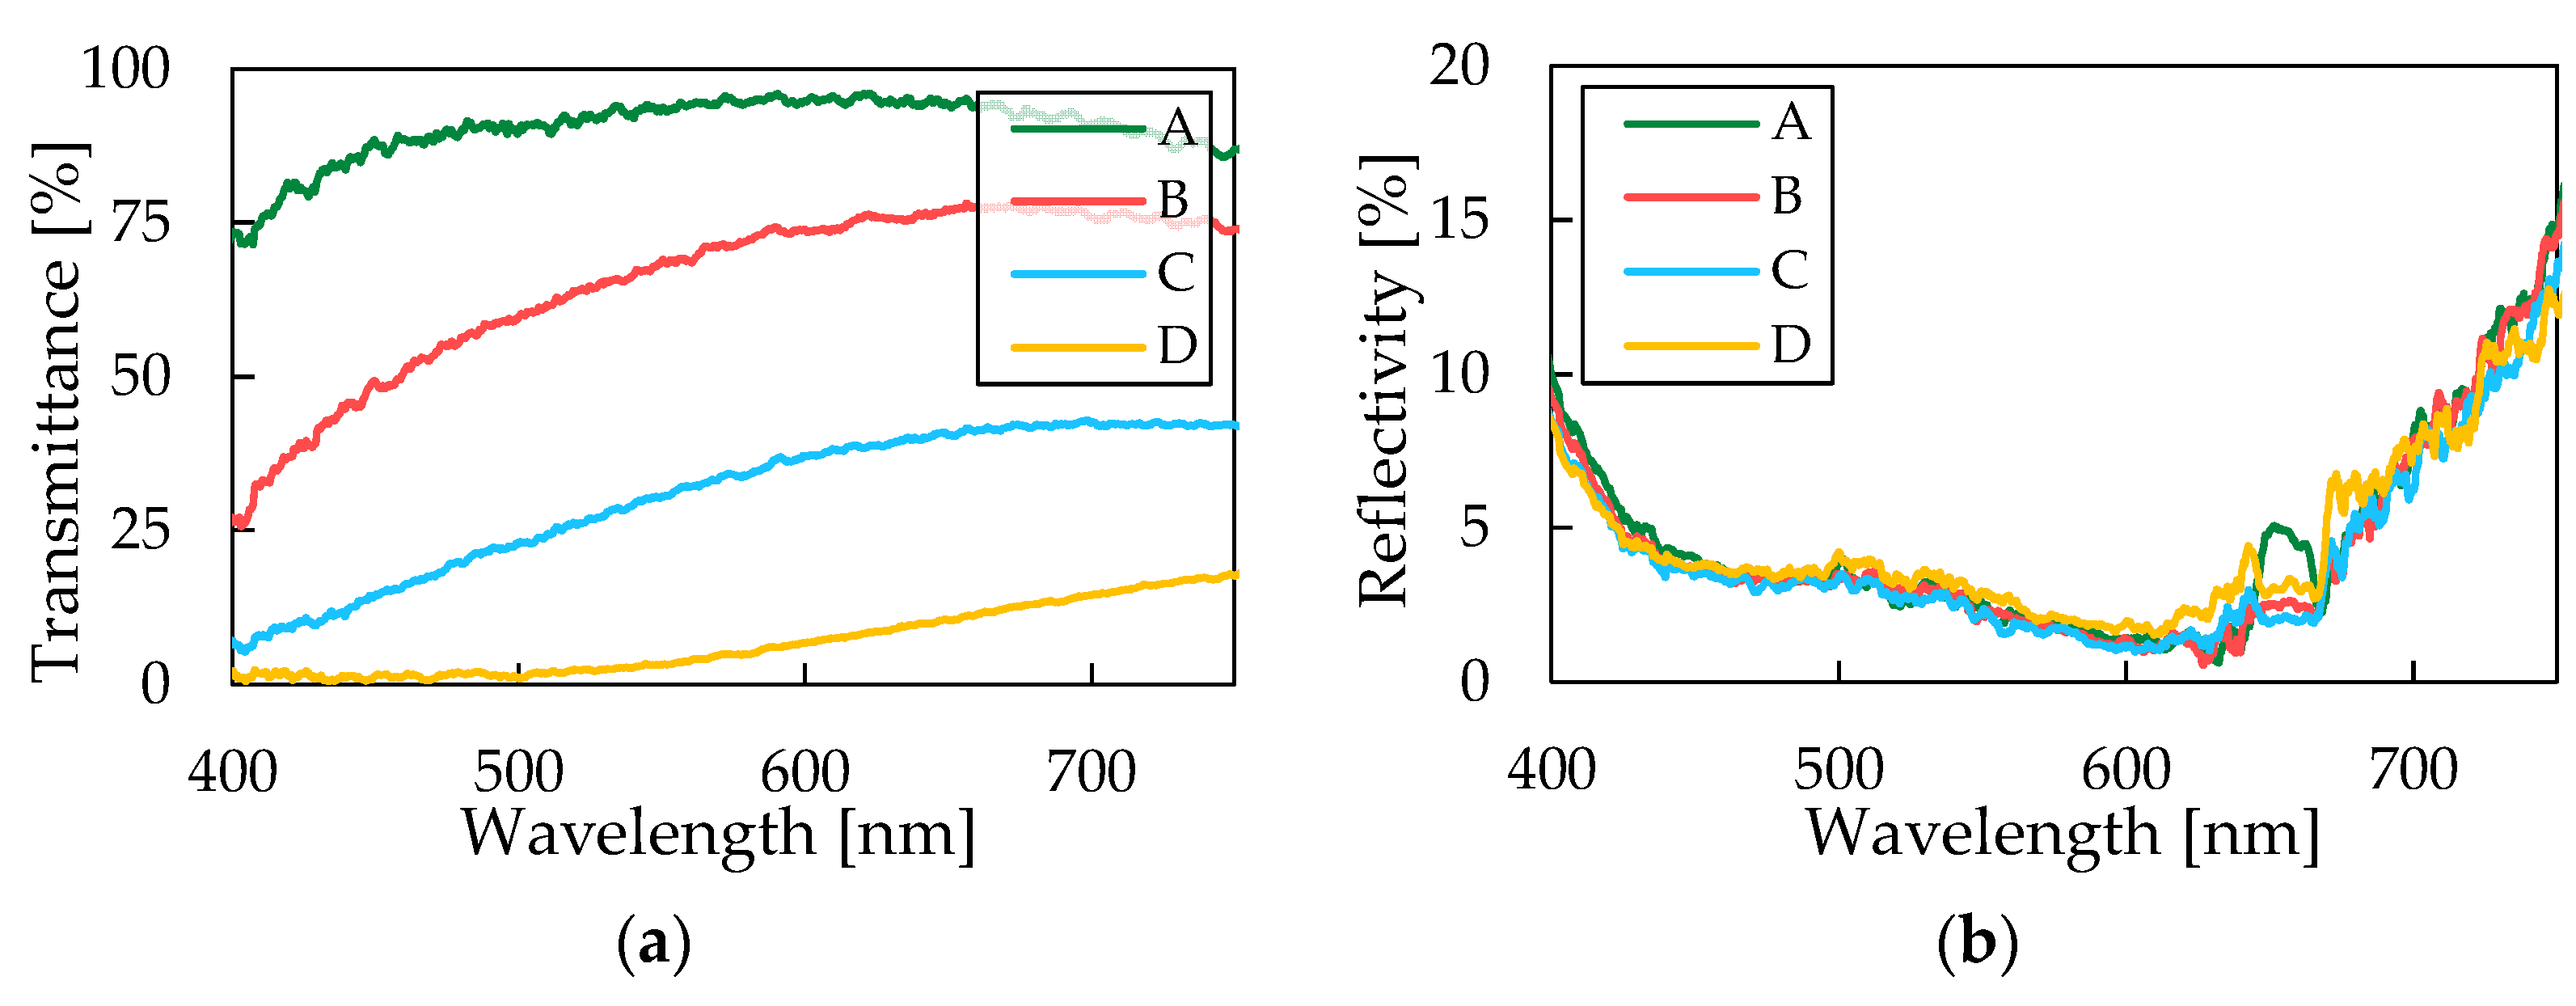
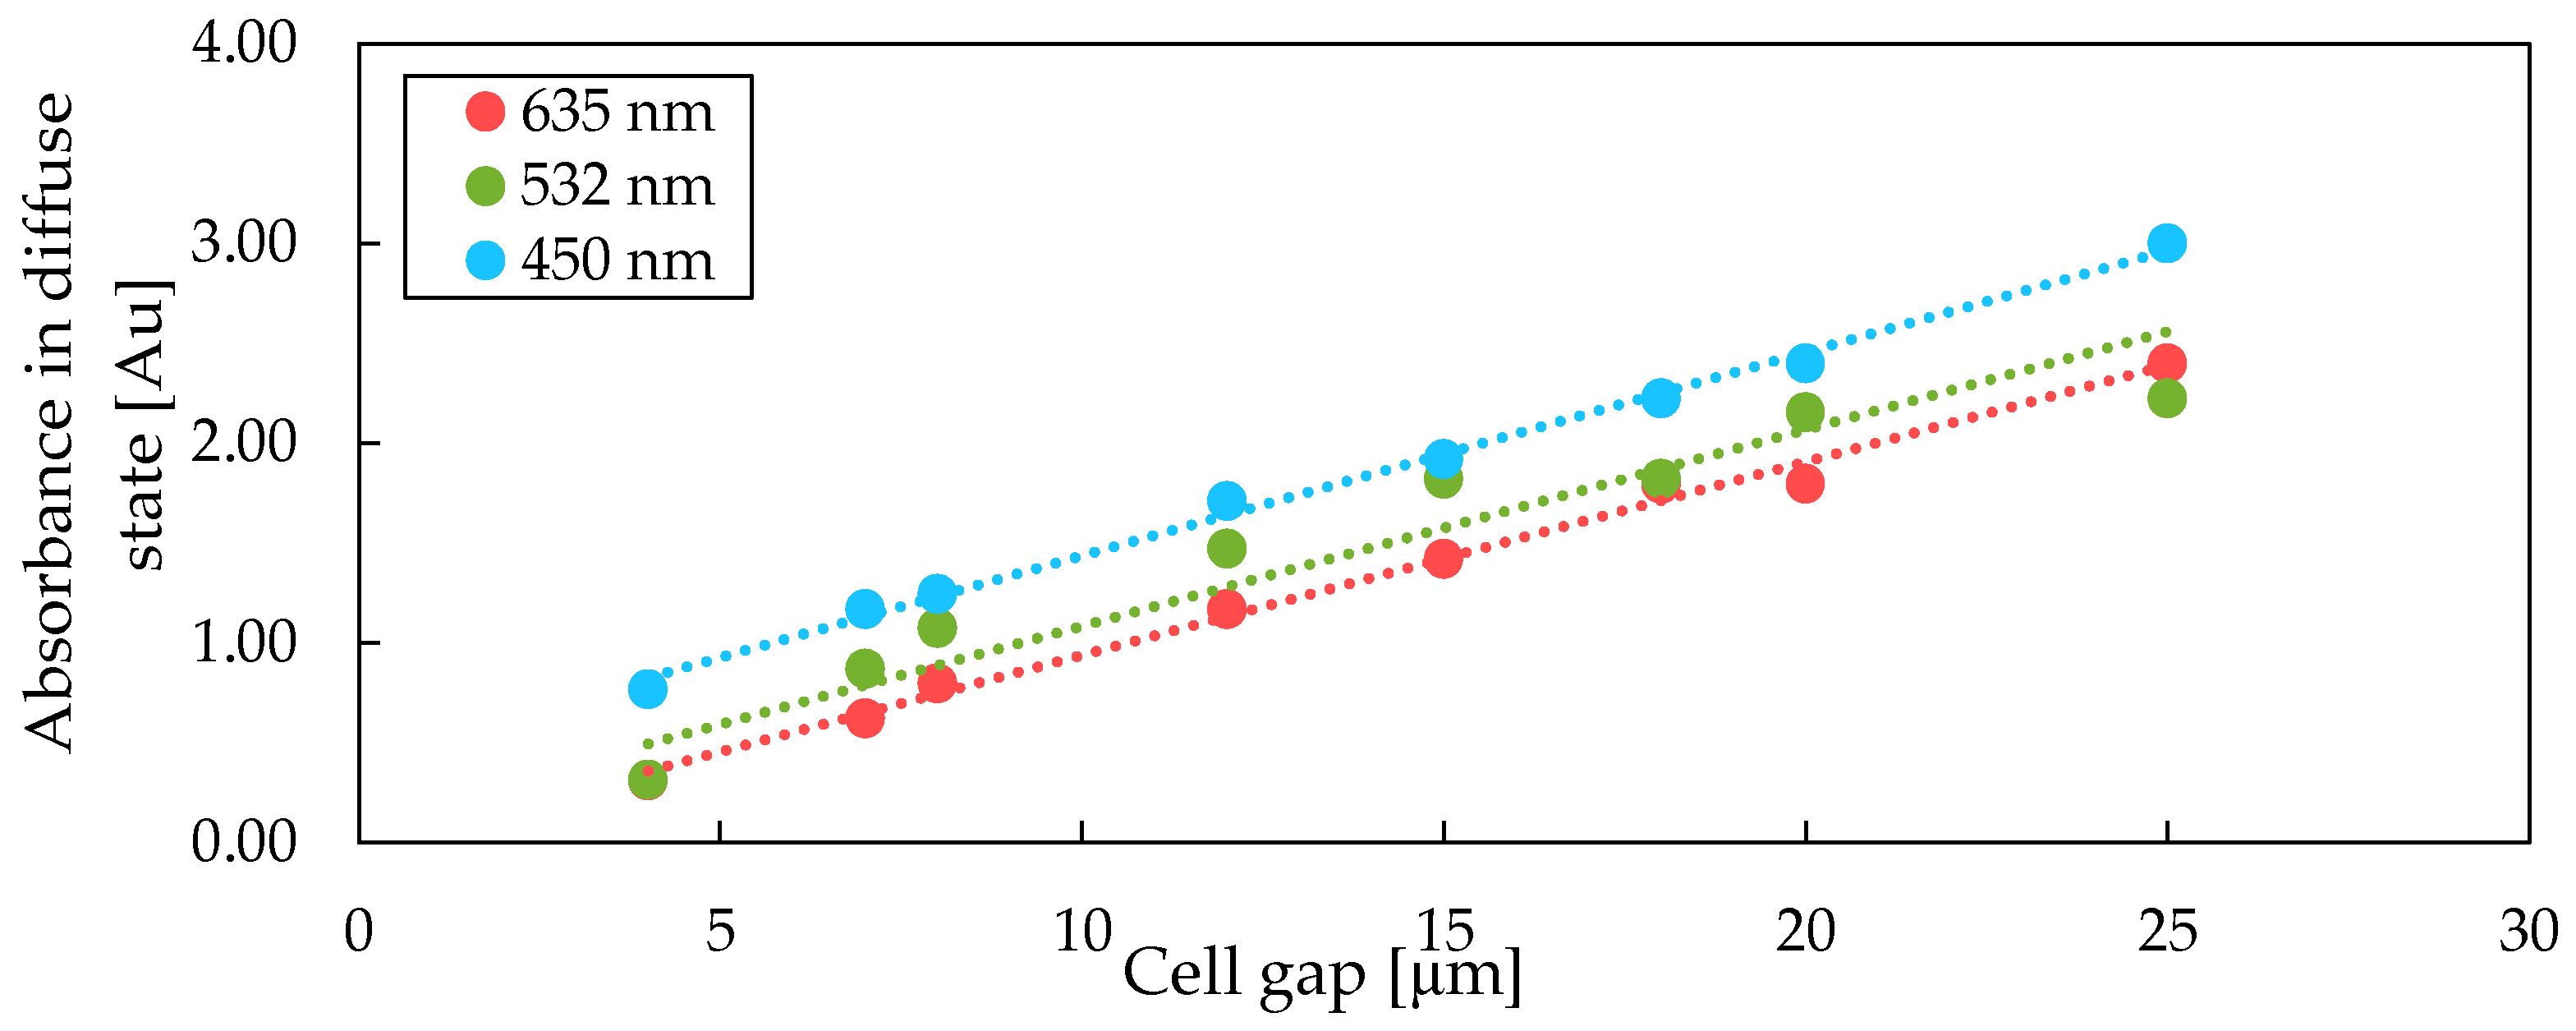
3.3. Scattering State

After the removal of the external electric field, up to approximately 250 μs is required for the microdomain nucleation seeds to form at room temperature. During this delay period, the light transmission remains constant and the scattering of light begins only afterwards. As can be seen in Figure 7, this is a metastable transient scattering state, which is characterized by a small domain structure and is relatively short lived. The exact time depends on the particular composition of the active LC layer but is in the order of tens of milliseconds; after this, the time domains grow and the light-scattering power decreases significantly.
The fraction of non-scattered light transmitted in the diffuse state depends on the cell gap. From the data (Figure 8), it can be seen that there is a relation—the larger the cell gap, the smaller the specular transmission in the diffuse state. Small cell gap diffusers have a pronounced high-specular transmission in the diffuse state. Therefore, a larger cell gap is beneficial for the quality of the liquid crystal diffuser performance (d > 12–15 mm).
A related trend between the cell gap and haze values within the diffuse state can be seen in Figure 9. With a growing cell gap, haze values also increase. The saturation of haze starts at around 12 µm cell gap and a further increase in haze is a slow asymptote towards 95.77%.
It is important to mention that these results could be impacted by switching speed kinetics. A cell with larger rise times could spend less time in the transmission state and, therefore, register elevated haze values.
Diffuse state light transmission and haze properties have strong correlation with viewing angle. Overall, increasing the cell gap also increases the viewing angle for all three wavelengths, see Figure 9 and Figure 10 (for diffuser elements with cell gap of 12 µm to 25 µm). The red (635 nm) wavelength has the narrowest viewing angle, while the blue (450 nm) has the widest viewing angle.

3.4. Influence of Driving Conditions

The transition from H to FC is not a homogeneous process and is related to structural changes in the liquid crystal bulk, as well as to the flow of material generated during this transition. It starts at the nucleation centers, such as the spacers or surface of polymer material in PDLC [20]. If voltage is removed slowly, the number of formed centers is lower, they grow to a larger size and, consequently, the resulting light-scattering power is weaker than in the case when the voltage is removed instantaneously, facilitating a higher number of nucleation centers and finer domain structure. Similar behavior is also observed for PFLC. The analogy is similar to crystallization of melts and either slow or fast cooling, resulting in either large-grain or fine-grain morphology. To obtain the highest scattering power, the capacitive structure of the cell must be discharged rapidly. Although the highest light-scattering power of a diffuser element is maintained for a limited time, it is more than enough for applications in time-sequential volumetric screens—including multi-focal near-eye display architectures. For example, considering four image planes and an image refresh rate of 60 Hz (240 Hz total), the maximum time slot devoted to a single frame is 4.16 ms. That is, in practice, the limiting factor for time-sequential volumetric display architectures is the switching time (rise time plus fall time), not the longevity of the super-diffusive state [21]. Even considering the lower threshold for a flicker-free (or flicker-tolerable) representation of a 3D image, a volumetric refresh rate of at least 50 Hz is required [22]. With this condition, a volumetric screen with 20 depth planes would cycle through one frame within 20 ms, leaving just 1 ms time slot per diffuser element. This highlights the fact that volumetric screen applications require virtually instantaneous switching to maximally utilize available time slots for the projection of graphical information and minimizing the “dead-time”.
In the case of PFLCs, if the electric field is decreased slowly, for example, by discharging conserved electric energy through a switched-off driver unit or added resistor, the switching speed is slower and the maximum scattering state is never observed, so transmission is only reduced to 40%, see Figure 11.
The shortest switching time for a PFLC is achieved by discharging through short-circuiting but then the transient peak is observed. If the discharge is slower, leading to longer switching times, the intensity of the transient peak decreases as well, see Figure 12.
A potential cause of the transient peak M could be attributed to reverse current caused by a dielectric double-boundary layer or the motion of electric carrier ions but no evidence was found within the current measurements, see Figure 13, and materials did not have any conductive ion contamination.
By measuring the cell current through 10 Ω shunt, the only current surge could be detected at the moment of switching off the drive signal, see Figure 13.

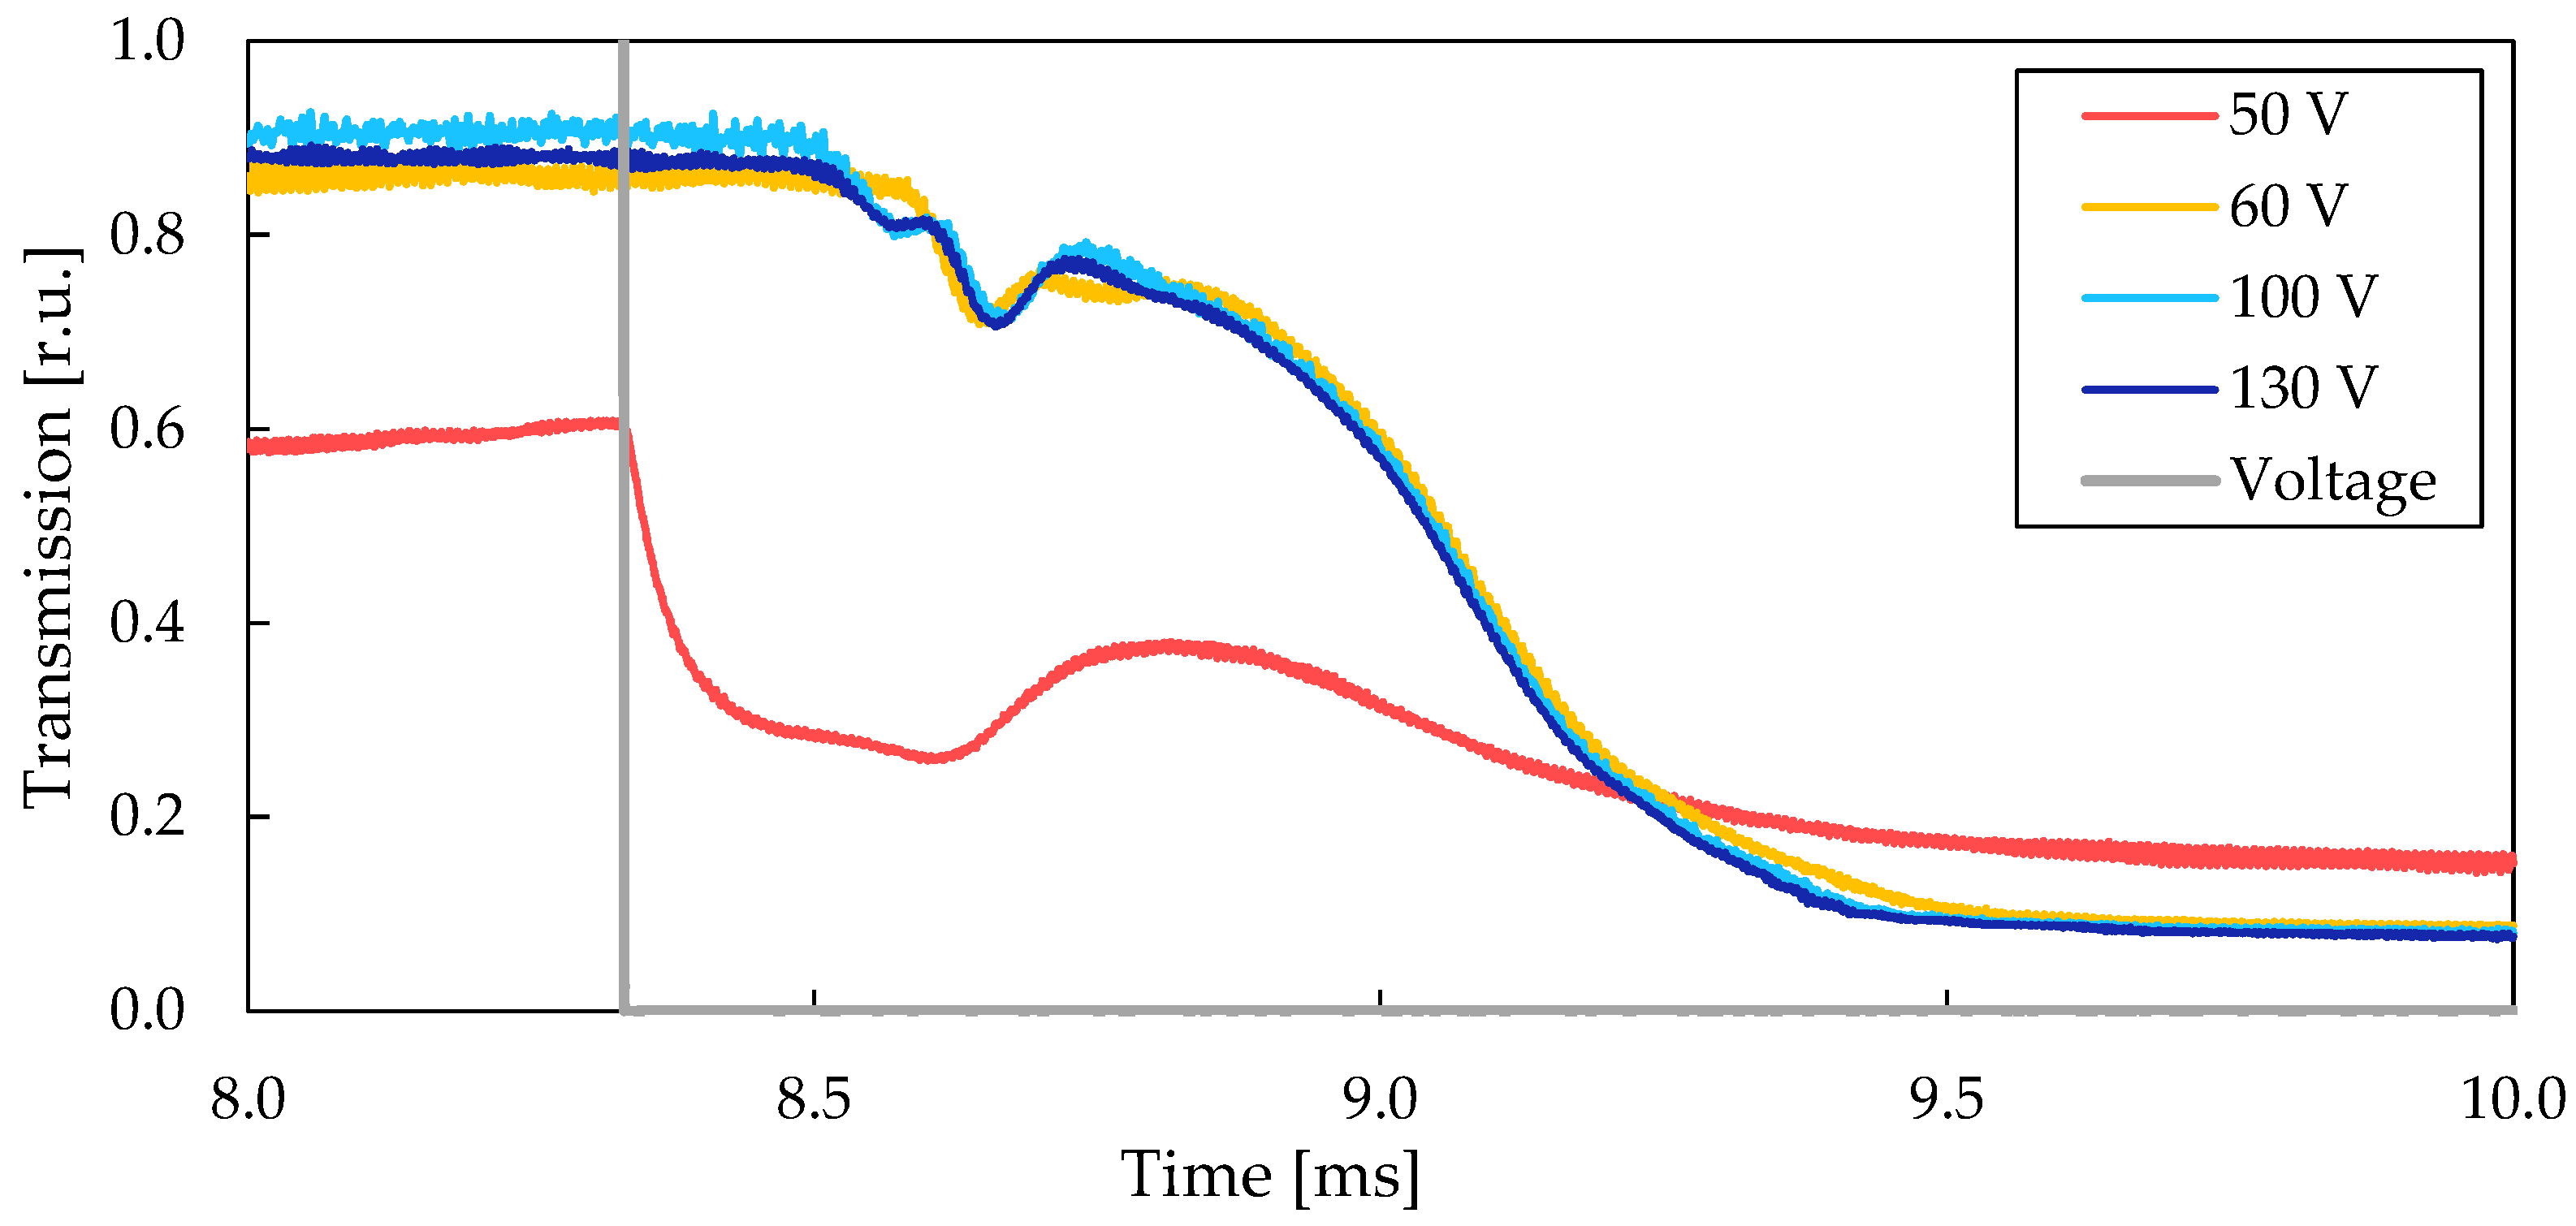
3.5. Transient Increase in Transmittance between H and FC States

The transient increase in transmittance (M), seen as a peak (Figure 4) after the initial drop in transmittance, can be explained by the possible formation of an energetically favorable transient state, similar to the intermediate planar state observed for PDLCs [23] or a microdomain orientation mechanism. A similar peak characteristic of the transient state can be seen in the FC-to-H transition but the distinctness of the peak depends on the driving conditions.
Approximately 0.2 ms are lost during the transient transmission peak, M state. Contrary to the TP state for PDLC systems, no selective reflection is observed. Transmission and reflection spectra of a 12 µm cell gap diffuser were measured with Ocean Optics Flame-T spectrometer, using an integrating sphere at several positions: A—before M state, B—at the maximum of M state, C—after the M state and D—at maximal diffuse (FC) state; see Figure 14.
The reflection does not significantly change for various time points or if polarizing filters are used. Since short-pitch systems will have narrow cholesteric reflection bands in the region of 510–580 nm, we cannot use it to confirm the supposed transient planar state. On the other hand, another type of transient state can be assumed. This issue is discussed later.
The influence of the confining substrate surfaces on the relaxation process decreases with increasing the thickness of the liquid crystal layer. By comparing different thicknesses in the LC layer, we can see that while fall time remains practically constant, transient peak M appears later for a thicker cell gap and also becomes narrower, see Figure 15.
The impact of a varying electric field intensity was evaluated by increasing the driving voltage in steps of 10 V. After the electric field reaches the switching threshold (60 V for the given samples), the nature of the transient state M does not change, see Figure 16.

3.6. Surface Role

One possible mechanism that might cause M is the reverse backflow of LC after the electric field is removed. PDLC devices typically use planar surface and LC backflow effects must be considered. As known from the literature [24], at planar and homeotropic anchoring conditions, there is a backflow effect after turning off the applied electric field. This backflow increases the fall (relaxation) time. On the contrary, in cells with reverse pretilt anchoring conditions (π-configuration), the fall time is shortened.
Different types of surfaces for LC alignment were evaluated, see Table 1. The intensity and timescale of the transient peak were observed to be similar for all surface conditions for 7 µm 67 × 60 mm cells. However, from the surface role studies, we can conclude that if any notable reverse backflow was present, it was countered by the reverse pretilt (antiparallel) surface condition, and it is not the cause of the transient peak M, as no change in its intensity or position on the falling edge was detected.
The fastest rise time is seen for homeotropic (PVD-sputtered SiOx) or high (80°) pretilt (SiO2 by CVD) surfaces, as in this configuration, LC near the surface is already oriented to the homeotropic direction, which will be enforced after the applied electric field. However, planar surface orientation provided better scattering properties than homeotropic orientation, which is more important. When antiparallel planar surface alignment is used for PFLC (promoting p-cell configuration), it provides higher light-scattering power, but the rise time is longer, when comparing to the parallel condition. Varying the LC anchoring strength to the surface, by changing the surface rubbing length (longer length corresponds to increased surface interaction), did not provide any noticeable effect on the diffuser performance (see Table 1).

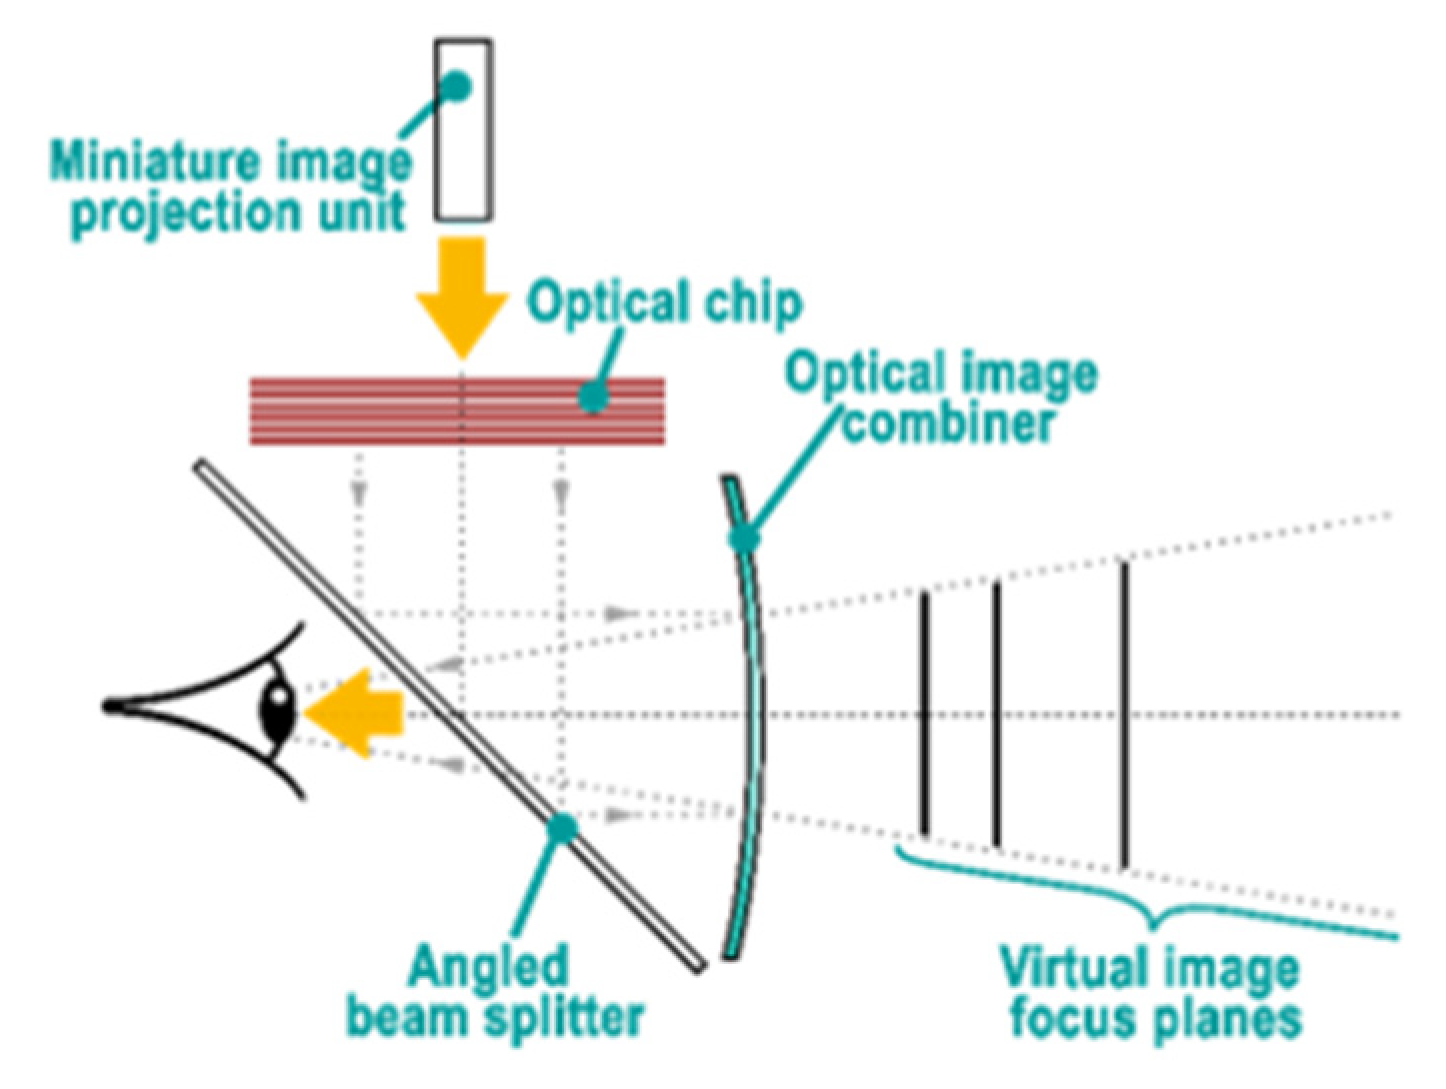
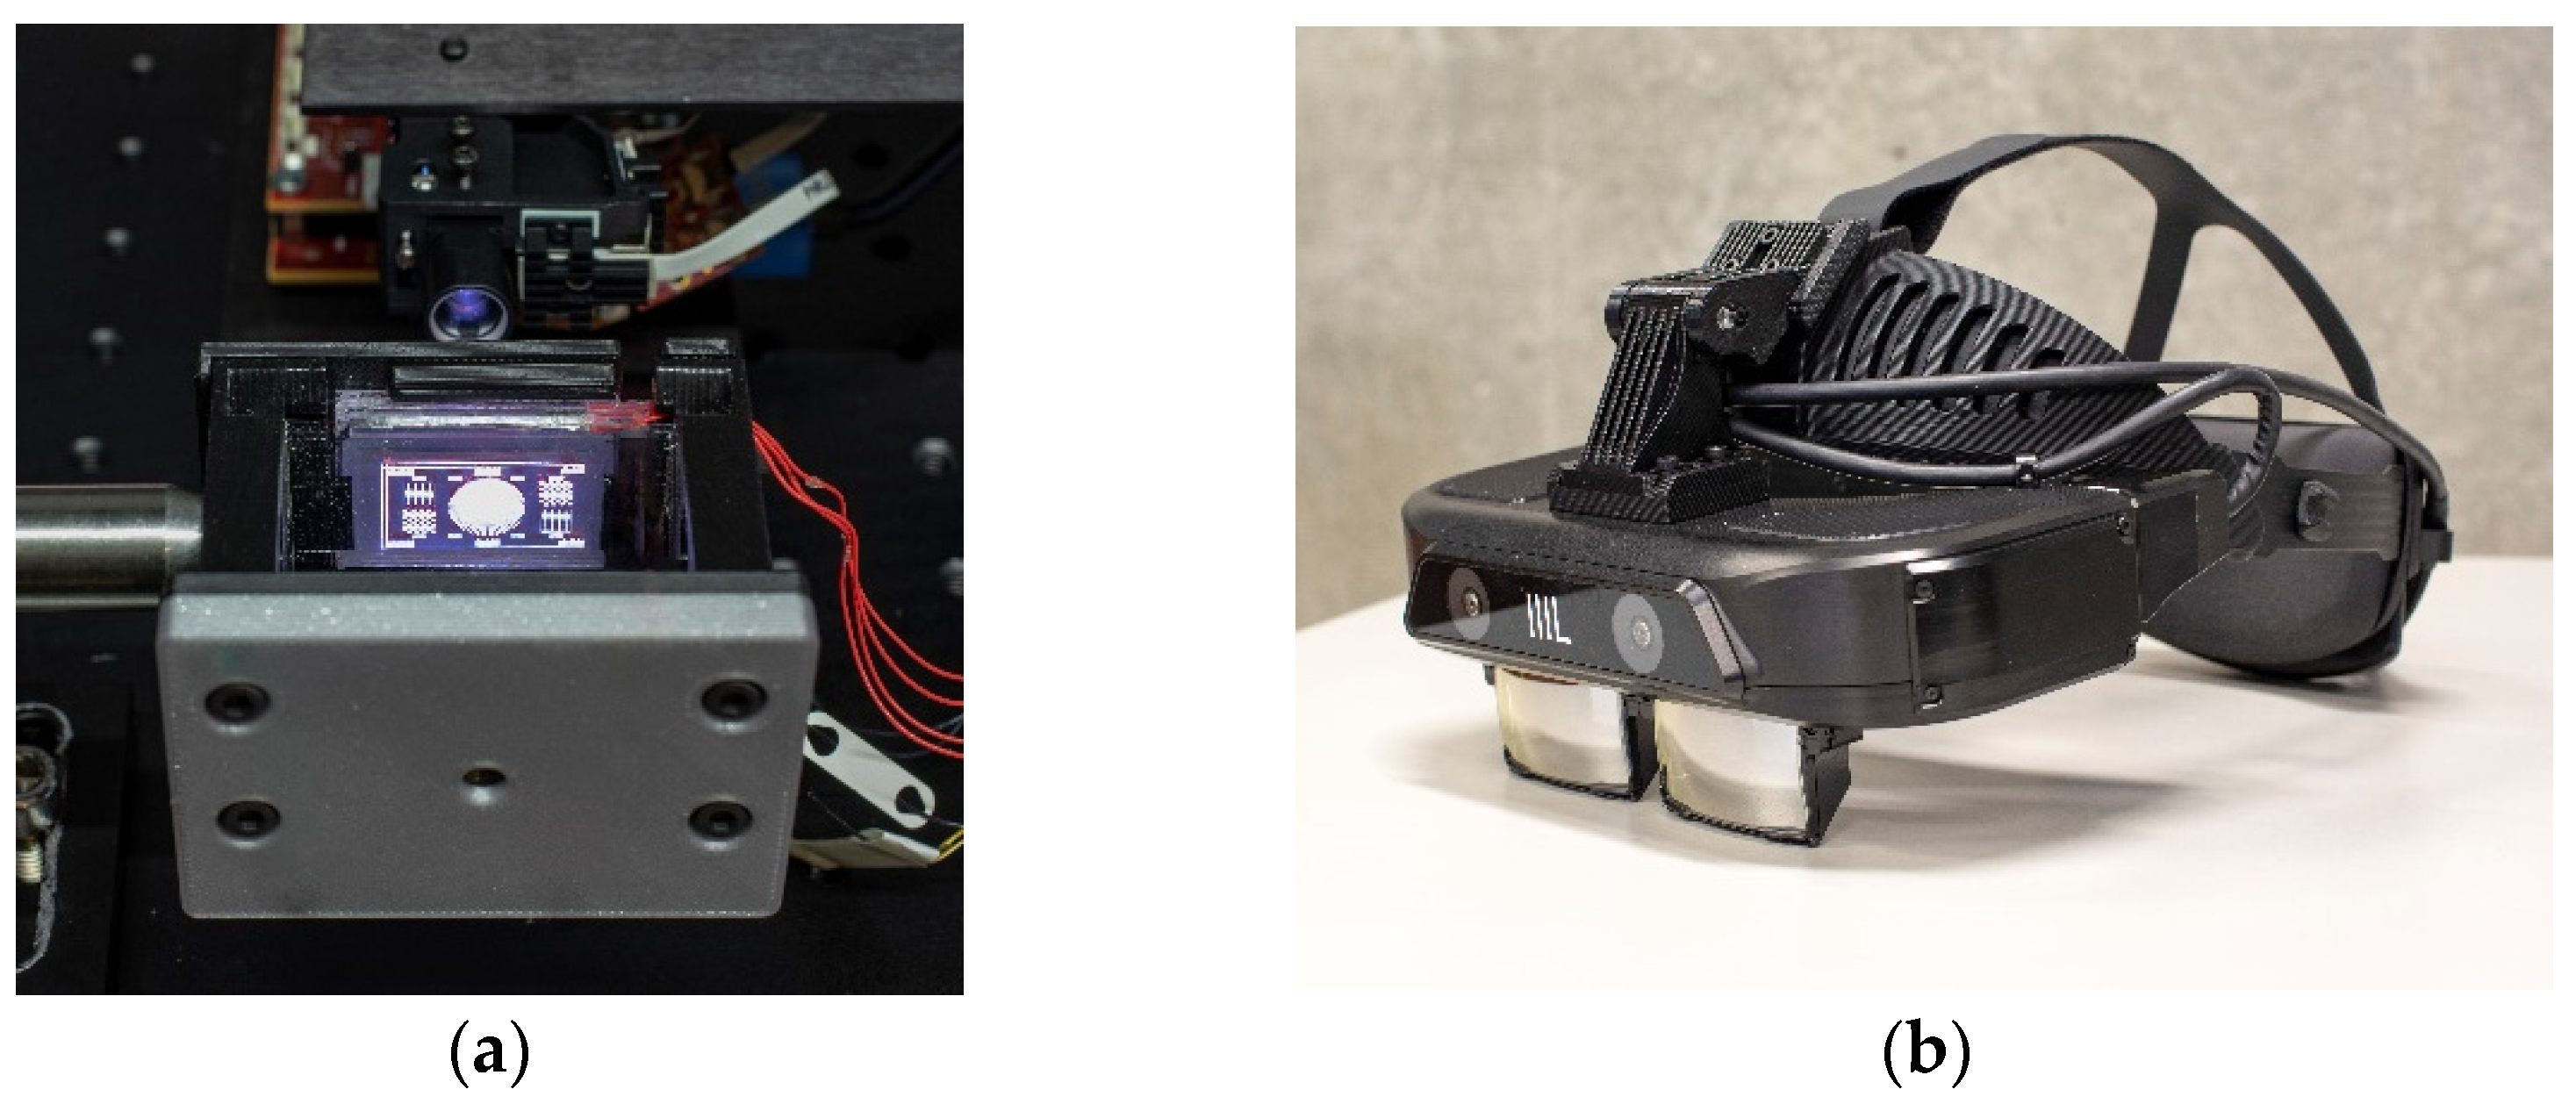
4. Application in Multi-Focal Display Architecture

For multi-focal applications, such as volumetric image display in virtual reality (VR) and augmented reality (AR) headsets, multiple LC cells or optical diffuser elements must be stacked together [25] to create an integrated optical chip (a discretized projection volume), see Figure 17.
The image volume comprises a stack of PFLC elements that are driven time sequentially. The image source is a fast image projection unit that is synchronized with the switching of diffuser elements to output the corresponding image depth plane at each respective moment in time. One of the PFLC elements is kept in the scattering state, while others are kept transparent. It is obvious that the contrast ratio depends on maximum transparency in the individual diffuser element and the effects impacting the image contrast will be multiplied by a number of diffuser elements within the stack.
Figure 18 shows the absorbance A of a PFLC obtained from transmittance T measurements as A = lg ( 1 / T ) . This value, therefore, also includes light lost through reflections from interfaces. However, the number of such interfaces is a constant for all samples; thus, the change in absorbance for different cell gaps is due to the absorption of light within the LC.
It is easy to notice that the absorbance depends on the wavelength of light used. For accurate color representation, a diffuser element, in an ideal case, should absorb (as well as scatter) all wavelengths in the visible spectrum equally. As can be seen from the transmission spectra in the figure below (Figure 19), this is not the case—the diffuser elements are more transparent to longer wavelengths of visible light, in both the H and FC states. This means that some color adjustments are required when rendering an image if accurate color representation is needed, as the images can otherwise have a red tint.
For practical applications, a 33 mm × 22 mm four-element multi-focal optical element MOE or optical chip was prepared by laminating individual diffuser elements with optically clear adhesive (OCA).
A small-sized volumetric screen, integrated with a projection system, and its corresponding performance is shown in Figure 20.

5. Discussion

In the evaluation for the characteristics of a liquid crystal diffuser applied in multi-focal display architectures, we shed light on some of the existing problems, with a focus on their mechanisms. We also suggest some measures to overcome these problems and to improve the performance of the liquid crystal diffuser.
As known from the literature, direct transition from H to Grandjean texture (the so-called planar state (P), with helix axis along the confining substrates’ normal) is not possible. Usually, this transition passes through the transient FC state. The cholesteric liquid crystal devices may exhibit three stable states, with textures being Grandjean (P), Focal Conic (FC) and Uniform Lying Helix (ULH), respectively (c.f. Figure 20). The switching between these states is possible by applying an electric field with appropriate form and duration, and/or surface treatment. Moreover, such a switching may be performed by the application of mechanical flow, with or without application of an electric field, which can be ether unidirectional, inducing transition from P or FC texture to ULH texture, or mechanical pressure, inducing the transition from P or ULH texture to FC texture.
The optical appearance of P, FC and ULH differs substantially. The P texture selectively reflects the incoming light with wavelength λ0, which is directly related to the cholesteric pitch p by λ0 = Δnp, where Δn is the average refractive index [n = (no + ne)/2], with no and ne being the ordinary and extraordinary indices of refraction. FC texture scatters the incoming light, whereas ULH texture is completely transparent.
Transitions between these textures, with or without applied field, usually takes place through transient states (structures). In ref. [26], it was found that the appearance of transition peak M in the electro-optical curve, after the removal of the applied electric field during H-P transition, indicated an increase in light transmission. The peak was considered to be a result of the appearance of a transient Grandjean-like cholesteric structure during the relaxation process.
As reported here, a similar peak in the light transmission curve of the liquid crystal diffuser studied in this work, was obtained after the removal of the electric field. This peak M in the optical response of the liquid crystal diffuser worsens the light scattering characteristic of the diffuser. Our investigations show, however, that the transient peak M does not exhibit selective reflection and, therefore, could not be assigned to the appearance of a transient (P) state. The increased light transmission, at the time of appearance of the peak M, suggests that the formation of domains with uniform lying helix texture, which are optically transparent, takes place during the relaxation process. The material flow, which is a result of the structural changes in liquid crystal bulk, is considered as the origin of this transient state, manifested by the peak M in the optical response of the diffuser. This flow may have a parallel component with respect to the confining substrates in certain regions of the liquid crystal bulk. However, such a flow gives a preferred orientation of the growing, as well as of the orientation, of existing cholesteric domains, thus, forming domains with transparent ULH structure. This process is transient and overgoes with the time to the FC state and then to the F state, respectively (see Figure 21, red arrows). Notice also that the H texture may relax permanently to a Grandjean texture through transient textures, being either FC or ULH.
As already mentioned, the appearance of a transient ULH state, indicated by the peak M in the optical response of the liquid crystal diffuser, is not desirable. One possible way to remove it is to apply an electric field with the form of a continuous decrease in the applied voltage (ramp) to the diffuser, rather than a sudden switch off to the voltage.
Applying anchoring conditions in the experimental cells, promoting the high reverse pretilt in the liquid crystal molecules at the confining substrates and, thus, realizing p-cell configuration, which eliminates the backflow effect in the H state and, hence, shortens the fall time, was observed and reported in this work.
Another alternative way of shortening the response fall time is to accelerate the relaxation process by increasing the concentration of the nucleation seeds, either in the liquid crystal bulk (via addition of nanoparticles or creating shallow appropriate polymer network) or by increasing their concentration on the substrates (creating appropriate surface topography).

6. Conclusions

In this work, we evaluated some of the key characteristics of a cholesteric liquid crystal diffuser element, which is a part of a volumetric image device. We evaluated the key characteristics of the diffuser, switching time, light transmission and their dependence on chiral dopant concentration, surface anchoring conditions and presence of transient state. This evaluation aimed to find out the measures, which can be undertaken, for an improvement in the device performance. For instance, increasing the concentration of a chiral dopant used in the PFLC diffuser shortens cholesteric pitch and decreases switching time from the H to FC state. However, the dependency of fall time vs. concentration has a pronounced minimum, after which increasing the concentration of chiral additive increases the switching time, while decreasing the effectiveness of the diffuser element’s light-scattering power. For one of the highest HTP dopants, the optimum concentration is found to be about 2.5%.
The surface-anchoring condition also has an effect on the characteristics of diffusers. The light-scattering characteristics can be facilitated by antiparallel surface alignment, which was shown to reduce direct transmission by 82% in comparison to homeotropic alignment while increasing switching time FCH by 30%. The influence of the anchoring conditions is most prominent in the cells with thinner cell gaps. The transient peak M in the optical response of the diffuser, during the relaxation from H to FC state, is found to be substantially suppressed when the experimental cell is in the p-cell configuration (with reverse pretilt at cell confining substrates’ surface) or when driving the cell with a flatter voltage-drop ramp.
To master the surface-anchoring conditions is an important pre-requisite for facilitating the H-FC transition process in the liquid crystal diffuser element. It is also worth mentioning that the H-FC transition in thick cells can also be accelerated by the presence of nucleation seeds in the bulk, such as the polymer fibers in a polymer network, created in the liquid crystal bulk, or dissolved in the liquid crystal nanoparticles, for instance.
Other optional improvement steps for the diffuser element performance, with a focus on the electrical driving of the device, are under way.

Author Contributions

Conceptualization, data curation, formal analysis and methodology, writing—original draft, A.O. Investigation and resources, R.Z. and A.O. Funding acquisition and validation, R.Z. Writing—review and editing, R.Z., L.K. and E.L. Data visualization, E.L. All authors have read and agreed to the published version of the manuscript.

Funding

This research was funded by the European Regional Development Fund, Project No. 1.1.1.1/19/A/070, Development of multi-plane volumetric display screen with improved optical performance by utilization of polymer interlayer lamination. Crystals 12 00733 i008

Institutional Review Board Statement

Not applicable.

Informed Consent Statement

Not applicable.

Data Availability Statement

Not applicable.

Conflicts of Interest

The funders had no role in the design of the study; in the collection, analyses, or interpretation of data; in the writing of the manuscript, or in the decision to publish the results.

References

  1. Zhou, Y.; Zhang, J.; Fang, F. Vergence-accommodation conflict in optical see-through display: Review and prospect. Results Opt. 2021, 5, 100160. [Google Scholar] [CrossRef]
  2. Shibata, T.; Kim, J.; Hoffman, D.M.; Banks, M.S. Visual discomfort with stereo displays: Effects of viewing distance and direction of vergence-accommodation conflict. In Proceedings of the Stereoscopic Displays and Applications XXII, San Francisco, CA, USA, 23–27 January 2011; Woods, A.J., Holliman, N.S., Dodgson, N.A., Eds.; Volume 7863, p. 78630P. [Google Scholar]
  3. Banks, M.S.; Kim, J.; Shibata, T. Insight into vergence/accommodation mismatch. In Proceedings of the Head- and Helmet-Mounted Displays XVIII: Design and Applications, Baltimore, MD, USA, 16 May 2013; Volume 8735. No. 873509. [Google Scholar] [CrossRef] [Green Version]
  4. Zhan, T.; Xiong, J.; Zou, J.; Wu, S.-T. Multifocal displays: Review and prospect. PhotoniX 2020, 1, 10. [Google Scholar] [CrossRef] [Green Version]
  5. Aksit, K.; Lopes, W.; Kim, J.; Shirley, P.; Luebke, D. Near-eye varifocal augmented reality display using see-through screens. ACM Trans. Graph. 2017, 36, 1–13. [Google Scholar] [CrossRef]
  6. Hu, X.; Hua, H. High-resolution optical see-through multi-focal-plane head-mounted display using freeform optics. Opt. Express 2014, 22, 13896. [Google Scholar] [CrossRef] [PubMed]
  7. Gu, G.; Parthasarathy, G.; Tian, P.; Burrows, P.E.; Forrest, S.R. Transparent stacked organic light emitting devices. II. Device performance and applications to displays. J. Appl. Phys. 1999, 86, 4076–4084. [Google Scholar] [CrossRef]
  8. Gu, G.; Parthasarathy, G.; Burrows, P.E.; Tian, P.; Hill, I.G.; Kahn, A.; Forrest, S.R. Transparent stacked organic light emitting devices. I. Design principles and transparent compound electrodes. J. Appl. Phys. 1999, 86, 4067–4075. [Google Scholar] [CrossRef]
  9. Li, C.-C.; Tseng, H.-Y.; Liao, H.-C.; Chen, H.-M.; Hsieh, T.; Lin, S.-A.; Jau, H.-C.; Wu, Y.-C.; Ya-Ling, H.; Hsu, W.-H.; et al. 74-4: High-image-quality Transparent Display based on AMOLED with Cholesteric Liquid Crystal Back-panel. SID Symp. Dig. Technol. Pap. 2018, 49, 993–995. [Google Scholar] [CrossRef]
  10. Kuksenkov, D.V.; Kang, C.; Lynn, C.M.; Timofeev, N.T.; Aguilar, A.; Joos, F.M.; Ishikawa, T.; Mlejnek, M. 55-3: Efficient, Low Haze Light Extraction for OLED Displays Using Micro-Optic Patterns Imprinted on Glass. SID Symp. Dig. Technol. Pap. 2020, 51, 818–821. [Google Scholar] [CrossRef]
  11. Sullivan, A. DepthCube solid-state 3D volumetric display. In Proceedings of the Stereoscopic Displays and Virtual Reality Systems XI, San Jose, CA, USA, 19–22 January 2004; Woods, A.J., Merritt, J.O., Benton, S.A., Bolas, M.T., Eds.; Volume 5291, pp. 279–284. [Google Scholar]
  12. Wang, Y.-J.; Lin, Y.-H. Liquid crystal technology for vergence-accommodation conflicts in augmented reality and virtual reality systems: A review. Liq. Cryst. Rev. 2021, 9, 35–64. [Google Scholar] [CrossRef]
  13. Yang, D.-K.; Wu, S.-T. Fundamentals of Liquid Crystal Devices; John Wiley & Sons: Chichester, UK, 2006. [Google Scholar]
  14. Ozols, A.; Zutis, E.; Zabels, R.; Linina, E.; Osmanis, K.; Osmanis, I. Fast-switching liquid crystal diffusers: Outlook on optical properties and applicability in volumetric display architecture. In Proceedings of the Digital Optical Technologies 2021, Munich, German, 21–25 June 2021; Peroz, C., Kress, B.C., Eds.; SPIE: Bellingham, WA, USA; p. 26. [Google Scholar]
  15. Ozols, A.; Mozolevskis, G.; Letko, E.; Rutkis, M.A.; Zabels, R.; Linina, E.; Osmanis, I. Sputtered SiOxNy thin films: Improving optical efficiency of liquid crystal diffuser elements in multi-focal near-to-eye display architecture. In Proceedings of the Advances in Optical Thin Films VII, Online, 13–17 September 2021; Lequime, M., Ristau, D., Eds.; SPIE: Bellingham, WA, USA; p. 15. [Google Scholar]
  16. Chen, R.H. Liquid Crystal Displays: Fundamental Physics and Technology; John Wiley & Sons: Hoboken, NJ, USA, 2011. [Google Scholar]
  17. Mozolevskis, G.; Sekacis, I.; Nitiss, E.; Medvids, A.; Rutkis, M. Dielectric breakdown of fast switching LCD shutters. In Proceedings of the Advances in Display Technologies VII, San Francisco, CA, USA, 1–2 February 2017; Chien, L.-C., Yoon, T.-H., Lee, S.-D., Eds.; p. 1012607. [Google Scholar]
  18. Kozachenko, A.; Komitov, L. Influence of the Surfaces on the Nucleation Process During the Cholesteric-Nematic Transition. Mol. Cryst. Liq. Cryst. 2004, 412, 205–217. [Google Scholar] [CrossRef]
  19. Hegde, G.; Kozachenko, A.; Komitov, L. Generation of hidden bistable images in a cholesteric liquid crystal device. Liq. Cryst. 2021, 48, 2076–2085. [Google Scholar] [CrossRef]
  20. Anderson, J.E.; Watson, P.; Ernst, T.; Bos, P.J. Computer simulation evidence of the transient planar state during the homeotropic to focal conic transition in cholesteric liquid crystals. Phys. Rev. E 2000, 61, 3951–3960. [Google Scholar] [CrossRef] [PubMed] [Green Version]
  21. Osmanis, K.; Valters, G.; Zabels, R.; Gertners, U.; Osmanis, I.; Kalnins, L.; Kandere, U.; Ozols, A. Advanced multiplanar volumetric 3d display. In Proceedings of the Emerging Liquid Crystal Technologies XIII, San Francisco, CA, USA, 29–31 January 2018; Muševič, I., Chien, L.-C., Broer, D.J., Chigrinov, V.G., Eds.; SPIE: Bellingham, WA, USA; p. 36. [Google Scholar]
  22. Hecht, S.; Shlaer, S. Intermittent Stimulation by Light. J. Gen. Physiol. 1936, 19, 965–977. [Google Scholar] [CrossRef] [PubMed] [Green Version]
  23. Blinov, L.M. Structure and Properties of Liquid Crystals; Springer: Dordrecht, The Netherlands, 2011; ISBN 978-90-481-8828-4. [Google Scholar]
  24. Kim, Y.B.; Hur, I.K. High speed response time of nematic liquid crystal mixtures for LCD monitor and TV applications. J. Inf. Disp. 2001, 2, 32–38. [Google Scholar] [CrossRef]
  25. Cheng, D.; Wang, Q.; Liu, Y.; Chen, H.; Ni, D.; Wang, X.; Yao, C.; Hou, Q.; Hou, W.; Luo, G.; et al. Design and manufacture AR head-mounted displays: A review and outlook. Light Adv. Manuf. 2021, 2, 336. [Google Scholar] [CrossRef]
  26. Tani, C. Phase Transition Temperature Dependence of Field-Induced Nematic-Cholesteric Relaxation Time. Jpn. J. Appl. Phys. 1979, 18, 1387–1388. [Google Scholar] [CrossRef]
Figure 1. Cross section of the diffuser cell. Glass substrates are treated with transparent conductive electrode layer (red) and subsequent dielectric/alignment layer (green). Substrates are separated by spherical spacers and the LC cell is sealed by a gasket deposited around the outer perimeter (orange).
Crystals 12 00733 g001
Figure 2. Setup for spectra dynamics characterization.
Crystals 12 00733 g002
Figure 3. Typical waveform used for cell electro-optical response characterization.
Crystals 12 00733 g003
Figure 4. Dynamics of electrical and optical signals for PDLC and PFLC diffusers with a 15µm active LC layer. Measurements with 3-wavelength laser system.
Crystals 12 00733 g004
Figure 5. Dependence of rise and fall time of cholesteric LC (pitch: 412 nm) diffusers on the applied driving voltage, white LED as light source.
Crystals 12 00733 g005
Figure 6. Change in direct optical light transmission of a PFLC light diffuser element in relation to dopant concentration. Utilized light source: white LED.
Crystals 12 00733 g006
Figure 7. Change in direct optical light transmission of the PFLC light diffuser element over time after the onset of external electric field-off condition. Utilized light source: white LED.
Crystals 12 00733 g007
Figure 8. Light transmission in the diffuse (D) state, depending on cell gap and wavelength.
Crystals 12 00733 g008
Figure 9. Diffuse (D) haze measurements for various cell gaps.
Crystals 12 00733 g009
Figure 10. LC layer thickness impact on viewing angle (FWHM).
Crystals 12 00733 g010
Figure 11. Electro-optical response of diffuser, discharged slowly through a resistor added in parallel. Note that changing resistor value from 1 kΩ to 0.970 kΩ decreases scattering state significantly.
Crystals 12 00733 g011
Figure 12. Transient peak intensity change going from fast (left) to slow discharge (right). Note that fall switching time increases.
Crystals 12 00733 g012
Figure 13. Current through the cell.
Crystals 12 00733 g013
Figure 14. Transmission (a) and reflectivity (b) changes over time for 12 μm diffuser cell.
Crystals 12 00733 g014
Figure 15. Electro-optical curve character for various cell gaps. Measurements with 525 nm green laser.
Crystals 12 00733 g015
Figure 16. Electro-optical response of diffuser, depending on electric field. Once above switching threshold, nature of the curve does not change depending on voltage.
Crystals 12 00733 g016
Figure 17. Principal layout of augmented reality headset system.
Crystals 12 00733 g017
Figure 18. Change in absorbance with cell gap size of a diffuser in the scattering state for different wavelengths. The scattering for 532 nm signal is due to the quality of laser source.
Crystals 12 00733 g018
Figure 19. Spectral transmittance in diffuse and transparent diffuser-element states.
Crystals 12 00733 g019
Figure 20. (a) Small-sized volumetric 3D screen and (b) multi-focal headset system housing the small-sized volumetric screen.
Crystals 12 00733 g020
Figure 21. Schematic presentation of the structural transition in cholesterics. Transition from H to P state may involve transient ULH state in the relaxation process.
Crystals 12 00733 g021
Table 1. E-O test at 525 nm results depending on rubbing strength, L(m) and surface condition.
Alignment ConditionsPretilt
Angle
OrientationRubbing Length, mOpen, %Close, %Fall, µsRise, µsFall Speed, %/µs
Crystals 12 00733 i001homeotropic-vertical-83.411.989813220.080
Crystals 12 00733 i002planarlowparallel-87.66.7100115350.081
Crystals 12 00733 i003planarmediumantiparallel188.56.4107518070.076
Crystals 12 00733 i004planarmediumparallel187.86.7102815170.079
Crystals 12 00733 i005planarmediumparallel1687.06.499115780.081
Crystals 12 00733 i006planarmediumparallel2883.76.599615410.077
Crystals 12 00733 i007tiltedHighparallel-92.56.7104615100.082
Publisher’s Note: MDPI stays neutral with regard to jurisdictional claims in published maps and institutional affiliations.

