Article

Microstructural Characterization of the Corrosion Product Deposit in the Flow-Accelerated Region in High-Temperature Water

1
School of Materials, Sun Yat-sen University, No. 132, Outer-Ring East Road, Guangzhou 510006, China
2
Research Center for Corrosion and Erosion Process Control of Equipment and Material in Marine Harsh Environment, Guangzhou Maritime University, Guangzhou 510725, China
3
Frontier Research Initiative, New Industry Creation Hatchery Center, Tohoku University, 6-6-10 Aramaki Aoba, Aoba-ku, Sendai 9808579, Japan
*
Author to whom correspondence should be addressed.
Submission received: 6 May 2022 / Revised: 19 May 2022 / Accepted: 19 May 2022 / Published: 23 May 2022
(This article belongs to the Special Issue Advances in Laminated Metallic Composites)

Abstract

:
The clogging behavior of the micro-orifice under a flow accelerated condition was investigated after 500 h of immersion in high-temperature water. The results indicated the residual area of the micro-orifice was reduced to one-third of its original size after 500 h of immersion due to the deposition of corrosion products. In this process, the clogging behavior of micro-orifice can be divided into three stages: the stable deposition stage, the quick recovery stage, and the dynamic equilibrium stage. The corrosion products were porous and consisted of many deposited particles. The process of particle deposition and removal was carried out simultaneously.

1. Introduction

During the operation of pressurized water reactors (PWRs), corrosion products would gradually deposit on the surfaces of components exposed to the coolant. Steam generator (SG) tubes, which occupy 65% of the surfaces, are the main place for corrosion product deposition [1,2,3]. The deposition of corrosion product in SG tubes has several adverse effects on the safety and operation efficiency of the plant, such as impeding coolant flow and subsequent heat from being transferred to the secondary circuit [4], causing constant friction between the tube support plate (TSP) and the SG tubing [5,6], and leading to local environmental deterioration, etc. [7].
One type of deposition is called ‘clogging’, which is a severe deposit build-up in the TSP quatrefoil-shaped holes between TSP and SG tube, where the flow rate is accelerated. Some investigations in plants showed that the holes of the uppermost TSP were partially or completely clogged by deposits formed by corrosion products [8]. The TSP clogging leads to a fluid-induced vibration. Besides these hazards, this phenomenon also can decrease the secondary side effective flow of water available for cooling, which can induce local overheats, causing dramatic consequences for SG tubes [9]. Details about the phenomenon have been reviewed by Yang et al. [1].
Most of the downtime maintenance cycle of nuclear power plants is based on experience instead of a regular reminder for service in the nuclear industry [10]. Clogging behavior is usually found to occur on the front face of the restriction as well as within the tubing and/or orifice plate in the secondary loop. The linear velocity of the water can reach from a few meters per second to tens of meters per second in the flow accelerated region [11,12,13]. In actual nuclear power plant conditions, when water flows through the clover-shape pore between the SG tube and TSP, the linear velocity suddenly increases from 8.8 m/s to 23.6 m/s [14]. The sudden increase of linear velocity was usually attributed to the clogging phenomenon.
To investigate such flow-accelerated conditions under the PWR environment in the laboratory, a special flow cell device needs to be designed and incorporated into a recirculated autoclave. McGrady et al. [15] used a set-up involving micro-orifice fluidics experiments to investigate clogging formation in primary circuit regions of PWR where the water flow accelerated. Post-test analysis of the deposit showed that both crystalline and particulate species were found, suggesting more than one mechanism of clogging was present. In another study [16], the research team investigated the effects of the local environment including flow velocity, material, and Fe concentration on clogging. It has been proved that higher Fe concentrations in solution facilitated clogging within the orifice whereas an increased flow velocity reduced clogging. Cassineri et al. [12] studied the deposition of corrosion products on 304 stainless steel (SS) with a micro-orifice under different flow velocities, dissolved hydrogen levels, and other water chemistry parameters. The results indicated that the clogging at the micro-orifice was more obvious with the increase of dissolved hydrogen due to the dissolution of 304 SS.
Up to now, studies on clogging are still limited and mainly focus on several research groups. Furthermore, the experimental parameters in previous studies deviate from actual working conditions to some extent due to safety concerns [15]. For instance, the temperature used by former researchers (230 °C) was slightly lower than the actual operating temperature (290 °C) of the secondary circuit, which is one of the important factors for ion dissolution and deposition [17,18]. The amount of ion concentration in the circuit directly affects clogging formation because the temperature affects the solubility of iron ions in the circuit, as well as the dissolution rate of the SG tube and TSP tube [19]. In addition, the test durations in previous research were relatively short (tens of hours). So, the clogging behavior obtained by current study may have some gaps to reflect the actual clogging happened in steam generators. In other words, previous studies only provide relatively limited microscopic analysis of deposited layers, which hinders the understanding of the formation mechanism of deposit.
So, simulating the actual working condition and characterizing the deposition comprehensively are beneficial to further investigation of the clogging phenomenon and clarification of relevant deposition mechanisms. In the current study, the micro-orifice fluid system was used to simulate the clogging behavior between the SG tube and the TSP under the water chemistry environment similar to the secondary loop with prolonged test duration. For this, 304 SS was used and the pH of the water was adjusted between 9.6 to 9.8. Various microscopic characterization techniques were used to reveal the deposition structure in detail.

2. Materials and Methods

2.1. Autoclave System

Figure 1a shows the schematic of the experimental system used in this work, which includes a low-pressure section and a high-pressure section. The low-pressure section is composed of a dissolved oxygen (DO) probe, a pH probe, and a conductivity probe (not marked in Figure 1a), which are used to monitor water chemistry in the water loop and feedback to the controller. There are two parallel circuits in the high-pressure section. The primary circuit includes a high-pressure pump (3), a heat exchanger (9), a preheater (10), a flow cell (14) in the autoclave (13), a condenser (6), and a back pressure regulator (7). In addition, pressure transducers are installed at the inlet and outlet of the autoclave to accurately record the pressure. The auxiliary circuit includes a high-pressure pump (3) and a second back pressure regulator (4). And digital rotameters are installed at the back of each back-pressure regulator to record the flow velocity of each circuit with a 2 min sampling interval.
To generate an accelerated flow condition, a special flow cell was designed. As shown in Figure 1b, the flow cell consisted of the upper part (I) and the lower part (II). The upper part was connected to the outlet of the autoclave lid. A 304 stainless steel (SS) disc with a central micro-orifice was placed between flow cell I and flow cell II. The chemical composition of 304 SS was shown in Table 1, and the geometry of the specimen was shown in Figure 1c. The diameter of the specimen was 12 mm with a thickness of 0.5 mm. The diameter of the central micro-orifice was 300 μm. Both sides were mirror-polished and then ultrasonically cleaned. In this experiment, the constant pressure drop model was used to simulate the clogging behavior of the micro-orifice. In this mode, to guarantee the pressure drop between the inlet and outlet of the autoclave can reach a preset value, it is necessary to adjust the two back-pressure regulators at the same time. The auxiliary circuit was mainly used to share the excess flow flux for the pressure drop at the inlet and outlet of the autoclave. A detailed description of experimental methods is given in reference [17].
The pH value at room temperature was set at 9.6~9.8 whilst the dissolved oxygen was <5 ppb, and the test was conducted at 290 °C for 500 h.

2.2. Deposition Characterization

After the experiment, the water was extracted from a valve of the low-pressure section to analyze the concentration of Fe, Cr, and Ni ions by using inductively coupled plasma atomic emission spectroscopy (ICP-MS). The surface morphology of the micro-orifice specimen before and after the test was observed by optical microscope (OM) (LEICA DM2700 M), and Image J software was used to measure the area of the micro-orifice. Raman spectroscope (RENISHAW0120-24) and energy dispersive spectroscope (EDS) were used to investigate the deposit type and composition. Super-deep 3D microscope (LY-WN-HPCCD20) and scanning electron microscope (SEM, M6480LV) were used to observe the surface morphology of the deposition around the micro-orifice, and FIB-SEM (SMI3050MS2) was used to observe the cross-section morphology. Finally, the cross-sectional morphology and lattice structure of the deposition near the micro-orifice were conducted by transmission electron microscope (TEM, JEM 3200fs), and fast Fourier transform (FFT) was used to analyze the diffraction pattern of the tiny area by GM3 software. After the experiment, the clogging morphology was observed, and the linear velocity was also calculated. Details about the calculation can be found in the Appendix A.

3. Results

3.1. Water Analysis

Concentrations of Fe, Cr, and Ni ions of water extracted from the water loop after the experiment are shown in Table 2, which are 18 ppb, 12 ppb, and 5 ppb respectively. It is worth noting that the concentration of one element in different forms (ion or particle) can not be differentiated by using ICP-MS.

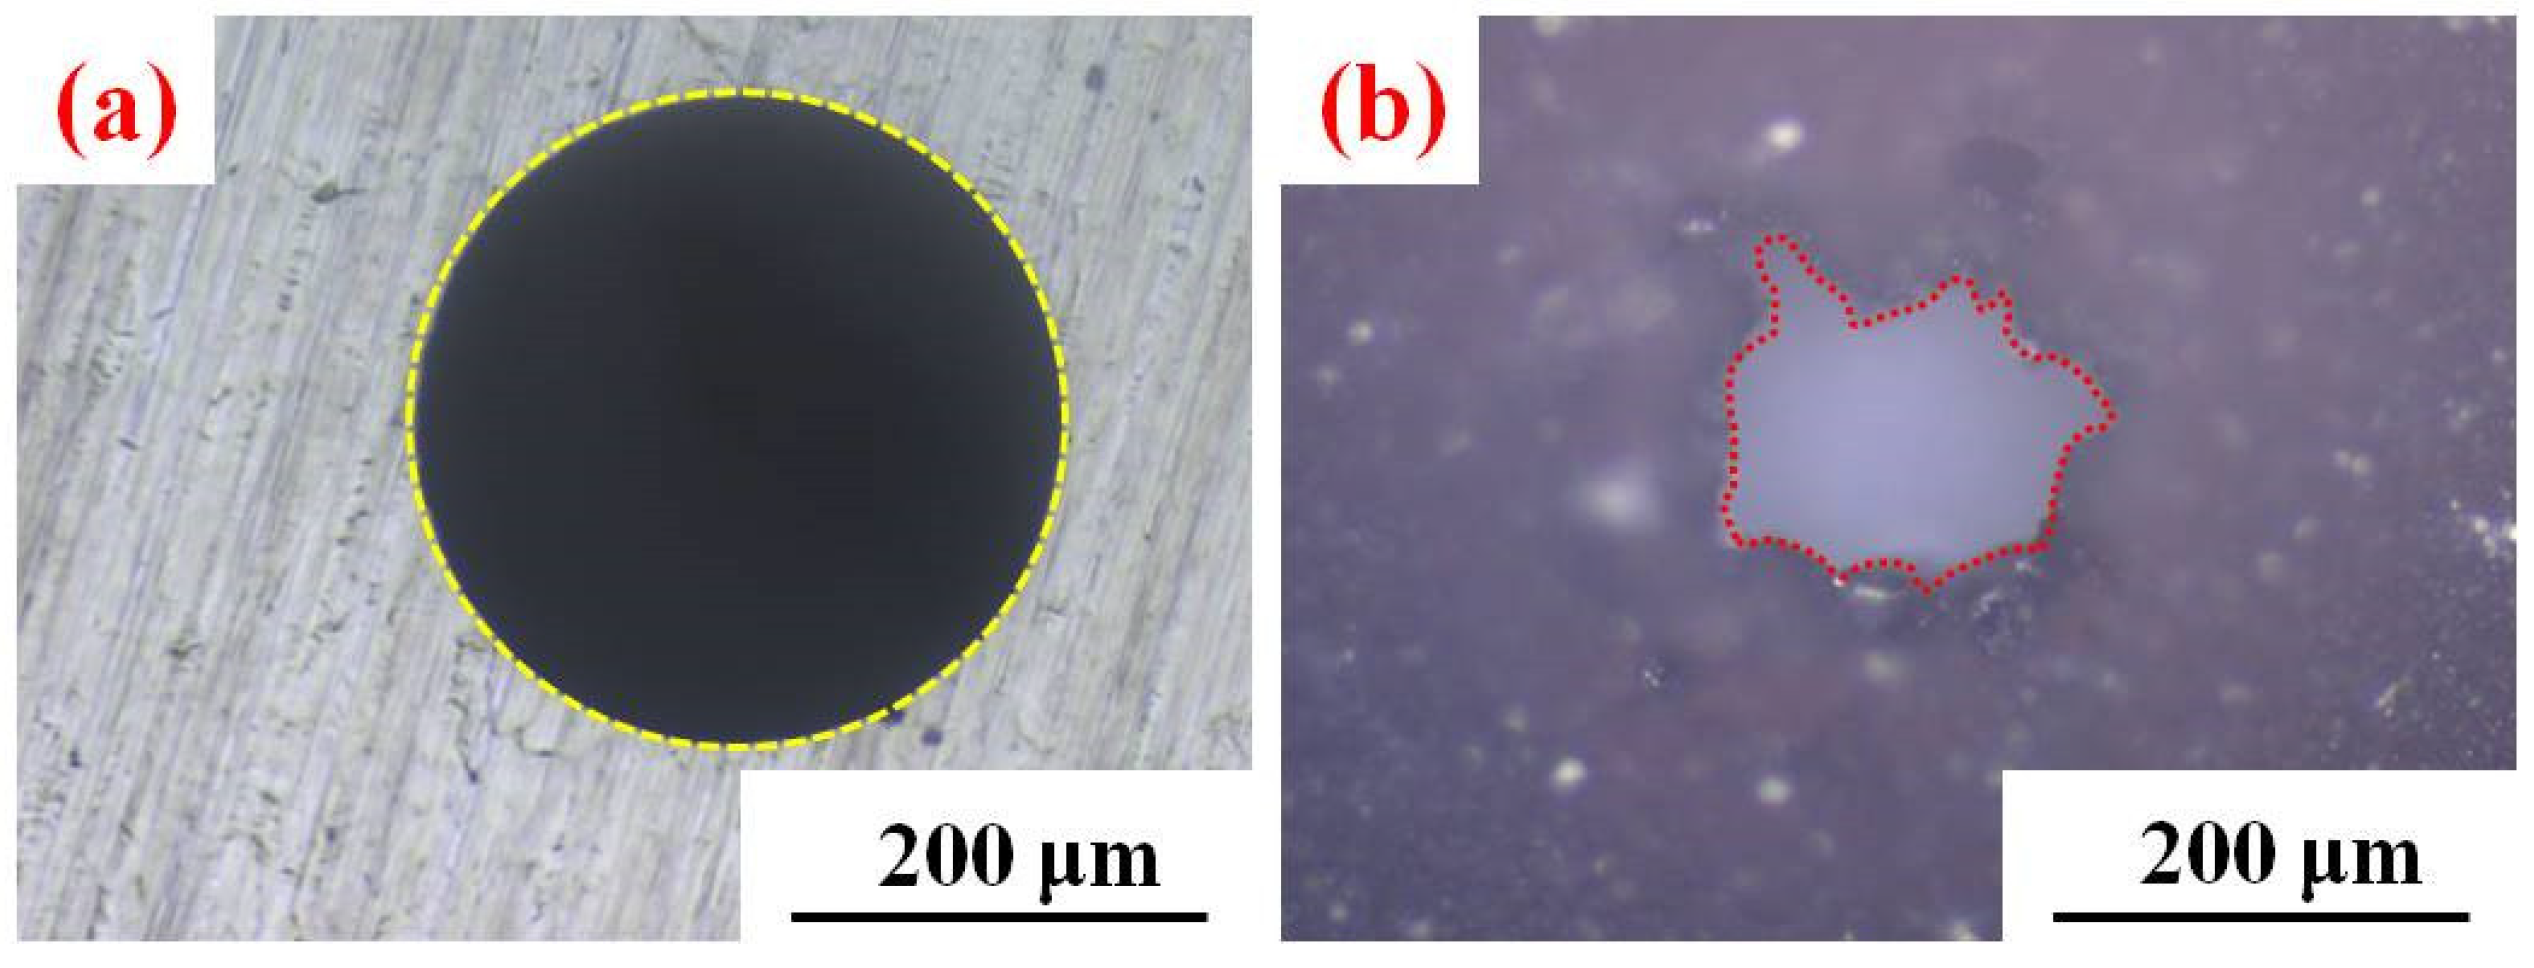
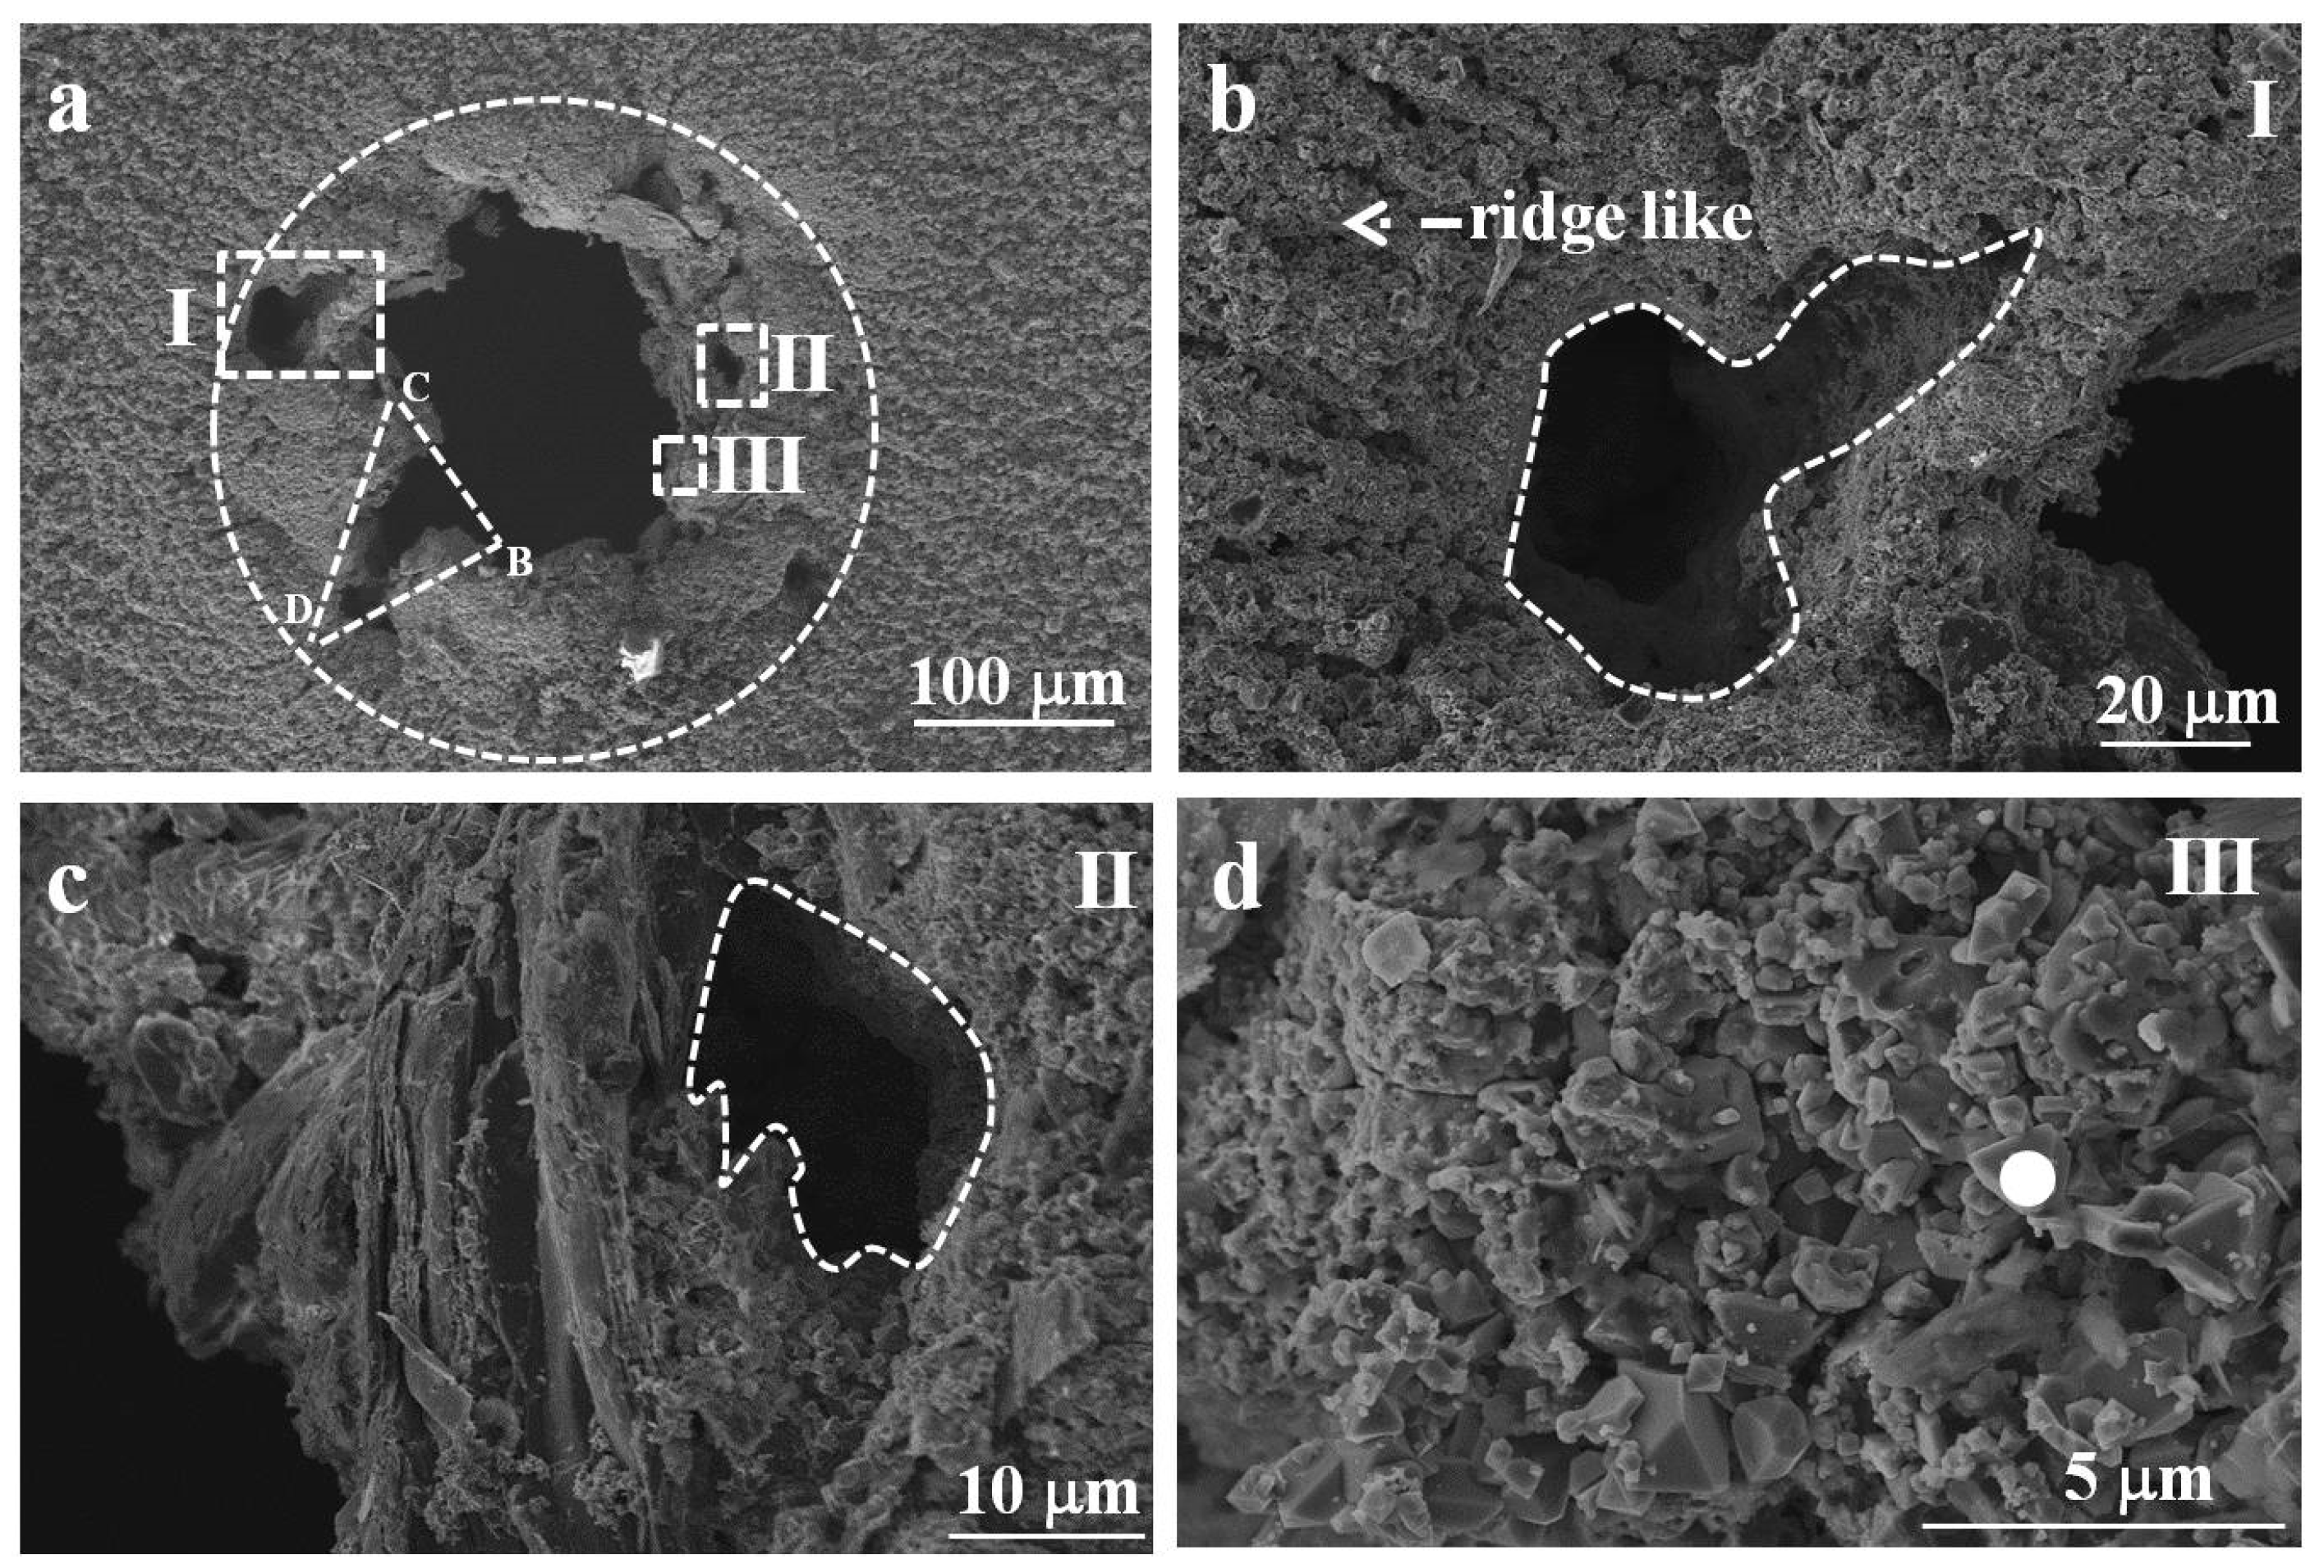
3.2. Deposit Surface Characterization

Figure 2 shows the morphology change before and after the test near the micro-orifice observed by OM. The boundaries of the central micro-orifice are marked by dotted lines before and after the test. A significant reduction of the micro-orifice area can be observed, which decreased from 70,650 μm2 to 21,197 μm2 as calculated by Image J. After the test, the shape of the micro-orifice was an irregular polygon.
As shown in Figure 3a, the solid red line is the contour line of the deposit around the micro-orifice. The initial position of the micro-orifice can be roughly determined by the contour line and the baseline in Figure 3b, and the clogging parameters defined in the Appendix part can be obtained. The length of BR (the definition can be found in the Appendix A) is about 56 μm, and the width of BS (the definition can be found in the Appendix A) is about 200 μm.
The SEM image of the post-tested micro-orifice is shown in Figure 4. As shown in Figure 4a, the circle indicates the periphery of the micro-orifice before the experiment, and the deposits outside the circle are loose and porous with different shapes. The morphologies of rectangles inside the circle are given in Figure 4b–d, respectively. Particulate (Figure 4c) and ridge-like (Figure 4b) deposits can be observed. What is more, there are several holes with the size of tens of microns in the clogging area as shown in Figure 4b,c. The composition of the deposit was analyzed by EDS in the area of the dot in Figure 4d. As can be seen from the EDS results in Table 3, these oxide particles are all Fe oxides.
Figure 5 shows the Raman spectra results of different regions near the central micro-orifice. Figure 5a gives the Raman spectrum of position outside the Bs range, while Figure 5b is within the Bs range. Fe3O4 and Fe2O3 peaks are detected at both locations, but Fe2O3 peaks within the range of Bs are very weak, while Fe2O3 peaks outside the range of Bs are very strong. This indicates that the deposits in the range of Bs are mainly Fe3O4, with a very small amount of Fe2O3. The deposits outside the range of Bs are mainly Fe3O4 and Fe2O3. It should be noted that the Raman spectrum was detected at several positions in all ranges and the same phenomenon was observed as well.

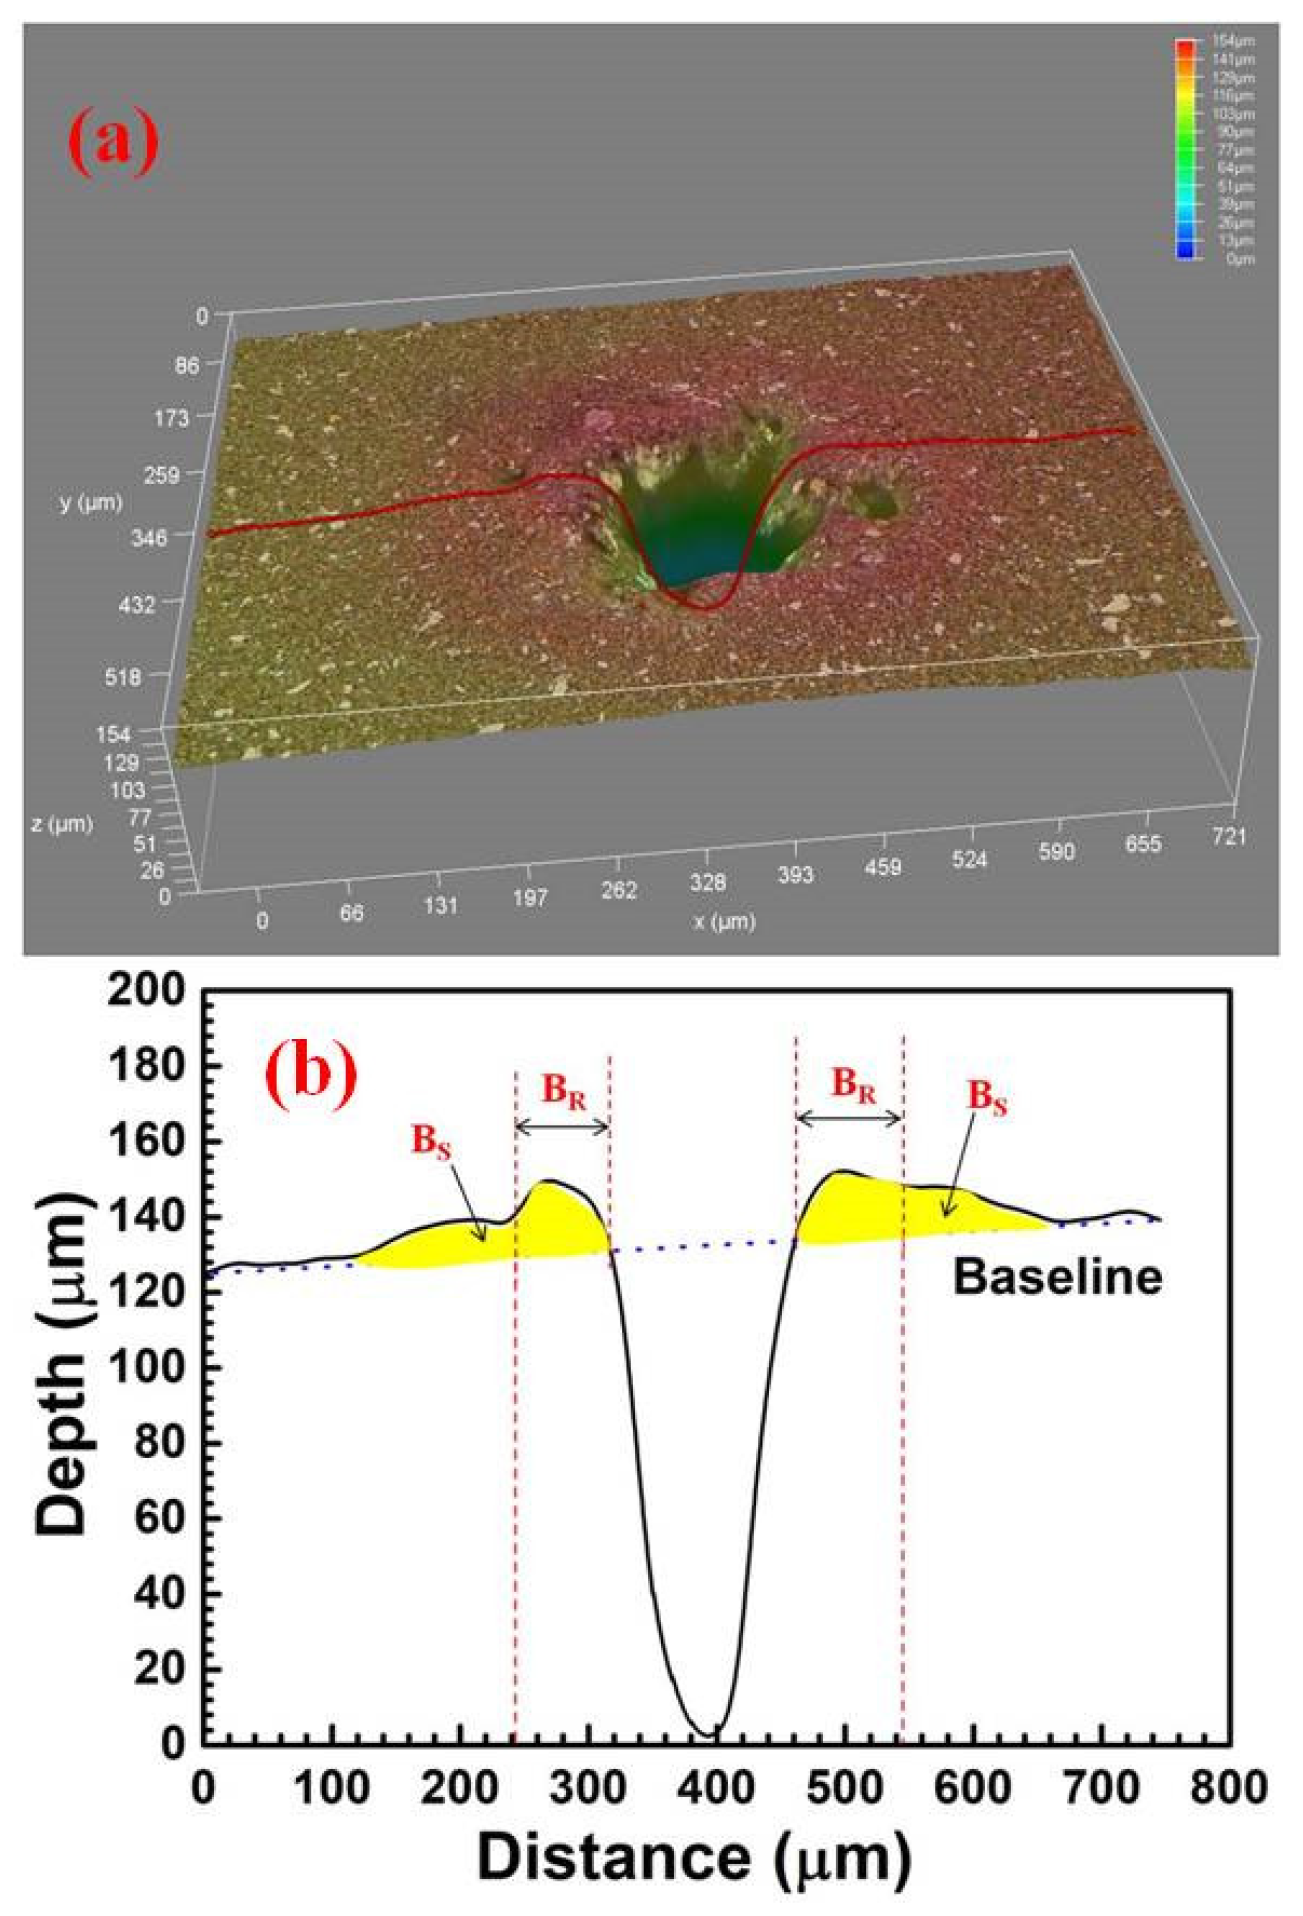
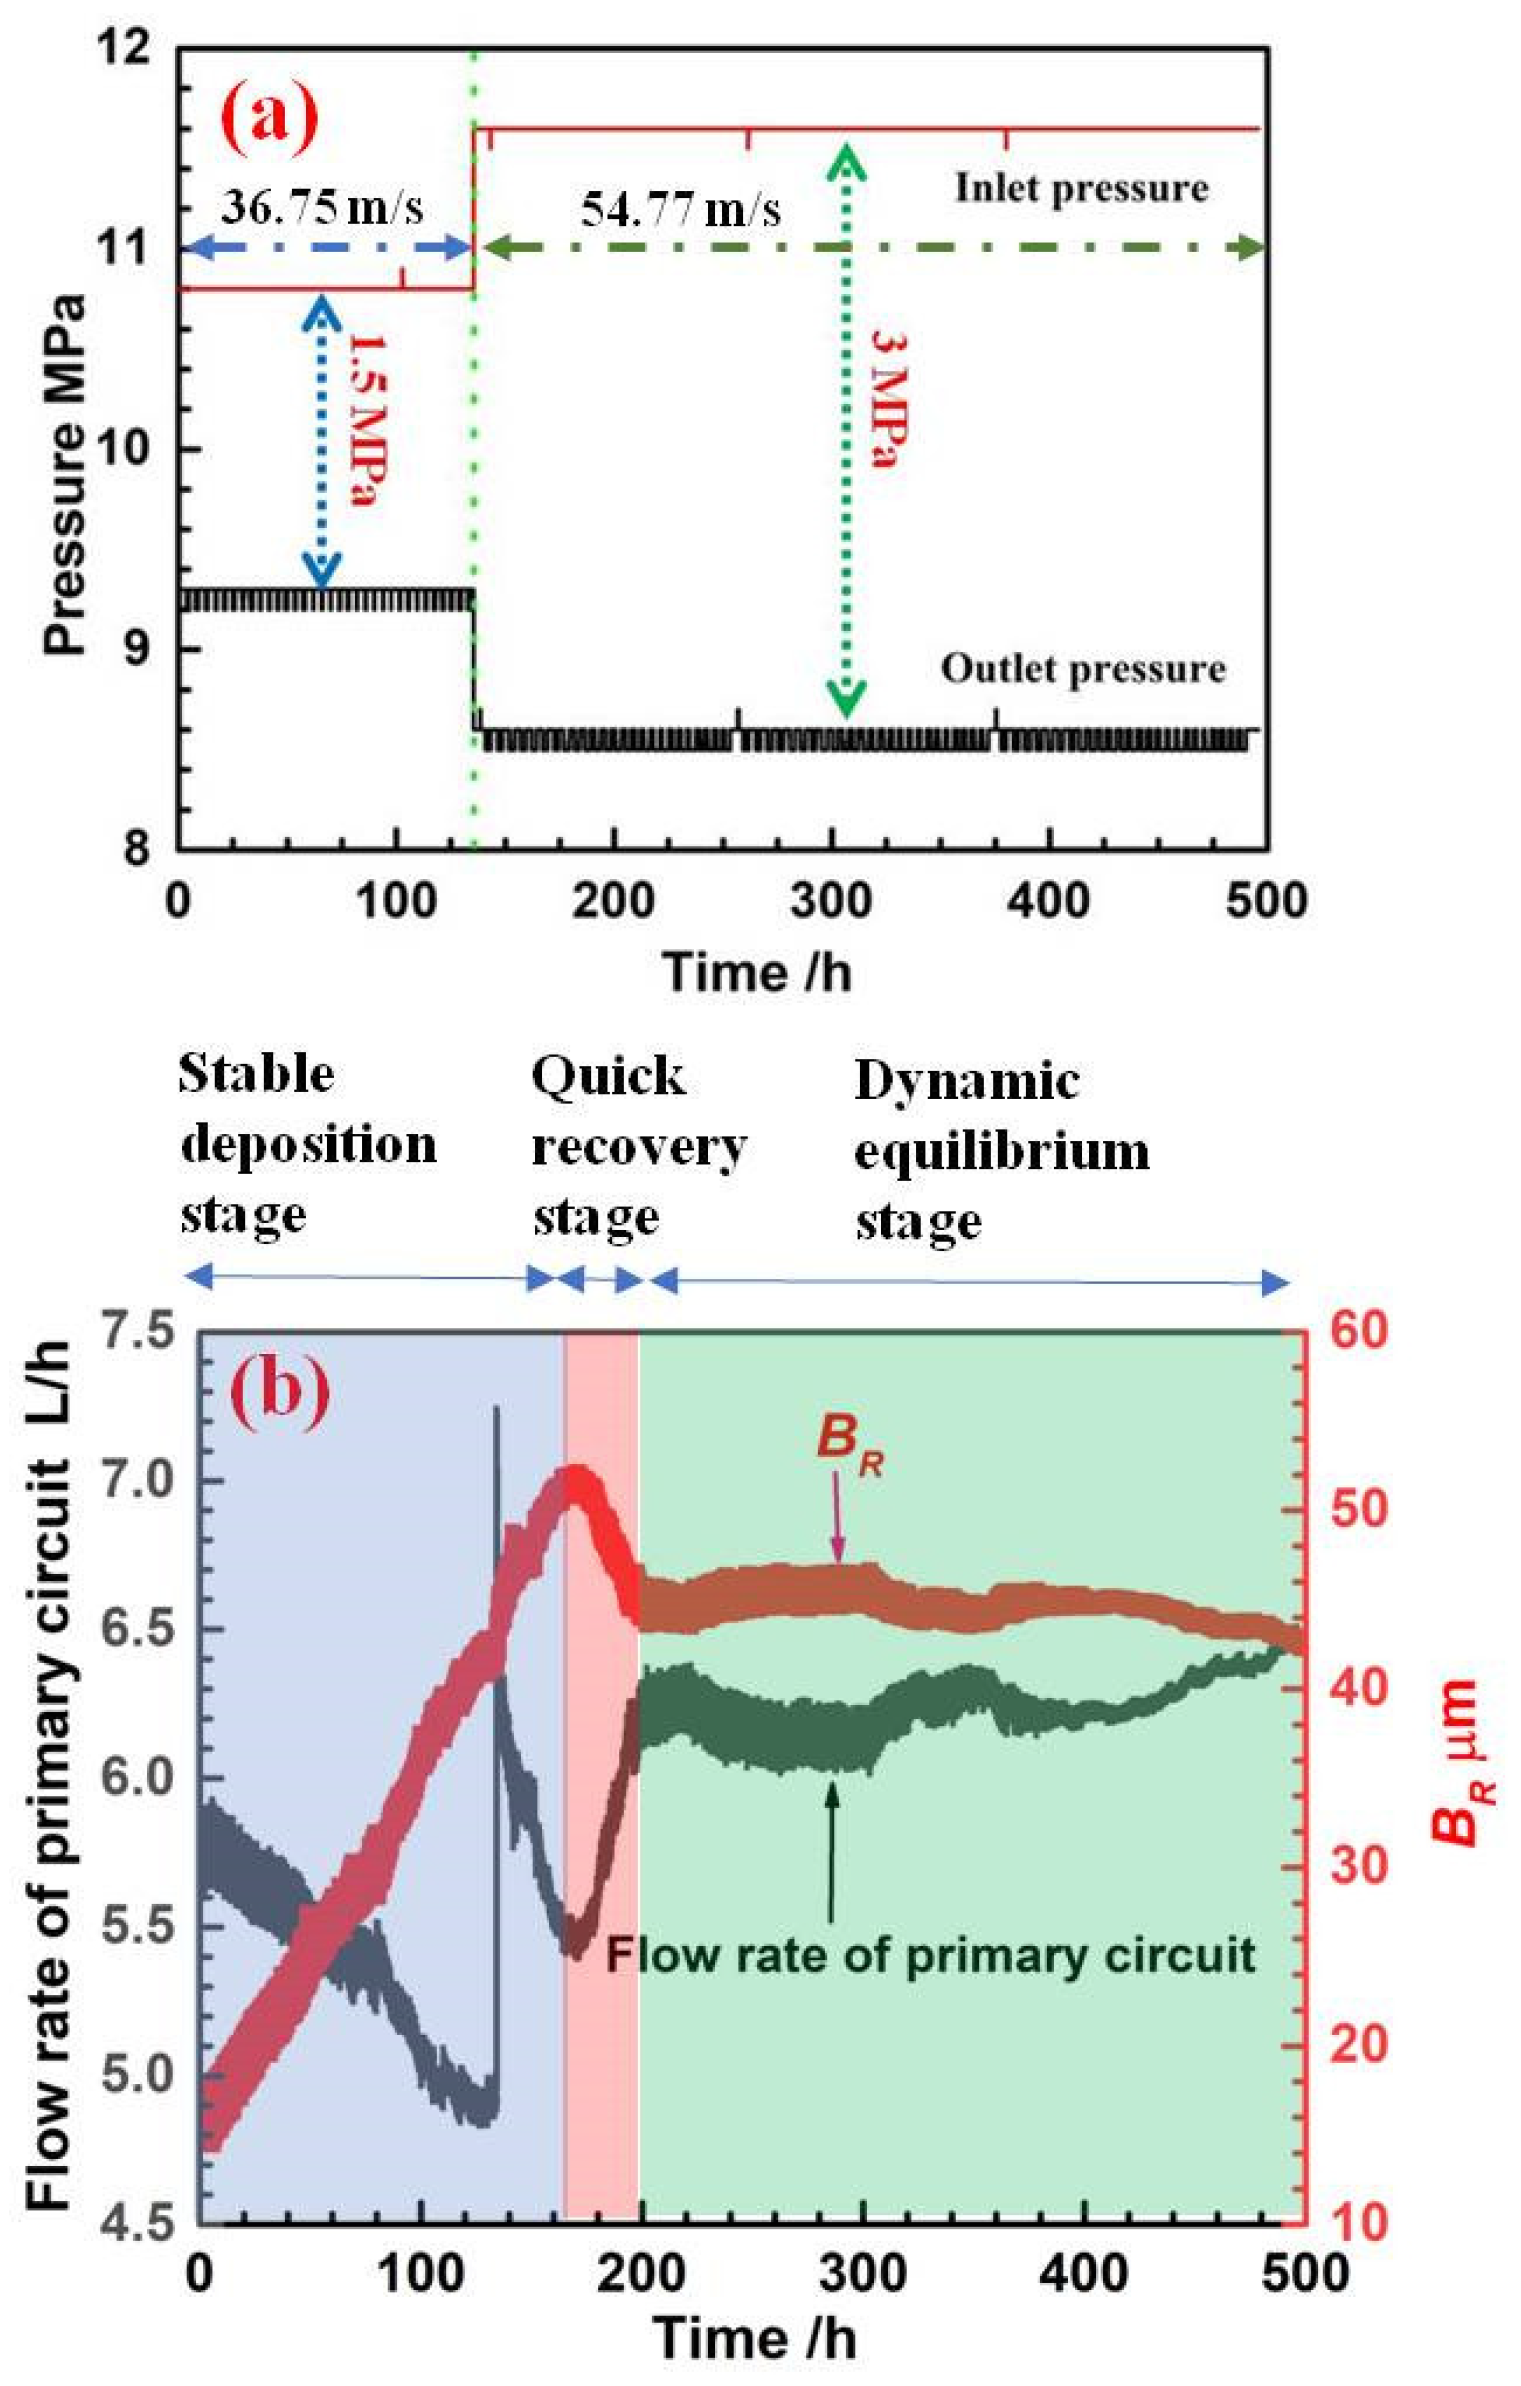
3.3. Deposition Dynamics

Figure 6a shows the inlet and outlet pressure with time in the main loop and bypass, respectively. As shown in Figure 6a, the whole experiment process is divided into two parts, namely, the pressure drop between the inlet and outlet of the first 140 h was 1.5 MPa, and after that, the pressure drop was adjusted to 3 MPa online. According to Equation (A4) in the Appendix A, the linear velocity through the micro-orifice was 36.75 m/s in the first 140 h, and 54.77 m/s in the last 360 h. The relationship between the residual area of the micro-orifice and the flow rate of the primary circuit with time can be obtained from Equation (A3), as shown in Figure 6b. The three stages can be distinguished based on the evolution of volumetric flow rate and BR. When the experiment began to run, the flow rate of the main loop gradually decreased to a steady state, and the BR gradually increased as shown in Equation (A3). After 140 h, the pressure drop increased, and the flow rate increased correspondingly. Then, the flow rate decreased evenly during the next 30 h. In the first 170 h, two pressure drops were applied (1.5 MPa and 3 MPa), and the BR increased continuously. So, this stage is called the stable deposition stage, as marked in Figure 6b.
As time went on, there was a rapid increase of flow rate, and the BR decreased correspondingly. However, the pressure drop and linear velocity did not change. This stage is called the quick recovery stage. After about 20 h of recovery, the experiment entered the dynamic equilibrium stage in which the BR stopped decreasing and was almost stable for the next 300 h.

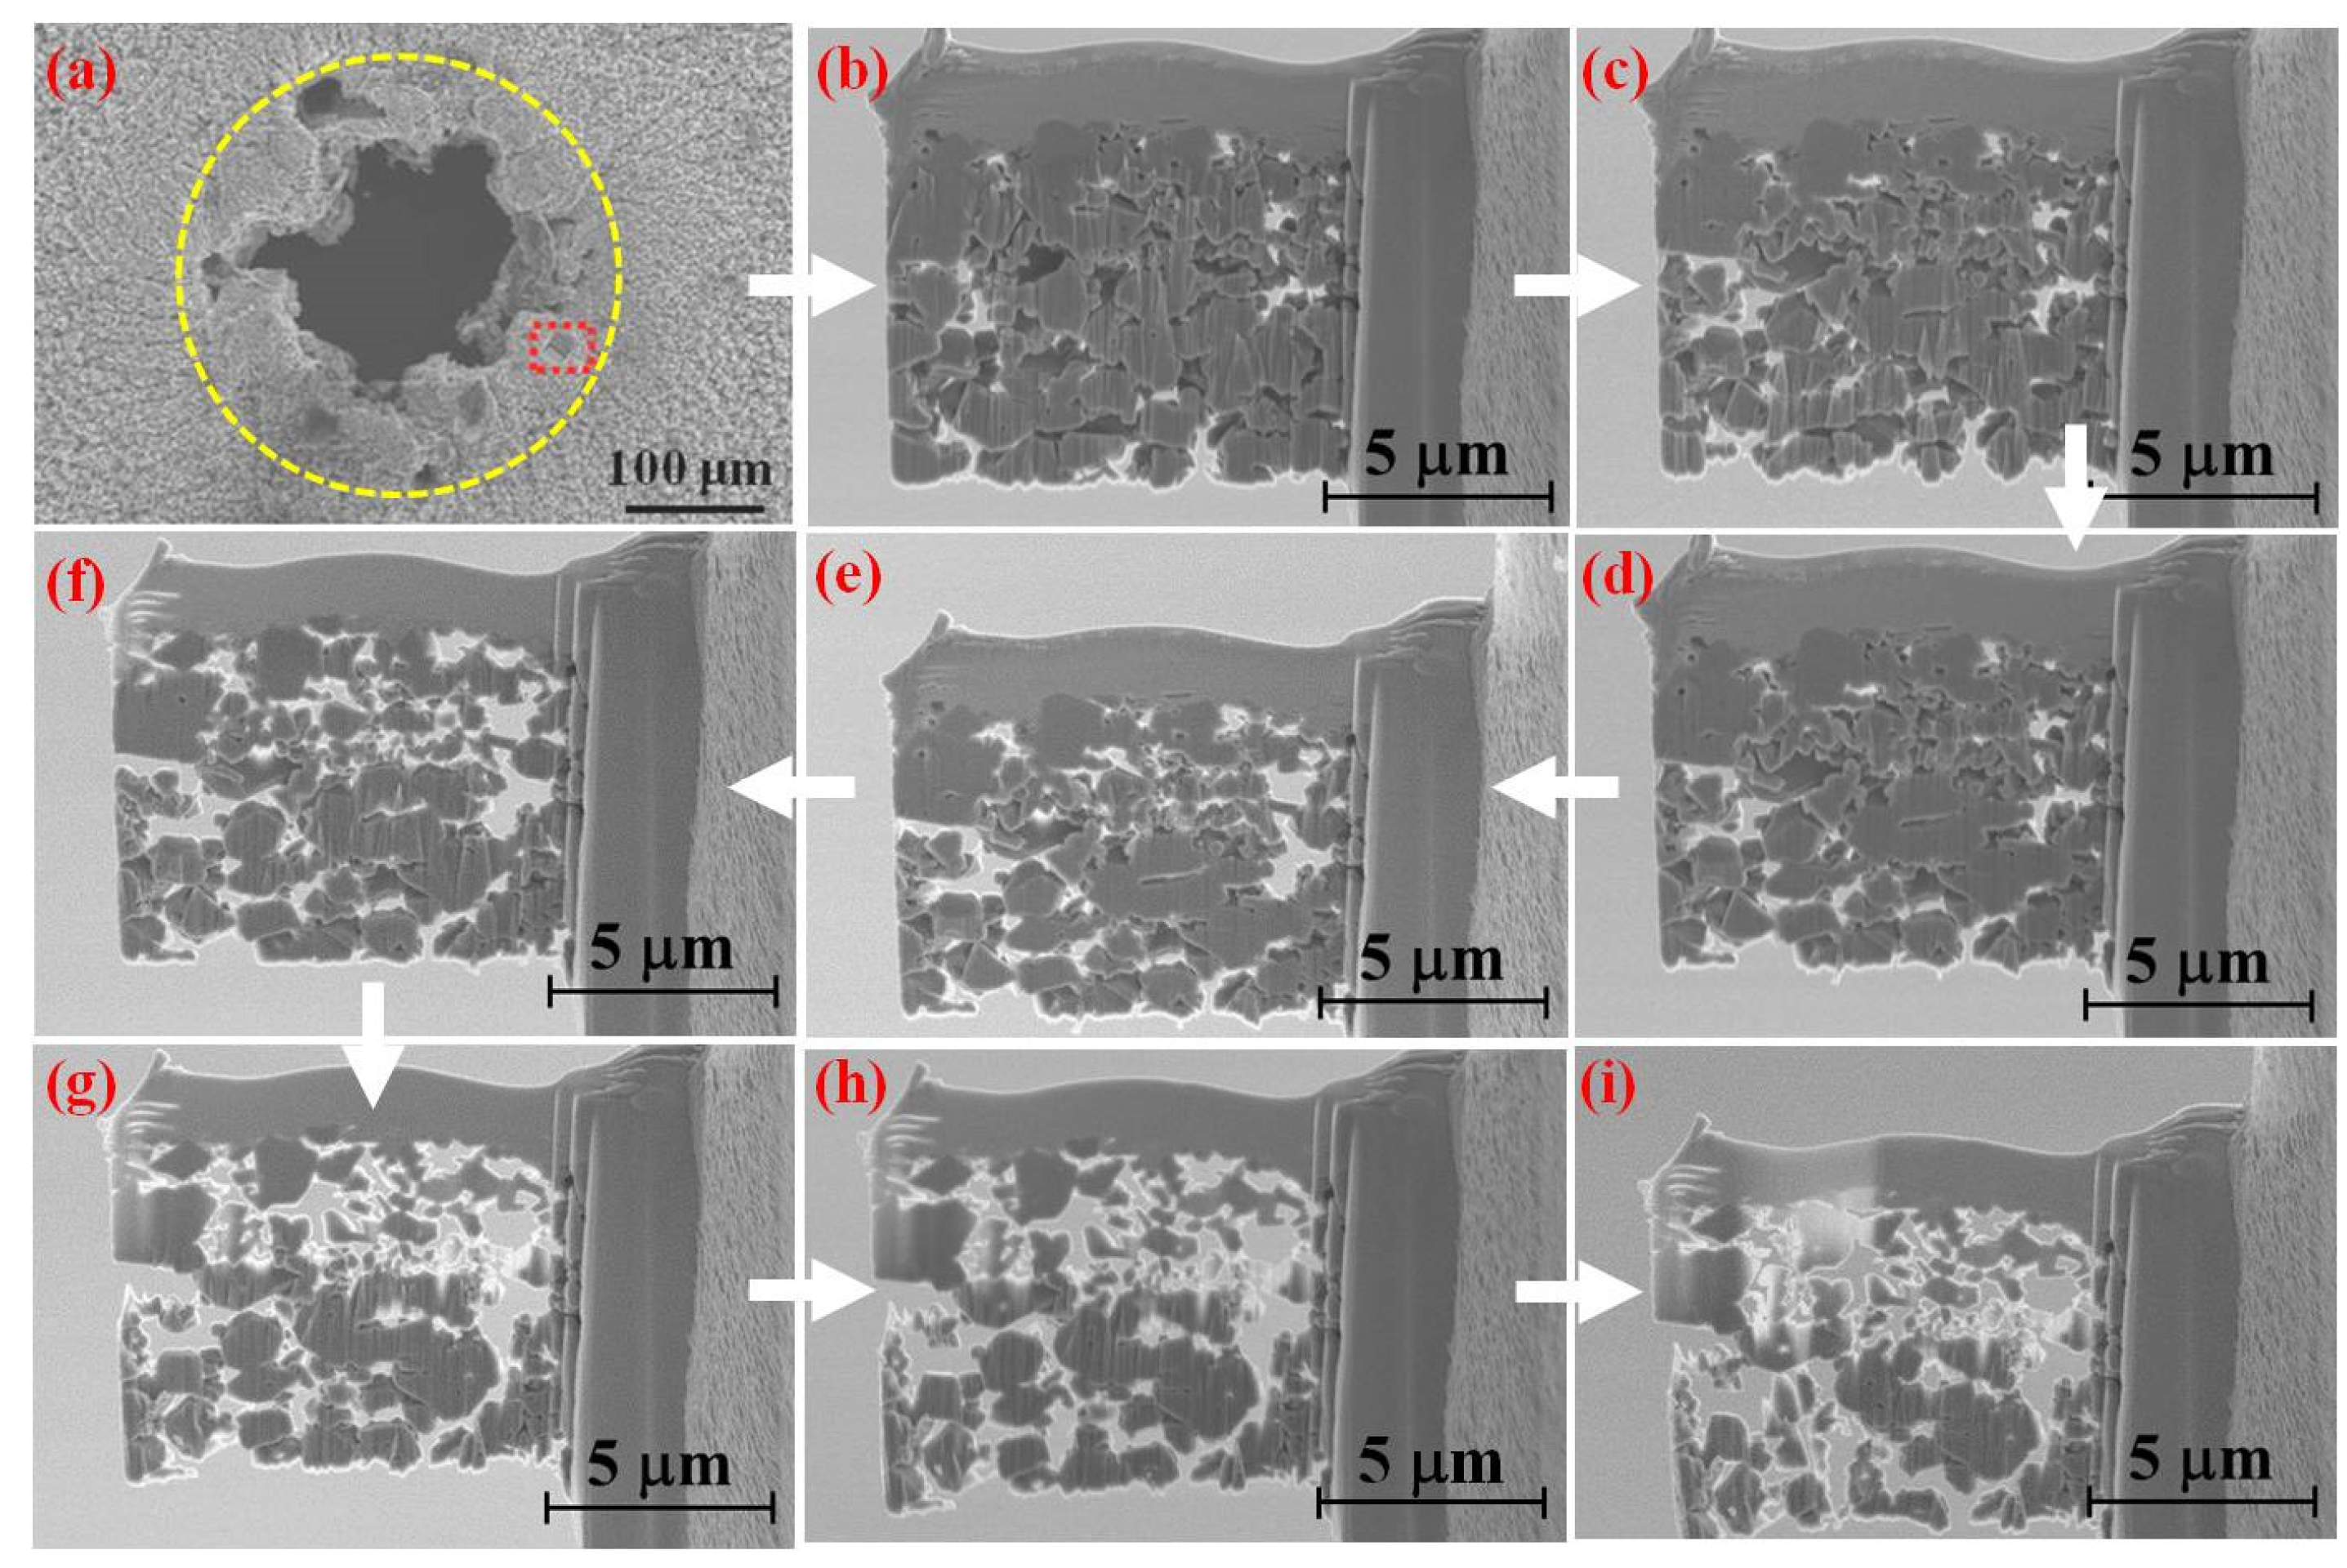
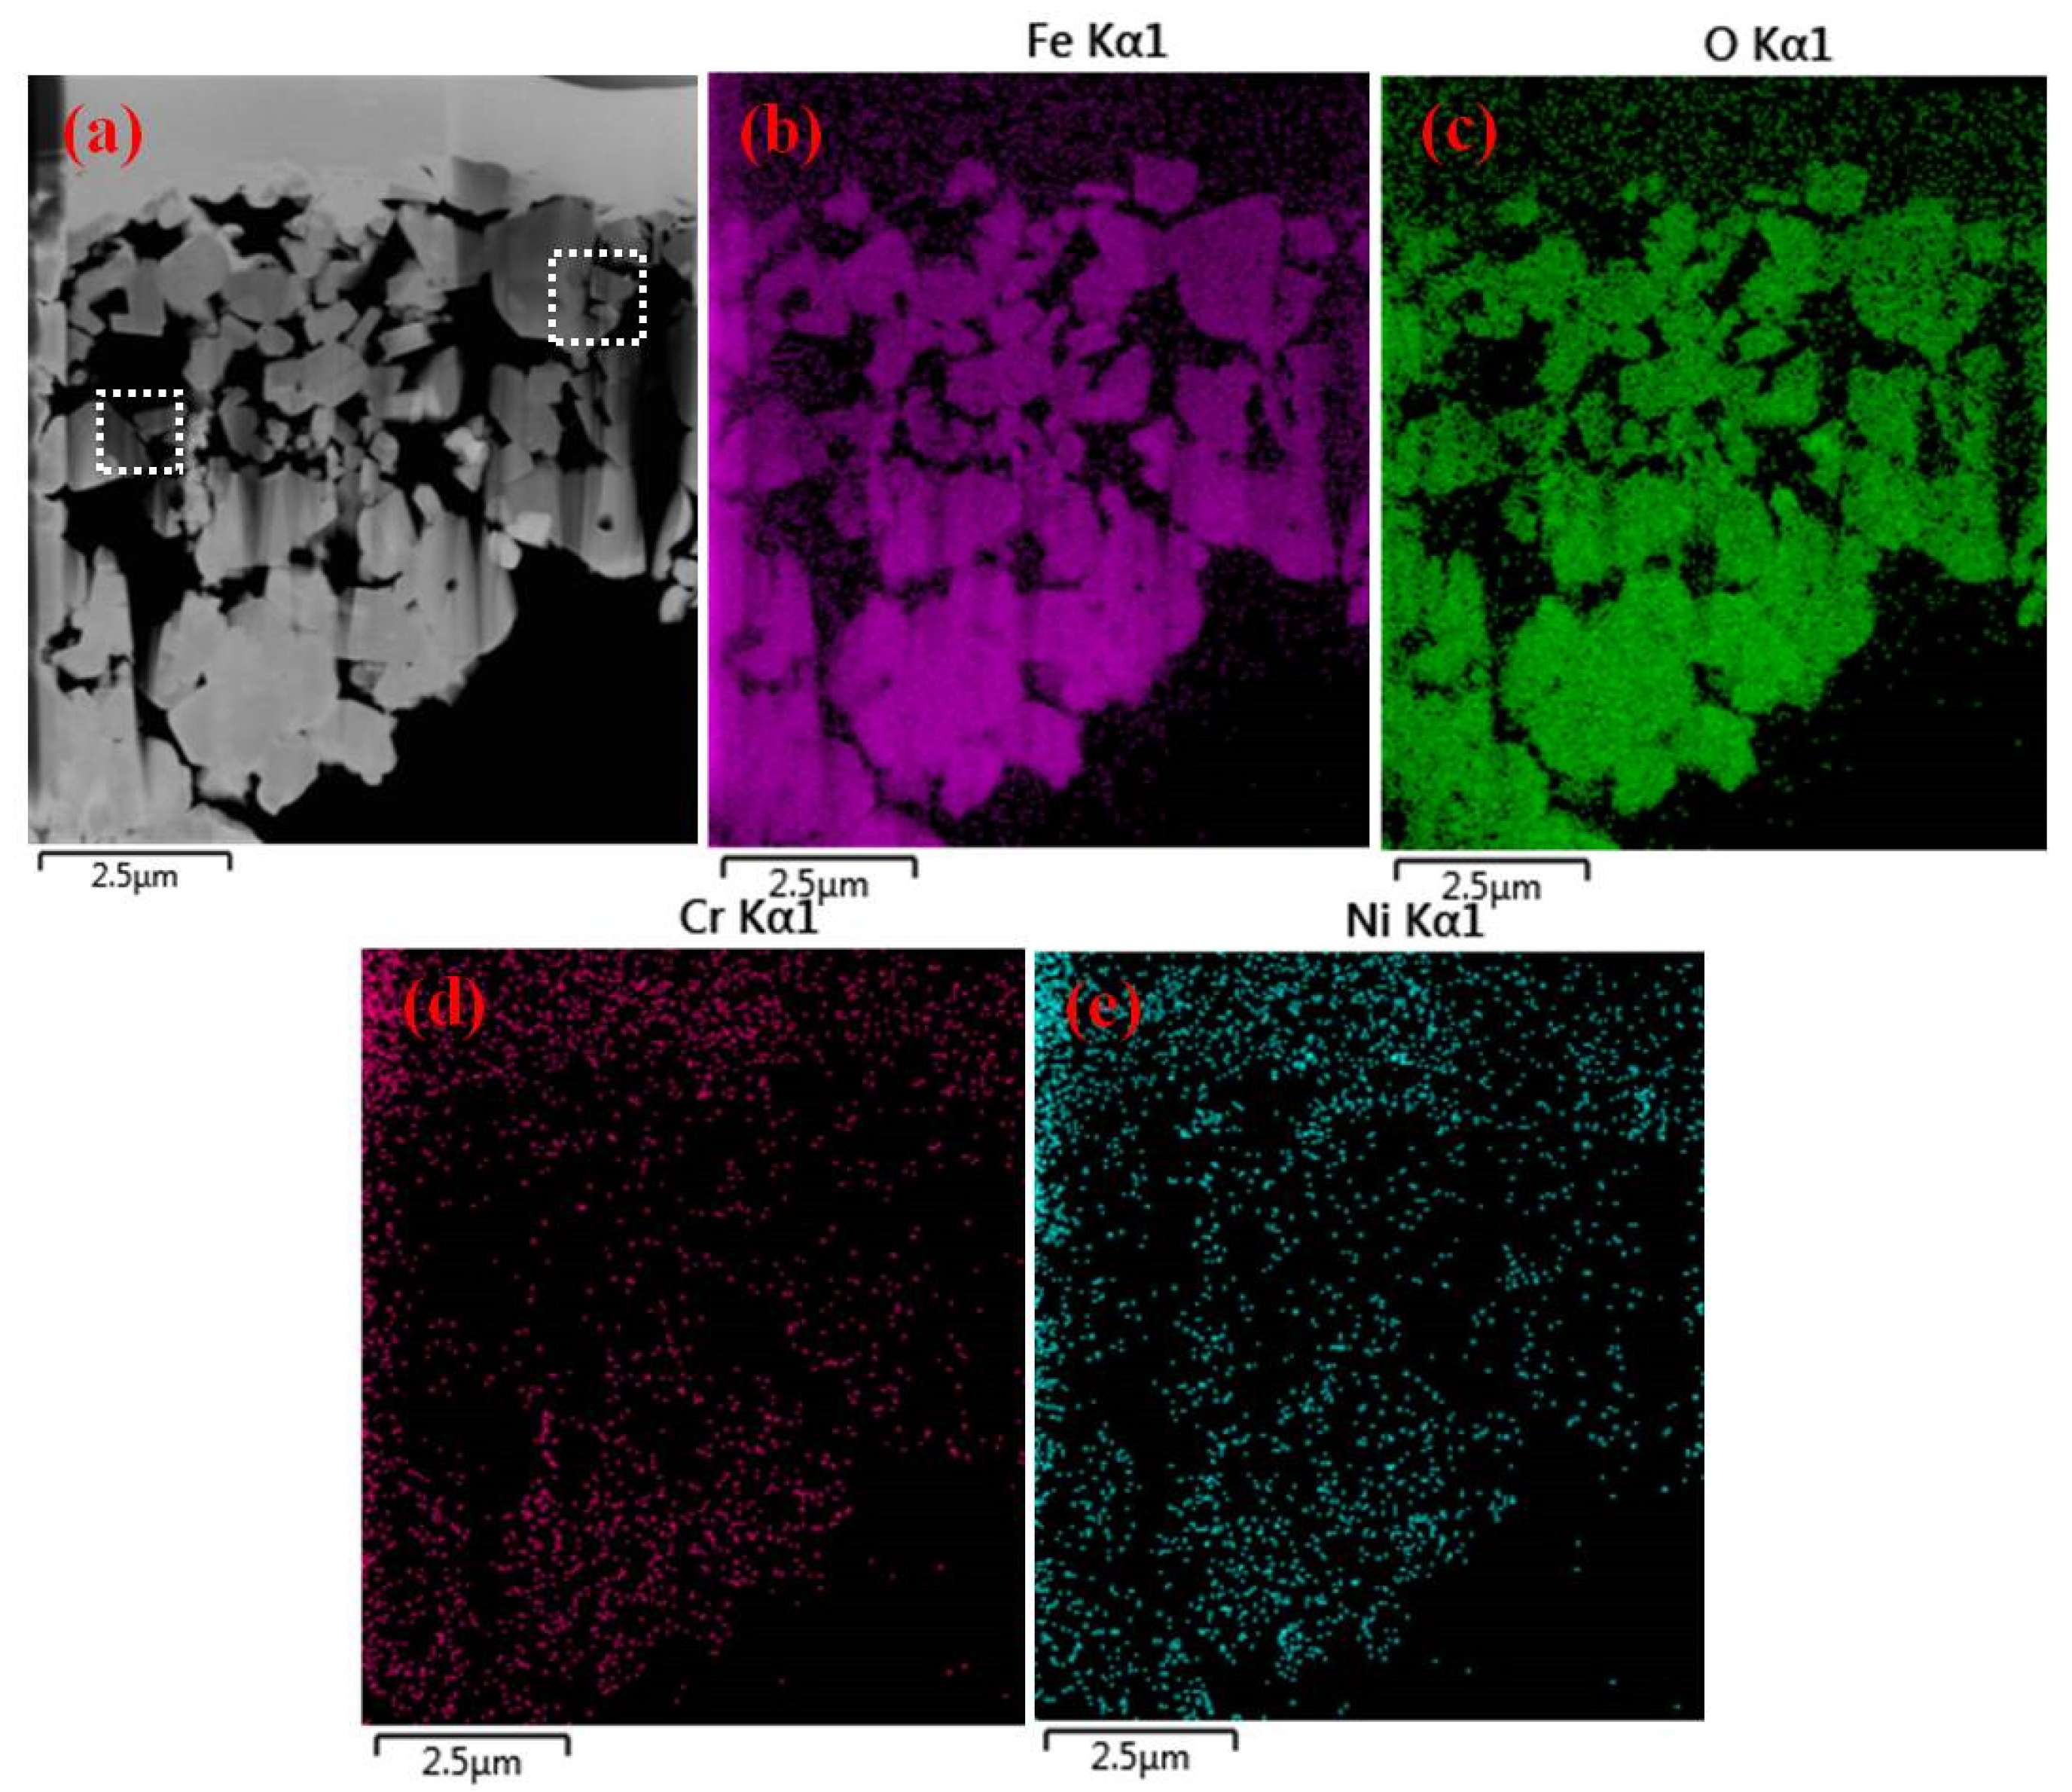
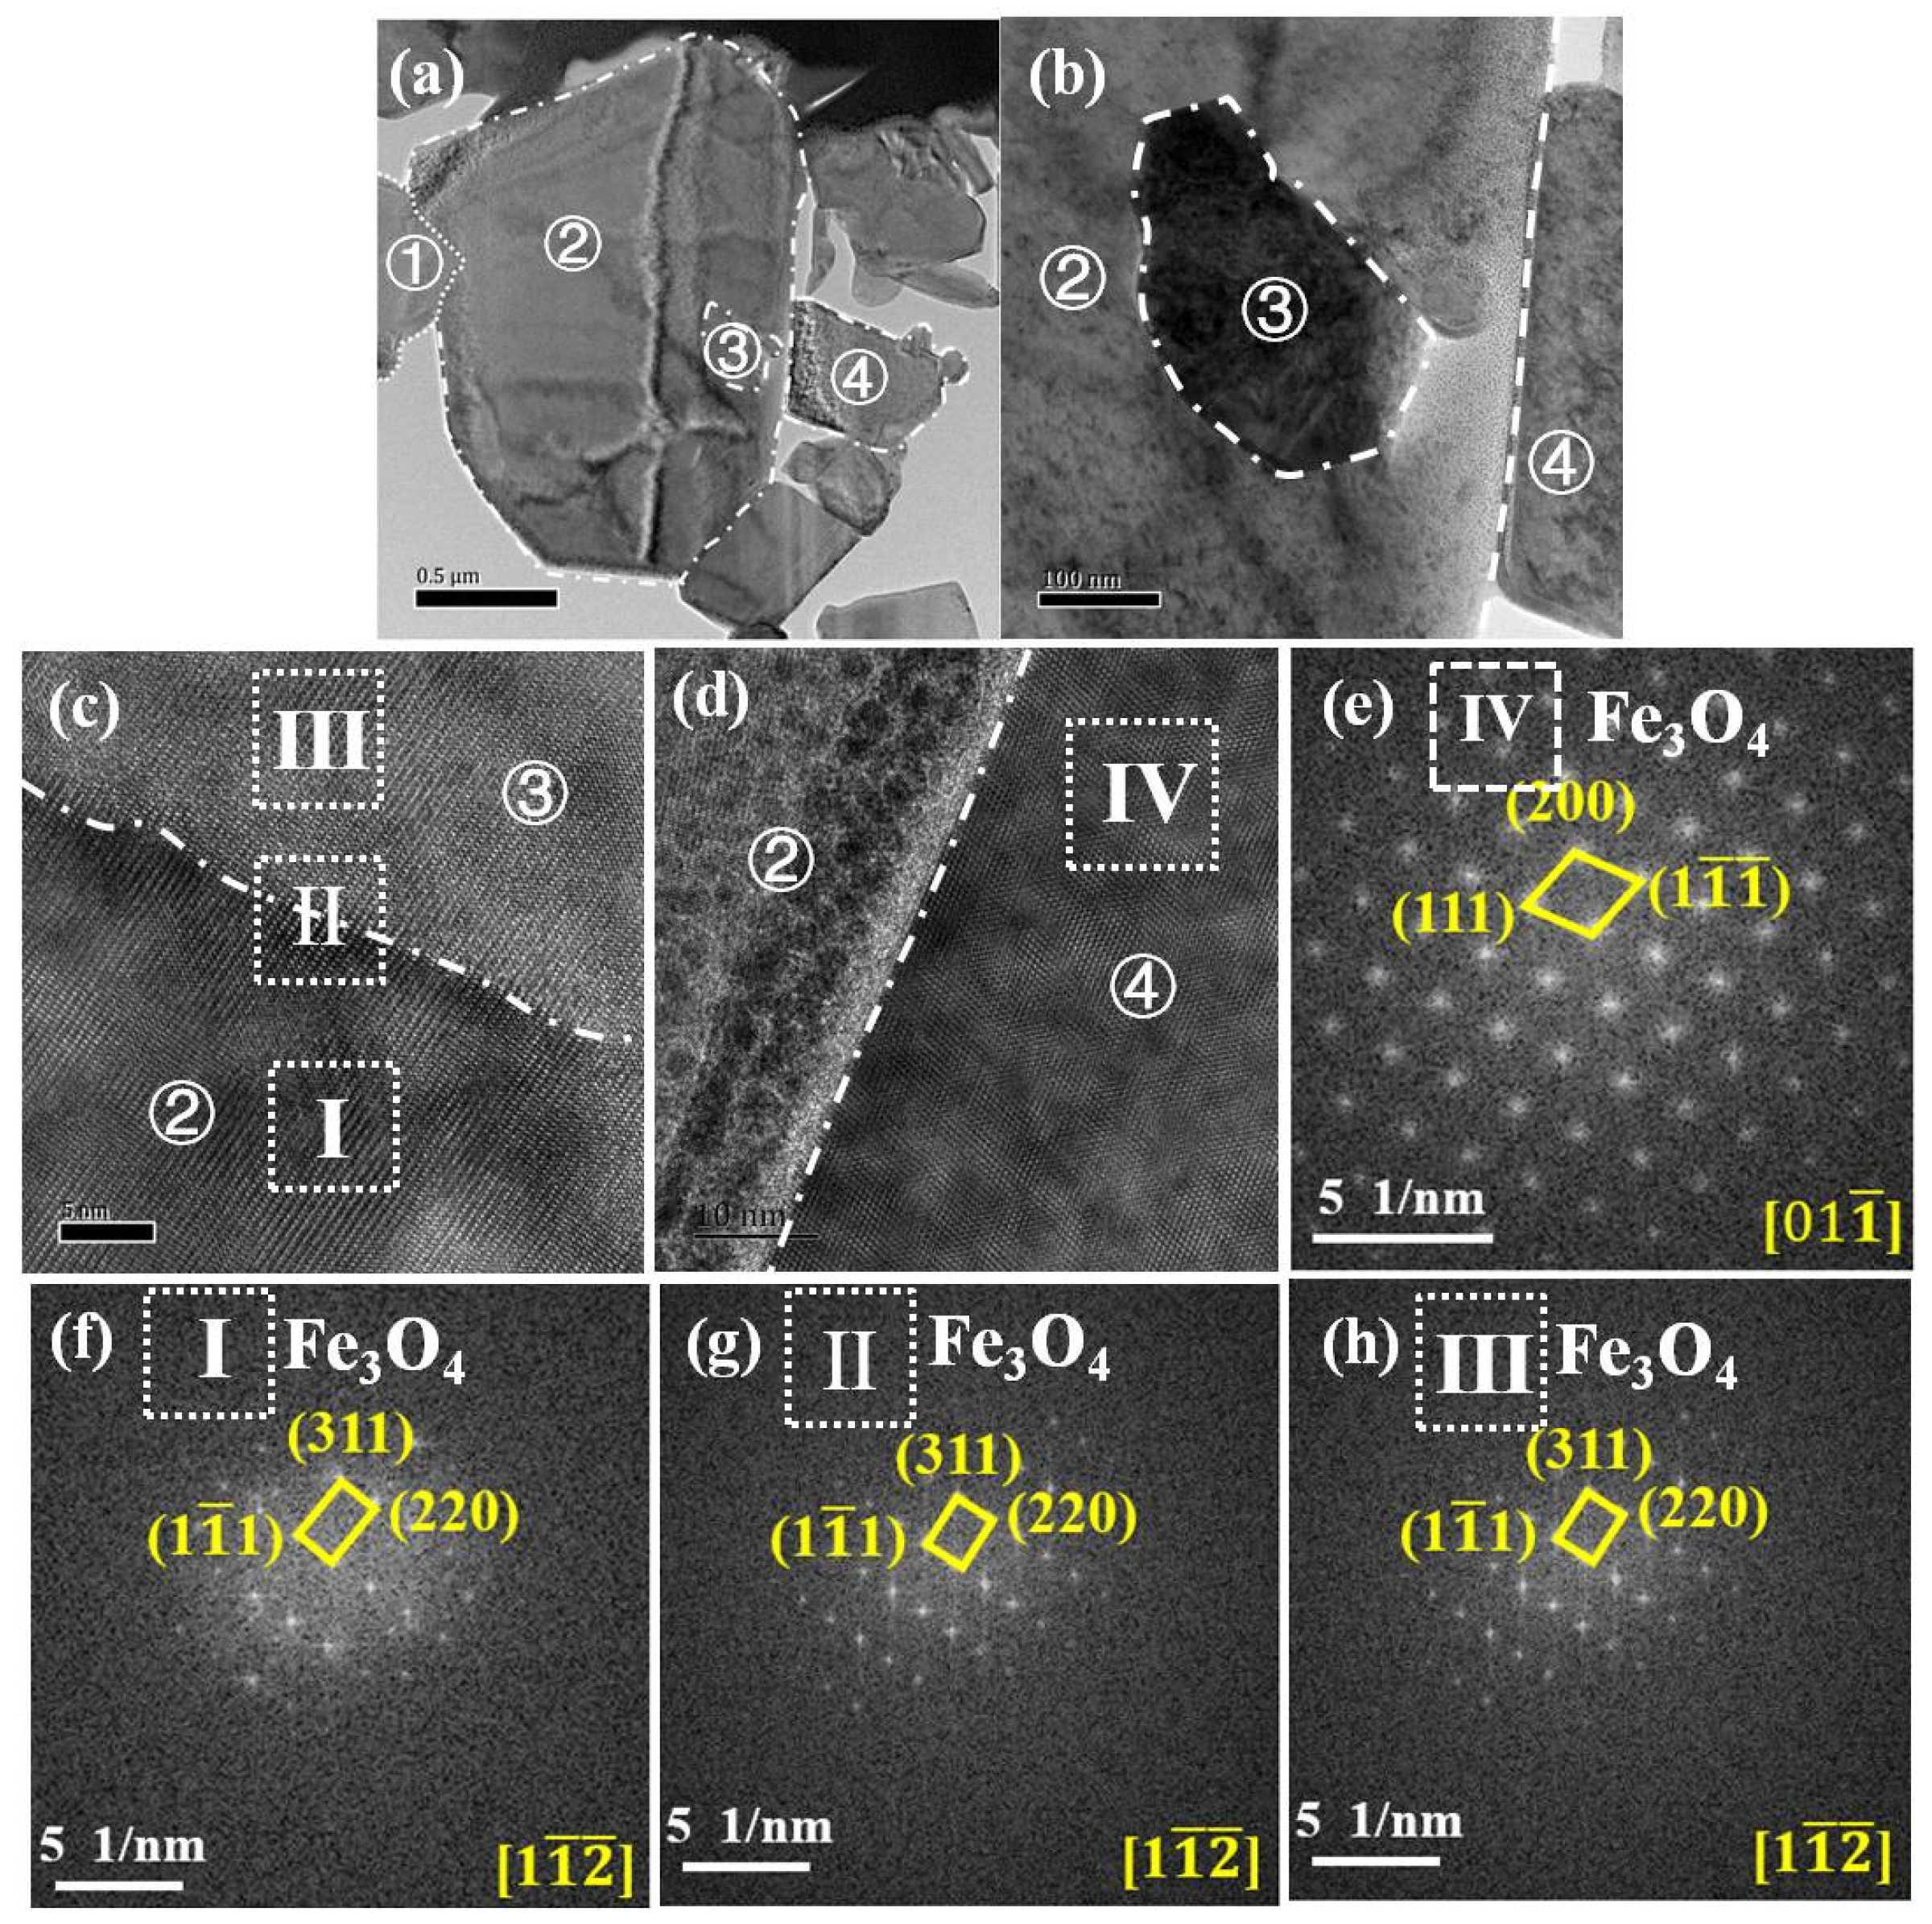
3.4. Deposit Cross-Sectional Characterization

Figure 7 shows the cross-section morphologies of deposits around the micro-orifice after different sputtering times. A small piece of deposit was cut and lifted out by FIB, and then the cross-section was observed by SEM. The location of sampling is marked by the red dotted box in Figure 7a. To observe the morphology of the deposit more comprehensively, the cross-section morphology around the micro-orifice was observed after sputtering different times as shown from Figure 7b–i. It was further confirmed that the deposit around the micro-orifice was loose and porous, and the space among particulate deposits varies from tens of nm to several μm.
Figure 8 shows the element mapping results of the cross section of the deposit. The deposit mainly consists of Fe and O, with a small amount of Cr and Ni. Table 4 shows the mass percentages of the four elements in this area.
Figure 9a shows the TEM image of the deposit marked in the right rectangle in Figure 8a to obtain more details on how the particulates deposited on each other. Three types of interfaces are found in Figure 9b, which are the curved interface such as particle ① and particle ② interface; the enclosed interface such as particle ③ and particle ② interface; and the flat interface such as particle ④ and particle ② interface. Figure 9c shows an HRTEM image of the interface between particle ③ and particle ②. It can be observed from the interface of the two particles that there is a same orientation relationship between the two particles. The FFT patterns of different regions are shown in Figure 9c, and only Fe3O4 is identified from the clear FFT diffraction patterns of different regions. At the same time, these different regions are located along the [ 1   1 ¯   2 ¯ ] zone axis. Figure 9d shows an HRTEM image of the interface between particle ④ and particle ②. As shown in Figure 9d, each particle has an independent crystal orientation, which can also confirm Figure 9i,f.
Figure 10a shows the TEM image of the deposit marked in the left rectangle in Figure 8a. As can be seen from Figure 10a, the particles are randomly arranged together, the same as a skeleton. In Figure 10b, it can be observed that there are some overlapping zones among particles by outlining particle boundaries with dotted lines. In terms of embedding depth, particle ⑤ is embedded almost to the larger particle ⑦ at the lower left, and the other two particles are also embedded with each other for more than ten nm. Figure 10c is an HRTEM image of the interface between particle ⑤ and particle ⑥, from which a clear lattice structure and complex overlapping region can be observed. The interface between particle 5 and particle 6 is defined as a mixed interface. FFT is performed on regions I and II in Figure 10c respectively. Fe3O4 can be identified clearly in the FFT diffraction pattern of region I. The FFT diffraction pattern of region II is formed by the superposition of different diffraction patterns, and the overlapping width between the two particles is more than 10 nm. The above information of interface types gives lots of hints in the mechanism of micro-orifice clogging formation.

4. Discussion

4.1. Evolution of Clogging

As shown in Figure 6, there are deposits of various ranges at the micro-orifice boundary. Due to the presence of the accelerated flow region, the electrokinetic effect is a key factor which affects the clogging behavior. When a metal contacts with the solution, ions in the solution would be rearranged to maintain charge neutrality within the local region of the metal surface, resulting in the formation of an electrical double-layer (EDL). The iron ion moves along the flow direction, resulting in a streaming current parallel to the inner wall of the flow cell [3,20,21]. In the flow-accelerated condition, such as facing a step (the disc in the current study), the streaming current increases rapidly. In order to maintain the overall electric neutrality, the wall current, which is parallel to the disc is generated to balance it. From the whole matrix, it could be seen that the wall current at the edge of the micro-orifice is higher, which has been proved by the theorical calculation [22]. Raman spectra in Figure 6 indicate that Fe3O4 is more prone to deposit than Fe2O3 in the flow accelerated region.
The BURR is an essential parameter reflecting the clogging dynamics, which can be obtained from the stable deposition stage based on Equations (A1)–(A4). Scenini et al. systematically studied the clogging behavior of the micro-orifice. They found that the BURR gradually decreased with the increase of the linear velocity through the micro-orifice with 300 μm at 230 °C in the pure water [12,20]. Moreover, when the flow velocity is 36 m/s, the BURR is 3.86 μm/h. Besides the obvious differences in temperature, pH, and testing time, the BURR (0.25 μm/h) in the study is about 1/15 of previous studies at the same linear velocity through the micro-orifice, which demonstrates that temperature and/or pH are the key parameters affecting the BURR. Moreover, these key parameters mainly affect the solubility of Fe3O4 particles in the loop. Biernatet al. studied the solubility of Fe3O4 particles at different temperatures when the pH was 7 and 10 [19,23,24]. The solubility of Fe3O4 particles varies under different temperatures and pH values. The concentration of iron ions in the loop was lower than the solubility of Fe3O4 particles in Scenini et al.’s work [22]. However, according to the results of ICP-MS in Table 2, the concentration of iron ions in the loop was higher than the solubility of Fe3O4 particles. Compared with the solubility of Fe3O4 under different conditions, the concentration of Fe ions in the loop leads to a different deposition mechanism which will be discussed later. The other factor affecting the deposition process is the adsorption energy of Fe2+. As calculated by Ren et al. [25], the adsorption energy decreased with increasing temperature in the range of 483 K to 563 K, which means the higher the temperature was, the weaker the adsorption strength of agglomerating Fe3O4.
During the rapid recovery stage, the residual area of the micro-orifice was calculated to increase by about 3850 μm2 according to the calculated BR. Such a decrease of BR is not commonly reported in the literature. One hypothesis is that in this stage a part of the deposit was removed for some reasons. It can be seen from Figure 5a that an area (marked by dotted triangle BCD) bulges out at the lower-left corner of the residual micro-orifice, which (3850 μm2) is approximately equal to the increase in the residual area during the rapid recovery stage. Before the beginning of the rapid recovery stage, an area (marked by dotted triangle BCD) at the lower-left corner of the residual micro-orifice is considered as an independent region. The deposit of this region was removed, then the solution can gradually flow through the BCD region as time goes on, and the BCD region becomes completely integrated with the central micro-orifice. As a result, the clogging radius of the micro-orifice decreased.
The dynamic equilibrium stage in the last 300 h indicates that the generation rate and removal rate of the deposit are almost equivalent. The deposit can be removed by either chemical dissolution or mechanical shear force of the flow. It is obvious that the degree of mechanical removal depends on the interfacial binding force between different deposit particles, which will be discussed in detail in the next section together with the deposition mechanism.

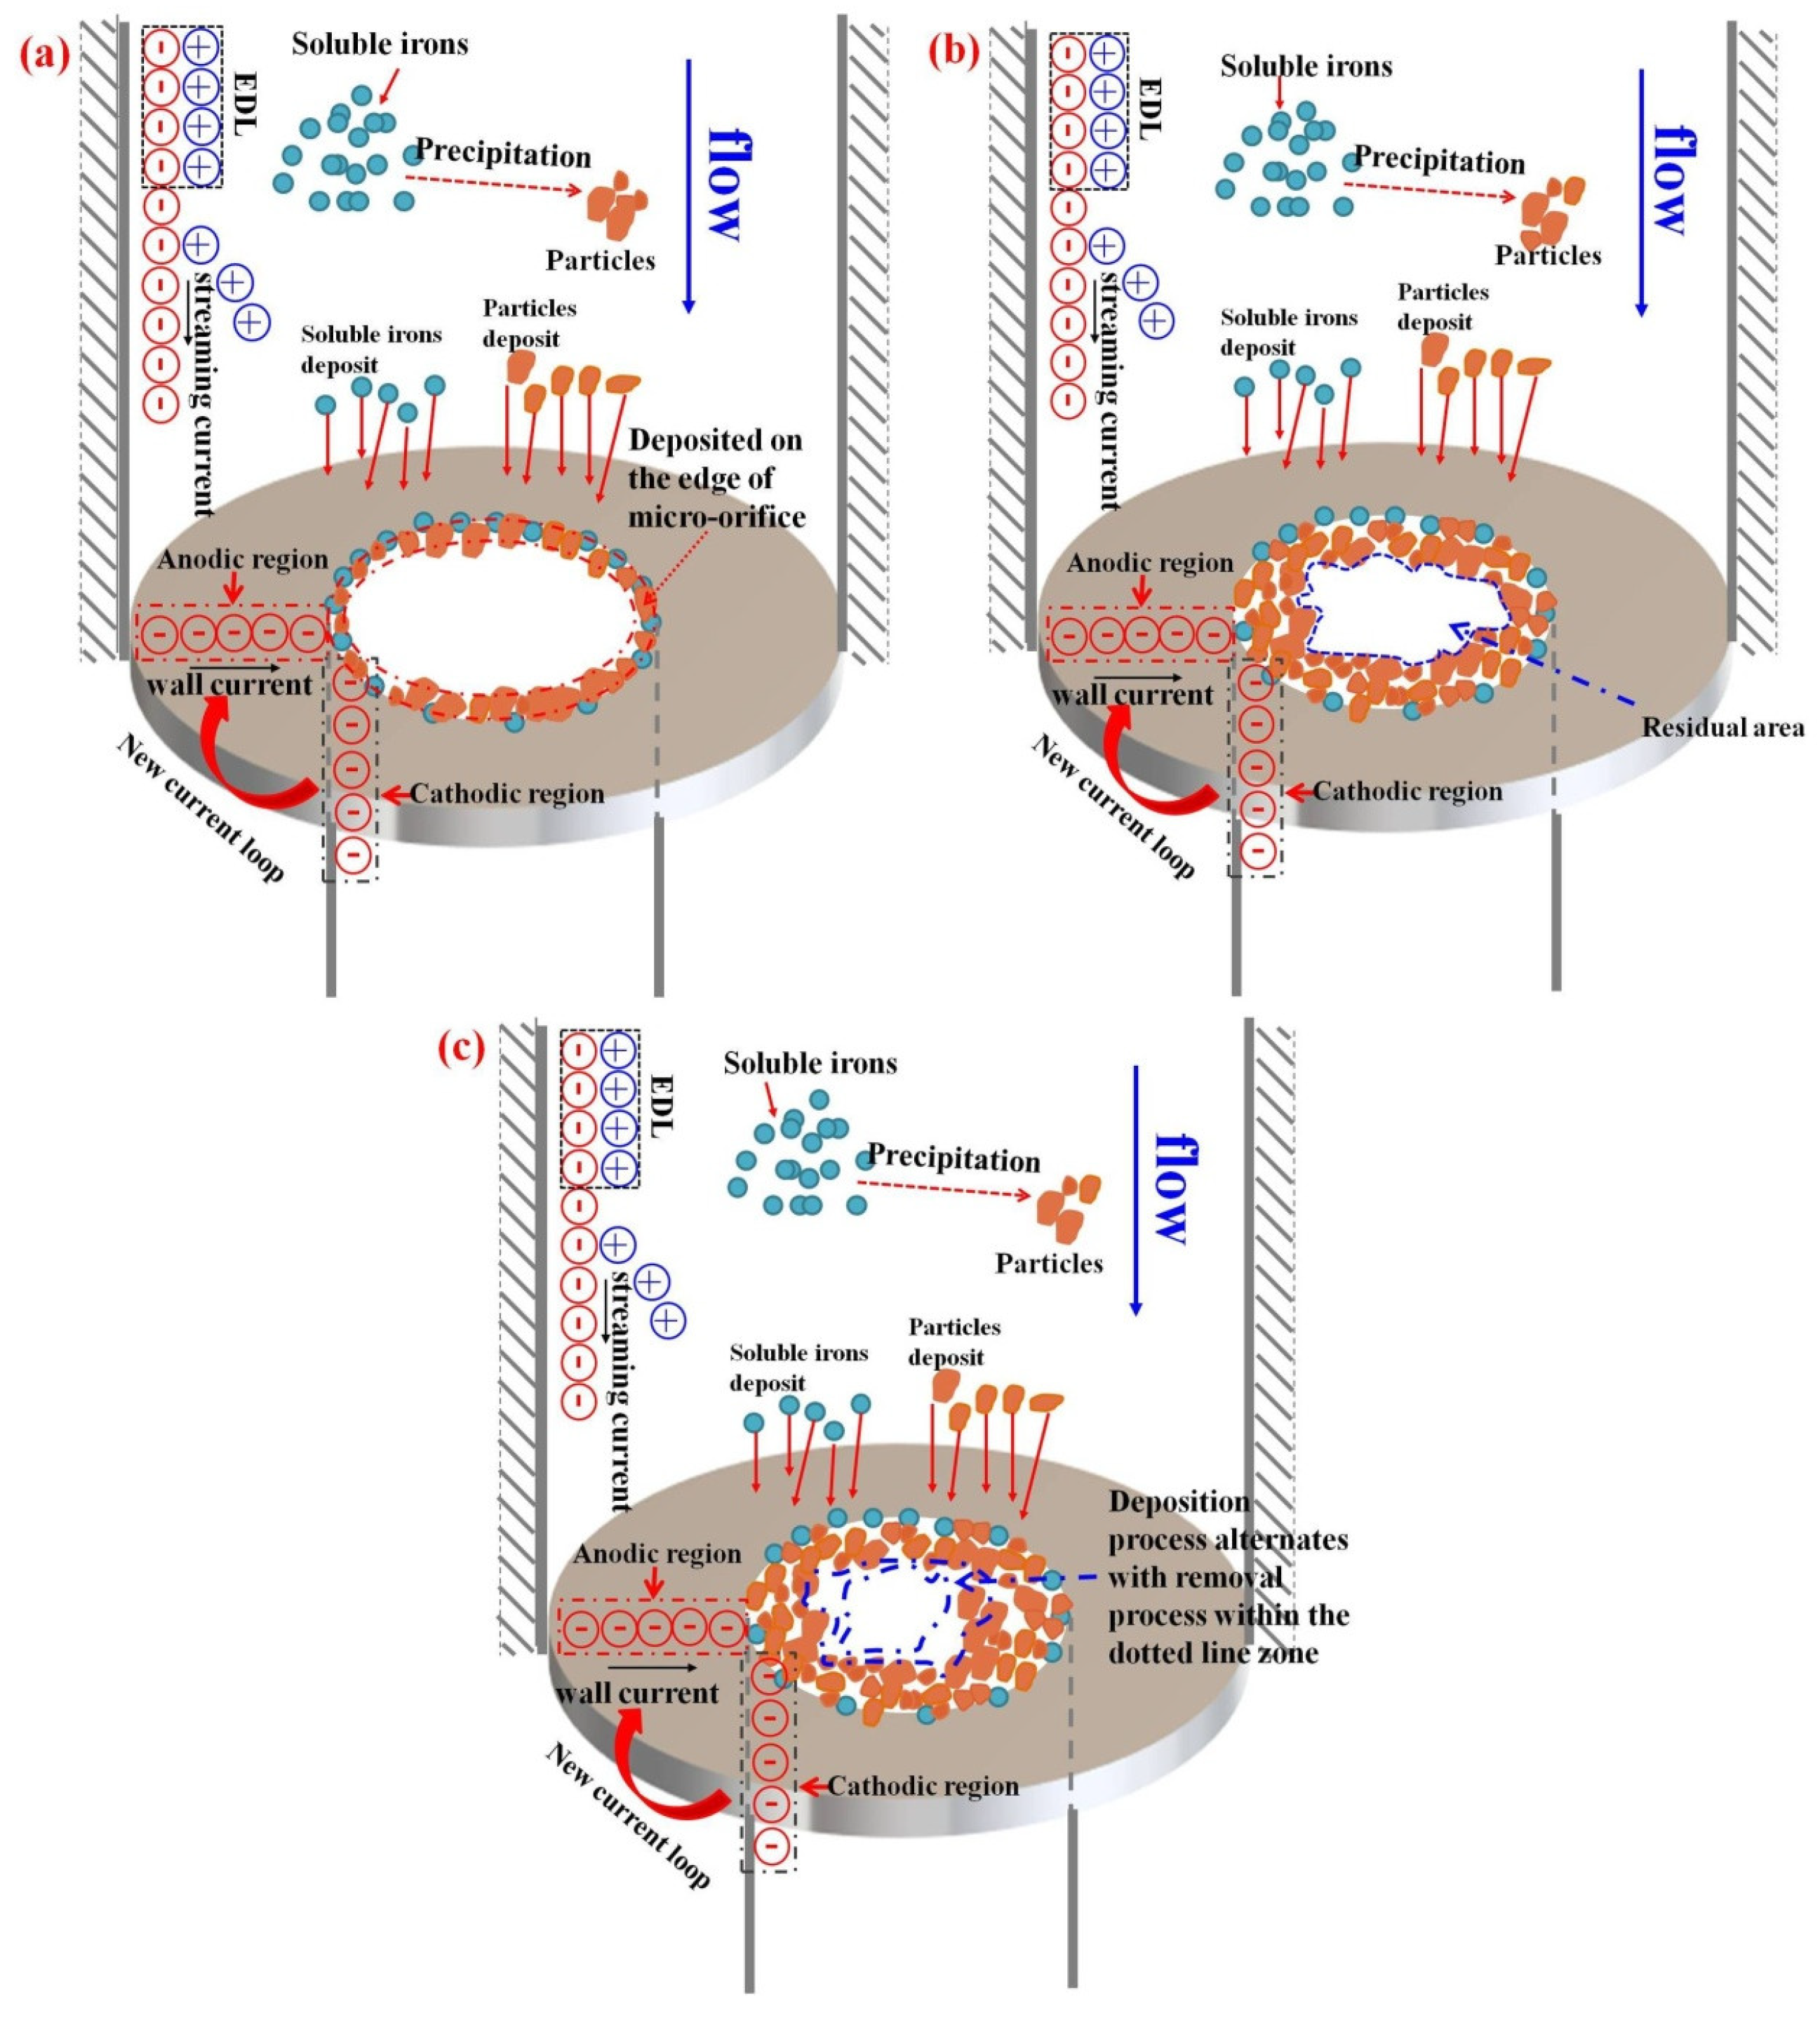
4.2. Deposition Mechanisms

Two deposition mechanisms are mainly reported in the literature [1]: the first one is the direct attachment of particles (particle deposition mechanism), and the second one is the precipitation of ions (soluble iron precipitation mechanism). According to the results of ICP-MS, the concentration of iron ions in the loop was higher than the solubility of Fe3O4 particles, which proves that Fe3O4 particles are present in the loop. This means the two deposition mechanisms may coexist in current study. It should be noted that the two different deposition mechanisms can lead to a certain difference in the interface between particles. Namely, if the deposition mechanism is ion precipitation, the ions prefer to deposit along the same crystal planes, and the new deposited part and the origin part have a coherent interface, as indicated by the theoretical calculation of Ren et al. [26,27]. However, if a particle in the solution just attaches to the surface, the orientation relationship in the interface would be weak. Figure 9 and Figure 10 show four types of interface, namely, the curved interface, the enclosed interface, the flat interface, and the mixed interface, and the interface structures are also presented. The enclosed interface and mixed interface in Figure 9 and Figure 10 have lattice orientation match or lattice superposition, indicating that deposited particles may be formed by the soluble iron precipitation mechanism. Such deposits, which formed on the surface itself, was also called crystallization fouling, are tenacious and difficult to remove [1]. Whereas in fact, the flat interface of particle ④ and particle ② has no lattice orientation match, indicating that the deposit may be formed by the particle deposition mechanism. For the curved interface of particle ① and particle ②, the detailed interface structure was not analyzed. It seems that particle ① hit particle ②, leaving a curved interface. Generally, different interfaces formed by different mechanisms have different binding forces, which can affect the removal of the deposit.
Figure 11 shows the mechanism diagram of the micro-orifice clogging process. For the interface between the 304 SS and the solution to remain neutral, the charge held onto the 304 SS was balanced by the redistribution of ions of opposite charge in the solution close to the 304 SS, leading to an EDL shown in Figure 11a [28,29]. When the solution flows into flow cell I, the flow acceleration area forms in it, resulting in the rapid increase of streaming current, and then the transfer of wall current generated from the 304 SS to the metal/solution interface [15,16,22,30]. In the meantime, the “Karman vortex street” phenomenon will occur in the flow accelerated region, making the pressure difference between the micro-orifice on both sides increase, and causing a new current loop to promote particle deposition [19,31,32,33,34]. According to previous calculations, the current was the highest at the edge of the flow accelerated region. This means that the metal dissolved the fastest around the micro-orifice. The dissolved metallic ions can precipitate on the surface around the micro-orifice, and the flowing particle in the solution can also deposit around the micro-orifice directly. As shown in Figure 11b, in the stable deposition stage, ions and particles continuously deposited on the surface of the deposits by two different deposition mechanisms, thus reducing the residual area of the micro-orifice. It should be noted that the deposit-removal process also occurred simultaneously, the difficulty of which relied on the binding force between different deposit particles. Figure 11c shows the schematic of deposit formation and removal processes, and the balance of the two processes results in the dynamic equilibrium stage.

5. Conclusions

The deposition process in the flow accelerated region at 290 °C was studied by using a micro-orifice specimen, and the following conclusions were reached:
  • The three stages, which are the stable deposition stage, the quick recovery stage, and the dynamic equilibrium stage, can be distinguished in the deposition process. The BURR in the stable deposition stage is 0.25 μm/h, while BURR in the dynamic equilibrium stage was almost unchanged.
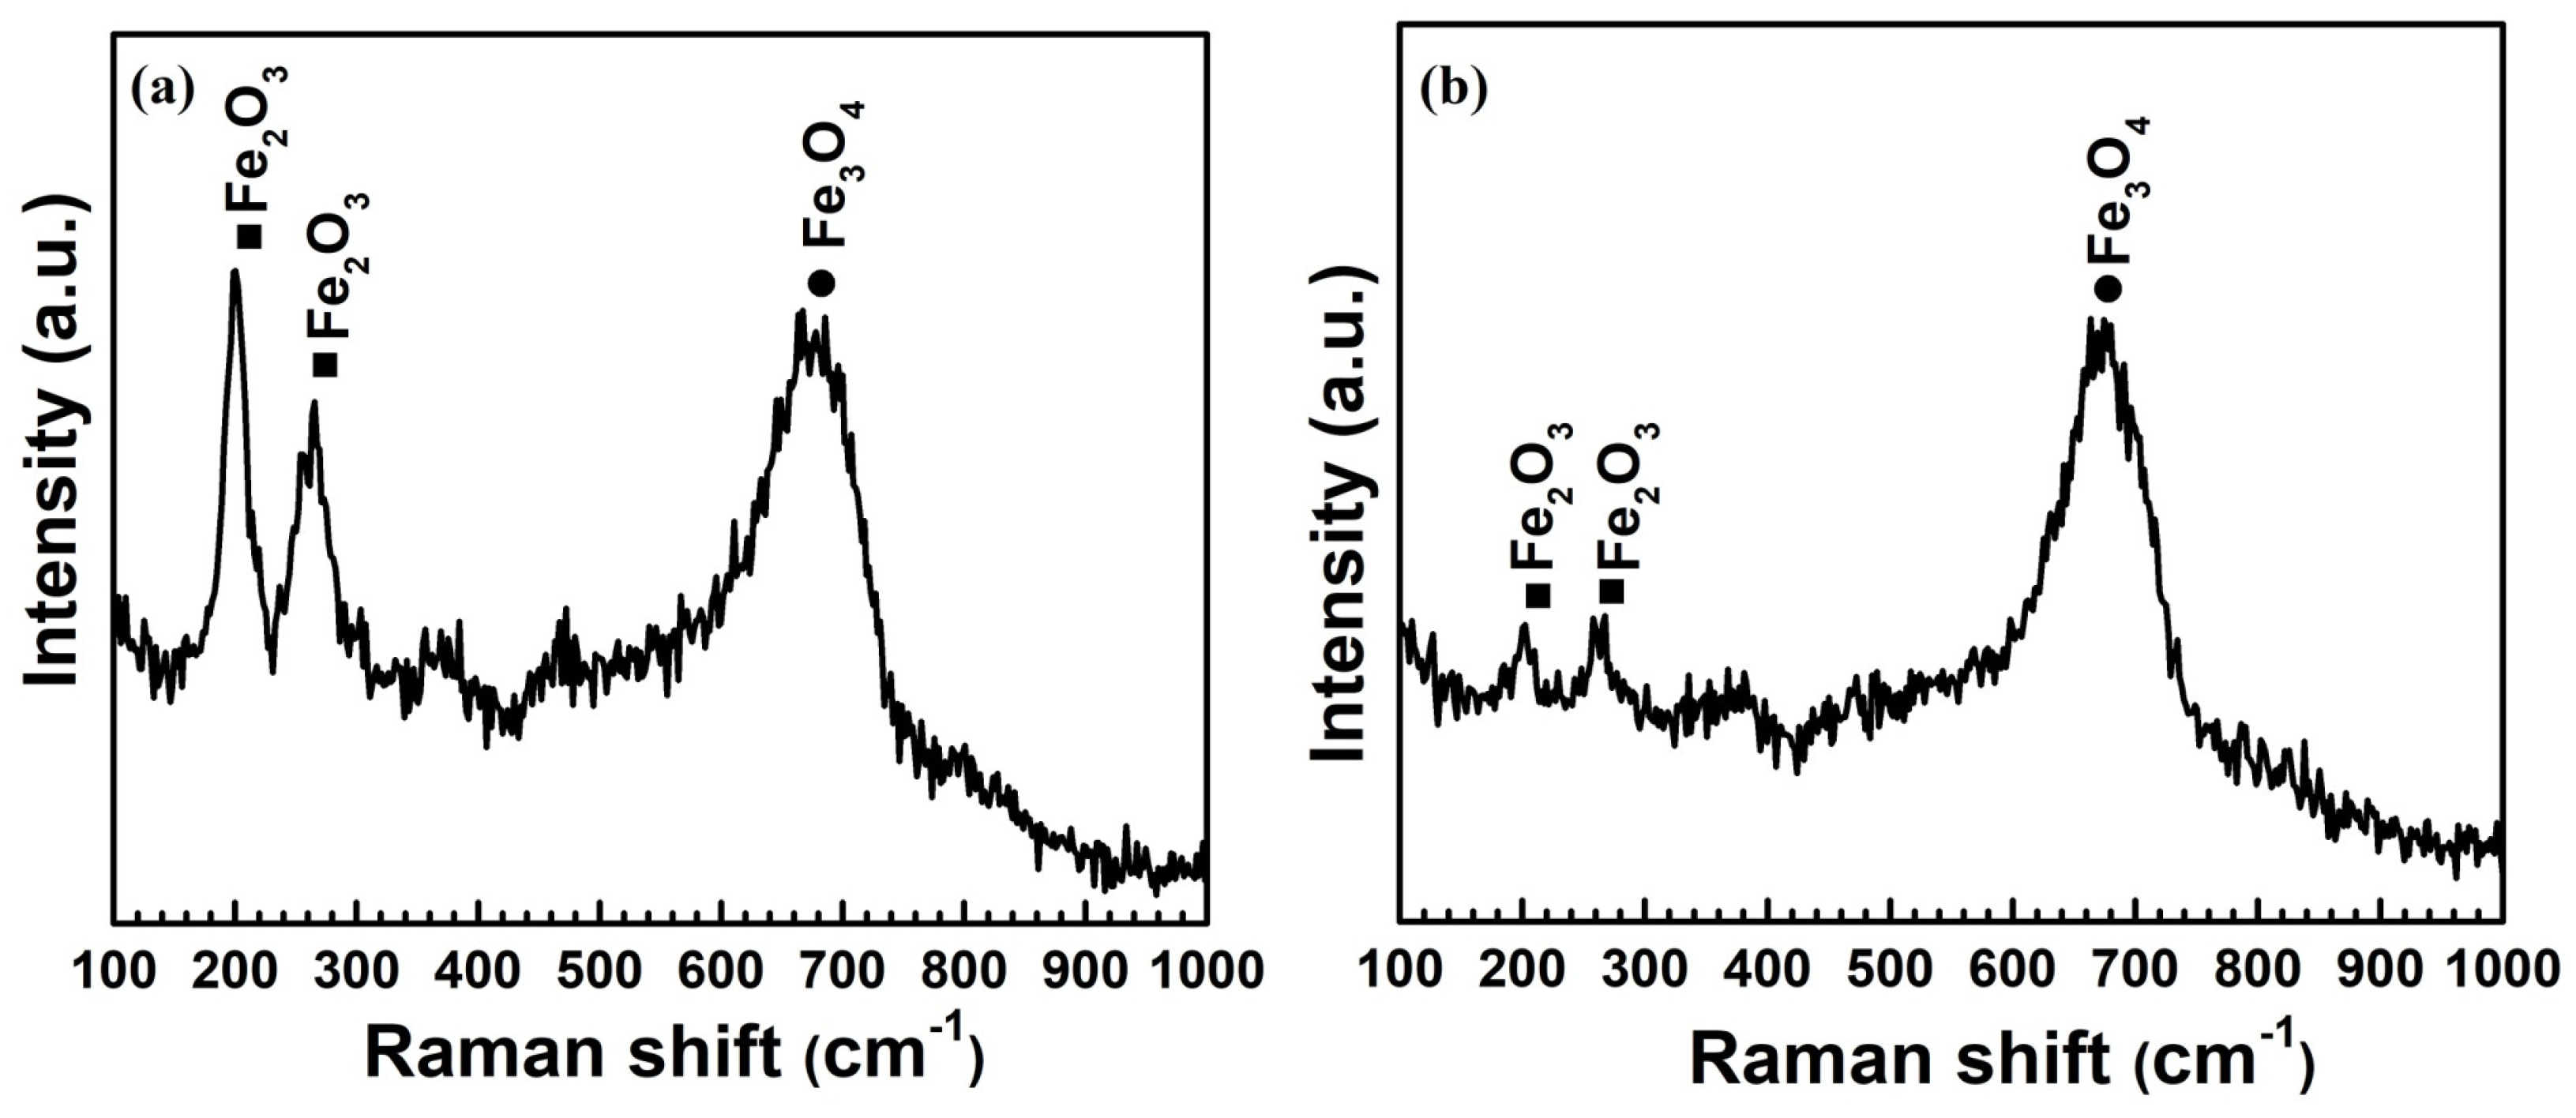
  • The deposit preferred to form near the micro-orifice. In the range of Bs, the deposit was mainly Fe3O4, while out of the Bs, the amount of Fe2O3 in the deposit increased. Only a small amount of Cr and Ni was detected in the deposit.
  • The deposit was porous and consisted of particles. The size of the pore among particles can be tens of nm to several μm.
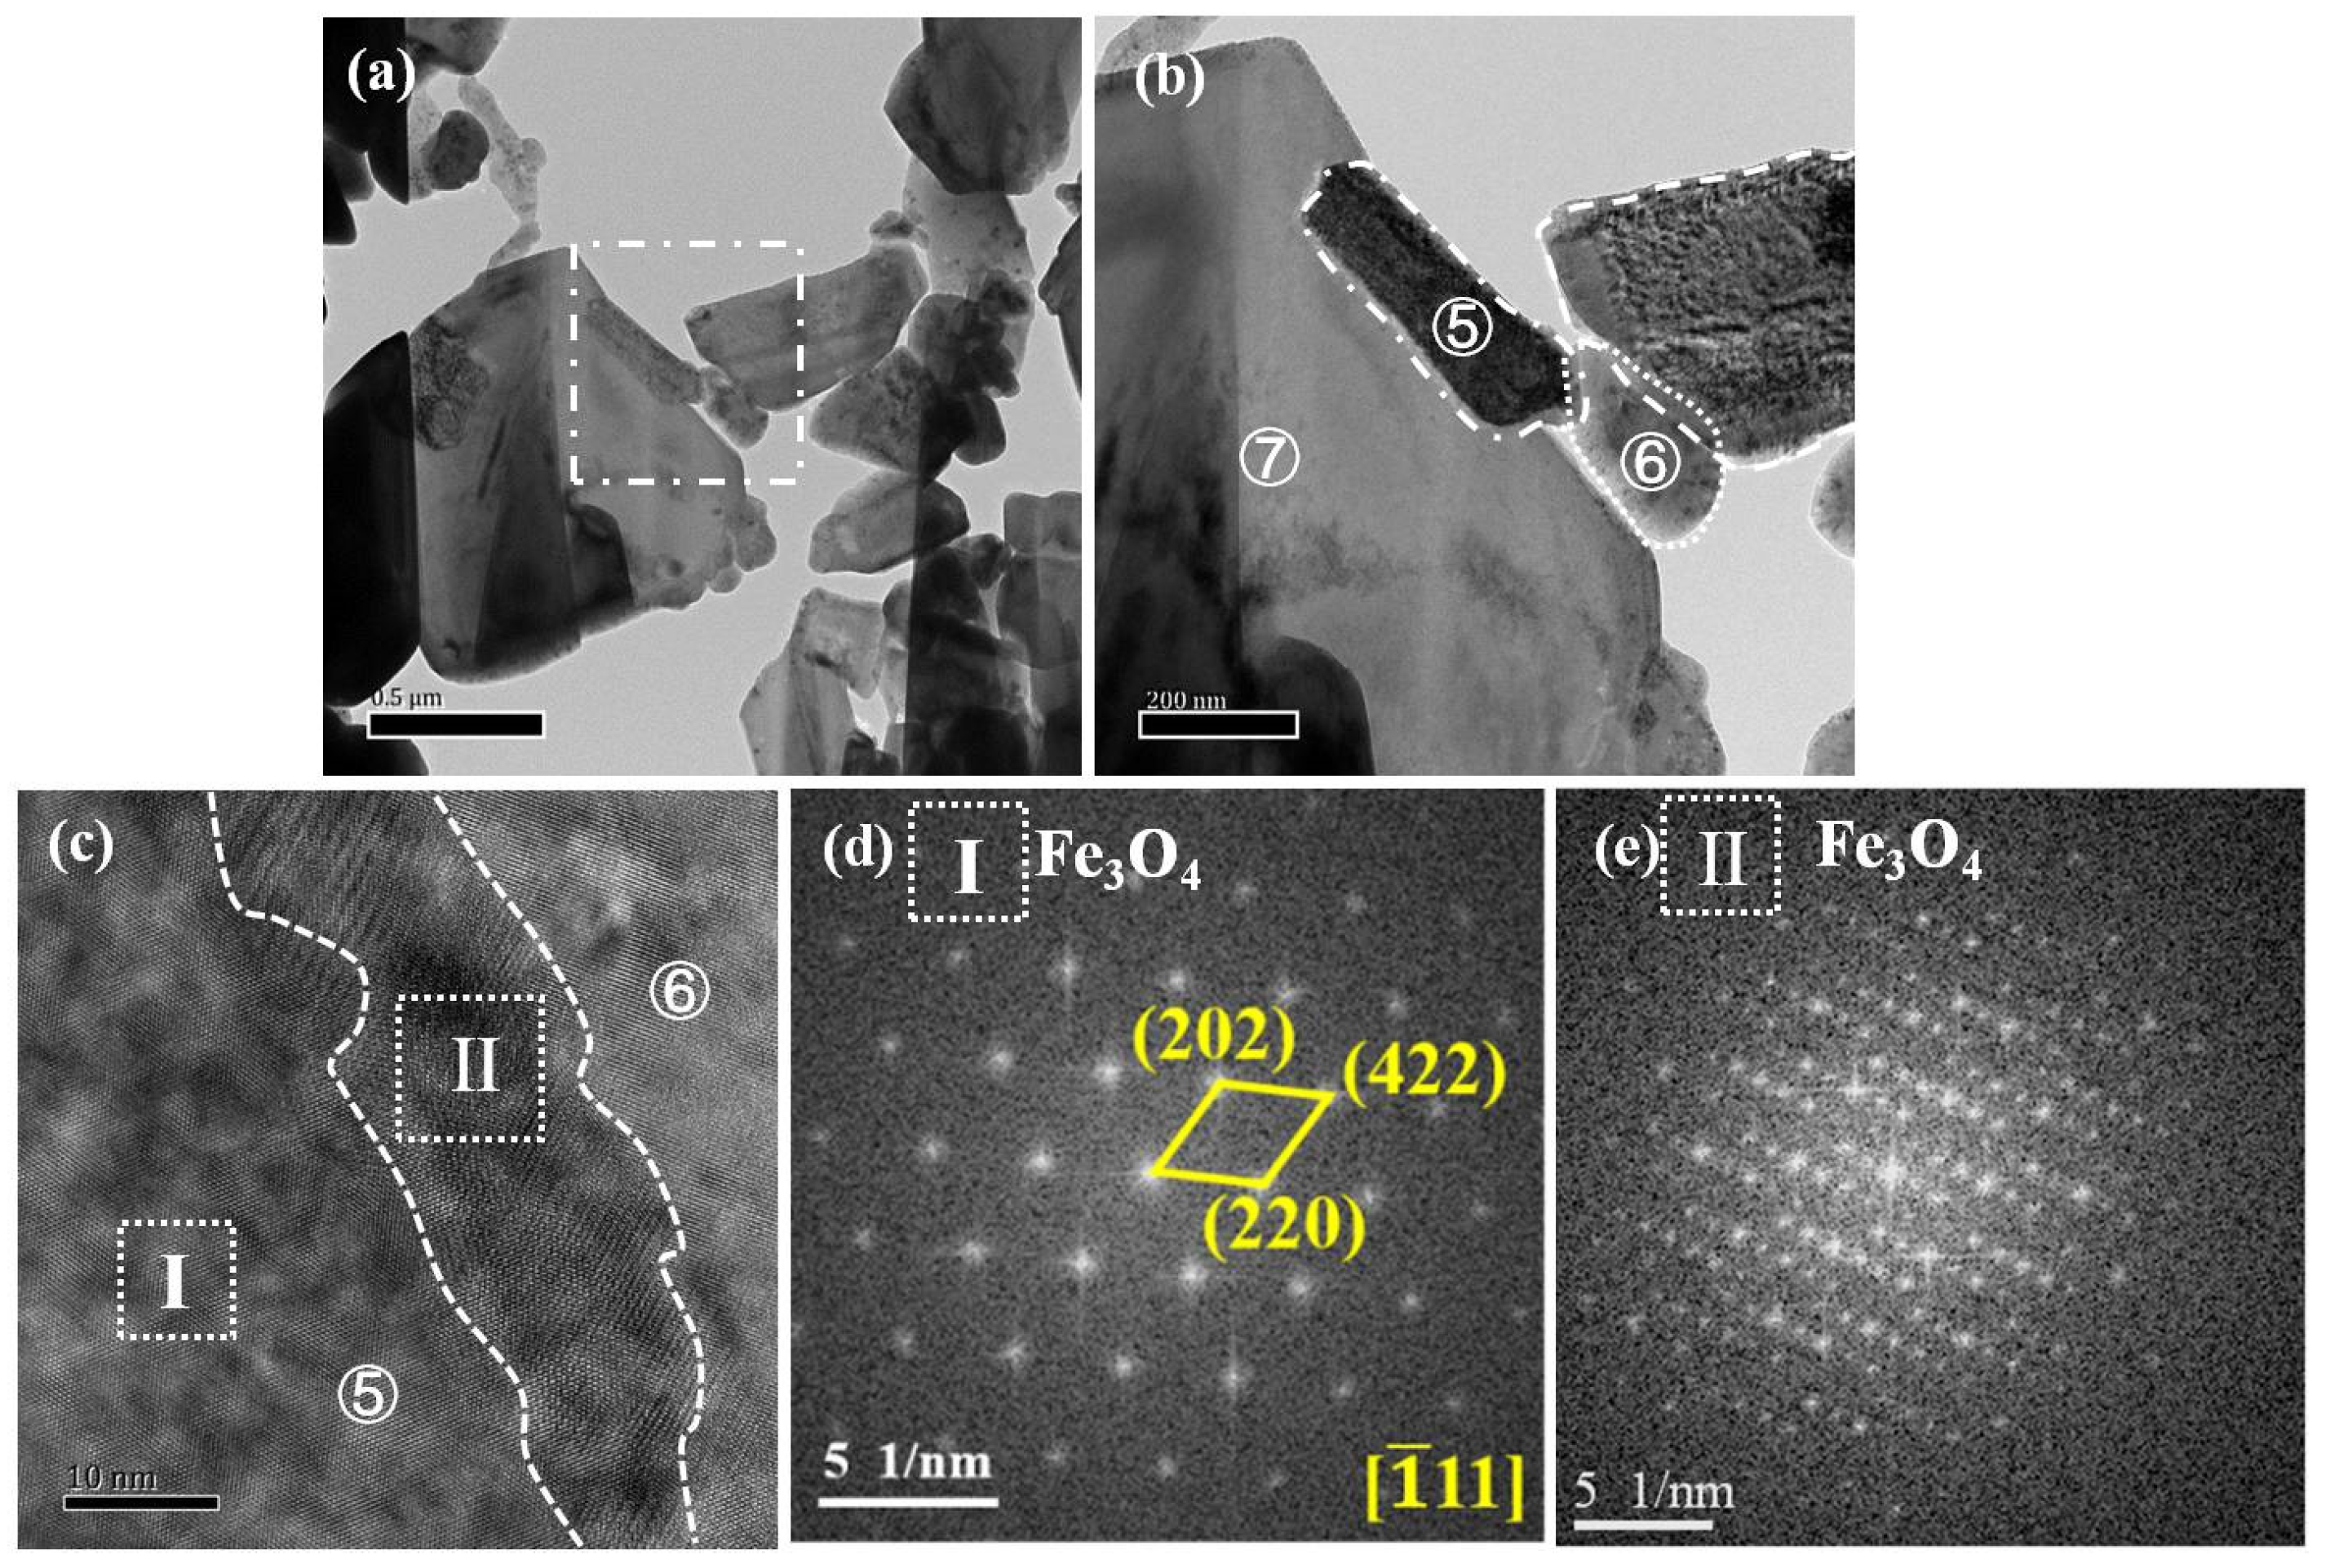
  • Three types of interfaces, namely curved interface, enclosed interface, and flat interface, were found between the deposit particles. Both the ion soluble iron precipitation mechanism and the particle deposition mechanism were confirmed according to the detailed interfacial analyses. For interfaces with lattice orientation match or preposition, the ion soluble iron precipitation mechanism was the dominant mechanism. On the contrary, for the interface without an orientation match, the deposit may be formed through the particle deposition mechanism.

Author Contributions

Methodology, T.Z.; formal analysis, T.L.; investigation, J.L.; resources, Q.G.; data curation, T.Z.; writing—original draft preparation, J.X.; writing—review and editing. All authors have read and agreed to the published version of the manuscript.

Funding

This research was funded by the National Natural Science Foundation of China grant number 51901254, 52001336.

Acknowledgments

This work has been supported by the National Natural Science Foundation of China (51901254, 52001336), Guangdong Natural Science Foundation (2020A1515110449, 2020A1515011033), China Postdoctoral Science Foundation (2021M693591).

Conflicts of Interest

The authors declare no conflict of interest.

Appendix A

Residual area calculation methods
The clogging behavior can be quantified by three parameters [15]: BR, BS, and BT. BR represents the clogging width of the micro-orifice, which can affect the pressure difference between the inside and outside of the micro-orifice and the linear velocity through the micro-orifice. BS represents the width of corrosion product deposited on the surface. BT represents the deposition thickness of the inner micro-orifice. Among them, BR plays an important role in the overall running state, following Equation (A1).
B U R R = D 0 D E 2 t
where: D0 is the initial diameter of the micro-orifice. DE is the equivalent diameter of the micro-orifice, following Equation (A2). t is the experimental deposition time.
D E = 4 × residual   area   of   micro - orifice   π
Therefore, once the real-time residual area of the micro-orifice is obtained, the change rule of BR can be obtained.
BR is related to the residual area of the micro-orifice only, as can be seen from Equations (A1) and (A2). The key to obtaining the connection between flow rate and BR is to find the connection between flow rate and residual area of micro-orifice. In general, the residual area of the micro-orifice, as an important parameter that directly reflects the degree of clogging, is not in a regular shape, and the BR calculated can only be used as a reference value. Therefore, it is more important to find the corresponding relation between the residual area and flow rate of micro-orifice with time.
The residual area of the micro-orifice can be obtained from the continuity equation satisfied by the flow, as shown in Equation (A3) [35].
Q = V × A
where: Q is the flow rate through the micro-orifice. V is the linear velocity through the micro-orifice. A is the residual area of the micro-orifice.
As shown in Figure 1, there is a digital rotameter behind the back pressure valve in the main loop, through which the evolution of flow rate in real-time can be obtained by recording value at an interval of 2 min. The linear velocity through the micro-orifice can be calculated by Bernoulli’s equation, as shown in Equation (A4) [36].
P 1 + 1 2 ρ V 1 2 = P 2 + 1 2 ρ V 2 2 + ζ ρ V 2 2
where: P1 is the inlet water pressure; P2 is the outlet water pressure; ρ is the density of water; ζ is the local resistance coefficient; V1 is the linear velocity through the flow cell; V2 is the linear velocity through the micro-orifice; P1 and P2 can be recorded by pressure sensors installed at the inlet and outlet of the autoclave; ζ can be calculated by Equation (A5).
ζ = 1 2 ( 1 A 2 A 1 )
where: A1 is the area of the inlet of the flow cell; A2 is the real-time area of the micro-orifice.
When A1A2, A2/A1 goes to 0, and ζ is approximately 0.5. The linear velocity through the micro-orifice can be obtained from Equations (A4) and (A5).

References

  1. Yang, G.; Pointeau, V.; Tevissen, E.; Chagnes, A. A review on clogging of recirculating steam generators in Pressurized-Water Reactors. Prog. Nucl. Energy 2017, 97, 182–196. [Google Scholar] [CrossRef] [Green Version]
  2. Ma, Y.; Huang, B.; Chen, J.; Muhammad, A.; Zhu, H.; Chen, Y. Deposition behavior of corrosion products in an Iter water-cooling experimental loop. Fusion Eng. Des. 2020, 159, 111883. [Google Scholar] [CrossRef]
  3. Prusek, T.; Moleiro, E.; Oukacine, F.; Adobes, A.; Jaeger, M.; Grandotto, M. Deposit models for tube support plate flow blockage in Steam Generators. Nucl. Eng. Des. 2013, 262, 418–428. [Google Scholar] [CrossRef]
  4. Cinosi, N.; Haq, I.; Bluck, M.; Walker, S.P. The effective thermal conductivity of crud and heat transfer from crud-coated PWR fuel. Nucl. Eng. Des. 2011, 241, 792–798. [Google Scholar] [CrossRef] [Green Version]
  5. Seligmann, D.C.; Guillou, J.P. Flow Induced Vibrations in a PWR Piping System. 1995, pp. 445–450. Available online: https://inis.iaea.org/collection/NCLCollectionStore/_Public/28/014/28014149.pdf?r=1 (accessed on 5 May 2022).
  6. Ding, H.-Z.; Xin, X.-S. A plastic flow-induced fracture theory for fatigue crack growth. J. Mater. Sci. 1996, 31, 4099–4103. [Google Scholar]
  7. Diercks, D.; Shack, W.; Muscara, J. Overview of steam generator tube degradation and integrity issues. Nucl. Eng. Des. 1999, 194, 19–30. [Google Scholar] [CrossRef] [Green Version]
  8. Henry, C.; Minier, J.P.; Lefevre, G. Towards a description of particulate fouling: From single particle deposition to clogging. Adv. Colloid Interface 2012, 185, 34–76. [Google Scholar] [CrossRef]
  9. Xin, L.; Luo, H.J.; Han, J.L.; Lu, Y.H.; Shoji, T. Damage mechanism of Alloy 690TT mated with Type 304 stainless steel during fretting wear in partial slip regime. Mater. Charact. 2017, 132, 284–292. [Google Scholar] [CrossRef]
  10. Nuclear Power Engineering Section. Indicators for Management of Planned Outages in Nuclear Power Plants; International Atomic Energy Agency: Vienna, Austria, 2006. [Google Scholar]
  11. Brun, C.; Engler, N.; Berthollon, G.; Muller, T.; Sala, B.; Combrade, P.; Turluer, G. Investigation on the relation between pressure drops and fluid chemical treatment. In Proceedings of the Chemistry 2002: International Conference on Water Chemistry in Nuclear Reactors Systems, Avignon, France, 22–26 April 2002; pp. 1–84. [Google Scholar]
  12. Cassineri, S.; Duff, J.; Cioncolini, A.; Curioni, M.; Banks, A.; Scenini, F. Deposition of corrosion products under pressurised water nuclear reactor conditions: The effect of flow velocity and dissolved hydrogen. Corros. Sci. 2019, 159, 108113. [Google Scholar] [CrossRef]
  13. Guillodo, M.; Guingo, M.; Foucault, M.; Ryckelynck, N.; Chahma, F.; Mansour, C.; Alos-Ramos, O.; Corredera, G. Experimental and numerical study of deposit for mation in secondary side SG and TSP by electrokinetic approach. In Proceedings of the International Conference on Water Chemistry of Nuclear Reactor Systems, Paris, France, 23–27 September 2012; pp. 1–14. [Google Scholar]
  14. Šadek, S.; Grgić, D. Heat Exchangers—Advanced Features and Applications, SMS Murshed, MM Lopes; International Association of STM Publishers: London, UK, 2017; pp. 168–172. [Google Scholar]
  15. McGrady, J.; Duff, J.; Stevens, N.; Cioncolini, A.; Curioni, M.; Banks, A.; Scenini, F. Development of a microfluidic setup to study the corrosion product deposition in accelerated flow regions. NPJ Mater. Degrad. 2017, 1, 21. [Google Scholar] [CrossRef] [Green Version]
  16. McGrady, J.; Scenini, F.; Duff, J.; Stevens, N.; Cassineri, S.; Curioni, M.; Banks, A. Investigation into the effect of water chemistry on corrosion product formation in areas of accelerated flow. J. Nucl. Mater. 2017, 493, 271–279. [Google Scholar] [CrossRef]
  17. Cassineri, S.; Duff, J.; Curioni, M.; Banks, A.; Scenini, F. CRUD deposition in accelerated high-temperature water: Investigation on the effect of substrate material and water chemistry. J. Nucl. Mater. 2020, 529, 151915. [Google Scholar] [CrossRef]
  18. Vidojkovic, S.; Rodriguez-Santiago, V.; Fedkin, M.V.; Wesolowski, D.J.; Lvov, S.N. Electrophoretic mobility of magnetite particles in high temperature water. Chem. Eng. Sci. 2011, 66, 4029–4035. [Google Scholar] [CrossRef]
  19. Ziernniak, S.E.; Jones, M.E.; Combs, K.E.S. Magnetite Solubility and Phase Stability in Alkaline Media at Elevated Temperatures. J. Solut. Chem. 1995, 24, 837–877. [Google Scholar]
  20. Scenini, F.; Palumbo, G.; Stevens, N.; Cook, A.; Banks, A. Investigation of the role of electrokinetic effects in corrosion deposit formation. Corros. Sci. 2014, 87, 71–79. [Google Scholar] [CrossRef]
  21. Cassineri, S.; Curioni, M.; Banks, A.; Scenini, F. Exploring the effect of cathodic polarization to mitigate CRUD deposition. Nucl. Eng. Des. 2020, 366, 110764. [Google Scholar] [CrossRef]
  22. Wu, J.J.; Stevens, N.; Scenini, F.; Connolly, B.; Banks, A.; Powell, A.; Pegg, L.L. Finite Element Modelling to Investigate the Mechanisms of CRUD Deposition in PWR. In Proceedings of the 18th International Conference on Environmental Degradation of Materials in Nuclear Power Systems–Water Reactors, Marriott, Portland, 13–17 August 2017; pp. 2313–2325. [Google Scholar]
  23. Biernat, R.J.; Robins, R.G. High-temperature potential/pH diagrams for the iron–water and iron–water–sulphur systems. Electrochim. Acta 1972, 17, 1261–1283. [Google Scholar] [CrossRef]
  24. Tremaine, P.R.; LeBlanc, J.C. The solubility of magnetite and the hydrolysis and oxidation of Fe2+ in water to 300 °C. J. Solut. Chem. 1980, 9, 415–422. [Google Scholar] [CrossRef]
  25. Xu, L.R.J.; Jia, W.Y.; Yu, H.Y.; Shoji, T.; Zhang, T.; Li, N.N.; Zhang, D.Y.; Sun, D.B. Computational study of Fe3O4 adsorption behaviour on the secondary side of the heat exchange tube in the steam generator. Comp. Mater. Sci. 2021, 195, 110471. [Google Scholar]
  26. Ren, L.; Wang, S.W.; Xu, J.; Zhang, T.; Guo, Q.; Zhang, D.Y.; Si, J.J.; Zhang, X.H.; Yu, H.Y.; Shoji, T.; et al. Fouling on the secondary side of nuclear steam generator tube: Experimental and simulated study. Appl. Surf. Sci. 2022, 590, 153143. [Google Scholar] [CrossRef]
  27. Ren, L.; Xu, J.; Pan, S.C.; Yu, H.Y.; Zhang, T.; Shoji, T.; Li, N.N.; Zhang, D.Y.; Sun, D.B. DFT studies on the interaction of Fe2+/Fe3O4(1 1 1) and OH/Fe3O4(1 1 1) during the adsorption process in the steam generators of nuclear power plants. Colloids Surf. A Physicochem. Eng. Asp. 2021, 617, 126393. [Google Scholar] [CrossRef]
  28. Lefevre, G.; Cerovic, L.; Milonjic, S.; Fedoroff, M.; Finne, J.; Jaubertie, A. Determination of isoelectric points of metals and metallic alloys by adhesion of latex particles. J. Colloid. Interface Sci. 2009, 337, 449–455. [Google Scholar] [CrossRef] [PubMed]
  29. Kosmulski, M. A literature survey of the differences between the reported isoelectric points and their discussion. Colloid Surf. A 2003, 222, 113–118. [Google Scholar] [CrossRef]
  30. Carrette, F.; Lafont, M.C.; Chatainier, G.; Guinard, L.; Pieraggi, B. Analysis and TEM examination of corrosion scales grown on Alloy 690 exposed to pressurized water at 325 °C. Surf. Interface Anal. 2002, 34, 135–138. [Google Scholar] [CrossRef]
  31. Cassineri, S.; Cioncolini, A.; Smith, L.; Curioni, M.; Scenini, F. Experiments on Liquid Flow through Non-Circular Micro-Orifices. Micromachines 2020, 11, 510. [Google Scholar] [CrossRef]
  32. Cioncolini, A.; Cassineri, S.; Duff, J.; Curioni, M.; Scenini, F. Micro-orifice single-phase flow at very high Reynolds number. Exp. Fluid Sci. 2018, 91, 35–40. [Google Scholar] [CrossRef]
  33. SJeon, H.; Shim, H.S.; Lee, J.M.; Han, J.; Hur, D.H. Simulation of Porous Magnetite Deposits on Steam Generator Tubes in Circulating Water at 270 °C. Crystals 2020, 10, 729. [Google Scholar]
  34. Shuai, M.R.; Chang, B.B.; Zhang, M.; Chu, Z.B.; Li, H.B.; Li, L.; Zhou, L. Study on the High-Temperature Deformation and Dynamic Recrystallization Behavior near the Interface of Stainless Steel Cladding. Crystals 2022, 12, 81. [Google Scholar] [CrossRef]
  35. Manzari, M.T. An explicit finite element algorithm for convection heat transfer problems. Int. J. Numer. Method H 1999, 9, 860–877. [Google Scholar] [CrossRef]
  36. Altoum, S.H.; Ettaieb, A.; Rguigui, H. Generalized Bernoulli Wick differential equation. Infin. Dimens. Anal. Quantum Probab. Relat. Top. 2021, 24, 2150001. [Google Scholar] [CrossRef]
Figure 1. (a) Schematic diagram of the experimental system used in the present work. (b) Schematic diagram of the flow cell enclosing the micro-orifice test piece. (c) Schematic diagram of 304 SS disc with a micro-orifice of 300 μm in diameter in the center.
Crystals 12 00749 g001
Figure 2. (a) Surface morphology of the micro-orifice before test observed by OM (b) Surface morphology of the micro-orifice observed by OM after 500 h of the test at 290 °C. The lines in the figure show the counterline of the micro-orifice before and after the test.
Crystals 12 00749 g002
Figure 3. The geometry of the micro-orifice after 500 h of immersion at 290 °C. (a) The three-dimensional shape of the micro-orifice. (b) The depth profile of the line shown in (a).
Crystals 12 00749 g003
Figure 4. (a) The surface morphology of the micro-orifice observed by SEM after 500 h of immersion at 290 °C. (bd) The magnified surface morphology indicted respectively in the rectangle regions I, II, and III; in the (a). A composition of the point in (d) was analyzed by EDS.
Crystals 12 00749 g004
Figure 5. Raman spectrum of the micro-orifice after 500 h of immersion at 290 °C (a) outside the range of BS and (b) in the range of BS.
Crystals 12 00749 g005
Figure 6. (a) The pressure evolution during the test. (b) The relationship between flow rate and radial build-up of the micro-orifice variation versus time.
Crystals 12 00749 g006
Figure 7. Cross-section morphology of different sputtering times of the micro-orifice after 500 h of immersion at 290 °C observed by FIB-SEM. (a) A small piece of deposit was cut and lifted out by FIB in the rectangle. (bi) The interval between each photo was 6 min.
Crystals 12 00749 g007
Figure 8. (a) TEM image of the cross-section of the micro-orifice after 500 h of immersion at 290 °C. (be) the mapping results of the cross-sectional elemental distribution of (a).
Crystals 12 00749 g008
Figure 9. (a) TEM image of local magnification of the position of the right rectangle in Figure 8a. (b) TEM image of local magnification of the particle ③ in (a). (c) HRTEM image of the interface between particle ② and particle ③ in (b). (d) HRTEM image of the interface between particle ② and particle ④ in (b). (e) The FFT patterns of locations IV are marked by the rectangle in (d). (fh) The FFT pattern of locations I, II, and III is marked by the rectangle in (c).
Crystals 12 00749 g009
Figure 10. (a) TEM image of local magnification of the position of the left rectangle in Figure 8a. (b) TEM image of local magnification of the position of the red rectangle in (a). (c) HRTEM image of the interface between particle ⑤ and particle ⑥ in (b). (d,e) The FFT patterns of locations I and II marked by the rectangle in (c).
Crystals 12 00749 g010
Figure 11. Schematic of the growth process of the clogging behavior formed on 304 SS disc with a micro-orifice of 300 μm in diameter drilled in the center. (a) Ionic dissolution stage. (b) stable deposition stage (c) dynamic equilibrium stage.
Crystals 12 00749 g011
Table 1. Chemical composition of the 304 SS used in this work (wt.%).
CrMnNiSiSPCFe
1828.50.070.0150.0350.75Balance
Table 2. The content of cations in the aqueous solution in this work (ppb).
Time/hFe/ppbCr/ppbNi/ppb
50018125
Table 3. EDS point analysis in Figure 4d (wt.%).
ElementPoint
O33.84
Cr0.13
Fe64.87
Ni0.07
Table 4. Mass percentages of the different four elements in Figure 8 (wt.%).
ElementPoint
O23.86
Cr0.25
Fe75.48
Ni0.41
Publisher’s Note: MDPI stays neutral with regard to jurisdictional claims in published maps and institutional affiliations.

