Article

Effect of Cooling Rate on Nano-Eutectic Formation in Laser Surface Remelted and Rare Earth Modified Hypereutectic Al-20Si Alloys

1
Department of Mechanical Engineering, University of Michigan, Ann Arbor, MI 48109, USA
2
Department of Materials Science and Engineering, University of Michigan, Ann Arbor, MI 48109, USA
3
Department of Mechanical Engineering, University of Nebraska, Lincoln, NE 68588, USA
*
Author to whom correspondence should be addressed.
Submission received: 22 April 2022 / Revised: 19 May 2022 / Accepted: 21 May 2022 / Published: 23 May 2022
(This article belongs to the Section Crystalline Metals and Alloys)

Abstract

:
Laser Surface Remelting (LSR) was applied to arc-melted Al-20Si-0.2Sr, Al-20Si-0.2Ce, and Al-20Si hypereutectic alloys to refine microstructures. Experiments revealed that microstructures in the melt pool varied from fully eutectic to a mixture of Al dendrites and inter-dendritic eutectic. We calculated cooling rates using the Eagar-Tsai model and correlated cooling rates with characteristic microstructures, revealing that a cooling rate on the order of 104 K/s could lead to maximized fully eutectic microstructure morphology. Due to rapid solidification, the Si composition in the LSR eutectic was measured at 18.2 wt.%, higher than the equilibrium eutectic composition of 12.6 wt.%Si. Compared to Al-20Si, Ce addition had no significant effect on the volume fraction of the fully eutectic structure but refined Si fibers to approximately 30 nm in diameter. Sr addition did not further refine the diameter of eutectic Si fibers compared to Al-20Si but increased the volume fraction of the fully eutectic microstructure morphology. The refinement ratio (φ) of the Si fiber diameter from the bottom of the melt pool to the surface for the three alloys was similar, at around 28%. The established correlation between the cooling rate and the size and morphology of the microstructure within the melt pool will enable tailoring of the microstructure in laser-processed as well as deposited alloys for high strength and plasticity.

1. Introduction

Aluminum (Al) and Silicon (Si) are the second and third most abundant elements in the Earth’s crust [1]. Still, these elements lag behind steel in terms of production and use due to steel’s unmatched strength and cost-effectiveness. However, there has been an effort to switch from steels to Al alloys [2] for structural [3] and tribological applications [4]. The higher strength-to-weight ratio of Al-Si alloys makes it them good candidates for industries interested in lightweighting [5]. In addition, Al-Si alloys exhibit good weldability, castability, corrosion resistance, wear-resistance, high thermal conductivity [6], and Al-Si alloys promise good recyclability. To fully take advantage of the harder Si phase, more attention has been gradually moved from hypo-eutectic (<12.6 wt.% Si) to hyper-eutectic Al-Si alloys [7,8]. However, Si tends to nucleate as large flakes in hyper-eutectic Al-Si alloys, significantly increasing the propensity for crack formation. Therefore, methods to refine and control morphology and distribution of Si in Al-Si alloys are an area of active investigation.
Many ways have been developed to refine primary and eutectic Si particles. For conventional casting, refinement starts with stirring of the alloy melt, originally done mechanically and nowadays performed electromagnetically [9] or via ultrasonic treatment [10]. Chemical modification of the molten liquid has been examined to hinder Si segregation, by the addition of Na [11,12] and P [13,14]. Likewise, chemical modification by rare earth elements microalloying have been studied for Ce [15,16], Sr [5,17], Y [18,19], La [20], Eu [21,22], Yb [23] and Nd [24]. Chemical modification often leads to thermodynamically favorable phases other than primary Silicon, thereby reducing the degree of Si segregation. However, the excess addition of rare earth elements leads to the formation of intermetallic phases that can be detrimental to the ductility and toughness of the alloy [25]. Melt spinning [26], thin film deposition [27], and gas atomization [28] and friction stir spot processing [29], have also been used for micro to nanoscale research and applications for refined Si phases. Another method for Al-Si alloy refinement is laser surface remelting (LSR) [30,31,32]. The technique involves scanning a high-power laser across a polished surface. The laser quickly heats the surface of the alloy above the liquidus temperature, forming a shallow melt pool. Due to the high thermal conductivity of the Al alloy and fast laser scan speed, the trailing end of the melt pool solidifies with estimated cooling rates up to 106 K/s [33]. If excimer lasers are used, cooling rates estimated from measured cell spacing could be up to 109 K/s [34]. Cooling rates are dependent on many process parameters, such as laser power and laser scanning speed. There has been research on chemical, mechanical, and high energy beam (laser or electron beam) modifications as well as their combination [35].
Although LSR leads to microstructure refinement, the microstructure within the melt pool can vary from fully eutectic to hypoeutectic (mixture of primary Al dendrite and eutectic) with fine Si precipitates eventually forming in the Al dendrites [36]. In this work, the effect of LSR process parameters and rare earth elements, Cerium (Ce) and Strontium (Sr), on the microstructure in the melt pool of Al-20Si alloys was studied, in particular, to correlate the cooling rate with the microstructure, specifically with the volume fraction of the fully eutectic regions in the melt pool as well as the size of eutectic Si particles. This combinatory effect of LSR and rare earth element alloying of Ce or Sr has not been investigated in prior research, and not correlated quantitatively with the cooling rate. For LSR, the laser power was varied in a range that caused melting within a thin layer at the surface. The cooling rates for these experiments were estimated using the Eagar-Tsai model [37] with backward-fitting. A correlation between the cooling rate and the size and morphology (eutectic versus hypoeutectic) of the microstructure within the melt pool will enable tailoring of the microstructure in laser processed and printed alloys for high strength and plasticity.

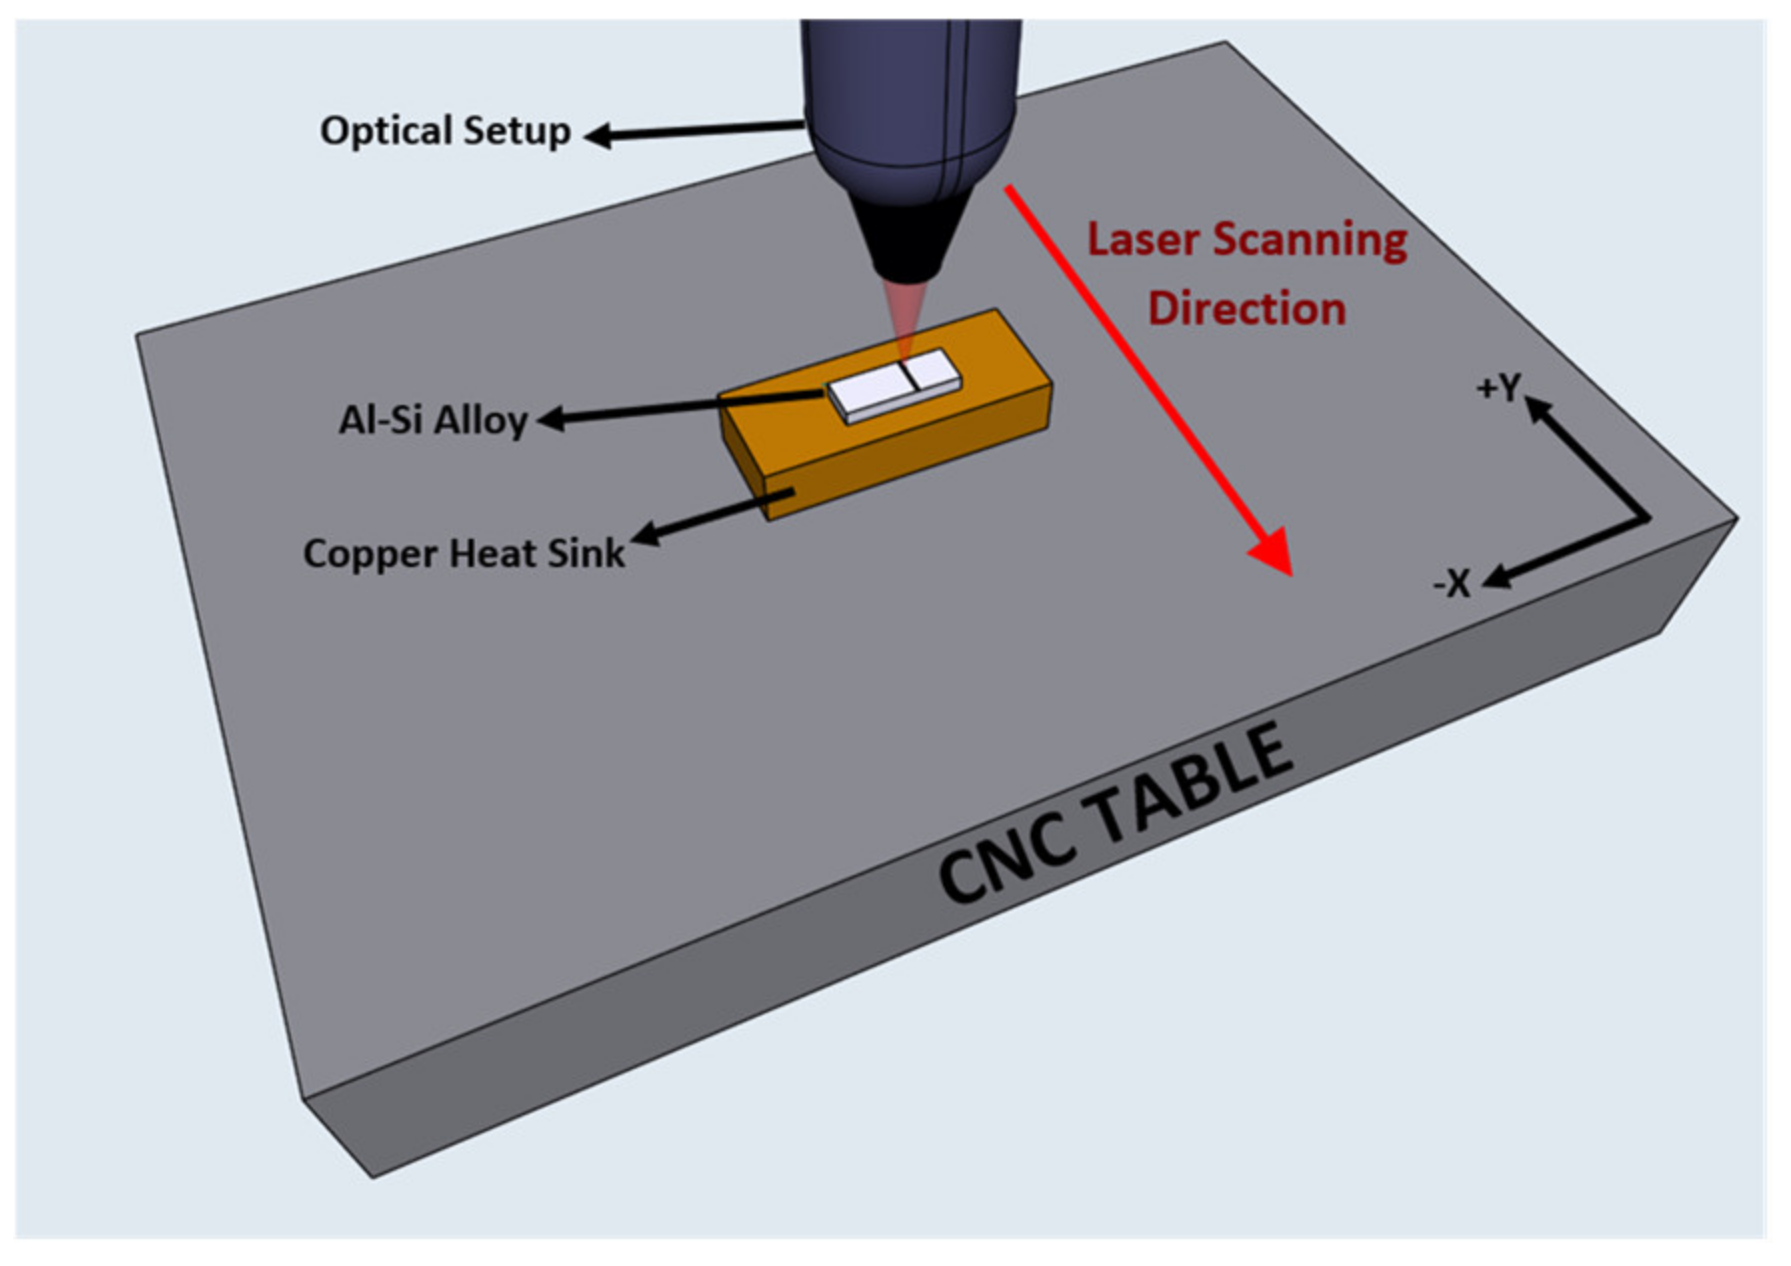
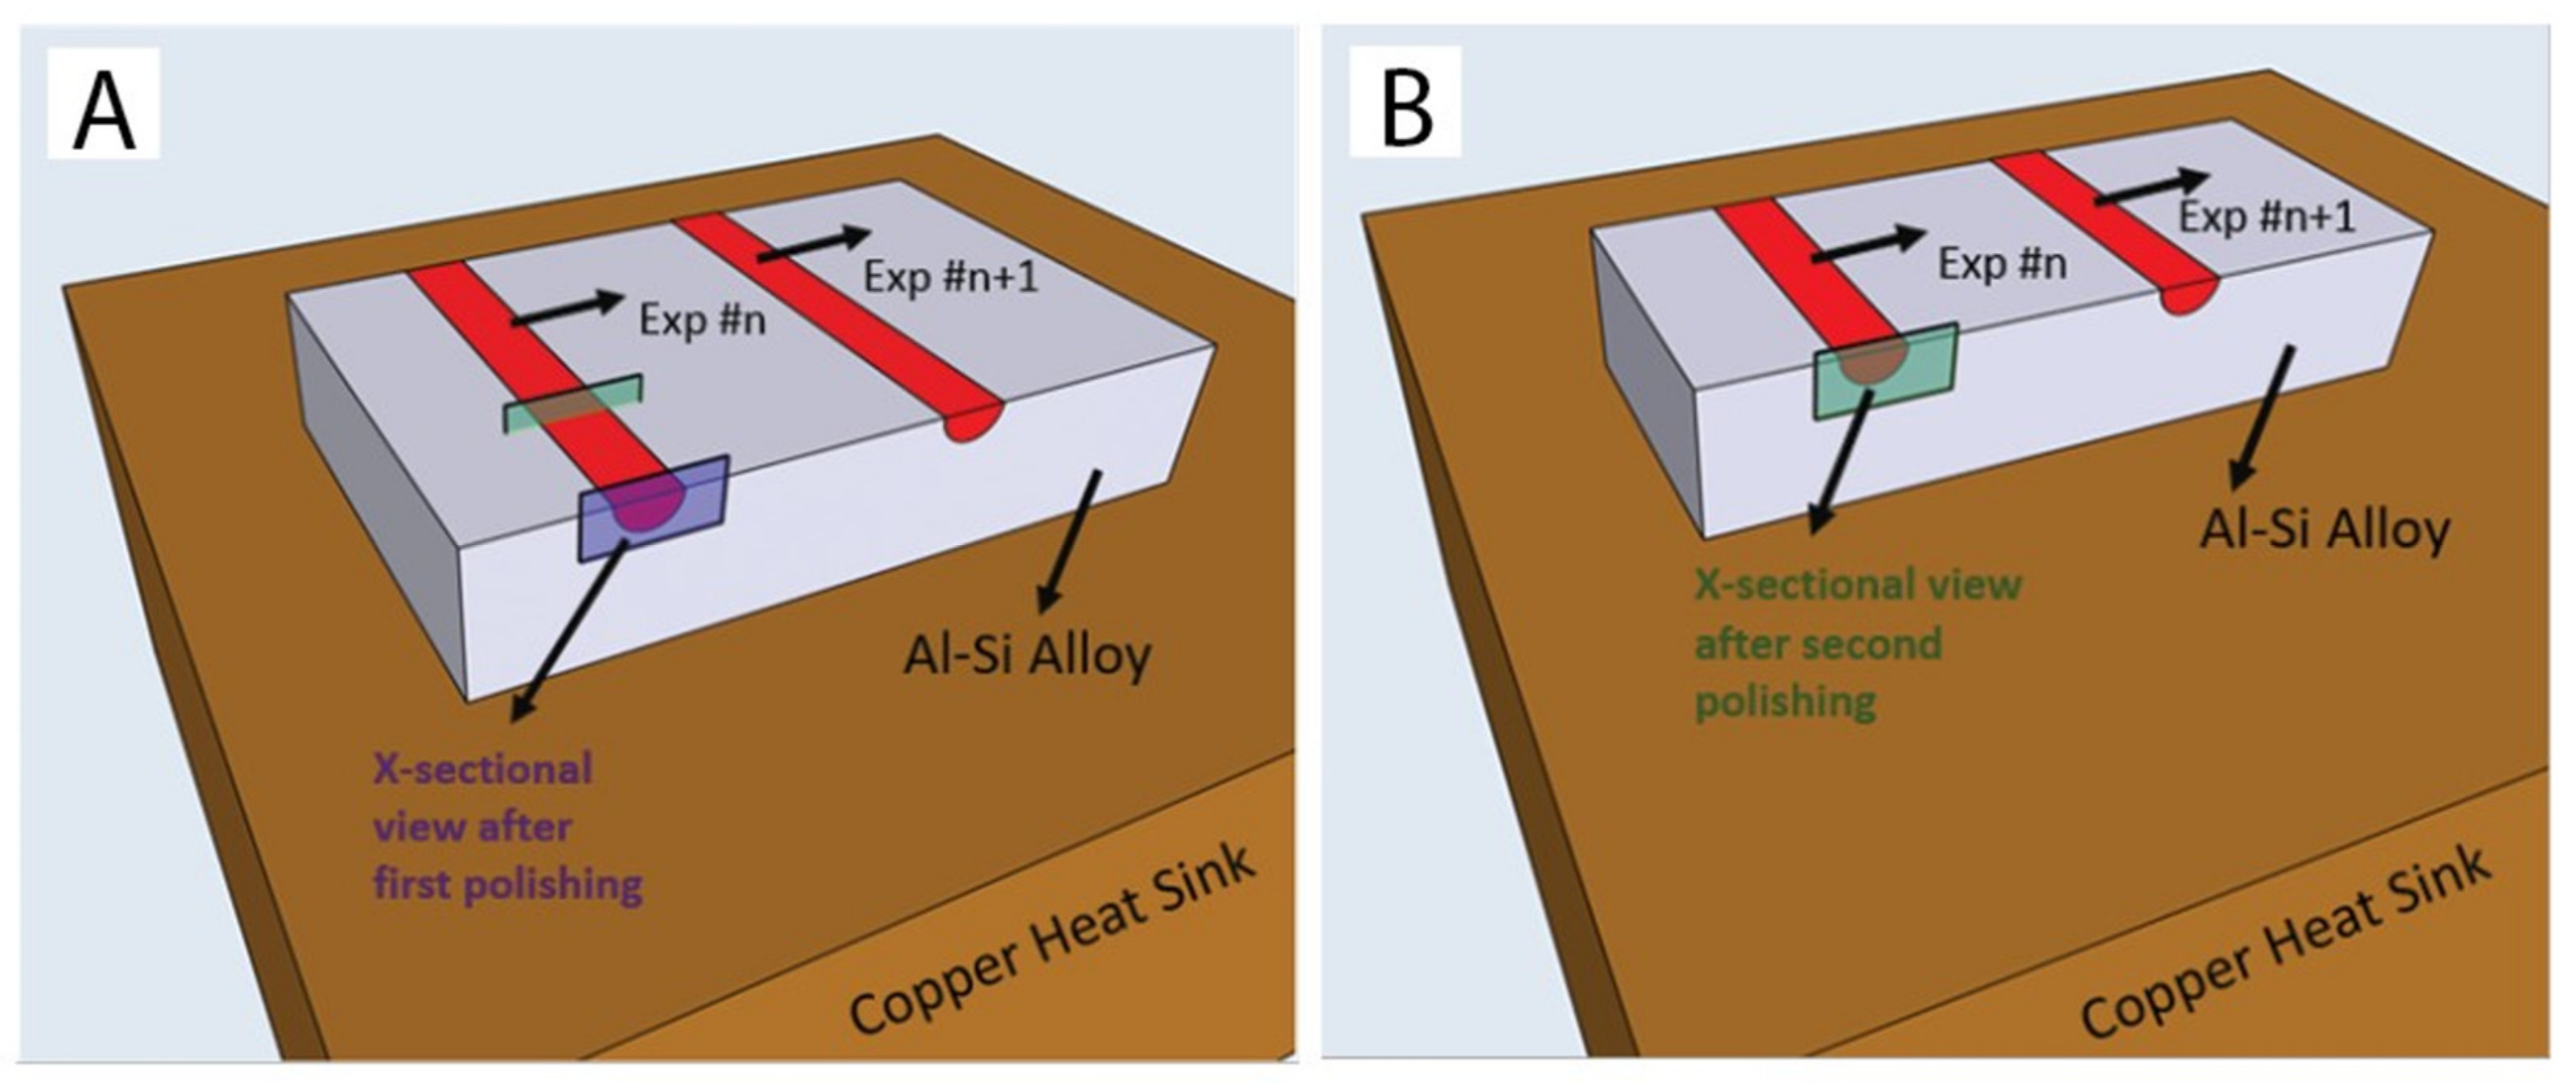
2. Materials and Methods

Arc-melted Al-20Si, Al-20Si-0.2 wt.% Sr, Al-20Si-0.2 wt.% Ce alloys were procured from the Materials Preparation Center, Ames National Lab. The compositions of as-received alloys were verified via energy dispersive X-ray spectroscopy (EDS) in a Scanning Electron Microscope (SEM). Small rectangular blocks, 4 mm thick and 20 mm long, were cut for LSR. The top and bottom surfaces of these blocks were polished to 3 μm surface roughness to ensure consistent melt pool geometry during LSR. The samples were affixed to a commercially pure copper heat sink with thermal paste (73 W/mK) to enhance the heat transfer rate. The top surfaces of the blocks were not coated with absorbent material in order to mitigate formation of extraneous phases and to make this approach leaner for future applications.
LSR parameters were selected to encompass a large range of power densities. For this reason, Taguchi’s method of experimental design was followed. With that, an easy comparison of analyzed outputs, such as area of fully eutectic regions, area fraction of fully eutectic regions relative to the whole melt pool, melt pool width, melt pool depth, and cooling rates of the processed material, were achieved. Laser beam diameter ranged from 0.4 mm to 2 mm, laser scan speed ranged from 25.4 mm/s to 177.8 mm/s and laser power was varied from 175 W to 3000 W (Figure 1). The lowest laser power just melts the surface of the samples while the highest laser power is close to the laser cutting threshold. The full list of LSR experimental parameters in Taguchi method format is shown in Table A1 in the Appendix A. As we had three alloys and eighteen sets of LSR parameters, a total of 54 samples were tested in the initial assay. The laser used in this study is a Trumpf HLD 4002 Disk laser (Yb:YAG) with 1030 nm wavelength.
Post LSR, the samples were polished and characterized using SEM (Tescan MIRA3) and EDS (TeamTM). SEM characterization was used to measure diameter and spacing of silicon fibers and measure corresponding microstructure morphologies within the melt pool. Figure 2 shows an example. Within the melt pool (Figure 2A), the SEM-observed microstructure can be primary Al + eutectic (Figure 2B) or fully eutectic with nano-fibrous Si (Figure 2C), even though the nominal composition corresponds to hyper-eutectic based on equilibrium phase diagram. Outside of the melt pool, the coarse Si flake eutectic morphology (Figure 2A,D) was observed with isolated primary Si particles. Though, for this study, refinements in the primary Si particles were not taken into account. Figure 2E,F schematically show the observed distributions of different microstructure morphologies. In an effort to correlate cooling rate with a given microstructure morphology, the area fraction of fully regular eutectic colonies in the melt pool was measured. For consistency, only the prominent fully regular eutectic colonies (arbitrarily defined as greater than 5 µm by 5 µm) were considered in the measurement of fully regular eutectic morphology fraction within the melt pool. In addition to the microstructure, compositions of specific areas were also collected via EDS (20 kV) after identification of the microstructures of interest.
After measuring and identifying the set of LSR parameters that yielded the highest fully eutectic area relative to the whole melt pool, the second set of samples was made to verify whether the results were representative and reproducible. The additional samples were also characterized in different cross-sections along the scanning path (shown schematically in Figure 3A,B) to examine whether the eutectic formation was stable and consistent along the entire path.

3. Results and Discussion

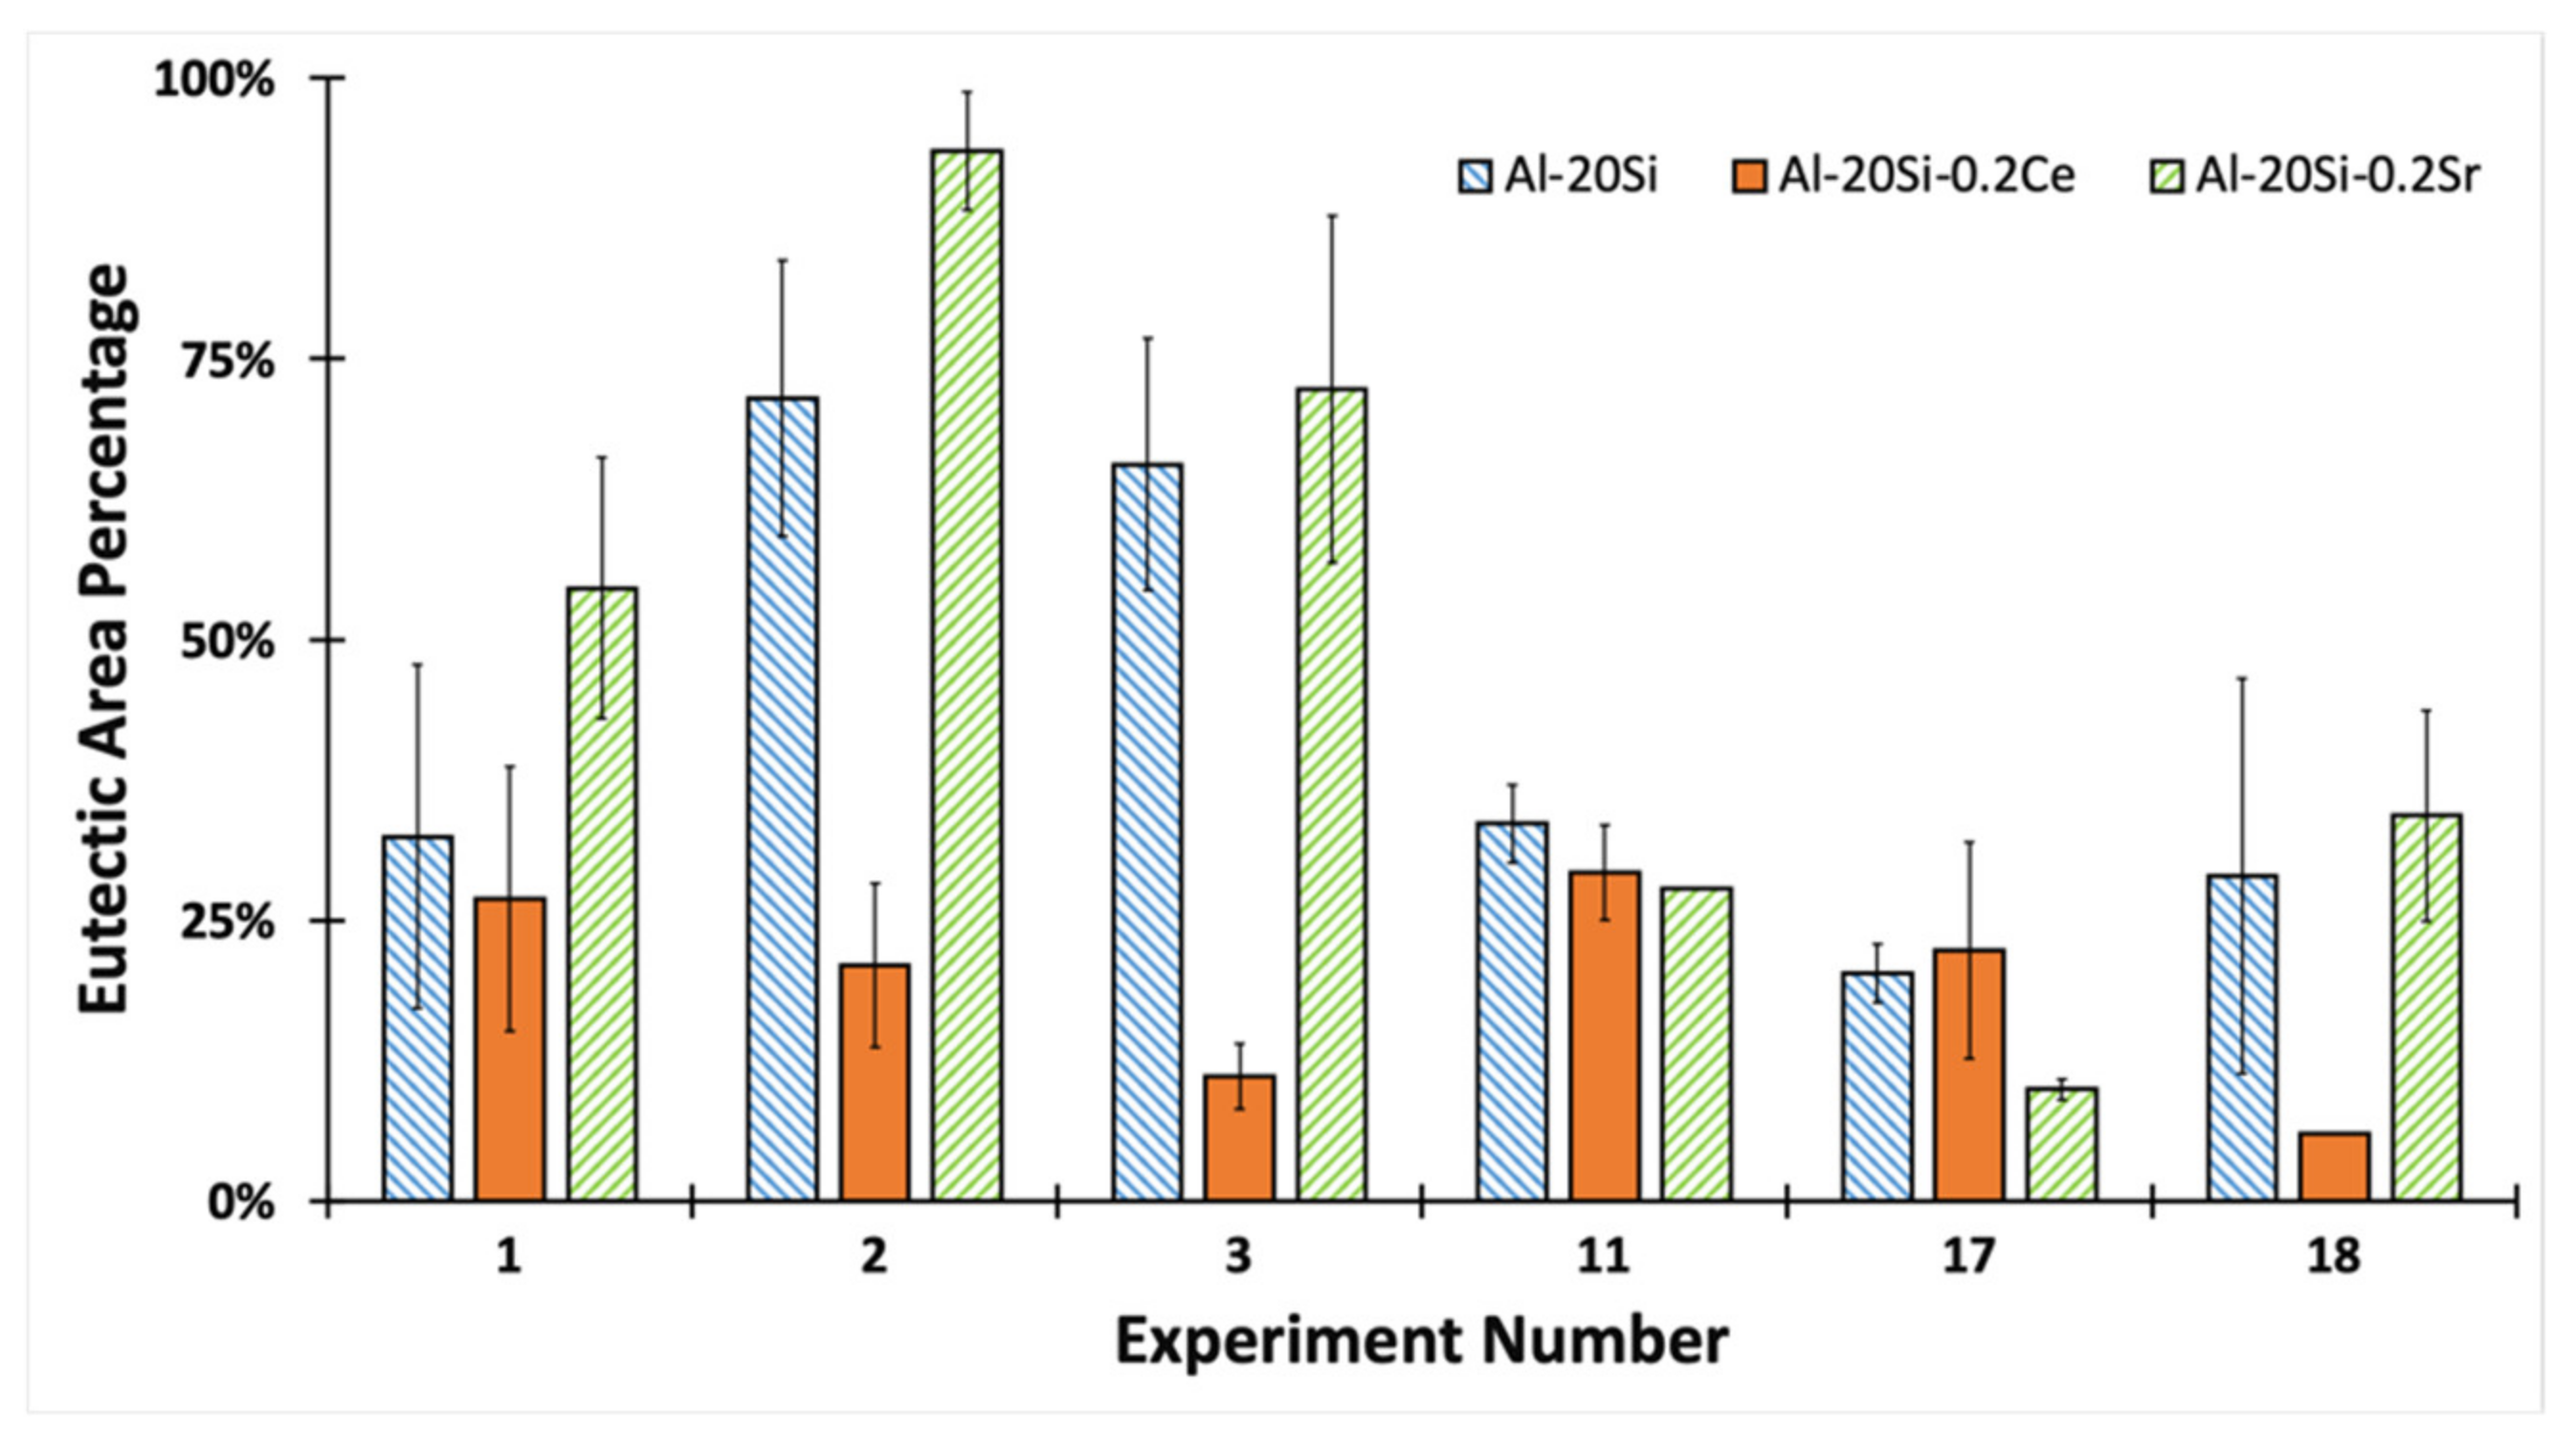
3.1. Eutectic Area within the Melt Pool

Table A2 in the Appendix A show the fully eutectic area percentages for all eighteen sets of LSR parameters for each Al-20Si alloy. Those results are summarized in Table 1 below. LSR parameter sets 1, 2, 3, 11, 17, and 18 were identified as those with the highest eutectic area percentages. Those experiments were then repeated three additional times with each sample sectioned and characterized two times. This resulted in 6 additional characterizations per Al-20Si alloy for each repeated LSR parameter set. The results of these additional characterizations as well as the originals are displayed in Figure 4.
As can be seen in Figure 4, Ce addition on average resulted in a lower amount of eutectic area formation compared to Al-20Si and Al-20Si-0.2Sr. SEM characterization of the Al-20Si-0.2Ce samples showed an abundance of Al dendrites and implies that Ce micro-alloying enhances the extent of hypo-eutectic microstructure in the hyper-eutectic composition alloy (Figure 5). Therefore, a future study of Al-Si-0.2Ce alloys with higher Si content could prove fruitful.
The EDS measurement of LSR parameter set 1 applied to Al-20Si showed approximately 18.2 wt.% Si within the eutectic region at the peripheral of the melt pool; 15.9% Si for Al-20Si-0.2Ce and 17.5% for Al-20Si-0.1Sr. Under equilibrium cooling conditions, the Al-Si eutectic structure should be 12.6 wt.% Si. The measured Si concentration in the eutectic structure, which is above the equilibrium level for all regions subjected to LSR, indicates that the cooling rates achieved by LSR led to substantial coupled zone growth driven by large undercooling [38]. As such, LSR allows for the synthesis of Al-Si eutectic structures supersaturated in Si and beyond that achievable by conventional means. For Figure 4, while the 11th, 17th, and 18th LSR parameter set experiments showed lower eutectic area formation compared to that of the 1st, 2nd, and 3rd, this was due to the former being processed with larger beam diameters (see Table A2 in the Appendix A).

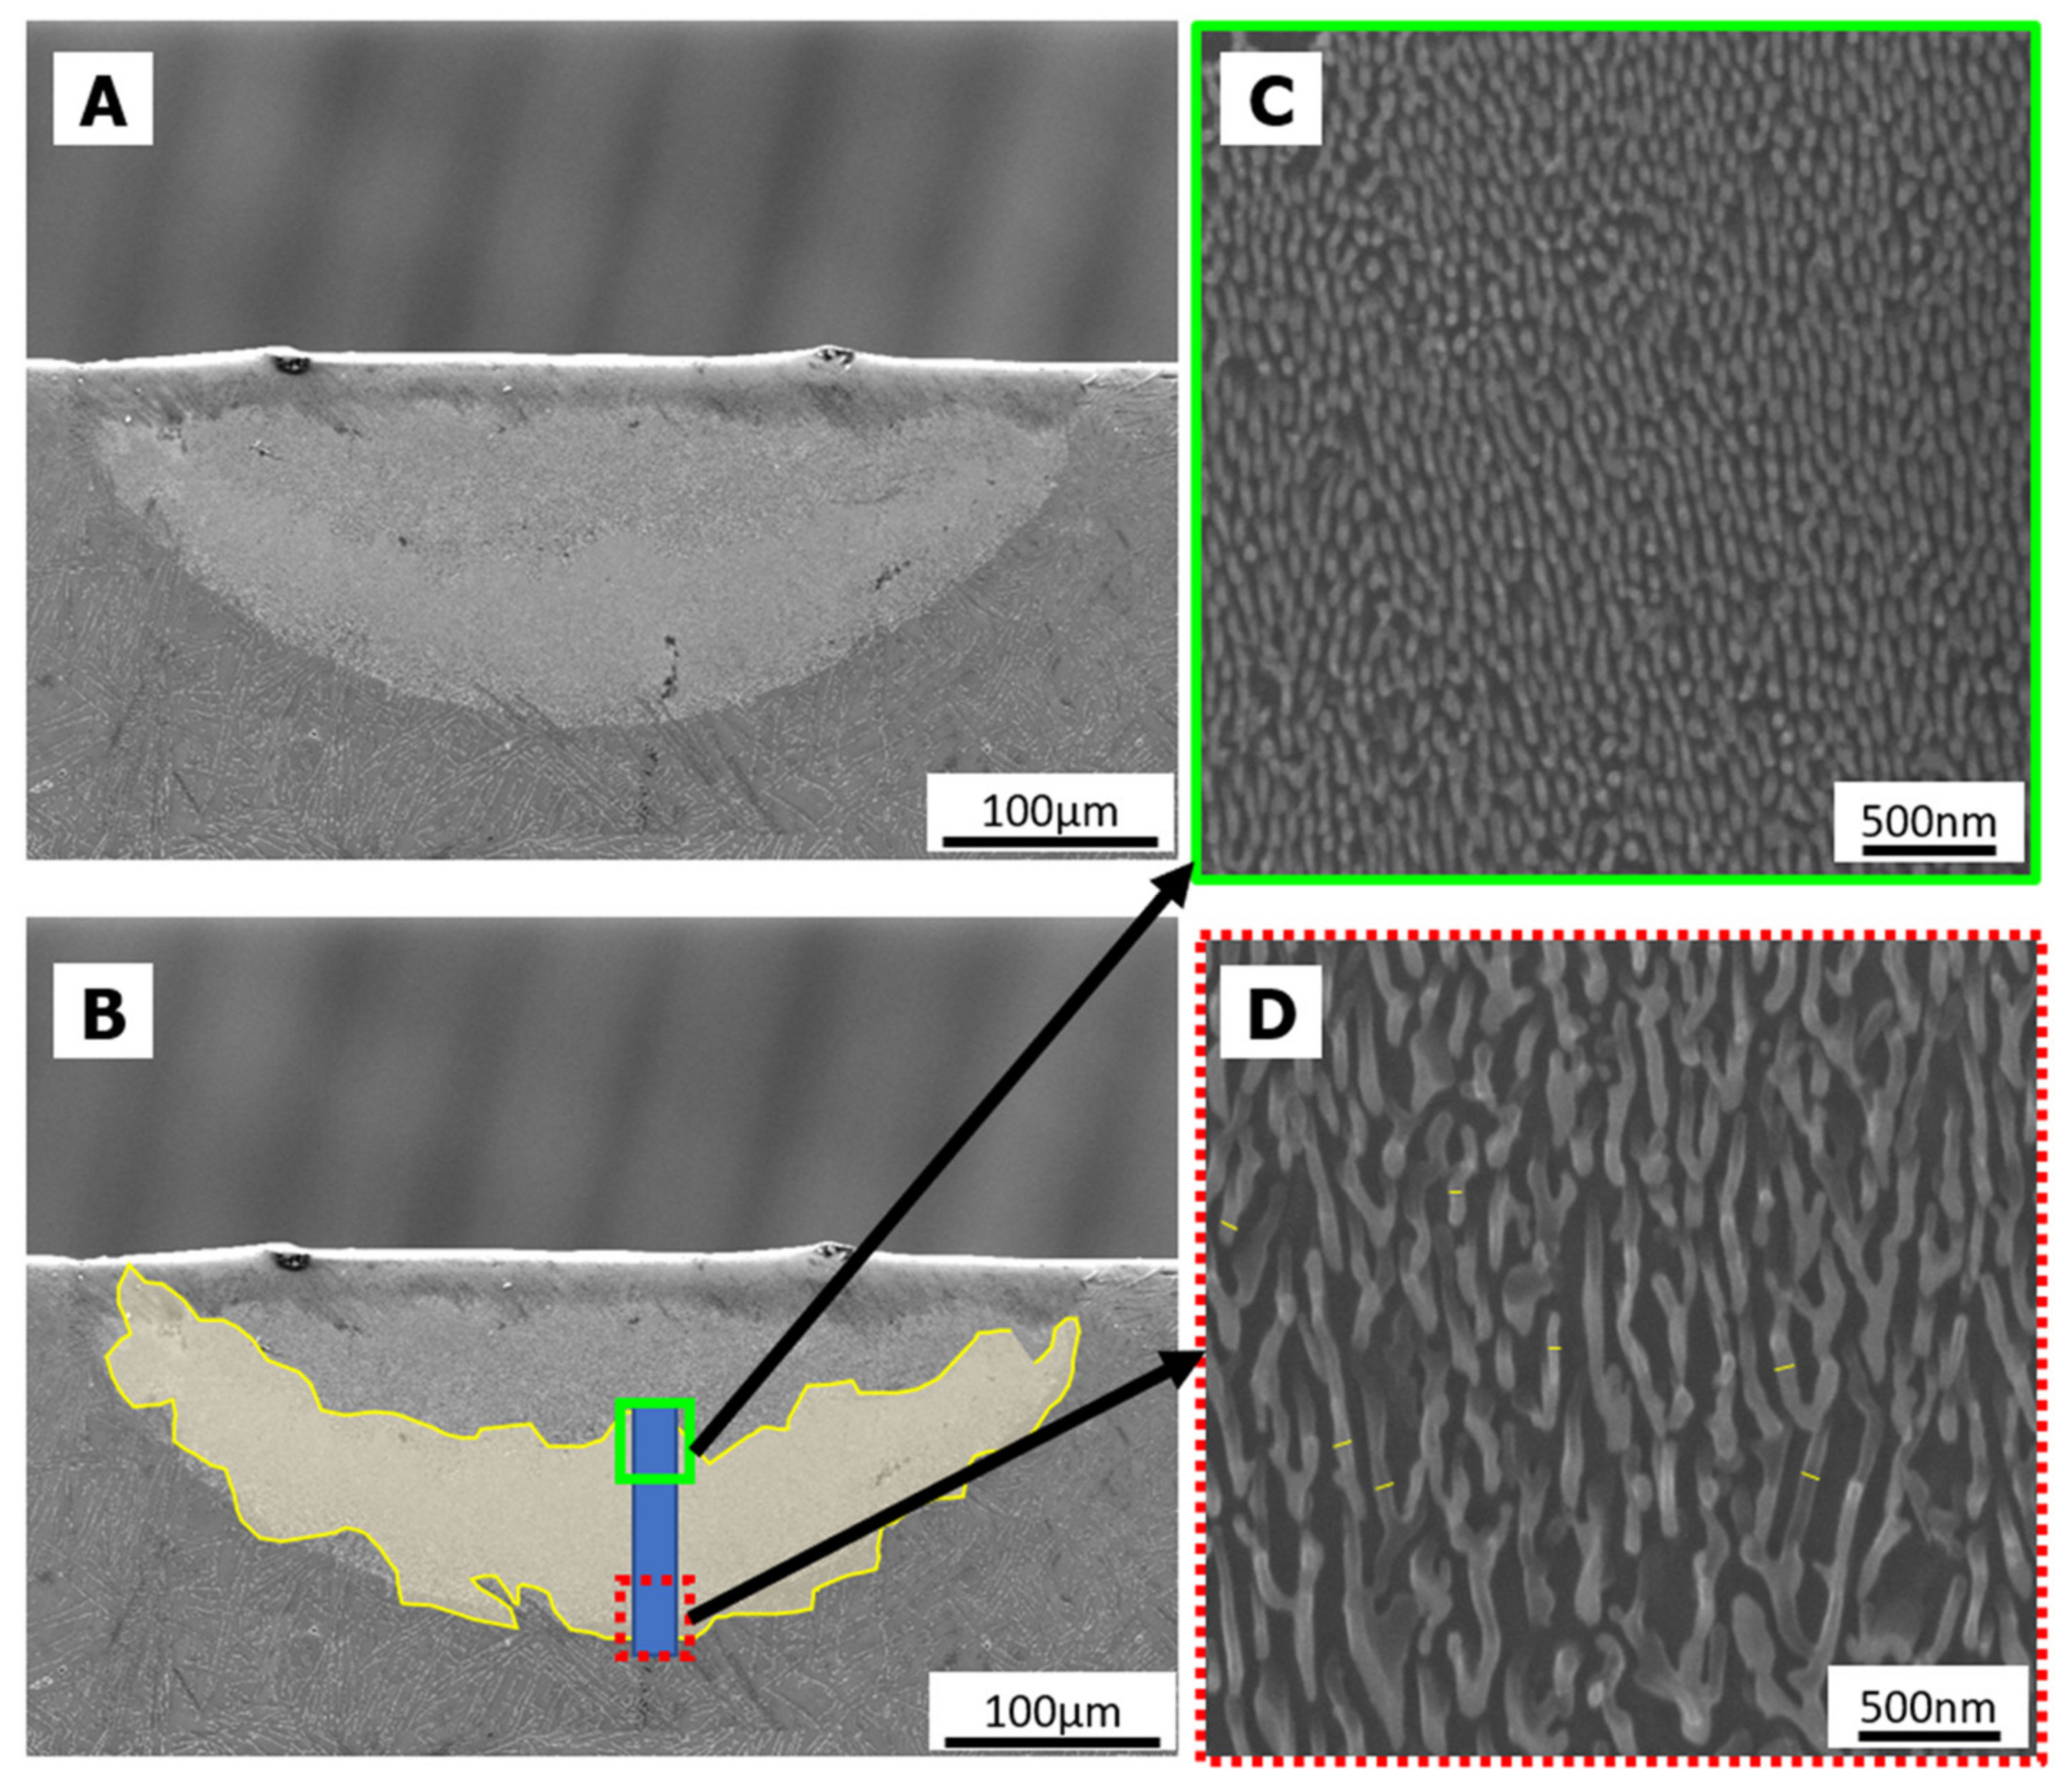
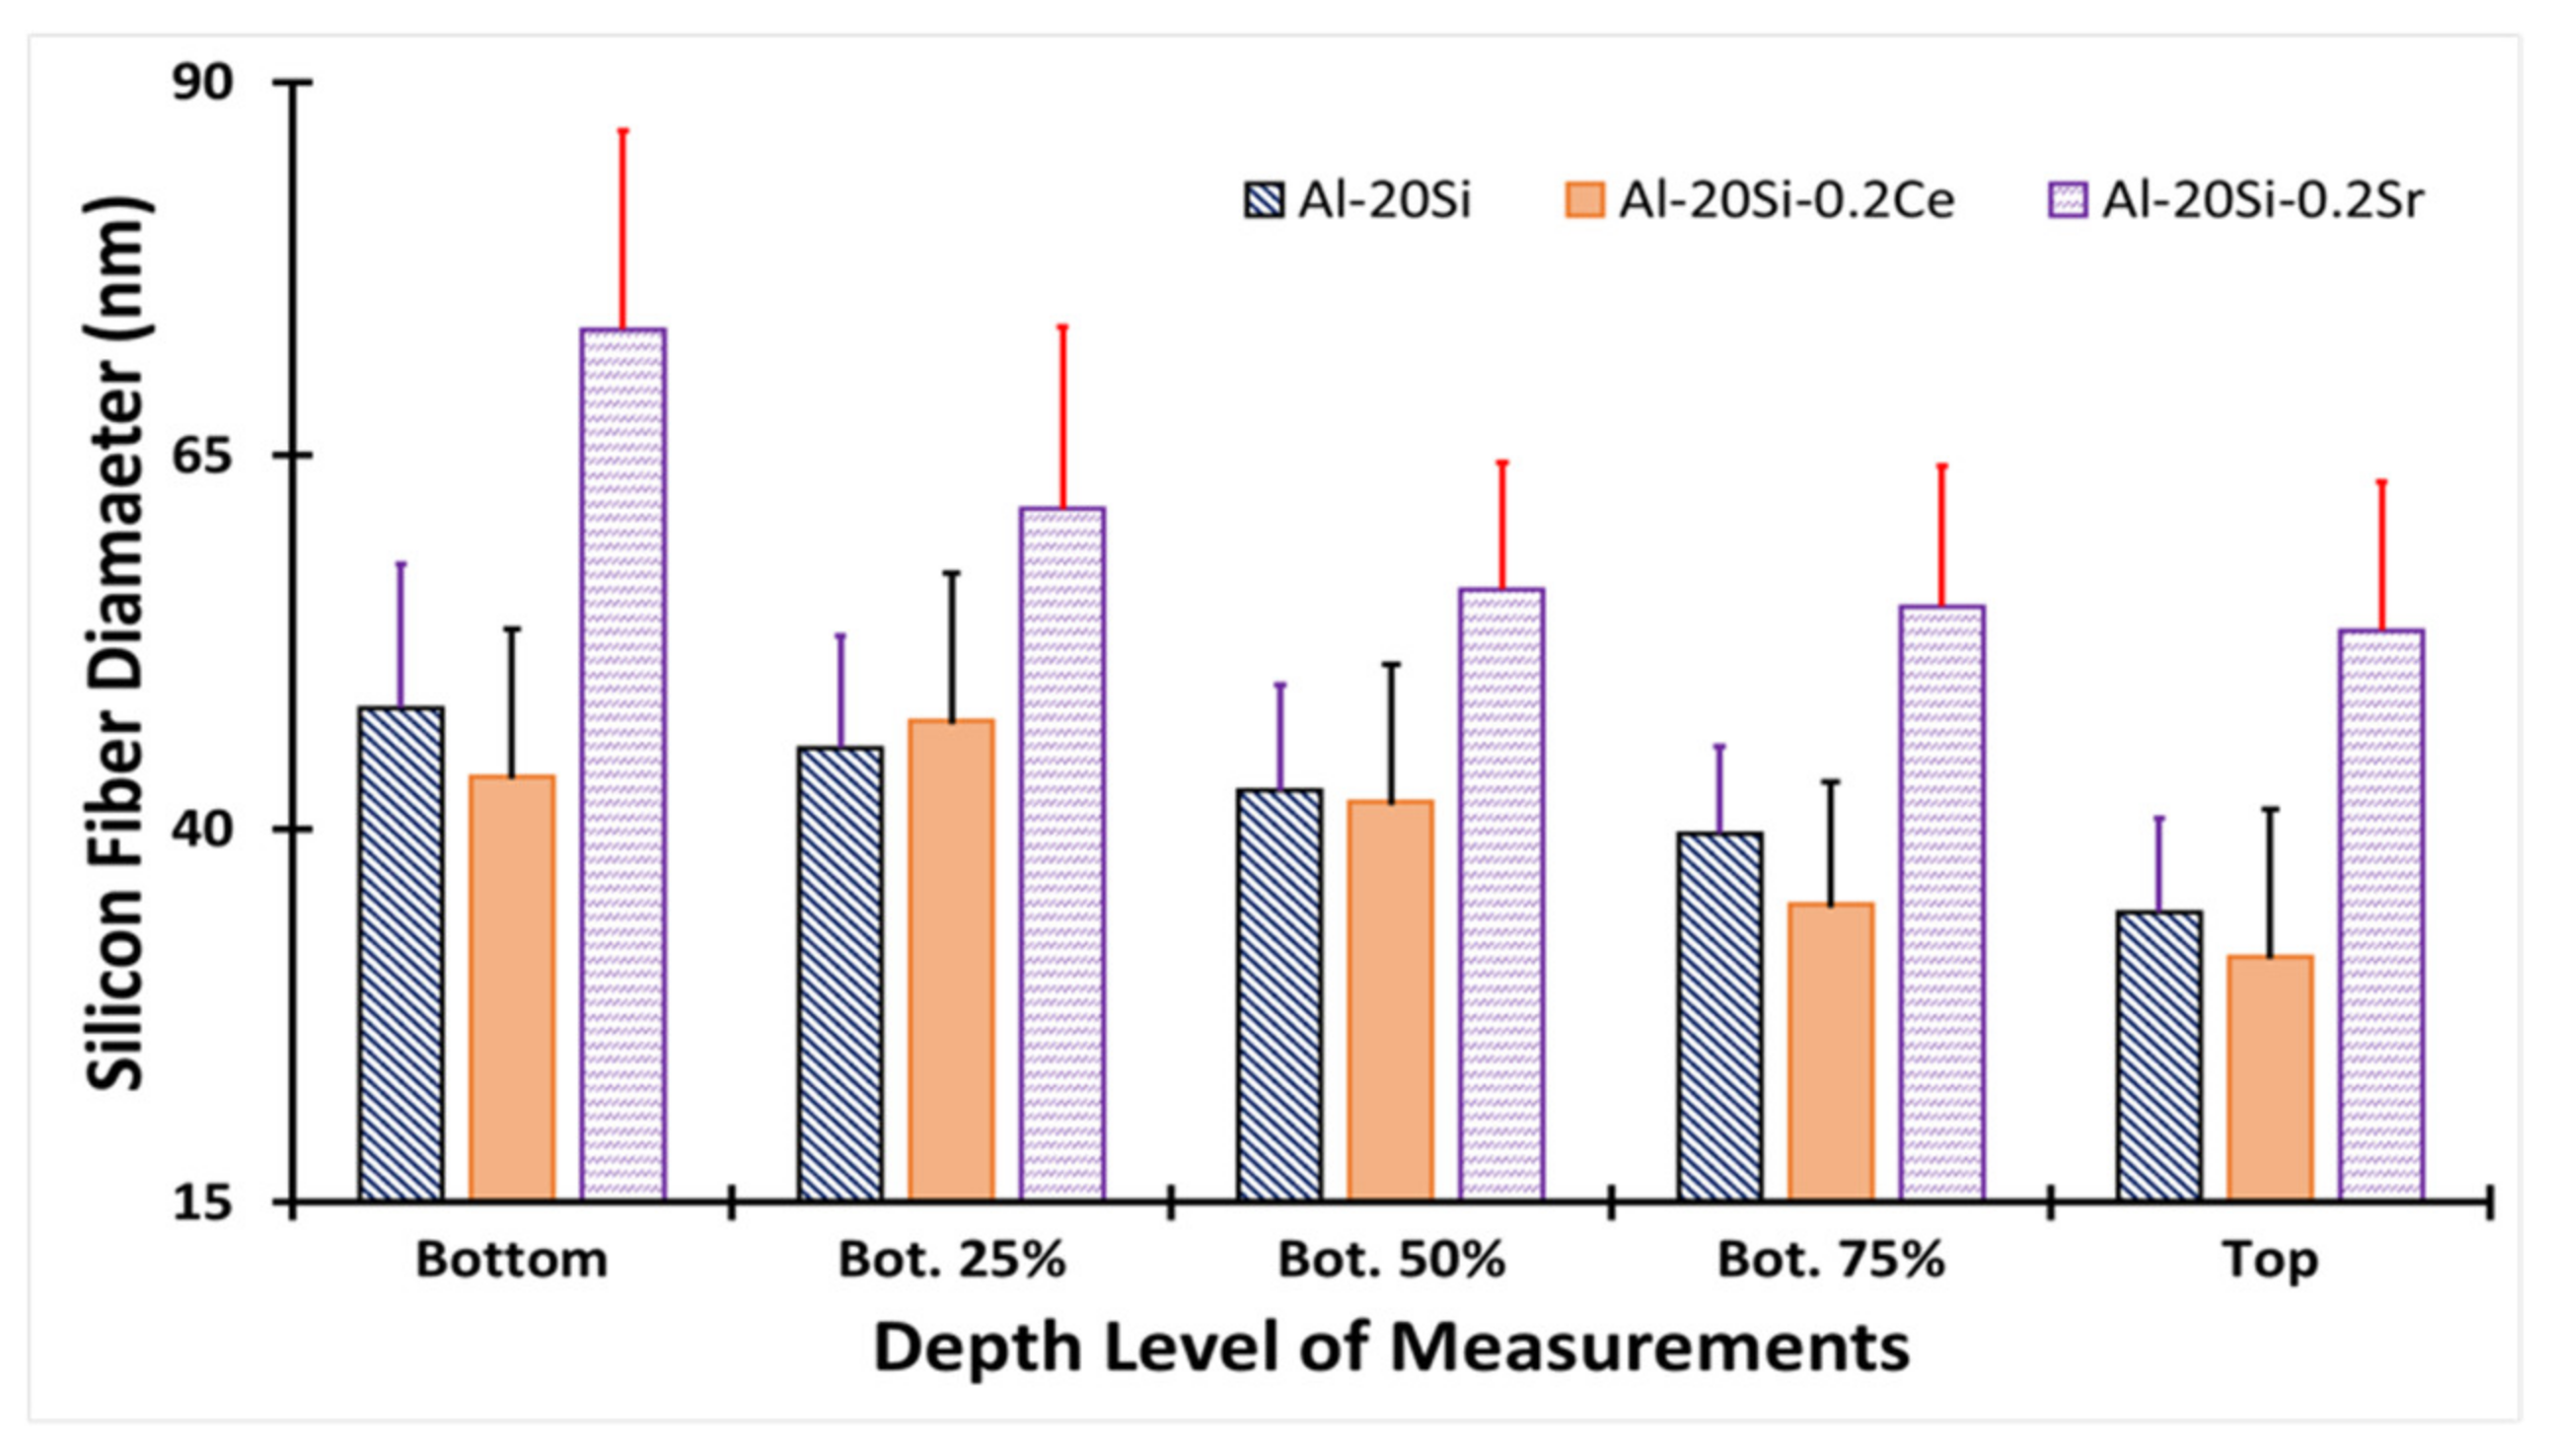
3.2. Silicon Fiber Refinement within the Melt Pool

Every sample was characterized by SEM to quantify Si fibers within the eutectic regions. First, cross-sectional cuts of the scanned lines for all alloys were prepared for SEM. Upon detection of contiguous (Figure 2E, rather than Figure 2F) and large (view field greater than 5 μm by 5 μm) eutectic area, five SEM captures, in equal spacing between top and bottom of the area, were taken and measured for constituent microstructures. At least 100 measurements of the diameter and the spacing of Si fibers were performed per image using ImageJ [39]. The diameter and spacing of Si fibers were measured with cylindrical projection in mind (Figure 6D).
Measurements follow the linear intercept method with cylindrical projection. To further validate the microstructure size, the cross-sectional melt pool was processed with a focused ion beam (FIB), as chemical etching on the surface could alter the microstructure and potentially introduce errors into the measurements. The FIB etched surface was then inspected under high-resolution SEM (Helios 650) with a confocal lens. The FIB was applied to a eutectic region at the bottom of the melt pool of experiment #1. The regional measurements showed a similar result for Al-20Si (Figure 7), so it is assumed to be consistent with the linear intercept method.
To evaluate the influence of Sr and Ce addition on the microstructure, a side-by-side comparison of eutectic silicon fibers is shown in Figure 8. The general trend in three alloys is that microstructure coarsened descending from the top surface of the melt pool and was consistent with previous observations [36,40]. This observation proved that this trend is also valid for regular eutectic formations. Surprisingly, the Al-20Si-0.2Ce alloys had lower eutectic volume fractions but improved silicon fiber refinement compared to Al-20Si-0.2Sr and Al-20Si.
Rare earth element addition to the Al-Si binary system has long been an area of investigation. Still, the mechanism behind the micro-alloying of rare earth element modifications, namely refinement of Si phases and coupled zone transitions, has not been fully understood [41]. It can be speculated that, since the heat history within the melt pool is similar, the undercooling amounts caused by micro-alloying elements are different. The other modifying factor of micro-alloying is dispersed intermetallic nucleants. When it comes to the nucleants, atom probe tomography and high-resolution transmission electron microscopy characterization for these sets of experiments will likely enhance the understanding of non-equilibrium phase formation, whether it arises from grain boundary solute rejection due to undercooling or from the nucleants themselves.
The refinement level (φ), a quotient of measured average fiber size at the surface (λSurface) and at the bottom (λBottom) of the melt pool was found to be almost identical for all of the samples at 28%. In laser processing, heat flows outward from the center of the melt pool, while the solidification direction is normal to the melt pool interface pointing inwards towards the center [42]. The difference in the thermal history is thought to be the root cause of this refinement difference.
φ = 100 × 1 λ Surface λ Bottom

3.3. Cooling Rate in the Melt Pools

Application of LSR to samples on the order of a few centimeters long occurs in under a second. For that reason, it is often acceptable to use conduction-based heat transfer models or dendrite arm spacing models to analyze the thermal history in the remelted region [43]. Other comprehensive multi-physics models are too computationally expensive and less applicable due to their long run times, taking up to a couple days to complete.
Of the many conduction-based models available, Rosenthal’s approach has been studied extensively. However, it assumes the laser heat source is an infinitesimally small point. This introduces a major flaw: the temperature goes to infinity as the radius goes to zero (right under the laser beam). The Eagar-Tsai model, on the other hand, is an advanced derivation of the Rosenthal equation. The model accounts for thermal conduction but excludes interfacial energy change and convection (Equation (2)). While the list of symbols is provided in Table A3 in the Appendix A, a more detailed explanation can be found elsewhere [37]. The Eagar-Tsai approach assumes a Gaussian intensity profile for the laser beam, whereas the Rosenthal equation assumes a point source. Thus, the former more accurately estimates cooling rates. Thermo-physical properties of the Al-20Si alloys were assumed to be independent of temperature and calculated using the rule of mixtures for Al and Si. The rare earth alloying elements were excluded from those calculations. Therefore, the calculated cooling rates will be equal for the three different alloys when all other LSR parameters are held constant.
θ = n 2 π 0 v 2 t   2 a d τ × τ 0.5 τ + u 2 × e ξ 2 + ψ 2 + 2 ξ τ + τ 2 2 τ + 2 u 2 ζ 2 2 τ
Laser beam diameter and actual laser power output was measured manually. This affects the n and u terms in Equation (2) (q and σ term in the more generic form, respectively). In order to fit these parameters exactly, the depth and width of the melt pool were obtained via SEM captures. Additionally, melt pool depth and width might vary within the laser entrance and exit regions due to lack of conduction bodies (Figure 9). Therefore, those regions will not be considered when fitting the Eagar-Tsai approach. The coefficient of variant for these width and depth ratios were found to be around three to five percent, implying a very accurate parameter. Adjustment of n and u terms were performed until simulated melt pool dimensions matched that of SEM captures. Upon completion of model fitting, the temperature profile was assumed to be representative of experiments and could be used for calculating cooling rates.
Solutions to Equation (2) require numerical integration across a discretized domain with a uniform grid spacing of 50 µm. We set our domain to be 2 mm by 1 mm (yz cross section) with the laser scanning along the x-axis. Thermophysical properties can be found elsewhere [44]. As the Eagar-Tsai approach can solve for the current temperature profile of our 2D cross-section at any arbitrary time post t = 0 s, we selected t = 2 s as our calculation start time. This calculation start time was chosen such that for the three tested laser scan speeds, a steady-state melt pool would have developed. At t = 2 s, we selected a 2D yz cross section such that the center point of the laser lay on the chosen plane. The temperature profile was then solved across 10 timesteps of 0.01 ms each. Once the temperature history was solved, cooling rates could be calculated from the difference in calculated temperatures across a given timestep. Equation (3) calculates the cooling rate and Table 2 show the cooling rates for LSR parameter sets 1, 2, 3, 6, 9, 11, 13, 15, 17 and 187.
d T d t n = T n T n 1 t n t n 1
Figure 10 suggests that there exists an optimal cooling rate for achieving above average eutectic area formation within the melt pool of the order of 104 K/s. Cooling rates above and below this optimal value resulted in smaller eutectic area formation and higher standard deviations. In future studies, this information may be used to guide LSR of Al-Si alloys targeting specific eutectic area percentage for selected mechanical properties. Cooling rate by itself falls short in explaining why the eutectic area formation percentage differs. Therefore, we inspected in detail the effect of the following kinetic variables: G (thermal gradient), V (solidification velocity) and ΔT (undercooling). Hearn et al. demonstrated that the thermal gradient can be calculated if the cooling rate and solidification velocity are known [45]. Cooling rate may be calculated with Equation (2). Calculations using the aforementioned model on eutectic microstructure grain size from our LSR experiments yielded solidification velocities, generally within 10% of their respective laser scan speeds. At high cooling rates, the solidification velocity can approach but never exceed the laser scan speed; therefore, we substituted the laser scan speed for the solidification velocity in calculating G. G was then calculated via Equation (4):
C R   K s = V   m s × G   K m
Undercooling occurs due to the nucleation energy required for phase transformation. At higher undercoolings, the large deviation from the equilibrium phase transformation temperature can change the resulting microstructure. Khan and Elliott studied the effect of undercooling on the growth mode of Si and identified a certain threshold for the transition from equilibrium-faceted growth to non-equilibrium fibrous or globular growth [46]. The kinetically modified undercooling in this study, ΔTk, was calculated using Equation (5). The results are listed in Table 3 and shown in Figure 11, respectively:
Δ T k = 0.67 × V 0.5   μ m s × G 0.2 K c m
Pierantoni et al. performed numerous LSR experiments on Al-Si alloys for a range of Si concentrations [38]. They corroborate our finding that solidification velocity approaches the laser scan speed at high cooling rates and that there exists a relation between the degree of undercooling and the different microstructure growth rates. In this study, many different heat cycles were tested to induce a variety of cooling rates and, by extension, different undercoolings. LSR experiments by Lien et al. at four laser scan speeds and their resulting metastable liquidus curve extensions are plotted on the Al-Si equilibrium phase diagram in their study [47]. As the degree of undercooling increased, favorable microstructure formation shifted from equiaxed primary Si + fibrous eutectic to fibrous eutectic, and finally to Al dendrites + interdendritic eutectic. Additionally, increased solidification velocities constrained fibrous eutectic formation to a narrow temperature range. This is in very good agreement with the calculated undercooling (Table 3). Thus, if higher eutectic area percentages are desired, the undercooling amount must be high enough to mitigate primary Si formation, but not so large that we exceed the fibrous eutectic to Al dendrite + interdendritic fine eutectic threshold. The ideal range of undercooling for obtaining high fibrous eutectic volume was calculated to be less than 20 K.

4. Conclusions

  • Microstructures in the melt pools in the laser surface remelted arc-cast hypereutectic Al-20Si, Al-20Si-0.2Sr and Al-20Si-0.2Ce alloys comprised of mixtures of fully eutectic and hypoeutectic (primary Al dendrites and inter-dendritic eutectic). Eutectic regions in LSR Al-20Si alloy contained approximately 18 wt.% Si, which is higher than the equilibrium eutectic composition.
  • The Si fibers in the eutectic microstructures of LSR Al-20Si alloys were reduced from a few microns in as-cast to less than 50 nanometers with rapid solidification and rare earth modification. Minimum average silicon fiber sizes in Al-20Si-0.2Ce were observed to be 35 ± 8 nm.
  • Si fibers in the regular eutectic structure were found to be more refined towards the top of the melt pool.
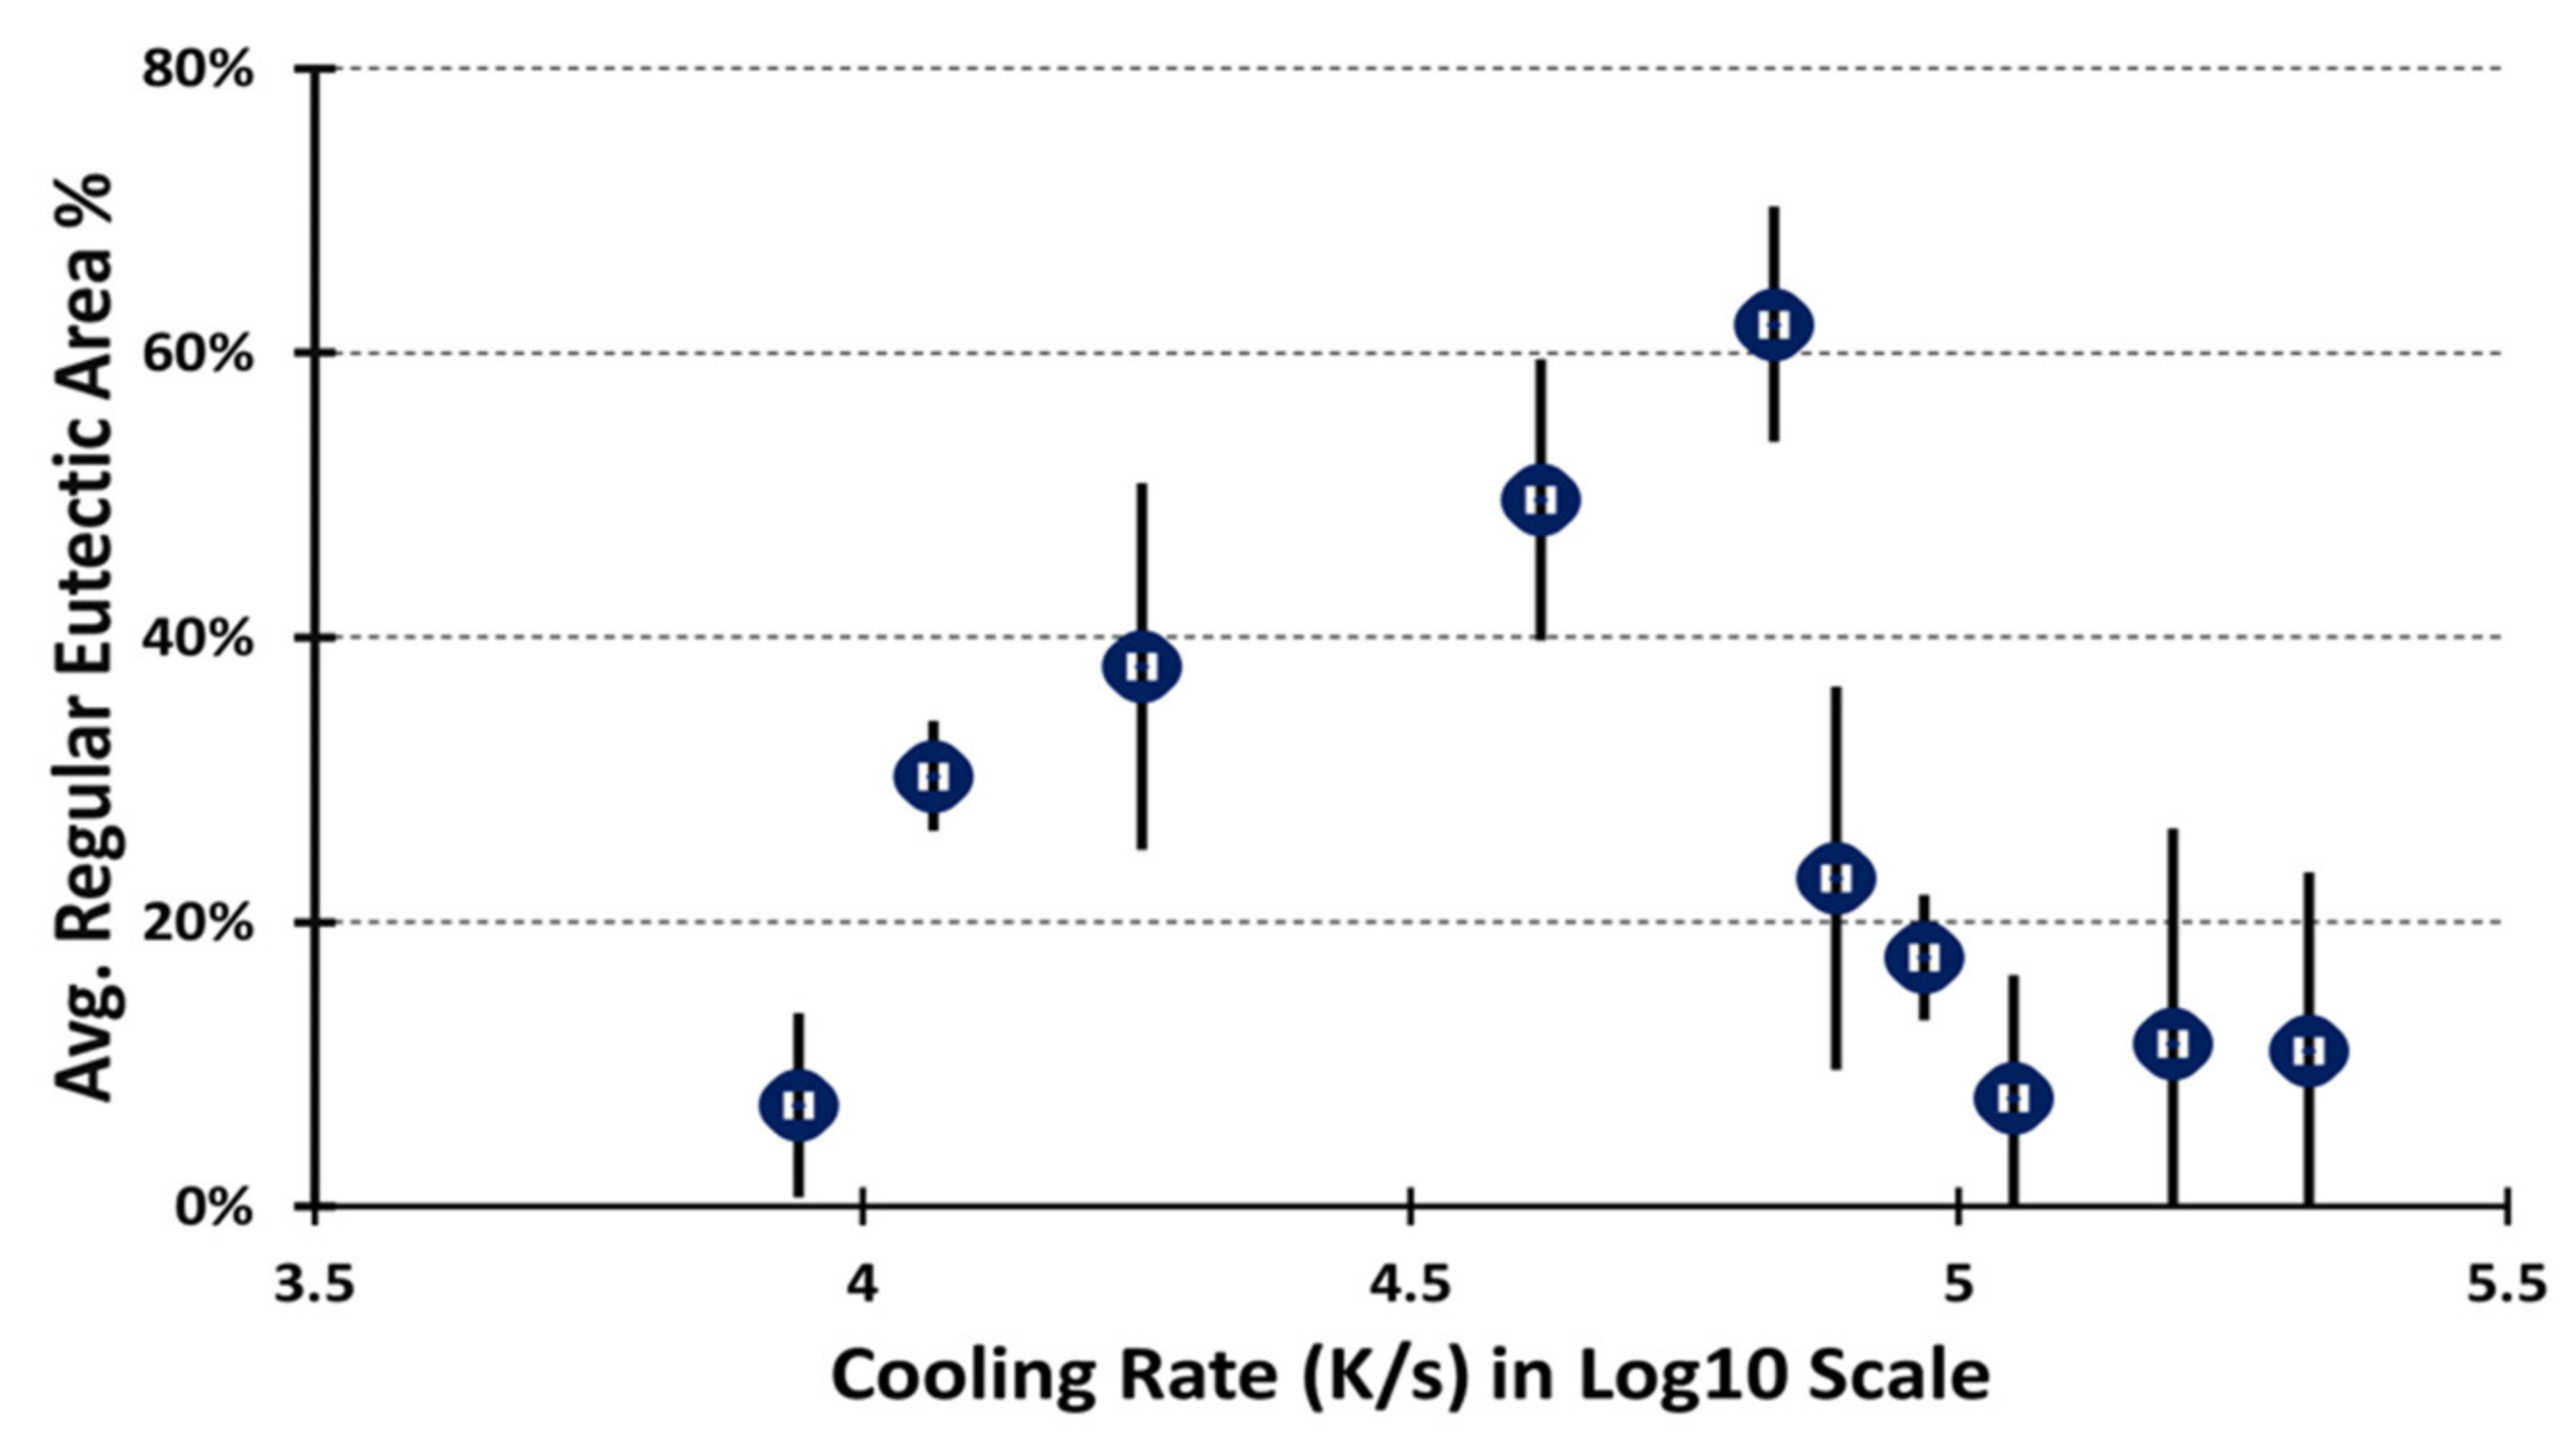
  • The volume fraction of the fully eutectic morphology in the melt pool depended on the cooling rate. Cooling rates for different experiments were calculated using the Eagar-Tsai approach and 104 K/s was found to be the optimal value to maximize the volume fraction of the fully eutectic morphology in the melt pool.
  • The average area percentage of fully eutectic colonies in the melt pool in the investigated Al-20Si, Al-20Si-0.2Sr and Al-20Si-0.2Ce alloys decreased from ≈60% to ≈10% with increasing undercooling, ΔT, from ≈10 K to ≈50 K.

Author Contributions

M.K.: Conceptualization, methodology, validation, formal analysis, writing—original draft, visualization. H.-H.L.: Formal Analysis. A.M.: supervision, project administration, funding acquisition, writing—review & editing. J.W.: writing—review & editing. J.M.: supervision. All authors have read and agreed to the published version of the manuscript.

Funding

This work is funded by DOE, Office of Science, Office of Basic Energy Sciences with the grant number of DE-SC0016808.

Data Availability Statement

Data in this study is available upon request.

Acknowledgments

Microscopy characterizations were performed at the Michigan Center for Materials Characterization, University of Michigan. The first author also would like to acknowledge partial fellowship support from Turkish Ministry of Education—Office of Overseas Education.

Conflicts of Interest

The authors report no declarations of interest.

Appendix A

Table A1. Laser Scanning Process Parameters.
Experiment
Number
Power
(W)
Scanning Speed
(mm/s)
Laser Beam Diameter
(mm)
1187.525.40.4
2375.025.40.4
3562.525.40.4
4187.5101.60.4
5375.0101.60.4
6562.5101.60.4
7187.5177.80.4
8375.0177.80.4
9562.5177.80.4
10750.025.42
111500.025.42
122250.025.42
13750.0101.62
141500.0101.62
152250.0101.62
16750.0177.82
171500.0177.82
182250.0177.82
Table A2. Eutectic formation for different experiment parameters.
Experiment
Number
Eutectic Formation of Al-20SiEutectic Formation of Al-20Si-0.2CeEutectic Formation of Al-20Si-0.2Sr
Total Area (in μm2)PercentageTotal Area (in μm2)PercentageTotal Area (in μm2)Percentage
13502.032.47%2983.526.91%11,269.554.58%
225,528.671.51%6777.521.00%50,978.193.50%
350,436.065.61%6814.311.11%85,823.772.33%
4301.02.97%206.41.98%304.91.82%
5682.32.42%0.00.00%5696.010.19%
62339.15.05%273.50.54%27,124.328.70%
71525.214.16%183.61.59%988.26.40%
82157.57.59%0.00.00%0.00.00%
910,707.524.72%0.00.00%6246.78.04%
1038,384.220.27%58,671.012.19%74,450.312.26%
11421,665.533.60%376,566.229.29%319,443.327.84%
12116,915.87.82%104,641.07.88%223,802.717.97%
131576.32.97%23,519.33.80%24,559.214.63%
14212,394.337.03%36,856.25.27%88,232.014.15%
15154,943.616.95%0.00.00%44,948.55.96%
160.00.00%31,319.87.54%0.00.00%
1792,172.620.27%264,627.022.32%42,871.29.95%
18218,353.028.97%41,944.96.05%248,621.534.33%
Table A3. List of the parameters and symbols for Equations.
SymbolExplanationNotes
aThermal diffusivity
CcSpecific heat
GGreen’s function
kThermal conductivity
nOperating parameters n = q v / 4   π a 2 ρ C T c T 0
qNet heat input per unit time(Power)
QPower distribution
Q*Heat source moving with v speed
RDistance to the center of arc R = w 2 + y 2 + z 2
R*Dimensionless distance from the center of the arc R * = ξ 2 + ψ 2 + ζ 2
TTemperature
T 0 Ambient temperature
T c Critical temperature
uDimensionless distribution parameter u = v σ / 2 a
vTravel speed of arc
wDistance in x direction in a moving coordinate of speed v w = x v t
yY distance
zZ distance
σ Distribution parameter for beam
ρ Density
δ Q Incremental amount of heat
τ Dimensionless time
θ Dimensionless temperature θ = T T 0 / T c T 0
ξ Dimensionless distance in the moving coordinate ξ = v w / 2 a
ψ dimensionless distance y
ζ dimensionless distance z
infinity

References

  1. Sjögren, B.; Iregren, A.; Montelius, J.; Yokel, R.A. Aluminum, 4th ed.; Elsevier: Amsterdam, The Netherlands, 2015; Volume 1. [Google Scholar] [CrossRef]
  2. Palazzo, J.; Geyer, R. Consequential life cycle assessment of automotive material substitution: Replacing steel with aluminum in production of north American vehicles. Environ. Impact Assess. Rev. 2019, 75, 47–58. [Google Scholar] [CrossRef]
  3. Kusuda, Y. Honda develops robotized FSW technology to weld steel and aluminum and applied it to a mass-production vehicle. Ind. Robot. Int. J. Robot. Res. Appl. 2013, 40, 208–212. [Google Scholar] [CrossRef]
  4. Gullino, A.; Matteis, P.; D’Aiuto, F. Review of aluminum-to-steel welding technologies for car-body applications. Metals 2019, 9, 315. [Google Scholar] [CrossRef] [Green Version]
  5. Dahle, A.; Nogita, K.; McDonald, S.; Dinnis, C.; Lu, L. Eutectic modification and microstructure development in Al-Si Alloys. Mater. Sci. Eng. A 2005, 413–414, 243–248. [Google Scholar] [CrossRef]
  6. Mondolfo, L. Al-Si Aluminum-Silicon system. In Aluminium Alloys; Butterworth & Co. Ltd.: London, UK, 1976; pp. 368–376. [Google Scholar] [CrossRef]
  7. Haghshenas, M.; Jamali, J. Assessment of circumferential cracks in hypereutectic Al-Si clutch housings. Case Stud. Eng. Fail. Anal. 2017, 8, 11–20. [Google Scholar] [CrossRef]
  8. Li, Q.; Xia, T.; Lan, Y.; Zhao, W.; Fan, L.; Li, P. Effect of rare earth cerium addition on the microstructure and tensile properties of hypereutectic Al–20%Si alloy. J. Alloys Compd. 2013, 562, 25–32. [Google Scholar] [CrossRef]
  9. Lu, D.; Jiang, Y.; Guan, G.; Zhou, R.; Li, Z.; Zhou, R. Refinement of primary Si in hypereutectic Al-Si alloy by electromagnetic stirring. J. Mater. Process. Technol. 2007, 189, 13–18. [Google Scholar] [CrossRef]
  10. Feng, H.; Yu, S.; Li, Y.; Gong, L. Effect of ultrasonic treatment on microstructures of hypereutectic Al-Si alloy. J. Mater. Process. Technol. 2008, 208, 330–335. [Google Scholar] [CrossRef]
  11. Plumb, J.E.; Lewis, R.C. The Modification of Aluminium-Silicon Alloys by Sodium (Journal Article)|OSTI.GOV. 1958. Available online: https://www.osti.gov/biblio/4329718 (accessed on 19 July 2021).
  12. Zhu, G.L.; Gu, N.J.; Zhou, B.J. Effects of Combining Na and Sr additions on Eutectic Modification in Al-Si alloy. IOP Conf. Ser. Mater. Sci. Eng. 2017, 230, 12015. [Google Scholar] [CrossRef] [Green Version]
  13. Chen, C.; Liu, Z.-X.; Ren, B.; Wang, M.-X.; Weng, Y.-G.; Liu, Z.-Y. Influences of complex modification of P and RE on microstructure and mechanical properties of hypereutectic Al-20Si alloy. Trans. Nonferr. Met. Soc. China 2007, 17, 301–306. [Google Scholar] [CrossRef]
  14. Dang, B.; Jian, Z.; Xu, J. Effect of pulsed magneto oscillation and phosphorus on microstructure and tensile properties of as-cast Al-25% Si alloy. Int. J. Mater. Res. 2021, 112, 295–302. [Google Scholar] [CrossRef]
  15. Aghaie, E.; Stroh, J.; Sediako, D.; Rashidi, A.; Milani, A. Improving the mechanical properties of the B319 aluminum alloy by addition of cerium. Mater. Sci. Eng. A 2020, 793, 139899. [Google Scholar] [CrossRef]
  16. Anasyida, A.; Daud, A.; Ghazali, M. Dry sliding wear behaviour of Al-12Si-4Mg alloy with cerium addition. Mater. Des. 2010, 31, 365–374. [Google Scholar] [CrossRef]
  17. Timpel, M.; Wanderka, N.; Schlesiger, R.; Yamamoto, T.; Lazarev, N.; Isheim, D.; Schmitz, G.; Matsumura, S.; Banhart, J. The role of strontium in modifying aluminium-silicon alloys. Acta Mater. 2012, 60, 3920–3928. [Google Scholar] [CrossRef]
  18. Li, Q.; Zhao, S.; Li, B.; Zhu, Y.; Liu, J.; Liu, D.; Lan, Y.; Xia, T. Modification of multi-component Al-Si casting piston alloys by addition of rare earth yttrium. Mater. Res. Express 2019, 6, 106525. [Google Scholar] [CrossRef]
  19. Li, Q.; Li, B.; Liu, J.; Li, J.; Liu, D.; Lan, Y.; Xia, T. Modification of Hypereutectic Al–20 wt%Si Alloy Based on the Addition of Yttrium and Al-5Ti-1B Modifiers Mixing Melt. Int. J. Met. 2018, 13, 367–383. [Google Scholar] [CrossRef]
  20. Elgallad, E.M.; Doty, H.W.; Alkahtani, S.A.; Samuel, F.H. Effects of La and Ce Addition on the Modification of Al-Si Based Alloys. Adv. Mater. Sci. Eng. 2016, 2016, 5027243. [Google Scholar] [CrossRef] [Green Version]
  21. Mao, F.; Wei, S.; Ou, L.; Zhang, C.; Chen, C.; Wang, X.; Cao, Z. Different influences of Rare Earth Eu Addition on primary Si Refinement in hypereutectic Al-Si alloys with varied purity. Materials 2019, 12, 3505. [Google Scholar] [CrossRef] [Green Version]
  22. Mao, F.; Qiao, Y.; Zhang, P.; Ou, L.; Chen, C.; Zhang, C.; Wang, Y. Modification Mechanism of Rare Earth Eu on Eutectic Si in Hypoeutectic Al-Si Alloy. Int. J. Met. 2021, 16, 634–645. [Google Scholar] [CrossRef]
  23. Xiao, D.H.; Song, M.; Chen, K.H.; Huang, B.Y. Effect of rare earth Yb addition on mechanical properties of Al-5·3Cu-0·8Mg-0·6Ag alloy. Mater. Sci. Technol. 2007, 23, 1156–1160. [Google Scholar] [CrossRef]
  24. Shi, W.; Gao, B.; Tu, G.; Li, S.; Hao, Y.; Yu, F. Effect of neodymium on primary silicon and mechanical properties of hypereutectic Al-15Si alloy. J. Rare Earths 2010, 28, 367–370. [Google Scholar] [CrossRef]
  25. Mahmoud, M.G.; Zedan, Y.; Samuel, A.-M.; Songmene, V.; Doty, H.W.; Samuel, F.H. Applications of Rare Earth Metals in Al-Si Cast Alloys. In Advances in High-Entropy Alloys—Materials Research, Exotic Properties and Applications [Working Title]; IntechOpen: London, UK, 2021; Volume 2. [Google Scholar] [CrossRef]
  26. Xu, C.; Wang, H.; Qiu, F.; Yang, Y.; Jiang, Q. Cooling rate and microstructure of rapidly solidified Al-20 wt.% Si alloy. Mater. Sci. Eng. A 2006, 417, 275–280. [Google Scholar] [CrossRef]
  27. Olk, C.; Lukitsch, M.; Haddad, D. Combinatorial investigation of the mechanical properties of aluminum-silicon thin film nanocomposites. J. Mater. Res. 2007, 22, 1029–1036. [Google Scholar] [CrossRef]
  28. Cai, Z.; Wang, R.; Zhang, C.; Peng, C.; Xie, L.; Wang, L. Characterization of Rapidly Solidified Al-27 Si Hypereutectic Alloy: Effect of Solidification Condition. J. Mater. Eng. Perform. 2015, 24, 1226–1236. [Google Scholar] [CrossRef]
  29. Pouraliakbar, H.; Beygi, R.; Fallah, V.; Monazzah, A.H.; Jandaghi, M.R.; Khalaj, G.; da Silva, L.F.; Pavese, M. Processing of Al-Cu-Mg alloy by FSSP: Parametric analysis and the effect of cooling environment on microstructure evolution. Mater. Lett. 2021, 308, 131157. [Google Scholar] [CrossRef]
  30. Chen, L.; Liu, Z.; Wang, X.; Wang, Q.; Liang, X. Effects of Surface Roughness Parameters on Tribological Performance for Micro-textured Eutectic Aluminum-Silicon Alloy. J. Tribol. 2020, 142, 021702. [Google Scholar] [CrossRef]
  31. Osório, W.R.; Cheung, N.; Spinelli, J.E.; Cruz, K.S.; Garcia, A. Microstructural modification by laser surface remelting and its effect on the corrosion resistance of an Al-9 wt%Si casting alloy. Appl. Surf. Sci. 2007, 254, 2763–2770. [Google Scholar] [CrossRef]
  32. Savrai, R.A.; Malygina, I.Y.; Kolobylin, Y.M. An Approach to Eddy-Current Evaluation of the Structural State in a Cast Aluminum-Silicon Alloy Subjected to Surface Laser Heat Treatment. J. Nondestruct. Eval. 2019, 38, 81. [Google Scholar] [CrossRef]
  33. Nayak, S.; Dahotre, N.B. Surface Engineering of Aluminum Alloys for Automotive Engine Applications. JOM 2004, 56, 46–48. [Google Scholar] [CrossRef]
  34. Mahanty, S. Gouthama Surface modification of Al-Si alloy by excimer laser pulse processing. Mater. Chem. Phys. 2016, 173, 192–199. [Google Scholar] [CrossRef]
  35. Zhang, Y.; Guo, Y.; Chen, Y.; Kang, L.; Cao, Y.; Qi, H.; Yang, S. Ultrasonic-Assisted Laser Metal Deposition of the Al 4047Alloy. Metals 2019, 9, 1111. [Google Scholar] [CrossRef] [Green Version]
  36. Lien, H.-H.; Mazumder, J.; Wang, J.; Misra, A. Microstructure evolution and high density of nanotwinned ultrafine Si in hypereutectic Al-Si alloy by laser surface remelting. Mater. Charact. 2020, 161, 110147. [Google Scholar] [CrossRef]
  37. Eagar, T.; Tsai, N.-S. Temperature Fields Produced by Traveling Distributed Heat Sources Use of a Gaussian heat distribution in dimensionless form indicates final weld pool shape can be predicted accurately for many welds and materials. Weld. J. 1983, 62, 154–155. [Google Scholar]
  38. Pierantoni, M.; Gremaud, M.; Magnin, P.; Stoll, D.; Kurz, W. The coupled zone of rapidly solidified Al□Si alloys in laser treatment. Acta Met. Mater. 1992, 40, 1637–1644. [Google Scholar] [CrossRef]
  39. Schneider, C.A.; Rasband, W.S.; Eliceiri, K.W. NIH Image to ImageJ: 25 years of image analysis. Nat. Methods 2012, 9, 671–675. [Google Scholar] [CrossRef]
  40. Lei, Q.; Ramakrishnan, B.P.; Wang, S.; Wang, Y.; Mazumder, J.; Misra, A. Structural refinement and nanomechanical response of laser remelted Al-Al2Cu lamellar eutectic. Mater. Sci. Eng. A 2017, 706, 115–125. [Google Scholar] [CrossRef]
  41. Chokemorh, P.; Pandee, P.; Chankitmunkong, S.; Patakham, U.; Limmaneevichitr, C. Primary Si refinement and eutectic Si modification in Al-20Si via P-Ce addition. Mater. Res. Express 2022, 9, 036501. [Google Scholar] [CrossRef]
  42. Roehling, J.D.; Coughlin, D.R.; Gibbs, J.W.; Baldwin, J.; Mertens, J.C.; Campbell, G.H.; Clarke, A.J.; McKeown, J. Rapid solidification growth mode transitions in Al-Si alloys by dynamic transmission electron microscopy. Acta Mater. 2017, 131, 22–30. [Google Scholar] [CrossRef] [Green Version]
  43. Abboud, J.; Mazumder, J. Developing of nano sized fibrous eutectic silicon in hypereutectic Al–Si alloy by laser remelting. Sci. Rep. 2020, 10, 12090. [Google Scholar] [CrossRef]
  44. Grimvall, G. Thermophysical Properties of Materials; Elsevier: Amsterdam, The Netherlands, 1999. [Google Scholar] [CrossRef] [Green Version]
  45. Hearn, W.; Bogno, A.-A.; Spinelli, J.; Valloton, J.; Henein, H. Microstructure Solidification Maps for Al-10 Wt Pct Si Alloys. Met. Mater. Trans. A 2019, 50, 1333–1345. [Google Scholar] [CrossRef]
  46. Khan, S.; Elliott, R. Quench modification of aluminium-silicon eutectic alloys. J. Mater. Sci. 1996, 31, 3731–3737. [Google Scholar] [CrossRef]
  47. Lien, H.-H.; Mazumder, J.; Wang, J.; Misra, A. Ultrahigh strength and plasticity in laser rapid solidified Al-Si nanoscale eutectics. Mater. Res. Lett. 2020, 8, 291–298. [Google Scholar] [CrossRef]
Figure 1. Schematic of the experiment setup.
Crystals 12 00750 g001
Figure 2. Microstructures of LSR Al-20Si alloys under SEM (A) and a schematic. (A) The melt pool formation right after the experiment was shown; hemi-spherical melt pool and surrounding non-heat-affected zone could be seen. (The cut off line and background carbon tape with some dark patterns were advised to be disregarded.) The microstructure quantification reported corresponds to (B) Al dendrite formation and interdendritic eutectic structure with fibrous Si in the LSR region. (C) Fully eutectic colony within LSR region, with fibrous Si. (D) As-cast flake eutectic. Schematic of the eutectic structures observed within the melt pools. (E) Continuous and discernable fully eutectic regions. (F) Random, inter-dendritic eutectic regions within primary Al dendrites with pockets of fully eutectic regions.
Crystals 12 00750 g002
Figure 3. Schematic illustration of the cross-sectional microstructure characterization of the melt pools. Here the purple plane (A) was characterized first, then the block ground again and polished to get the green surface (B). Approximate distance between the purple and green plane is 100 µm.
Crystals 12 00750 g003
Figure 4. Summary of Eutectic Formation Percentage. Errors are represented in 1 standard deviation.
Crystals 12 00750 g004
Figure 5. Hypoeutectic-like dendritic and interdendritic eutectic structure from Experiment #5 (Table 1) with Ce addition.
Crystals 12 00750 g005
Figure 6. Regular eutectic formation and microstructure measurements at different depths. (A) Cross section of melt pool after LSR. (B) Same melt pool cross-section with highlighted yellow region denoting area of melt pool with fully eutectic microstructure. (C,D) are Si fibers from the top and the bottom of the eutectic area, respectively. Linear interception with cylindrical projection can be seen in the yellow bands in (D) (Al-20Si Exp#1). This figure shows how the total of 72 (18 × 3 original and 6 × 3 replications) experiments were characterized.
Crystals 12 00750 g006
Figure 7. Graph for FIB/SEM comparison. FIB etched regions, which are illustrated in solid fillings on the left-most side, were measured at least 100 times for different fibers. Data shown here is from the experiment set 1 Al-20Si.
Crystals 12 00750 g007
Figure 8. General overview of Si fiber refinement for the three alloys. Errors are represented in 1 standard deviation. Refinement level (ϕ) is calculated to be 28.4% for Al-20Si, 27.7% for Al-20Si-0.2Ce and 27.5% for Al-20Si-0.2Sr.
Crystals 12 00750 g008
Figure 9. Entrance Exit SEM for the experiments with Ce addition #2 and #3. Compared to the middle section, entrance and exit region of the laser get widen due to the lack of conduction body. Stability of the melt pools can be understood whether they tend to expand or shrink. In this scenario, there is no clear expansion or shrinkage trend observed.
Crystals 12 00750 g009
Figure 10. Cooling rates and fully eutectic area percentages relative to the total melt pool area. Errors are represented with one standard deviation.
Crystals 12 00750 g010
Figure 11. Average eutectic area plotted against undercooling. The red dashed line shows that eutectic area percentage correlates to undercooling with good agreement (R2 = 0.88). This is an empirical power fit (y = 16.894x−1.312) and intended to show the downward trend to the reader.
Crystals 12 00750 g011
Table 1. Summary of eutectic formation for the initial set of LSR experiments. The Al-20Si-0.2Ce samples had noticeably lower eutectic area percentages compared to Al-20Si-0.2Sr and Al-20Si.
Laser Spot Diameter
(mm)
Average Fully Eutectic Area Percentage for
Al-20Si-0.2Sr
Average Fully Eutectic Area Percentage for
Al-20Si-0.2Ce
Average Fully Eutectic Percentage for
Al-20Si
0.424.93%7.60%17.62%
216.21%14.06%20.83%
Table 2. Cooling rates for the highest and lowest eutectic volume fractions.
Experiment #Cooling Rate (K/s)Average Eutectic FormationStd Dev for Eutectic Formation
11.80 × 10437.98%12.89%
26.78 × 10462.00%8.28%
34.15 × 10449.67%9.86%
111.16 × 10430.24%3.86%
179.30 × 10417.52%4.40%
187.74 × 10423.12%13.47%
61.57 × 10511.43%15.13%
92.00 × 10510.92%12.61%
138.15 × 1057.13%6.51%
151.12 × 1057.64%8.60%
Table 3. Calculated kinetic parameters.
Experiment #LOG10 Scale
Cooling Rate (K/s)
Vmax
(mm/s)
G
(K/mm)
Calc. Undercooling ΔTk (K)
14.325.4708.718.1
24.825.42667.313.9
34.625.41634.415.3
65.2101.61542.831.0
95.3177.81174.243.4
114.125.4457.219.8
133.9101.686.155.3
155.0101.61102.433.2
175.0177.8523.251.0
184.9177.8435.152.9
Publisher’s Note: MDPI stays neutral with regard to jurisdictional claims in published maps and institutional affiliations.

