Review

Soft Elasticity in Main Chain Liquid Crystal Elastomers

1
Department of Physics, Kent State University, Kent, OH 44242, USA
2
School of Materials Science and Engineering, Georgia Institute of Technology, Atlanta, GA 30332, USA
*
Author to whom correspondence should be addressed.
Current address: Brady Innovation Center, 15/F, Sinolight Building B, 4 Qiyang Road, Chaoyang District, Beijing 100201, China.
Submission received: 6 February 2013 / Revised: 2 May 2013 / Accepted: 27 May 2013 / Published: 7 June 2013
(This article belongs to the Special Issue Advances in Liquid Crystals)

Abstract

:
Main chain liquid crystal elastomers exhibit several interesting phenomena, such as three different regimes of elastic response, unconventional stress-strain relationship in one of these regimes, and the shape memory effect. Investigations are beginning to reveal relationships between their macroscopic behavior and the nature of domain structure, microscopic smectic phase structure, relaxation mechanism, and sample history. These aspects of liquid crystal elastomers are briefly reviewed followed by a summary of the results of recent elastic and high-resolution X-ray diffraction studies of the shape memory effect and the dynamics of the formation of the smectic-C chevron-like layer structure. A possible route to realizing auxetic effect at molecular level is also discussed.

1. Introduction

Liquid crystal elastomers (LCEs) are complex soft materials where somewhat rigid anisotropic liquid crystalline (LC) moieties are incorporated into flexible polymer chains and then randomly cross-linked forming an initially isotropic or anisotropic rubbery structure depending on temperature and the presence of external fields. These materials embody a unique competition between the anisotropic liquid crystalline and the isotropic polymeric tendencies. Their complex structure and the consequent new physical behavior are important both for investigations of the incipient basic scientific phenomena and technological applications, e.g., in artificial muscles [1,2,3,4], shape memory [5,6,7,8], soft elasticity [9,10,11], thermo-mechanical actuation [1,12,13,14,15], sensors [16], and other applications [17,18]. Some very good reviews [17,19] and monographs [15,17] on this topic have discussed the mechanical, chemical, and structural properties of LCEs in general. In this article, we shall give an overview of some of these exciting effects in the main chain LCEs [20] which exhibit the shape memory effect.
The first LCE synthesized in 1981 by Finkelmann, et al., was a polydomain nematic elastomer [21]. It was based on a polysiloxane backbone, which provided flexibility to the polymer network and paved the way for the synthesis of new LCEs. The chemistry of LCEs has since evolved resulting in many materials with fascinating physical properties [22,23,24]. To discuss the elastic behavior of LCEs, it is useful to understand the concept of classical rubber elasticity of elastomers. To introduce soft elasticity, we largely follow Warner and Terentjev, additional details and references can be found in their classic monograph [15]. An isotropic rubber is obtained by cross-linking a polymer melt at random points, thus suppressing the large-scale Brownian motion of the chains and freezing its macroscopic configuration. The polymer strands between two cross-linked points stay in their equilibrium conformation where they possess maximum disorder [25]. Under the influence of external stress, their equilibrium conformation is perturbed and the distance between the cross-linked points changed. The free energy of the system increases as the configurational entropy is reduced. When the external stress is removed, the elastomer network tries to regain the original equilibrium conformation. Due to this behavior of the crosslinked network, elastomers are considered as “entropic-springs”.
Assuming a Gaussian random walk of the polymer segments, one can write [15] the relationship between the elastic free energy density FE and the second rank deformation tensor λij [26] as:
Crystals 03 00363 i001
Here, Einstein’s summation convention [27] is followed in writing the above expression adapted from [15]. The trace of the product of the deformation tensor with its transpose decides the final value of the elastic free energy density and the characteristic rubber modulus μ= nskBT, where, ns is the average strand count per unit volume, kB is the Boltzmann constant, and T is the absolute temperature. The free energy expression could be simplified when a uniaxial strain (λ = 1 + ∆L/L0) is applied along the x-direction; here L0 is the initial stress-free elastomer length and ∆L is the change in length. Deformations in the other two directions will be such that the condition of incompressibility of volume: |λij| = 1 is satisfied. Under such conditions, FE reduces to:
Crystals 03 00363 i002
The value of the characteristic elastic modulus is the same in all directions for a normal rubber. We shall later see that, in the case of LCEs, this elastic modulus is anisotropic and its value depends on the direction in which the elastomer is stretched. The above free energy density was derived for classical elastomers at constant volume and under affine approximation [15] which assumes that there is a geometric proportion between the deformation of the elastomer and the distance between crosslinking points. The constant volume requires an associated decrease in the cross-sectional area with increasing strain and is justified, as the bulk modulus of elastomers is typically 104–105 times higher than the characteristic rubber modulus. From the expression for FE, one can calculate the nominal (or, engineering) σn and the true σt stresses for the rubbery network:
Crystals 03 00363 i003
Here, f is the applied force and A0 is the initial area of cross section of the elastomer. σn is easily measured as the force per unit area of the initial cross-section in the plane perpendicular to the force. But, as the cross sectional area decreases with increasing strain, σt measured with respect to the actual area of cross-section is a more realistic force density. According to this simple model, the strain vanishes at zero stress implying the absence of spontaneous elongation. The above equations are obtained assuming constant volume and a Gaussian distribution of polymer chains which is not “strictly” valid at the large deformations that rubber could withstand.

2. Nematic Liquid Crystal Elastomer (NLCE)

A typical elastomer does not have any anisotropic component in the polymer backbone and assumes a spherical (isotropic) equilibrium conformation in the absence of external fields. In an LCE, the mesogenic moieties add anisotropy to the polymer network. The LC molecules may be incorporated either into the main chain (backbone) or be attached on the side of the backbone through a linkage group. These are, referred to as the main chain liquid crystal elastomer (MCLCE) and the side chain liquid crystal elastomer (SCLCE), respectively. The interaction between different components and the length and flexibility of the linkage group play important roles in determining the type of LC order and the equilibrium polymer conformation [28,29]. In an end-on MCLCE, the main chain may respond to the anisotropic field imposed by the LC order and be generally parallel to the director and adopt prolate conformation, Figure 1a. On the other hand, the main chain conformation is likely to become oblate in a side-on MCLCE as, now, the main chain will spend more time perpendicular to the director, Figure 1b. The behavior of end-on SCLCE is governed by the length of the linkage group. For a side-on SCLCE, the mesogens may have lower energy in the nematic field of the mesogens if the linkage group is flexible, leading to a prolate conformation of the backbone. Furthermore, an even number of carbon atoms in the linkage groups tend to orient the mesogens parallel to the backbone resulting in a prolate conformation, Figure 1d. The mesogens would be on average perpendicular to the polymer backbone for odd numbers of carbons in the linkage group. In such cases, the polymer backbone lies in a plane perpendicular to the mesogens in an oblate conformation, Figure 1e. Consequently, the LCEs exhibit significantly different organization of the mesogens and the backbone in three spatial directions. For systems with uniaxial symmetry, the two perpendicular directions are equivalent and anisotropic physical quantities can be specified in terms of two components. For a NLCE, the elastic free energy density, FLCE, can be written as [15,17]:
Crystals 03 00363 i004
Figure 1. Polymer chain conformations and mesogens (dark ellipses) organization depend on the length, flexibility, number (even/odd) of carbons in the spacer, the type of attachment (side-on or end-on), and interaction among them. Several possible scenarios are shown for, both, the main-chain and side-chain liquid crystal elastomers (LCEs): (a,c,d) Mesogens lying parallel to the polymer backbone favoring prolate conformation; and (b,e) Polymer backbone perpendicular to mesogens adopts an oblate conformation.
Crystals 03 00363 g001
Here, Crystals 03 00363 i012 is the step length tensor at the time of crosslinking the network and Crystals 03 00363 i013 is the inverse of the step length tensor under any general deformation. The above free energy density FLCE incorporates the effect of polymer chain conformation via the step length tensors which carry the information about the nematic order, which was missing from FE. This form of the elastic free energy is useful in discussions of soft elasticity, later in this article. Considering a uniaxial strain geometry similar to the previous section, the expression of free energy now becomes [15]:
Crystals 03 00363 i005
Here, a is the mean step size describing the spherical conformation of the polymer chain in the isotropic state. The step length tensor is diagonal in the mesophase with unequal components (a//, a, a) in the three directions with respect to Crystals 03 00363 i014 . This form of FLCE for nematic elastomers incorporates the anisotropy of the polymer and leads to the expression of true stress of NLCEs:
Crystals 03 00363 i006
Specifically, for zero external stress, it can be shown that a nematic system undergoes a spontaneous extension upon entering the mesophase [15,30,31]:
Crystals 03 00363 i007
Above temperature TI where the system undergoes transition to the isotropic phase, the chain conformation in the isotropic phase is spherical like a normal rubber. Below the clearing point in the presence of an orienting field, the anisotropy imposed on polymer chains by liquid crystalline moieties in the nematic (N) phase gives rise to a spontaneous shape change in these materials. Depending on the prolate or oblate chain conformation, the NLCE will either elongate or shrink along the director. The effect is more prominent in monodomain systems but may also be seen in samples with partially ordered polydomains as it originates from the step length tensor in FLCE. The spontaneous shape change gives rise to the possibility of large-scale thermo-mechanical actuation in LCEs that has been experimentally realized [1,12,13]. As the temperature is lowered, the orientational order parameter (S) of the N phase grows in magnitude and the chain anisotropy increases [15]:
Crystals 03 00363 i008
The spontaneous elongation continues to increase in the N phase. This could lead to controlled shape change of the elastomer paving the way for actuation. Another way of achieving spontaneous shape change is by incorporating photo responsive mesogenic moieties into the elastomer network. Then, by shining light on the material, one can affect a spontaneous shape change and observe other exciting behavior in LCEs [32,33,34,35,36,37,38,39,40,41,42].

2.1. Soft Elasticity of Nematic Liquid Crystal Elastomers

One of the important effects of polymer network’s anisotropy is a large spontaneous shape change across the isotropic to N phase transition. The deformation (extension or contraction) parallel to the macroscopic nematic director has been studied in monodomain NLCEs. However, their response to applied linear stress parallel/perpendicular to the initial director is not completely understood. The changes induced in the distribution of domain-directors in a polydomain sample, the value of orientational order parameter, the polydomain to monodomain transition, the connection between microscopic LC structure and the macroscopic order, and the dynamics of their relaxation processes are of great interest to fully understand the underlying science and develop new applications of LCEs.
Experimentally, for both the monodomain and polydomain NLCEs, a plateau in the stress-strain curve is observed [43,44], Figure 2. At low strains, the elastomer behaves almost like an isotropic rubber and the stress increases according to the classical theory of rubber elasticity. After reaching a certain level of strain, further deformation costs almost zero energy and the stress practically remains constant as the strain increases significantly. At the end of the plateau, the strain rises again with applied stress, i.e., a finite energy is required to produce further deformation. The characteristic moduli (i.e., slopes of the curve) are different before and after the plateau. Below the plateau, the elastomer is initially in a polydomain state. It achieves the monodomain state after the plateau, where the directors pertaining to individual microdomains are pointing towards the stretch direction. Well below TI, the elastic response in the monodomain state does not change appreciably with temperature as can be inferred from the nearly constant slope of the stress-strain curve at two different temperatures, 22 °C and 34 °C in Figure 2. The width of the plateau decreases with temperature and completely disappears above TI where the system behaves more like a normal rubber. It is the plateau region where soft [9,10] or semi-soft [15,45] elasticity is observed. Soft elasticity in NLCEs is explained by considering the director reorientation in monodomain samples [9,11] and reorientation of the microdomain-directors in polydomain samples accompanied by a rapid rise in the orientational order parameter S [44,46].
Figure 2. Typical stress-strain plots for a polydomain nematic liquid crystal elastomer (NLCE) consisting of polysiloxane backbone, rod-like mesogens as side group, and a point-like “tri-functional” crosslinker. The strain on the horizontal axis represents fractional extension (i.e., ΔL/L0 = λ − 1) of the sample. Reproduced with permission from [44]. Copyright 1998 American Chemical Society.
Crystals 03 00363 g002
The dependence [9,47] of the free energy on the initial and final states of the nematic director is contained in Crystals 03 00363 i012 and aij, respectively, in Equation (1). The deformation tensor λij determines how the final state is reached. Generally, macroscopic deformations cause a distortion of the polymer chain conformation. However, there exist deformations in which the shape of the polymer chain conformation is not altered; but rotated in a continuous manner until the nematic director and the stretch direction become parallel without affecting S. Such soft modes of deformations are also called Goldstone modes [11]. Generally, for any deformation, one can find a frame of reference in which the deformation appears as shear and can be separated into symmetric and anti-symmetric components [26]. For example, uniaxial elongation of a monodomain NLCE accompanied by contraction in the perpendicular directions can be viewed as pure shears in a rotated frame of reference. Pure shear is symmetric and does not contain a rotational component while an anti-symmetric part contains rotations. An ideal elastomer matrix is defined by the position of the cross-linkers. During soft deformation, they move in such a way that their overall distribution remains unchanged [11] but the polymer conformation between the cross-linked points rotates towards the stretch direction. The presence of finite-size rod like cross-linkers [48] and/or compositional fluctuation of the polymer strands [49] lead to deviation from this ideal behavior and towards “semi-soft elasticity” [45].
Consider now a monodomain NLCE with the director initially pointing along the x-axis. A uniaxial strain is applied along the y-axis such that the director rotates by angle θ about the z-axis, going continuously from 0 → π/2 in the x–y plane. One can reduce [9,11,15] the deformation tensor to a 2 × 2 matrix:
Crystals 03 00363 i009
The deformation can be separated into an identity matrix (symmetric spherical part) and an anti-symmetric matrix representing shear. Here, the diagonal terms λxx and λyy represent the contraction and extension, respectively, while the off-diagonal terms λxy and λyx represent the components of shear in the x-y plane. When the deformation is complete at θ = π/2, the shear vanishes, i.e., the final state of the elastomer only has an extension along the y-axis and a proportionate contraction along the x-axis. The free energy remains invariant and the deformation corresponds to the plateau of the stress-strain curve. Beyond the plateau, an increase in stress is needed to further deform the NLCE. For the case of isotropic elastomers a// = a, and the anti-symmetric component of the deformation matrix vanishes leaving only the identity matrix. Evidently, no shear is present and hence no soft elasticity exists in isotropic elastomers. Soft elasticity is a characteristic of anisotropic elastomers, originating from the anti-symmetric component of the deformation, which necessarily involves director rotation.

3. Smectic Liquid Crystal Elastomers (SmLCE)

Here, we shall briefly discuss the polydomain main-chain smectic-A (SmA) elastomers and smectic-C (SmC) elastomers, and the shape memory effect followed by a possible way of realizing negative Poisson’s ratio materials at the molecular level. The focus will then shift to two main–chain polydomain SmC elastomers (LCE1 and LCE2), synthesized by W. Ren et al. [50]. These elastomers show large strain retention capabilities pertaining to a plateau in the stress-strain curve.
Smectic mesogens incorporated into an elastomer network impose, in addition to the orientational order, a one-dimensional positional order defined by mesogens to form layers. In SmLCEs, the backbone has a tendency to lie parallel to the layers. Within layers, the mesogens lack order and behave almost like a two-dimensional liquid. A monodomain smectic elastomer can exhibit highly anisotropic stress-strain behavior [51]. Along the direction perpendicular to the smectic layers, the system responds to stress almost like a conventional solid. Yet, it is rubbery in the two orthogonal directions. The elastic modulus and hence the mechanical response of SmLCEs is highly anisotropic. Uniform director reorientations, or the soft mode, as observed in the case of monodomain NLCEs is not seen in the case of smectic monodomain samples as their layer structure restricts the rotational freedom of the director. A strain applied parallel to the layers acts directly to stretch the polymer backbone. An increase in length in the stretch direction is compensated by an associated decrease in the other in-plane direction, thus satisfying the conservation of volume. The liquid-like behavior of the mesogens within a smectic layer is not disturbed and any decrease in sample width perpendicular to the smectic layers is strongly resisted preserving the number of smectic layers [52].
Figure 3. X-ray diffraction pattern of a smectic-A (SmA) monodomain elastomer consisting of a polymer backbone [poly[oxy-(methylsilylene)], two kinds of mesogenic molecules with varying spacer length and concentration, and 10% of rod-like crosslinker; Adapted with permission from [52]. Copyright 1997 American Chemical Society.
Crystals 03 00363 g003
Figure 3 shows a representative room temperature X-ray diffraction (XRD) pattern of a monodomain SmA SCLCE. The presence of higher order reflections at small angles is due to the highly condensed smectic density wave. The wide-angle X-ray scattering (WAXS) peaks provide a measure of the orientational order of the mesophase. When a monodomain SmA sample is stretched perpendicular to the layers, strong light scattering [52] is observed due to layer undulations. At much higher strains, it is possible to disrupt the smectic layers [53]. The sample becomes highly opaque and has a much lower elastic modulus beyond a threshold strain, which is comparable to the nematic elastomers. It was argued [54] that this is due to strain induced rotation of the smectic layers. Layer rotation is energetically favored since the smectic elastic modulus is typically two orders of magnitude higher than the rubber modulus. Layer rotations along with the rigid clamping condition explain [54] the emergence of a much lower elastic modulus at strains beyond the threshold [53]. This is to be distinguished from the “semi-soft” response of some nematic elastomers originating from director rotation. On the other hand, a monodomain SmC elastomer is predicted to show soft deformation modes [55] as the director is now tilted with respect to the layer normal and is free to rotate on the surface of a cone around it. This freedom of mesogens could lead to soft deformations.

3.1. Soft Elasticity and the Shape Memory Effect in Smectic Liquid Crystal Elastomers

An early report by Ortiz et al. [56] described strain retention in a smectic MCLCE. However, the pioneering work of Rousseau et al. [7], on the shape memory effect was performed on a polydomain SmC MCLCE prepared with two benzoate based rod-like mesogens (in varying concentrations), flexible poly(dimethyl siloxane) spacers, and point-like siloxane cross linkers. The shape memory cycle of this material, Figure 4, consists of heating the elastomer above the clearing temperature where it behaves like an isotropic rubber. The elastomer was then subjected to elongation, subsequently cooled to low temperature, followed by the removal of the external stress.
Figure 4. The complete shape memory cycle in a smectic-C (SmC) polydomain main chain liquid crystal elastomer (MCLCE) obtained from dynamic mechanical analysis. Case (a) is for the SmC polydomain MCLCE and (b) the case of isotropic rubber where no “fixing” of secondary shape is observed. Adapted with permission from [7]. Copyright 2003 American Chemical Society.
Crystals 03 00363 g004
The secondary shape induced by stretching at elevated temperature retained ~84% of the original strain. This apparent “fixing” of the secondary shape has its origin in the anisotropy of LC components of the system. The initial shape could be recovered by heating the elastomer above the clearing temperature and then cooling back to room temperature with no external load. The process of fixing and subsequent recovery of primary shape is repeatable. The results reveal that the secondary shape consists of a highly ordered and well-aligned SmC mesophase. The elastomer network is rubbery in nature (μ ~ 20 MPa) even at temperatures as low as −20 °C. The strain retention pertaining to shape memory effect in polydomain MCLCEs [50] will be discussed later.

3.2. Transverse Rod Incorporation for Auxetic Effect Material

However, some natural [57] and engineered [58] materials exhibit negative Poisson’s ratios as their lateral dimension increases with elongation. This behavior is termed “auxetic” and may be realized even at the molecular level by reorientation of transverse rod components in a polymer chain via “site-connectivity” [59]. X-ray scattering study was employed to investigate molecular auxetic behavior in conventional main-chain polymers. Incorporation of a rigid transverse component into the main chain of such materials has an interesting effect. When stretched, the polymer chains elongate but the transverse components simultaneously orient perpendicular to the stretch direction and keep the polymer chains away from each other. This provides a pathway to the molecular design of materials with negative Poisson’s ratios [59]. This concept of molecular auxetic design was also attempted by incorporating TR3 into the main chain of LCE2. Unfortunately, it did not lead to auxetic behavior [60] due to the hindrance to transverse rotation in the presence of smectic layers. A longer transverse rod group and a shorter spacer length might be necessary to realize auxetic effects in MCLCEs.

3.3. Polydomain Smectic-C Main Chain Liquid Crystal Elastomers

Polydomain smectic MCLCEs have been extensively studied [20,60,61,62,63,64,65,66,67]. Sánchez-Ferrer et al. [64] reported the polydomain to monodomain (P–M) transition caused by uniaxial strain in these materials. The monodomain obtained is termed as pseudo-monodomain [68] because of the conical distribution of the layers around the mechanically induced director. Application of shear deformation perpendicular to the director [61] rendered a perfectly monodomain sample from the pseudo-mono-domain state. For brevity, we shall use the term monodomain to imply a well-defined direction for the director, which accompanies conical distribution of smectic layers around the director. In this section, we shall focus on recent mechanical and X-ray diffraction measurements on two polydomain MCLCEs prepared by W. Ren et al. [50]. These materials are important for two reasons: (1) they have remarkable strain retention at room temperature and thus a potential for use as shape memory materials [7]; and (2) a plateau in the stress-strain curve points towards a region of soft elastic response in these MCLCEs.
Figure 5. Schematic representation of elastomers LCE1 and LCE2: Here, “x” is the mesogen; “y” is the TR3 incorporated into the main chain of LCE2, “m” is siloxane spacer, “n” is a octasiloxane crosslinker. LCE1 has only the mesogens incorporated at the “end-on” positions where as many as four chains could attach to the crosslinker. In LCE2, 20% of the “x”-blocks are replaced by “y” blocks. Adapted from reference [50].
Crystals 03 00363 g005
The monomers related to the two elastomers LCE1 and LCE2 are shown in Figure 5. LCE1 contains only mesogens x attached to the main-chain in the end-on position via eleven methylene groups on both sides. The polymer is crosslinked with 10 mol % of 2,4,6,8-tetramethylcyclotetrasiloxane crosslinker n. In LCE2, 20 mol % of the mesogens x are replaced by the transverse component y. The chain extension and cross-linking reactions for preparing the elastomers were performed at room temperature. LCE1 was chosen as the parent elastomer because its cross linking concentration is optimum for efficient liquid crystalline and rubbery network properties, and presence of the plateau [60] in the stress-strain curve might correspond to the soft elastic behavior.
These systems are initially opaque in the polydomain state which can be transformed into a stable transparent monodomain state by an external mechanical force even at room temperature. A specimen of ~25 mm length was elongated at a rate of 0.125 mm/s. These elastomers usually show significant strain retention and, after the formation of monodomains, nearly half of the strain is retained [20] as shown in Figure 6. The residual strain increases with the magnitude of the applied strain above 50%, i.e., λ = 1.5. Most of the strain recovery occurs within the first 20 min of removing the stress. Under these conditions, the global director Crystals 03 00363 i014 
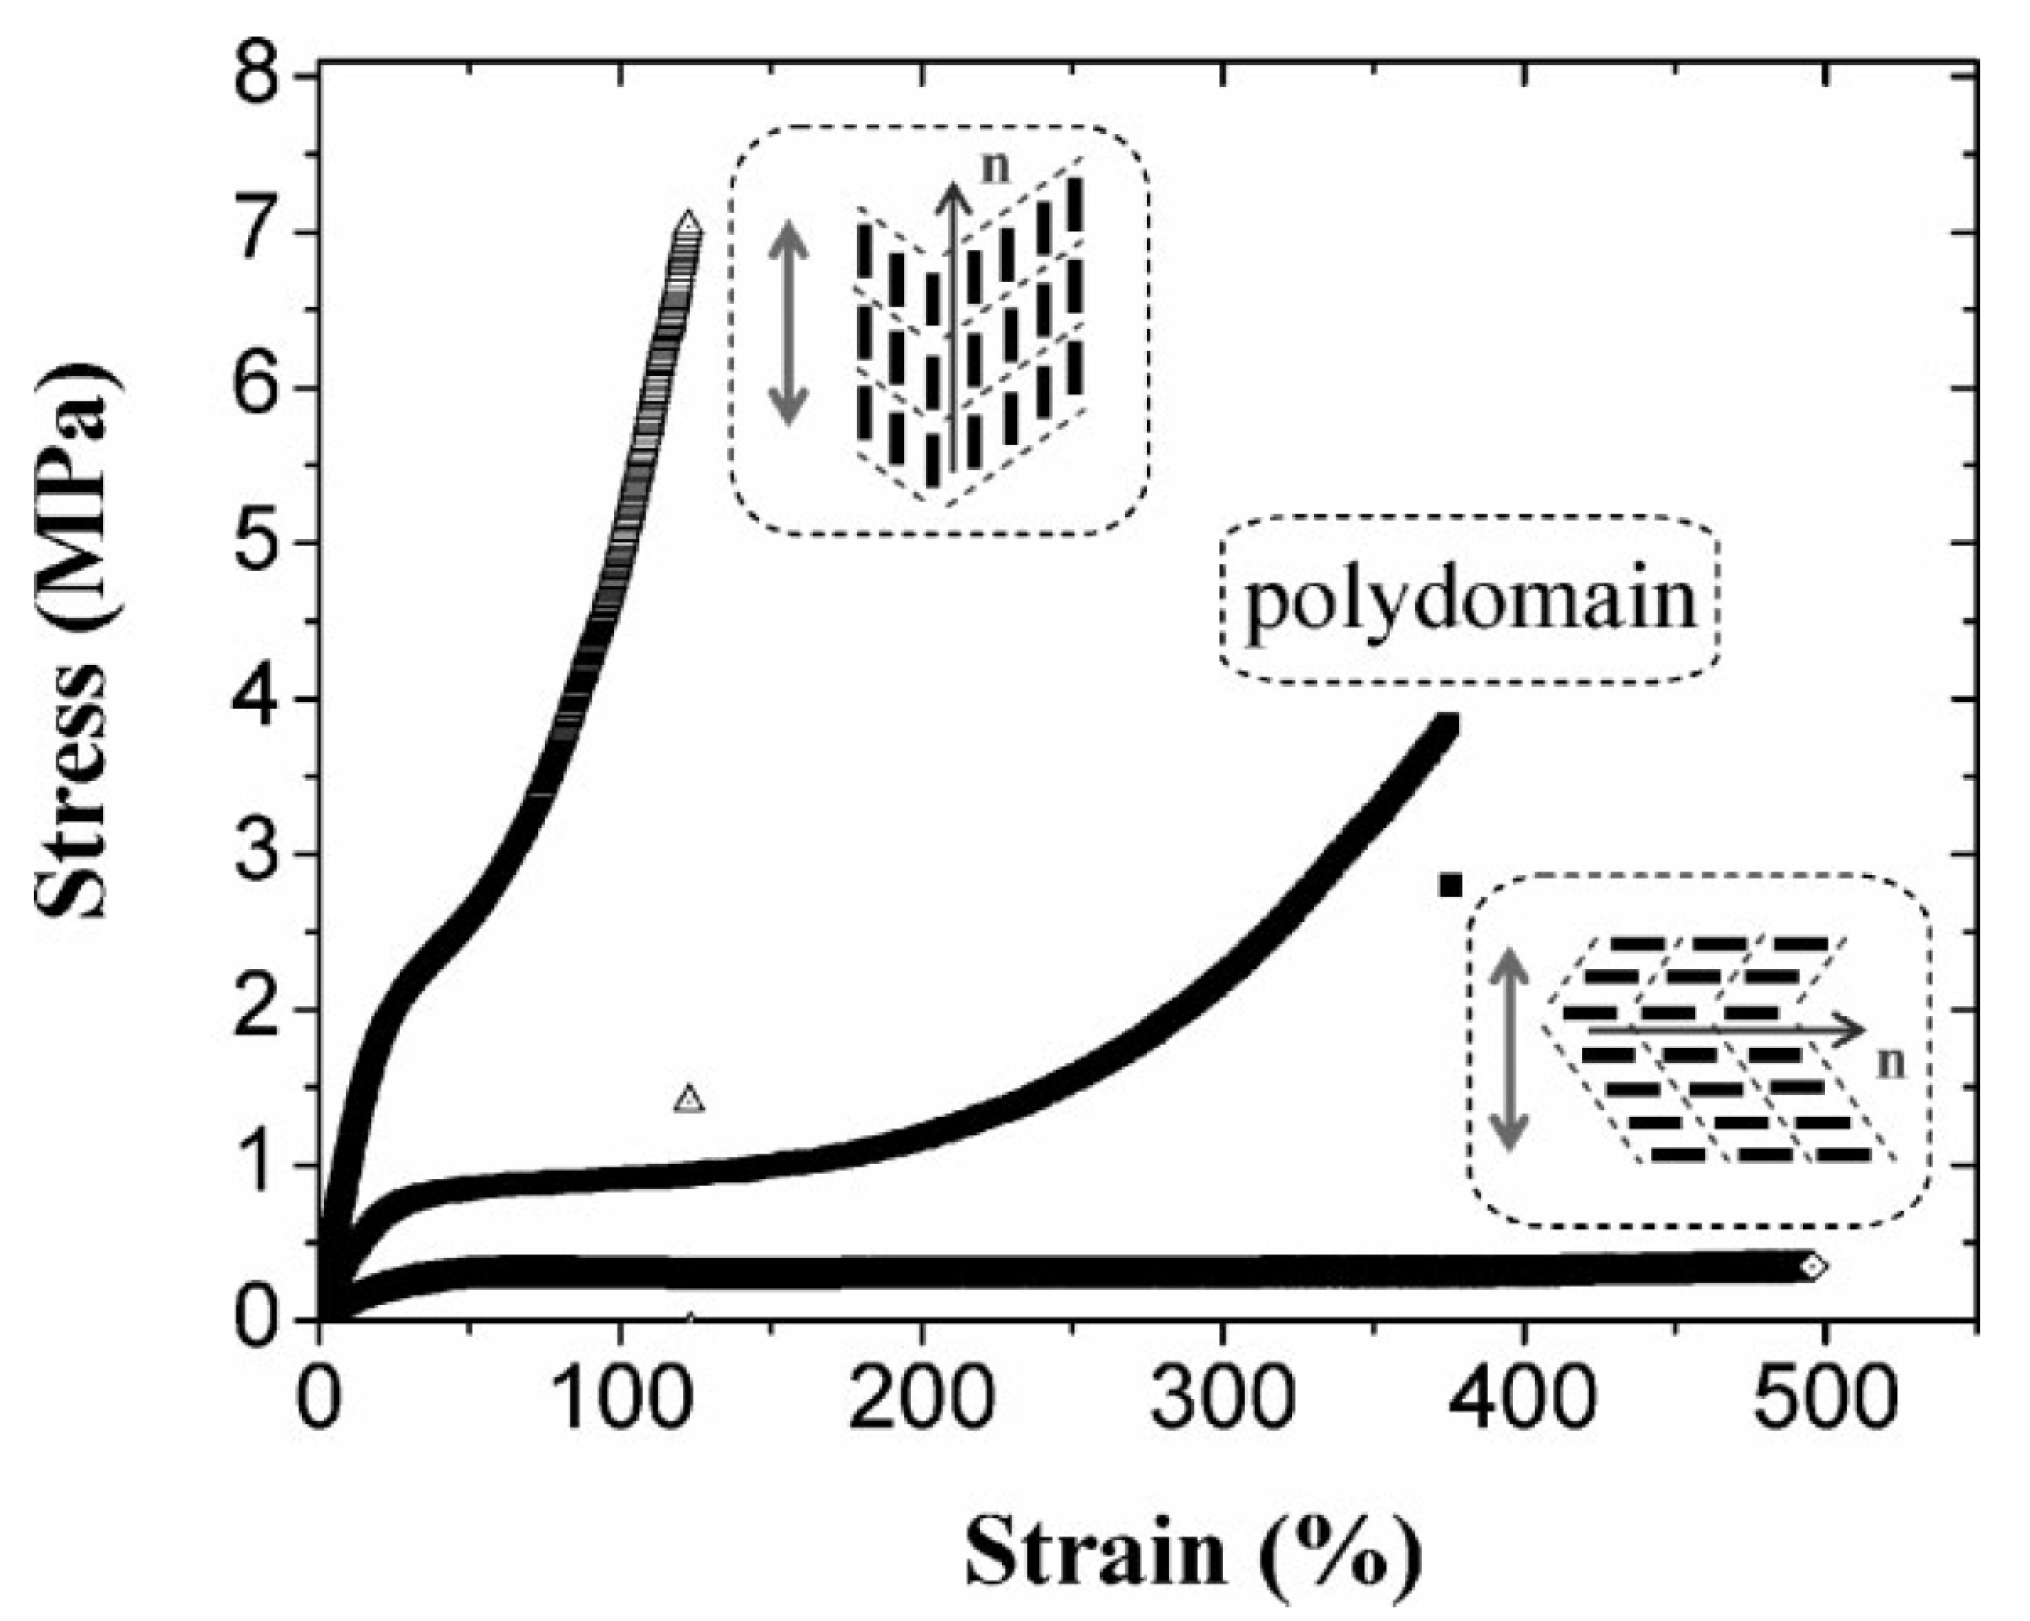
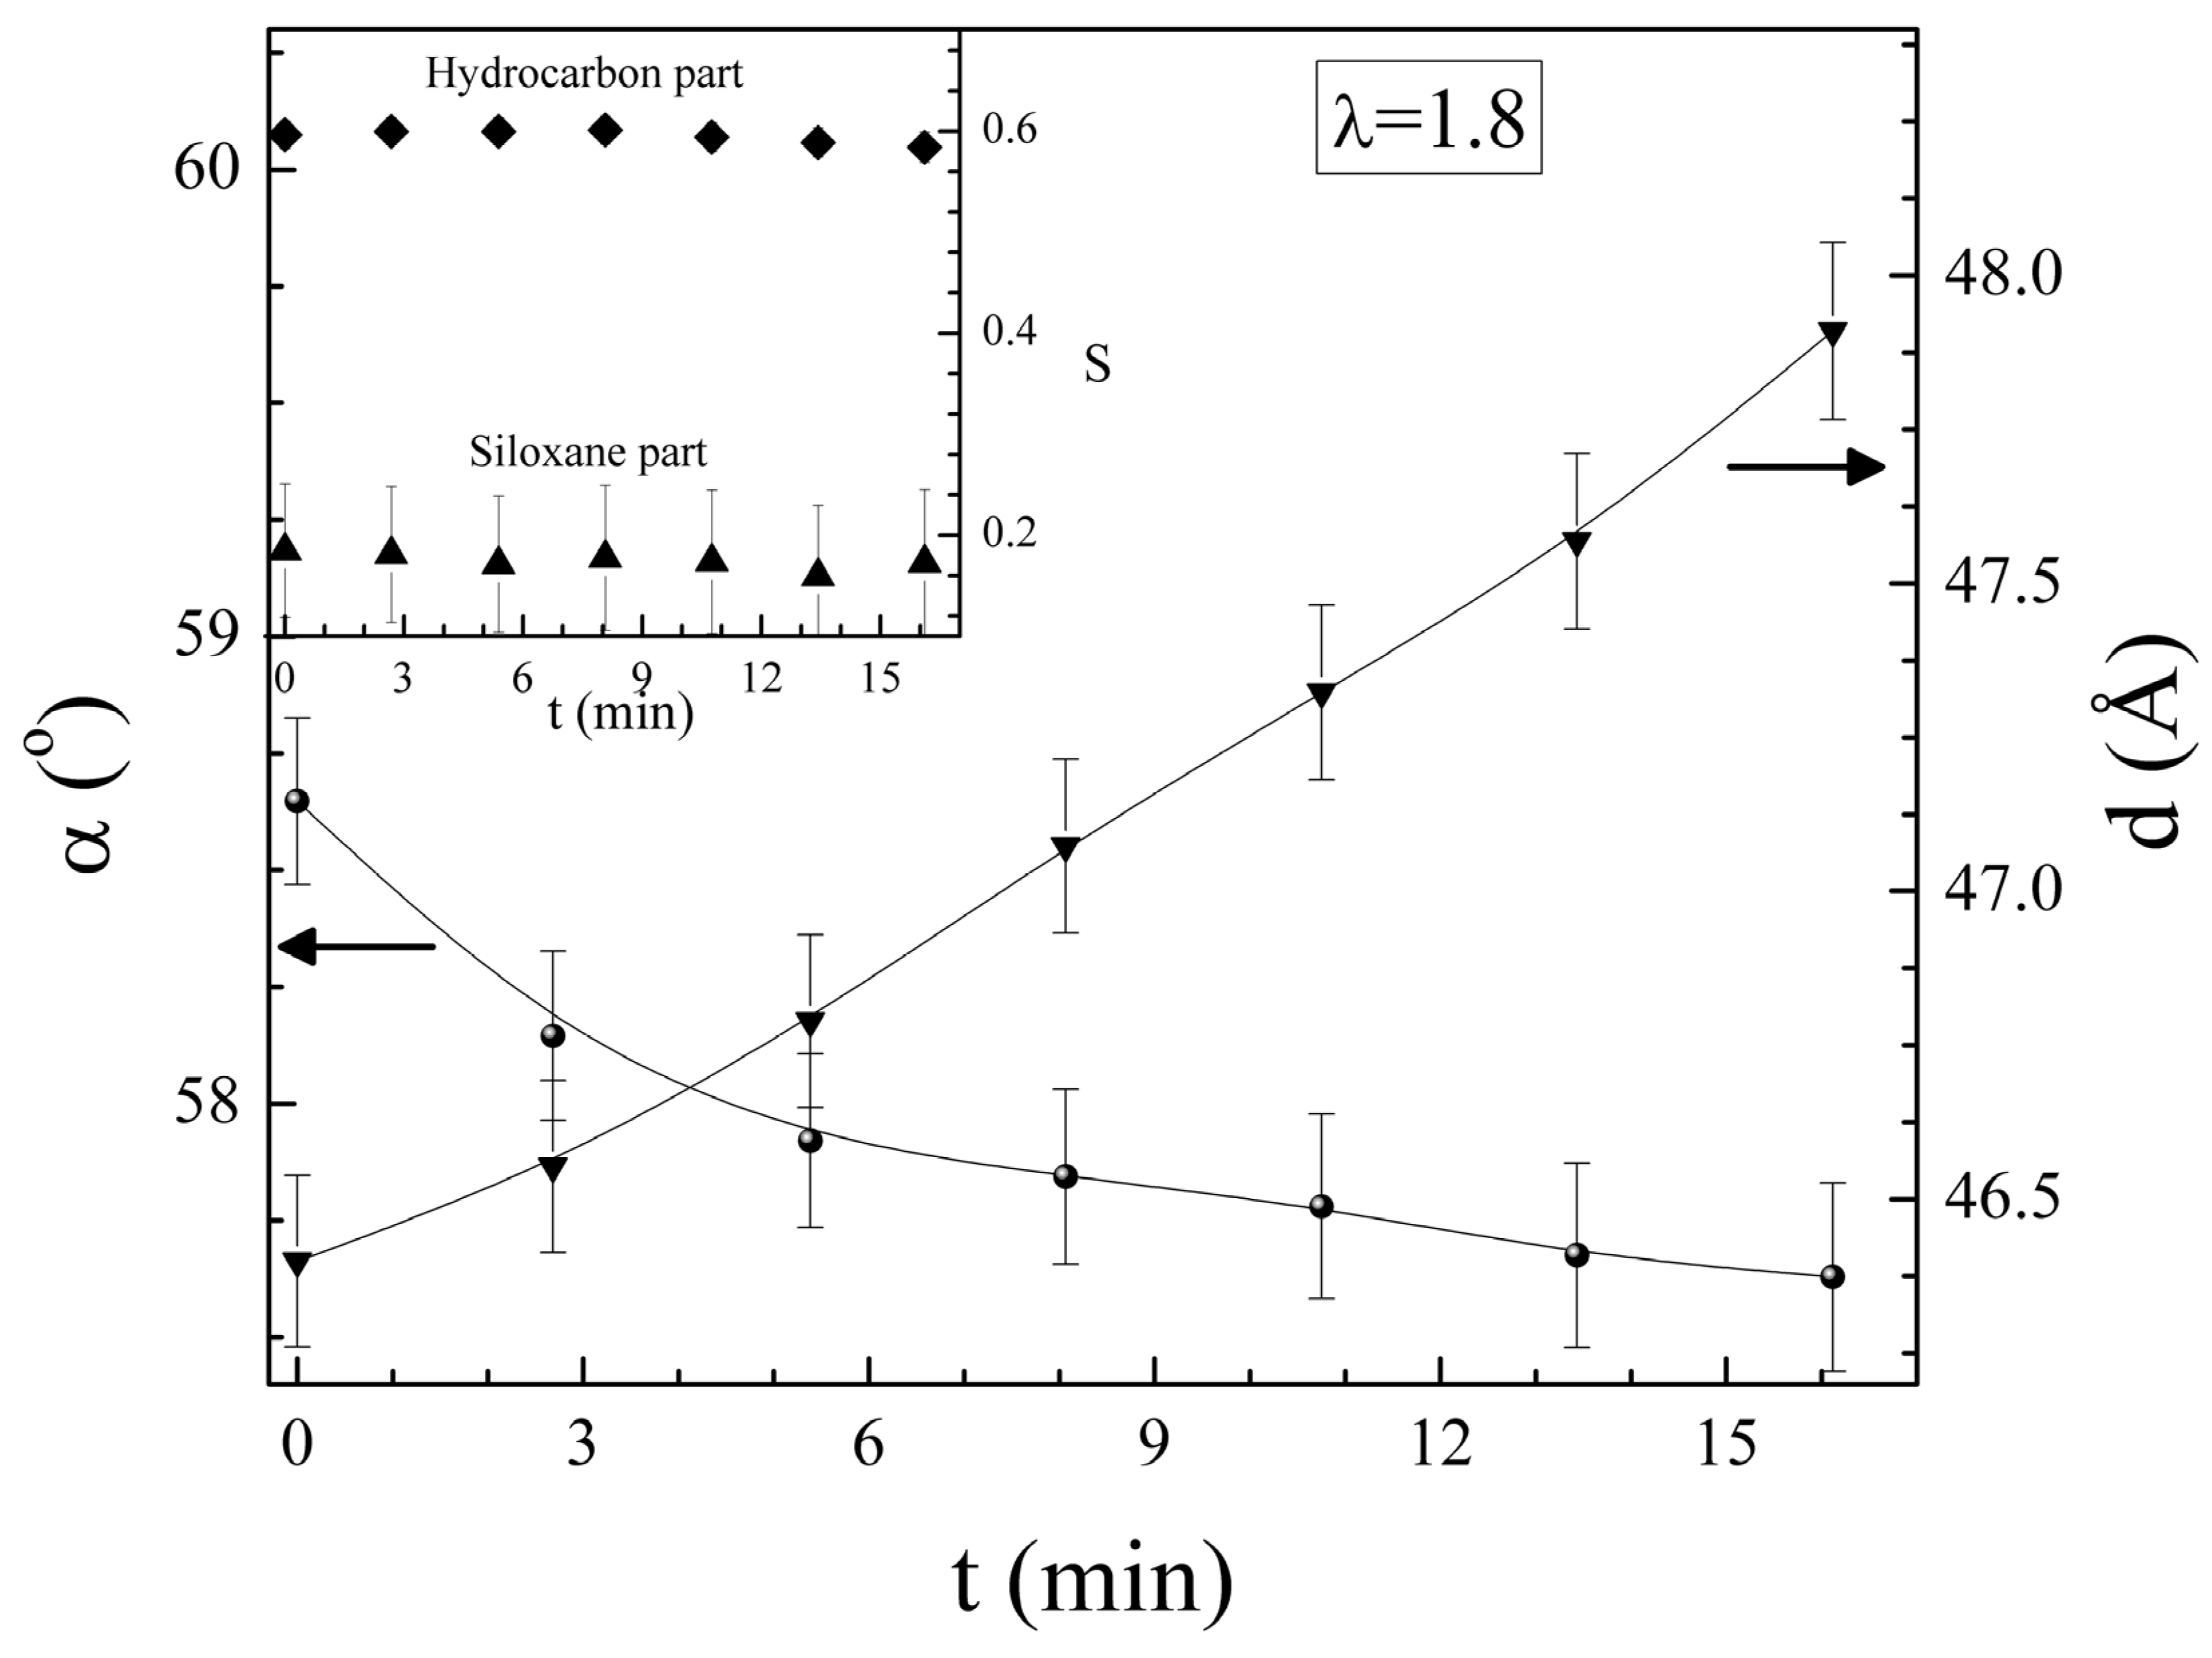
is predominantly aligned along the stretch direction. A monodomain state such as this can again be stretched, both parallel and perpendicular to Crystals 03 00363 i014 , to study the effect on the elongated monodomain state.
Figure 6. Time dependence of the residual strain of LCE1 uniaxially stretched to different initial strains at room temperature [20]. For fractional strains above 0.5 (or, 50%), the elastomer retains part of the imparted strain. The amount of strain retained appears to increase with the value of initial strain. Most of the strain-recovery occurs within ca. 20 min of releasing the elastomer. Adapted with permission from [20]. Copyright 2012 John Wiley and Sons.
Crystals 03 00363 g006
Three specimens of LCE1 were prepared: one in polydomain and the other two in mechanically induced monodomain states. An initial strain of 200% (λ = 3) was applied and approximately 130% of the strain was retained in the monodomain samples for prolonged periods of time [65]. Figure 7 shows the response characteristics of LCE1 when stretched along the directions parallel and perpendicular to Crystals 03 00363 i014 
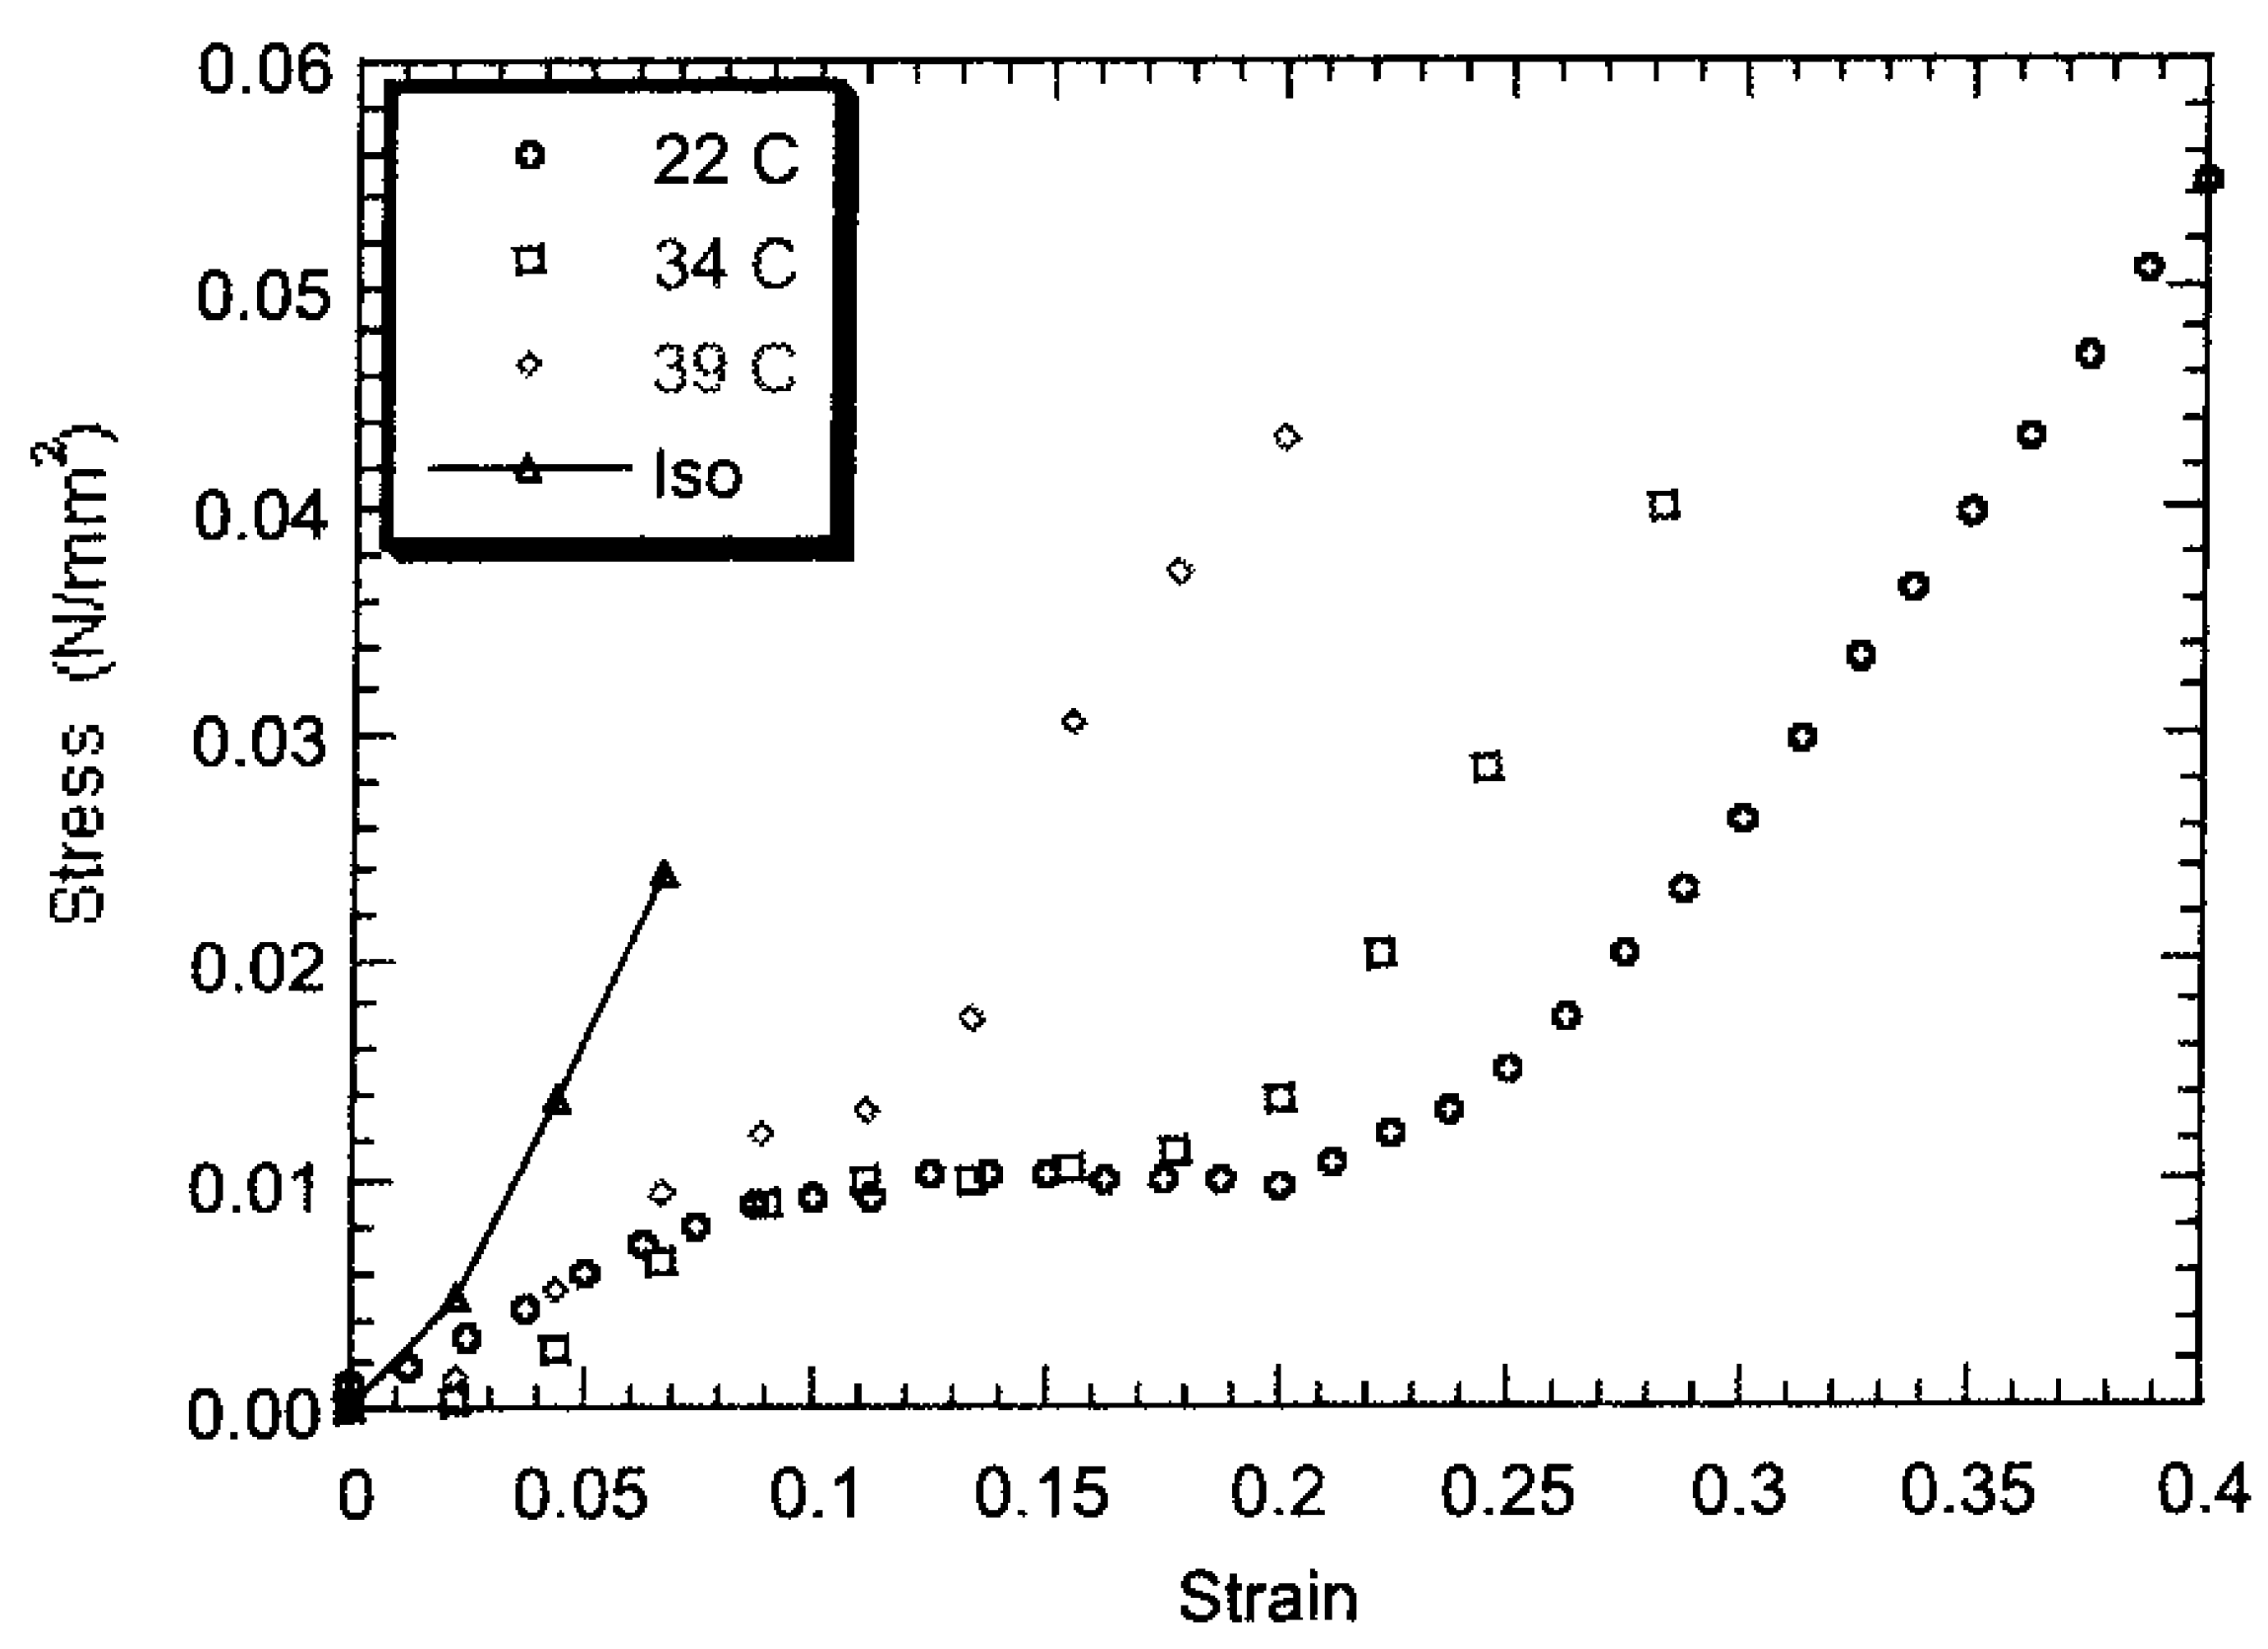
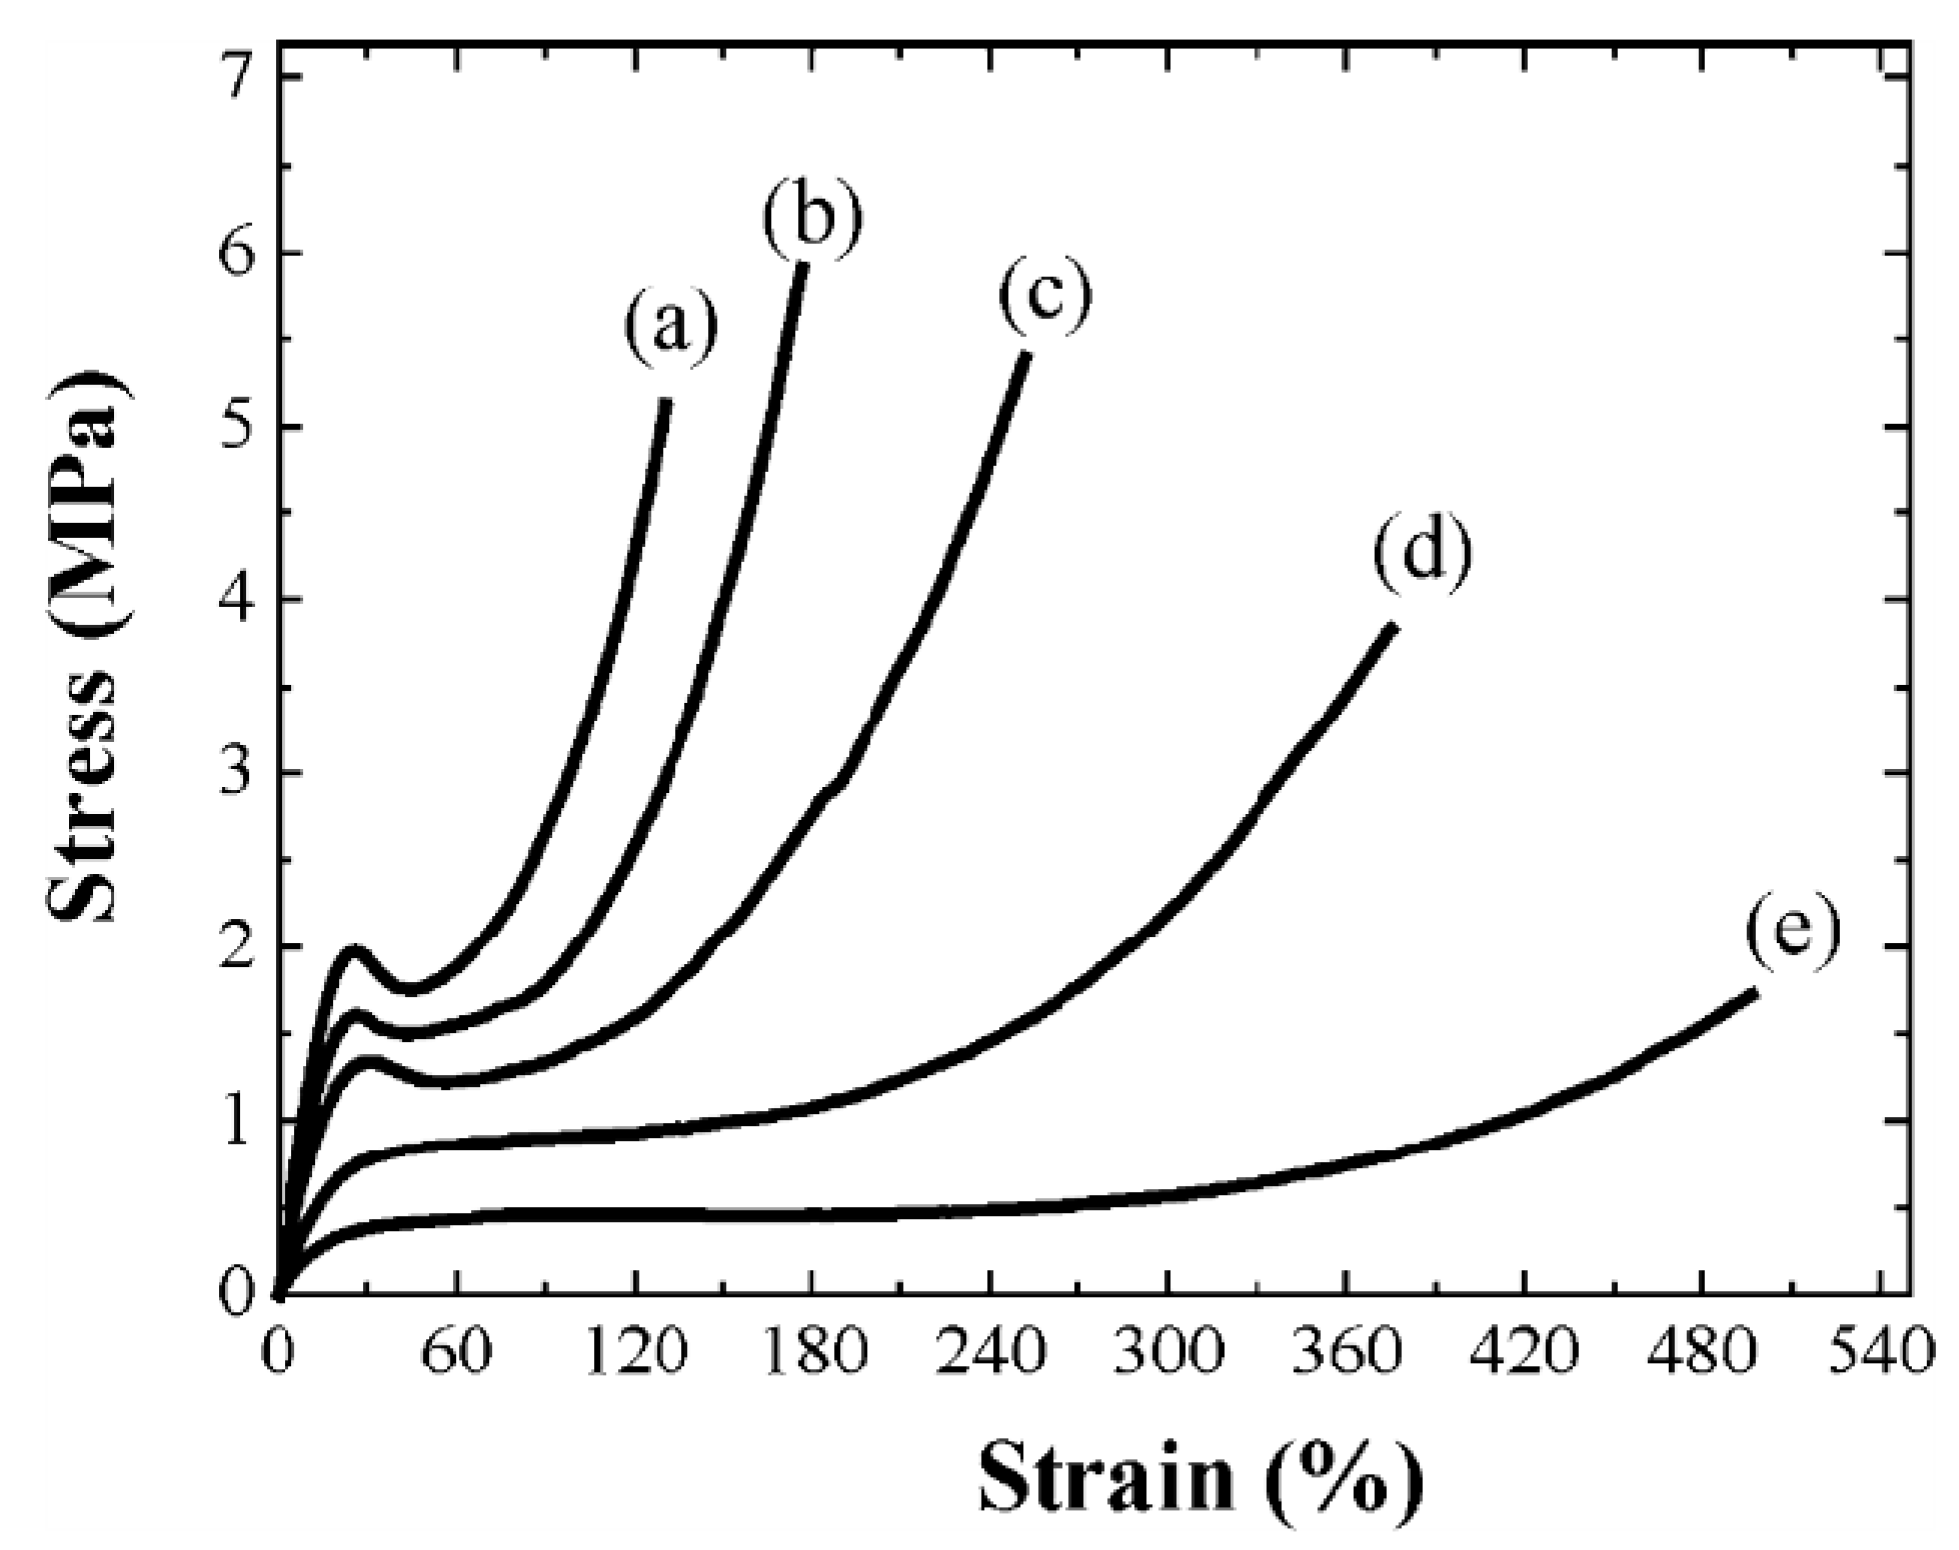
, and also in the initially polydomain state. The value of the elastic modulus is higher when stretched parallel to Crystals 03 00363 i014 than in one in the perpendicular direction. Also, the width of the plateau region is considerably reduced when stretched parallel to Crystals 03 00363 i014 . For stretching in the direction perpendicular to Crystals 03 00363 i014 the stress-strain plateau extends up to a large strain (of ~500%) until the film breaks [65]. A volume preserving narrowing of the width is observed as the film is elongated [50]. To study this effect as a function of cross-linking density, several samples were prepared with cross-linking concentrations from 5% to 25%. Increasing crosslinkage density gave rise to higher rigidity and an increase in glass transition temperature [60]. Also, the P–M plateau became shorter with increasing crosslinker content, and at higher concentrations, a yield point was observed, Figure 8.
Figure 7. Real time stress-strain plot for LCE1 stretched parallel and perpendicular to the global director. Rate of elongation: 0.125 mm/s. These plots reveal directional dependence of the elastic modulus. The system is more (less) rigid in the case of parallel (perpendicular) stretching. Adapted with permission from [65]. Copyright 2008 John Wiley and Sons.
Crystals 03 00363 g007

3.4. Polydomain—Monodomain Transition under Uniaxial Strain

From the measurements on LCE1, it became clear that the stress-strain curve of this polydomain MCLCE has three different regions. The first region is elastic as the system reverts back to its original state after removal of the strain. In the second region, the sample’s behavior is non-elastic and soft; it does not immediately fully recover the initial state upon removal of the strain. The third region is also non-elastic but there is a marked increase in the slope of the stress-strain curve. When the strain is removed, the elastomer attempts to revert back to the pre-strain state but does not fully go back to the original shape in a finite time, case (d) in Figure 8. In the second and third regions, the system is only partially reversible, as shown in Figure 6, and can only be brought back to the original pre-stretched state by raising the temperature above TI or putting the sample in a solvent. The second and third elastic regions are termed, respectively, as anelastic and plastic in earlier reports [20,50,65,67] but to avoid any ambiguity we shall use the terms “non-elastic reversible” and “non-elastic irreversible” following Ricco and Pegoretti [69]. Here, “non-elastic” means that stress and strain are not linearly proportional and “non-reversible” implies that the specimen does not instantaneously return to strain-free state upon removal of stress. At small strains, the LCE1 is composed of polydomains and shows reversible (elastic) stress-strain behavior. At intermediate strains, it enters a plateau region with non-elastic reversible behavior where the strain increases with practically small applied stress. The P–M transition occurs in this region of soft-elasticity via rotations of smectic domains.
Figure 8. Dependence of elastic behavior of a rectangular piece (25 mm × 8 mm × 0.2 mm) of LCE1 on cross-linker concentration; (a) 25 mol %; (b) 20 mol %; (c) 15 mol %; (d) 10 mol %; (e) 5 mol % [60]. For concentrations ≥15%, a yield point appears in the stress-strain curve [60]. Copyright 2009 John Wiley and Sons.
Crystals 03 00363 g008
A detailed study of the plateau region was performed using high-resolution X-ray diffraction (XRD) to understand the underlying mechanism and microscopic structural origin of soft elastic response of the network. Previous observations on this elastomer indicated that most of the strain recovery occurs within the first two minutes (Figure 6) of removing the load. The LCE1 film held at a constant strain, the stress is expected to show a decrease [70,71,72,73,74,75] and the equilibrium stress-strain curve would be lower than what is measured in real time. Figure 9 shows representative XRD patterns of LCE1 over a wide q-range (bottom row) and the magnified small angle X-ray scattering (SAXS) patterns (top row). The images shown are taken approximately twenty minutes after the induction of the corresponding strain.
The WAXS peaks correspond to the lateral separation of ~4.2 Å between the mesogens. The ring corresponding to ~7.2 Å arises from the flexible siloxane segments. This includes contributions from the randomly placed siloxane-based crosslinkers and the siloxane spacers attached to the main chains, which appear to nano-segregate [20] and become parallel to the stretch direction. Its intensity begins to concentrate in arcs along the vertical direction as the sample is elongated. The siloxane reflections are more diffused than reflections from the hydrocarbon parts suggesting a lower orientational order for the former. These would later be quantified through calculations of the corresponding order parameters S. Also the second harmonic peak, which was always present, became more visible at higher strain (Figure 9: e.g., at λ = 2.1). The presence of the second harmonic points towards formation of well defined smectic density waves.
The first measurement was recorded at λ = 1.0 where all the reflections were diffuse rings, typical of a randomly oriented polydomain state. The azimuthal intensity distribution (or χ-scans) of the WAXS and SAXS peaks are plotted in Figure 10 for different strain values. At lower strains (λ < 1.3), the WAXS reflections still look like a diffuse ring but the SAXS peaks initially develop into two vertical crescents parallel to the stretch direction. The smectic layer distribution remains broad but slight modulation of the SAXS peak is apparent. This shows somewhat poorly aligned SmC layers. The WAXS ring suggests that in the lateral direction, there is negligible orientational bias. Due to the azimuthal degeneracy of the molecular tilt with respect to the smectic layer normal in different domains, the WAXS ring still remains relatively uniform.
With increasing strain, the intensity of the WAXS peaks begins to concentrate in the equatorial direction. The small angle peak becomes even broader and then flat at λ = 1.5. This is because of a gradual development of a chevron like SmC layer structure which becomes discernible only at higher strains. At λ = 1.6, there is a clear indication that the SAXS pattern transforms into two pairs of reflections arising from smectic layers. The two sections of the chevron structure forms with its apex along the stretch direction. At λ = 1.7, the four-spot pattern is completely resolved and becomes better defined with increasing strain (Figure 10: λ = 2.1). The siloxane reflection (the middle ring) also develops a modulation due to partial ordering at high strains (λ > 1.7). The WAXS reflection is still concentrated along the equator suggesting that the molecules have become parallel to the stretch direction while the smectic layers are oblique to it. The angle between the directions of the SAXS and WAXS reflections is a direct measure of the molecular tilt of the mesogens [76].
Figure 9. LCE1: Representative SAXS (top row) and WAXS (bottom row) patterns recorded ~ 20 min after the application of different uniaxial strains in the direction of the red arrows. The patterns in the bottom row also show shadows of parts of the sample oven and the mechanism used for stretching the film sample.
Crystals 03 00363 g009
Unlike the SmC phase of monomer LCs, molecular tilt with respect to the smectic layer normal can not be calculated from measured layer spacing [76] as these materials do not exhibit an untilted, i.e., the SmA phase. As the mesogens align parallel to the direction of the applied stress, the smectic layers do not remain orthogonal to the strain direction. The angle, α, between the strain direction and the smectic layer normal can be directly measured from the diffraction patterns. However, because of the azimuthal degeneracy, smectic layers in a bulk sample tilt in, both, clockwise and counterclockwise directions about the strain direction and appear to develop a chevron-like configuration. The chevron’s apex angle is (180 − 2α) as shown in the inset of Figure 11. In order to measure the angle, α, χ-scans of the diffraction peaks are fitted to Gaussian functions.
Figure 10. LCE1: Azimuthal intensity I (arbitrary units) profiles (χ-scans) for SAXS and WAXS peaks in Figure 9. The red curves are the sum of two Gaussian curves used to determine the peak positions. At λ = 1.5, the SAXS reflections becomes flat at the top due to superposition of unresolved peaks out of which four peaks start to eventually emerge at λ = 1.6, clearly leading to four peaks at λ = 1.7. The WAXS peaks continue to gradually sharpen with increasing strain.
Crystals 03 00363 g010
Both d and α were found to decrease with λ, Figure 11. The layer spacing d ~ 49 Å is maximum at λ ~ 1.35 but decreases at higher strains. The angle α for λ >1.7 approaches its minimum value accompanied by a decrease in d which points towards an increase in molecular tilt at higher strains. In contrast, the changes in the chevron structure show a decrease in angle α. Evidently, the chevron angle and the mesogens tilt angle appear to change in opposite directions with increasing strain. The behavior of these two SmC elastomers with strain is unlike conventional lower mass liquid crystals where an increase in the chevron angle is always accompanied by an increase in the molecular tilt.
The dependence of S on strain can be calculated following the method of P. Davidson, et al., [77], by analyzing the χ-scans of the WAXS hydrocarbon and siloxane peaks. This procedure yields the global value of S as X-ray scattering measures the ensemble average over a large number of micro-domains. With increasing strain, the χ-scans corresponding to the siloxane peaks become sharper, albeit to a much lesser extent than the hydrocarbon peaks. This is reflected in the corresponding values of S, for the siloxane and the hydrocarbon parts, shown in Figure 11. The value of S for the hydrocarbon parts of the mesogens becomes as high as 0.83 but saturates at ~0.4 for the siloxane segments.
Figure 11. LCE1: Dependence of S, d and α in strain λ for LCE1. All values are calculated after ~20 min of equilibration at each strain. The dashed-dotted lines at strains of 1.35 and 1.8 serve as guide to eye separating the three elastic regions.
Crystals 03 00363 g011
The elastomer’s behavior under strain (Figure 11) can be understood as follows. Below a small threshold strain (λ ~ 1.2), an externally applied mechanical force acts on the polymer network and tries to decrease its entropy. Removal of the strain leads to an “entropic” elastic response [15] of the network in the (initial) elastic region of the stress-strain curve (Figure 7). In this region, the orientations of domain-directors remain poorly defined. The global S remains nearly zero and smectic layers are generally poorly but vertically aligned. At higher λ, the system enters the plateau region and the domain-directors are rendered increasingly parallel to the stretch direction. Reorientation of the domains and a rapid rise in S lead to intrinsic enhancement of the sample’s length resulting in the plateau (Figure 7). In this region, the SmC layers are oriented with respect to the director at a polar angle equal to the molecular tilt but are azimuthally degenerate. X-rays probe the smectic layers oriented on either side of the stretch direction for which the smectic layer normal lies in a plane perpendicular to the incident beam. The diffraction results would be indistinguishable from chevron-like structure of smectic layers.
Beyond the plateau, at a strain of λ ~ 3.0 the reorientation of the microdomains is complete. The degree of reorientation and further increase in S is limited by random crosslinking of the network and the presence of chain entanglement and hairpin defects. As the macroscopic S reaches saturation, any additional external stress acts directly on the elastomer network. The measured value of S for the siloxane part shows a similar behavior but remains small due to the contribution from both the ordered nano-segregated siloxane spacers and the randomly placed siloxane crosslinkers. An attempt has been made to fit it to a widely used phenomenological logistic growth model [78] that yields the equations shown as insets in Figure 11. In this model, there is a lower and an upper limit of saturation (0 ≤ S ≤ 1) for the parameter S. The system initially responds slowly followed by a rapid growth which is later reduced upon reaching a critical value (λc = 1.7) of strain, and beyond which it slowly approaches the saturation value Smax allowed by the system. In the present case, the initial slow alignment of the microdomains is accelerated in the plateau region and then saturates at a maximum values of S = 0.82 and 0.4, for the mesogen and siloxane parts, respectively. The fits show that beyond λ = 1.7, the chevron monodomain structure is well formed. This observation is consistent with the results in Figure 9, where the separation of chevrons at λ = 1.7 is apparent.
Figure 12. Plots of layer bend α vs. S of the mesogens during the P–M transition caused by uniaxial stretching show linear correlation between the two quantities. Clearly, the reorientation of the chevron domains towards the stretch direction is related to the increasing orientational order of the mesogenic parts.
Crystals 03 00363 g012
Plots of angle α vs. global S for mesogens (hydrocarbon parts) during the P–M transition are shown in Figure 12 for LCE1 and LCE2. Linear fits to the data reveal higher magnitudes of the slope and the intercept for LCE1, inset in Figure 12. It is evident that: (1) there is a direct linear dependence between the orientational ordering of the mesogens and the chevron angle. The corresponding values of the angle α and S are lower for LCE2 than LCE1 which appears to be related to the introduction of the transverse rod group TR3; (2) with increasing global orientational order of the mesogens, the chevron domains are rotated towards the stretch direction; and (3) the chevron angle and the orientational order of the mesogens remain practically unchanged after the monodomain state is achieved (Figure 11). They reach saturation values determined by the topological constraints imposed by the crosslinkers and defects such as the hairpin and chain entanglement [17].
Figure 13. Schematic depiction of the P–M transition: The top row shows the molecular arrangement inside the sample and the bottom row shows the corresponding XRD patterns as strain is applied in vertical direction. The polymer and crosslinker parts have been omitted for clarity.
Crystals 03 00363 g013
Figure 13 schematically shows the structural changes in the elastomer associated with applied strain and how the diffraction patterns are modified by them. At negligible strains, the elastomer is in the polydomain state with randomly distributed microdomains-directors. This gives rise to broad small- and large-angle diffraction rings. At intermediate strains, the elastomer network is affected, reorienting the randomly distributed polymer chains and extending them in the strain direction. The applied stress causes an extension of the sample and thus internal shear, which appears to be responsible for initially making the smectic layers somewhat parallel to the stretch direction. As the strain increases, polymer chains and thus the mesogens start to be oriented parallel to the stretch direction causing the WAXS ring to change to a pair of arcs along the transverse (equatorial) direction. The SmC layers adopt a chevron-like geometry and the SAXS peaks split into four spots. On further stretching, these peaks become sharper beyond the plateau region and the (chevron) monodomain formation is complete. During the process, the WAXS arcs also become less diffuse suggesting improved alignment of the mesogens. In the final chevron monodomain, the layer normals are distributed at an angle around the stretch direction. Similar results have previously been reported [64,79,80] at the P–M transition from the SmCA (polydomain) to the SmC (chevron) states. The P–M transition in these SmC MCLCE occurs via reorientation of smectic domains from random to well-aligned state when a uniaxial external strain is applied.
The changes in α and d for LCE1 during ~20 min immediately after affecting a strain of 1.8 are shown in Figure 14. The inset in Figure 14 shows the values of S for the hydrocarbon and siloxane parts that remain nearly constant while α decreases and d increases with time. The changes in the latter two parameters are consistent with each other; an increase in d points towards a decrease of molecular tilt. The chevron structure also relaxes with a decreasing value of α.
Figure 14. LCE1: Relaxation of α (left ordinate axis) and d (right ordinate axis) at a constant strain of λ = 1.8 for LCE1. The inset shows the relaxation of S for the hydrocarbon and siloxane parts of the elastomer.
Crystals 03 00363 g014

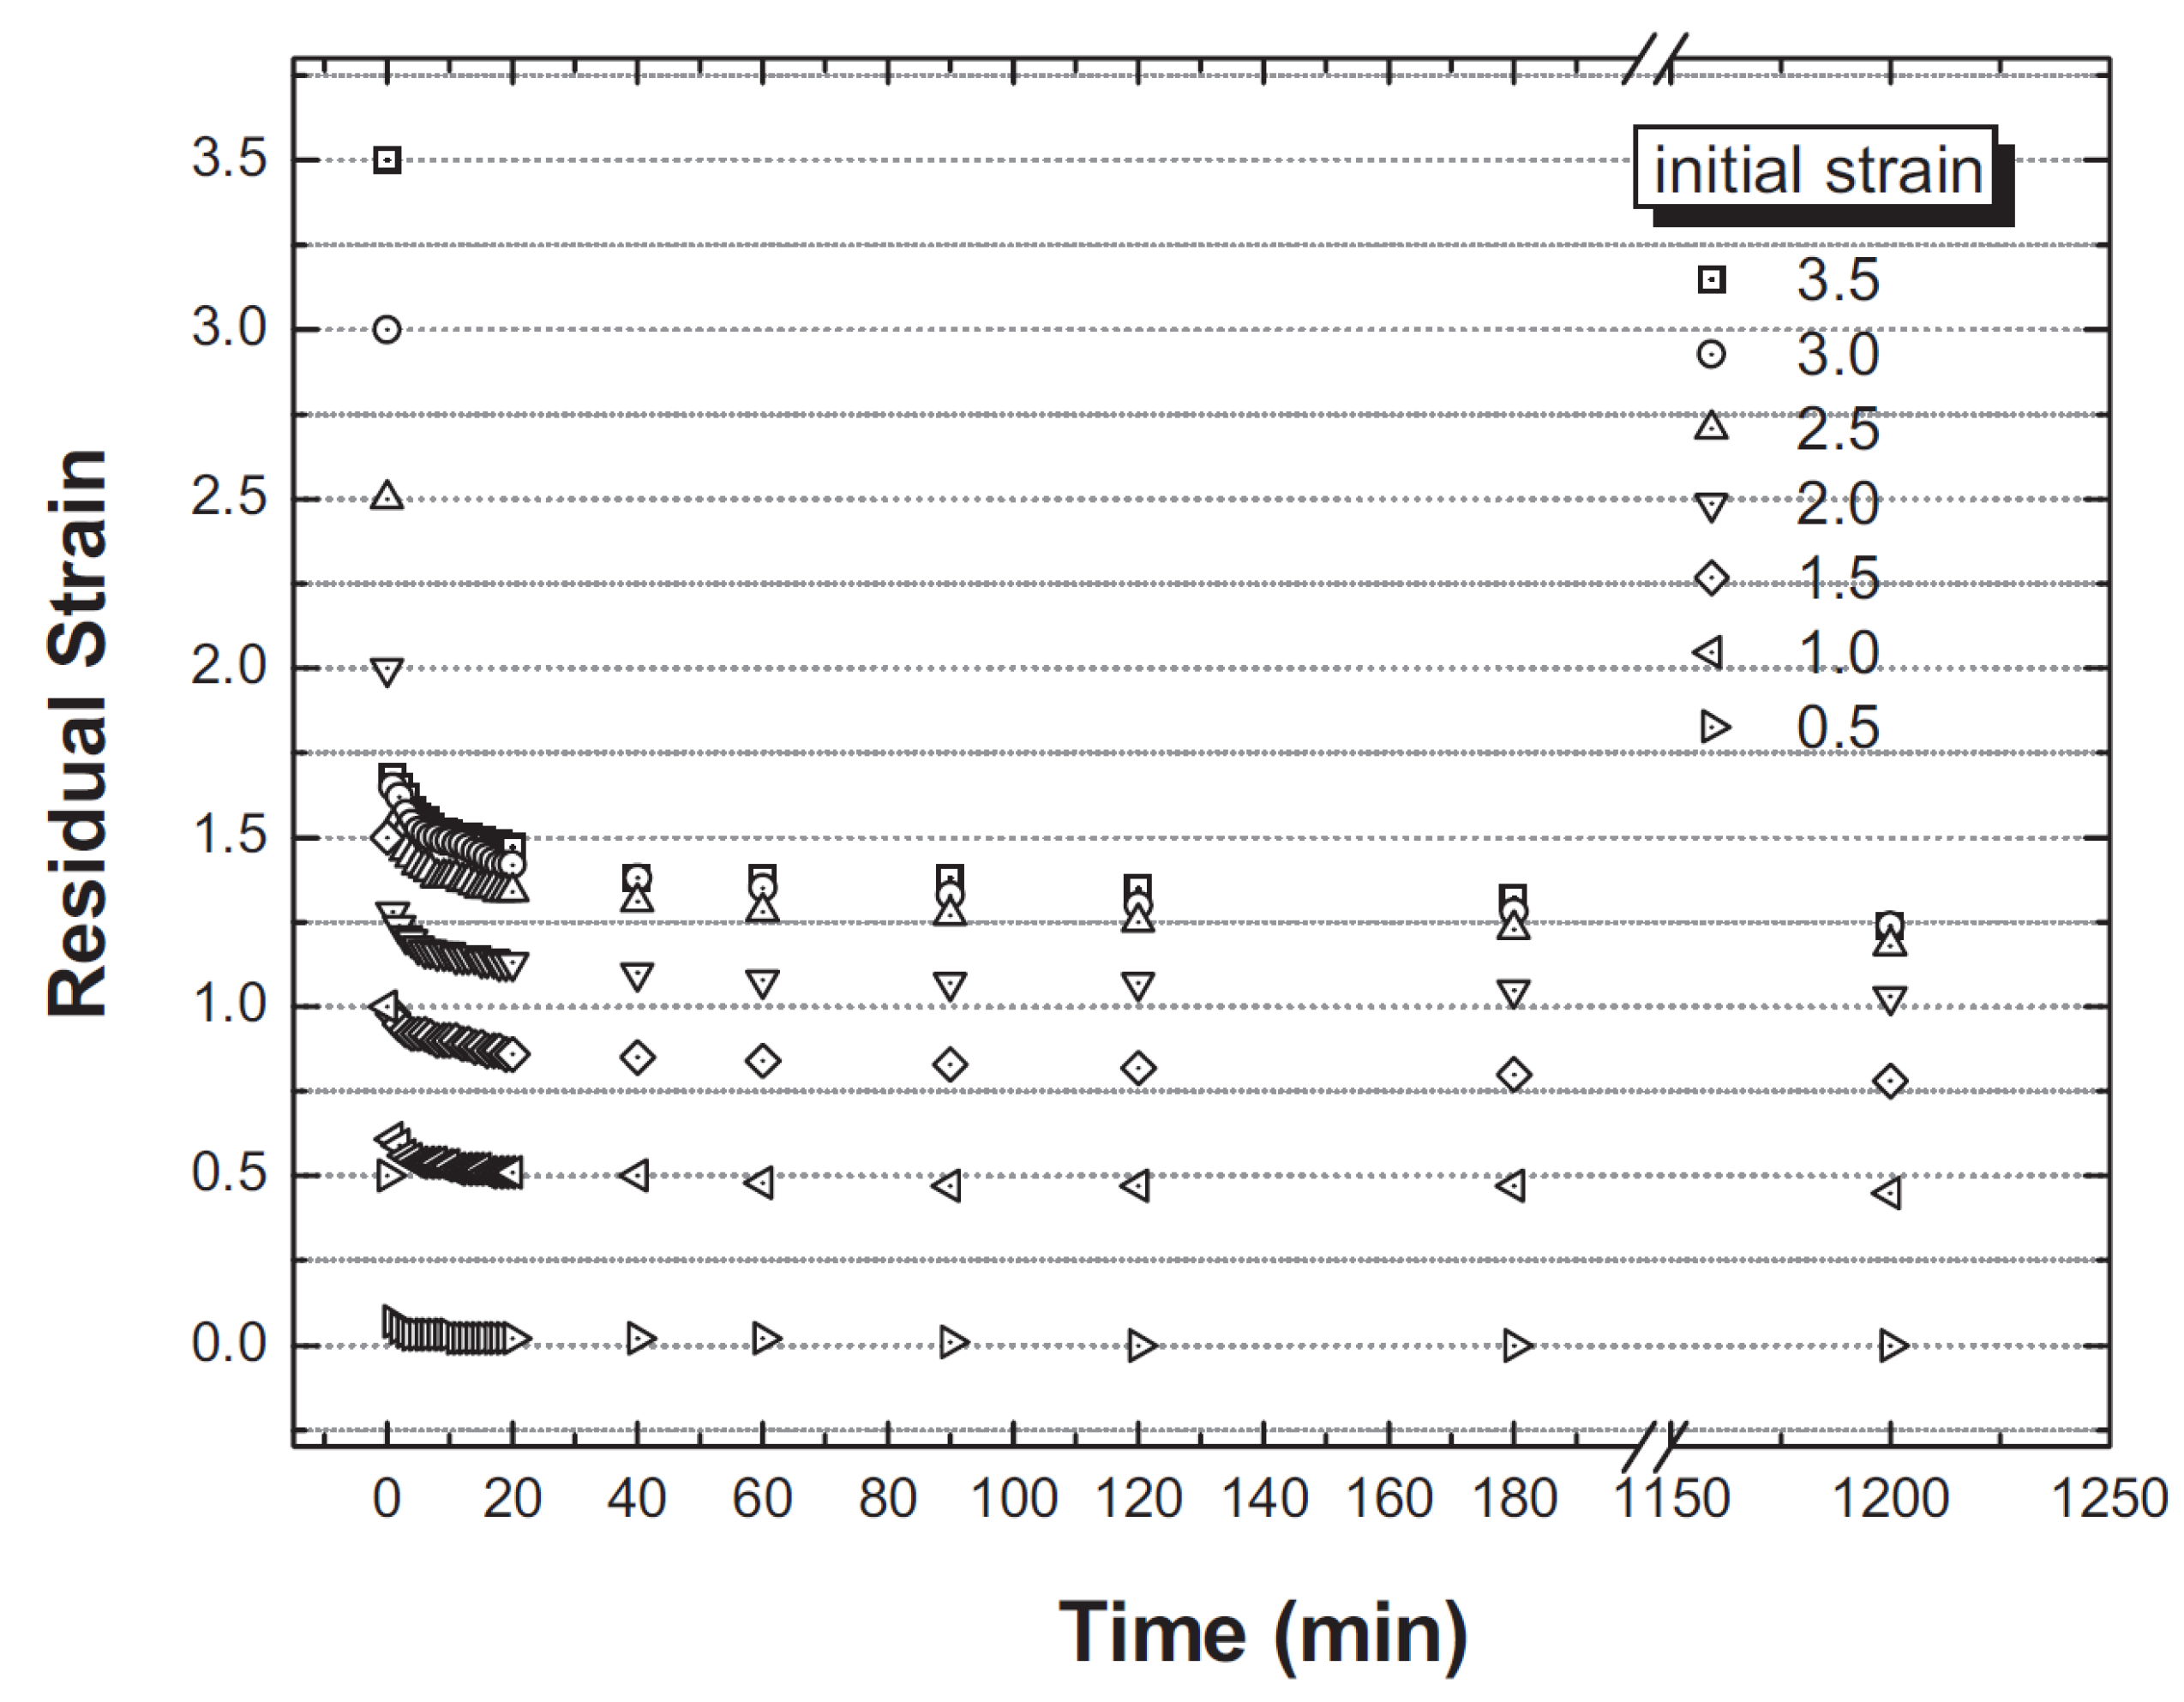
3.5. Strain Retention

To investigate strain retention in the parent LCE1 after achieving the monodomain structure at λ = 4, the lower sample clamp was removed during X-ray experiments but a negligible weight was hung to keep the sample straight. As discussed earlier (Figure 6), the strain within the sample initially relaxes quickly [20] in the first two minutes of the removal of load and, after that, continues to relax at a slower rate. Excluding the first two minutes, the time-relaxation of the measured changes in the layer spacing, S for the hydrocarbon parts, and the layer bend-angle in LCE1 over the next ninety minutes are shown in Figure 15. Based on the observation during the P–M transition, we expect a slow decrease in strain and S to accompany a corresponding increase in d, as is observed. On the other hand, the decrease in α is contrary to expectations. We shall come back to this issue in the next section.
A stretched exponential function [50,72,81]:
Crystals 03 00363 i010
was used to fit S and α during the first ninety minutes. Here, y0 and y1 are the end values of the parameter and β is the stretching exponent. The relaxation behaviors of the orientational order parameter and the layer bend angle are best fitted by:
Crystals 03 00363 i011
Values of the parameters for individual fits are summarized in the caption of Figure 15. The characteristic relaxation time (τ) for the bend angle is approximately four times longer than for S. Eventually, almost after one day, the system is found to be in the SmC phase with α ~ 41° and S ~ 0.6.
Figure 15. LCE1: Time dependence of d, S and α after removal of applied uniaxial strain for LCE1. The solid curves are fits to Equation 2. Equilibrium state was achieved after ca. 90 min with S = 0.68 ± 0.01 and α = 40.0° ± 0.2°. The fitting exponent is almost the same; (0.70 ± 0.12) for S and (0.77 ± 0.07) for α. The relaxation time (26.3 ± 3.4 min) for angle α is approximately four times larger than (6.4 ± 1.0 min) of S.
Crystals 03 00363 g015

3.6. Thermal Length Recovery

By first affecting the P–M transition with uniaxial stretching, allowing the sample to stand and retain strain under negligible load, and then recovering the original polydomain state by heating, one completes the full “shape-memory” cycle of these materials. We measured the global S during stretching of LCE2 (XRD patterns in the top row of Figure 16) at room temperature (about 37.5 °C below the clearing point) and then during heating (bottom row) as the system reverted back to the polydomain state. LCE1 (Figure 9) also exhibits qualitatively the same behavior. During the P–M transition, the SAXS peaks appear first as two vertical arcs parallel to the stretch direction and then split into two pairs of peaks at high strain forming stable SmC chevron domains. With increasing strain, the separation between small angle peaks decreases and saturates in the plateau region to a value <45°. The presence of the second harmonic of layer Bragg reflections establishes the presence of a well-condensed smectic density wave and well-aligned chevron structures. The intensity of WAXS reflections corresponding to the hydrocarbon parts start to concentrate in the equatorial direction, as already discussed in Section 3.4 for LCE1.
Figure 16. Small angle XRD patterns acquired during stretching (top row) and thermal recovery (bottom row) of LCE2 (LCE1 also shows similar behavior). The red arrows show the direction of stretching. The small angle peaks get increasingly close to each other (perpendicular to the stretch direction) as the temperature rises before they form a ring again. Here, PD and MD imply polydomain and monodomain, respectively.
Crystals 03 00363 g016
As the thermal recovery process is initiated, the intensity of the SAXS peaks decreases before they eventually transform into an isotropic ring at temperatures above TI (bottom row). The re-mergence of the four SAXS reflections into two horizontal arcs and then ultimately into an isotropic ring is somewhat different than observed during the stretching when the arcs are first formed in the vertical direction and then split into four spots.
One can explain the difference in smectic layer orientation and, thus the small angle reflections observed during stretching and thermal annealing as follows: initially, the stretching of polymer chains causes internal flow requiring smectic layers to slide which is easier when layers are parallel to the direction of sliding. Any further stretching pulls the polymer chains and renders them statistically increasingly parallel to the direction of elongation. Since the mesogens are embedded in the polymer main chains, the mesogens and the director Crystals 03 00363 i014 
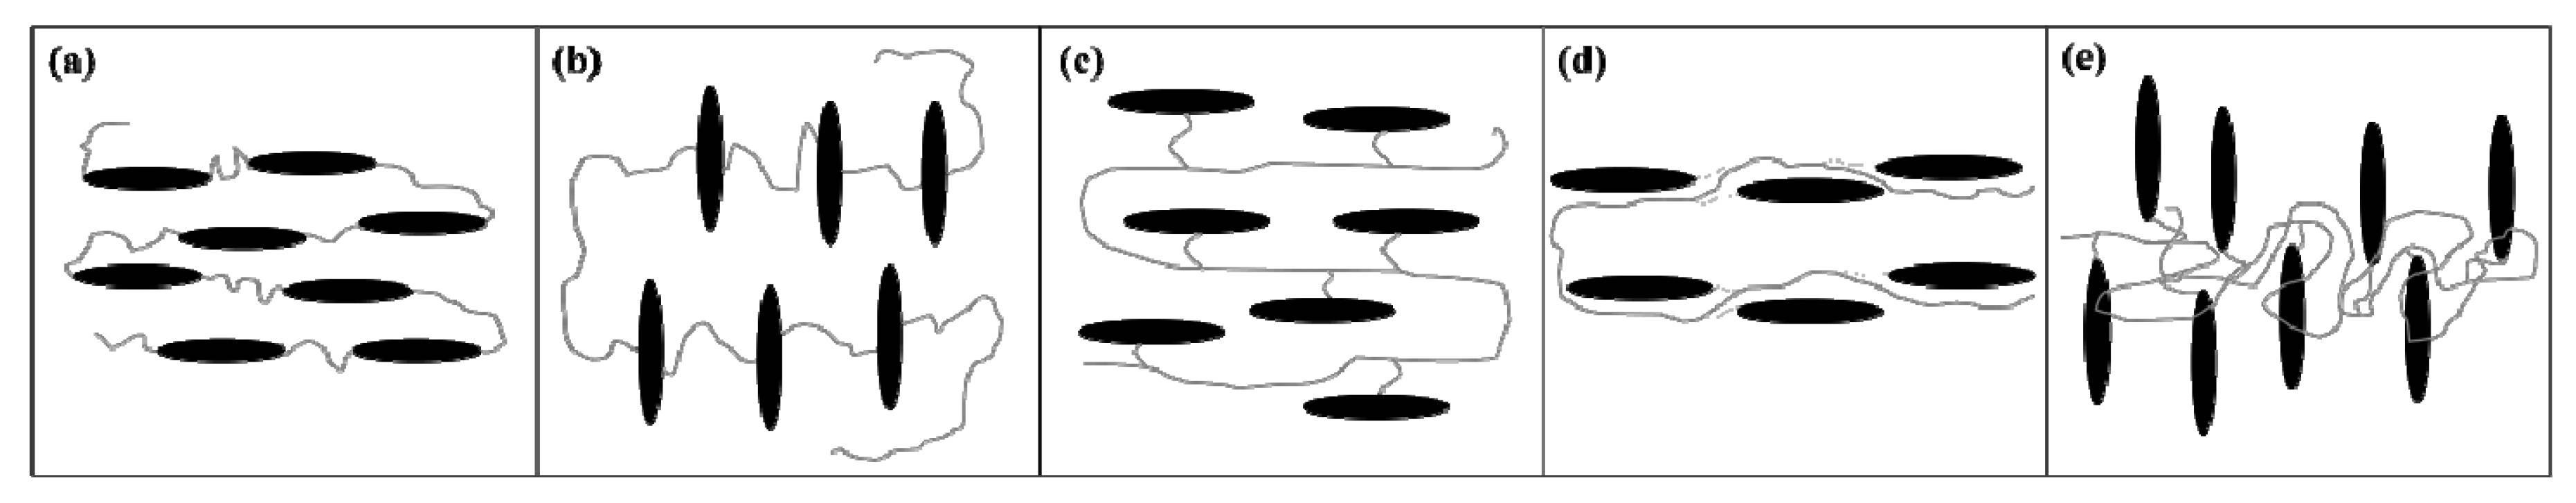
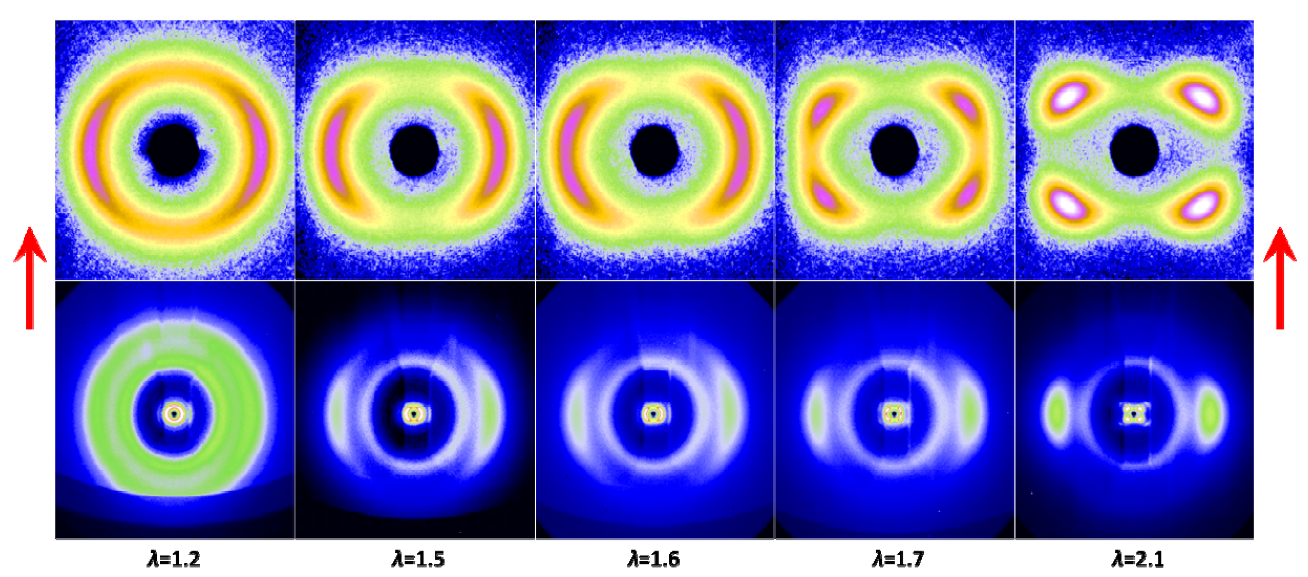
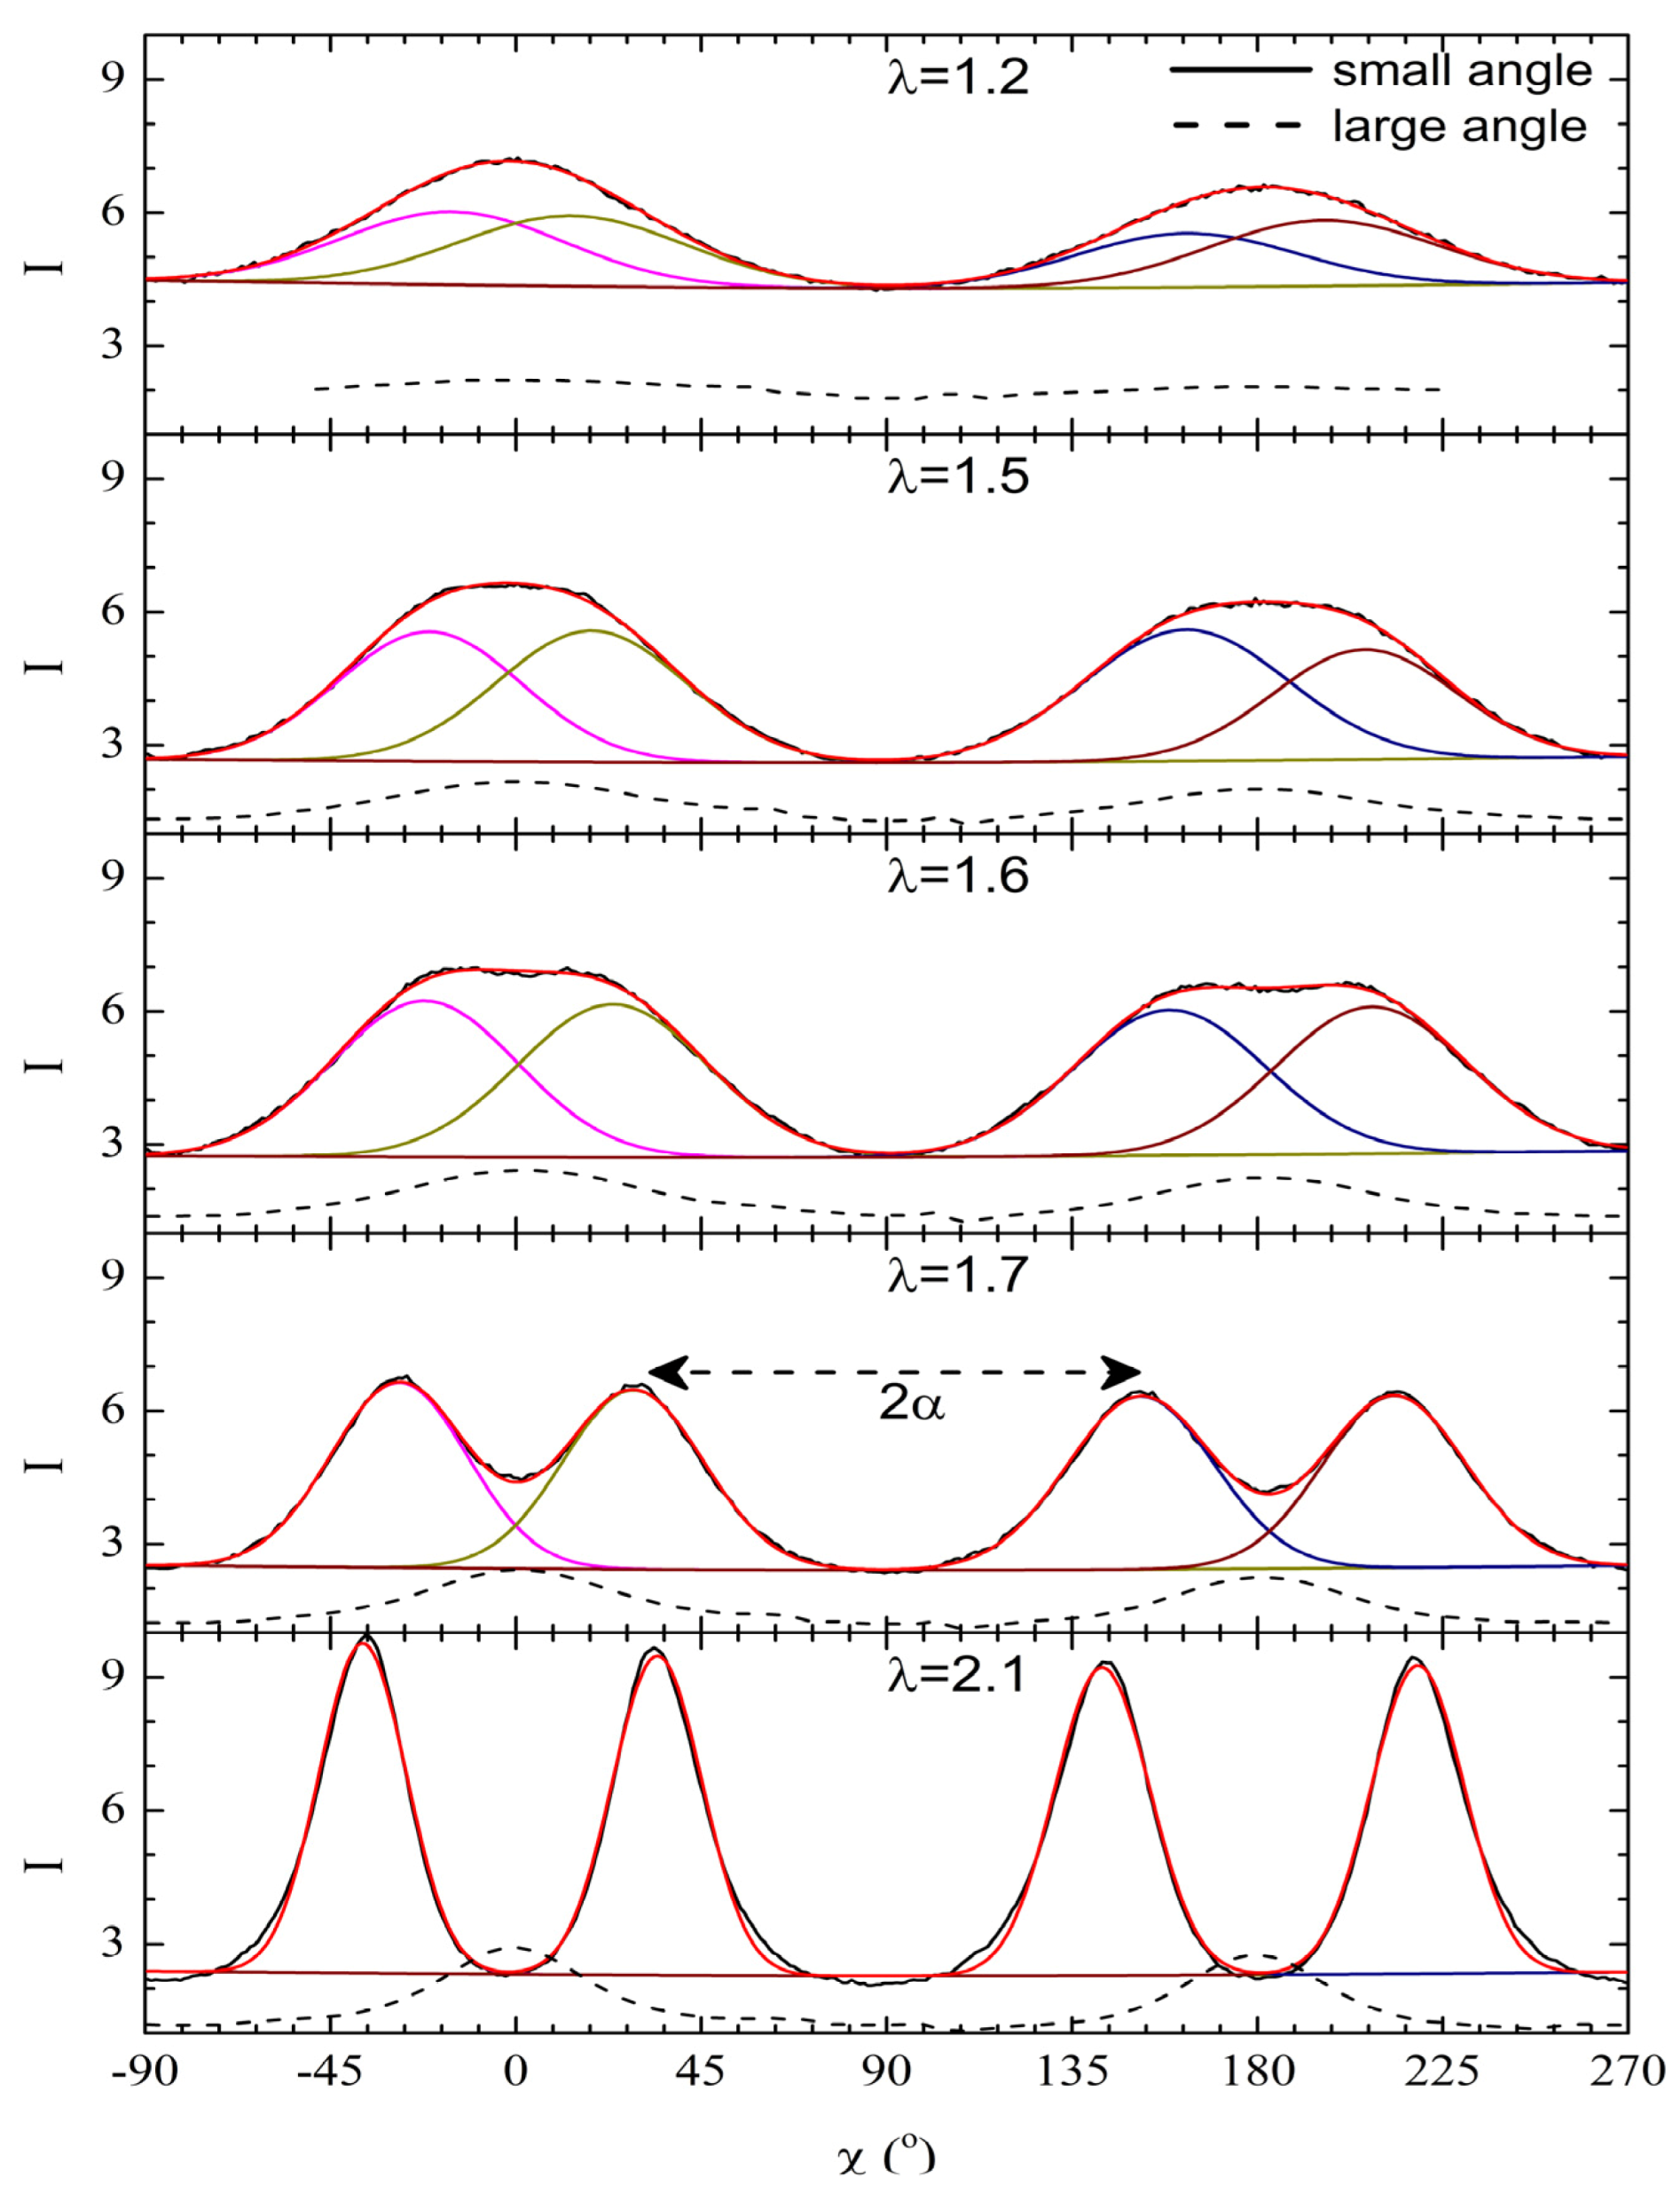
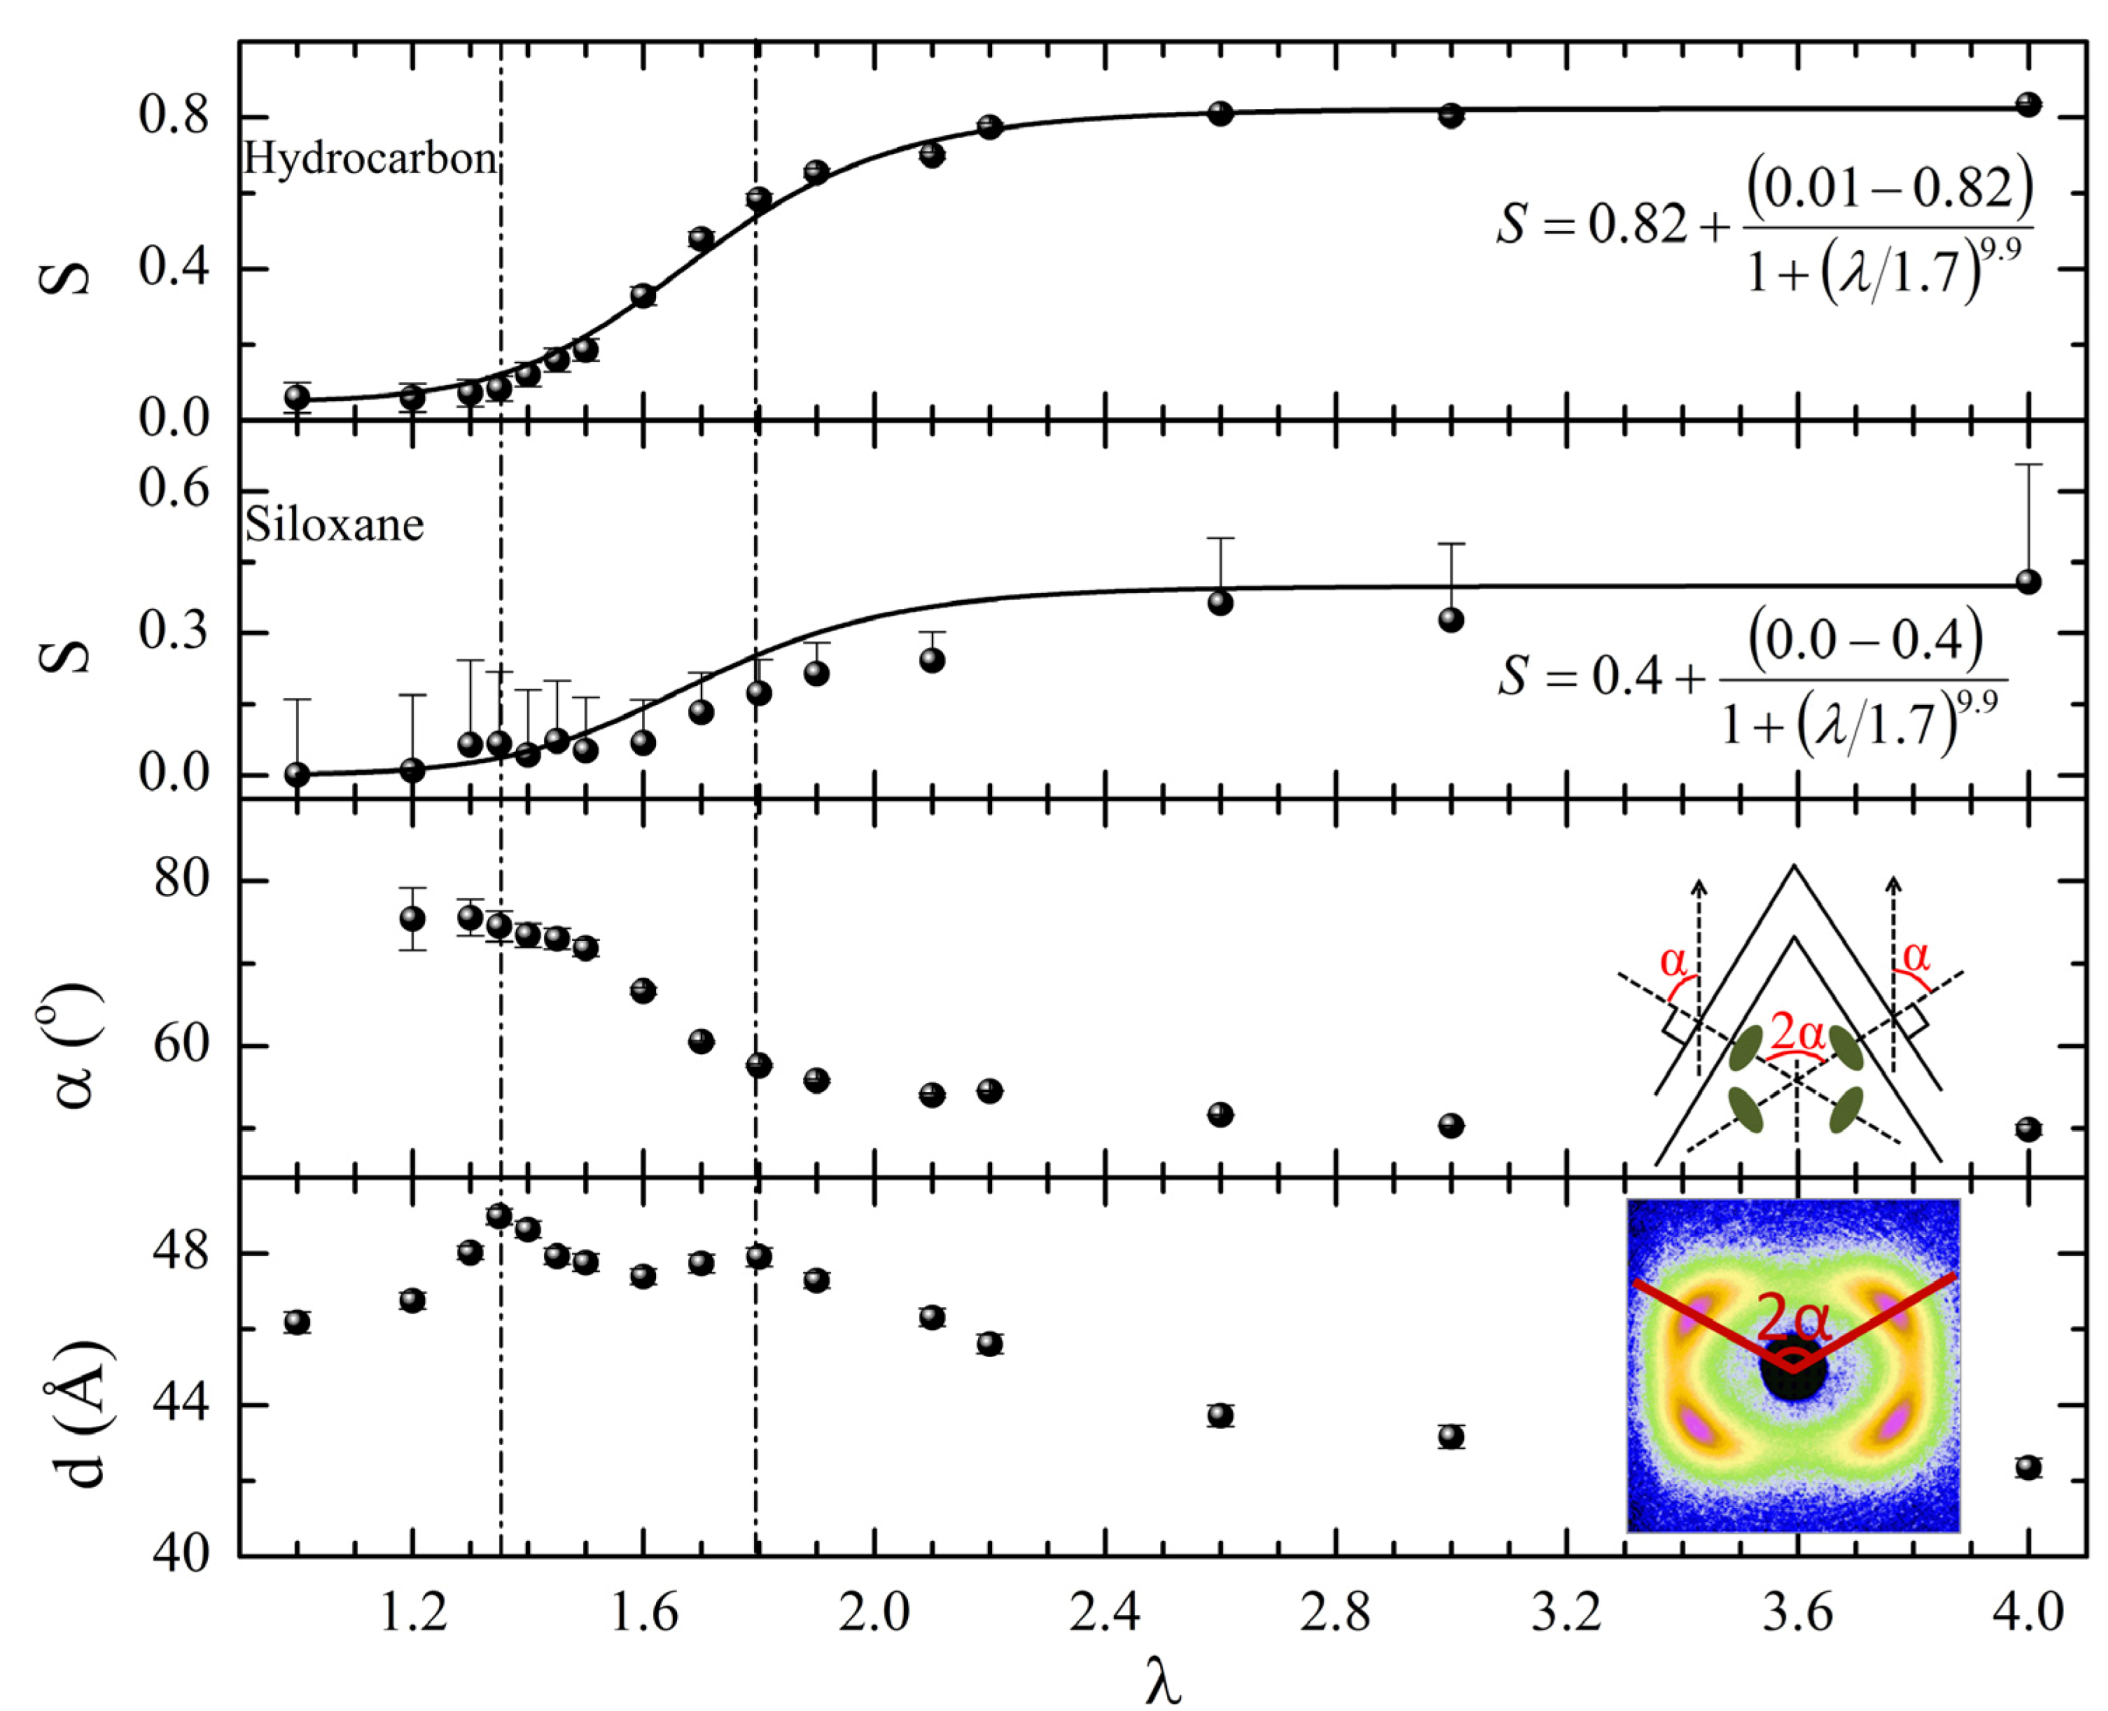
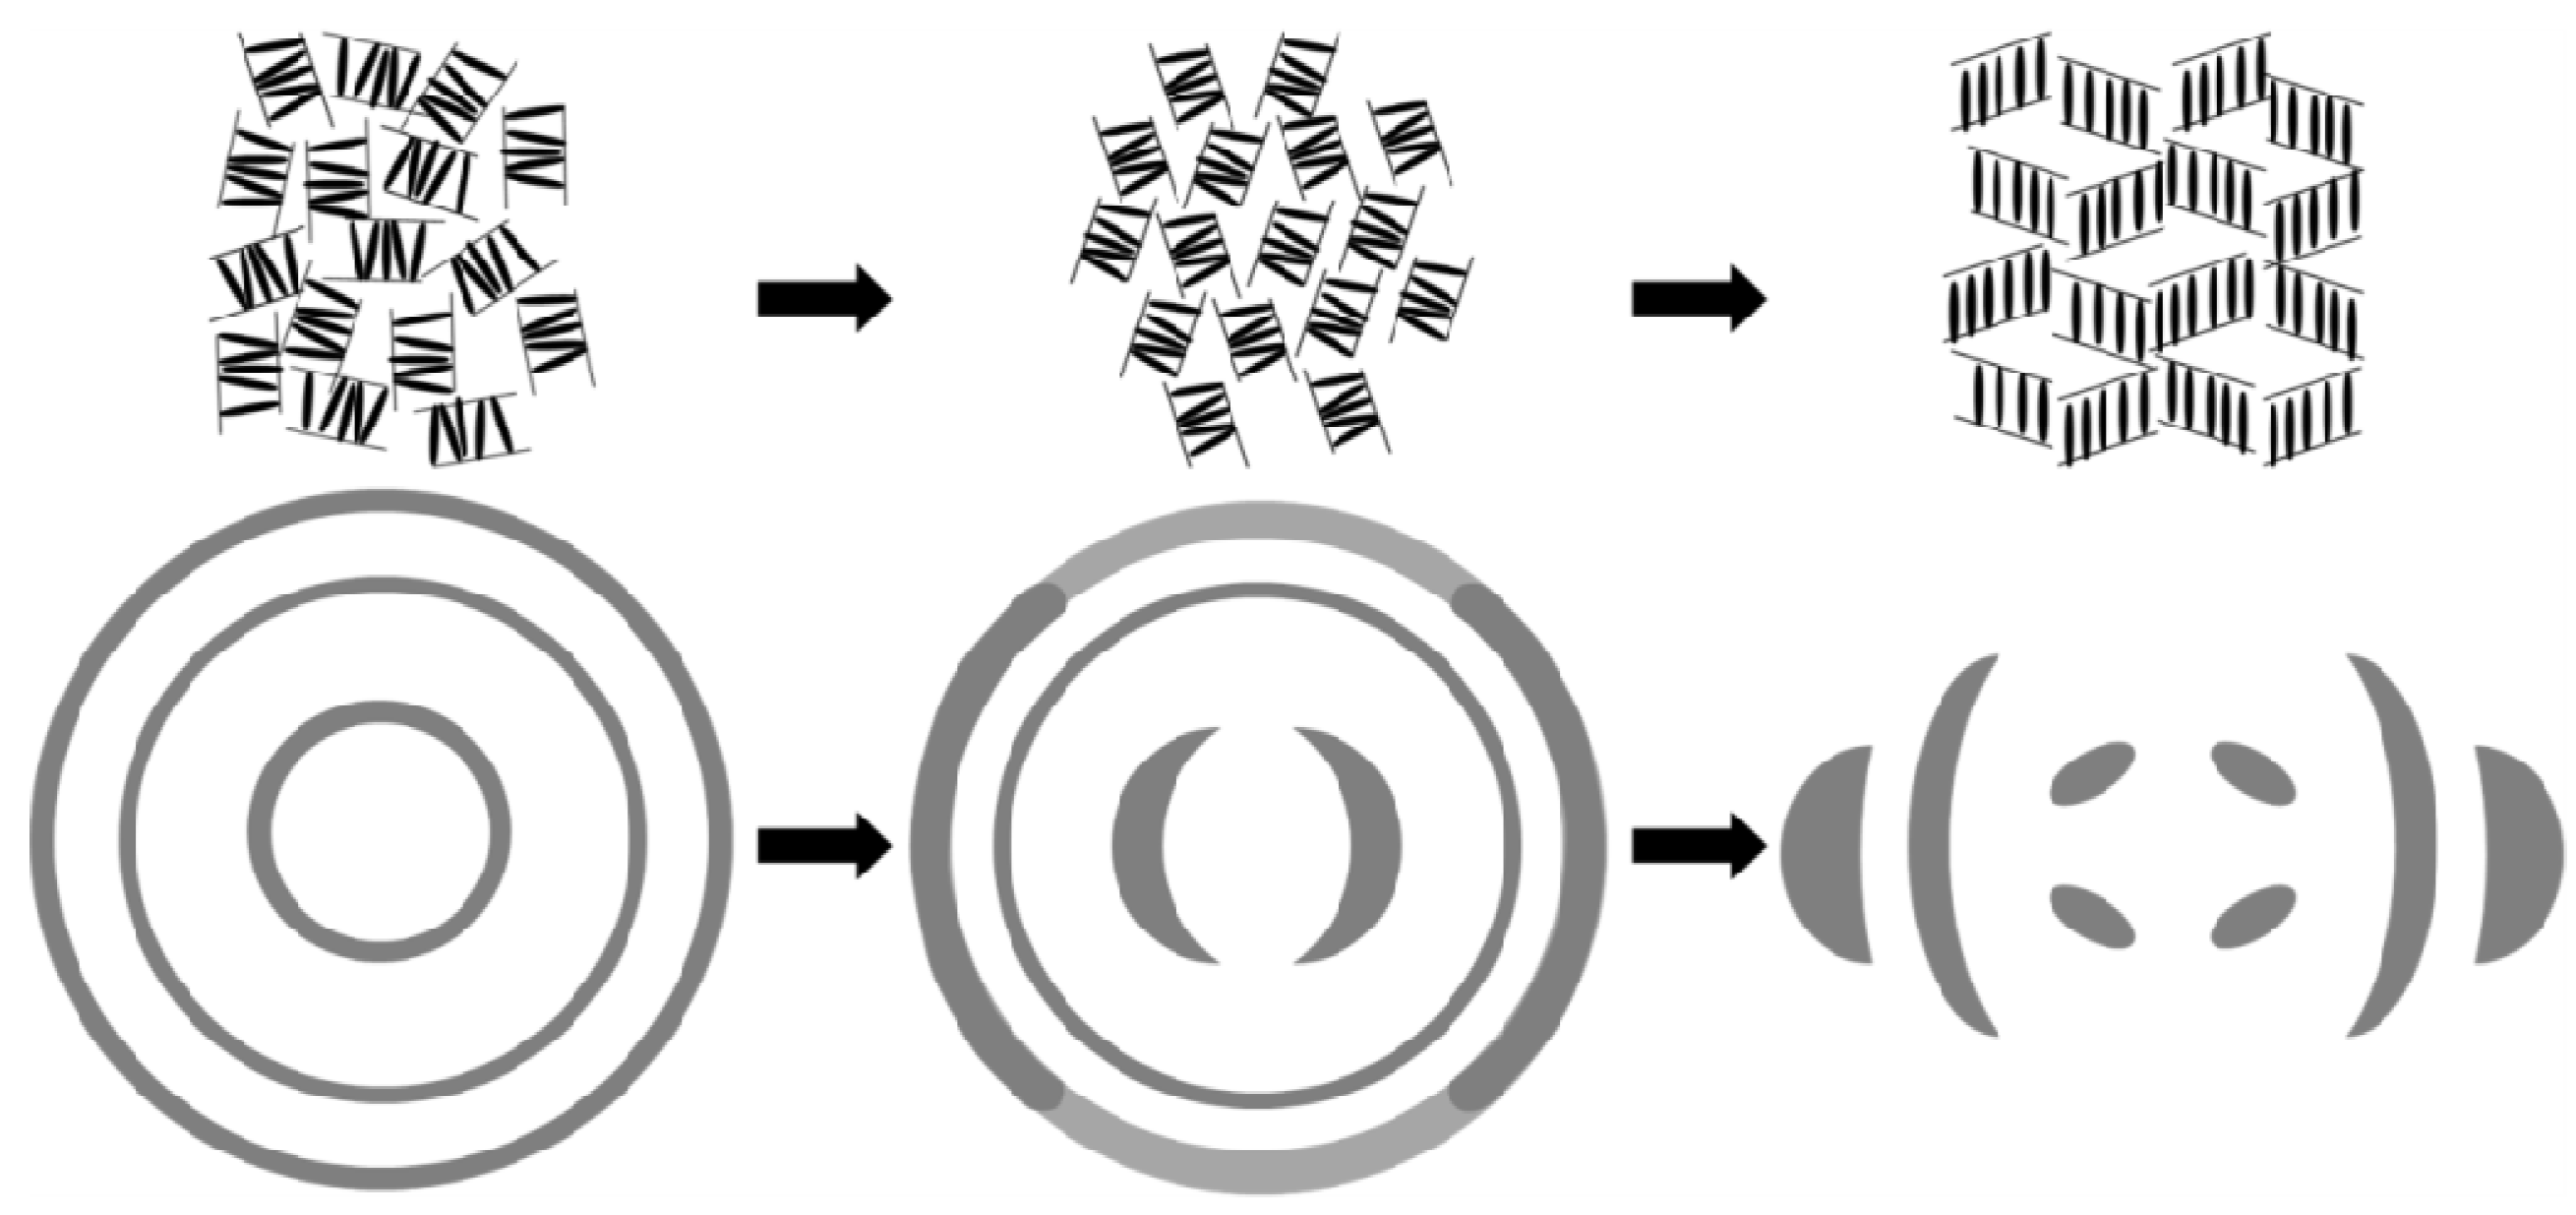
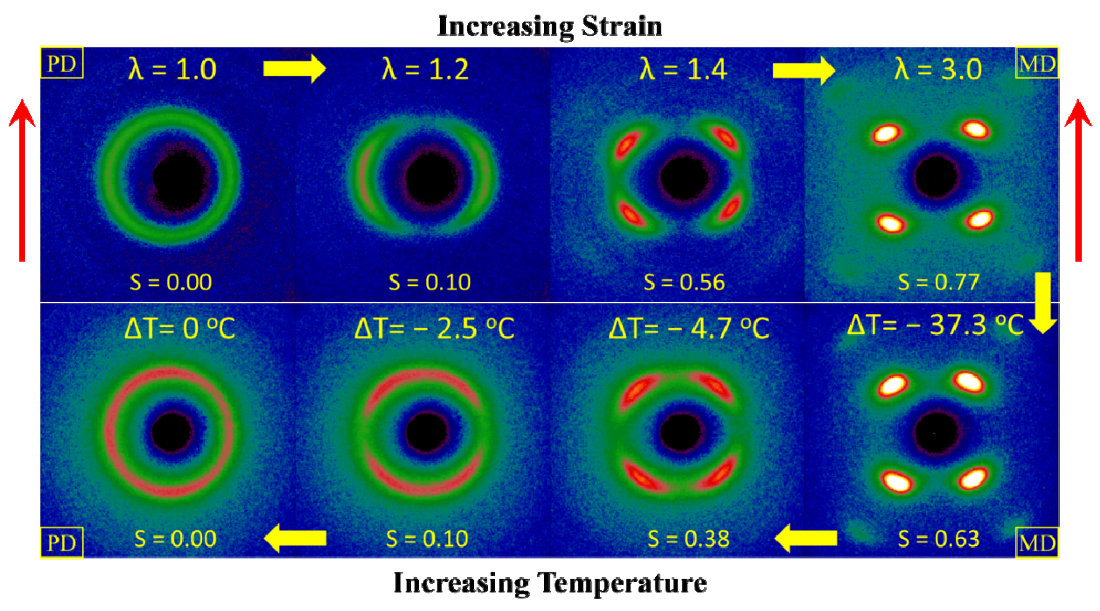
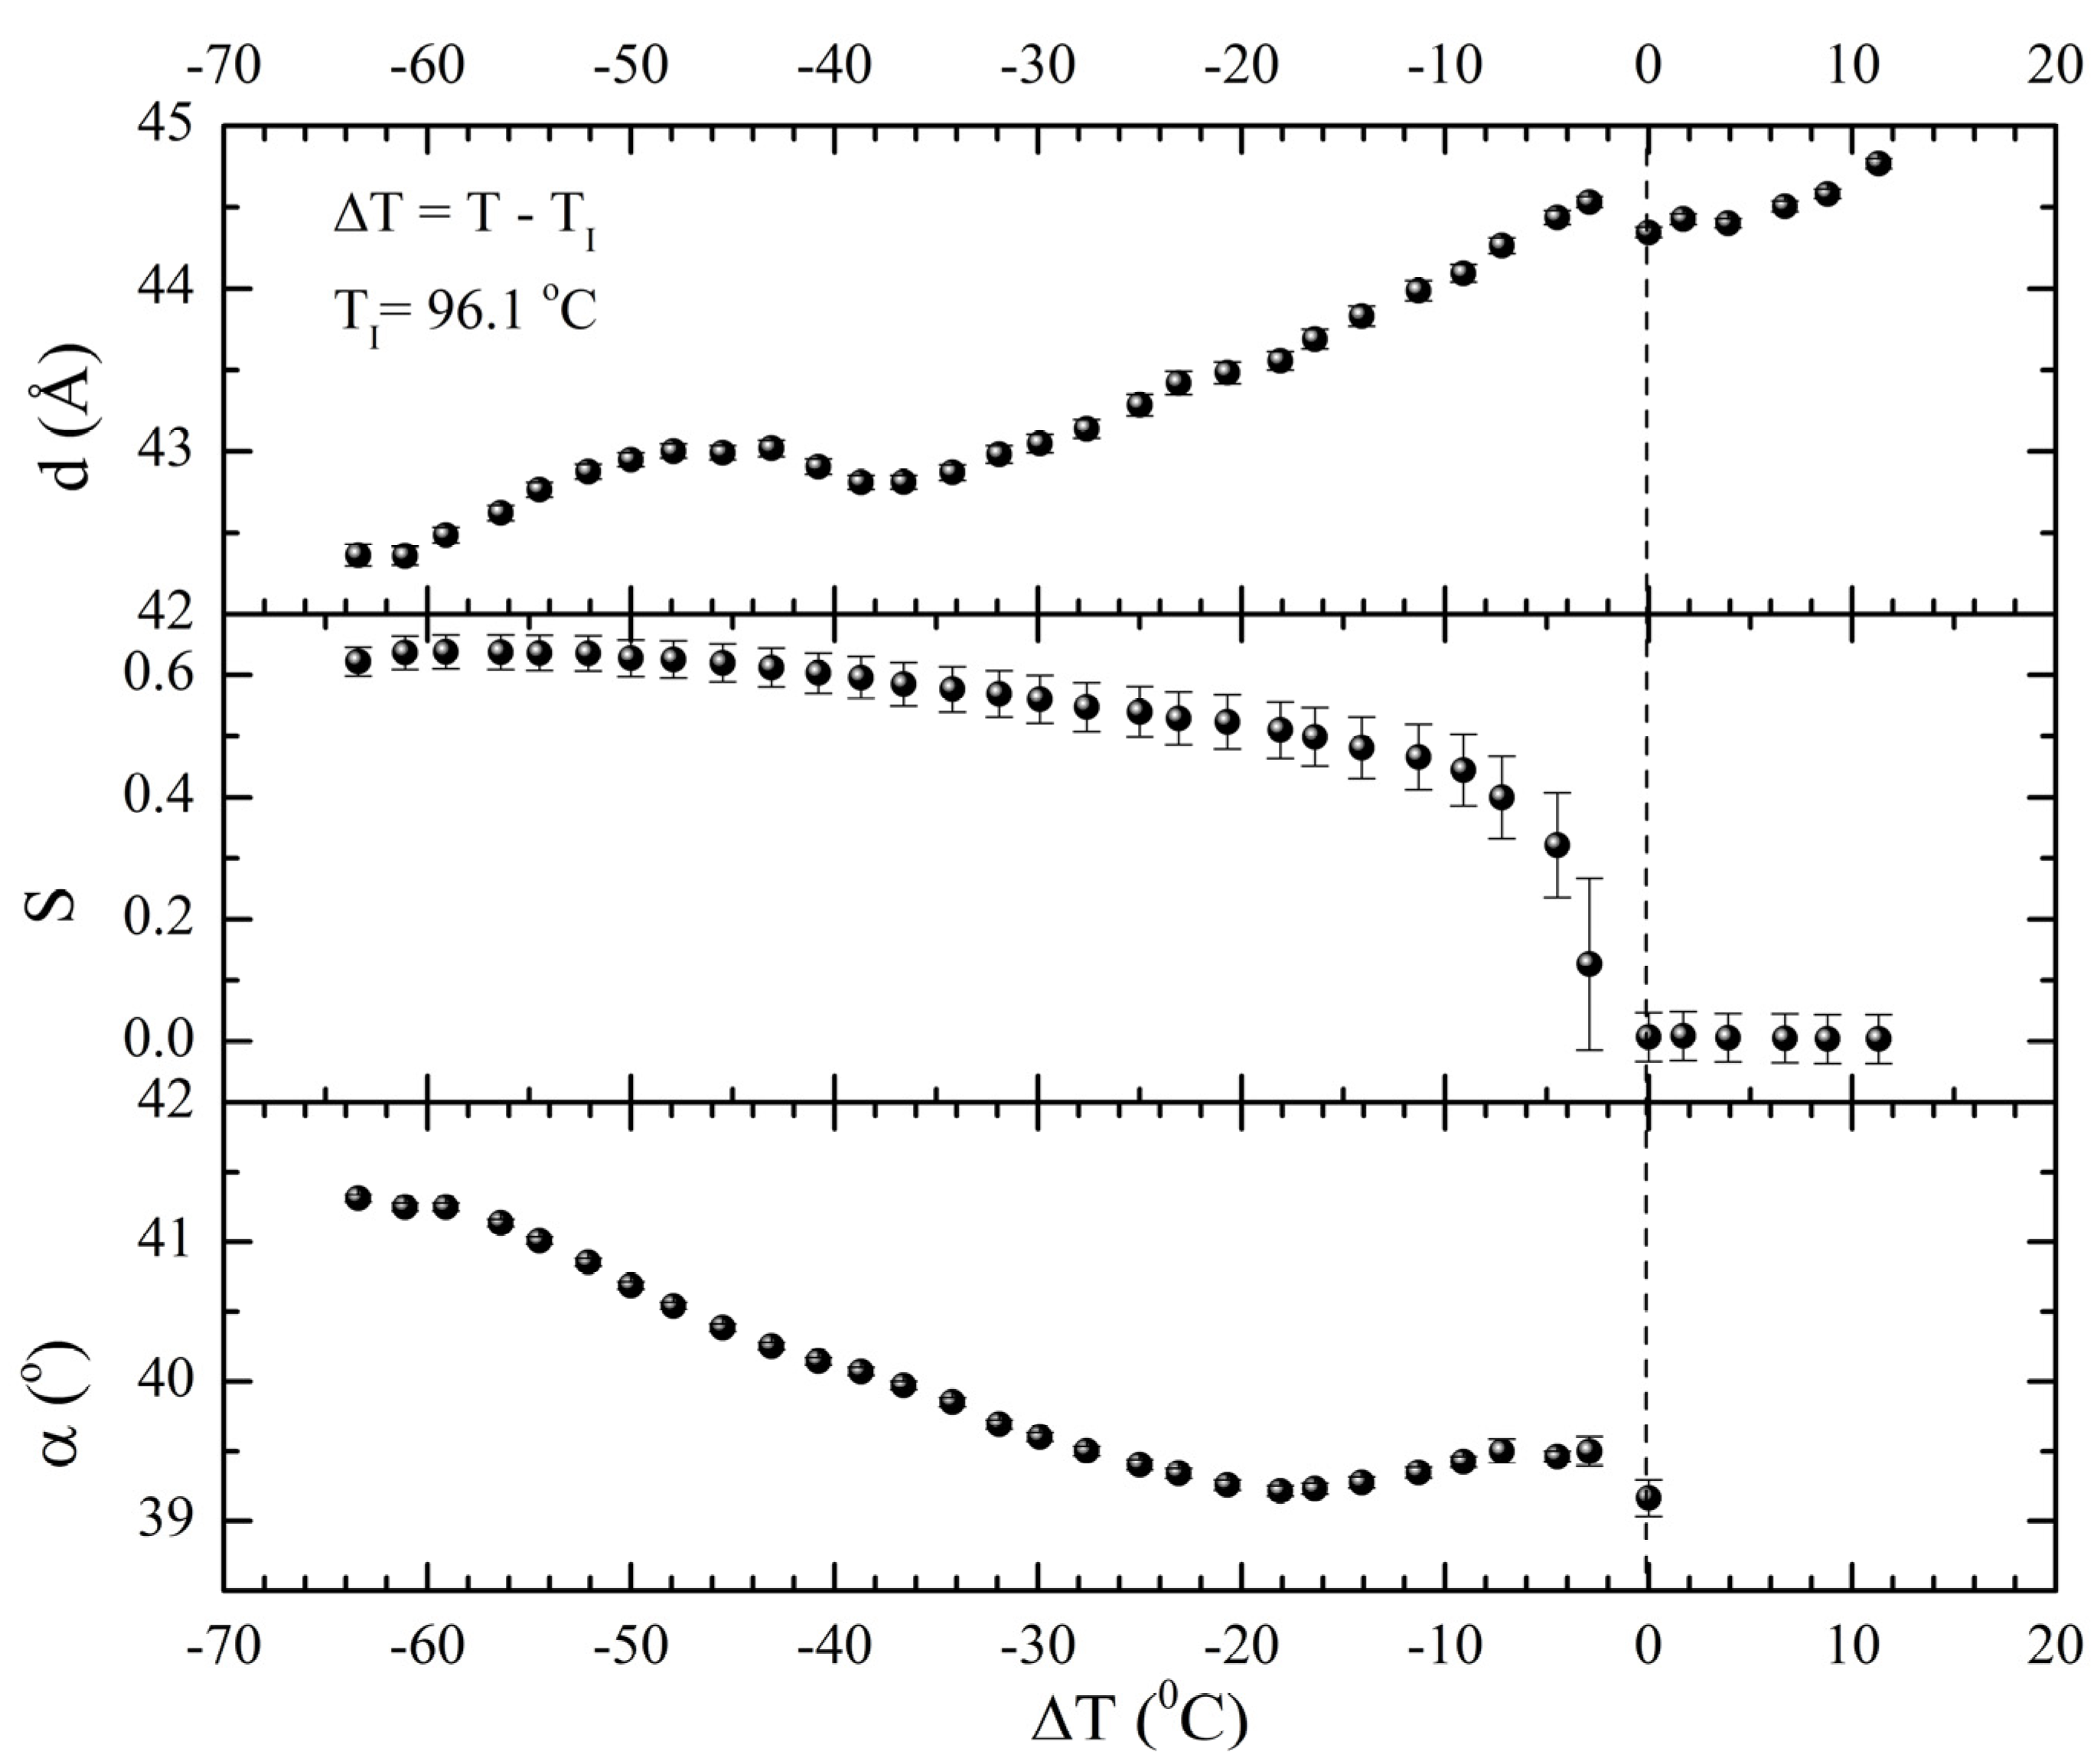
gradually become parallel to the stretch direction and deplete the population of perpendicularly oriented mesogens. The smectic layers are oriented symmetrically with respect to the mesogens’ long axis (i.e., the stretch direction) and form smectic layers in a manner that will statistically resemble chevron-like geometry. As the mesogen distribution becomes increasingly parallel to the strain direction in the SmC phase, the chevron angle decreases ultimately saturating below 45° in the secondary monodomain state with the apex of the chevron pointing in the direction of stretch (Figure 13). During the thermally driven recovery, the distribution of polymer chains and the mesogens become increasingly random, and the chevrons begin to relax back to a polydomain state. The smectic layers continue to exhibit an orientational preference perpendicular to the stretch direction. Naturally, the remnant chevrons re-merge forming poorly defined layers that are statistically perpendicular to the stretch direction which give rise to horizontal arcs in the diffraction pattern until the system enters the isotropic phase at TI. So, these elastomers do not quite follow an entirely reverse path.
Figure 17. LCE1: Length Recovery: Temperature dependence of d and S for the hydrocarbon part and the angle α are shown as function of the distance ∆T = T − TI from the clearing point, while the elastomer is slowly heated from the non-elastic irreversible state at room temperature to the isotropic state above temperature TI where the original polydomain state is recovered.
Crystals 03 00363 g017
The recovery of d, S and α as functions of the distance from TI, i.e., ∆T = TTI, are shown in Figure 17. The value of TI determined from the point where the SAXS peaks become a uniform ring is ~10 °C lower than the value measured by DSC [67]. In fact, the WAXS rings become more or less uniform, consistent with S (=0) shown in Figure 17. The polydomain structure is recovered by heating. During recovery, d continues to increase while S decreases slowly as temperature increases. Further heating shows a more pronounced drop in S as the clearing point is approached and the system recovers the polydomain state when heated above TI.

4. Conclusions

Classical rubber elasticity of Gaussian distribution of the polymer chains in isotropic conformation was discussed followed by the introduction of anisotropic Gaussian distribution [15] and tensorial form of the free energy for nematic elastomers. Nematic monodomain elastomers have been reported to spontaneously change shape across the isotropic-nematic transition leading to a way for applications as thermo-mechanical actuators [12,14] and artificial muscles [1,2,3,4]. The soft elasticity [9,10,11] of nematic elastomers is a unique property where a macroscopic shape change costs little or no elastic free energy. The soft elasticity is explained in terms of director rotation in monodomain NLCE and rotation of micro-domains in the case of polydomain samples [44]. Soft elasticity [55] also manifests itself in polydomain SmC main chain elastomers [8,20,60] via the shape memory effect [7]. The materials LCE1 and LCE2 show a P–M transition and are a model system to investigate the phenomena of shape memory effect, non-elastic reversible behavior, and soft-elasticity. Detailed X-ray diffraction study of the microscopic structural changes associated with this transition reveals that the random polydomain distribution of smectic elastomers changes into a chevron like monodomain via the re-orientation of smectic domains. A polydomain sample’s transformation to a monodomain sample commences at a critical strain of λ = 1.7. The monodomain formation is enhanced at strains as high as λ = 4.0 and the parameter S for mesogens reaching a maximum value of 0.82. The value of S for the siloxane parts of the elastomer reaches only a maximum value of ~ 0.4 due to random cross-linking in the siloxane rich regions. During the P–M transition, the chevron angle is found to follow a linear dependence on S. Relaxation of chevrons during strain retention experiments is found to be approximately four times slower than the mesogen relaxation. The elastomers do not quite follow an entirely reverse path while the initial polydomain state is recovered by heating from the mechanically induced monodomain state. The experimental results discussed here should help in advancing the theoretical understanding [82,83] of soft elasticity exhibited by these polydomain SmC MCLCEs.

Acknowledgments

This work was supported by the US Department of Energy, Office of Science, Basic Energy Sciences under grant DE-SC0001412. Use of the Advanced Photon Source (APS) was supported by the U.S. Department of Energy, Office of Science, Basic Energy Sciences, under Contract No. DE-AC02-06CH11357. Data was collected on the X-ray Science Division’s beamline 6-ID-B: Sector 6 at the APS, Argonne National Laboratory.

Conflict of Interest

The authors have no conflict of interest.

References and Notes

  1. Thomsen, D.L.; Keller, P.; Naciri, J.; Pink, R.; Jeon, H.; Shenoy, D.; Ratna, B.R. Liquid crystal elastomers with mechanical properties of a muscle. Macromolecules 2001, 34, 5868–5875. [Google Scholar] [CrossRef]
  2. Buguin, A.; Li, M.H.; Silberzan, P.; Ladoux, B.; Keller, P. Micro-actuators: When artificial muscles made of nematic liquid crystal elastomers meet soft lithography. J. Am. Chem. Soc. 2006, 128, 1088–1089. [Google Scholar]
  3. Li, M.H.; Keller, P. Artificial muscles based on liquid crystal elastomers. Philos. Trans. R. Soc. Lond. Ser. A 2006, 364, 2763–2777. [Google Scholar] [CrossRef]
  4. Wermter, H.; Finkelmann, H. Liquid crystalline elastomers as artificial muscles. e-Polymers 2001, 013:1–013:13. [Google Scholar]
  5. Davis, K.A.; Burke, K.A.; Mather, P.T.; Henderson, J.H. Dynamic cell behavior on shape memory polymer substrates. Biomaterials 2011, 32, 2285–2293. [Google Scholar] [CrossRef]
  6. Liu, C.; Qin, H.; Mather, P.T. Review of progress in shape-memory polymers. J. Mater. Chem. 2007, 17, 1543–1558. [Google Scholar] [CrossRef]
  7. Rousseau, I.A.; Mather, P.T. Shape memory effect exhibited by smectic-C liquid crystalline elastomers. J. Am. Chem. Soc. 2003, 125, 15300–15301. [Google Scholar] [CrossRef]
  8. Burke, K.A.; Mather, P.T. Soft shape memory in main-chain liquid crystalline elastomers. J. Mater. Chem. 2010, 20, 3449–3457. [Google Scholar] [CrossRef]
  9. Warner, M.; Bladon, P.; Terentjev, E.M. Soft elasticity—Deformation without resistance in liquid-crystal elastomers. J. Phys. II 1994, 4, 93–102. [Google Scholar] [CrossRef]
  10. Verwey, G.C.; Warner, M. Soft rubber elasticity. Macromolecules 1995, 28, 4303–4306. [Google Scholar] [CrossRef]
  11. Olmsted, P.D. Rotational invariance and goldstone modes in nematic elastomers and gels. J. Phys. II 1994, 4, 2215–2230. [Google Scholar] [CrossRef]
  12. Finkelmann, H.; Greve, A.; Warner, M. The elastic anisotropy of nematic elastomers. Eur. Phys. J. E 2001, 5, 281–293. [Google Scholar] [CrossRef]
  13. Tajbakhsh, A.R.; Terentjev, E.M. Spontaneous thermal expansion of nematic elastomers. Eur. Phys. J. E 2001, 6, 181–188. [Google Scholar] [CrossRef]
  14. Lagerwall, J.P.F.; Scalia, G. A new era for liquid crystal research: Applications of liquid crystals in soft matter nano-, bio- and microtechnology. Curr. Appl. Phys. 2012, 12, 1387–1412. [Google Scholar] [CrossRef]
  15. Warner, M.; Terentjev, E.M. Liquid Crystal Elastomers; Oxford University Press Inc.: New York, NY, USA, 2007. [Google Scholar]
  16. Ohm, C.; Brehmer, M.; Zentel, R. Liquid crystalline elastomers as actuators and sensors. Adv. Mater. 2010, 22, 3366–3387. [Google Scholar] [CrossRef]
  17. Brehmer, M.; Brommel, F.; Cordoyiannis, G.; Finkelmann, H.; Kramer, D.; Kutnjak, Z.; Lebar, A.; Ohm, C.; Ostrovskii, B.I.; Palffy-Muhoray, P.; et al. Liquid Crystal Elastomers: Materials and Applications; de Jeu, W.H., Ed.; Springer: Berlin and Heidelberg, Germany, 2010; Volume 250. [Google Scholar]
  18. Sanchez-Ferrer, A.; Fischl, T.; Stubenrauch, M.; Albrecht, A.; Wurmus, H.; Hoffmann, M.; Finkelmann, H. Liquid-crystalline elastomer microvalve for microfluidics. Adv. Mater. 2011, 23, 4526–4530. [Google Scholar] [CrossRef]
  19. Ping, X.; Rongben, Z. Liquid crystal elastomers, networks and gels: Advanced smart materials. J. Mater. Chem. 2005, 15, 2529–2550. [Google Scholar] [CrossRef]
  20. Ren, W.; Griffin, A.C. Mechanism of strain retention and shape memory in main chain liquid crystalline networks. Phys. Status Solidi B 2012, 249, 1379–1385. [Google Scholar] [CrossRef]
  21. Finkelmann, H.; Kock, H.J.; Rehage, G. Investigations on liquid-crystalline polysiloxanes. 3. Liquid-crystalline elastomers—A new type of liquid-crystalline material. Makromol. Chem. Rapid Commun. 1981, 2, 317–322. [Google Scholar] [CrossRef]
  22. Finkelmann, H.; Rehage, G. Liquid-crystal side-chain polymers. Adv. Polym. Sci. 1984, 60–61, 99–172. [Google Scholar] [CrossRef]
  23. Finkelmann, H.; Gleim, W.; Hammerschmidt, K.; Schatzle, J. Liquid-crystal elastomers. Makromol. Chem. Macromol. Symp. 1989, 26, 67. [Google Scholar] [CrossRef]
  24. Zentel, R. Liquid-crystalline elastomers. Angew. Chem. Int. Ed. 1989, 28, 1407–1415. [Google Scholar] [CrossRef]
  25. Treloar, L.R.G. The Physics of Rubber Elasticity, 3rd ed.; Oxford University Press Inc.: New York, NY, USA, 2005. [Google Scholar]
  26. Landau, L.D.; Lifshitz, E.M. Theory of Elasticity, 3rd ed.; Butterworth-Heinemann: Oxford, UK, 2007; Volume 7. [Google Scholar]
  27. Spiegel, M.R. Schaum’s Outline of Theory and Problems of Vector Analysis and an Introduction to Tensor Analysis; McGraw-Hill: New York, NY, USA, 1959. [Google Scholar]
  28. Wang, X.J.; Warner, M. Theory of nematic backbone polymer phases and conformations. J. Phys. A Math. Gen. 1986, 19, 2215–2227. [Google Scholar] [CrossRef]
  29. Wang, X.J.; Warner, M. Theory of nematic comb-like polymers. J. Phys. A Math. Gen. 1987, 20, 713–731. [Google Scholar] [CrossRef]
  30. Warner, M.; Gelling, K.P.; Vilgis, T.A. Theory of nematic networks. J. Chem. Phys. 1988, 88, 4008–4013. [Google Scholar] [CrossRef]
  31. Abramchuk, S.S.; Khokhlov, A.R. Molecular theory of high elasticite of the polymer networks taking into account the orientational ordering of links. Dokl. Akad. Nauk 1987, 297, 385–389. [Google Scholar]
  32. Camacho-Lopez, M.; Finkelmann, H.; Palffy-Muhoray, P.; Shelley, M. Fast liquid-crystal elastomer swims into the dark. Nat. Mater. 2004, 3, 307–310. [Google Scholar] [CrossRef]
  33. Sanchez-Ferrer, A.; Merekalov, A.; Finkelmann, H. Opto-mechanical effect in photoactive nematic side-chain liquid-crystalline elastomers. Macromol. Rapid Commun. 2011, 32, 671–678. [Google Scholar] [CrossRef]
  34. Finkelmann, H.; Nishikawa, E.; Pereira, G.G.; Warner, M. A new opto-mechanical effect in solids. Phys. Rev. Lett. 2001, 87, 015501:1–015501:4. [Google Scholar] [CrossRef]
  35. Corbett, D.; Warner, M. Changing liquid crystal elastomer ordering with light—A route to opto-mechanically responsive materials. Liq. Cryst. 2009, 36, 1263–1280. [Google Scholar] [CrossRef]
  36. Dawson, N.J.; Kuzyk, M.G.; Neal, J.; Luchette, P.; Palffy-Muhoray, P. Cascading of liquid crystal elastomer photomechanical optical devices. Opt. Commun. 2011, 284, 991–993. [Google Scholar] [CrossRef]
  37. Garcia-Amoros, J.; Piñol, A.; Finkelmann, H.; Velasco, D. Azophenol-based liquid−crystalline elastomers for light-driven actuators. Org. Lett. 2011, 13, 2282–2285. [Google Scholar] [CrossRef]
  38. Camargo, C.J.; Campanella, H.; Marshall, J.E.; Torras, N.; Zinoviev, K.; Terentjev, E.M.; Esteve, J. Batch fabrication of optical actuators using nanotube-elastomer composites towards refreshable braille displays. J. Micromech. Microeng. 2012, 22, 075009:1–075009:9. [Google Scholar] [CrossRef]
  39. Gregorc, M.; Hui, L.; Domenici, V.; Ambrożič, G.; Čopič, M.; Drevenšek-Olenik, I. Kinetics of holographic recording and spontaneous erasure processes in light-sensitive liquid crystal elastomers. Materials 2012, 5, 741–753. [Google Scholar] [CrossRef]
  40. Lin, Y.; Jin, L.; Huo, Y. Quasi-soft opto-mechanical behavior of photochromic liquid crystal elastomer: Linearized stress–strain relations and finite element simulations. Int. J. Solids Struct. 2012, 49, 2668–2680. [Google Scholar] [CrossRef]
  41. Sun, Y.; Evans, J.S.; Lee, T.; Senyuk, B.; Keller, P.; He, S.; Smalyukh, I.I. Optical manipulation of shape-morphing elastomeric liquid crystal microparticles doped with gold nanocrystals. Appl. Phys. Lett. 2012, 100, 241901:1–241901:5. [Google Scholar]
  42. Yusuf, Y.; Kai, S. Electro-opto-mechanical effects in swollen polydomain side chain liquid crystal elastomers. AIP Conf. Proc. 2012, 1454, 290–293. [Google Scholar] [CrossRef]
  43. Kupfer, J.; Finkelmann, H. Liquid-crystal elastomers—Influence of the orientational distribution of the cross-links on the phase-behavior and reorientation processes. Macromol. Chem. Phys. 1994, 195, 1353–1367. [Google Scholar] [CrossRef]
  44. Clarke, S.M.; Terentjev, E.M.; Kundler, I.; Finkelmann, H. Texture evolution during the polydomain-monodomain transition in nematic elastomers. Macromolecules 1998, 31, 4862–4872. [Google Scholar] [CrossRef]
  45. Biggins, J.S.; Terentjev, E.M.; Warner, M. Semisoft elastic response of nematic elastomers to complex deformations. Phys. Rev. E 2008, 78, 041704:1–041704:9. [Google Scholar] [CrossRef]
  46. Fridrikh, S.V.; Terentjev, E.M. Polydomain-monodomain transition in nematic elastomers. Phys. Rev. E 1999, 60, 1847–1857. [Google Scholar] [CrossRef]
  47. Bladon, P.; Terentjev, E.M.; Warner, M. Deformation-induced orientational transitions in liquid-crystals elastomer. J. Phys. II 1994, 4, 75–91. [Google Scholar] [CrossRef]
  48. Verwey, G.C.; Warner, M. Nematic elastomers cross-linked by rigid rod linkers. Macromolecules 1997, 30, 4196–4204. [Google Scholar] [CrossRef]
  49. Verwey, G.C.; Warner, M. Compositional fluctuations and semisoftness in nematic elastomers. Macromolecules 1997, 30, 4189–4195. [Google Scholar] [CrossRef]
  50. Ren, W. Structure-property relations in siloxane-based main chain liquid crystalline elastomers and related linear polymers. Ph.D. Thesis, Georgia Institute of Technology, Atlanta, GA, USA, 2007. [Google Scholar]
  51. Kundler, I.; Nishikawa, E.; Finkelmann, H. Nematic and smectic liquid single crystal elastomers: Influence of external stress parallel and perpendicular to the director. Macromol. Symp. 1997, 117, 11–19. [Google Scholar] [CrossRef]
  52. Nishikawa, E.; Finkelmann, H.; Brand, H.R. Smectic-A liquid single crystal elastomers showing macroscopic in-plane fluidity. Macromol. Rapid Commun. 1997, 18, 65–71. [Google Scholar] [CrossRef]
  53. Nishikawa, E.; Finkelmann, H. Smectic-A liquid single crystal elastomers—Strain induced break-down of smectic layers. Macromol. Chem. Phys. 1999, 200, 312–322. [Google Scholar] [CrossRef]
  54. Adams, J.M.; Warner, M. Elasticity of smectic-A elastomers. Phys. Rev. E 2005, 71, 021708:1–021708:15. [Google Scholar] [CrossRef]
  55. Adams, J.M.; Warner, M. Soft elasticity in smectic elastomers. Phys. Rev. E 2005, 72, 011703:1–011703:8. [Google Scholar] [CrossRef]
  56. Ortiz, C.; Wagner, M.; Bhargava, N.; Ober, C.K.; Kramer, E.J. Deformation of a polydomain, smectic liquid crystalline elastomer. Macromolecules 1998, 31, 8531–8539. [Google Scholar] [CrossRef]
  57. Baughman, R.H.; Shacklette, J.M.; Zakhidov, A.A.; Stafstrom, S. Negative poisson’s ratios as a common feature of cubic metals. Nature 1998, 392, 362–365. [Google Scholar] [CrossRef]
  58. Lakes, R. Foam structures with a negative poissons ratio. Science 1987, 235, 1038–1040. [Google Scholar]
  59. He, C.B.; Liu, P.W.; Griffin, A.C. Toward negative poisson ratio polymers through molecular design. Macromolecules 1998, 31, 3145–3147. [Google Scholar] [CrossRef]
  60. Ren, W.T.; McMullan, P.J.; Griffin, A.C. Stress-strain behavior in main chain liquid crystalline elastomers: Effect of crosslinking density and transverse rod incorporation on “Poisson’s ratio”. Phys. Status Solidi B 2009, 246, 2124–2130. [Google Scholar] [CrossRef]
  61. Sanchez-Ferrer, A.; Finkelmann, H. Uniaxial and shear deformations in smectic-C main-chain liquid-crystalline elastomers. Macromolecules 2008, 41, 970–980. [Google Scholar] [CrossRef]
  62. Cordoyiannis, G.; Sanchez-Ferrer, A.; Finkelmann, H.; Rozic, B.; Zumer, S.; Kutnjak, Z. Thermal study of the isotropic to smectic-C phase transition in main-chain liquid-crystalline elastomers. Liq. Cryst. 2010, 37, 349–353. [Google Scholar] [CrossRef]
  63. Sanchez-Ferrer, A.; Finkelmann, H. Thermal and mechanical properties of new main-chain liquid-crystalline elastomers. Solid State Sci. 2010, 12, 1849–1852. [Google Scholar] [CrossRef]
  64. Sanchez-Ferrer, A.; Finkelmann, H. Polydomain-monodomain orientational process in smectic-C main-chain liquid-crystalline elastomers. Macromol. Rapid Commun. 2011, 32, 309–315. [Google Scholar] [CrossRef]
  65. Ren, W.; McMullan, P.J.; Griffin, A.C. Poisson’s ratio of monodomain liquid crystalline elastomers. Macromol. Chem. Phys. 2008, 209, 1896–1899. [Google Scholar] [CrossRef]
  66. Ren, W.; McMullan, P.J.; Guo, H.; Kumar, S.; Griffin, A.C. A liquid crystalline elastomer with a p-pentaphenyl transverse rod laterally attached to the main chain. Macromol. Chem. Phys. 2008, 209, 272–278. [Google Scholar] [CrossRef]
  67. Ren, W.T.; Kline, W.M.; McMullan, P.J.; Griffin, A.C. Thermal strain recovery of anelastic monodomain liquid crystalline networks: Mechanically induced strains ratios. Phys. Status Solidi B 2011, 248, 105–110. [Google Scholar] [CrossRef]
  68. Heinze, P.; Finkelmann, H. Shear deformation and ferroelectricity in chiral SmC* main-chain elastomers. Macromolecules 2010, 43, 6655–6665. [Google Scholar] [CrossRef]
  69. Ricco, T.; Pegoretti, A. Energy storage and strain-recovery processes in highly deformed semicrystalline poly(butylene terephthalate). J. Polym. Sci. B Polym. Phys. 2002, 40, 236–243. [Google Scholar] [CrossRef]
  70. Clarke, S.M.; Terentjev, E.M. Slow stress relaxation in liquid crystal elastomers and gels. Faraday Discuss. 1999, 112, 325–333. [Google Scholar] [CrossRef]
  71. Ngai, K.L. Relaxation and Diffusion in Complex Systems, 1st ed.; Springer: New York, NY, USA, 2011. [Google Scholar]
  72. Ortiz, C.; Ober, C.K.; Kramer, E.J. Stress relaxation of a main-chain, smectic, polydomain liquid crystalline elastomer. Polymer 1998, 39, 3713–3718. [Google Scholar] [CrossRef]
  73. Povolo, F.; Schwartz, G.; Hermida, E.B. Stress relaxation of PVC below the yield point. J. Polym. Sci. B Polym. Phys. 1996, 34, 1257–1267. [Google Scholar] [CrossRef]
  74. Wortmann, F.J.; Schulz, K.V. Nonlinear viscoelastic performance of nomex, kevlar and polypropylene fibers in a single-step stress-relaxation test. 2. Moduli, viscosities and isochronal stress-strain curves. Polymer 1995, 36, 2363–2369. [Google Scholar] [CrossRef]
  75. Wortmann, F.J.; Schulz, K.V. Stress-relaxation and time-temperature superposition of polypropylene fibers. Polymer 1995, 36, 315–321. [Google Scholar] [CrossRef]
  76. Kumar, S. Liquid Crystals: Experimental Study of Physical Properties and Phase Transitions; Cambridge University Press: Cambridge, NY, USA, 2001. [Google Scholar]
  77. Davidson, P.; Petermann, D.; Levelut, A.M. The measurement of the nematic order-parameter by X-ray-scattering reconsidered. J. Phys. II 1995, 5, 113–131. [Google Scholar] [CrossRef]
  78. Tsoularis, A.; Wallace, J. Analysis of logistic growth models. Math. Biosci. 2002, 179, 21–55. [Google Scholar] [CrossRef]
  79. Ishige, R.; Naito, Y.; Kang, S.M.; Tokita, M.; Watanabe, J. Regular formation of chain folding in smectic phase of main-chain bb-3(2-ph) polymer followed by columnar association of phenyl side group in propane spacer. Macromolecules 2009, 42, 2557–2562. [Google Scholar] [CrossRef]
  80. Ishige, R.; Osada, K.; Tagawa, H.; Niwano, H.; Tokita, M.; Watanabe, J. Elongation behavior of a main-chain smectic liquid crystalline elastomer. Macromolecules 2008, 41, 7566–7570. [Google Scholar] [CrossRef]
  81. Hotta, A.; Clarke, S.M.; Terentjev, E.M. Stress relaxation in transient networks of symmetric triblock styrene-isoprene-styrene copolymer. Macromolecules 2002, 35, 271–277. [Google Scholar] [CrossRef]
  82. Adams, J.; Conti, S.; DeSimone, A. Soft elasticity and microstructure in smectic-C elastomers. Contin. Mech. Thermodyn. 2007, 18, 319–334. [Google Scholar] [CrossRef] [Green Version]
  83. Biggins, J.S.; Warner, M.; Bhattacharya, K. Elasticity of polydomain liquid crystal elastomers. J. Mech. Phys. Solids 2012, 60, 573–590. [Google Scholar] [CrossRef]

