A Phosphonic Acid Anchoring Analogue of the Sensitizer P1 for p-Type Dye-Sensitized Solar Cells


Department of Chemistry, University Basel, CH-4058 Basel, Switzerland
*
Author to whom correspondence should be addressed.
†
These authors contributed equally to this work.
Crystals 2018, 8(10), 389; https://0-doi-org.brum.beds.ac.uk/10.3390/cryst8100389
Submission received: 18 September 2018
/
Revised: 5 October 2018
/
Accepted: 9 October 2018
/
Published: 12 October 2018
(This article belongs to the Special Issue Metal Phosphonates and Phosphinates)
Abstract
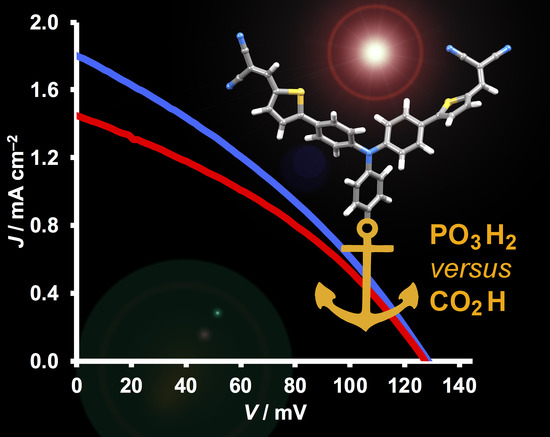
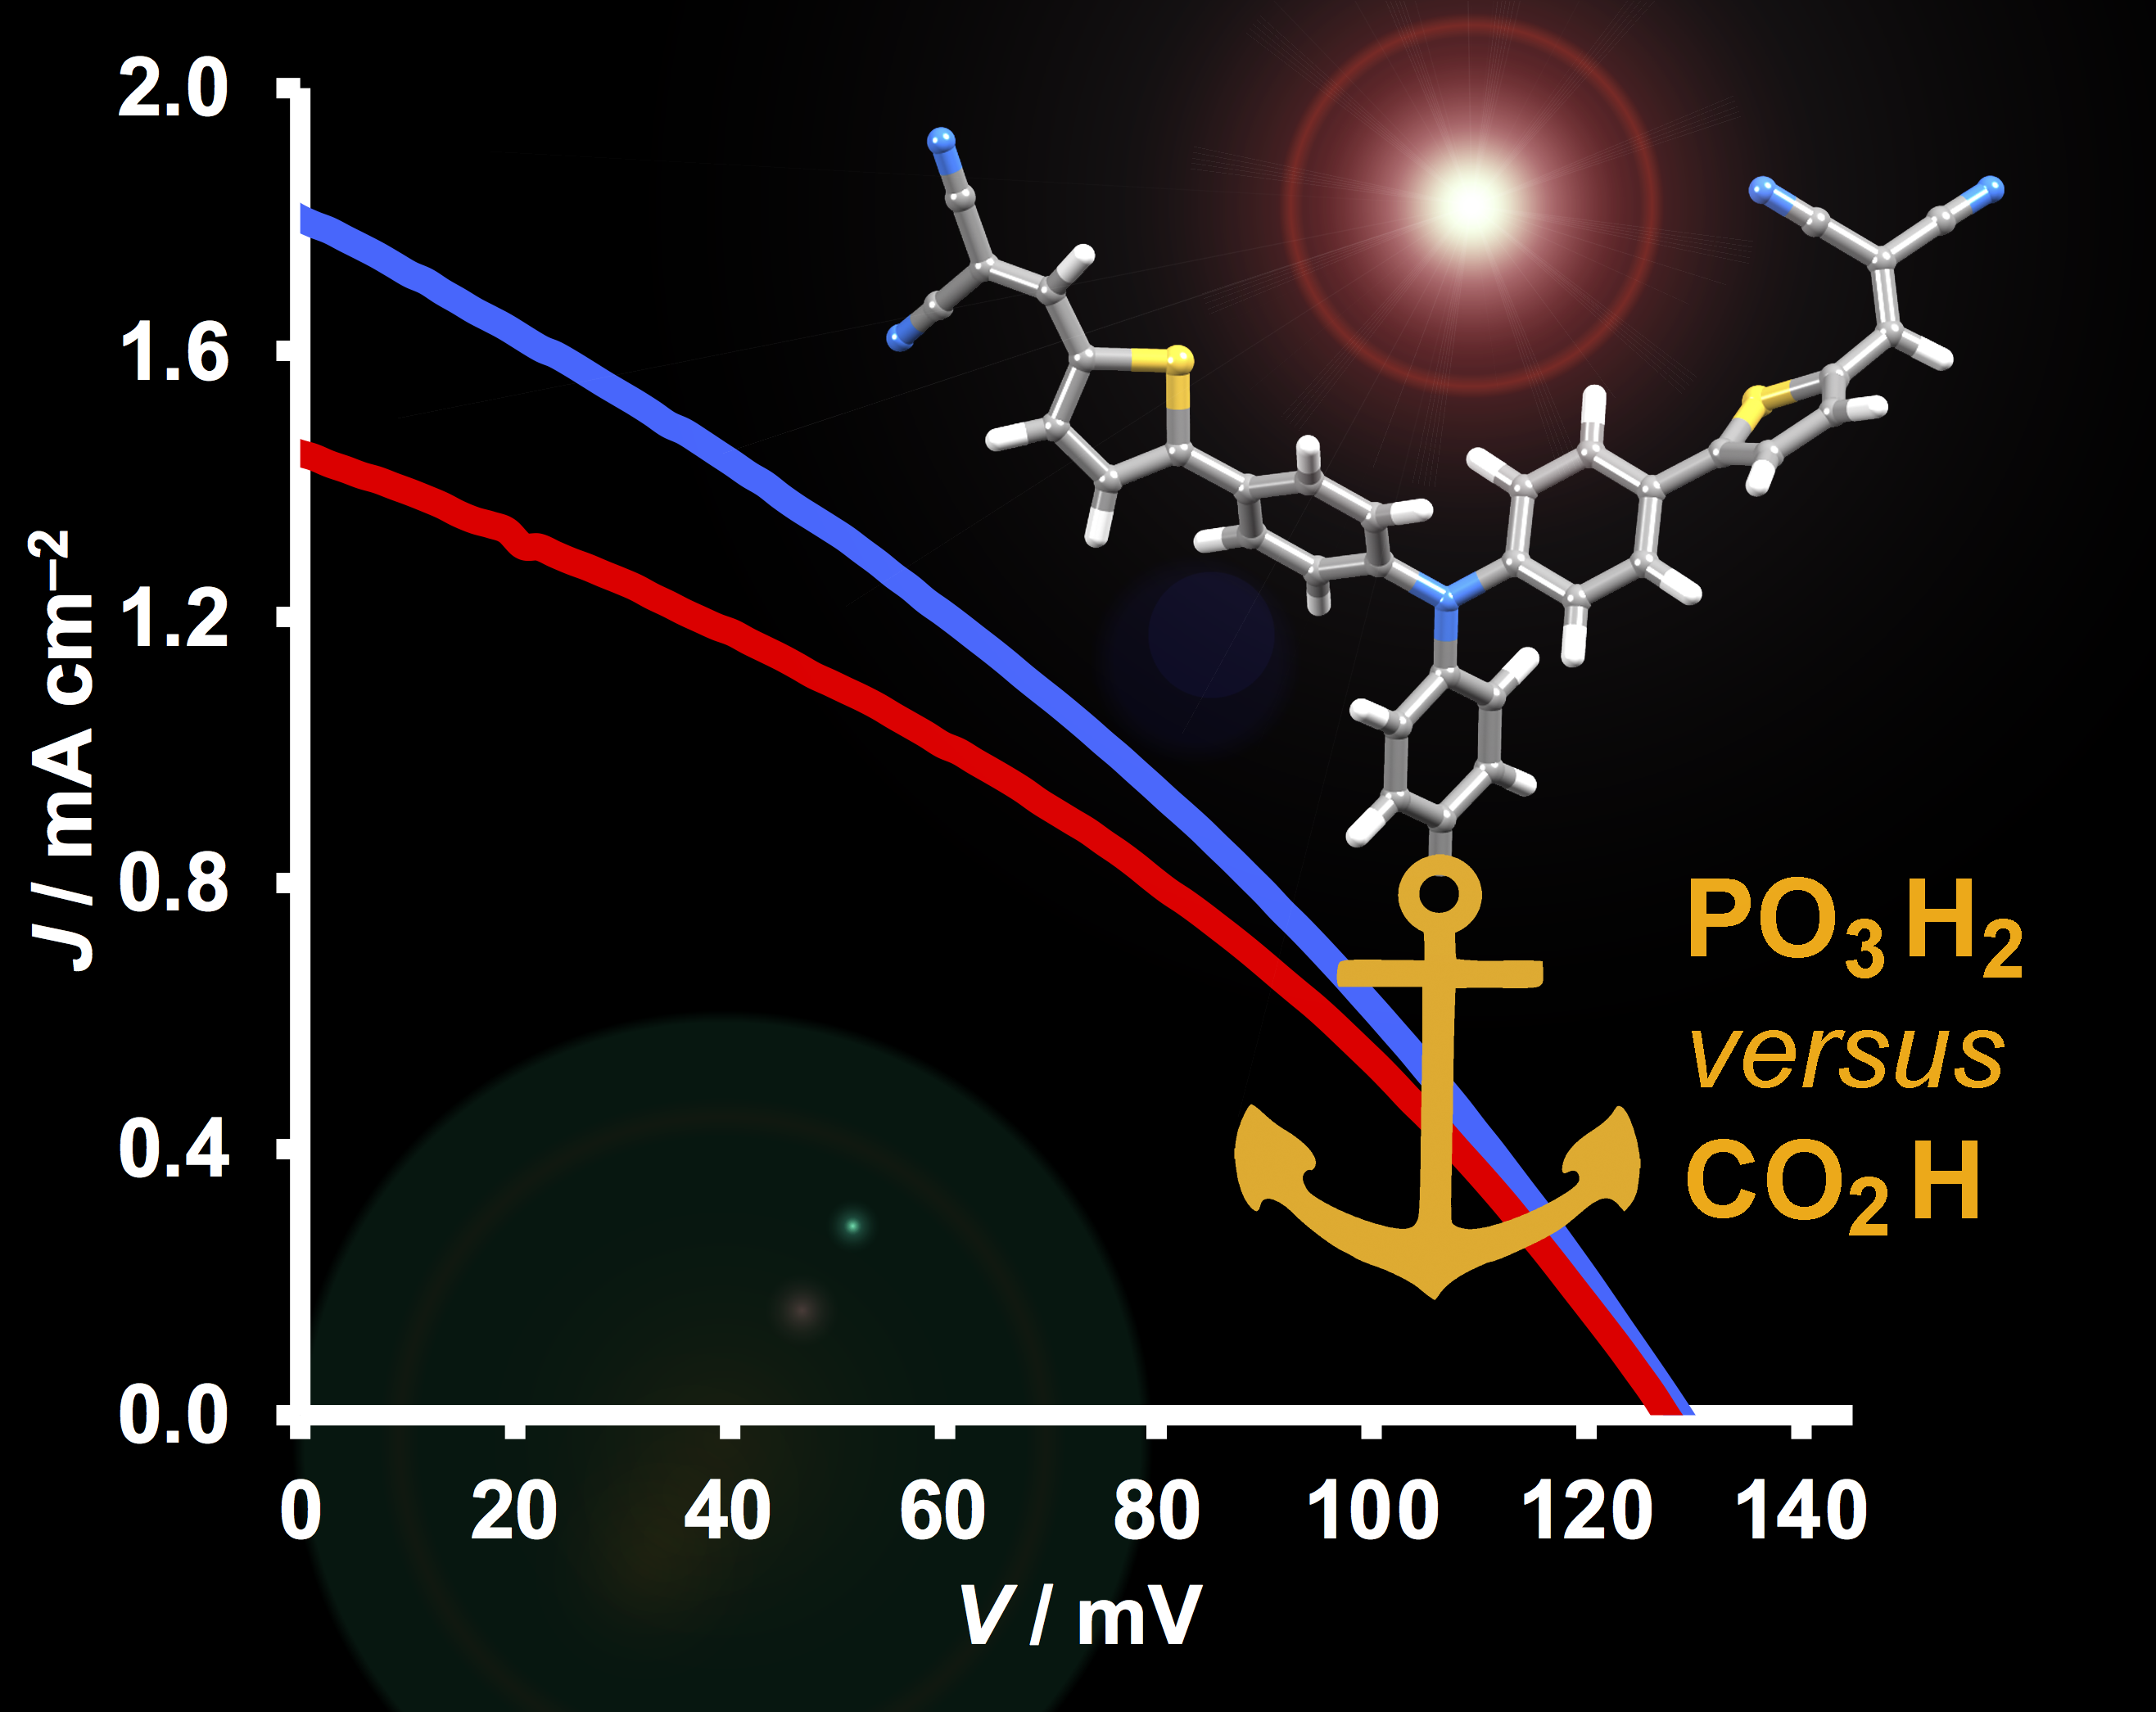
:We report the synthesis and characterization of the first example of an organic dye, PP1, for p-type dye-sensitized solar cells (DSCs) bearing a phosphonic acid anchoring group. PP1 is structurally related to the benchmarking dye, P1, which possesses a carboxylic acid anchor. The solution absorption spectra of PP1 and P1 are similar (PP1 has λmax = 478 nm and εmax = 62,800 dm3 mol−1 cm−1), as are the solid-state absorption spectra of the dyes adsorbed on FTO/NiO electrodes. p-Type DSCs with NiO as semiconductor and sensitized with P1 or PP1 perform comparably. For PP1, short-circuit current densities (JSC) and open-circuit voltages (VOC) for five DSCs lie between 1.11 and 1.45 mA cm−2, and 119 and 143 mV, respectively, compared to ranges of 1.55–1.80 mA cm−2 and 117–130 mV for P1. Photoconversion efficiencies with PP1 are in the range 0.054–0.069%, compared to 0.065–0.079% for P1. Electrochemical impedance spectroscopy, open-circuit photovoltage decay and intensity-modulated photocurrent spectroscopy have been used to compare DSCs with P1 and PP1 in detail.
1. Introduction
In n-type dye-sensitized solar cells (DSCs) [1,2,3,4], a wide variety of anchoring domains are used or have been proposed to attach the dye to the semiconductor surface [5], the most common being carboxylic and phosphonic acids. In practice, these anchors may actually function as carboxylates or phosphonates since the protonation state of the anchoring groups is not usually clearly defined and can have a significant impact of DSC performance [6]. Investigations of DSCs are dominated by studies of devices operating with an n-type semiconductor functioning as the photoanode. Despite the typically poor photoconversion efficiencies of DSCs with p-type semiconductors as the photocathode [7], research interest in the p-type interface and the development of new p-type dyes [8] is driven by the ultimate goal of tandem cells in which the performance of an n-type DSC can be further boosted by harnessing additional photoconversion events at the photocathode [9]. DSCs containing p-type photocathodes typically exhibit low fill-factors [10]. Enhancement of the performance of p-type DSCs is hampered by rapid recombination between injected holes and reduced sensitizer molecules and/or reduced electrolyte. This in turn prevents efficient dye regeneration by the electrolyte [11]. Furthermore, hole-transport resistance is typically high in p-type DSCs.
A major difference between two of the most common n-type and p-type semiconductors (TiO2 and NiO) is their inherent light absorption. TiO2 absorbs in the UV region and there is no interference with the light absorption of adsorbed dyes in the visible region. In contrast, NiO is typically grey or black, and as a consequence adsorbed dyes tend to be panchromatic and possess especially high extinction coefficients. Theoretical investigations are important in guiding the design of p-type dye sensitizers, including the choice of anchor and role of solvents (for example, [12,13,14,15,16]). One of the benchmarking p-type dyes is P1 with a carboxylic acid anchoring group (Scheme 1) [17]. Under optimized DSC conditions and with an I3−/I− redox couple, a DSC sensitized with P1 achieves values of the short-circuit current density (JSC) of 4.83 mA cm−2, open-circuit voltage (VOC) of 96 mV, and photoconversion efficiency (η) of 0.145% [18]. The value of JSC has been increased to 7.4 mA cm−2 by judicious extension of the conjugated system while retaining the basic core structure of P1 [19]. Another commonly used p-type dye is the coumarin C343 (Scheme 2) which, like P1, contains a carboxylic acid anchor. Theoretical studies have indicated that stronger binding of the coumarin dye to NiO is achieved if the CO2H anchor is replaced by a phosphonic acid. Moreover, calculated values of VOC are influenced by a change in anchor, and the highest VOC values are found for a monodentate binding mode to NiO for both CO2H and PO(OH)2 anchors [14]. However, to the best of our knowledge [8], there have been no experimental investigations of the use of phosphonic acid derivatives of C343 in DSCs. Pellegrin et al. have demonstrated that the ruthenium dye 1 (Scheme 2) with values of JSC = 0.78 mA cm–2, VOC = 95 mV and η = 0.025%, has a comparable performance to C343 in a p-type DSC and outperforms an analogous [Ru(bpy)3]2+-based dye with CO2H anchors [20]. Similarly, DSCs with the zwitterionic cyclometallated ruthenium dye 2 (Scheme 2) give photoconversion efficiencies that exceed those of cells sensitized by an analogous dye bearing a CO2H anchor [21,22] and we have shown that values of JSC up to 4.13 mA cm−2 and η up to 0.139% can be achieved using 2, with solvent and NiO fabrication playing critical roles in optimizing the performance [23]. We were therefore motivated to investigate an analogue of dye P1 which contains a PO(OH)2 rather than CO2H acid anchoring group; the structure of this PP1 dye is shown in Scheme 1.
2. Materials and Methods
2.1. General
1H, 13C and 31P NMR spectra were recorded on a Bruker Avance III-500 spectrometer (Bruker BioSpin AG, Fällanden, Switzerland) at 295 K. The 1H and 13C NMR chemical shifts were referenced with respect to residual solvent peaks (δTMS = 0), and 31P shifts with respect to 85% aqueous H3PO4. A Shimadzu LCMS-2020 instrument (Shimadzu Schweiz GmbH, Roemerstr, Switzerland) was used to record electrospray ionization (ESI) mass spectra; high resolution ESI mass spectra were recorded using a Bruker maXis 4G instrument (Bruker Daltonics GmbH, Fällanden, Switzerland) and a Bruker Daltonics Inc. microflex instrument (Bruker Daltonics GmbH, Fällanden, Switzerland) was used for MALDI mass spectra. Solution absorption spectra and solid-state absorption spectra of dye-functionalized transparent electrodes (Solaronix SA, Aubonne, Switzerland) were measured using a Cary-5000 spectrophotometer (Agilent Technologies Inc., Santa Clara, CA, USA). Reactions carried out under microwave conditions used a Biotage Initiator 8 reactor (Biotage, Uppsala, Sweden).
2.2. Compound 1
(4-Bromophenyl)diphenylamine (1.00 g, 3.08 mmol), [Pd(PPh3)4] (0.178 g, 0.154 mmol) and Cs2CO3 (1.50 g, 4.62 mmol) were added to a microwave vial and this was then evacuated and flushed with N2 three times. Diethyl phosphite (0.591 mL, 0.638 g, 4.62 mmol) was dissolved in dry THF (18 mL) and N2 was bubbled through the solution for 20 min. The solution was added to the microwave vial which was then sealed and heated in a microwave reactor at 120 °C for 20 min. Water (15 mL) and dichloromethane (50 mL) were added. The organic phase was extracted, dried over MgSO4 and the solvent removed under reduced pressure. The crude product was purified by column chromatography (SiO2, 3:2 cyclohexane/ethyl acetate, Rf = 0.1). Compound 1 was isolated as a yellow oil (573 mg, 1.503 mmol, 48.8%). 1H NMR (500 MHz, CDCl3) δ/ppm 7.59 (dd, J = 12.7, 8.4 Hz, 2H, HA2), 7.29 (t, J = 7.7 Hz, 4H, HB3), 7.16–7.07 (m, 6H, HB2+B4), 7.01 (dd, J = 8.6, 3.4 Hz, 2H, HA3), 4.11 (m, 4H, HPO(OCH2CH3)2), 1.32 (t, J = 7.1 Hz, 6H, HPO(OCH2CH3)2). 13C{1H} NMR (126 MHz, CDCl3) δ/ppm 151.6 (d, JPC = 3.3 Hz, CA4), 146.7 (CB1), 133.0 (d, JPC = 11.1 Hz, CA2), 129.6 (CB3), 125.9 (CB2), 124.50 (CB4), 120.3 (d, JPC = 15.6 Hz, CA3), 118.9 (d, JPC = 195.7 Hz, CA1), 62.0 (d, JPC = 5.4 Hz, CPO(OCH2CH3)2), 16.5 (d, JPC = 6.6 Hz, CPO(OCH2CH3)2). 31P NMR (202 MHz, CDCl3) δ/ppm +20.1. MALDI-MS m/z 381.31 [M]+ (calc. 381.16).
2.3. Compound 2
Compound 1 (1.145 g, 3.00 mmol) was dissolved in THF, and N-bromosuccinimide (1.335 g, 7.500 mmol) was added in one portion. The solution was heated at 60 °C for 16 h. Aqueous Na2CO3 (20 mL, 10%) was added and the mixture was extracted with ethyl acetate (3 × 50 mL). The organic phases were combined, dried over MgSO4 and the solvent removed under reduced pressure. The crude product was purified by column chromatography (SiO2, 2:3 cyclohexane/ethylacetate, Rf = 0.4). Compound 2 was isolated as a yellow oil (920 mg, 1.71 mmol, 56.9%). 1H NMR (500 MHz, CDCl3) δ/ppm 7.68–7.57 (m, 2H, HA2), 7.44–7.36 (m, 4H, HB3), 7.02 (dd, J = 8.6, 3.3 Hz, 2H, HA3), 7.00–6.95 (m, 4H, HB2), 4.15 (m, 4H, HPO(OCH2CH3)2), 1.33 (t, J = 7.1 Hz, 6H, HPO(OCH2CH3)2). 13C{1H} NMR (126 MHz, CDCl3) δ/ppm 150.7 (d, JPC = 3.3 Hz, CA4), 145.6 (CB1), 133.3 (d, JPC = 11.0 Hz, CA2), 132.9 (CB3), 127.0 (CB2), 121.3 (d, JPC = 15.6 Hz, CA3), 120.9 (d, JPC = 194.9 Hz, CA1), 117.5 (CB4), 62.2 (d, JPC = 5.5 Hz, CPO(OCH2CH3)2), 16.5 (d, JPC = 6.5 Hz, CPO(OCH2CH3)2). 31P NMR (202 MHz, CDCl3) δ/ppm + 19.3. MALDI-MS m/z 540.13 [M + H]+ (calc. 539.98).
2.4. Compound 3
5-(4,4,5,5-Tetramethyl-1,3,2-dioxaborolan-2-yl)thiophene-2-carbaldehyde (1.029 g, 4.32 mmol), Pd(PPh3)4 (0.125 g, 0.108 mmol) and Cs2CO3 (2.111 g, 6.48 mmol) were added to a microwave vial and then the vial was evacuated and flushed with N2 three times. Compound 2 (0.582 g, 1.08 mmol) was dissolved in dry toluene (18 mL) and N2 was bubbled through the solution for 20 min. The solution was added to a microwave vial, which was then sealed and heated in a microwave reactor at 120 °C for 4 h. Water (15 mL) and ethyl acetate (50 mL) were added. The organic phase was extracted, dried over MgSO4 and the solvent removed under reduced pressure. The crude product was purified by column chromatography (SiO2, ethyl acetate, Rf = 0.4). Compound 3 was isolated as a yellow oil (402 mg, 0.668 mmol, 61.9%). 1H NMR (500 MHz, CDCl3) δ/ppm 9.88 (s, 2H, HAld), 7.74 (d, J = 4.0 Hz, 2H, HC4), 7.70 (dd, J = 12.8, 8.6 Hz, 2H, HA2), 7.61 (d, J = 8.6 Hz, 4H, HB3), 7.36 (d, J = 3.9 Hz, 2H, HC3), 7.20–7.14 (m, 6H, HB2/A3), 4.12 (m, 4H, HPO(OCH2CH3)2), 1.35 (t, J = 7.1 Hz, 6H, HPO(OCH2CH3)2). 13C{1H} NMR (126 MHz, CDCl3) δ/ppm 182.8 (CAld), 153.6 (CC2), 150.3 (d, JPC = 3.4 Hz, CA4), 147.5 (CB1), 142.3 (CC5), 137.7 (CC4), 133.4 (d, JPC = 11.0 Hz, CA2), 127.9 (CB3), 125.4 (CB2), 123.85 (CC3), 122.8 (d, JPC = 16 Hz, CA3), 122.1 (d, JPC = 195 Hz, CA1) 62.4 (d, JPC = 5.5 Hz, CPO(OCH2CH3)2), 16.5 (d, JPC = 6.5 Hz, CPO(OCH2CH3)2); a signal for CB4 was not resolved. 31P NMR (202 MHz, CDCl3) δ/ppm +19.0. MALDI-MS m/z 601.54 [M + H]+ (calc. 602.12).
2.5. Compound 4
Compound 3 (0.349 g, 0.58 mmol) was dissolved in anhydrous MeCN (30 mL). Malononitrile (0.084 g, 1.28 mmol) and Me3N (4 drops) were added and the mixture was heated at reflux at 85 °C for 16 h. CH2Cl2 (50 mL) was added and the organic phase was washed with water (3 × 30 mL), dried over MgSO4 and the solvent removed under reduced pressure. The crude product was purified by column chromatography (SiO2, ethyl acetate, Rf = 0.3). Compound 4 was isolated as a red oil (278 mg, 0.398 mmol, 68.7%). 1H NMR (500 MHz, CDCl3) δ/ppm 7.79 (s, 2H, Ha), 7.76–7.70 (m, 4H, HA2/C4), 7.64–7.62 (m, 4H, CB3), 7.40 (d, J = 4.1 Hz, 2H, CC3), 7.21–7.15 (m, 6H, CA3/B2), 4.15 (m, 4H, HP(O)(OCH2CH3)), 1.35 (t, J = 7.1 Hz, 6H, HP(O)(OCH2CH3)). 13C{1H} NMR (126 MHz, CDCl3) δ/ppm 155.7 (Ca), 150.6 (CC2), 149.9 (d, JPC = 3.5 Hz, CA4), 148.0 (CB1), 140.4 (CC4), 134.1 (CC5), 133.5 (d, JPC = 10.8 Hz, CA2), 128.1 (CB3), 125.2 (CB2), 124.3 (CC3), 123.6 (d, JPC = 15.5 Hz, CA3), 123.2 (d, JPC = 194 Hz, CA1), 114.4 (CCN), 113.6 (CCN), 76.4 (Cb), 62.3 (d, JPC = 5.6 Hz, CP(O)(OCH2CH3)), 16.5 (d, JPC = 6.5 Hz, CP(O)(OCH2CH3)); a signal for CB4 was not resolved. 31P NMR (202 MHz, CDCl3) δ/ppm +18.6. MALDI-MS m/z 697.78 [M + H]+ (calc. 698.14).
2.6. PP1
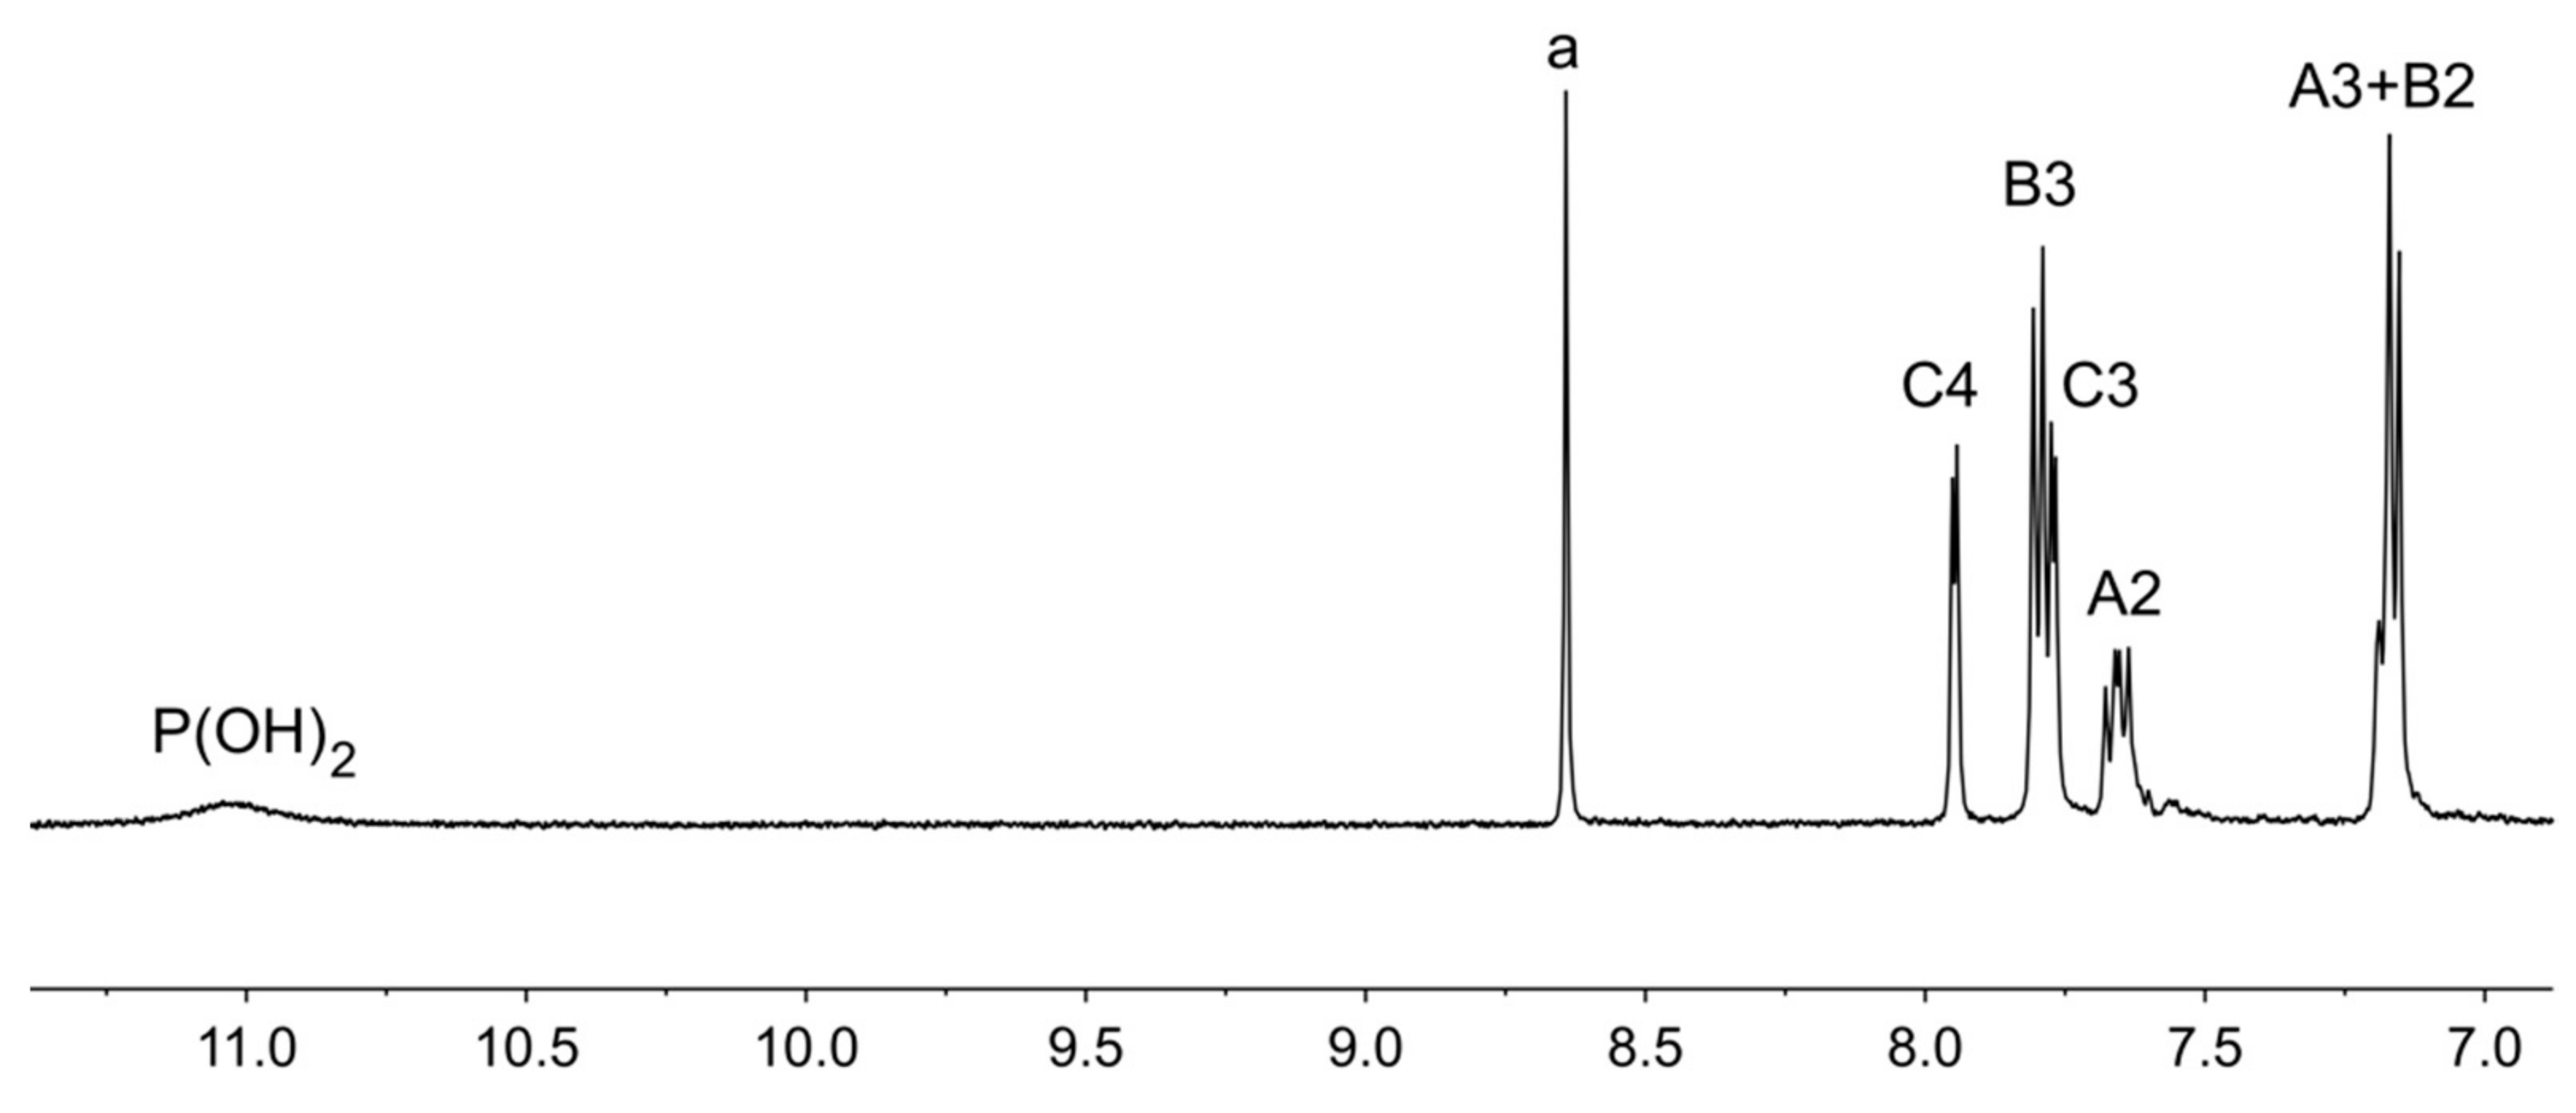
Compound 4 (0.06 g, 0.086 mmol) was dissolved in anhydrous CH2Cl2 (30 mL). Me3SiBr (0.227 mL, 0.263 g, 1.72 mmol) was added and the solution stirred at room temperature for 16 h. Water (20 mL) and CH2Cl2 (20 mL) were added and the organic phase was washed with water (3 × 30 mL), dried over MgSO4 and the solvent removed under reduced pressure. The crude product was recrystallized from ethanol/cyclohexane. PP1 was isolated as a red solid (38 mg, 0.059 mmol, 68.9%). 1H NMR (500 MHz, DMSO-d6) δ/ppm 11.03 (s, 2H, HP(O)(OH)2), 8.64 (s, 2H, Ha), 7.95 (d, J = 4.1 Hz, 2H, HC4), 7.80 (d, J = 8.4 Hz, 4H, HB3), 7.77 (d, J = 4.1 Hz, 2H, HC3), 7.66 (dd, JPH = 12.4, JHH = 8.1 Hz, 2H, HA2), 7.21–7.13 (m, 6H, HA3+B2). 13C{1H} NMR (126 MHz, DMSO-d6) δ/ppm 155.1 (CC2), 153.1 (Ca), 148.2 (CA1/A4), 143.1 (CC4), 133.3 (CA2), 128.5 (CB3), 127.4 (CA1/A4), 125.4 (CC3), 124.6 (CA3+B2), 115.2 (CCN); other 13C nuclei could not be resolved. 31P NMR (202 MHz, DMSO-d6) δ/ppm +25.5. ESI-MS m/z 639.99 [M − H]− (calc. 640.07). HR ESI-MS (acetone with NaOH) m/z 640.0671 [M − H]− (calc. 640.0672).
2.7. Crystallography
Single crystal data were collected on a Bruker APEX-II diffractometer (Bruker AXS GmbH, Karlsruhe, Germany); data reduction, solution and refinement used APEX2, SuperFlip and CRYSTALS respectively [24,25,26]. Structure analysis used Mercury v.3.6 [27,28]. Disorder of the thiophene ring containing S20 and its aldehyde group meant that this unit had to be refined isotropically.
3: C32H28NO5PS2, M = 601.68, yellow block, monoclinic, space group C2/c, a = 27.7428(18), b = 9.4833(6), c = 25.0824(14) Å, β= 119.127(2)o, U = 5764.5(6) Å3, Z = 8, Dc = 1.386 Mg m−3, µ(Cu-Kα) = 2.555 mm−1, T = 123 K. Total 16101 reflections, 5160 unique, Rint = 0.027. Refinement of 4606 reflections (360 parameters) with I > 2σ(I) converged at final R1 = 0.0811 (R1 all data = 0.0871), wR2 = 0.2172 (wR2 all data = 0.2262), gof = 0.9393. CCDC 1861694.
2.8. Electrode Preparation
Working NiO electrodes were prepared as follows. An FTO glass plate (TCO22-7, 2.2 mm thickness, sheet resistance = 7 Ω square−1, Solaronix SA, Aubonne, Switzerland) was cleaned by sonicating in surfactant (2% in milliQ water), rinsed with milliQ water and EtOH and then sonicated for 10 min in acidified EtOH. The surface was sintered at 450 °C for 30 min. A pretreatment of NiO was prepared by spin-coating (3000 rpm for 1 min) onto the clean substrates of a Ni(OAc)2 solution (0.5 M) containing ethanolamine (0.5 M) in methoxyethanol. After spin-coating, the plate was sintered at 500 °C for 30 min. A layer of NiO paste (Ni-Nanoxide N/SP, Solaronix SA, Aubonne, Switzerland)) was screen-printed (90 T, Serilith AG, Switzerland) onto the pretreated FTO plate, which was then placed in an EtOH chamber for 3 min to reduce surface irregularities, and dried (125 °C heating plate, 6 min). In total, two cycles of screen printing were carried out and the resultant two-layer plate was sintered by gradually heating from room temperature to 450 °C over a period of 30 min, maintained at 450 °C for 30 min, then allowed to cool over 2 h to room temperature. The NiO electrodes were soaked in an EtOH solution of Ni(OAc)2 (20 mM) containing 1% ethanolamine for 30 min at 60 °C followed by EtOH rinsing and drying in air. The sintered FTO/NiO plates were then cut to form electrodes (1 × 2 cm). The thickness of the NiO layer (≈1.0–2.5 µm) was confirmed using focused ion beam (FIB) scanning electron microscopy (REM-FEI Helios NanoLab 650).
The FTO/NiO electrodes were heated at 250 °C (20 min), then cooled to 80 °C before being placed in an MeCN solution (0.3 mM) of P1 (Dyenamo AB, Stockholm, Sweden) or an acetone solution (0.3 mM) of PP1. The electrodes were removed from the solutions, washed with the same solvent as used in the dye bath, then dried in an N2 stream. Commercial counter electrodes (Test Cell Platinum Electrodes, Solaronix SA, Aubonne, Switzerland) were washed with EtOH, then heated at 450 °C (hot plate) for 30 min to remove volatile organic impurities. The working and counter electrodes were combined using thermoplast hot-melt sealing foil (Meltonix 1170–25 Series, 60 µm thick, Solaronix SA, Aubonne, Switzerland) by heating while pressing them together. The electrolyte of composition I2 (0.1 M), LiI (1 M) in MeCN was introduced into the DSC by vacuum backfilling. The hole in the counter electrode was closed with a hot-melt sealing foil and cover glass.
2.9. Solar Cell Measurements
The solar cell measurements were made using unmasked cells with an active area of 0.237 cm2. The DSCs were sun-soaked from the anode side for 20 min at 1 sun irradiation. The cell was then inverted and measured immediately with a LOT Quantum Design LS0811 instrument ((LOT-QuantumDesign GmbH, Darmstadt, Germany) (100 mW cm−2 = 1 sun at AM1.5 and 23 °C) to obtain the current density–voltage (J–V) curves. The instrument software was set to a p-type measurement mode (inverted configuration), with a 360 ms settling time [22] and a voltage step of 5.3 mV. The voltage was scanned from negative to positive values.
The external quantum efficiency (EQE) measurements were made using a Spe-Quest quantum efficiency instrument (Rera Systems, Nijmegen, The Netherlands) equipped with a 100 W halogen lamp (QTH) and a lambda 300 grating monochromator (L.O.T.-Oriel GmbH & Co. KG, Darmstadt, Germany). The monochromatic light was modulated to 1 Hz by using a chopper wheel (ThorLabs Inc., Newton, NJ, USA). The cell response was amplified with a large dynamic range IV converter (Melles Griot B.V., Didam, The Netherlands) and measured using a SR830 DSP Lock-In amplifier (Stanford Research Systems Inc., Sunnyvale, CA, USA).
2.10. Electrochemical Impedance Spectroscopy (EIS), Open-Circuit Photovoltage Decay (OCVD) and Intensity-Modulated Photocurrent Spectroscopy (IMPS) Measurements
EIS and IMPS measurements were carried out on a ModuLab® XM PhotoEchem photoelectrochemical measurement system (Solartron Metrology Ltd., Leicester, UK). The impedance was measured around the open-circuit potential of the cell at different light intensities (590 nm) in the frequency range 0.05 Hz to 400 kHz [29] using an amplitude of 10 mV. The impedance data were analysed using ZView® software (Scribner Associates Inc., Southern Pines, NC, USA). The IMPS measurements were performed using a small perturbation (>5%) of the steady state illumination. Voltage decay was measured on a Modulab XM electrochemical system (Solartron Metrology Ltd., Leicester, UK).
3. Results and Discussion
3.1. Synthesis and Characterization of PP1
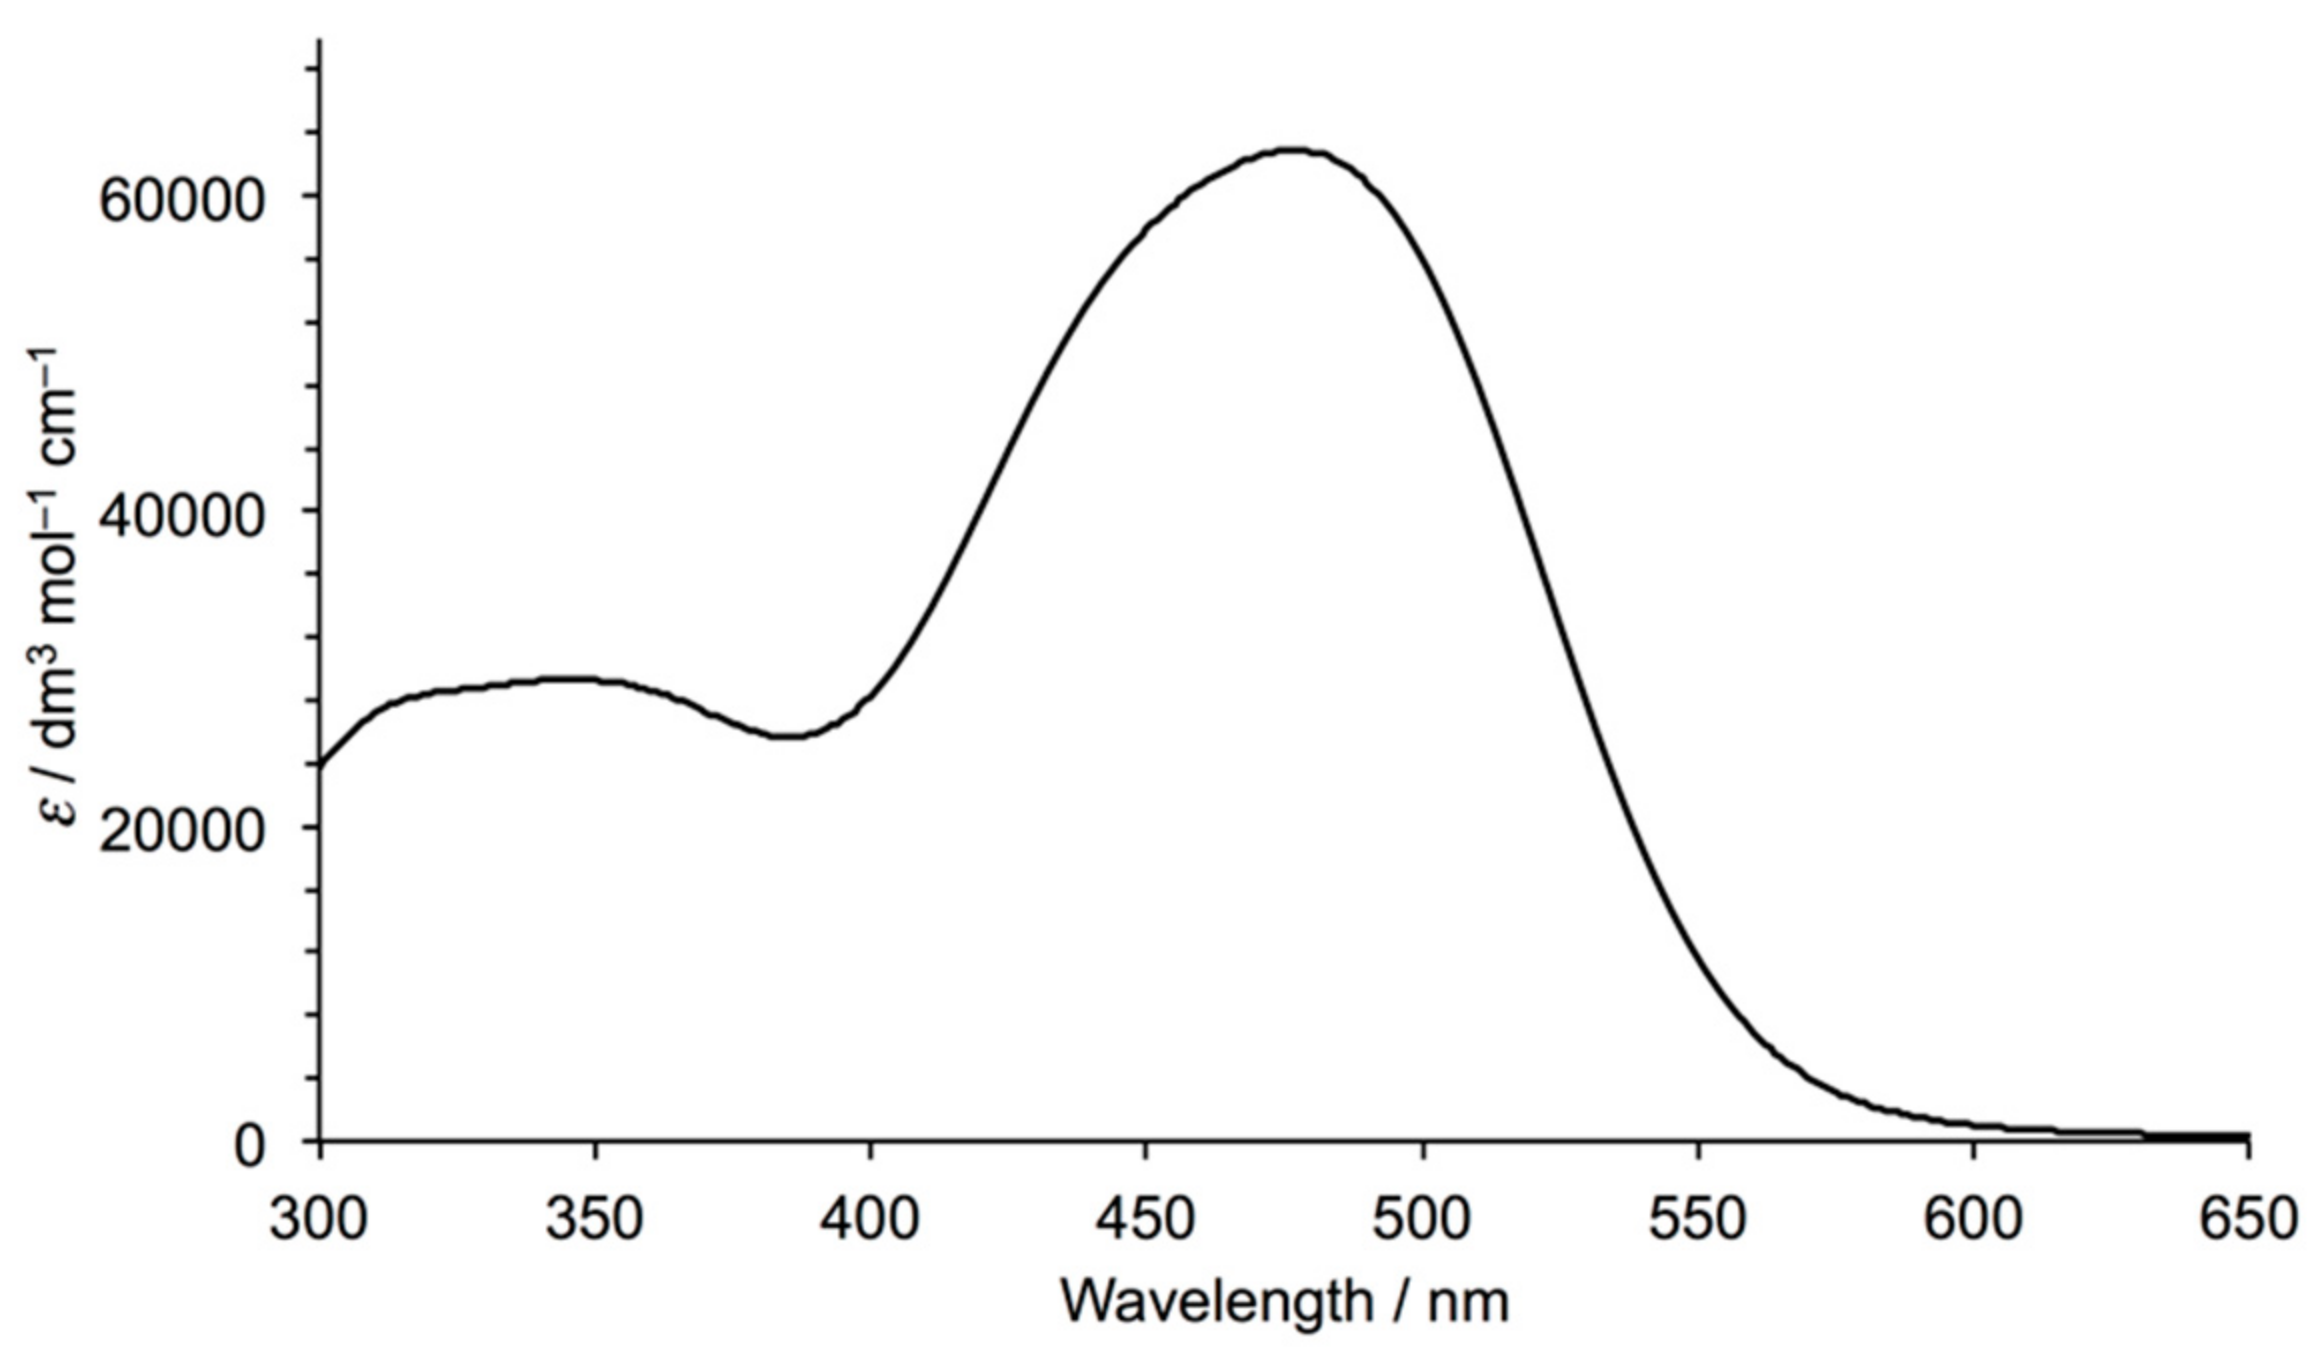
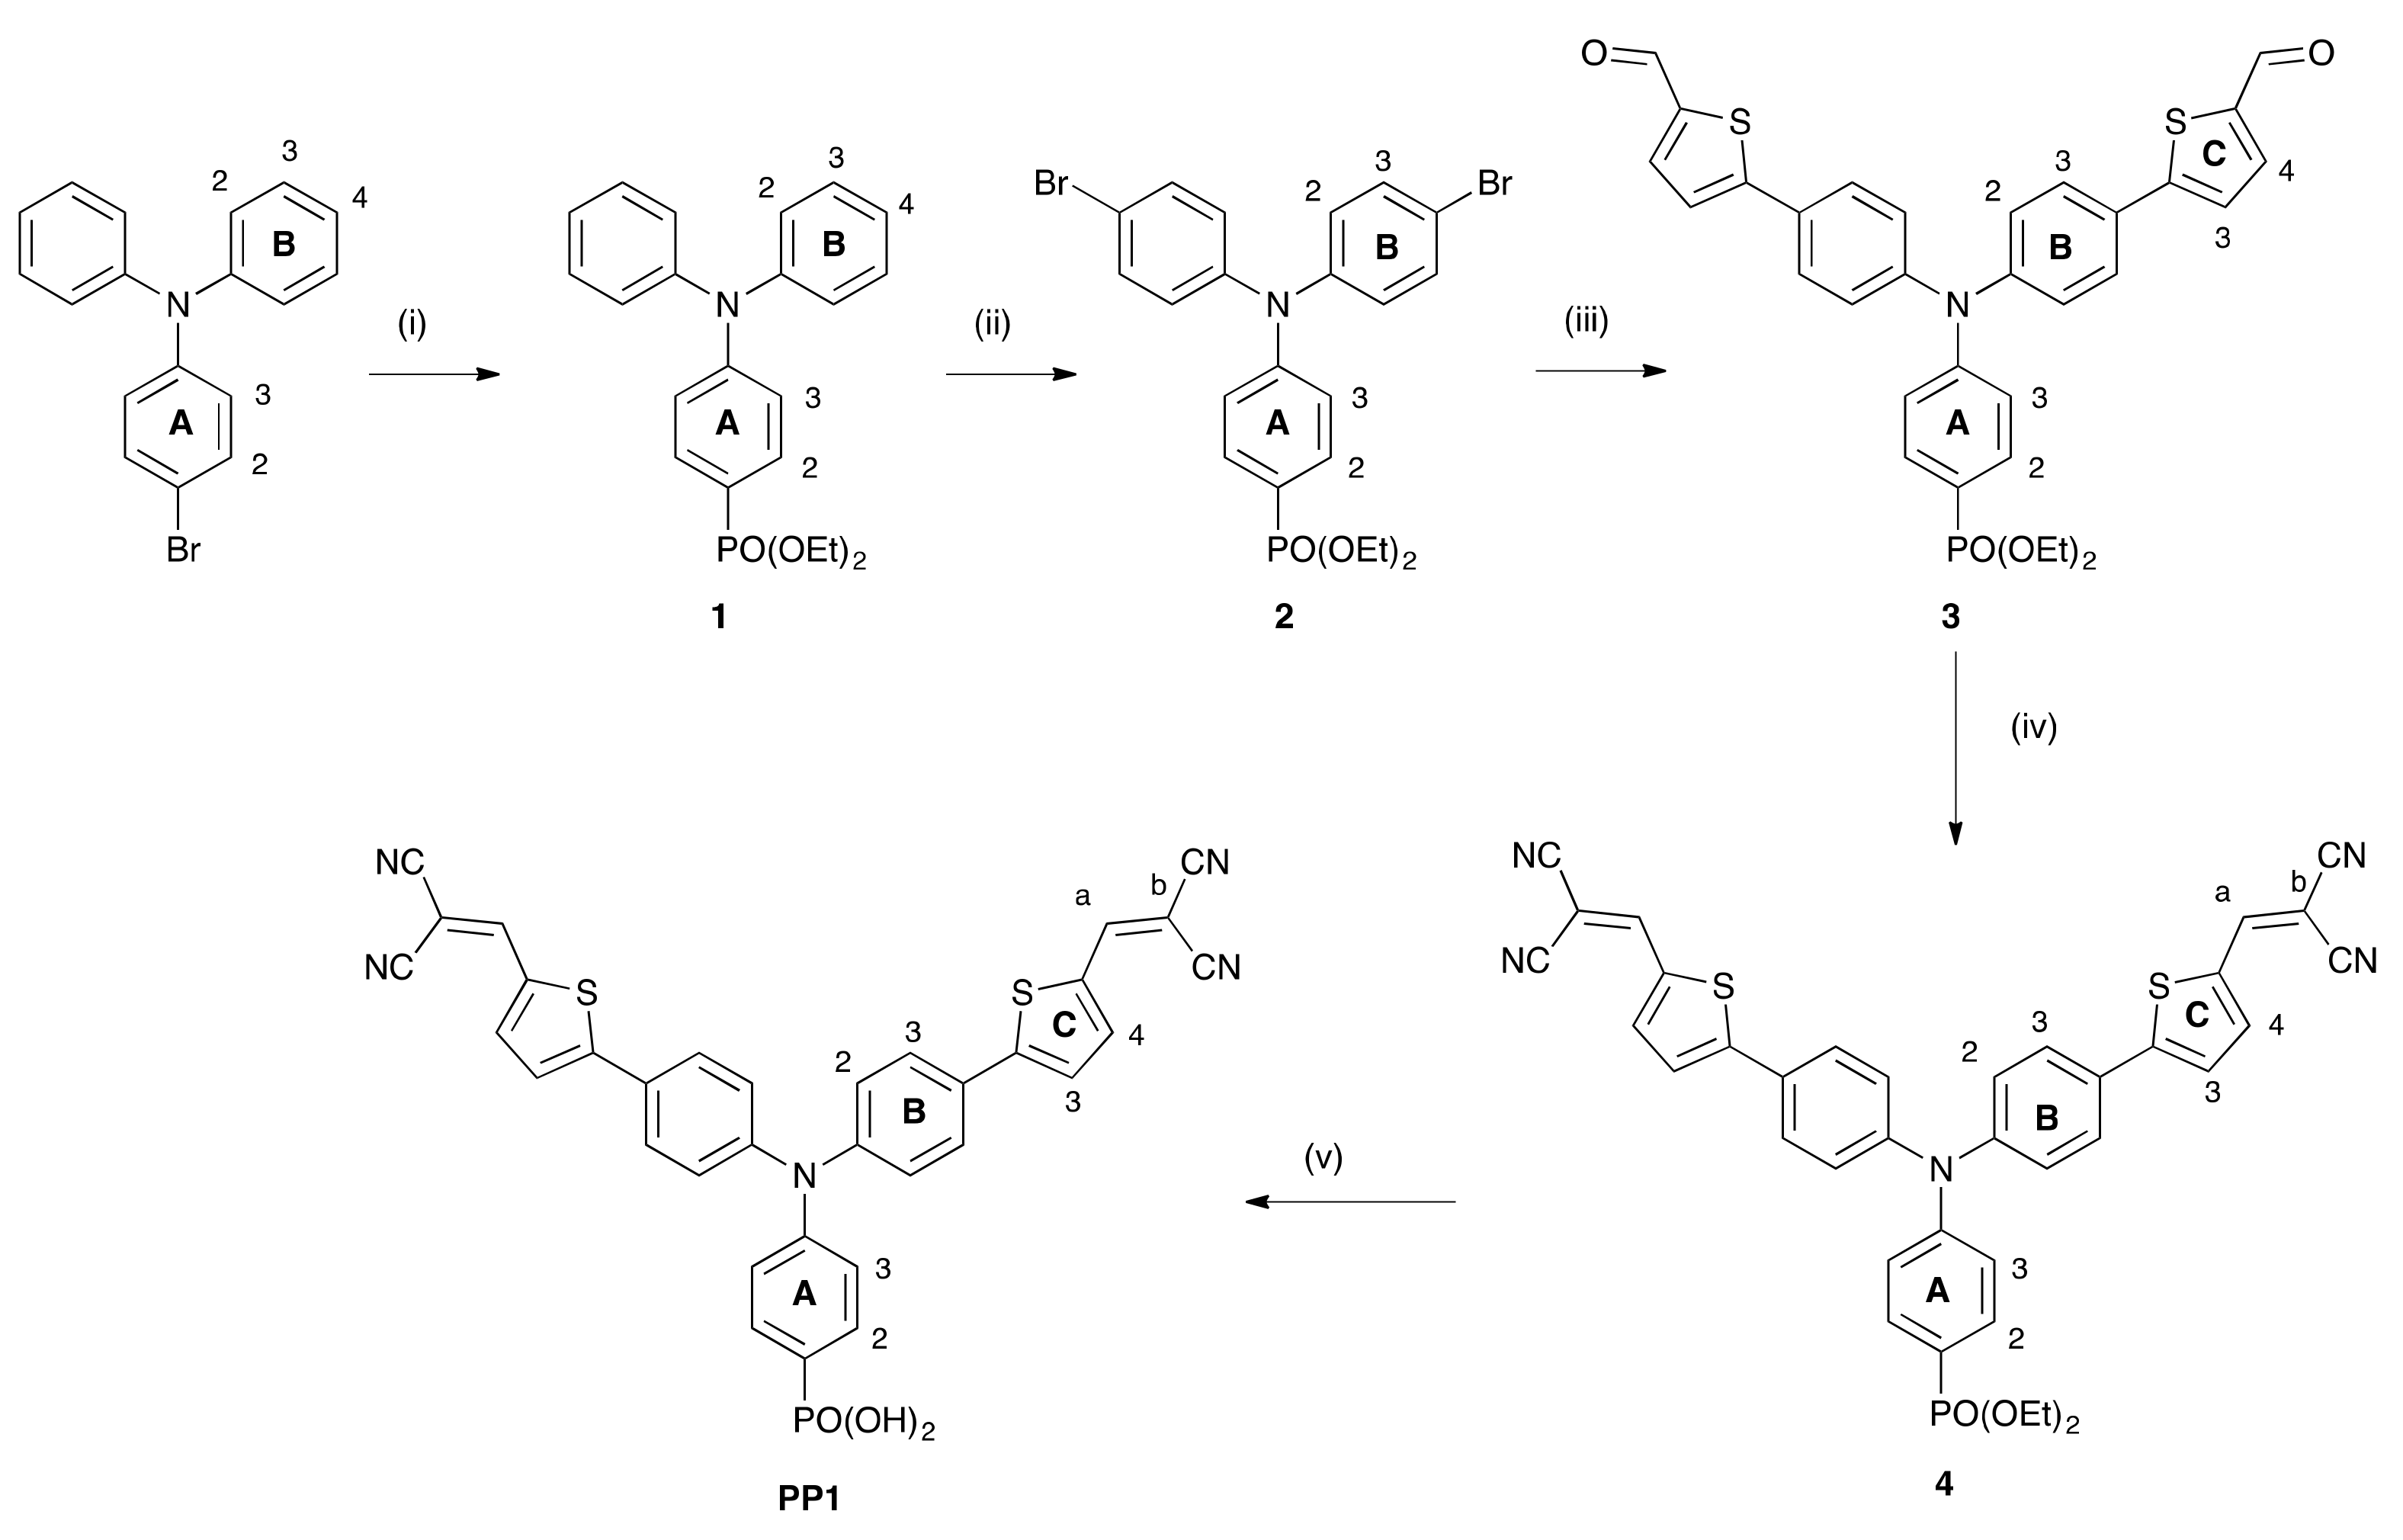
The synthetic route to compound PP1 is summarized in Scheme 3. In our hands, yields of the Pd-catalysed cross-coupling reaction introducing the phosphonic ester group are rather low and we therefore decided to carry out this transformation as the first step of the multi-step synthesis. (4-Bromophenyl)diphenylamine was treated with HPO(OEt)2 in the presence of Cs2CO3 with [Pd(PPh3)4] as catalyst under microwave conditions and 1 (Scheme 3) was isolated in 48.8% yield. Treatment of 1 with NBS gave selective bromination in the 4-positions of the unsubstituted phenyl rings. A double Suzuki-Miyaura coupling of 2 (Scheme 3) using four equivalents of 5-(4,4,5,5-tetramethyl-1,3,2-dioxaborolan-2-yl)thiophene-2-carbaldehyde under microwave conditions yielded the dialdehyde intermediate 3 (see below), although the 1H NMR spectrum indicated the presence of trace quantities of a second aldehyde-containing species. The electron withdrawing dicyanovinyl groups were then introduced by reaction of 3 with malononitrile (Scheme 3), and finally, the phosphonate ester groups were deprotected by treatment with Me3SiBr to yield PP1 as a red solid after recrystallization in 68.9% yield. The 1H and 13C NMR spectra of the intermediates in Scheme 3 and of PP1 were fully assigned by 2D methods, and representative spectra are given in Figures S1–S4. Whereas phosphonate ester 4 is readily soluble in most common solvents, PP1 is poorly soluble and NMR spectra were recorded in DMSO-d6. Figure 1 shows the 1H NMR spectrum of PP1. Complete deprotection of 4 to the acid was confirmed by the loss of the signals for the ethyl groups δ 4.15 and 1.35 ppm. The negative mode electrospray mass spectrum of PP1 showed a base peak at m/z 639.99 corresponding to the [M − H]− ion. The solution absorption spectrum of PP1 consists of two bands at λmax = 344 and 478 nm with values of εmax = 29,300 and 62,800 dm3 mol−1 cm−1, respectively (Figure 2). This corresponds closely to the reported MeCN solution absorption spectrum of P1 (λmax = 345 and 468 nm with εmax = 58,000 dm3 mol−1 cm−1 at 468 nm) [17].
3.2. Crystal Structure of Intermediate 3
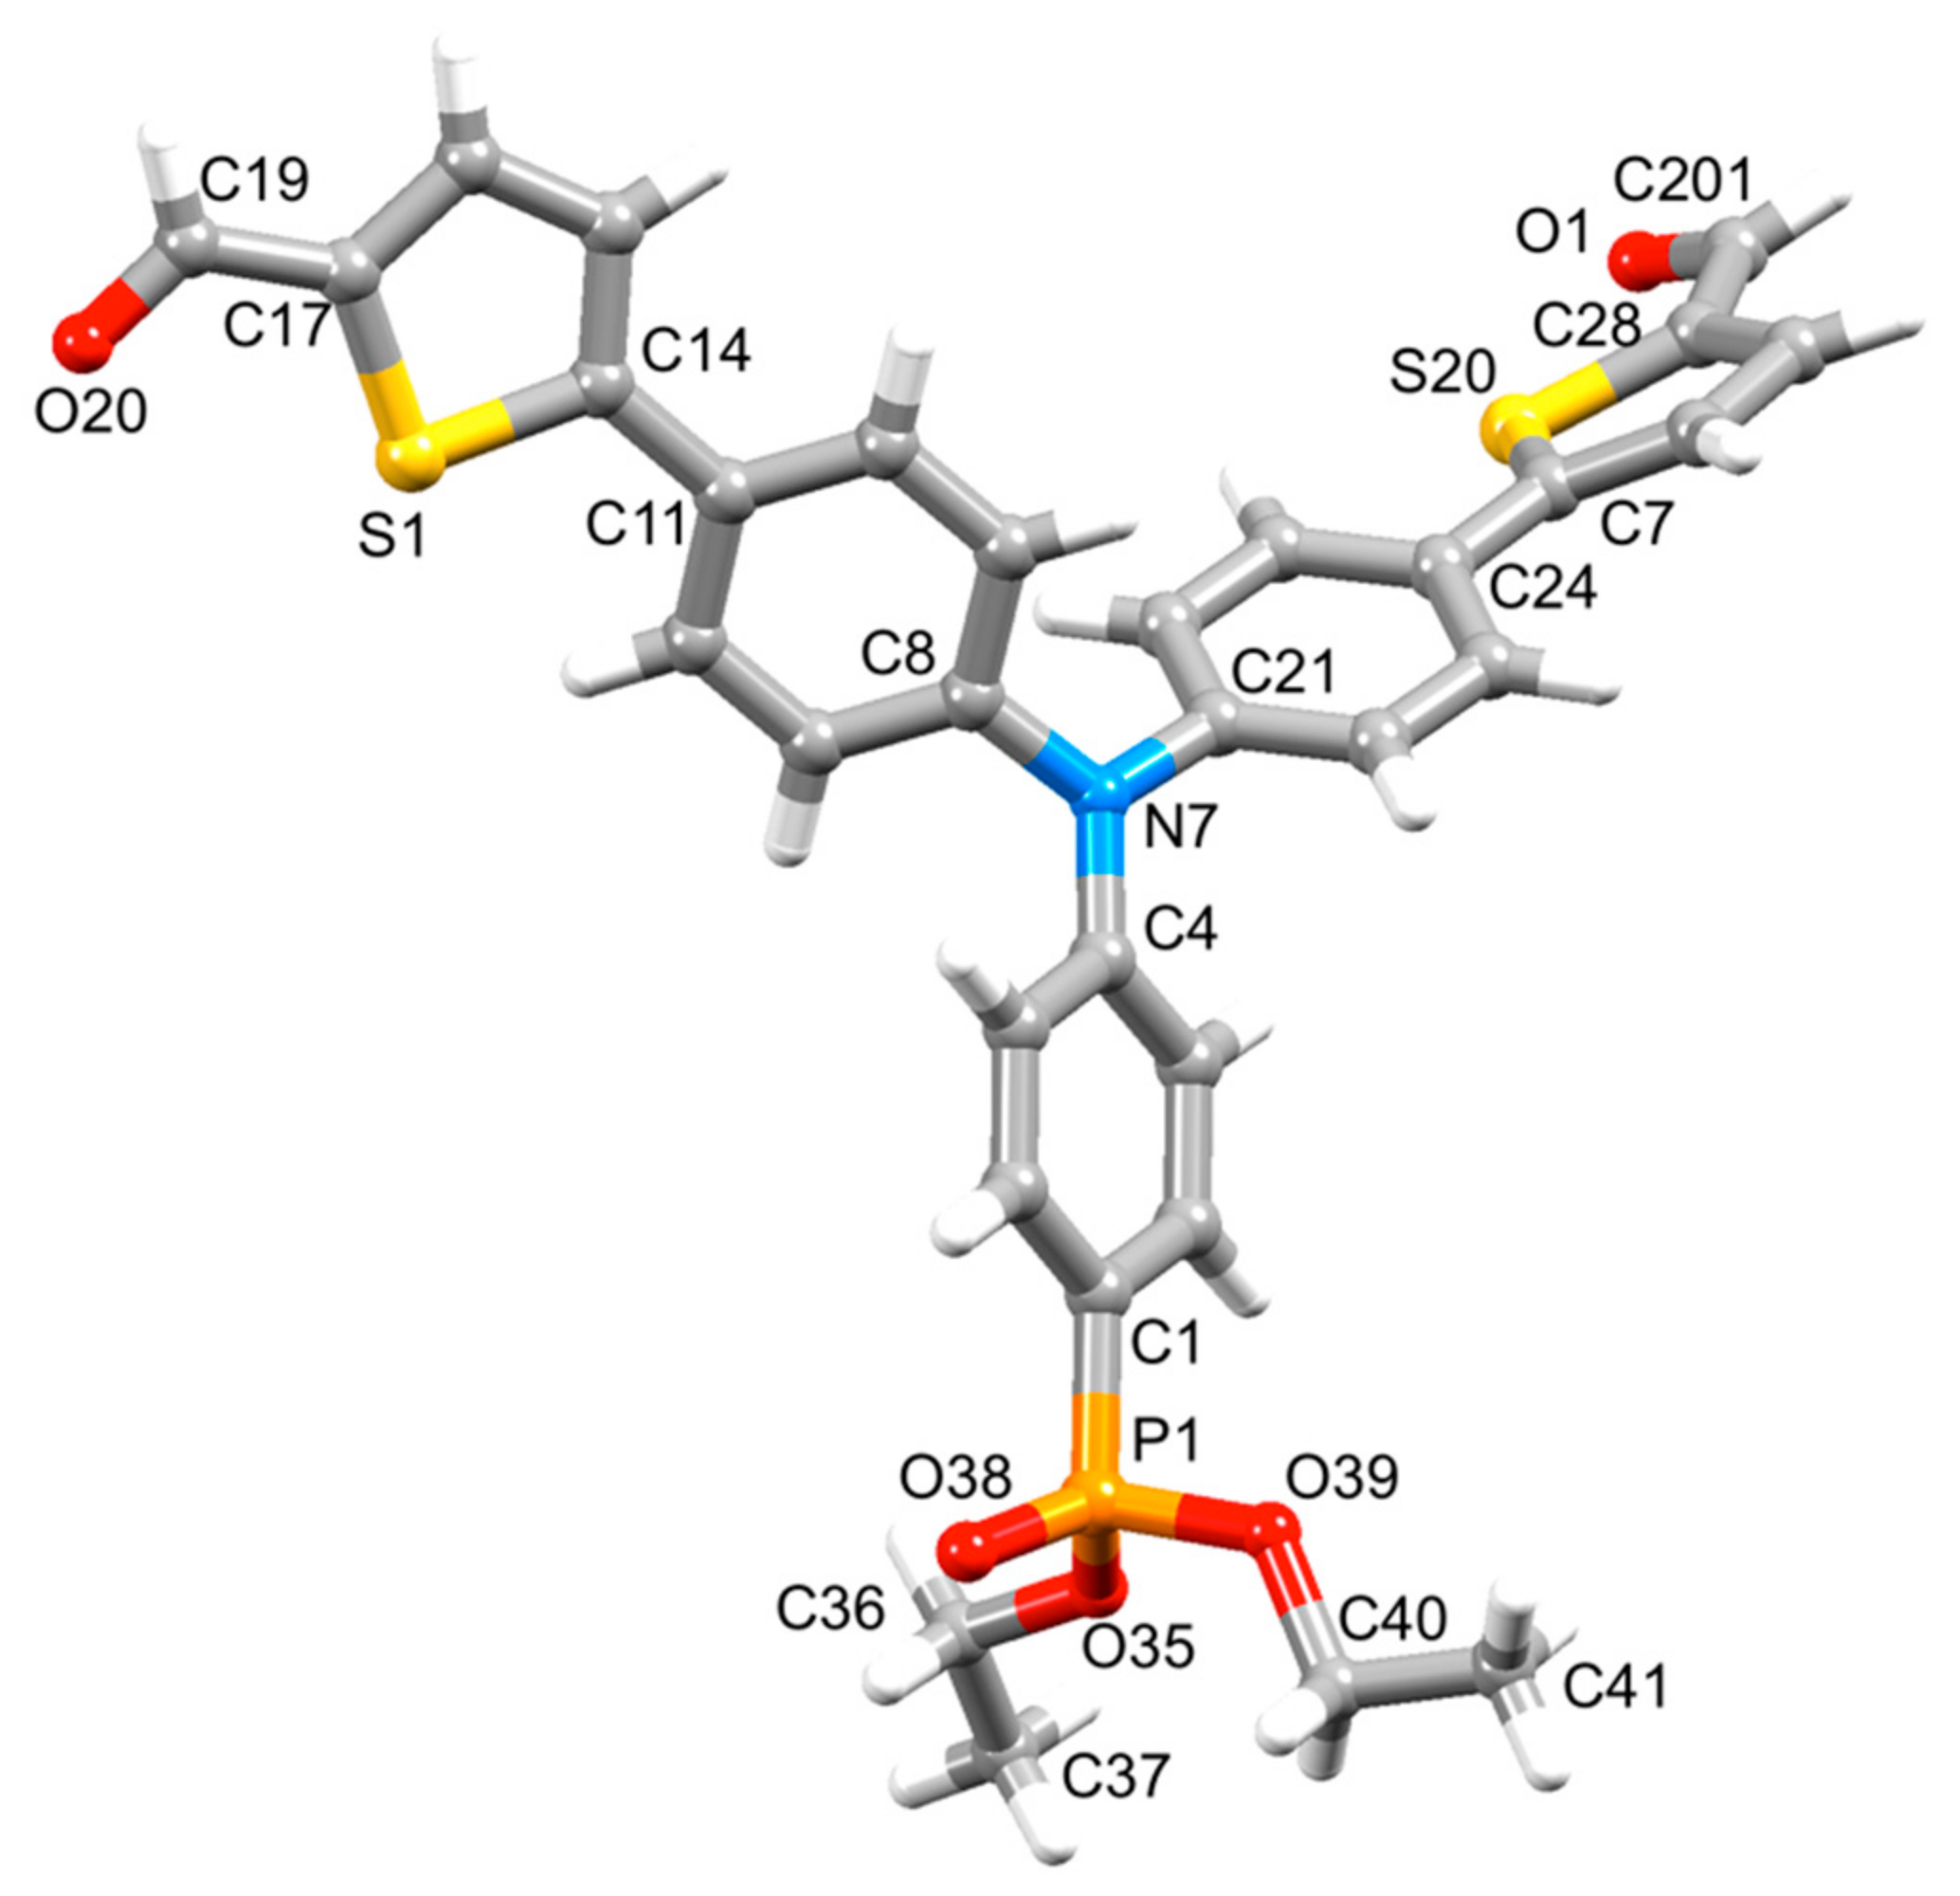
Single crystals of the intermediate 3 were grown by slow evaporation of a solution of 3 in ethyl acetate and the structure was confirmed by single-crystal X-ray diffraction. Compound 3 crystallizes in the monoclinic C2/c space group, and the structure is depicted in Figure 3, and an ORTEP-style plot in Figure S5. One thiophene ring and its aldehyde group are disordered and was modelled over two positions with occupancies of 40 and 60%; only the major occupancy site containing S20 and C201 is shown in Figure 3 and Figure S5. The phenyl rings adopt the sterically-favored paddle-wheel arrangement around the planar N7 with N–C bond lengths and C–N–C angles in the ranges 1.403(5)–1.430(4) Å and 116.4(3)–121.7(3)°, respectively. The angles C17–C19–O20 and O1–C201–C28 of 125.5(4) and 119.9(8)° are consistent with sp2 hybridization in the aldehyde. For the minor occupancy aldehyde, O3–C200–C30 = 118.2(8)°. The crystal structure confirms the presence of the phosphonate ester, with the bond P1–O38 being shorter than P1–O35 and P1–O39 (Figure 3 caption).
3.3. Electrode Preparation
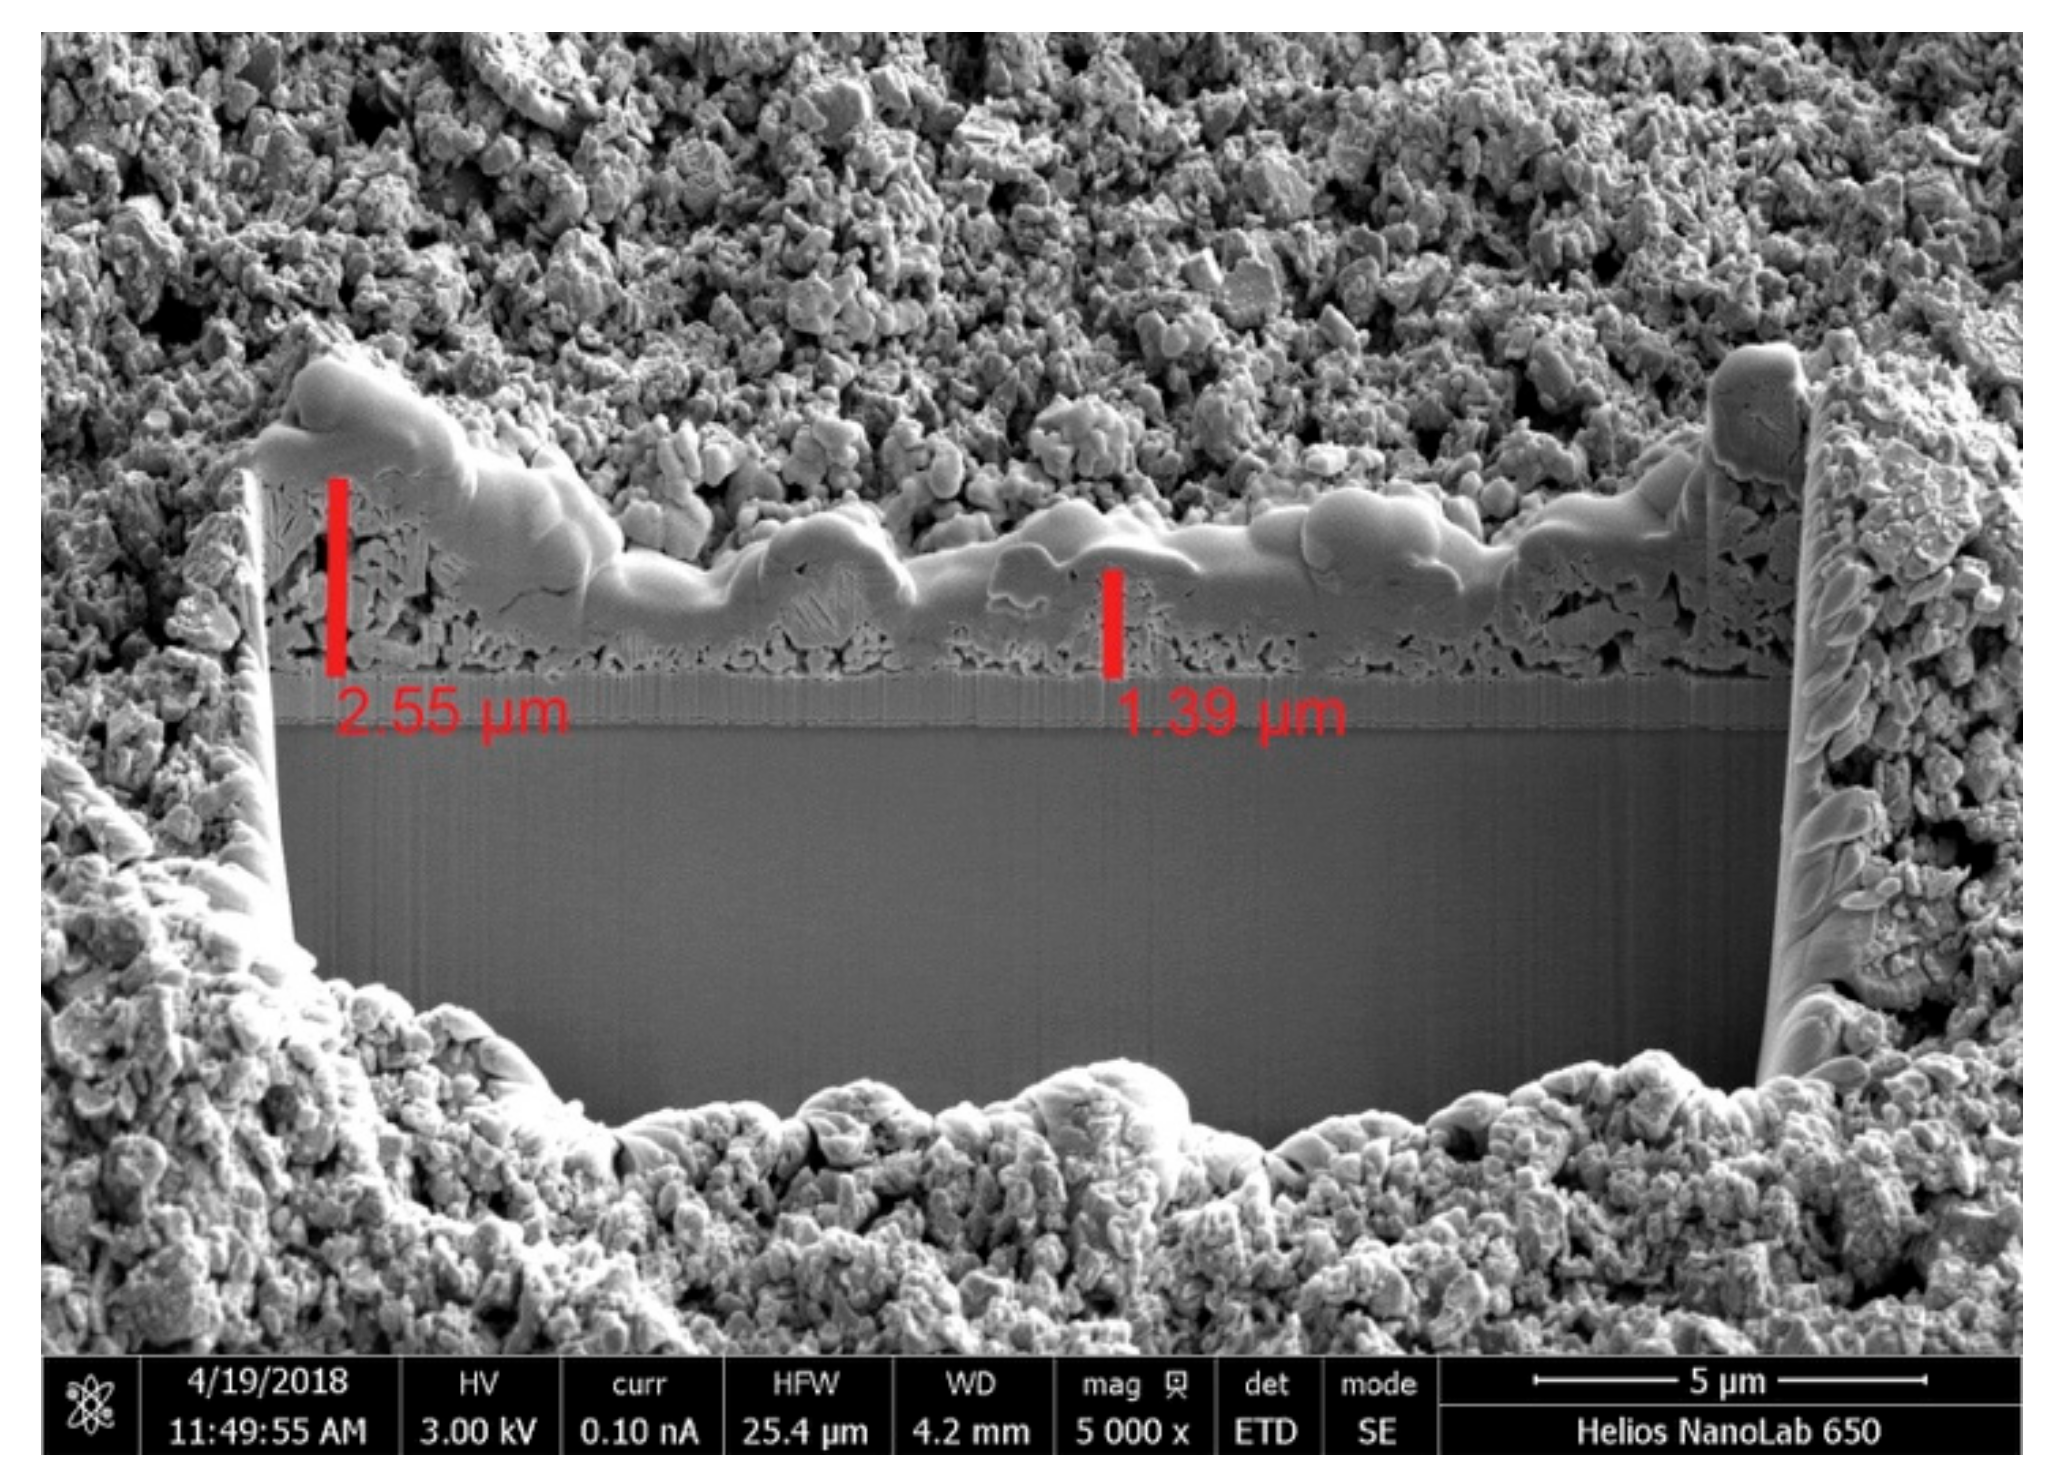
FTO/NiO working electrodes for p-type DSCs were prepared by screen-printing two layers of NiO paste after a [Ni(OAc)2] pre-treatment of the FTO surface. A pre-treatment with [Ni(OAc)2] or [Ni(acac)2] is essential for optimizing DSC performance by improving the adhesion of the NiO paste onto the FTO-glass surface [30,31]. In the present investigation, we modified our previously described method for Ni(acac)2 pretreatment [22,23] and spin-coated a Ni(OAc)2 solution in methoxyethanol containing ethanolamine onto the FTO-coated glass plate [32]. In addition, a post-treatment of Ni(OAc)2 followed by sintering was applied after printing of the NiO layers in a manner similar to that described by Odobel and coworkers [32]. The final NiO surface morphology was examined using scanning electron microscopy (SEM) and fast ion bombardment (FIB) imaging (see Materials and Methods section). An NiO layer thickness of 2.0 ± 1.0 μm (Figure 4) was observed consistent with our previous work [22].
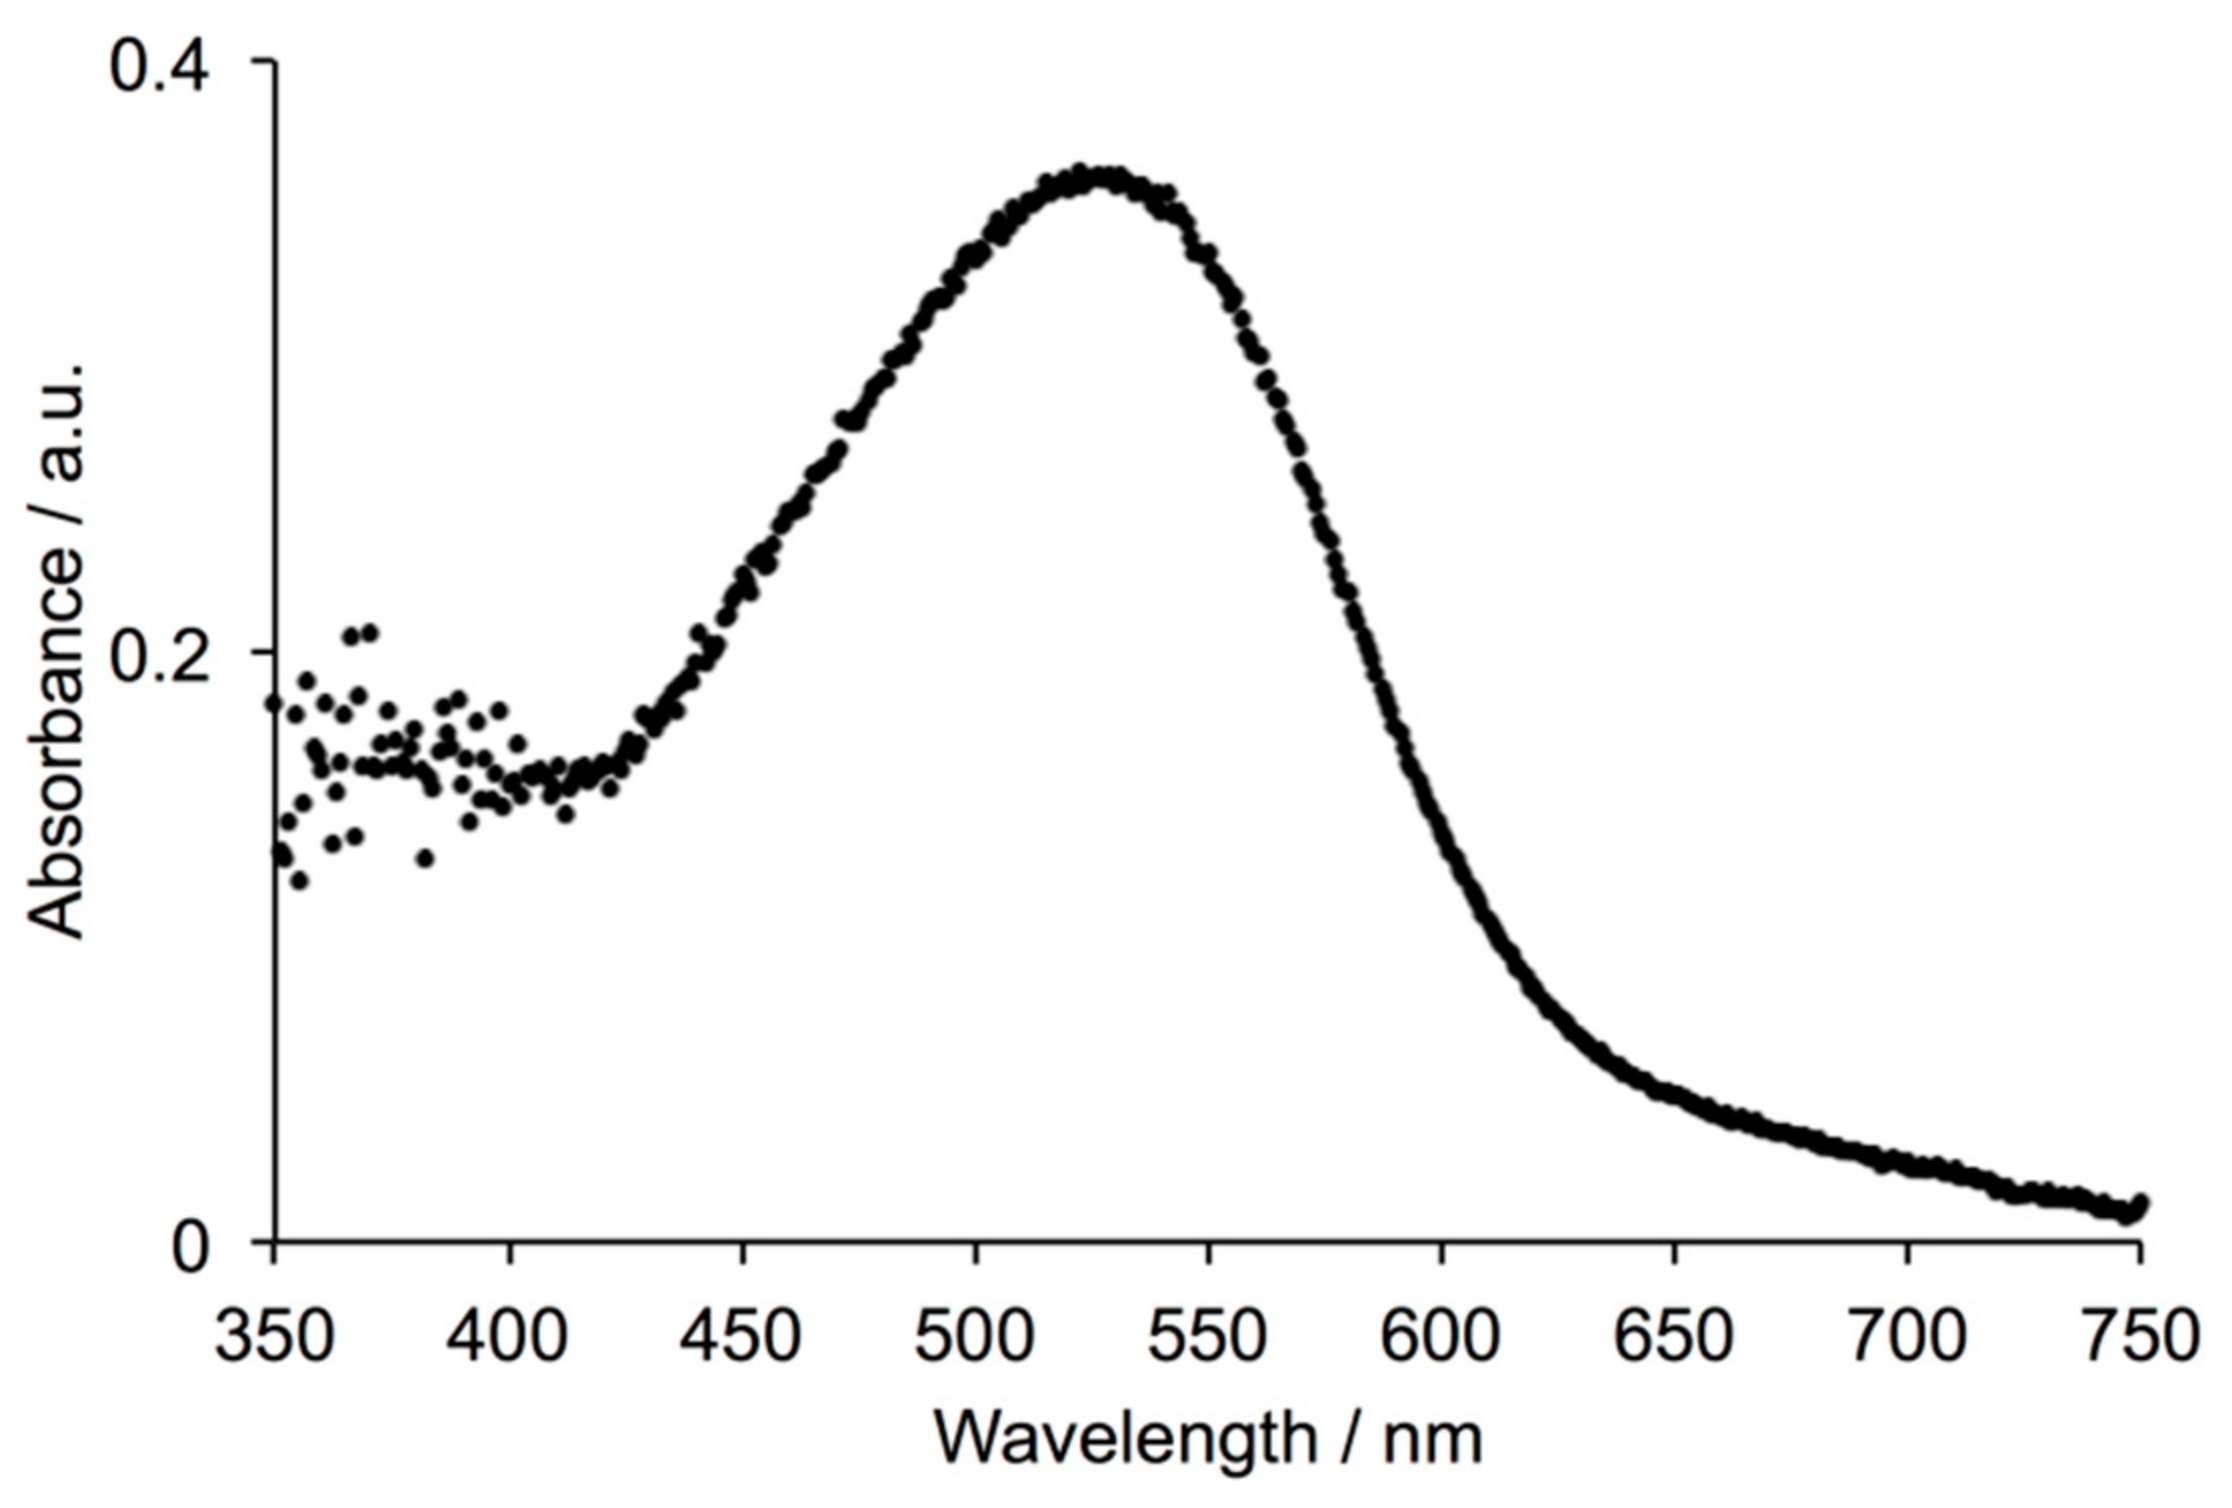
Electrodes with chemisorbed dyes P1 or PP1 were prepared by immersion of FTO/NiO photocathodes into solutions of the compounds. The solid-state absorption spectrum of an FTO/NiO electrode with adsorbed dye PP1 is shown in Figure 5. The absorption band (λmax = 530 nm) is red-shifted with respect to the solution spectrum (λmax = 478 nm, Figure 2), consistent with the shift to lower energy reported for P1 (468 to 499 nm) [17]. We note however, that we have also reported a value of λmax = 525 nm for P1 absorbed on FTO/NiO electrodes made in a similar manner to those used in the present work [22].
3.4. DSC Performances
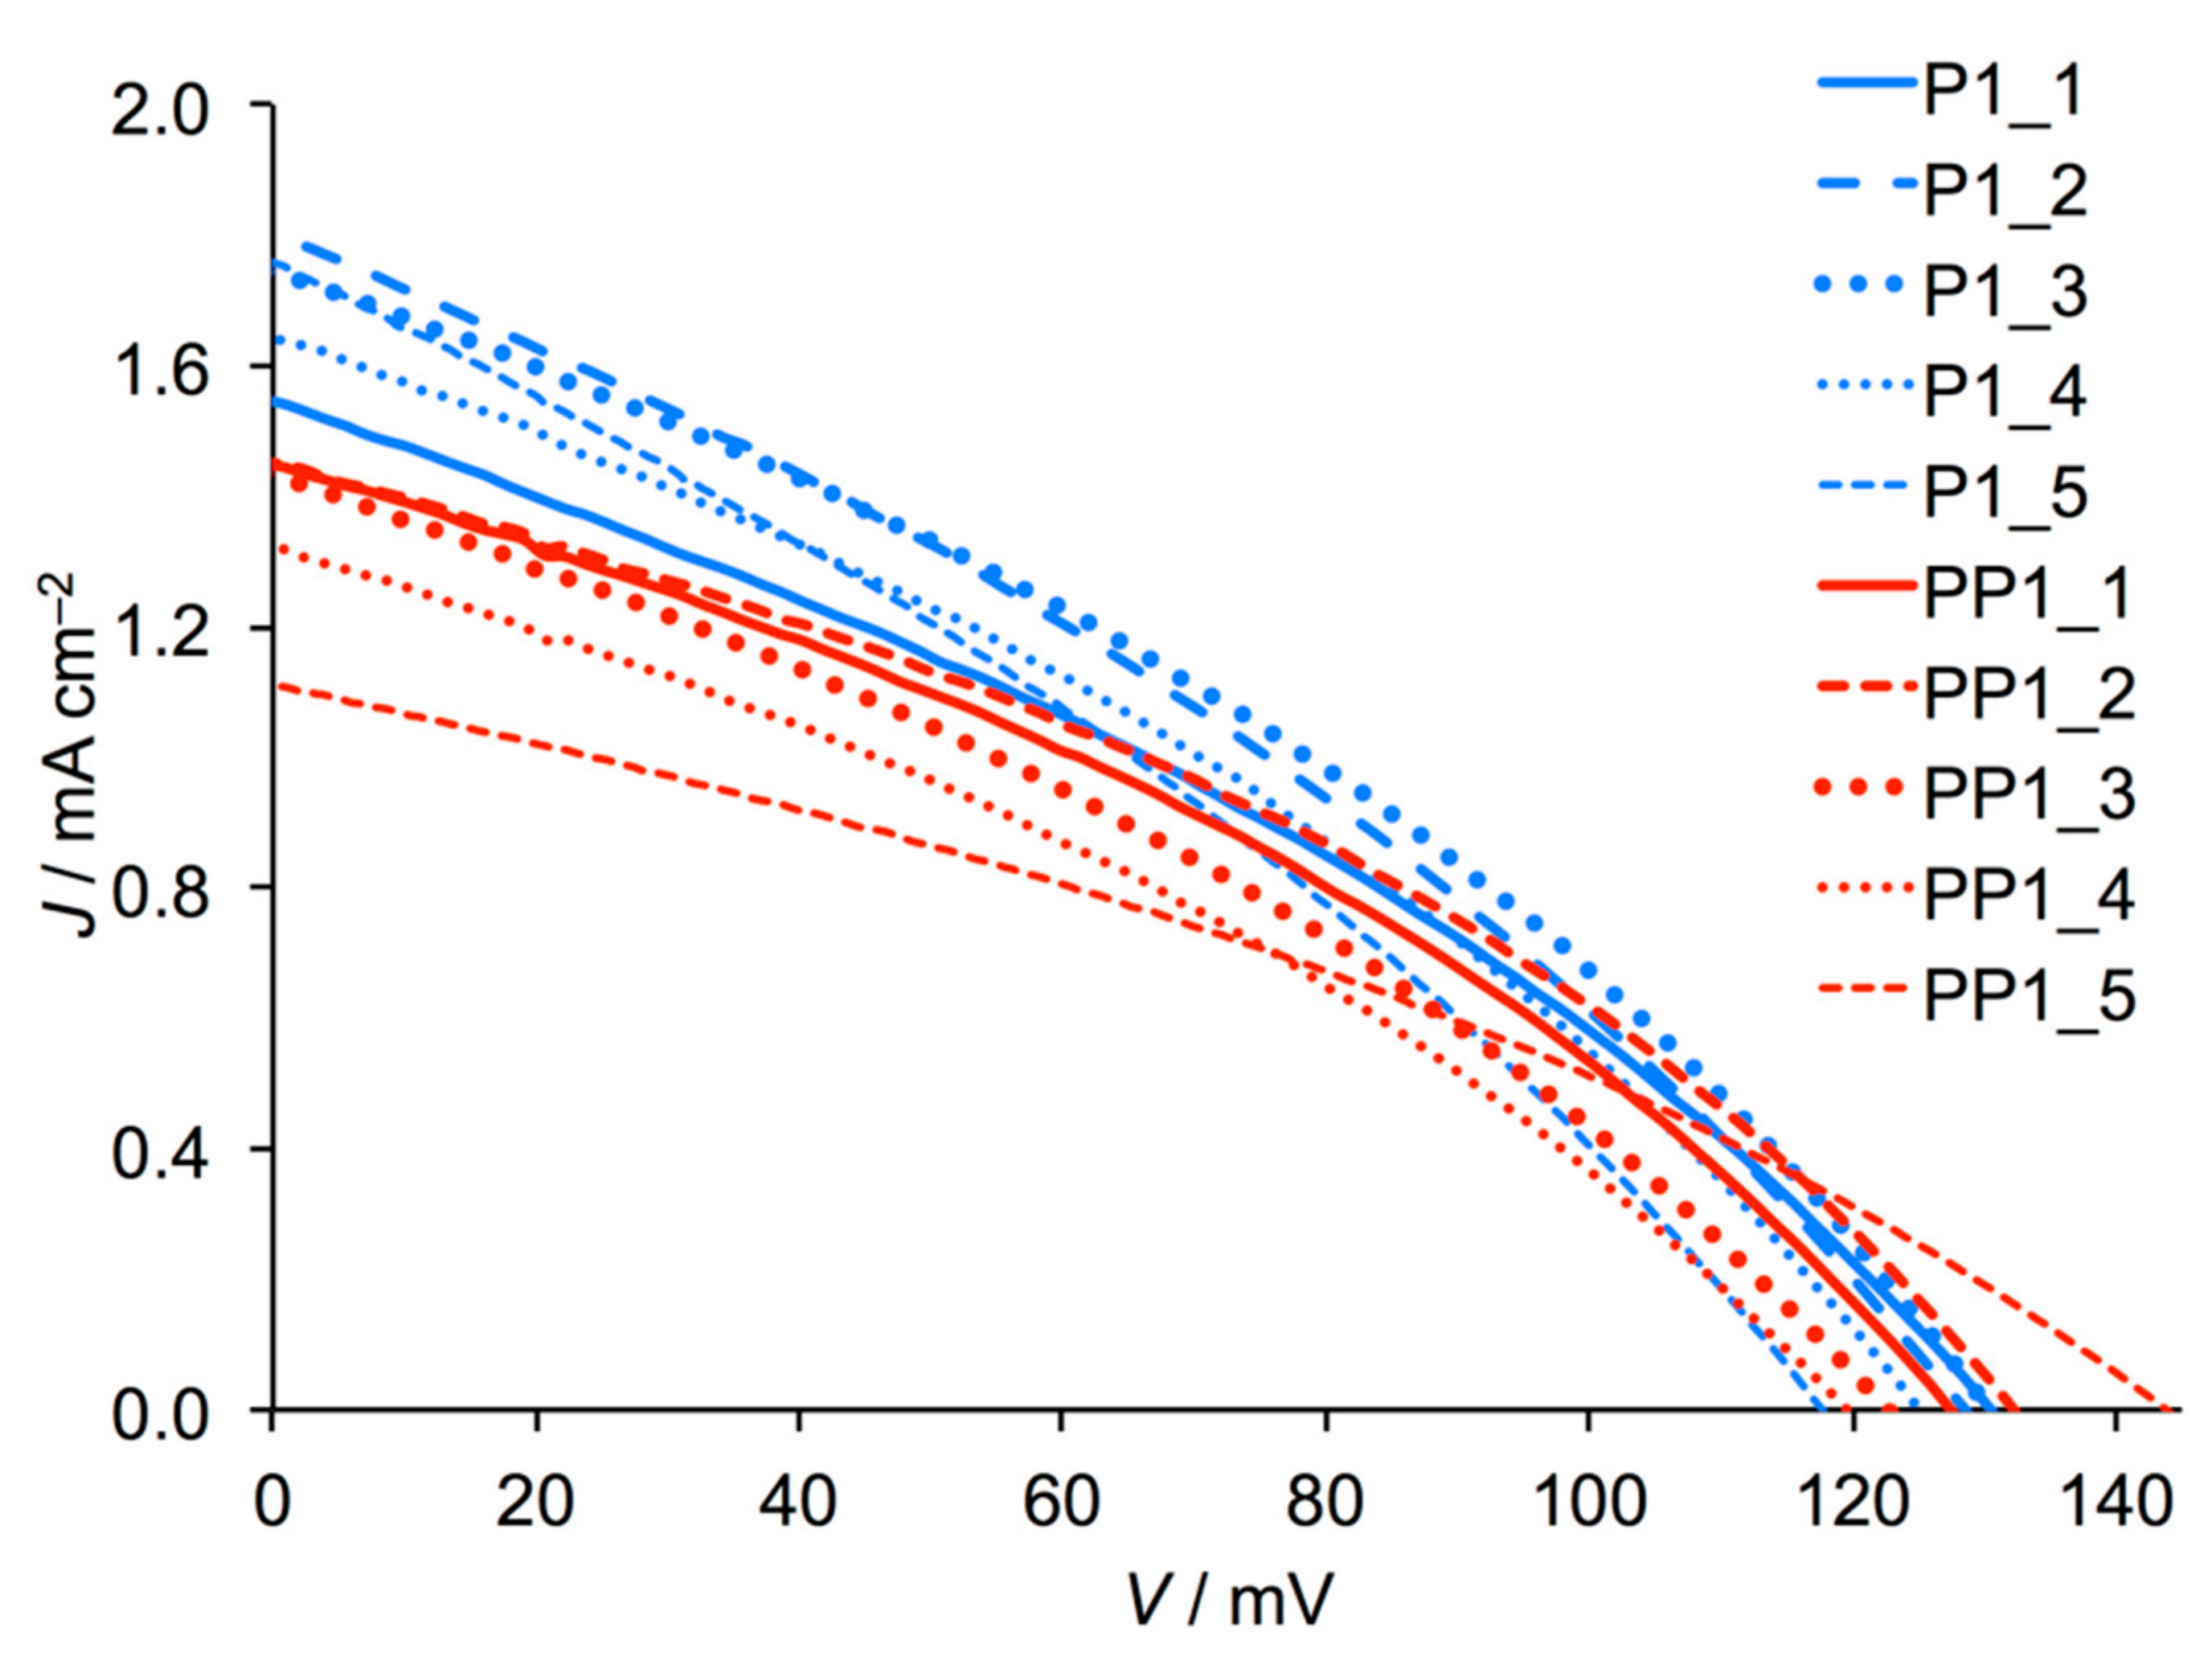
Five DSCs were fabricated for each dye and the performance parameters are given in Table 1. Current-density/voltage plots are shown in Figure 6. Although the values of JSC are low (not unexpected for a p-type DSC), for a given dye, the reproducibility of the cells is noteworthy. Values of JSC lie in the range 1.55–1.80 mA cm−2 for P1 and 1.11–1.45 mA cm−2 for PP1, and values of VOC are in the range 117–130 mV for P1 and 119–143 mV for PP1. The overlap of the data indicates that the dyes behave similarly, and this is borne out in the overall efficiencies (Table 1). All cells show similar fill-factors which, although low, are typical of p-type DSCs [10]. In comparison to our earlier work in which P1 gave values of VOC in the range 82–97 mV and JSC values between 1.84 and 2.76 mA cm−2 [21,22,23], the DSCs in Table 1 with sensitizer P1 achieve significantly higher values of VOC, but lower values of JSC. We attribute the differences to a change in the method of fabrication of the working electrodes (see Section 2.3), with the use of both pre- and post-treatments with Ni(OAc)2 [32] proving beneficial.
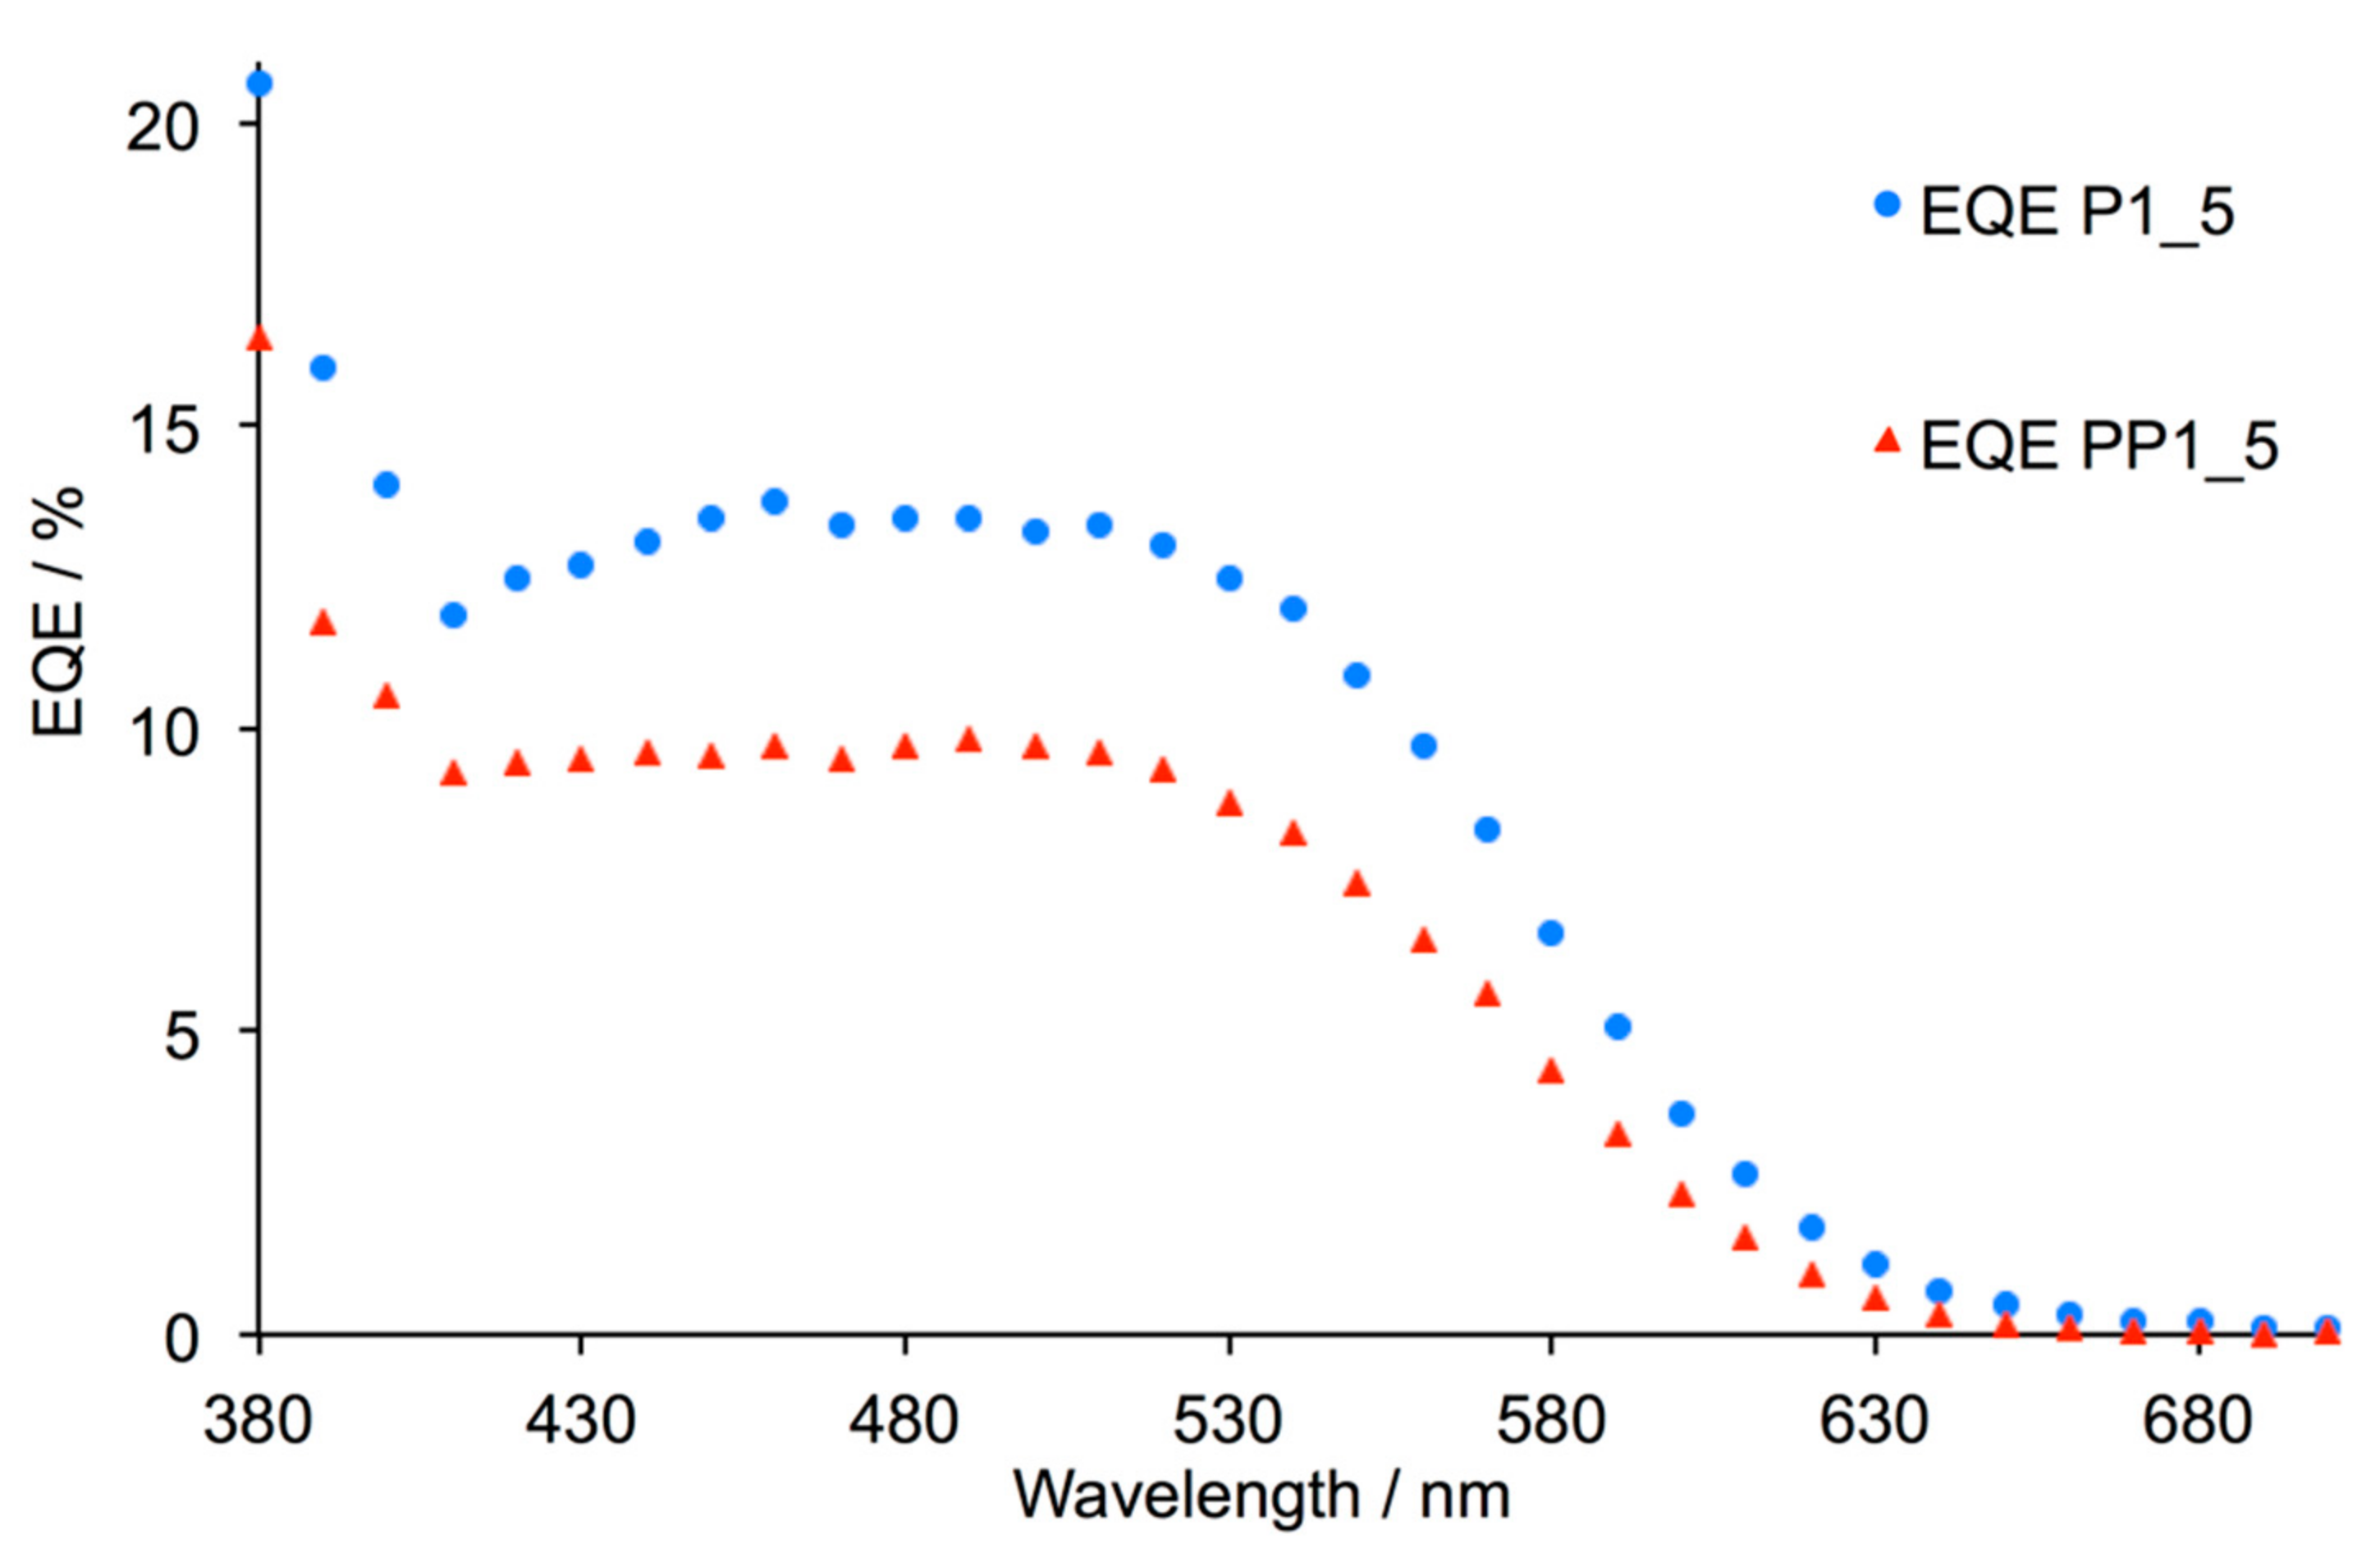
Figure 7 displays the external quantum efficiency (EQE) spectra for DSCs containing the two dyes. The spectra are broad (430–600 nm), consistent with charge-carrier injection over the full range of light absorption observed for the dyes (see Figure 5 and accompanying discussion). For PP1, EQEmax = 10% at λmax~500 nm which compares to 13.5% for P1 (at λmax = 500 nm). The latter compares to 18% reported originally by Qin et al. for P1 [17]. We note that values of EQEmax are significantly affected by the method of fabrication of the NiO working electrode [18], and values of up to 64% have been achieved [33]. Nonetheless, the data for PP1 and P1 reported here confirm the similar performances of the two dyes, indicating that the replacement of the carboxylic acid anchor in P1 by the phosphonic acid unit in PP1 does not have a significant detrimental effect upon electron injection.
3.5. Electrochemical Impedance Spectroscopy (EIS)
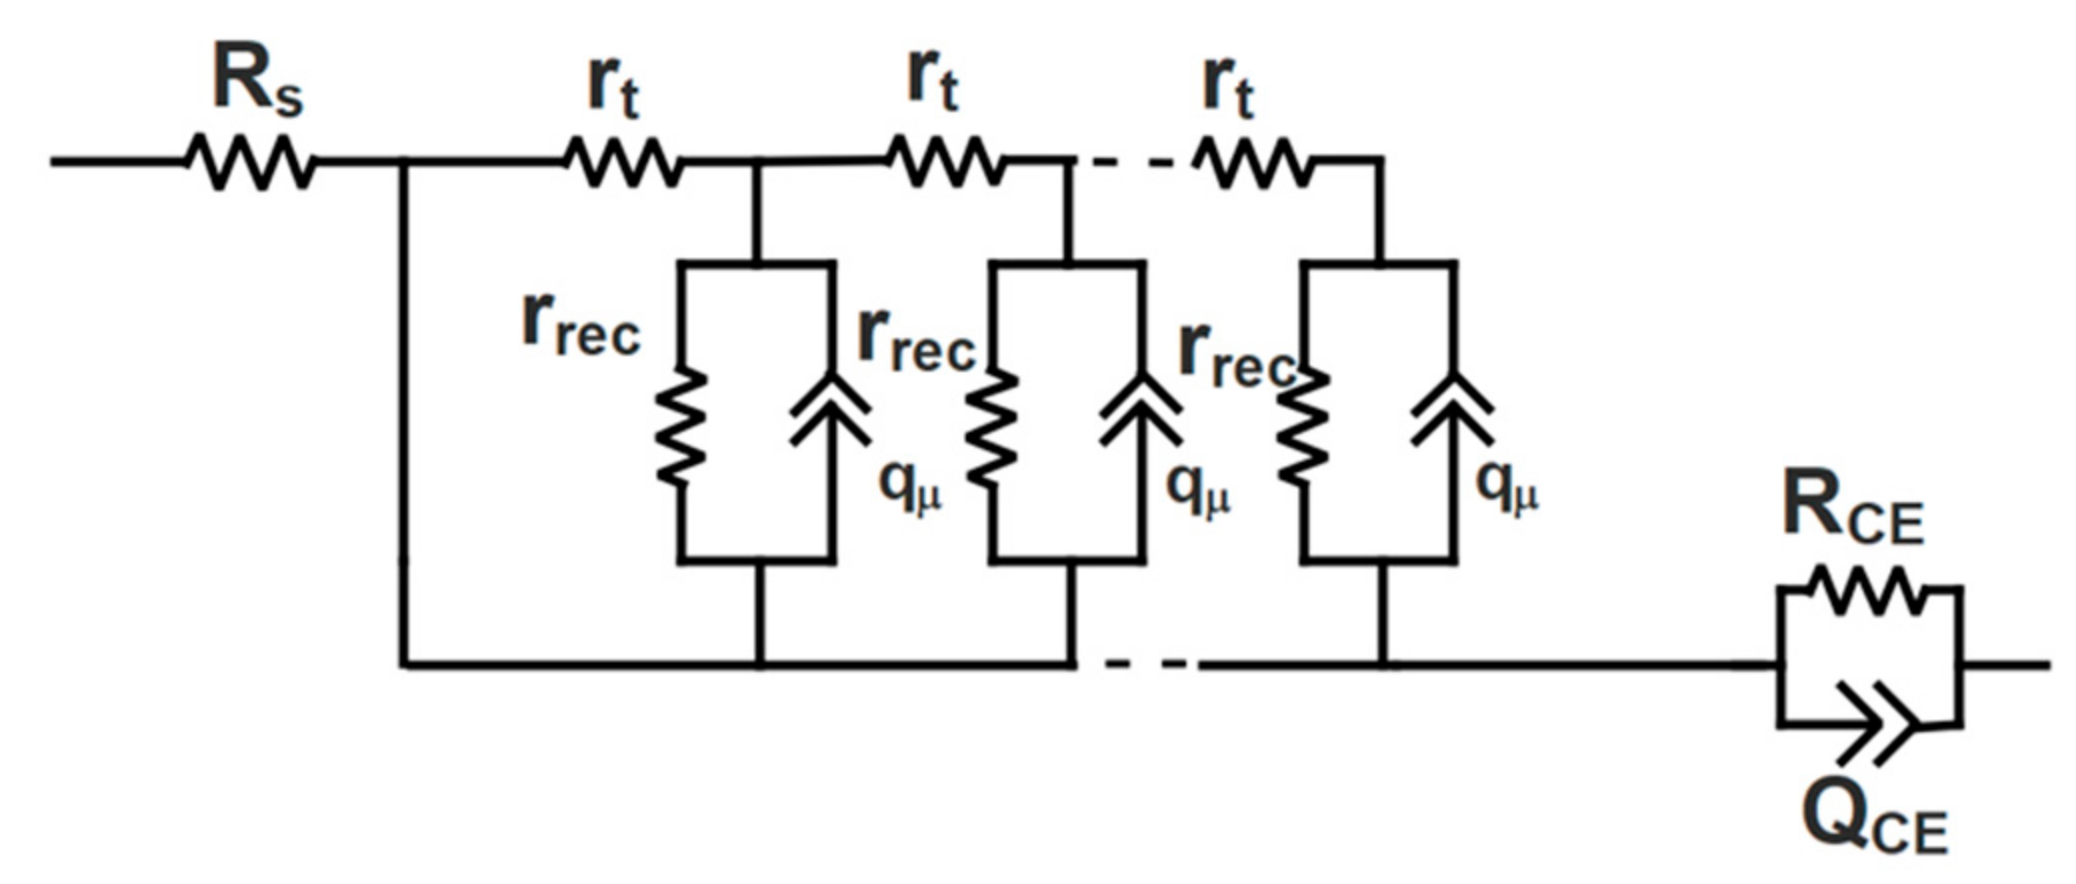
In order to compare the performances of P1 and PP1 in more detail, we have used EIS to investigate the internal processes and dynamics in a DSC [34,35,36]. A model based on an equivalent electrical circuit is used to represent the DSC. During the EIS experiment, AC voltages are applied to the DSC and the resulting current response is monitored with respect to amplitude and phase shift. Nyquist and Bode plots are used to depict the EIS results and parameters which can be extracted from the data include the recombination charge transfer resistance (Rrec), electron/hole transport resistance (Rt), charge-transfer resistance at the counter-electrode (RPt) and the active layer surface chemical capacitance (Cµ). A Nyquist plot comprises three semicircles, but for p-type DSCs, typically only two semicircles are seen as a consequence of the relative magnitudes of the recombination and ion diffusion impedances. Scheme 4 shows the equivalent circuit used in the present investigation, and is composed of a series resistance (Rs), a distribution element that consists of the Rt, Rrec and constant phase element (CPE, Qµ) of the NiO/electrolyte interface [37]. Values of Rt, Rrec and Qµ are derived from the individual values of rt, rrec and qµ [34,35,36] and the resistance and constant phase element of the platinum counter electrode (RCE, QCE). A CPE was used for charge transfer processes at both the NiO working electrode and platinum counter electrode due to the different porosity of the electrode surfaces [38]; we have previously detailed the equation used to calculate the fitted capacitance (Cµ) [21].
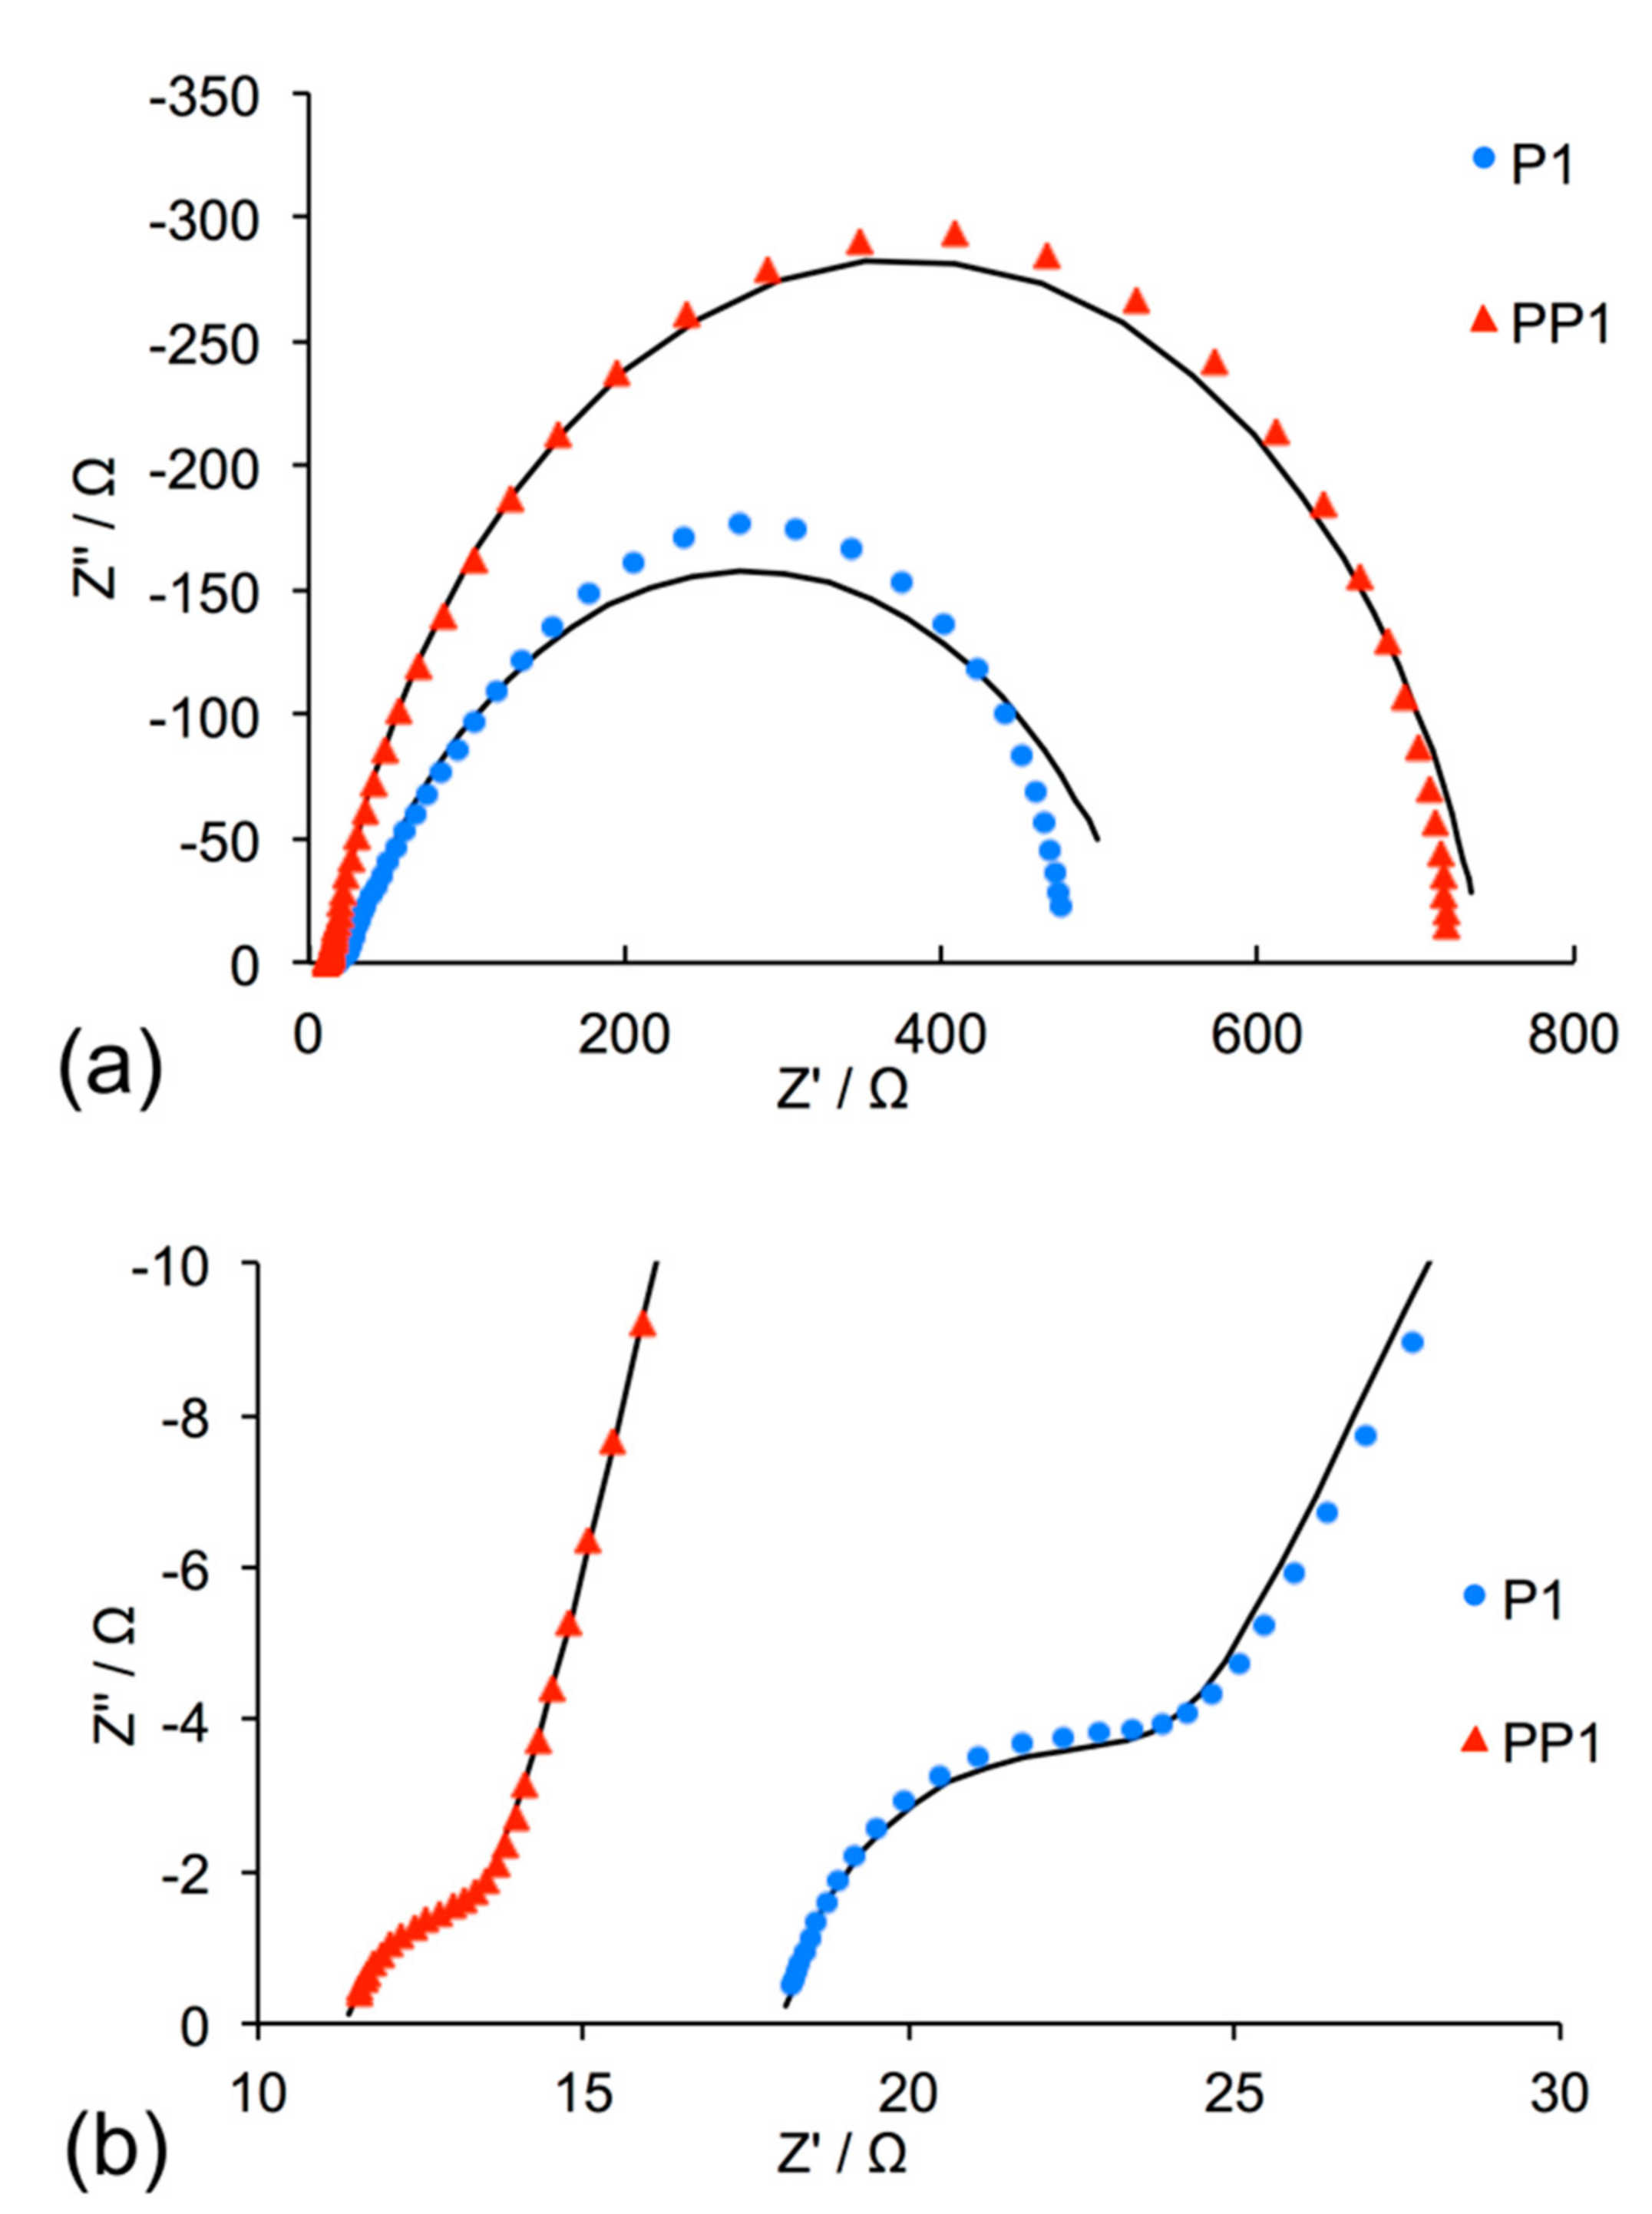
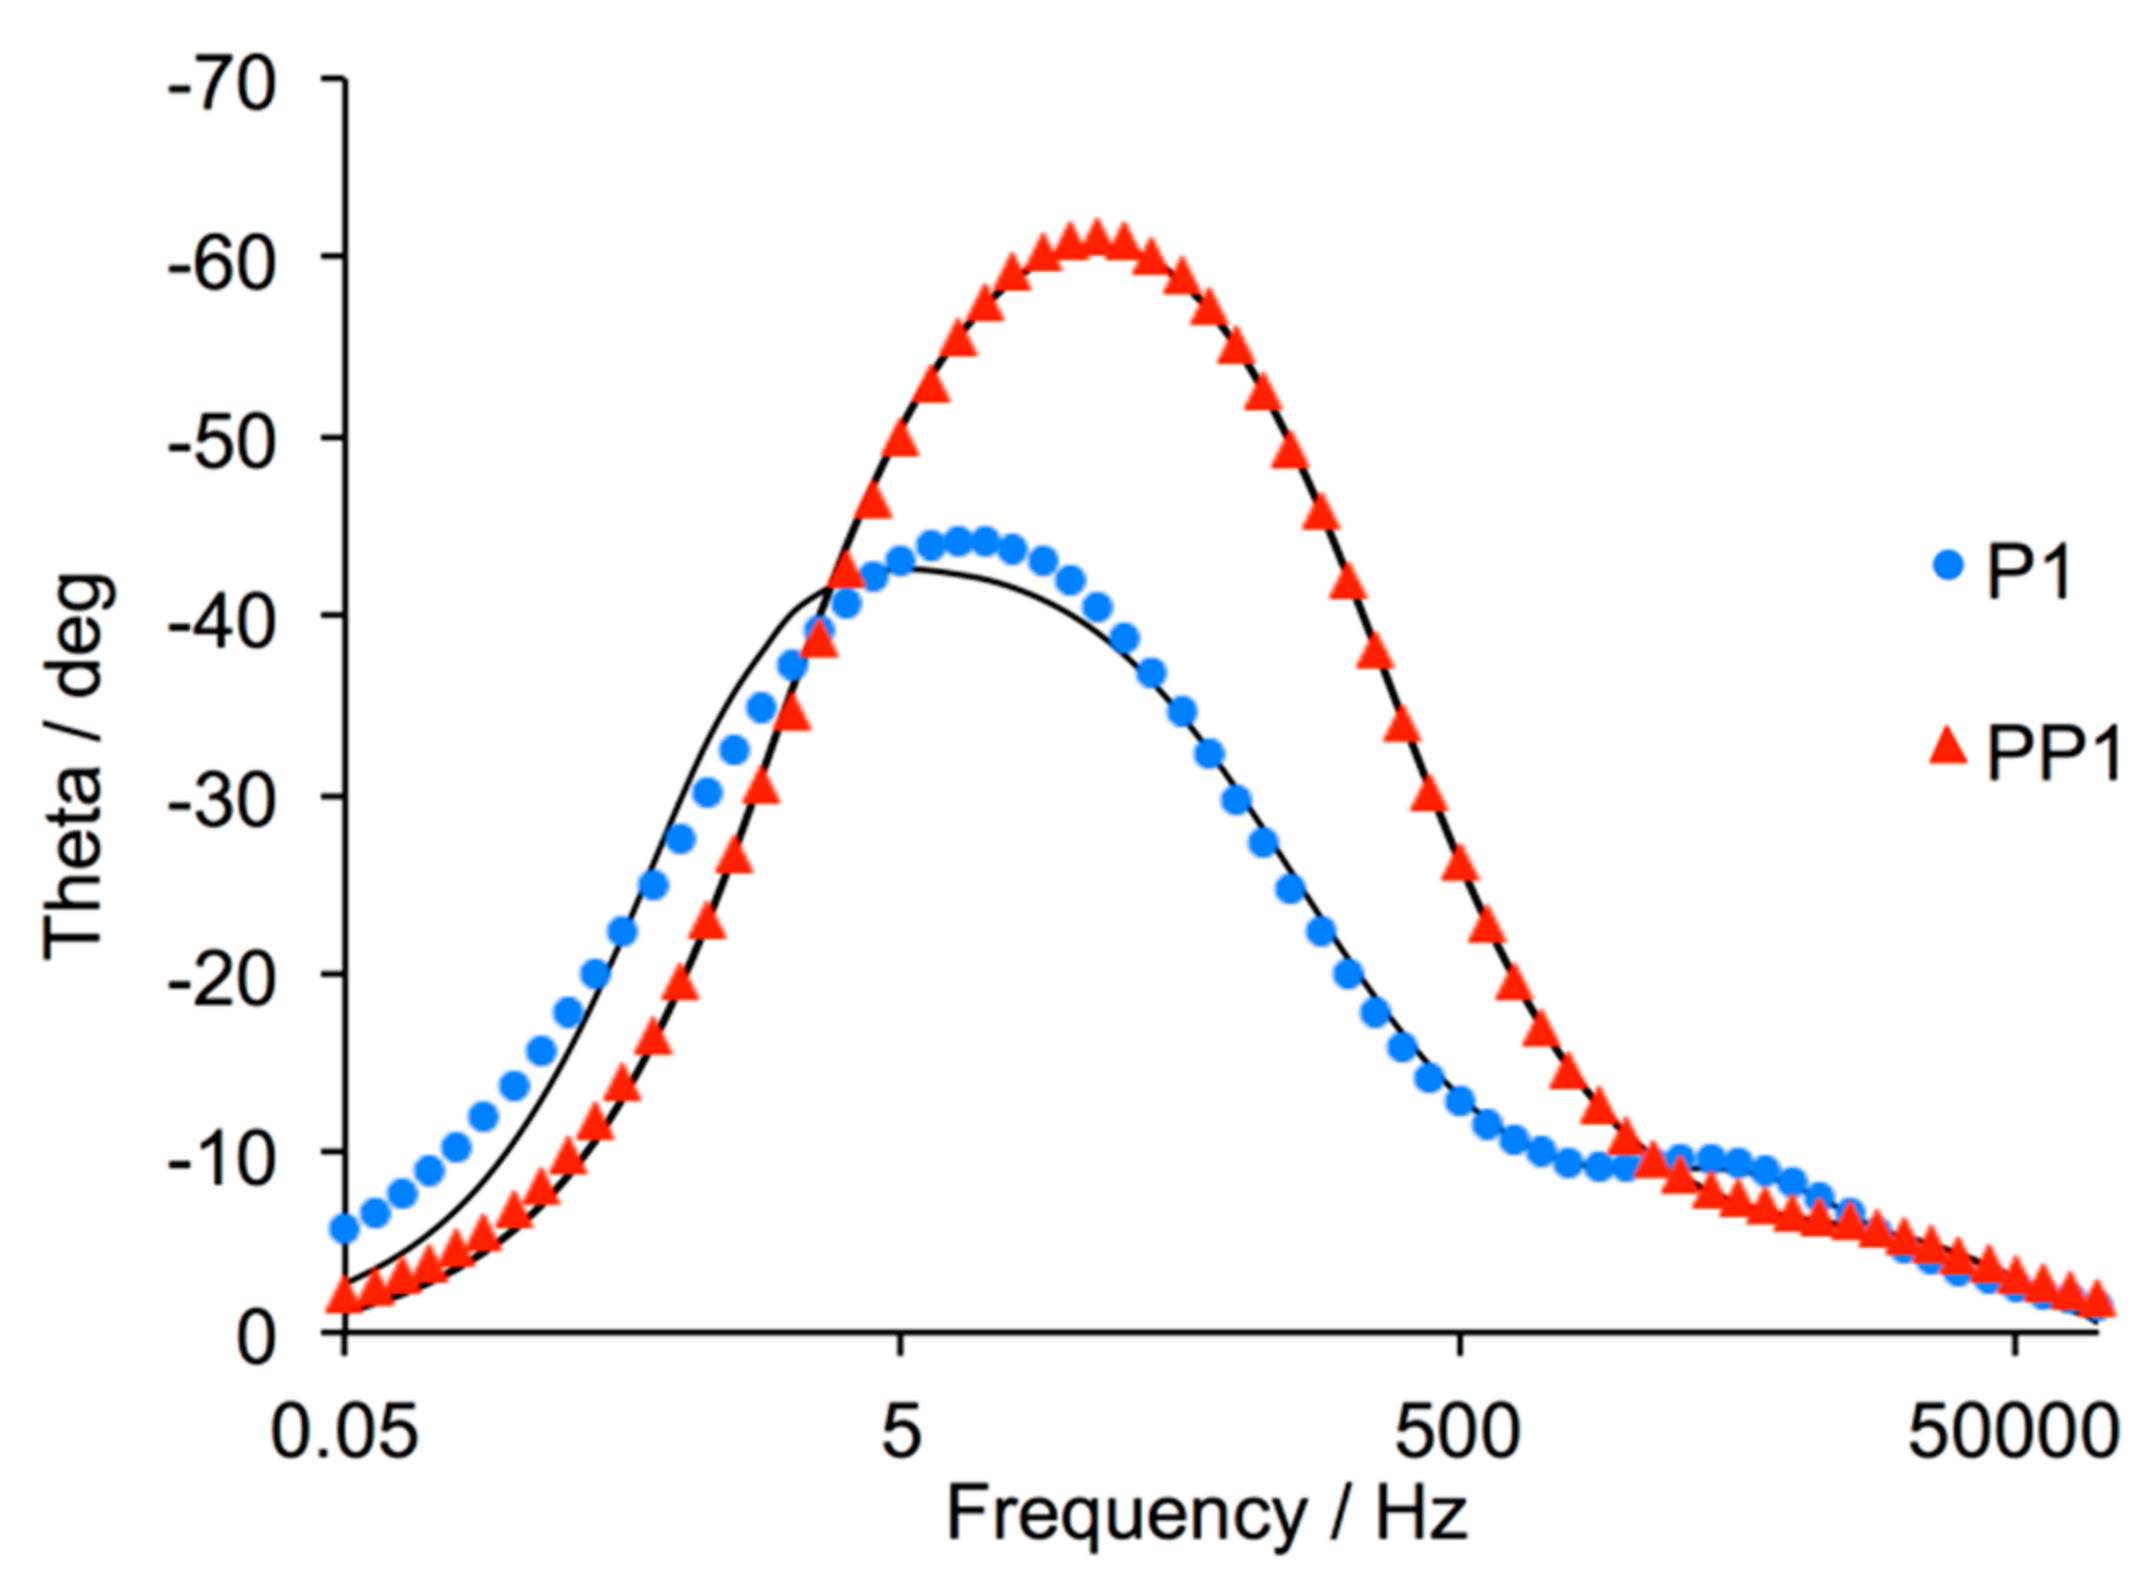
Figure 8 shows Nyquist plots for DSCs sensitized with P1 and PP1, and parameters obtained from the fitting are presented in Table 2. The first semicircle at high frequencies (seen in the expansion in Figure 8b) is attributed to the platinum counter electrode charge transfer process, while the semicircle at lower frequencies is ascribed to charge transfer processes at the NiO/electrolyte interface. Table 2 shows that the DSC sensitized with PP1 exhibits a higher recombination resistance (Rrec) while the DSC containing P1 exhibits a lower transport resistance and a much higher capacitance. The similar overall performances of the DSCs (Table 1) indicate that these factors essentially offset one another. From the Bode plot (Figure 9), it is observed that PP1 has the shorter hole lifetime since it has the higher frequency position [39] (fmax = 31.6 Hz for PP1 versus 9.9 Hz for P1). Nevertheless, in order to calculate the hole lifetime of the DSC, the capacitance must first be calculated from the fitted values of the pre-factor Q and the empirical constant α (Equation (1) and Table 2) [40]. The hole lifetime can then be calculated from Equation (2). The values obtained from these equations for the two different sensitized DSCs reveal that the hole lifetime of the DSC sensitized with PP1 is shorter than that for the device sensitized with P1 (τn = 0.096 versus 0.32 ms)
3.6. Open-Circuit Photovoltage Decay (OCVD) and Intensity-Modulated Photocurrent Spectroscopy (IMPS) Measurements
Under open-circuit voltage conditions, the band gap between the valence band and the conduction band of the semiconductor is at its lowest value, and the rates of charge-carrier injection and recombination are equal. From Equation (3), the lifetime of the charge, τn, can be extracted [41,42]. However, since the photovoltage decay is a dark measurement, the data concern only the recombination process with the electrolyte and not the recombination path with the anchored dye [41].
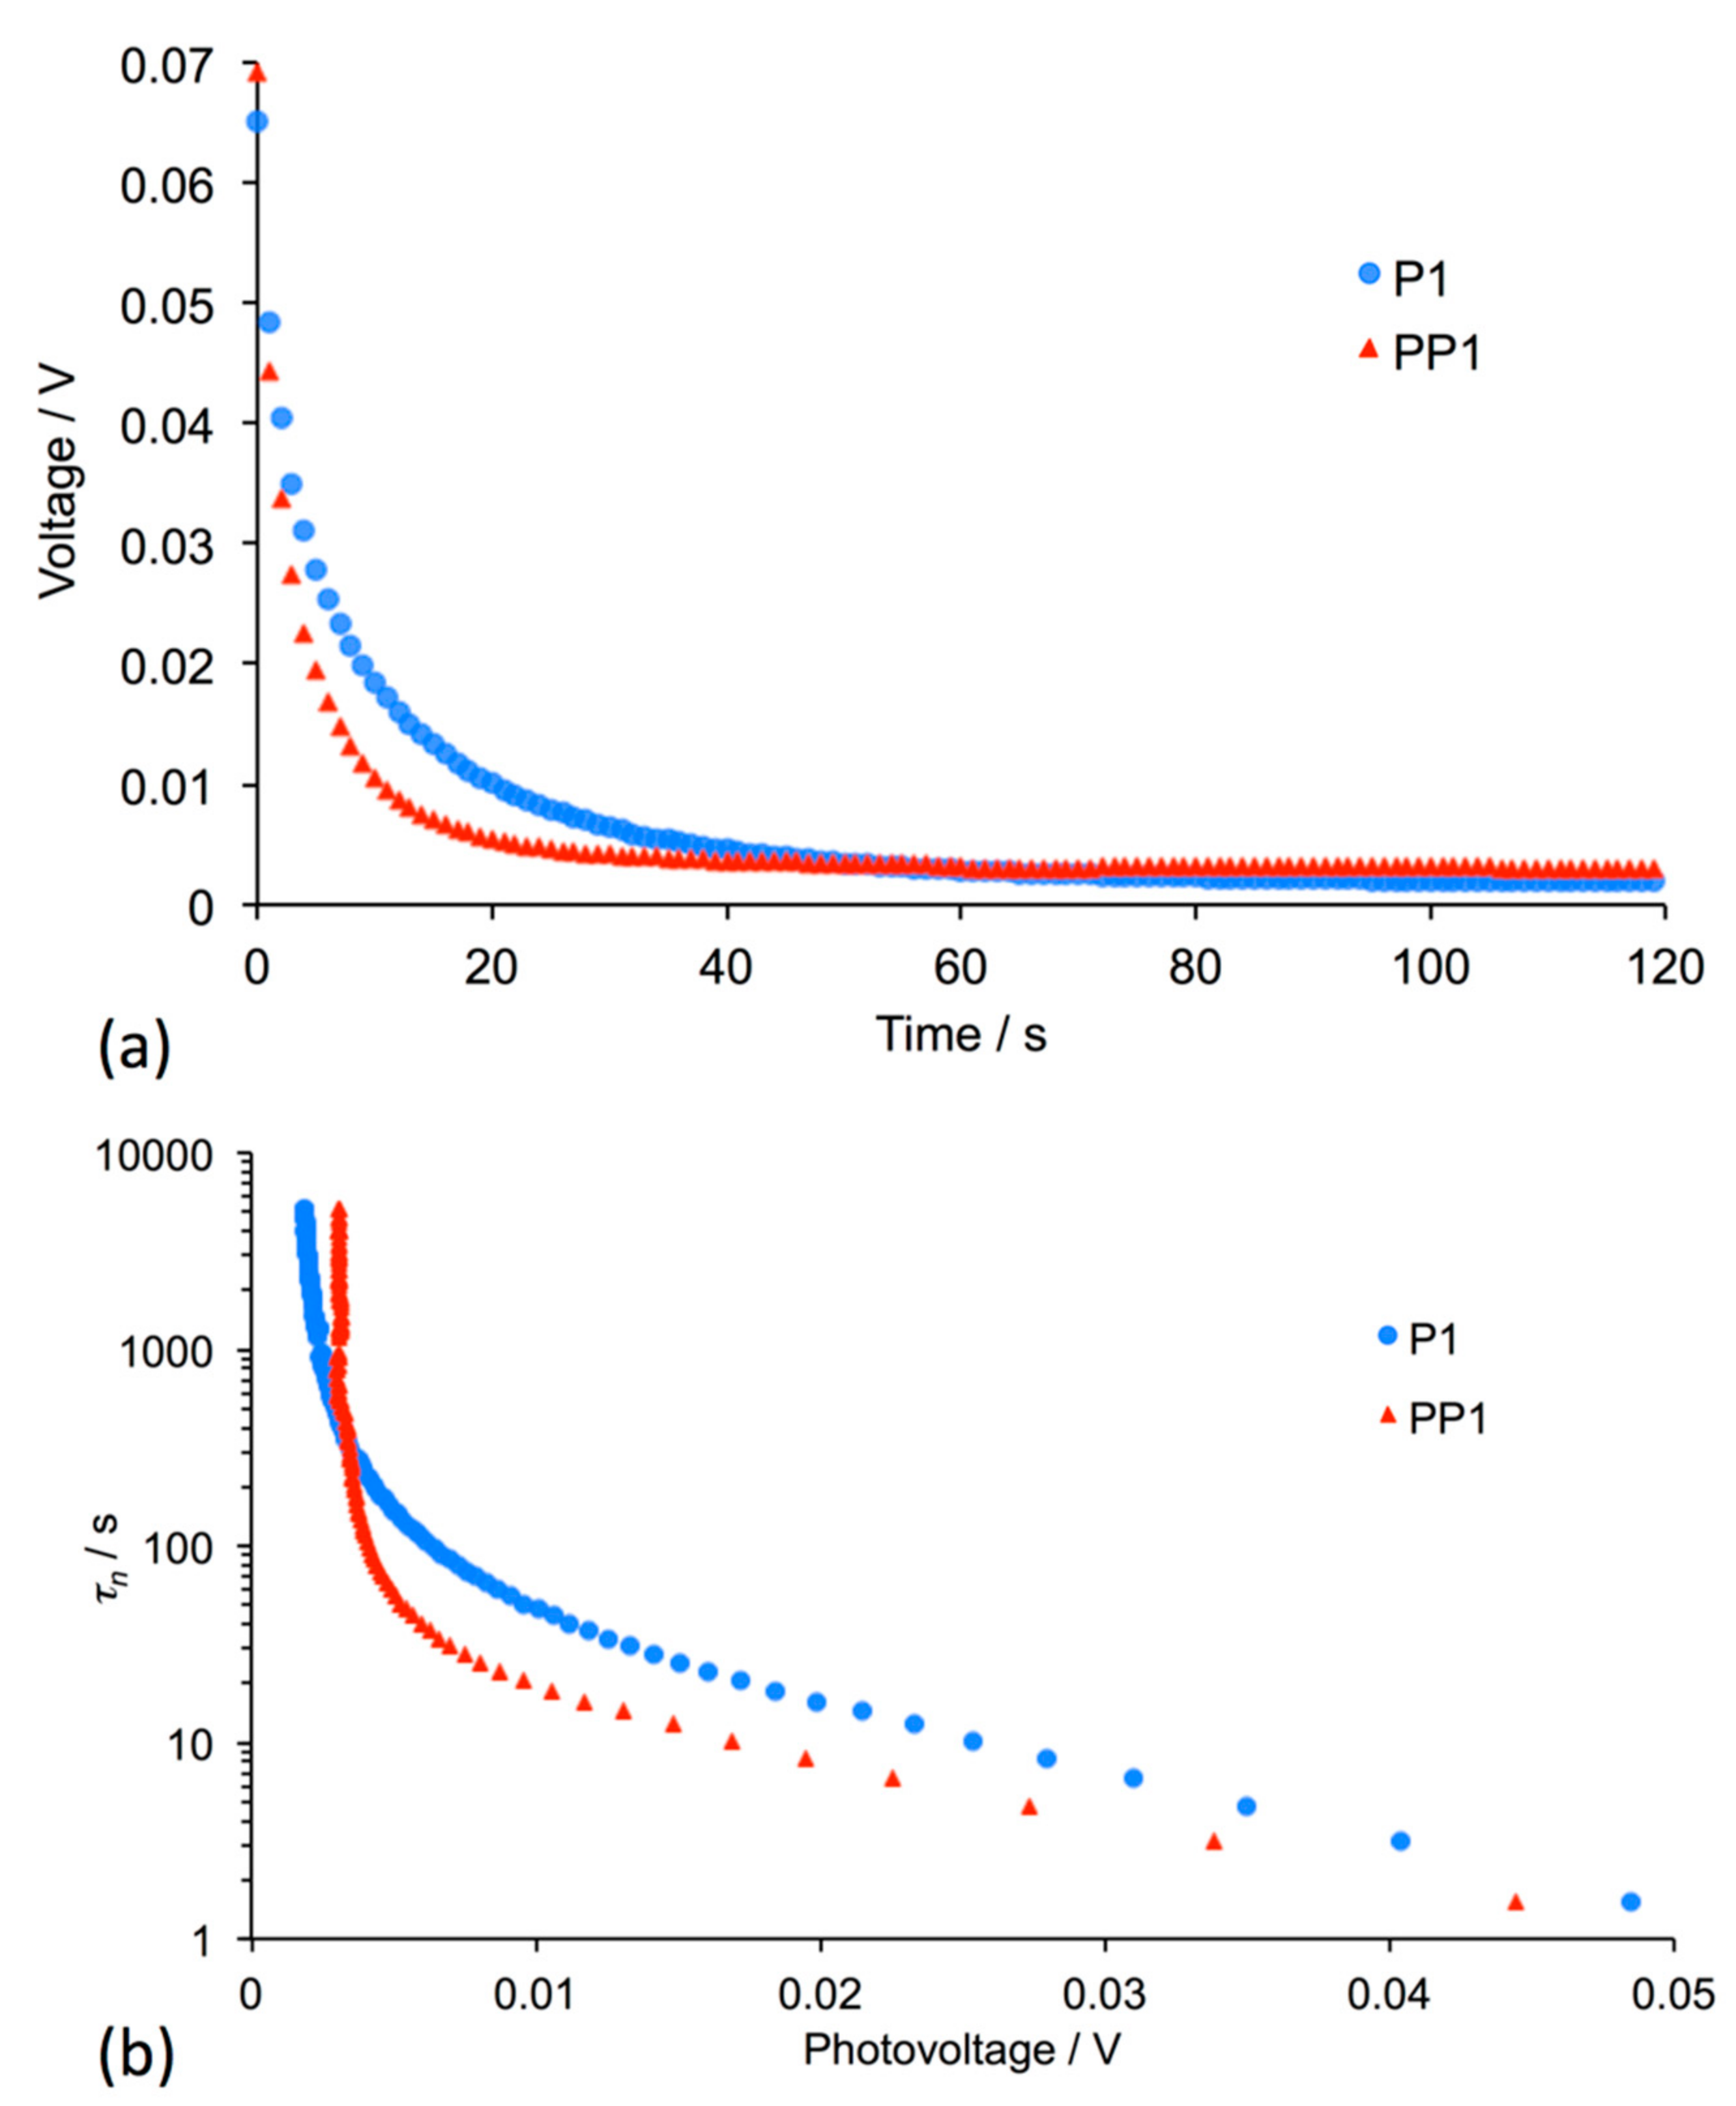
Figure 10a displays the voltage decay profiles for DSCs containing dyes P1 or PP1, and demonstrates that the decay of VOC is more rapid for PP1 than for P1. By using Equation (3), the lifetime versus voltage plot shown in Figure 10b is obtained, which shows that the lifetime of the P1-sensitized DSC remains longer with increased voltage. The DSC sensitized with PP1 exhibits a greater drop in lifetime at lower voltages, which in turn translates to a more dominant charge recombination process with the electrolyte for PP1 versus P1.
The diffusion length (Ld) of the charge in the NiO semiconductor is also important in defining the efficiency of the DSC and can be calculated from Equation (4) where τ0 is the free charge lifetime and D0 is the free charge diffusion coefficient.
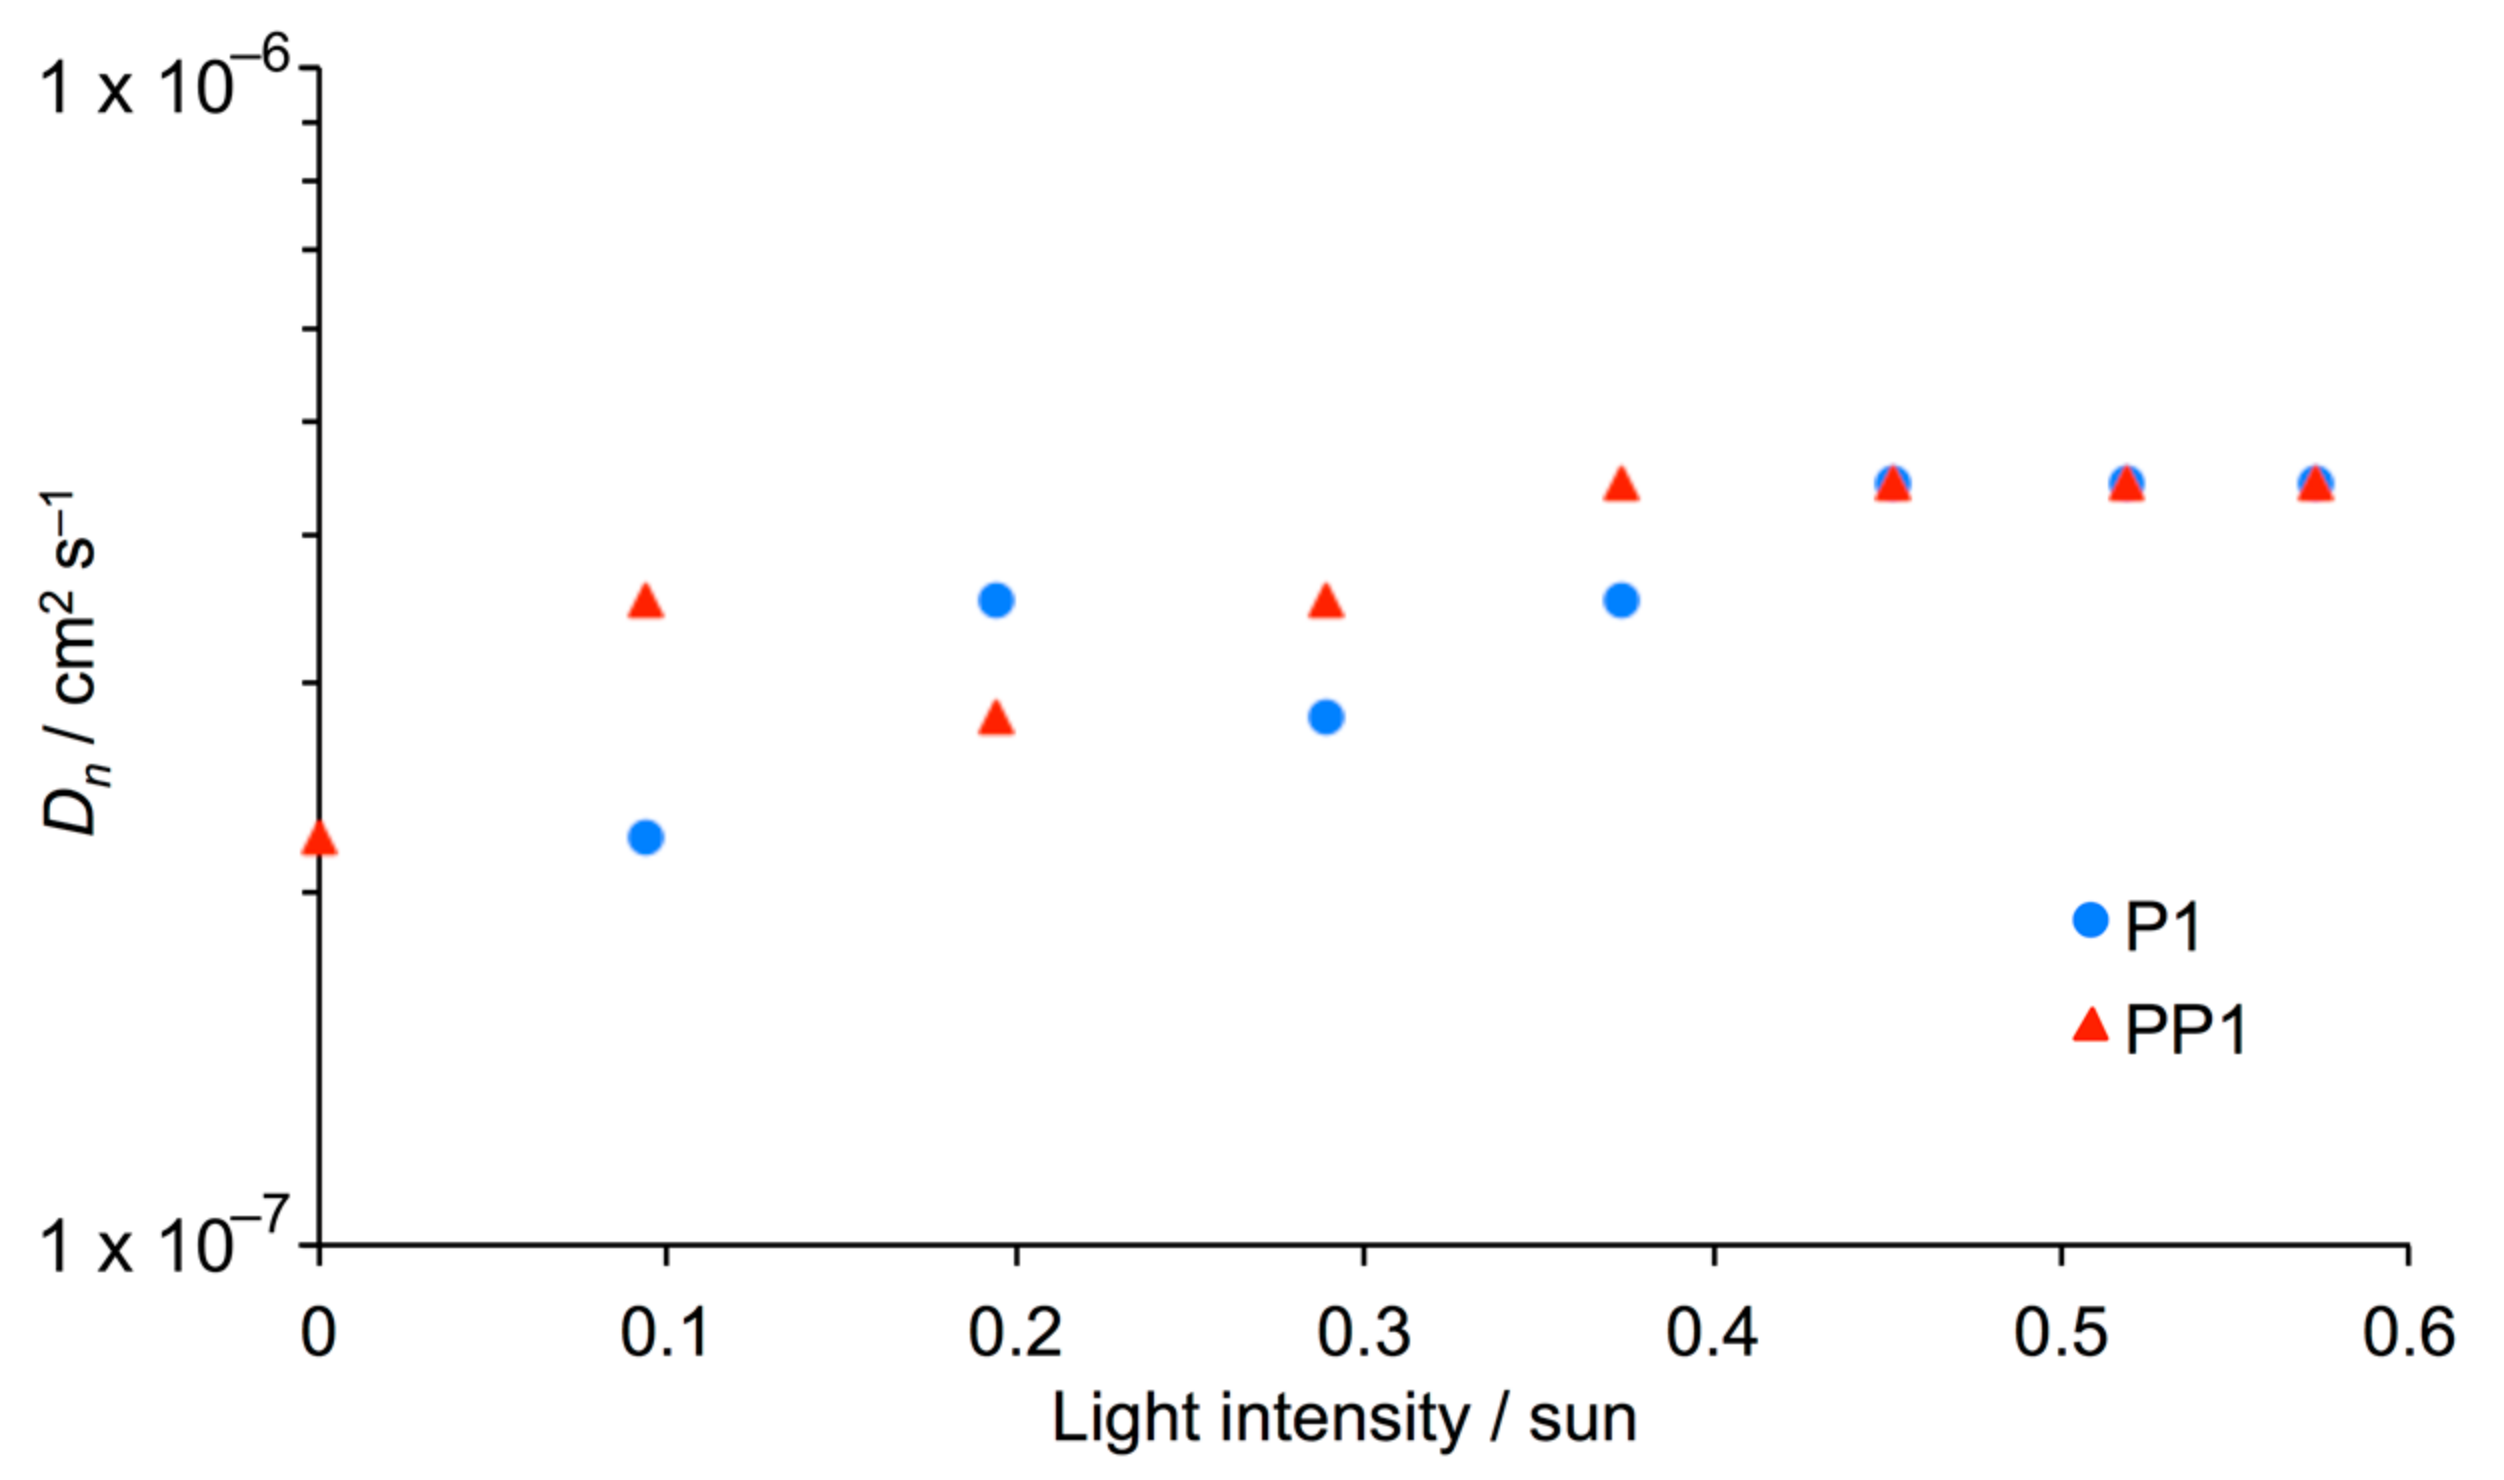
In an n-type DSC, the diffusion length should be 2–3 times larger than the thickness of the TiO2 semiconductor for efficient charge collection [43]. However, in p-type DSCs, this ratio is difficult to achieve due to the intrinsic properties of the p-type semiconductor [9]. Intensity-modulated photocurrent spectroscopy (IMPS) [44,45] at different light intensities was used to calculate the chemical diffusion coefficient (Dn) of the P1 and PP1 sensitized cells. During this measurement, the cell is potentiostatically controlled and the photocurrent is measured with no bias applied. Since the measurement is done under short-circuit conditions, the semiconductor band gap is at a maximum, and no charge is exchanged at the semiconductor/electrolyte/dye interface. As a consequence, charges migrate to the back layer of the photocathode where most reactions occur, so the charge transport time, as well as the diffusion length coefficient, can be calculated [45]. From Figure 11, it can be seen that the diffusion lengths of both the P1 and PP1-sensitized cells are similar and follow the same trend, only increasing slightly as the light intensity increases. This indicates a similar mechanism for the movement of the charge in the semiconductor for both dyes. The dependence of Dn on light intensity is not as great for p-type as in n-type DSCs [10], attributed to different mechanisms for the migration of charge carriers (hopping as opposed to a trapping-detrapping mechanism) [46,47].
4. Conclusions
We report the first example of an organic dye, PP1, for p-type DSCs bearing a phosphonic acid anchoring group. The solution absorption spectrum of PP1 is similar to its carboxylic acid analogue, P1, with the dominant absorption band at λmax = 478 nm (εmax = 62,800 dm3 mol−1 cm−1). The solid-state absorption spectrum of PP1 adsorbed on an FTO/NiO electrode exhibits a broad band with λmax = 530 nm, again similar to the spectrum for P1. p-Type DSCs sensitized with either P1 or PP1 perform comparably, confirmed using five DSCs for each dye. For PP1, values of JSC and VOC lie in the ranges 1.11–1.45 mA cm−2 and 119–143 mV, respectively, compared to the ranges 1.55–1.80 mA cm−2 and 117–130 mV for P1. This observation is in contrast to n-type organic dyes where those with carboxylic acid anchors typically outperform analogous dyes with phosphonic acids [5], although Abate et al. have demonstrated that in solid-state n-type DSCs, phosphonic acid anchors are beneficial [48]. We hope that the results from the present work encourage the use of phosphonic acid or phosphonate anchors in dyes for p-type DSCs.
Supplementary Materials
The following are available online at https://0-www-mdpi-com.brum.beds.ac.uk/2073-4352/8/10/389/s1, Figure S1: 1H NMR spectrum (500 MHz, CDCl3) of compound 1, Figure S2: 1H NMR spectrum (500 MHz, CDCl3) of compound 2. * = residual CHCl3, Figure S3: Aromatic region of the 1H NMR spectrum (500 MHz, CDCl3) of compound 3. * = residual CHCl3, Figure S4: 1H NMR spectrum (500 MHz, CDCl3) of compound 4. * = residual CHCl3, # = H2O, Figure S5: ORTEP-style plot of compound 3.
Author Contributions
Y.M.K.: Synthesis, solution NMR and absorption spectroscopies, contributions to manuscript preparation; N.M.: all DSC measurements including EQE, EIS, OCVD, IMPS, contributions to manuscript preparation; E.C.C.: group leader, project concepts and contributions to manuscript preparation; C.E.H.: group leader, project concepts and manuscript preparation.
Funding
We thank the Swiss National Science Foundation (Grant numbers CR22I2_156236 and 200020_162631) and the University of Basel for support.
Conflicts of Interest
The authors declare no conflict of interest.
References
- O’Reagan, B.; Grätzel, M. A low-cost, high-efficiency solar cell based on dye-sensitized colloidal TiO2 films. Nature 1991, 353, 737–740. [Google Scholar] [CrossRef]
- Nazeeruddin, Md.K.; Baranoff, E.; Grätzel, M. Dye-sensitized solar cells. A brief overview. Sol. Energy 2011, 85, 1172–1178. [Google Scholar] [CrossRef]
- Grätzel, M. Recent Advances in Sensitized Mesoscopic Solar Cells. Acc. Chem. Res. 2009, 42, 1788–1798. [Google Scholar] [CrossRef] [PubMed]
- Grätzel, M. Solar energy conversion by dye-sensitized photovoltaic cells. Inorg. Chem. 2005, 44, 6841–6851. [Google Scholar] [CrossRef] [PubMed]
- Zhang, L.; Cole, J.M. Anchoring groups for dye-sensitized solar cells. ACS Appl. Mater. Interfaces 2015, 7, 3427–3455. [Google Scholar] [CrossRef] [PubMed]
- Stephens, A.J.; Malzner, F.J.; Constable, E.C.; Housecroft, C.E. The influence of phosphonic acid protonation state on the efficiency of bis(diimine)copper(I) dye-sensitized solar cells. Sustain. Energy Fuels 2018, 2, 786–794. [Google Scholar] [CrossRef]
- Odobel, F.; Pellegrin, Y.; Gibson, E.A.; Hagfeldt, A.; Smeigh, A.L.; Hammarström, L. Recent advances and future directions to optimize the performance of dye-sensitized solar cells. Coord. Chem. Rev. 2012, 256, 2414–2423. [Google Scholar] [CrossRef]
- Nikolaou, V.; Charisiadis, A.; Charalambidis, G.; Coutsolelos, A.G.; Odobel, F. Recent advances and insights in dye-sensititzed NiO photocathodes for photovoltaic devices. J. Mater. Chem. A 2017, 5, 21077–21113. [Google Scholar] [CrossRef]
- Odobel, F.; Le Pleux, L.; Pellegrin, Y.; Blart, E. New photovoltaic devices based on the sensitization of p-type semiconductors: Challenges and opportunities. Acc. Chem. Res. 2010, 43, 1063–1071. [Google Scholar] [CrossRef] [PubMed]
- Huang, Z.; Natu, G.; Ji, Z.; He, M.; Yu, M.; Wu, Y. Probing the Low Fill Factor of NiO p-Type Dye-Sensitized Solar Cells. J. Phys. Chem. C 2012, 116, 26239–26246. [Google Scholar] [CrossRef]
- Borgström, M.; Blart, E.; Boschloo, G.; Mukhtar, E.; Hagfeldt, A.; Hammarström, L.; Odobel, F. Sensitized Hole Injection of Phosphorus Porphyrin into NiO: Toward New Photovoltaic Devices. J. Phys. Chem. B 2005, 109, 22928–22934. [Google Scholar] [CrossRef] [PubMed]
- Yan, W.; Chaitanya, K.; Sun, Z.-D.; Ju, X.-H. Theoretical study on p-type D-π-A snsitizers with modified π-spacers for dye-sensitized solar cells. J. Mol. Model. 2018, 24, 68. [Google Scholar] [CrossRef] [PubMed]
- Piccinin, S.; Rocca, D.; Pastore, M. Role of solvent in the energy level alignment of dye-sensitized NiO interfaces. J. Phys. Chem. C 2017, 121, 22286–22294. [Google Scholar] [CrossRef]
- Muñoz-García, A.B.; Pavone, M. Structure and energy level alignment at the dye-electrode interface in p-type DSSCs: New hints on the role of anchoring modes from ab initio calculations. Phys. Chem. Phys. Chem. 2015, 17, 12238–12246. [Google Scholar] [CrossRef] [PubMed]
- Wykes, M.; Odobel, F.; Adamo, C.; Ciofini, I.; Labat, F. Anchoring groups for dyes in p-DSSC application: Insights from DFT. J. Mol. Model. 2016, 22, 289. [Google Scholar] [CrossRef] [PubMed]
- Zhang, L.; Favereau, L.; Farre, Y.; Maufroy, A.; Pellegrin, Y.; Blart, E.; Hissler, M.; Jacquemin, D.; Odobel, F.; Hammarström, L. Molecular-structure control of electron transfer dynamics of push-pull porphyrins as sensitizers for NiO based dye sensitized solar cells. RSC Adv. 2016, 6, 77184–77194. [Google Scholar] [CrossRef]
- Qin, P.; Zhu, H.; Edvinsson, T.; Boschloo, G.; Hagfeldt, A.; Sun, L. Design of an organic chromophore for p-type dye-sensititzed solar cells. J. Am. Chem. Soc. 2008, 130, 8570–8571. [Google Scholar] [CrossRef] [PubMed]
- Wood, C.J.; Summers, G.H.; Clark, C.A.; Kaeffer, N.; Braeutigam, M.; Carbone, L.R.; D’Amario, L.; Fan, K.; Farre, Y.; Narbey, S.; et al. A comprehensive comparison of dye-sensitized NiO photocathodes for solar energy conversion. Phys. Chem. Chem. Phys. 2016, 18, 10727–10738. [Google Scholar] [CrossRef] [PubMed] [Green Version]
- Click, K.A.; Beauchamp, D.R.; Garrett, B.R.; Huang, Z.; Hadad, C.M.; Wu, Y. A double-acceptor as a superior organic dye design for p-type DSSCs: High photocurrents and the observed light soaking effect. Phys. Chem. Chem. Phys. 2014, 16, 26103–26111. [Google Scholar] [CrossRef] [PubMed]
- Pellegrin, Y.; Le Pleux, L.; Blart, E.; Renaud, A.; Chavillon, B.; Szuwarski, N.; Boujita, M.; Cario, L.; Jobic, S.; Jacquemin, D.; et al. Ruthenium polypyridine complexes as sensitizers in NiO based p-type dye-sensitized solar cells: Effects of the anchoring groups. J. Photochem. Photobiol. A 2011, 219, 235–242. [Google Scholar] [CrossRef]
- Marinakis, N.; Wobill, C.; Constable, E.C.; Housecroft, C.E. Refining the anchor: Optimizing the performance of cyclometallated ruthenium(II) dyes in p-type dye sensitized solar cells. Polyhedron 2018, 140, 122–128. [Google Scholar] [CrossRef]
- Brunner, F.; Marinakis, N.; Wobill, C.; Willgert, M.; Ertl, C.D.; Kosmalski, T.; Neuburger, M.; Bozic-Weber, B.; Glatzel, T.; Constable, E.C.; et al. Modular synthesis of simple cycloruthenated complexes with state-of-the-art performance in p-type DSCs. J. Mater. Chem. C 2016, 4, 9823–9833. [Google Scholar] [CrossRef] [Green Version]
- Marinakis, N.; Willgert, M.; Constable, E.C.; Housecroft, C.E. Optimization of performance and long-term stability of p-type dye-sensitized solar cells with a cycloruthenated dye through electrolyte solvent tuning. Sustain. Energy Fuels 2017, 1, 626–635. [Google Scholar] [CrossRef] [Green Version]
- Bruker X-ray Diffraction Laboratory. M86-E01078 APEX2 User Manual, 2nd ed.; Bruker AXS Inc.: Madison, WI, USA, 2006. [Google Scholar]
- Palatinus, L.; Chapuis, G. SUPERFLIP. A computer program for the solution of crystal structures by charge flipping in arbitrary dimensions. J. Appl. Cryst. 2007, 40, 786–790. [Google Scholar] [CrossRef]
- Betteridge, P.W.; Carruthers, J.R.; Cooper, R.I.; Prout, K.; Watkin, D.J. CRYSTALS Version 12: Software for Guided Crystal Structure Analysis. J. Appl. Cryst. 2003, 36, 1487–1487. [Google Scholar] [CrossRef]
- Macrae, C.F.; Edgington, P.R.; McCabe, P.; Pidcock, E.; Shields, G.P.; Taylor, R.; Towler, M.; van de Streek, J. Mercury: Visualization and analysis of crystal structures. J. Appl. Cryst. 2006, 39, 453–457. [Google Scholar] [CrossRef]
- Macrae, C.F.; Bruno, I.J.; Chisholm, J.A.; Edgington, P.R.; McCabe, P.; Pidcock, E.; Rodriguez-Monge, L.; Taylor, R.; van de Streek, J.; Wood, P.A. Mercury CSD 2.0—New Features for the Visualization and Investigation of Crystal Structures. J. Appl. Cryst. 2008, 41, 466–470. [Google Scholar] [CrossRef]
- Hod, I.; Tachan, Z.; Shalom, M.; Zaban, A. Characterization and control of the electronic properties of a NiO based dye sensitized photocathode. Phys. Chem. Chem. Phys. 2013, 15, 6339–6343. [Google Scholar] [CrossRef] [PubMed]
- Zhang, X.L.; Huang, F.; Nattestad, A.; Wang, K.; Fu, D.; Mishra, A.; Bäuerle, P.; Bach, U.; Cheng, Y.-B. Enhanced open-circuit voltage of p-type DSC with highly crystalline NiO nanoparticles. Chem. Commun. 2011, 47, 4808–4810. [Google Scholar] [CrossRef] [PubMed]
- Perera, I.R.; Daeneke, T.; Makuta, S.; Yu, Z.; Tachibana, Y.; Mishra, A.; Bäuerle, P.; Ohlin, C.A.; Bach, U.; Spiccia, L. Application of the tris(acetlyacetonato)iron(III)/(II) redox couple in p-type dye-sensitized solar cells. Angew. Chem. Int. Ed. 2015, 54, 3758–3762. [Google Scholar] [CrossRef] [PubMed]
- Farré, Y.; Raissi, M.; Fihey, A.; Pellegrin, Y.; Blart, E.; Jacquemin, D.; Odobel, F. A blue diketopyrrolopyrrole sensitizer with high efficiency in nickel-oxide-based dye-sensitized solar cells. ChemSusChem 2017, 10, 2618–2625. [Google Scholar] [CrossRef] [PubMed]
- Li, L.; Gibson, E.A.; Qin, P.; Boschloo, G.; Gorlov, M.; Hagfeldt, A.; Sun, L. Double-layered NiO photocathodes for p-type DSSCs with record IPCE. Adv. Mater. 2010, 22, 1759–1762. [Google Scholar] [CrossRef] [PubMed]
- Bisquert, J. Theory of the impedance of charge transfer via surface states in dye-sensitized solar cells. J. Electroanal. Chem. 2010, 646, 43–51. [Google Scholar] [CrossRef]
- Fabregat-Santiago, F.; Garcia-Belmonte, G.; Mora-Seró, I.; Bisquert, J. Characterization of nanostructured hybrid and organic solar cells by impedance spectroscopy. Phys. Chem. Chem. Phys. 2011, 13, 9083–9118. [Google Scholar] [CrossRef] [PubMed]
- Fabregat-Santiago, F.; Bisquert, J.; Palomares, E.; Otero, L.; Kuang, D.; Zakeeruddin, S.M.; Grätzel, M. Correlation between photovoltaic performance and impedance spectroscopy of dye-sensiitzed solar cells based on ionic liquids. J. Phys. Chem. C 2007, 111, 6550–6560. [Google Scholar] [CrossRef]
- Bisquert, J.; Garcia-Belmonte, G.; Fabregat-Santiago, F.; Compte, A. Anomalous transport effects in the impedance of porous film electrodes. Electrochem. Commun. 1999, 1, 429–435. [Google Scholar] [CrossRef]
- Córdoba-Torres, P. Relationship between constant-phase element (CPE) parameters and physical properties of films with distributed resistivity. Electrochim. Acta 2017, 225, 592–604. [Google Scholar] [CrossRef]
- Ho, P.; Bao, L.Q.; Ahn, K.S.; Cheruku, R.; Kim, J.H. P-Type dye-sensitized solar cells: Enhanced performance with a NiO compact blocking layer. Synth. Met. 2016, 217, 314–321. [Google Scholar] [CrossRef]
- Shoar Abouzari, M.R.; Berkemeier, F.; Schmitz, G.; Wilmer, D. On the physical interpretation of constant phase elements. Solid State Ionics 2009, 180, 922–927. [Google Scholar] [CrossRef]
- Bisquert, J.; Zaban, A.; Greenshtein, M.; Mora-Seró, I. Determination of rate constants for charge transfer and the distribution of semiconductor and electrolyte electronic energy levels in dye-sensitized solar cells by open-circuit photovoltage decay method. J. Am. Chem. Soc. 2004, 126, 13550–13559. [Google Scholar] [CrossRef] [PubMed]
- Zaban, A.; Greenshtein, M.; Bisquert, J. Determination of the electron lifetime in nanocrystalline dye solar cells by open-circuit voltage decay measurements. ChemPhysChem 2003, 4, 859–864. [Google Scholar] [CrossRef] [PubMed]
- Dunn, H.K.; Westin, P.-O.; Staff, D.R.; Peter, L.M.; Walker, A.B.; Boschloo, G.; Hagfeldt, A. Determination of the electron diffusion length in dye-sensitized solar cells by substrate contact patterning. J. Phys. Chem. C 2011, 115, 13932–13937. [Google Scholar] [CrossRef] [Green Version]
- Schlichthörl, G.; Huang, S.Y.; Sprague, J.; Frank, A.J. Band edge movement and recombination kinetics in dye-sensitized nanocrystalline TiO2 solar cells: A study by intensity modulated photovoltage spectroscopy. J. Phys. Chem. B 1997, 101, 8141–8155. [Google Scholar] [CrossRef]
- Dloczik, L.; Ileperuma, O.; Lauermann, I.; Peter, L.M.; Ponomarev, E.A.; Redmond, G.; Shaw, N.J.; Uhlendorf, I. Dynamic response of dye-sensitized nanocrystalline solar cells: Characterization by intensity-modulated photocurrent spectroscopy. J. Phys. Chem. B 1997, 101, 10281–10289. [Google Scholar] [CrossRef]
- Zhu, H.; Hagfeldt, A.; Boschloo, G. Photoelectrochemistry of mesoporous NiO electrodes in iodide/triiodide electrolytes. J. Phys. Chem. C 2007, 111, 17455–17458. [Google Scholar] [CrossRef]
- Peter, L. Transport, trapping and interfacial transfer of electrons in dye-sensitized nanocrystalline solar cells. J. Electroanal. Chem. 2007, 599, 233–240. [Google Scholar] [CrossRef]
- Abate, A.; Pérez-Tejadam, R.; Wojciechowski, K.; Foster, J.M.; Sadhanala, A.; Steiner, U.; Snaith, H.J.; Franco, S.; Orduna, J. Phosphonic anchoring groups in organic dyes for solid-state solar cells. Phys. Chem. Chem. Phys. 2015, 17, 18780–18789. [Google Scholar] [CrossRef] [PubMed] [Green Version]
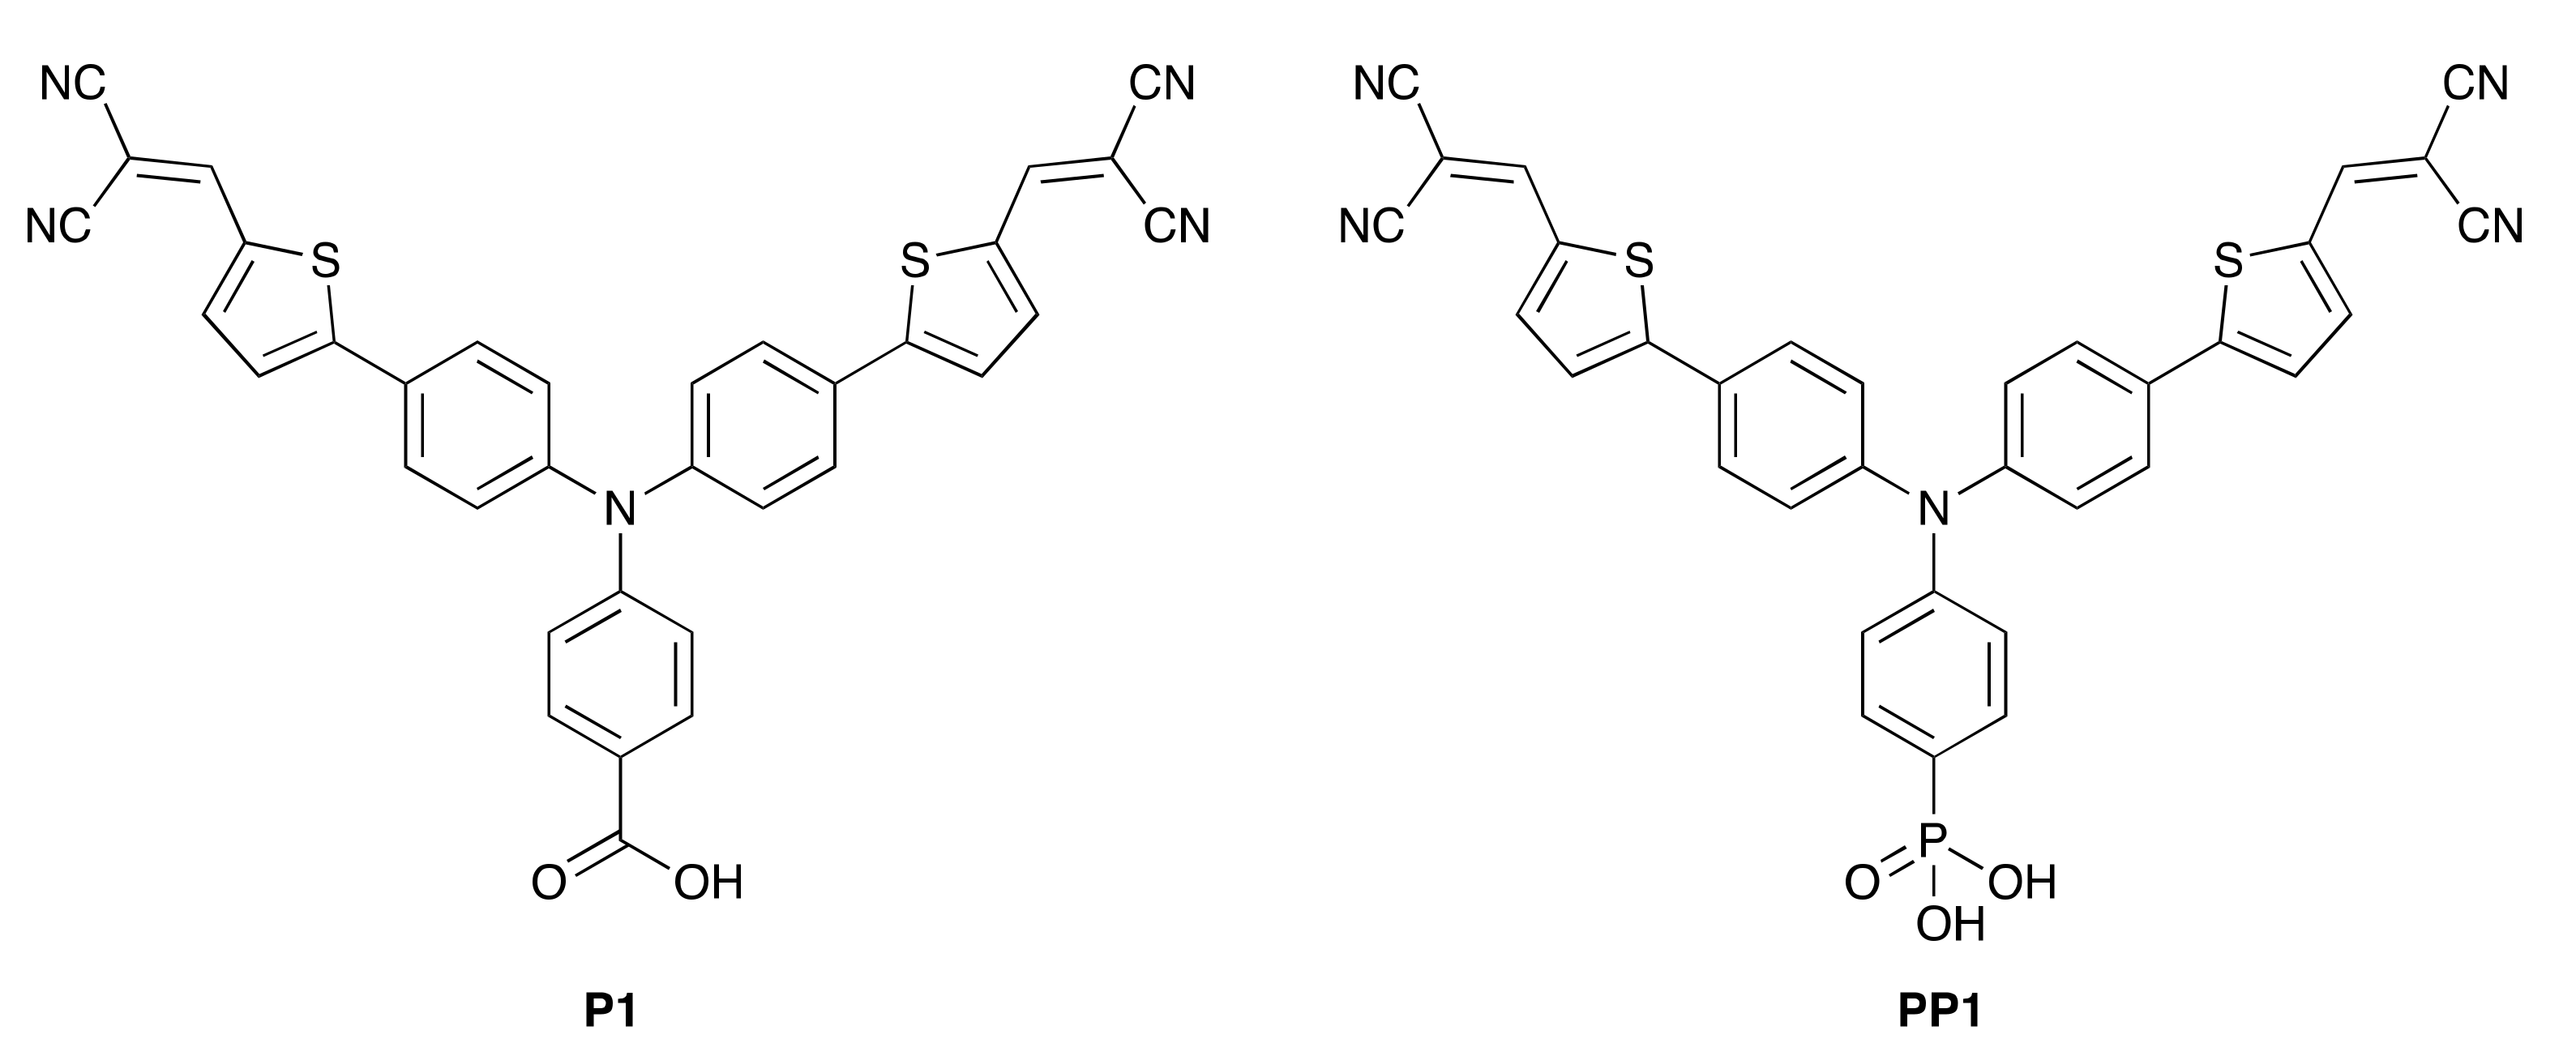
Scheme 1.
Structures of the P1 and PP1 dyes.

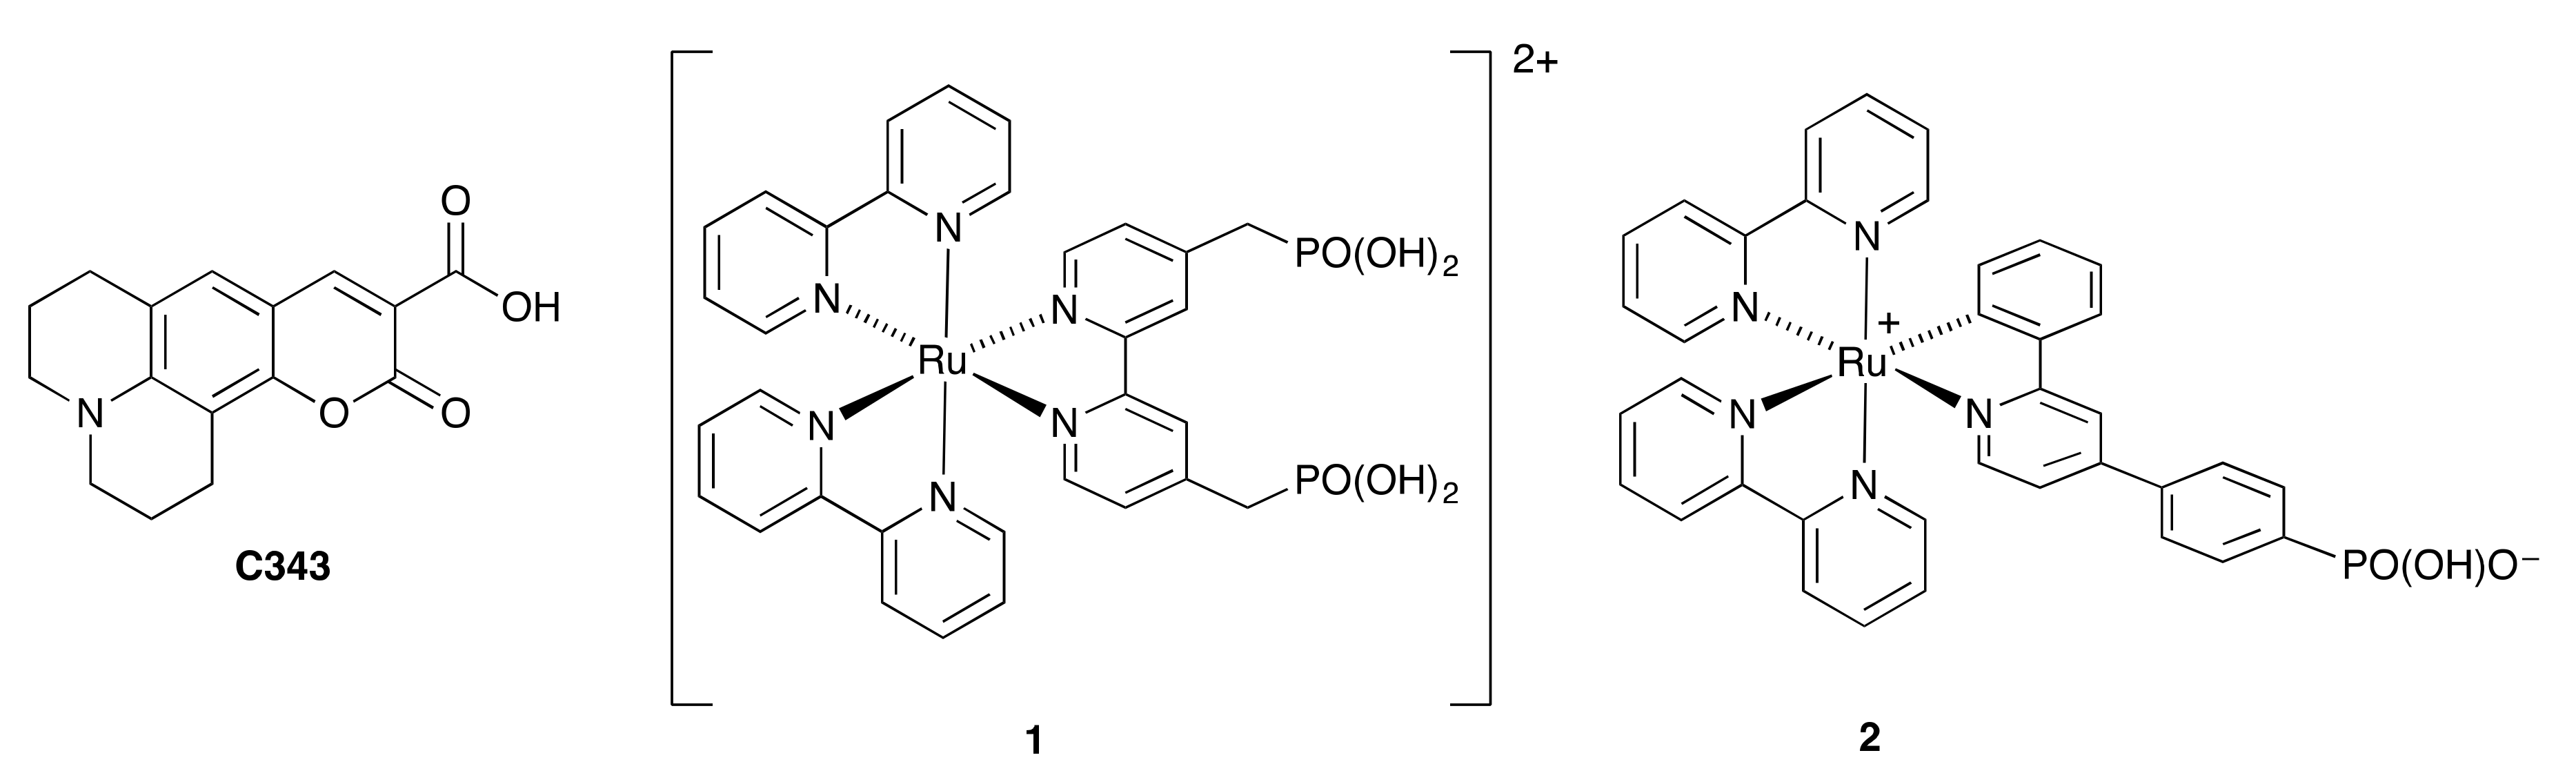
Scheme 2.
The structures of coumarin C343 and ruthenium dyes 1 and 2, used for p-type materials.

Scheme 3.
Synthysis of PP1. Conditions: (i) HPO(OEt)2, Cs2CO3, [Pd(PPh3)4], dry THF (120 °C, 20 min microwave reactor); (ii) NBS, THF, 60 °C; (iii) 5-(4,4,5,5-tetramethyl-1,3,2-dioxaborolan-2-yl)thiophene-2-carbaldehyde, Cs2CO3, [Pd(PPh3)4] in dry toluene (120 °C, 4 h, microwave conditions); (iv) malononitrile, Et3N in dry MeCN; (v) Me3SiBr, CH2Cl2, room temperature, 12 h, addition of H2O. Ring and atom labelling are for NMR spectroscopic assignments.

Figure 1.
The 1H NMR spectrum (500 MHz, DMSO-d6) of PP1.

Figure 2.
The solution (MeCN, 1.18 × 10⁻⁵ mol dm−3) absorption spectrum of PP1.

Figure 3.
Single crystal structure of compound 3; an ORTEP-style plot in Figure S5. The thiophene unit containing S20 and C201 is the major occupancy site of the disordered unit (see text). Selected bond parameters: P1–O35 = 1.586(4), P1–O38 = 1.451(4), P1–O39 = 1.557(5), O20–C19 = 1.208(6), C201–O1 = 1.300(13) Å; O35–P1–O38 = 114.5(3), O35–P1–O39 = 98.7(2), O38–P1–O39 = 119.1(3), O35–P1–C1 = 107.6(2), O38–P1–C1 = 113.8(2), O39–P1–C1 = 101.2(2), C17–C19–O20 = 125.5(4), O1–C201–C28 = 119.9(8)°. For the minor occupancy aldehyde: C200–O3 = 1.238(5) Å.

Figure 4.
Fast ion bombardment (FIB) image of an NiO electrode. A platinum layer was sputtered onto the top surface as a protective layer, and a gallium beam (30 kV) was used to cut into the NiO. The depths of the NiO layer at two points (2.55 and 1.30 μm) are marked in red.
Figure 4.
Fast ion bombardment (FIB) image of an NiO electrode. A platinum layer was sputtered onto the top surface as a protective layer, and a gallium beam (30 kV) was used to cut into the NiO. The depths of the NiO layer at two points (2.55 and 1.30 μm) are marked in red.

Figure 5.
Solid-state absorption spectrum of FTO/NiO electrode with adsorbed dye PP1.

Figure 6.
J–V curves for dye-sensitized solar cells (DSCs) containing dyes P1 and PP1. Five replicate cells were made for each dye. Data are for the day that the cells were sealed and correspond to the values in Table 1.
Figure 6.
J–V curves for dye-sensitized solar cells (DSCs) containing dyes P1 and PP1. Five replicate cells were made for each dye. Data are for the day that the cells were sealed and correspond to the values in Table 1.

Figure 7.
External quantum efficiency (EQE) spectra for DSCs with dyes P1 and PP1 (for each, cell 5 in Table 1).
Figure 7.
External quantum efficiency (EQE) spectra for DSCs with dyes P1 and PP1 (for each, cell 5 in Table 1).

Scheme 4.
Equivalent circuit used to fit the electrochemical impedance spectroscopy (EIS) data.

Figure 8.
(a) Nyquist plots for DSCs containing P1 or PP1. (b) Expansion of the high frequency region of the Nyquist plots. Fitted curves are shown as solid black lines.
Figure 8.
(a) Nyquist plots for DSCs containing P1 or PP1. (b) Expansion of the high frequency region of the Nyquist plots. Fitted curves are shown as solid black lines.

Figure 9.
Bode plots for DSCs containing P1 or PP1. Fitted curves are shown as solid black lines.

Figure 10.
(a) Open-circuit voltage decay versus time. (b) Electron life time versus open circuit voltage at a light intensity of 22 mW cm−2.
Figure 10.
(a) Open-circuit voltage decay versus time. (b) Electron life time versus open circuit voltage at a light intensity of 22 mW cm−2.

Figure 11.
Chemical diffusion coefficients for DSCs with P1 or PP1 at different light intensities.


Table 1.
DSC performance parameters for dyes P1 and PP1 on NiO in p-type DSCs. Data are for the day that the cells were sealed and five DSCs were made for each dye. a
Table 1.
DSC performance parameters for dyes P1 and PP1 on NiO in p-type DSCs. Data are for the day that the cells were sealed and five DSCs were made for each dye. a
| Dye | DSC Number | JSC/mA cm−2 | VOC/mV | ff/% | η/% |
|---|---|---|---|---|---|
| P1 | 1 | 1.55 | 130 | 34 | 0.068 |
| P1 | 2 | 1.80 | 128 | 33 | 0.076 |
| P1 | 3 | 1.74 | 130 | 35 | 0.079 |
| P1 | 4 | 1.64 | 125 | 34 | 0.071 |
| P1 | 5 | 1.76 | 117 | 32 | 0.065 |
| PP1 | 1 | 1.45 | 127 | 35 | 0.065 |
| PP1 | 2 | 1.45 | 132 | 36 | 0.069 |
| PP1 | 3 | 1.32 | 119 | 34 | 0.054 |
| PP1 | 4 | 1.43 | 122 | 34 | 0.059 |
| PP1 | 5 | 1.11 | 143 | 34 | 0.054 |
aJSC = short-circuit current density; VOC = open-circuit voltage; ff = fill factor; η = photoconversion efficiency.
Table 2.
EIS data obtained from measurements at a light intensity of 22 mW cm−2 of p-type DSCs containing FTO/NiO working electrodes, P1 or PP1 dyes, and an electrolyte comprising I−/I3− in MeCN.
Table 2.
EIS data obtained from measurements at a light intensity of 22 mW cm−2 of p-type DSCs containing FTO/NiO working electrodes, P1 or PP1 dyes, and an electrolyte comprising I−/I3− in MeCN.
| Rs/Ω | RPt/Ω | CPt/µF | Rtr/Ω | Rrec/Ω | Cμ/μF | αa | |
|---|---|---|---|---|---|---|---|
| P1 | 17.7 | 4.8 | 7.9 | 1.9 | 507.1 | 485.6 | 0.70 |
| PP1 | 11.1 | 2.0 | 20 | 8.3 | 729.9 | 96.5 | 0.88 |
aα is an empirical constant [21].
© 2018 by the authors. Licensee MDPI, Basel, Switzerland. This article is an open access article distributed under the terms and conditions of the Creative Commons Attribution (CC BY) license (http://creativecommons.org/licenses/by/4.0/).
Share and Cite
MDPI and ACS Style
Klein, Y.M.; Marinakis, N.; Constable, E.C.; Housecroft, C.E. A Phosphonic Acid Anchoring Analogue of the Sensitizer P1 for p-Type Dye-Sensitized Solar Cells. Crystals 2018, 8, 389. https://0-doi-org.brum.beds.ac.uk/10.3390/cryst8100389
AMA Style
Klein YM, Marinakis N, Constable EC, Housecroft CE. A Phosphonic Acid Anchoring Analogue of the Sensitizer P1 for p-Type Dye-Sensitized Solar Cells. Crystals. 2018; 8(10):389. https://0-doi-org.brum.beds.ac.uk/10.3390/cryst8100389
Chicago/Turabian StyleKlein, Y. Maximilian, Nathalie Marinakis, Edwin C. Constable, and Catherine E. Housecroft. 2018. "A Phosphonic Acid Anchoring Analogue of the Sensitizer P1 for p-Type Dye-Sensitized Solar Cells" Crystals 8, no. 10: 389. https://0-doi-org.brum.beds.ac.uk/10.3390/cryst8100389
Note that from the first issue of 2016, this journal uses article numbers instead of page numbers. See further details here.