Effect of Pressure Treatment on the Specific Surface Area in Kaolin Group Minerals


1
Department of Earth System Sciences, Yonsei University, Seoul 03722, Korea
2
Center for High Pressure Science & Technology Advanced Research, Shanghai 201203, China
*
Author to whom correspondence should be addressed.
Crystals 2019, 9(10), 528; https://0-doi-org.brum.beds.ac.uk/10.3390/cryst9100528
Submission received: 29 August 2019
/
Revised: 29 September 2019
/
Accepted: 8 October 2019
/
Published: 14 October 2019
(This article belongs to the Special Issue High Pressure Synthesis in Crystalline Materials)
Abstract
:Pressure can tailor the properties of a material by changing its atomistic arrangements and/or crystal morphology. We have investigated the changes in the adsorption properties of kaolin group minerals as a function of pressure treatment in the gigapascal range. External pressures have been applied using a large volume press (LVP) to kaolinite (Al2Si2O5(OH)4) and halloysite (H4Al2O9Si2·2H2O), which represent natural 2D layered and 1D nanowire structures, respectively. Powdered samples have been compressed up to 3 GPa in 1 GPa steps at room temperature and recovered by up to ca. 0.35 g from each pressure step. Brunauer–Emmett–Teller (BET) measurements were conducted using N2 gas to measure the specific surface area, pore size distribution, and pore volume of the pressure-treated samples. As the treatment pressure increased, kaolinite showed an increase in the adsorption behavior from nonpores to mesopores, whereas halloysite responded in an opposite manner to show a decrease in its adsorption capability. We discuss the contrasting effects of pressure-treatment on the two morphologically distinct kaolin group minerals based on field-emission scanning electron microscope (FE-SEM) images measured on each recovered material. We observed that the layers in kaolinite separate into smaller units upon increasing pressure treatment, whereas the tubes in halloysite become flattened, which led to the contrasting changes in surface area. Further study is in progress to compare this effect to when water is used as the pressure-transmitting medium.
1. Introduction
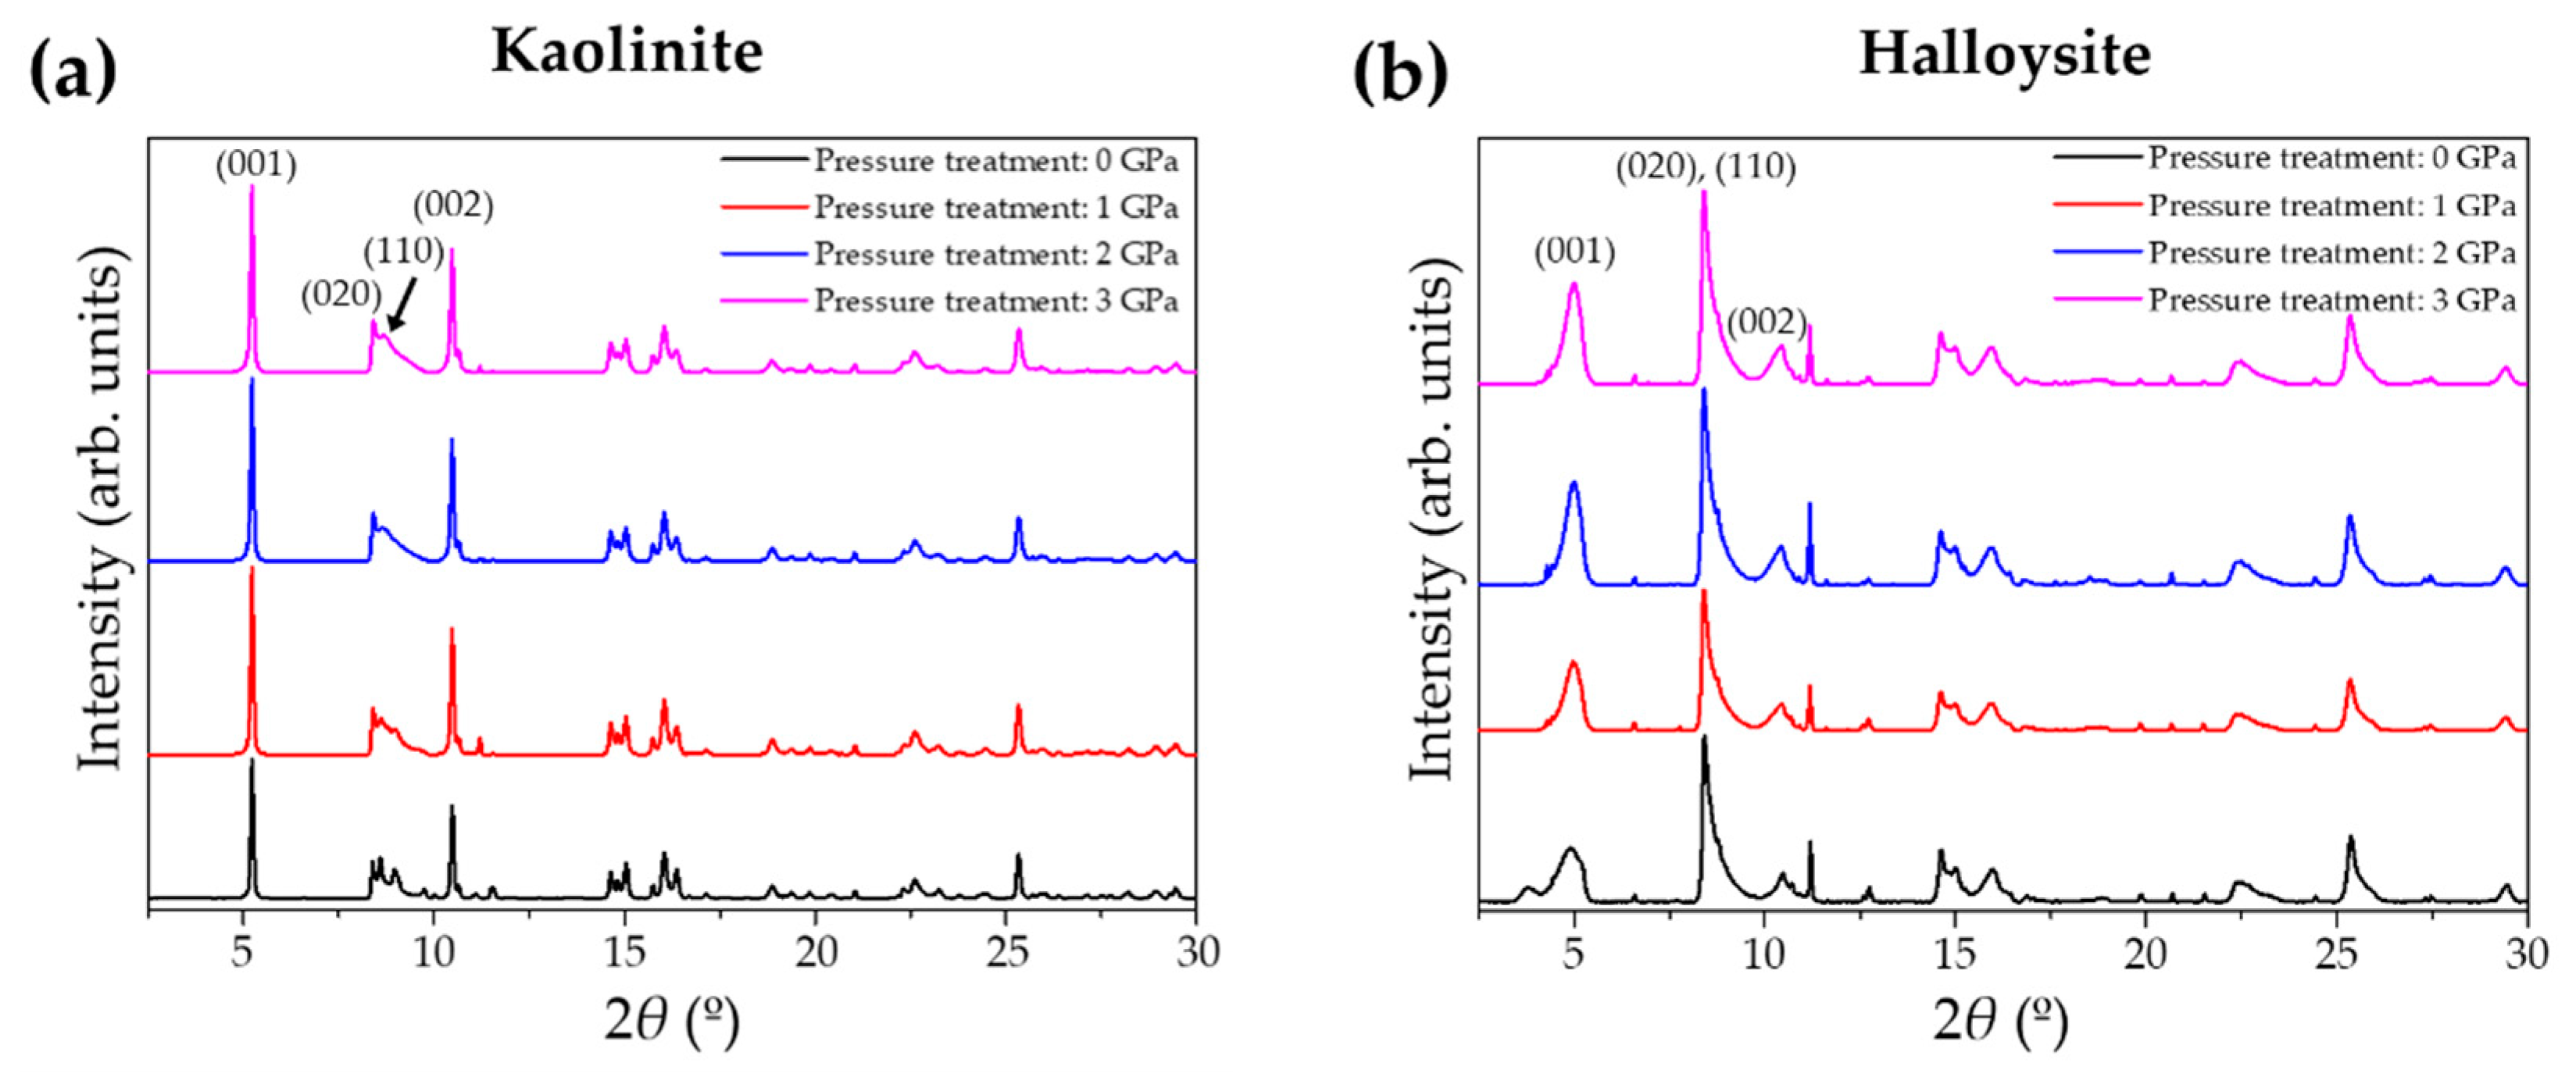
Kaolinite and halloysite are representative clay minerals belonging to the kaolin group and are layered silicate minerals making up fine particles [1]. Kaolinite and halloysite are known to be suitable for ceramic materials because they represent plasticity and stiffness depending on their moisture content and are also noted for their functions in cosmetics and pharmaceuticals, zeolite catalysts, fillers, paper, ceramics, refractory bricks, rubber, paints, and plastics [2,3,4,5]. The layer composition of kaolinite and halloysite is the same as Al2Si2O5(OH)4, but halloysite contains interlayer water, leading to the composition of Al2Si2O5(OH)4∙2H2O [1]. Through FE-SEM images, it has been revealed that kaolinite possesses a plate-stacked morphology, whereas halloysite has a tube-shaped form where plates are rolled because of water layers [6]. In X-ray diffraction (XRD), kaolinite shows a characteristic ~7 Å spacing between adjacent layers, whereas halloysite shows ~10 Å peaks as the first (001) reflection [7]. The interlayer water molecules in halloysite can be easily removed in conditions of low humidity (or by heating above 50 °C), which transforms the ~10 Å peak to ~7.5 Å [8,9,10].
A recent study on kaolinite has shown that under high-temperature and high-pressure conditions mimicking a depth of ~75 km along a cold subduction zone, water molecules can be inserted into kaolinite layers, making super-hydrated kaolinite, Al2Si2O5(OH)4∙3H2O, with a water content higher than that of halloysite [11]. In addition to the geochemical and seismic implications from the formation of super-hydrated kaolinite, changes in physical properties are expected, which might be selectively utilized in certain applications using these type of clay minerals. Particle size- and/or shape-dependent changes in adsorption behavior have been studied in activated carbon [12] and oxide nanoparticles [13]. Kaolinite has been studied as one of the good industrial adsorbents for environmental pollutants [14,15]. In order to understand how pressure affects the characteristic crystal morphology and associated adsorption properties, we have investigated two representative kaolin group minerals as a function of pressure treatment for changes in specific surface area and pore volume.
2. Materials and Methods
The kaolinite used in this study was a KGa-1b sample approved by Clay Minerals Society. The halloysite was from Nanoclay (Product Number: 685445) sold by SIGMA-ALDRICH (St. Louis, USA). Initial characterization of the samples was performed using X-ray diffraction (MicroMax-007HF/R-axis IV++, Rigaku, Tokyo, Japan) at the UNIST-PAL 6D beamline at PAL (Pohang Accelerator Laboratory), Korea. Each powder sample was loaded into a borosilicate capillary with Ø 0.3 mm. A monochromatic X-ray of 18.986 keV (λ = 0.6530(1) Å) was selected by Si (111) double crystals and then collimated to a size of 2880 mm × 2880 mm. A CCD detector (MX225-HS, Rayonix) (Rayonix, Evanston, USA) placed at a distance of 185 mm from the specimen was used for data measurement for 150 s after calibration using LaB6 standard (lanthanum hexaboride, SRM 660c) (NIST, Gaithersburg, USA). Figure 1 shows the XRD patterns of the kaolinite and halloysite starting samples together with data measured after each pressure treatment.
2.1. High-Pressure Treatment
Kaolinite and halloysite powder samples were compressed using a large volume press (QUICKpress apparatus of Depth of the Earth Company, Pheonix, USA) at the Crystallography Laboratory at Yonsei University. Approximately 0.03 g of kaolinite and halloysite specimens was loaded, respectively, in capsules made of Teflon with an outer diameter of 3.4 mm and height of 12 mm. The sample assembly consisted of alumina disks that support the capsule, Pyrex, and a salt-cell as a medium for transferring pressure. The assembly was pressure-treated at room temperature at intervals of 1 GPa up to 3 GPa. The sample was held for 1 h at each pressure before releasing to ambient conditions. A total of ~10 runs were performed at each pressure to produce ca. 0.35 g of the recovered samples.
2.2. Brunauer–Emmett–Teller (BET) Measurements
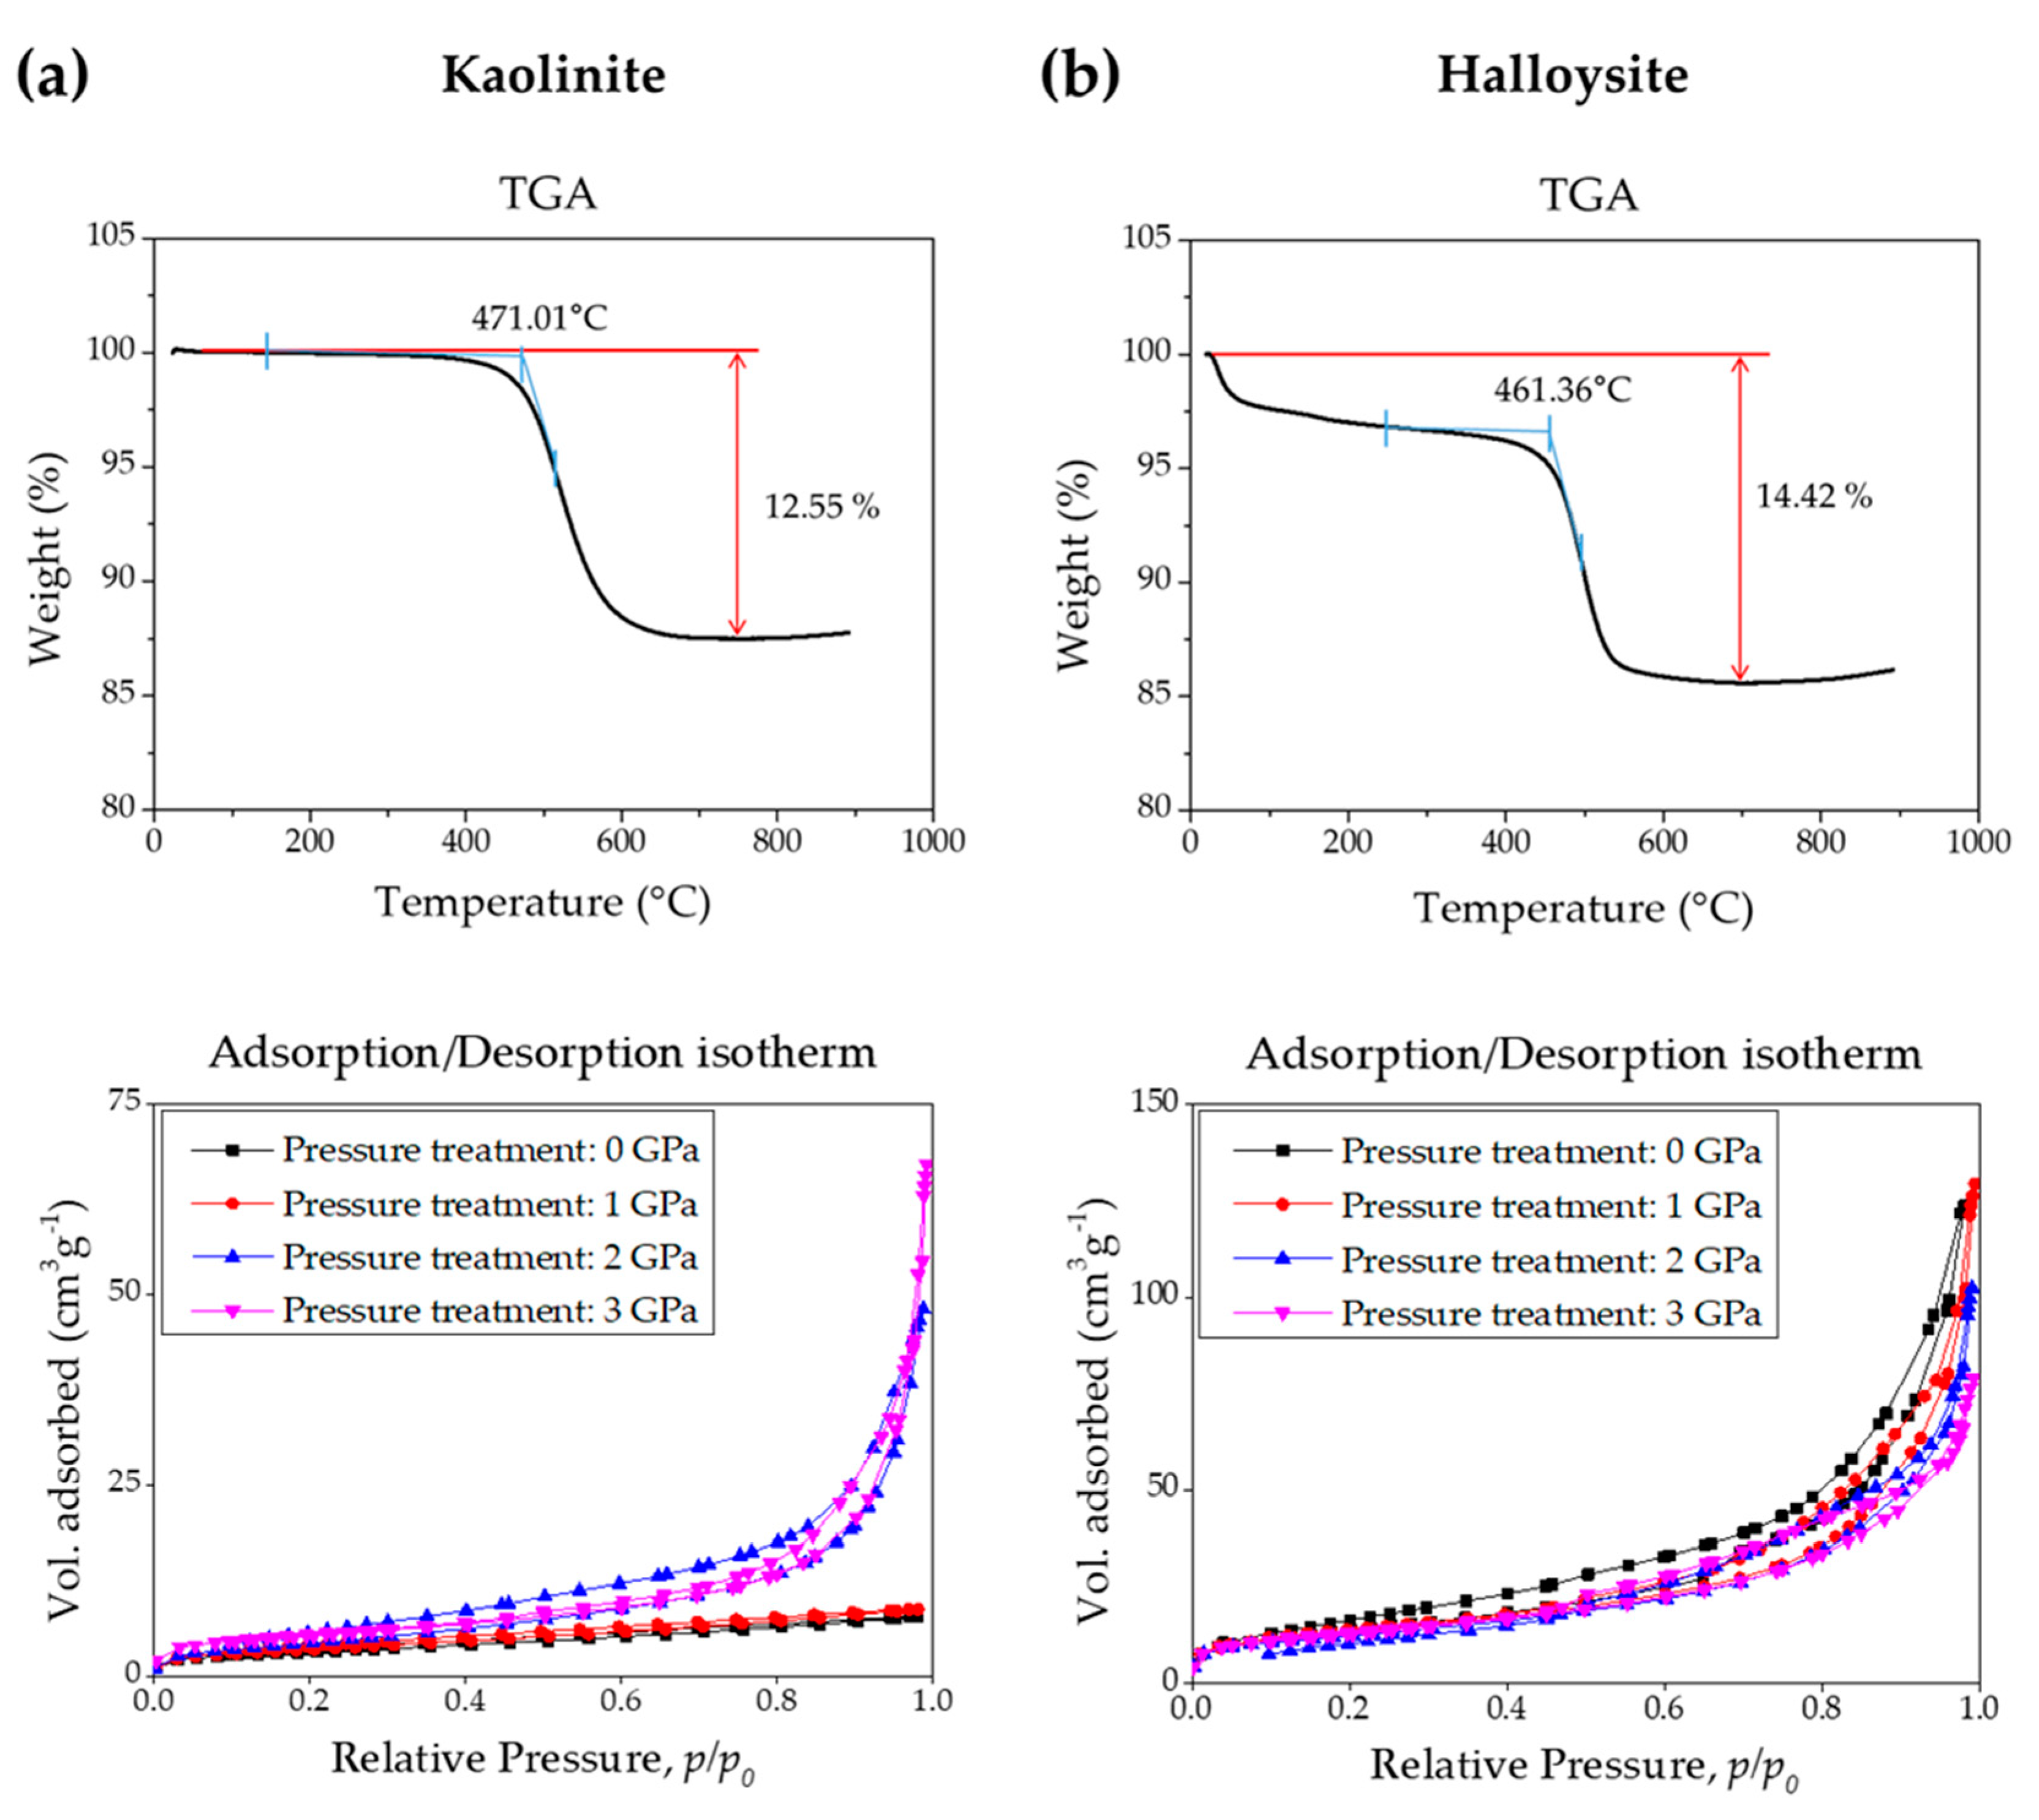
In order to measure the changes in the specific surface area of the pressure-treated samples, BET measurements were performed using BELSORP mini II (MicrotracBEL Corp., Osaka, Japan) at the Crystallography Laboratory at Yonsei University. Before measuring the BET specific surface area, ca. 0.3 g of each specimen was pre-treated at 300 °C for 15 h under vacuum to remove surface water and impurities. The pre-treatment temperature was determined by thermogravimetric analysis (TGA) on kaolinite and halloysite, as shown in Figure 2. For TGA experiments (Q50, TA Instruments, New Castle, USA), we used TA Instrument’s Q50 at Yonsei Center for Research Facilities and set the starting weight of 3.048 mg using a platinum cell. Nitrogen gas was used at 40.0 mL/min, and the sample was analyzed up to 900 °C at 20 °C/min. TGA graphs of Figure 2 show the temperatures at which the kaolinite and halloysite lose impurities on the surface and decomposes in two steps. For all the samples including the original kaolinite and halloysite before pressure treatment, BET measurements were performed using N2 gas at 77 K. The results are summarized in Table 1.
3. Results
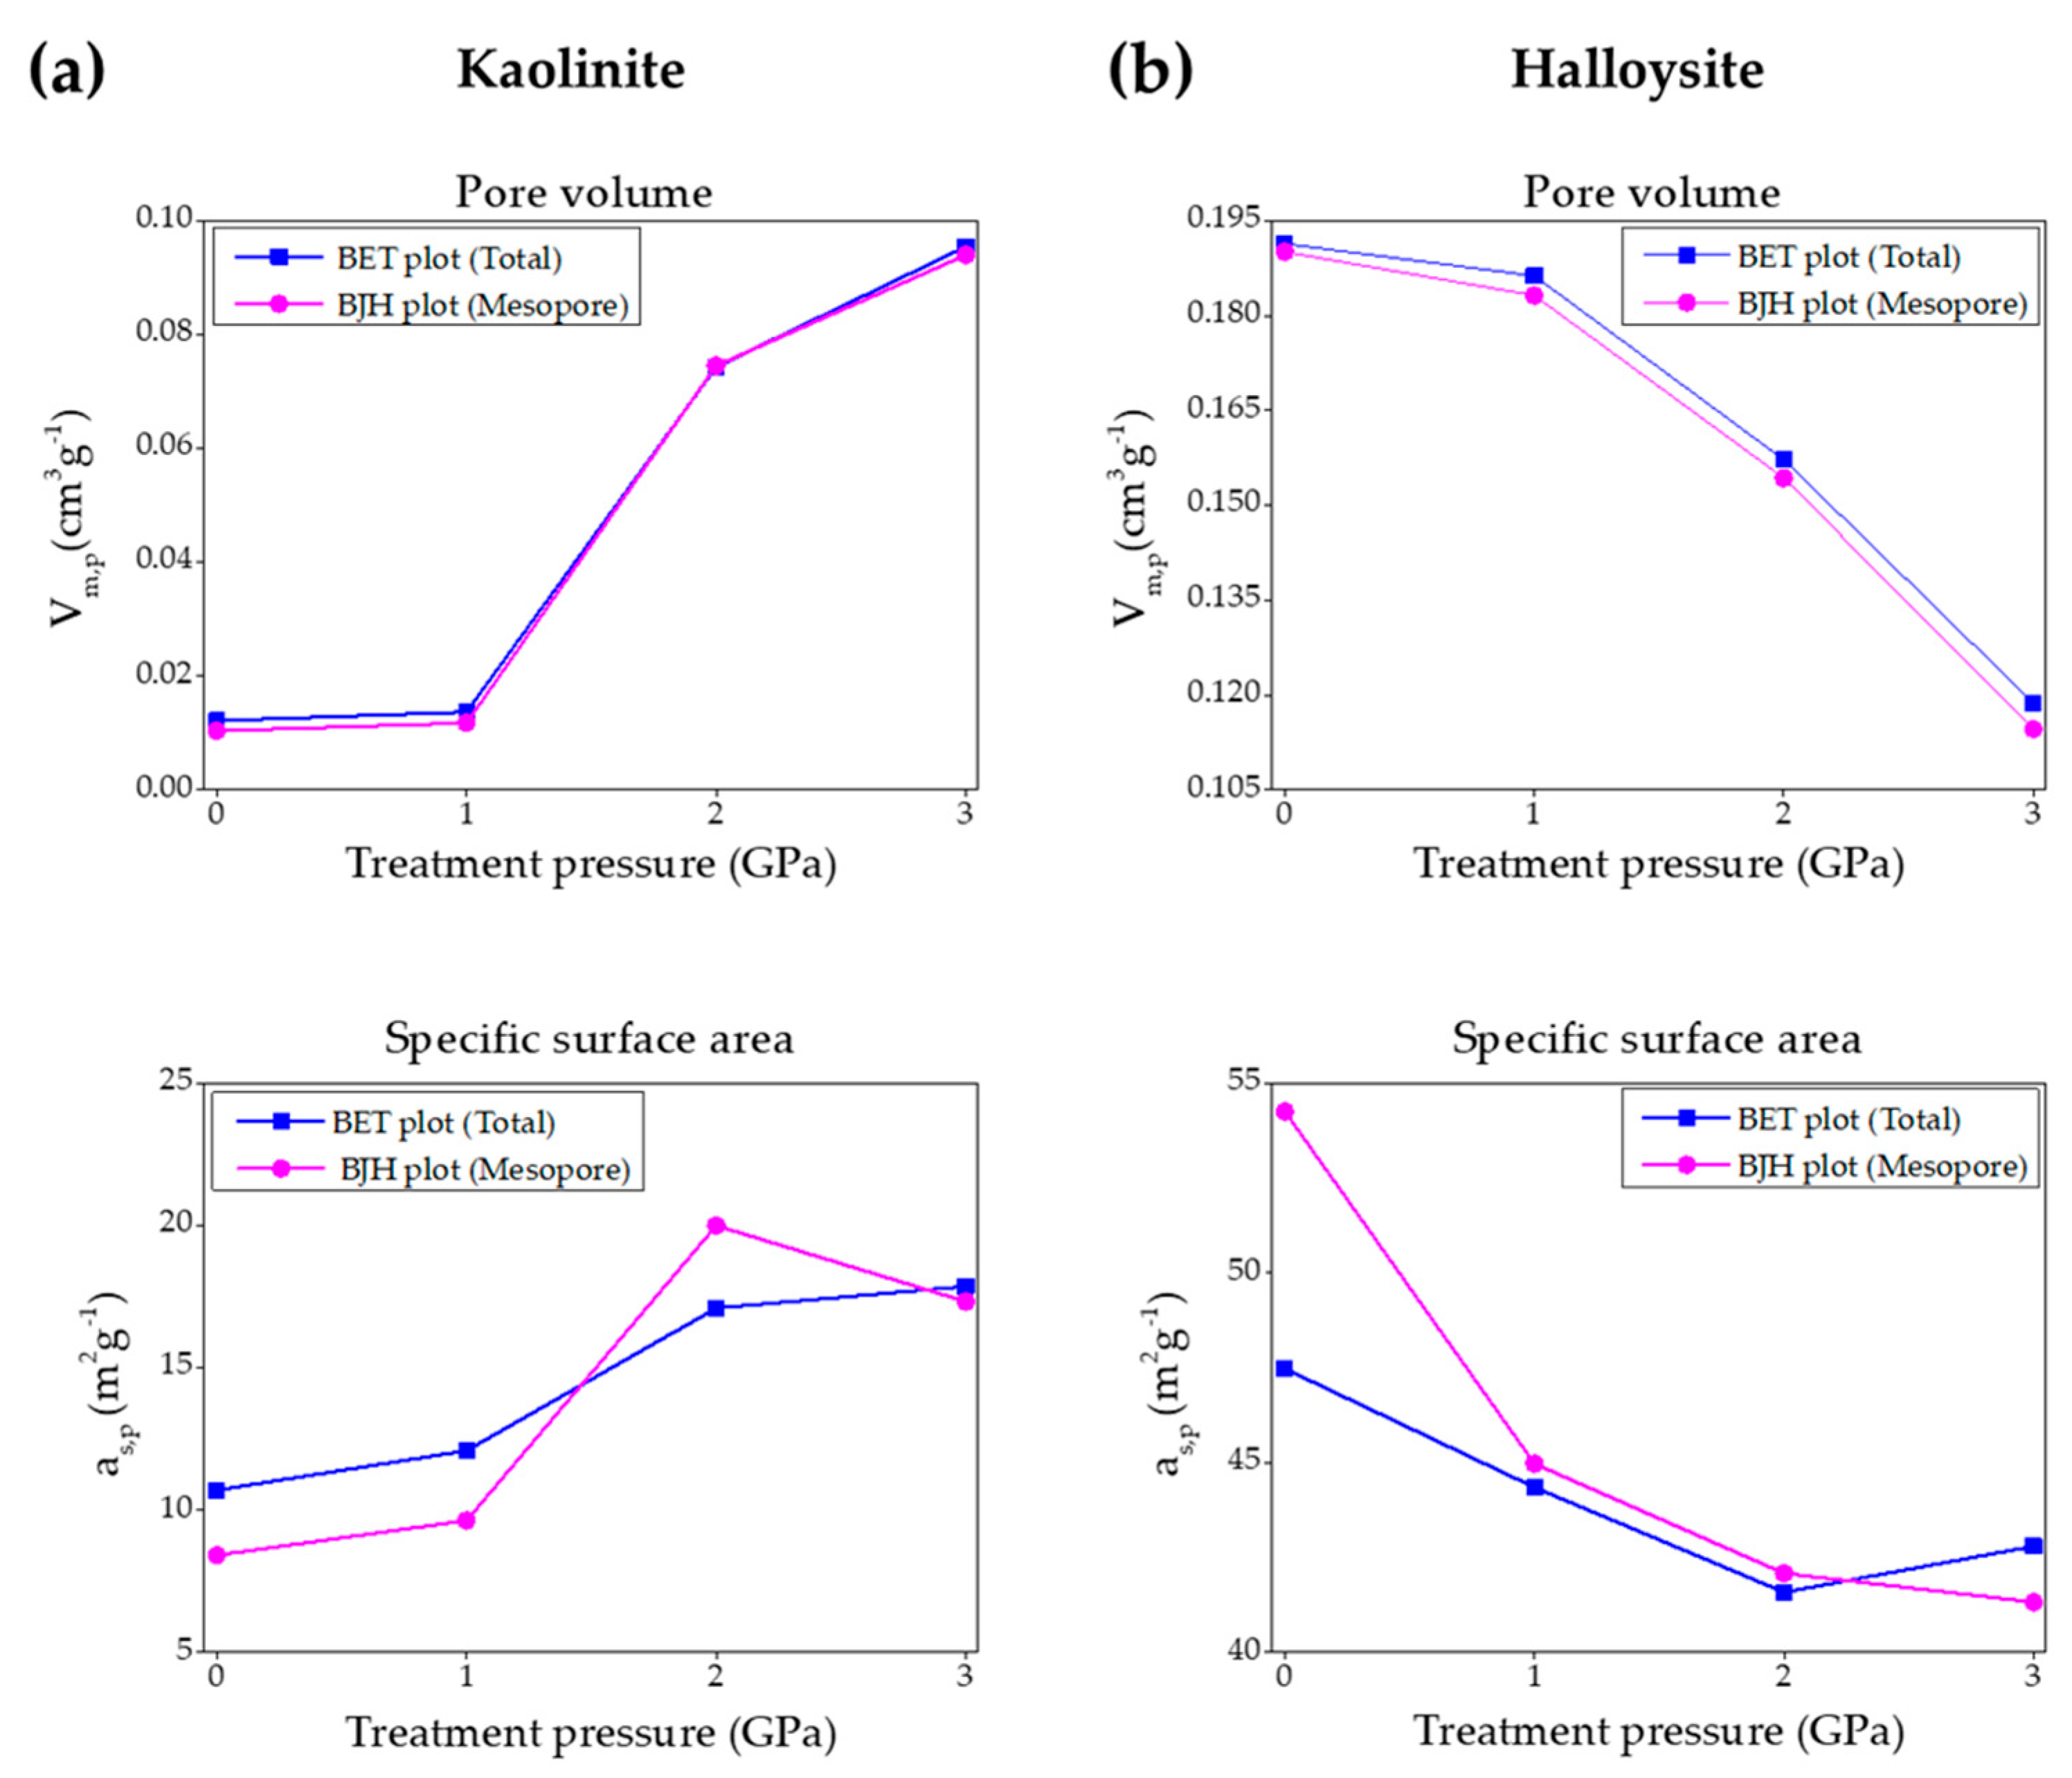
Powder diffraction patterns indicate that the long-range ordering of kaolinite and halloysite is maintained after pressure treatment without showing no apparent changes in peak positions and shape (Figure 1). In terms of changes in adsorption properties, however, we found systematic yet contrasting effects of pressure treatment between kaolinite and halloysite (Figure 2). In kaolinite, the degree of hysteresis increased compared to the isotherms from the ambient and 1 GPa-treated samples. Changes in the overall pore volume and specific surface area were calculated using the BET equation, as shown below [16,17], and are plotted in Figure 3 and summarized in Table 1.
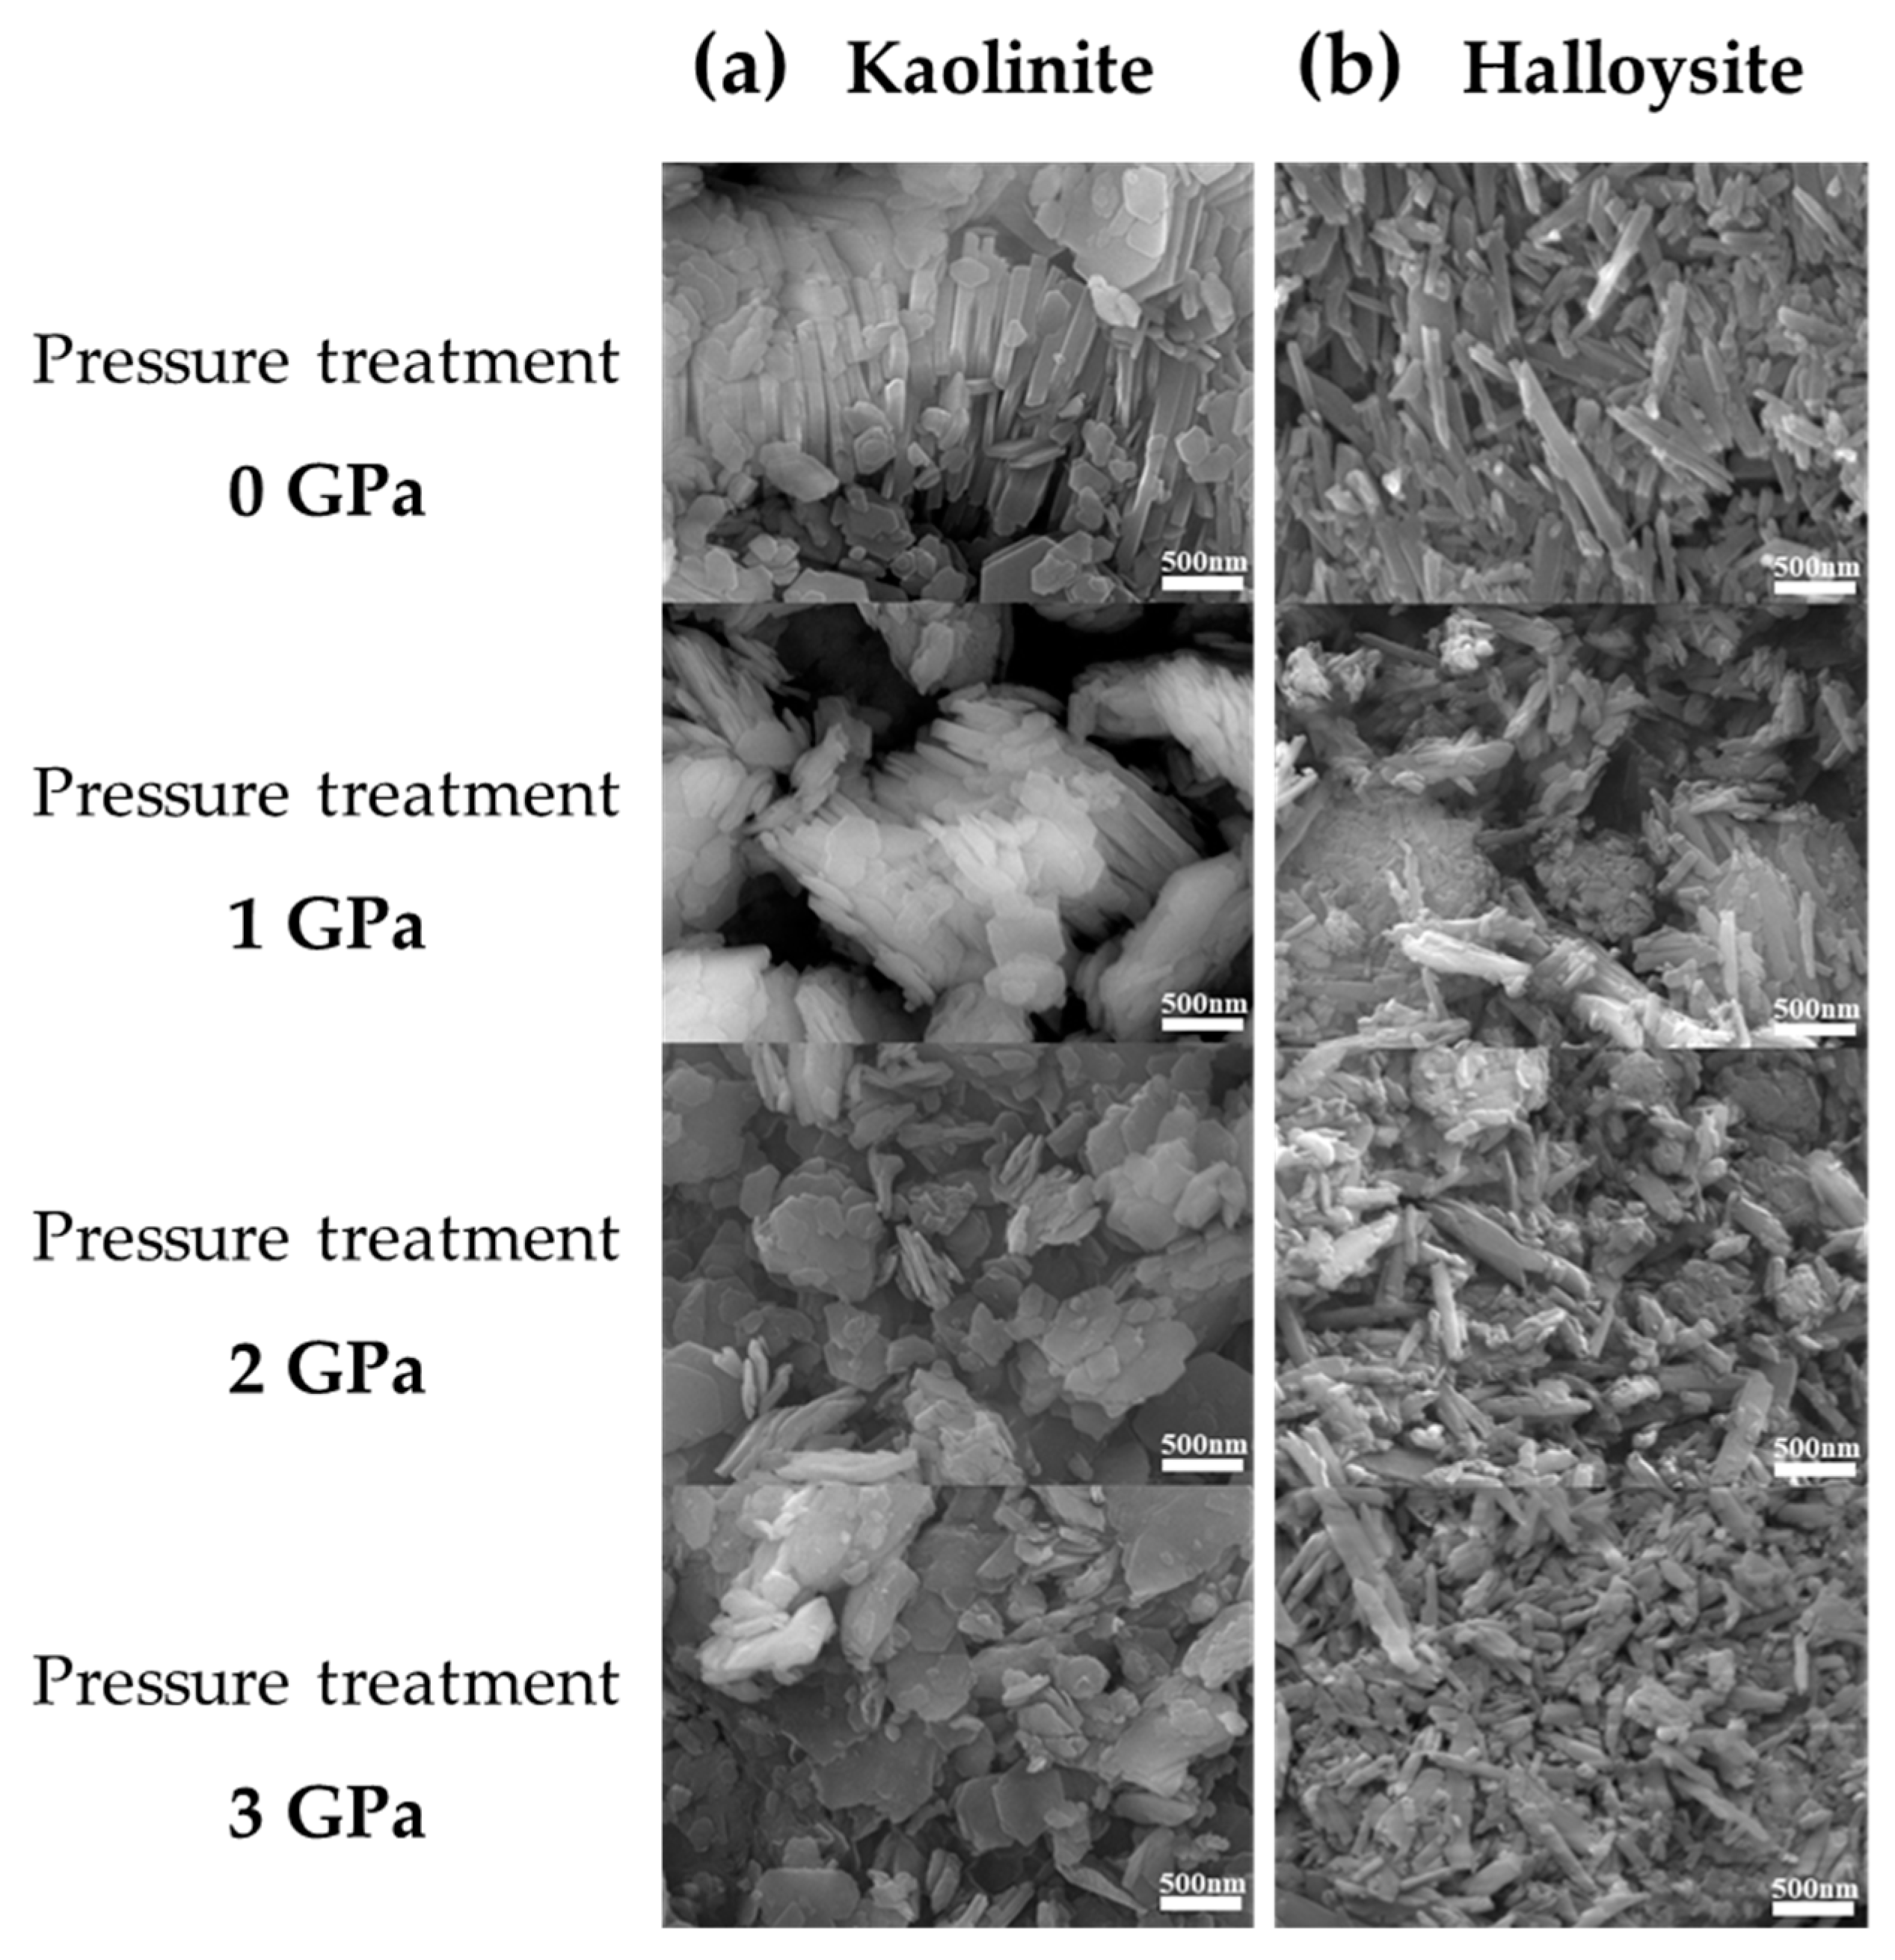
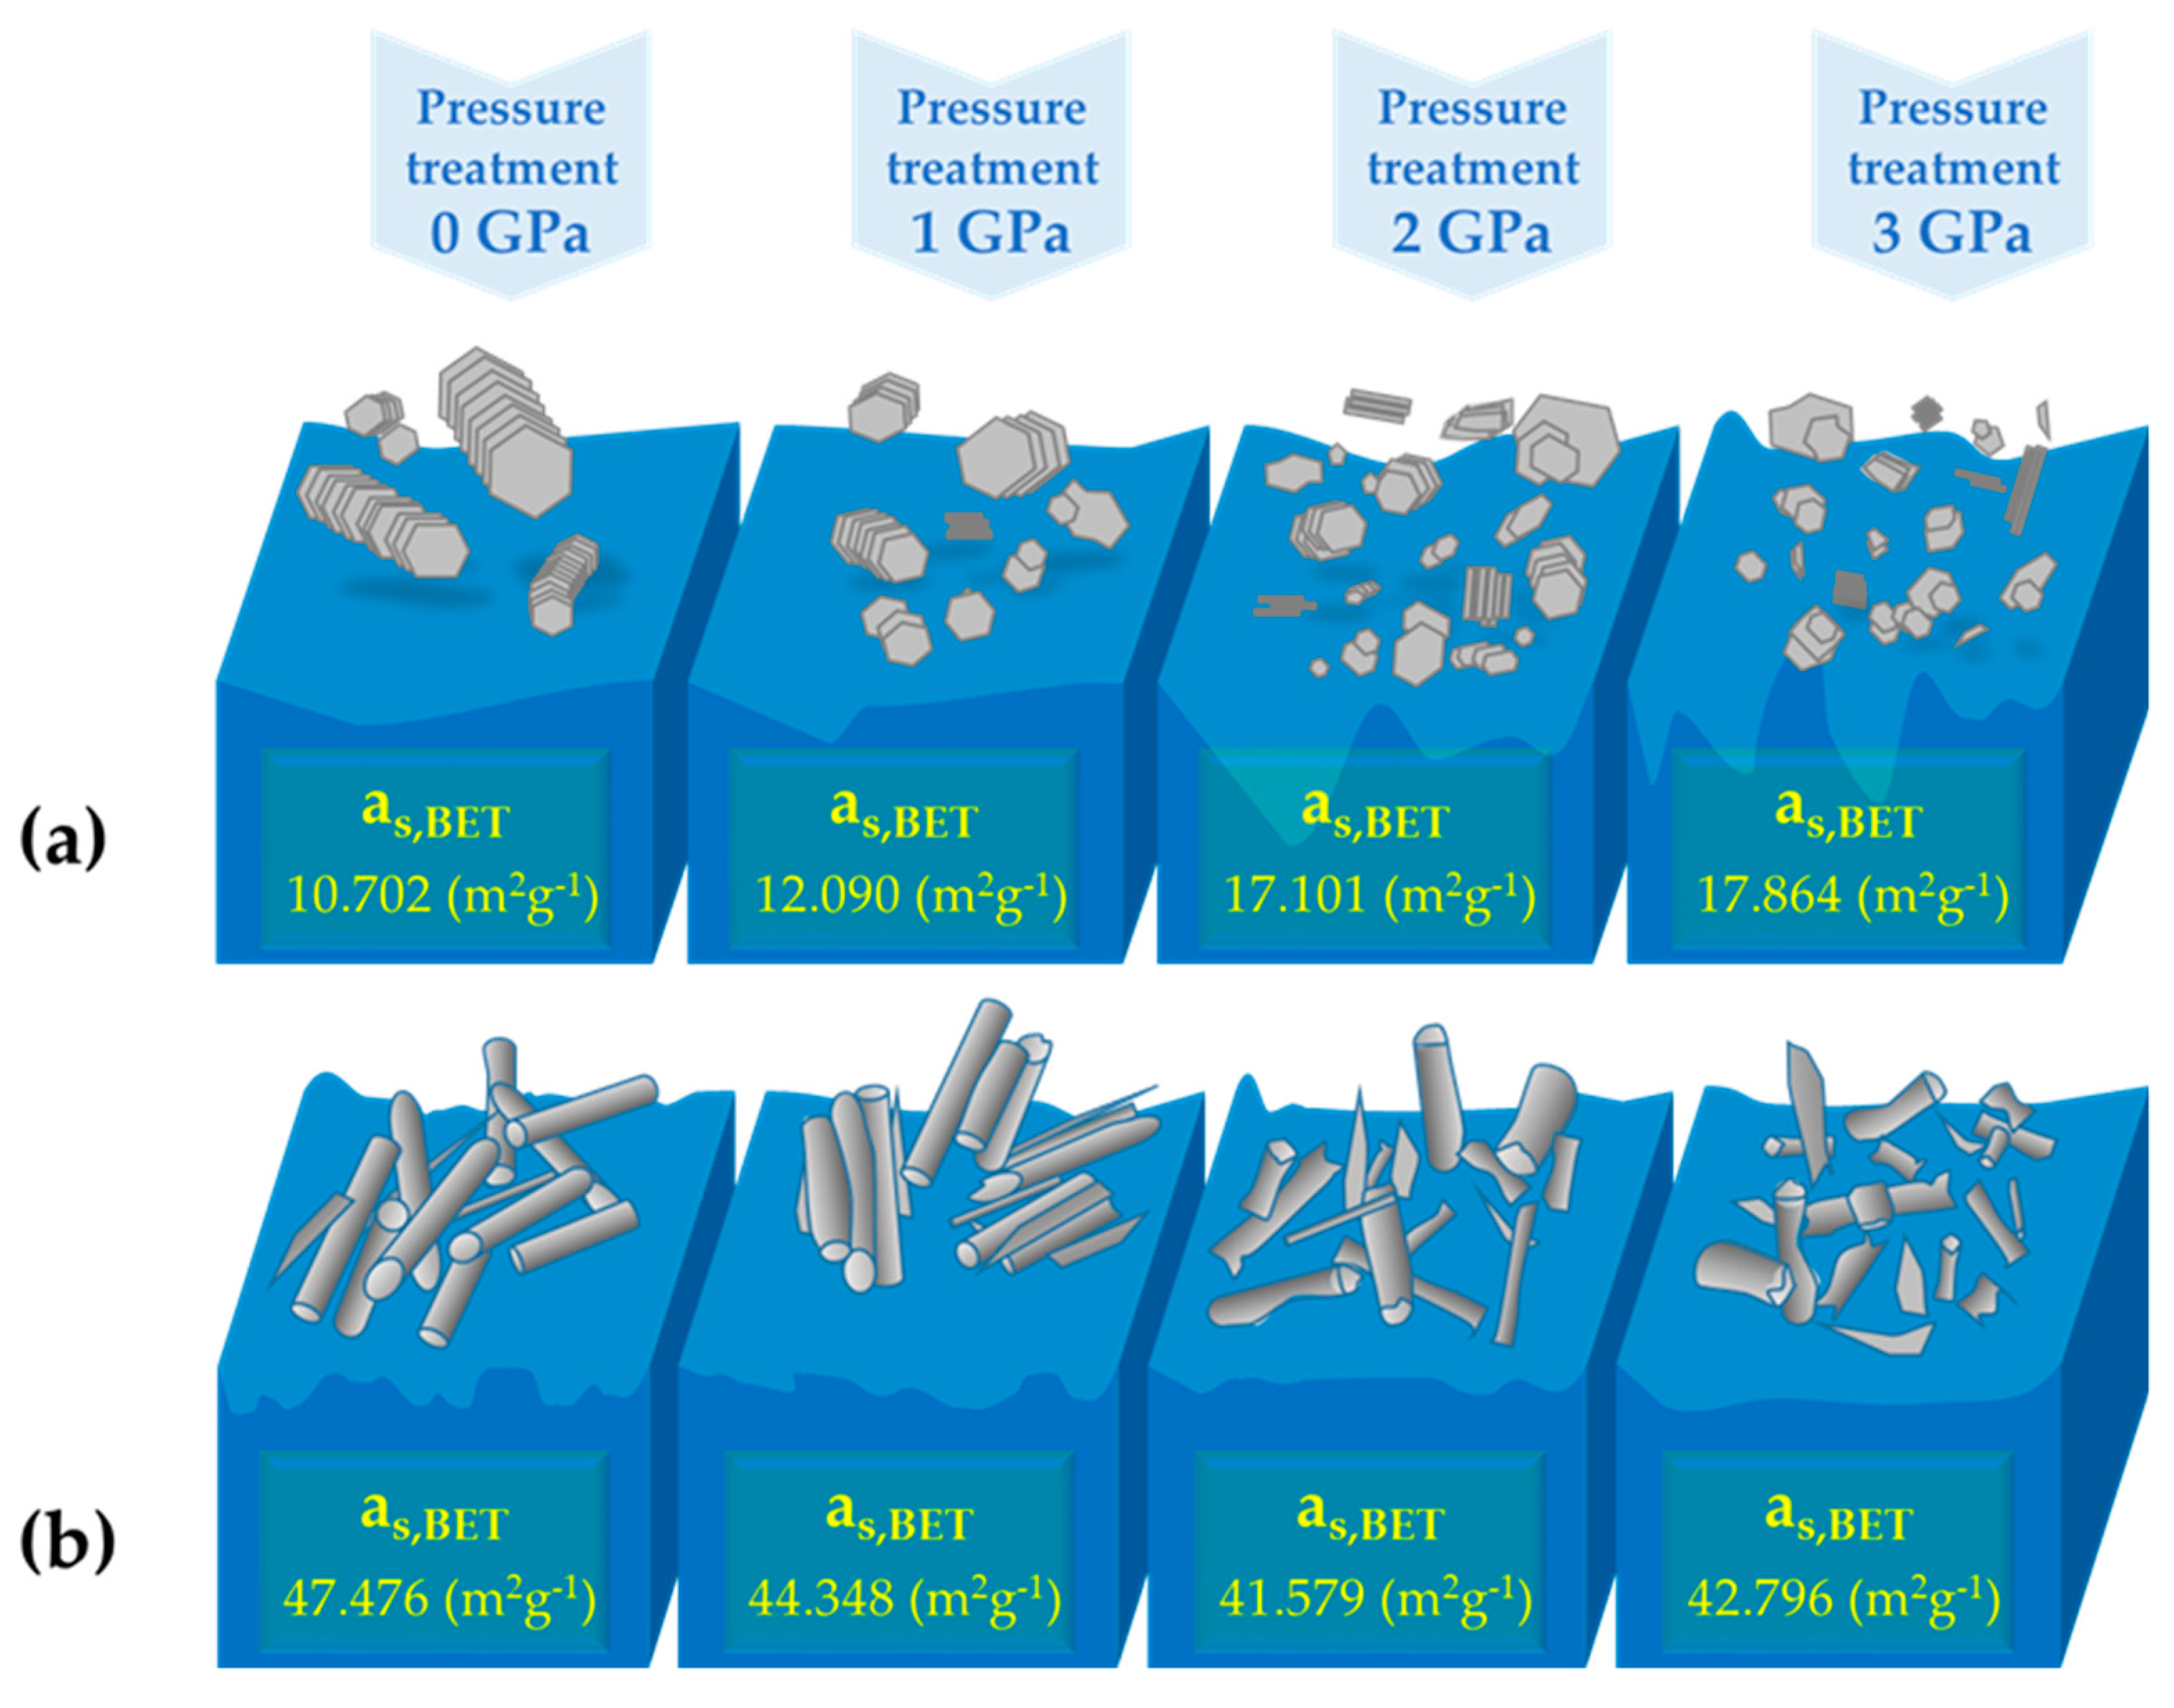
where p/p0 is the relative vapor pressure of the adsorbate, v is the volume of gas adsorbed, vm is the volume of gas adsorbed in a monolayer, and c is a constant related to the energy of adsorption [16,17]. Before pressure-treatment, the specific surface area of kaolinite was measured to be 10.702 (m2 g−1), which increases to 12.090 (m2 g−1) after 1 GPa, 17.101 (m2 g−1) after 2 GPa, and 17.864 (m2 g−1) after 3 GPa treatments. These lead to a gradual increase in the total volume of adsorbed pores from 0.01216 (cm3 g−1) at ambient, to 0.01368 (cm3 g−1) at 1 GPa, 0.074337 (cm3 g−1) at 2 GPa, and 0.09546 (cm3 g−1) at 3 GPa treatments. Therefore, the original and 1 GPa-treated kaolinite showed an overall low adsorption behavior. The pore size in this stage is characterized as nonpores. When the treatment pressure was increased to 2 and 3 GPa, the adsorption isotherms showed an exponential increase after a relative pressure of ca. 0.7, characterizing the samples to be in the mesopore state with a pore size of 2 to 50 nm. There are clear increases in both properties after 2 and 3 GPa treatment in kaolinite. FE-SEM (JEOL 7800F, operated at 5 kV) analysis showed that the changes in the adsorption behaviors are due to changes in the crystal morphologies, e.g., the original and 1 GPa-treated samples are overall identical in terms of the stacking of the hexagonal plate crystals, which become separated as the treatment pressures increase to 2 and 3 GPa (Figure 4).
In the case of halloysite, the adsorption isotherms showed gradual yet opposite behavior compared to those observed in kaolinite (Figure 2). Overall, all the adsorption behaviors resembled that of mesopore state, but as the treatment pressure increased, the adsorbed volume decreased gradually (Figure 3). Unlike kaolinite, the specific surface area of halloysite decreased from 47.476 (m2 g−1) at ambient to 44.348 (m2 g−1) after 1 GPa, 41.579 (m2 g−1) after 2 GPa, and 42.796 (m2 g−1) after 3 GPa treatments, which resulted in an overall decrease in the total volume of the pore from 0.1914 (cm3 g−1) at ambient to 0.1863 (cm3 g−1) after 1 GPa, 0.1572 (cm3 g−1) after 2 GPa, and 0.1187 (cm3 g−1) after 3 GPa treatments. SEM analysis of the original and pressure-treated halloysite is in line with the observed isotherms in terms of showing gradual morphological breakdowns from a well-formed and stacked nanotube shape into shortened and flattened particles upon the increase in treatment pressure (Figure 4). As a result, the changes in the pore volume and specific surface area in halloysite decrease gradually with the increase in the treatment pressure.
4. Conclusions
We have demonstrated that pressure can be applied as a clean variable to systematically alter the adsorption behavior of natural kaolin group minerals. Throughout the pressure treatment, no apparent changes in the composition or long-range ordering were observed. Upon pressure treatment, kaolinite showed an increase in the adsorption behavior from nonpores to mesopores, whereas halloysite responded in an opposite manner to show a decrease in its adsorption capability. We revealed that irreversible changes in the crystal morphology upon pressure treatment, as illustrated in Figure 5, is the key factor to affect the observed changes in the adsorption isotherms and changes in the pore volume. The pressure range we applied in this study is within the industrially achievable regime and may be further optimized depending on the treatment conditions such as using a suitable pressure medium or adding temperature as an additional variable. Future studies will reveal the more complex interplay between pressure and crystal morphology, which may be utilized in certain designed applications.
Author Contributions
S.K. conducted the experiments and data analysis with the help from H.H. Y.L. designed the research, provided supervision to the project, and worked on the manuscript with all authors.
Funding
This research was funded by the Leader Researcher program (NRF-2018R1A3B1052042) of the Korean Ministry of Science and ICT. We also thank the partial supports by NRF-2016K1A4A3914691 and NRF-2017R1A2B2004688 grants.
Acknowledgments
The authors thank Tae Joo Shin of UNIST for providing beamtime supports at UNIST-PAL 6D beamline at PAL (Pohang Accelerator Laboratory), Korea.
Conflicts of Interest
The authors declare no conflict of interest.
References
- Lázaro, B.B. Halloysite and Kaolinite two clay minerals with geological and technological importance. Real Acad. Cienc. Zaragoza 2015, 70, 7–38. [Google Scholar]
- Khurana, I.S.; Kaur, S.; Kaur, H.; Khurana, R.K. Multifaceted role of clay minerals in pharmaceuticals. Future Sci. OA 2015, 1. [Google Scholar] [CrossRef] [PubMed]
- Awad, M.E.; Lopez-Galindo, A.; Setti, M.; El-Rahmany, M.M.; Iborra, C.V. Kaolinite in pharmaceutics and biomedicine. Int. J. Pharm. 2017, 533, 34–48. [Google Scholar] [CrossRef] [PubMed]
- Murray, H.H.; Kogel, J.E. Engineered clay products for the paper industry. Appl. Clay Sci. 2005, 29, 199–206. [Google Scholar] [CrossRef]
- Murray, H.H. Overview—Clay mineral applications. Appl. Clay Sci. 1991, 5, 379–395. [Google Scholar] [CrossRef]
- Churchman, G.J. Intercalation Method Using Formamide for Differentiating Halloysite from Kaolinite. Clays Clay Miner. 1984, 32, 241–248. [Google Scholar] [CrossRef]
- Brindley, G.W.; Brown, G. Crystal Structures of Clay Minerals and Their X-ray Identification; Mineralogical Society: London, UK, 1982; pp. 145–161. [Google Scholar]
- Dong, F.; Wang, J.; Wang, Y.; Ren, S. Synthesis and humidity controlling properties of halloysite/poly (sodium acrylate-acrylamide) composite. J. Mater. Chem. 2012, 22, 11093–11100. [Google Scholar] [CrossRef]
- Joussein, E.; Petit, S.; Churchman, J.; Theng, B.; Righi, D.; Delvaux, B. Halloysite clay minerals—A review. Clay Miner. 2018, 40, 383–426. [Google Scholar] [CrossRef]
- Alexander, L.T.; Faust, G.T.; Hendricks, S.B.; Insley, H.; McMurdie, H.F. Relationship of the clay minerals halloysite and endellite. Am. Mineral. 1943, 28, 1–18. [Google Scholar]
- Hwang, H.; Seoung, D.; Lee, Y.; Liu, Z.; Liermann, H.-P.; Cynn, H.; Vogt, T.; Kao, C.-C.; Mao, H.-K. A role for subducted super-hydrated kaolinite in Earth’s deep water cycle. Nat. Geosci. 2017, 10, 947–953. [Google Scholar] [CrossRef]
- Mathews, A.P.; Zayas, I. Particle Size and Shape Effects on Adsorption Rate Parameters. J. Environ. Eng. 1989, 115, 41–55. [Google Scholar] [CrossRef]
- Wang, H.; Shadman, F. Effect of particle size on the adsorption and desorption properties of oxide nanoparticles. AIChE J. 2013, 59, 1502–1510. [Google Scholar] [CrossRef]
- Dipa Ghosh, K.G.B. Adsorption of methylene blue on kaolinite. Appl. Clay Sci. 2002, 20, 295–300. [Google Scholar] [CrossRef]
- Sen Gupta, S.; Bhattacharyya, K.G. Adsorption of heavy metals on kaolinite and montmorillonite: A review. Phys. Chem. Chem. Phys. 2012, 14, 6698–6723. [Google Scholar] [CrossRef] [PubMed]
- Clausen, L.; Fabricius, I.I. BET Measurements: Outgassing of Minerals. J. Colloid Interface Sci. 2000, 227, 7–15. [Google Scholar] [CrossRef] [PubMed]
- Brunauer, S.; Emmett, P.H.; Teller, E. Adsorption of Gases in Multimolecular Layers. J. Am. Chem. Soc. 1938, 60, 309–319. [Google Scholar] [CrossRef]
Figure 1.
X-ray powder diffraction patterns of (a) kaolinite and (b) halloysite before and after pressure treatments.
Figure 1.
X-ray powder diffraction patterns of (a) kaolinite and (b) halloysite before and after pressure treatments.

Figure 2.
TGA and Brunauer–Emmett–Teller (BET) adsorption/desorption isotherms data of (a) kaolinite and (b) halloysite before and after pressure treatments.
Figure 2.
TGA and Brunauer–Emmett–Teller (BET) adsorption/desorption isotherms data of (a) kaolinite and (b) halloysite before and after pressure treatments.

Figure 3.
Calculated pore volume (Vm.p. cm3/g−1) and specific surface area (as.p. m2/g−1) of (a) kaolinite and (b) halloysite before and after pressure treatments.
Figure 3.
Calculated pore volume (Vm.p. cm3/g−1) and specific surface area (as.p. m2/g−1) of (a) kaolinite and (b) halloysite before and after pressure treatments.

Figure 4.
SEM images of (a) kaolinite and (b) halloysite before and after pressure treatments.

Figure 5.
Schematic illustrations showing changes in the crystal morphology in (a) kaolinite and (b) halloysite as a function of pressure treatments.
Figure 5.
Schematic illustrations showing changes in the crystal morphology in (a) kaolinite and (b) halloysite as a function of pressure treatments.


Table 1.
BET results of (a) kaolinite and (b) halloysite before and after pressure treatments.
| Kaolinite | BET Plot | BJH Plot | ||||
| Treatment Pressure | Sample Weight (g) | as,BET (m2g−1) | Total Pore Volume (cm3g−1) | Mean Pore Diameter(nm) | ap (m2g−1) | Vp (cm3g−1) |
| 0 GPa | 0.334 | 10.702 (± 0.321) | 0.012 | 4.543 | 8.413 (± 0.252) | 0.010 |
| 1 GPa | 0.302 | 12.09 (± 0.363) | 0.013 | 4.526 | 9.631 (± 0.289) | 0.012 |
| 2 GPa | 0.341 | 17.101 (± 0.513) | 0.074 | 17.388 | 20.002 (± 0.600) | 0.075 |
| 3 GPa | 0.322 | 17.864 (± 0.536) | 0.096 | 21.375 | 17.325 (± 0.520) | 0.094 |
| Halloysite | BET plot | BJH plot | ||||
| Treatment Pressure | Sample Weight (g) | as,BET (m2g−1) | Total Pore Volume (cm3g−1) | Mean Pore Diameter (nm) | ap (m2g−1) | Vp (cm3g−1) |
| 0 GPa | 0.322 | 47.47 6(±1.424) | 0.191 | 16.125 | 54.260 (±1.628) | 0.190 |
| 1 GPa | 0.327 | 44.348 (±1.330) | 0.186 | 16.800 | 44.968 (±1.349) | 0.183 |
| 2 GPa | 0.297 | 41.579 (±1.247) | 0.157 | 15.124 | 42.081 (±1.262) | 0.154 |
| 3 GPa | 0.315 | 42.79 6(±1.284) | 0.119 | 11.090 | 41.323 (±1.240) | 0.115 |
© 2019 by the authors. Licensee MDPI, Basel, Switzerland. This article is an open access article distributed under the terms and conditions of the Creative Commons Attribution (CC BY) license (http://creativecommons.org/licenses/by/4.0/).
Share and Cite
MDPI and ACS Style
Kwon, S.; Hwang, H.; Lee, Y. Effect of Pressure Treatment on the Specific Surface Area in Kaolin Group Minerals. Crystals 2019, 9, 528. https://0-doi-org.brum.beds.ac.uk/10.3390/cryst9100528
AMA Style
Kwon S, Hwang H, Lee Y. Effect of Pressure Treatment on the Specific Surface Area in Kaolin Group Minerals. Crystals. 2019; 9(10):528. https://0-doi-org.brum.beds.ac.uk/10.3390/cryst9100528
Chicago/Turabian StyleKwon, Soyeon, Huijeong Hwang, and Yongjae Lee. 2019. "Effect of Pressure Treatment on the Specific Surface Area in Kaolin Group Minerals" Crystals 9, no. 10: 528. https://0-doi-org.brum.beds.ac.uk/10.3390/cryst9100528
Note that from the first issue of 2016, this journal uses article numbers instead of page numbers. See further details here.