Raman Scattering in Non-Stoichiometric Lithium Niobate Crystals with a Low Photorefractive Effect

Kola Science Centre of the Russian Academy of Sciences, Subdivision of the Federal Research Centre Tananaev Institute of Chemistry, 26 a, Akademgorodok, Apatity 184209, Murmansk region, Russia
*
Author to whom correspondence should be addressed.
Crystals 2019, 9(10), 535; https://0-doi-org.brum.beds.ac.uk/10.3390/cryst9100535
Submission received: 12 July 2019
/
Revised: 14 October 2019
/
Accepted: 15 October 2019
/
Published: 17 October 2019
(This article belongs to the Special Issue Raman Spectroscopy of Crystals)
Abstract
:Raman spectra of lithium niobate single crystals strongly doped by zinc and magnesium, it has been established, contain low-intense bands with frequencies 209, 230, 298, 694, and 880 cm−1. Ab ignition calculations fail to attribute these bands to fundamental vibrations of A2 symmetry type unambiguously. Such vibrations are prohibited by the selection rules in the space group C3V6 (R3c). Ab initio calculations also proved that low-intense “extra” bands with frequencies 104 and 119 cm−1 definitely do not correspond to vibrations of A2 symmetry type. We have paid special attention to these extra bands that appear in LiNbO3 single crystals Raman spectra despite the fact that they are prohibited by the selection rules. In order to do so, we have studied a number of lithium niobate single crystals, both nominally pure and doped, by Raman spectroscopy. We have assumed that some “extra” bands correspond to two-particle states of acoustic phonons with a total wave vector equal to zero. We have also detected a Zn concentration area (0.05–0.94 mol.% ZnO in a crystal) where doped crystal structure is more ordered: The order of alternation of the main, doping cations, and vacancies along the polar axis is increased, and oxygen octahedra are less distorted.
1. Introduction
The widespread use of lithium niobate (LiNbO3, LN) as a non-linear optical material necessitates a detailed study of its vibrational spectrum. Special attention should be paid to the composition and technology of obtaining LN. The non-centrosymmetric LN single-crystal is one of the most widely sought-after nonlinear-optical, acousto-optical, and laser materials at the present time [1,2,3,4,5,6]. This ferroelectric is characterized by a deeply defective crystal structure with very high Curie temperature (≈1410 K) and spontaneous polarization (Ps = 5 × 10⁻⁵ Cl/cm2) [1,2]. In addition, among all known piezoelectric materials, LN has the highest electromechanical coupling coefficient [2]. High values of nonlinear optical coefficients determine the possibility of using LN as a material for parametric frequency conversion of laser radiation, including in the terahertz region with excitation of polariton waves; to create electro-optical modulators; to convert laser and broadband radiation; for the implementation of a range of frequencies with stimulated Raman scattering, etc. The high value of spontaneous polarization and the presence of an extensive spectrum of defects of different nature with localized electrons lead to abnormally large values of the internal electric field strength. Special attention towards semiconductor magnonics is paid in papers [7,8] The defects have a significant effect on many physical properties of a crystal [2,5,9]. LN is a non-stoichiometric phase of variable composition and differs in a wide area of homogeneity on the phase diagram (from 44.5 to 50.5 mol.% Li2O at 1460 K) [2,5]. The interactions between the structural units of a crystal change when the composition changes. Features of the LN crystal structure determine features of its vibrational spectrum and many other physical characteristics.
LN single crystal is a material with a widely developed secondary structure. It is important to note that the fine features of its structure and, accordingly, the physical characteristics can be significantly changed by changing the composition (changing the Li/Nb ratio and doping), as well as by changing the structure and physicochemical properties of the melt [3,4,5,6]. Moreover, the oxygen-octahedral structure allows doping of the crystal with high (several wt.%) concentrations of metals, as well as double and triple doping with different elements with different charge states.
When interpreting the experimental results, the crystal should be considered as a solid solution of Me:Nb:LiNbO3 (Me is a doping metal). Many metals are capable of entering the octahedral voids of the structure; the solubility limits of the metals are rather large. The concentration of doping metals in the crystal LN structure can reach several wt. % and accordingly ~9 mol.% [2,3,4,5,6]. At the same time, the octahedral coordination of cations by oxygen ions allows significant geometric distortions of octahedra LiO6, NbO6, MeO6, □O6, (□ is a vacant octahedron) without changing their symmetry. This fact, along with a large number of point defects in the cation sublattice, leads to structural and optical ununiformity of LN crystal and to formation of complex ionic complexes and microstructures (clusters) in the main (primary) crystal structure, i.e., to the formation of a widely developed secondary crystal structure [6,10,11,12,13]. By primary (basic) crystal structure we mean a structure that can be experimentally determined by diffraction methods—neutron scattering and X-ray structural analysis. The basic structure of a crystal, containing atomic coordinates, is described in the framework of the theories that are based on the symmetry space groups. However, experimental data can be reconciled with the theory only considering that real crystals are defective, and they consist of microstructures (clusters) and other micro-formations. The dimensions of the latter are usually <10−6 m, i.e., microstructures (clusters) and other micro-formations form a secondary structure.
It should be noted that increasing of concentrations of many metallic elements in the crystal structure cause jump-like changes in the physical properties and structure of LiNbO3 crystals, which has a threshold nature [3,5,14,15].
The values of threshold concentration of various doping cations noticeably differ from each other. For example, for Mg2+ and Zn2+ cations, the values of the first thresholds are ~5.5 and 7.0 mol.% in the melt, respectively [5,6]. There are concentration thresholds for many doping elements. Once dopant concentration reaches threshold, the mechanism of doping cation incorporation to a structure changes and the properties of the crystal change too. This phenomenon attracts the close attention of researchers [3,4,5,6,10,11,14,15,16,17]. The space group of the LN crystal does not change, even doped with high (above the threshold) concentrations of Mg2+ and Zn2+, despite the significant change in the state of its defectiveness. The parameters of the structure fluctuate within noticeable limits, and the dependence of the structure parameters on the concentration is often jump-like [5,6,14,15,16].
“Non-photorefractive” cations (cations with a constant valence, for example, Zn2+, Mg2+, Gd3+, etc.), unlike the multiply charged “photorefractive” cations (Fe, Rh, Cu, etc.) do not change their charge state in the crystal (they are not donors of electrons) under the action of optical radiation. Optically highly perfect LN crystals, heavily doped with “non-photorefractive” metal cations, have an increased resistance to optical damage and a low value of the coercive field [6]. This explains why there was a significant interest in the creation, development of technologies, and research of such materials in recent years. Many intrinsic and impurity defects with electrons localized on them (electron traps) characterize real LN crystals. They have the effect of photoinduced changes in the refractive index (optical damage). The magnitudes of the refractive indices of LN crystals vary in very wide limits, and this depends on the composition of the crystal and the state of its defectiveness [1,3,4,5,6,9]. The photorefractive effect occurs in the illuminated region of the crystal as a result of spatial electron transfer (drift or diffusion). This leads to subsequent capture of electrons to deep levels and the formation of an internal space charge field, which changes the refractive indices of the crystal [3,5]. Moreover, the extraordinary refractive index varies significantly more than ordinary one. It is recognized that the photovoltaic mechanism dominates in photorefraction in a LiNbO3 crystal, i.e. the value of the photovoltaic field is much larger than the value of the diffusion field [9,18]. Band gap also changes with variation in the crystal composition. A band gap value in a nominally pure congruent LN crystal is 3.72 eV, in doped crystals it varies in the range 3.4–3.8 eV. These values are close to the value characteristic of wide-gap semiconductors [1,19]. In addition, when exposed to laser radiation, Rayleigh photoinduced light scattering (PILS) occurs on laser-induced static and dynamic (fluctuating) defects with altered refractive index. The value of the electro-optical effect determines the value of the angle of disclosure of the PILS indicatrix, which in the LiNbO3 crystal occurs predominantly along the polar axis Z in the form of an “eight” or an ellipse [7,20,21].
LN crystal is characterized by the formation of complex defects of various types in addition to point defects of the cation sublattice, described in detail in [3,5,6,14,15,16,22,23,24,25] LN crystals of any composition grown in an air atmosphere always contain hydroxyl groups (OH−) in the structure [3,10,26]. The concentration of OH groups in the crystal is 1017–1019 cm−3. OH-groups occupy oxygen sites and form various complex defects with the main (Li+, Nb5+) and doping cations in the crystal structure [3,10,26,27,28]. OH− groups occupy oxygen sites in the crystal structure and form various complex defects with the main (Li+, Nb5+) and doping cations, including complex defects of the type (□Li)-OH−, (NbLi)–OH−, and another [1,3,26,27,28]. These defects are caused by hydrogen bonds in the crystal structure [10,26,27,28]. OH groups increase the conductivity and reduce the photorefractive effect and the magnitude of the coercive field in the crystal. Some features of the OH groups localization in LN crystals described in this research were investigated in [10,26,27,28]. The nature of complex defects associated with OH groups depends on the composition of the crystal and the technological factors of their production. For example, the method of preparing the initial precursors and charge, the type and concentration of dopants, the characteristics of their localization in the structure, the thermal history of the crystal, etc., influence these complexes [10,26,27,28]. Since protons are anharmonically linked to the oxygen ion of a LN crystal by a hydrogen bond, OH groups in the crystal structure should have a noticeable effect on the vibrations of the oxygen atoms in the oxygen octahedra. The effect of hydrogen bonds on the vibrations of the oxygen lattice of a LN crystal is very poorly studied at present time.
Attempts of computer simulation of cluster formation in the structure of a LN crystal were undertaken in [29,30,31]. Cluster structures in nominally pure non-stoichiometric LiNbO3 crystals (R = Li/Nb < 1) usually arise near point defects NbLi, □Li, etc., and in doped crystals also near doping cations [5,6,16,22]. The higher the concentration of the doping cation is, the more clusters in the structure of the LN crystal form; thus, the structural ununiformity of the crystal increases. The computer simulation method gave two conclusions. First, a stoichiometric cluster (Li/Nb = 1) is impossible in the structure of a LN crystal; and second, when the number of atoms in a cluster increases, the composition of a cluster with any Li/Nb ratio inevitably tends to congruent (Li/Nb = 0.946) [29,30]. The composition of the cluster and its structure differ from those of the crystal matrix [5,29,30]. The cluster structure has usually a lower symmetry than the structure of the main matrix [29,30,31]. The main (Li+ and Nb5+) and doping cations in the cluster are in low-energy positions, which leads to a distortion of oxygen octahedra and a change in spontaneous polarization [5,6,11,16]. Doping metals influence the secondary structure of LN crystals particularly strong near concentration thresholds when the mechanism of the doping cation incorporation into the lattice changes [5,6,14,15,16].
Modern technologies provide growth of optically perfect LiNbO3 crystals with different Li/Nb ratios—nominally pure and doped with a wide range of metal elements. At the same time, the physical characteristics, optical and structural uniformity of LN crystals can vary significantly [2,4,6,10]. Besides, the genesis of the LN charge has a noticeable effect on the characteristics of the secondary structure and the physical characteristics of LiNbO3 crystals. Completely new technologies are also being developed at the present day. They make it possible to change the structure of the LN melt by homogeneous doping of the precursor Nb2O5 with non-metallic doping cations that fail to incorporate into the crystal structure [32,33,34]. This approach allows us to obtain nominally pure crystals that are close to heavily doped crystals in their physical characteristics, but at the same time, in structural and optical uniformity, they often are significantly better. The diversity of the possible compositions of LN, the features of the crystal, and the charge technology give rise to a situation where researchers often actually deal with different optical materials based on LiNbO3 crystals, rather than with LN crystals themselves. These materials differ in compositions, are characterized by different structural formulas, and differ in features of secondary structure and physical characteristics. Thereby, it is important to create a database of the physical and structural characteristics of LiNbO3 crystals, which are grown by different technologies from a charge of a different genesis.
This paper is devoted to a review of researches on the effect of the compositional characteristics, charge technology, and crystals on the Raman spectrum of real LiNbO3 crystals grown by Czochralski. Researches were carried out mainly by scientists of the ICT KSC RAS. Particular attention is paid to the interpretation of the Raman spectra of heavily doped by “non-photorefractive” cations LiNbO3 crystals, the manifestation in the spectrum of “order-disorder” processes, and point and extended defects of various types.
Low-scale defects and clusters are also considered. These phenomena have recently become the object of intensive research due to the development of high-resolution optical research equipment [6,12,13,35]. The Raman spectra are highly sensitive to changes in the interactions between the structural units of the crystal and, consequently, to various fine reorganizations of the crystal structure and to the processes of “order-disorder” that occur when its composition changes and its structural units are ordered. Raman spectroscopy is a powerful method for studying the fine features of the structure, controlling the optical and structural perfection of LN crystals. The method has been successfully applied in practice when creating a technology of real crystals of high optical quality [5,6]. In addition, Raman spectroscopy is still the only method that allows us to investigate the effect of photorefraction and the specific features of the crystal structure caused by it simultaneously [5].
We have compared the Raman spectra, photoinduced light scattering and compositional uniformity of CLN crystals heavily doped with Mg2+ and Zn2+: LiNbO3:Zn (4.5 mol.% ZnO), LiNbO3:Mg (5.01):Fe (0.005), LiNbO3:Mg (5.1), LiNbO3:Mg (5.3 mol.% MgO) and spectra of nominally pure CLN and SLN crystals obtained by different technologies. The crystals heavily doped with non-photorefractive impurities have a low photorefractive effect and are perspective as optical materials with micron, submicron, and nanometer periodic structures for radiation conversion. The structural and optical uniformity of heavily doped crystals were studied by photoinduced light scattering (PILS) and laser conoscopy. For comparison, the spectra of nominally pure CLN and SLN crystals and a crystal SLN(K2O) were also investigated. Raman spectra of nominally pure CLN, SLN, and SLN(K2O) crystals and congruent crystals doped with magnesium and zinc were previously investigated in [5,36,37,38,39,40,41,42,43,44,45,46,47].
LN crystal structure was first described in [22,48]. The base of the crystal structure is a frame of slightly deformed oxygen octahedra O6 connected through common faces and edges. In the octahedra occupied by Nb5+ cations, there are two different distances oxygen–metal along the polar axis. This provides great anisotropy of the crystal field along the polar axis and ferroelectricity. Columns of oxygen octahedra are elongated along the third order axis (polar axis). Oxygen carcass has the densest hexagonal packing. Only two thirds of oxygen octahedra are occupied by Nb5+ and Li+ cations; the rest are left vacant in the perfect stoichiometric crystal (R = Li/Nb = 1). There is a certain perfect order of metal cations and vacancies that form the structure of a perfect Stoichiometric LN crystal: Li+, Nb5+, vacant octahedron. Point defects always exist in non-stoichiometric LN crystals (R < 1). Such defects could be two atoms of the same type or two vacancies standing together. The main defects are Nb in Li sites, NbLi. The amount of NbLi defects reaches ≈6% wt % [2] in a congruent LN crystals (R = 0.946). In perfect SLN crystals these defects are absent. A full chemical formulae of undoped non-stoichiometric LN crystal is (Li1-5xNbx)4x)NbO3. Note that this formula is unable to consider all various types of secondary structure. Some types of microstructures observed in this paper reveal deep nano- and microstructure of studied real LN crystals (see Section 3.1).
2. Materials, Methods, and Theory
2.1. Obtaining LiNbO3 Crystals of Different Chemical Composition.
SLN and CLN were grown in an air atmosphere by Czochralski, according to the technology described in papers [4,49]. SLN was grown from melt with 58.6 mol.% Li2O; CLN was grown from melt of congruent composition. SLN(K2O) was grown by the high temperature top speed solution growth (HTTSSG) method from a congruent melt with the addition of a flux 6 wt. % K2O [4]. A LiNbO3:Mg(5.01):Fe(0.005 mol.%) crystal was obtained using the method of homogeneous doping of the precursor Nb2O5 [6,50]. Crystals LiNbO3:Mg (5.1 mol.%) and LiNbO3:Mg(5.3 mol.%) were obtained using a granulated solid phase ligature [51,52]. The LiNbO3:Zn crystal (4.5 mol.%) was obtained by direct doping. The method involves adding, with stirring, zinc oxide to a granulated charge of lithium niobate before fusing the crucible [49]. Methods of preparing the charge and growing crystals of different composition used in this study are described in detail in papers [49,50,51,52,53]. A granular charge of congruent composition (48.6 mol.% Li2O) with a high bulk density was used to grow LiNbO3 crystals. It was obtained by the method of synthesis-granulation. The concentration of impurities in the mixture for individual impurities did not exceed 5·× 10−4 wt. %. The growth was carried out on induction type growth plants “Crystal-2”. They are equipped with an automatic system of the crystal diameter control. The crystal vertical speed was 1.1 mm/h and the rotation speed was 14 rpm. The magnitude of the axial gradient was ~1 deg/mm. Grown crystals were subjected to heat treatment at T = 1200 °C for 24 hours in order to remove thermoelastic stresses. The concentration of doping elements in the crystal was determined by analyzing the plates cut from the top (conical—Ct) and bottom (lower Cb) parts of the boule. The analysis of the content of doping elements was performed by atomic emission spectrometry (spectrometer ICPS-9000 by Shimadzu). The error in determining by this method was ~1%. Turning of LiNbO3:Mg crystals to a single-domain state was carried out by high-temperature electrodiffusion annealing (HTEA). The essence of the method is application of constant voltage while cooling the samples at a rate of 20 deg/h, in the temperature range ~1240–890 °C. The degree of the resulting single domain was determined by analyzing the frequency dependence of the electrical impedance and by determining the value of the static piezoelectric coefficient (d333st) of the crystal boule.
2.2. Methods of Experimental Studies of Raman Spectra and Optical Uniformity Crystals
Optical homogeneity and photorefractive properties of LN crystals were investigated by the methods of laser conoscopy in wide-aperture laser beams and photoinduced light scattering (PILS). Samples for studying Raman spectra, PILS, and conoscopic patterns were cut from crystals in the form of rectangular parallelepipeds (dimensions ~ 7 × 6 × 5 mm3). Their edges coincided in direction with the crystalophysical axes X, Y, Z (Z is the polar axis of the crystal). The faces of the parallelepipeds were carefully polished.
The Raman spectra were excited with a 514.5 nm band of argon laser (Spectra Physics, model 2018-RM, Rankweil, Austria) and recorded with a T64000 spectrograph (Horiba Jobin Yvon, Longjumeau, France) using a confocal microscope. The Raman spectrum of a LiNbO3 crystal can be significantly affected by photorefraction [4,5]. In order to eliminate the effect of photorefraction on the Raman spectrum, the spectra were excited by a low-intensity radiation. Thereby, the power of the exciting laser radiation under a microscope did not exceed 3 mW. The diameter of the laser beam focused on the surface of the sample is equal to 1 mm. All spectra were recorded with a resolution of 1.0 cm−1. The spectra were processed using the Horiba Lab Spec 5.0 and Origin 8.1 software package. Errors of determining the frequencies, widths, and intensities of the lines were ±1.0, ±3.0 cm−1, and 5%, respectively. The method of recording PILS and conoscopic patterns is described in detail in [21,54].
2.3. Particularities of Raman Spectra of Real LiNbO3 Crystals with Different Chemical Composition
The rhombohedral unit cell of the ferroelectric phase of a perfect LN crystal is characterized by a spatial symmetry group C3V6 (R3c) and contains two formula units [2,5]. Such a non-centrosymmetric structure is polar and is characterized by spontaneous polarization. Its value depends on the state of the secondary structure, in particular, on the ordering of the structural units of the crystal cationic sublattice [1,2,5].
Table 1 demonstrates vector V, pseudovector Ṽ of asymmetric tensor of the second rank [V]2, the third rank tensor [V]2 × V and the optical representations Topt of the C3V6 point symmetry group, as well as the number n0 of ions remaining in their sites (up to pure translations) when symmetry of the C3V6 (R3c) space group is transformed. The right part of the Table 1 reveals components of the vector ai, a symmetric second-rank tensor aij, and a third-rank tensor aijk, symmetric with respect to the first two indices. As follows from the Table 1, the representations V (vector), Ṽ (pseudovector), [V]2 (symmetric square of the vector representation), [V]2 × V, and Topt (optical representation) for the ferroelectric phase of lithium niobate and tantalate are
V = A1(Z) + E(X, Y)
Ṽ = A2 + E(X, Y)
[V]2 = 2A1(Z) + 2E(X, Y)
[V]2 × V = 4A1(Z) + 2A1 + 6E(X, Y)
Topt = 4A1(Z) + 9E(X, Y) + 5A2
The tensors ai, aij, aijk define the selection rules for the processes of IR absorption, Raman, and hyper-Raman light scattering, respectively. Optical modes of A1(Z) type are polar vibrations of ions along the ferroelectric axis Z. Modes of E(X, Y) type correspond to vibrations perpendicular to this axis. Vibrations of A2 type belong to the pseudoscalar type of symmetry that is prohibited by the selection rules for the processes of IR absorption and Raman scattering but is allowed for hyper-Raman scattering processes. Tensor of Raman scattering for optical modes allowed by the selection rules has the form:
In accordance with the results of group-theoretical analysis (see Table 1 and ratios 1–5), we should expect the appearance of transverse TO and longitudinal LO optical modes A1(Z) (TO, LO) and E(X, Y) (TO, LO) as well as polariton states in the Raman spectra of a non-centrosymmetric LN crystal. The Raman spectrum of polariton states depends on the angle of collection of the scattered radiation. Pseudoscalar modes of A2 type are forbidden for a perfect LN crystal IR and Raman spectra, but they are allowed in the hyper-Raman spectrum (Table 1). According to the data of group-theoretical analysis for a perfect LN crystal, the phonon dispersion curve has 30 oscillatory branches; 27 of them are optical and 3 are acoustic [5,36,55,56,57,58]. Since there is no alternative prohibition, due to absence of an inversion center, Raman active optical vibrations must also manifest themselves in IR absorption spectra. 4A1 + 9E dipole active fundamental oscillations are active in Raman scattering and IR absorption at k = 0 (in the center of the Brillouin zone) [5,36,55,56,57,58]. All optical vibrations (except A2) have a polar nature, thus they are split in the crystal into longitudinal (LO) and transverse (TO). A2 oscillations related to the pseudoscalar type of symmetry are forbidden in the vibrational spectrum of a perfect LN crystal at k = 0. They are also not dipole-active and do not experience LO-TO splitting [5,55,56]. However, A2 symmetry type oscillations are allowed for the processes of hyper-Raman scattering [56].
According to the selection rules for the space group of symmetry C3V6 (R3c), taking into account the LO-TO splitting at k = 0, 26 bands should appear in the Raman spectrum of a perfect LN crystal. These bands correspond to the fundamental vibrations of A1 and E type of symmetry. Besides, there are 2 acoustic (A1 + E) and 5A2 optically inactive fundamental oscillations as well as polariton states. Acoustic and A2 oscillations are not supposed to appear in the Raman and IR absorption spectra. The Raman spectrum of polaritons depends on the angle of collection of scattered radiation [5,55]. As numerous studies show, significantly more bands are observed in the Raman spectra of real crystals than allowed by the selection rules for a structure characterized by the spatial symmetry group C3V6 (R3c) with two formula units per the unit cell [5,11,36,37,38,39,40,41,42,55,56,59,60,61,62,63,64,65,66,67]. In addition to the bands corresponding to the fundamental lattice vibrations, a number of low-intensity bands are observed in the spectrum—the so-called extra bands. These bands are not provided by the selection rules, and their interpretation and attribution are difficult [5]. A number of important points are the subject of discussions and are of interest for further experimental and theoretical studies, despite the large number of studies of the Raman spectra of LN crystals with different chemical composition at the present time. These include determining the reasons for appearing of extra bands in the spectra and detection of bands corresponding to pseudoscal A2 symmetry type oscillations. The latter are predicted as a result of ab initio calculations [57,58] but are forbidden by the selection rules at k = 0 both in the Raman and in the IR absorption spectra for a perfect LN crystal structure.
It was established experimentally that only the bands corresponding to fundamental lattice vibrations are observed in the Raman spectrum of a nominally pure SLN crystal (R = Li/Nb = 1), which has the most ordered cation sublattice [5,25,26,27,57]. Extra bands are absent from the spectrum of SLN crystal. All 26 bands (corresponding to the fundamental A1 (TO, LO) and E (TO, LO) phonons) were experimentally detected and reliably interpreted in the Raman spectrum of a SLN crystal [5,37,38,39,59]. Low-intensity bands 180 and 610 cm−1, corresponding to fundamental E (TO) vibrations of symmetry type, disappear in structural disordering effects and are not observed in spectra of LN crystals with a composition different from stoichiometric [5,37,38,39,59]. These bands appear only in the spectrum of a high perfect SLN crystal. This crystal has a highly ordered cation sublattice close to the perfect structure.
When the composition of the LN crystal deviates from stoichiometric, for example, for congruent and doped crystals, a number of low-intensity extra bands not corresponding to the fundamental vibrations are observed in the Raman spectrum [5,11,36,37,38,39,40,41,42,43,44,45,46,47,56,59,60,61,62,63,64,65,66], Figure 1. The extra bands with frequencies 85, 92, 100, 120, 187, 305, 331, 412, 477, 535, 605, 668, 690, 739, 743, 825 cm−1 fail to fit the interpretation of the spectrum within the framework of fundamental oscillations and are not attributed to any known scattering processes. Frequencies of low-intensity extra bands do not coincide with frequencies of fundamental oscillations, and their intensity is almost two orders of magnitude less. The intensity of extra bands increases with an increase in the deviation of the crystal composition from the stoichiometric one [5]. The nature of the extra bands has not been established by now. There is a reason to suppose that the appearance of extra bands is due to the deviation of its composition from the stoichiometric one and the peculiarities of its secondary structure. Features of the secondary structure are probably associated with the formation of clusters and nanodomains of a certain type.
It is important to find out whether optically inactive A2 symmetry vibrations, forbidden by the selection rules for the C3V6 (R3c) space group, appear in the Raman spectrum of real heavily doped LN crystals. Note that doping by concentrations close to threshold and higher leads to the strongest disorder in the cation sublattice and the greatest difference of the clusters structure from the main crystalline matrix. This may be possible due to the fact that the structure inside clusters of a sufficiently large size may no longer correspond to the spatial group C3V6 (R3c) at certain localization of the dopant in the LN crystal lattice.
3. Results
3.1. Point Defects, Clusters, and Domains in Real LN Crystals
General thermodynamic concepts allow us to consider the formation of self-similar micro- and fractal-type nanostructures in LN crystals. These processes relate to different types of defective structure regardless of the specific physical mechanisms that generate it. Self-organization of a defective structure can occur at different scale levels and stages as a result of of the technological process of obtaining a crystalline material and an intense high-energy effect on the already grown LN crystals. The growth of LN crystals by Czochralski always takes place at a greater or lesser distance from the thermodynamic equilibrium. The formation of nano- and microstructures of the fractal type is especially characteristic of heavily doped LN crystals. Analysis of crystal growth processes and further study of their growth structure allows us to describe the ability of the system to self-organize. For example, complex non-equilibrium micro- and nanostructures of the fractal type are formed in an LN crystal during a non-equilibrium melt crystallization [6,13,32]. They are usually difficult to reproduce (Figure 2a). At the same time, the formation of micro- and nanostructures in crystals in the region of relatively low temperatures (TRoom < T < 140 °C) can occur under high-energy effects, for example, under an intense flow of external energy. This effect can be in the form of large doses of ionizing radiation (γ radiation) high power. The domain microstructures of the fractal type (Figure 2a) were found in a LiNbO3:Tm crystal. The crystal is grown under conditions that are far from thermodynamic equilibrium. Self-similar domain microstructures of the fractal type, spatially oriented along the direction of the Y axis of the hexagonal crystallographic symmetry, were also found in nominally pure LiNbO3 crystals. They are irradiated with large doses of γ-radiation from the Co60 source, Figure 2b.
Domain microstructures presented on Figure 2a, have properties of self-similarity at different scale levels and can be identified as fractals. Self-similar domain microstructures of the fractal type in the LiNbO3:Tm crystal are spatially oriented along the three Y-directions of the hexagonal crystallographic symmetry, Figure 2a. Such spatial self-organization of domains is associated with the pinning of domain walls on defects arising during non-equilibrium crystallization of a doped melt—gradients of a dopant distribution, as well as dislocations. Their arrangement follows the symmetry of the unit cell of a LN crystal, in accordance with Curie’s principle. Judging by the crystallographic orientation of self-similar structures in the LiNbO3:Tm crystal, they were formed during the growth process. Probably, the fluctuations of the crystal growth rate occurred at a relatively high concentration of the dopant. At the same time, doping ions diffusing from the melt to the interfacial surface occupied the most favorable areas for growth—the edges of the steps, which coincided with the direction of the rhombohedral faces, and the latter had the highest growth rate.
Single microdomains with a size of about ~1 to 2 μm are observed in both doped and nominally pure CLN crystals. Single microdomains have a hexagonal shape in a plane perpendicular to the polar Z axis (Figure 3a). Hexagonal microdomains are complex formations. They have their own fine structure. The splitting of a hexagonal microdomain ~1.6 μm in size into separate nanostructured layers is clearly seen on Figure 3a. The splitting occurs in the direction of the polar axis Z. Microdomains of a triangular shape (Figure 3b), wedge-shaped microdomains (Figure 4) and “finger” domains (Figure 2) are observed in LN crystals. “Finger” domains are oriented along the Y directions and form self-similar domain microstructures of a fractal type.
CLN crystals with a regular domain structure (RDS) doped with REE can be obtained under substantially unequilibrium thermal conditions. A RDS is formed along the polar axis. Its step is determined by the ratio of the speed of extrusion and rotation of the crystal and ranged from ~100 to 1 μm, Figure 5.
Periodic nanoscale structures of the fractal type with a step from 10 to 100 nm were detected by atomic force microscopy for these crystals in the region of periodic regular domain structures (on negative domain walls). Periodic splitting occurs both in the direction parallel and perpendicular to the polar axis of the crystal. Periodic structural formations with a volume of several hundred unit cells appear in the crystal, Figure 6, Table 2. The detected structures have clear signs of spatial self-organization. They possess self-similarity properties at different scale levels and can be identified as fractals.
Regular domain structures can also be formed in a plane that is perpendicular to the polar Z axis. Figure 7 and Figure 8 show that the boundaries of such domains are blurred and cut up. At the same time, there are areas with a strictly regular domain structure (Figure 7b and Figure 8b) on the periphery of the crystal plates. The period of RDS Λ decreases from the center of the plates to the edge: for crystals grown in highly unsteady conditions, from 23 to 14 μm over the average length of the RDS region of ~2 mm, and for crystals grown under conditions close to equilibrium, from 46 to 38 μm over the average length of the RDS region ~1.5 mm. The presence of RDS in the edge part of the plates, cut perpendicular to the growth axis, is typical of most heavily doped LN crystals, thus it is natural.
Impurity phases sometimes separate with incoherent, semi-coherent, and coherent boundaries in heavily doped and near-stoichiometric LN crystals, Figure 9, Figure 10, Figure 11, Figure 12 and Figure 13.
The structural defects of the macro-, meso-, micro-, and nanolevels can affect the Raman scattering in nominally pure and doped LN crystals. This influence is noticeable, however, difficult to interpret. Domains that we have revealed on Figure 2, Figure 3, Figure 4, Figure 5, Figure 6, Figure 7, Figure 8, Figure 9, Figure 10, Figure 11, Figure 12, Figure 13 and Figure 14 are only bigger part of the hierarchy of different defects forming in LN crystal during crystallization under highly non-equilibrium conditions and energy dissipating. At this, macro-domains (sizes of which are comparable with sizes of the samples that we have used in our research) in general usually have the structure similar to the structure of a crystal matrix. However, such macro-domains have microstructure that consists of fractal-like micro-domains. They themselves obviously cannot cause appearance of extra Raman bands. However, periodically poled structures have their own substructure. We have observed it by SPM to the size scale 5–10 nm. For example, on LN:REE crystals we have observed the following: On negative domain walls (Figure 5) we have detected periodic nano-size structures with a step 10–100 nm, Figure 6. Figure 6 clearly shows that periods are directed both along and perpendicular to the crystal polar axis. Thus, LN crystals contain periodic structures several hundred unit cells in volume. Formation of such structures is not connected with growth processes that cause growth strips. These periodic nano-size structures are not domains in the common sense. Formation of these defects is probably caused by ordering of clusters that form around intrinsic and doping defects during crystallization in non-equilibrium state. Boundaries between such nano-structures probably have some charge (at least in non-equilibrium state, for example, during heating or leaching). Otherwise, leaching could not have been able to reveal them. Such separate nano-domains (Figure 3) could possibly have even smaller intrinsic structure. The more unordered the structure is (as in non-stoichiometric LN crystals), the more substructures are formed in the materials.
3.2. Raman Spectra, Conoscopic Patterns, and Photoinduced Light Scattering in Nominal Pure and Heavily Doped LiNbO3 Crystals
Figure 14 and Figure 15 show fragments of Raman spectra of a nominally pure CLN crystal and heavily doped (with a dopant concentration near the main concentration threshold) LiNbO3:Zn (4.5 mol.% ZnO), LiNbO3:Mg (5.01):Fe (0.005), LiNbO3:Mg (5.1), LiNbO3:Mg (5.3 mol.% MgO). The spectra geometries are Y(ZZ)Ȳ and Y(ZX)Ȳ; vibrations of the A1(TO) and E(TO) symmetry types are active. Figure 16 and Figure 17 demonstrate conoscopic and PILS patterns of of the investigated crystals.
Conoscopic patterns of crystals correspond to patterns of a highly perfect single axis crystals. An increase in the laser radiation power density p from 0.039 to 3.54 W/cm2 (Figure 16) leads to a certain increase in contrast and image clarity, but does not introduce significant interference anomalies into conoscopic patterns. Figure 16 and Figure 17 show that doping with magnesium cations suppresses the effect of photorefraction in an LN crystal. In a double doped crystal (Fe: Mg), concentrations of magnesium are close to the second concentration threshold (5.5 mol.% MgO). However, photorefractive effect is almost absent in the crystal; the “photorefractive” Fe3+–Fe2+ have a minor effect on the photorefraction, contrary to the effects caused by iron in singly doped crystals. The PILS indicatrix is impossible to excite even at relatively high powers density of laser radiation (6.29 W/cm2). Only a insignificant circular scattering appears. This indicates the smallness of the photorefractive effect.
Crystal LiNbO3:Zn (4.5 mol.% ZnO) deserves special attention. Studies of zinc-doped LN crystals with a small concentration step (0.2 mol.%) showed that heavily doped LiNbO3:Zn crystals are the most optically and compositionally uniform in the concentration range ≈4.0–6.5 mol.% ZnO, i.e., between concentration thresholds at ≈3.0 and ≈6.76 mol.% ZnO [6]. At this, the most complete suppression of photorefraction occurs at concentrations above the second concentration threshold at ≈6.8 mol.% ZnO in the crystal. However, LiNbO3:Zn crystals with concentrations greater than ≈6.8 mol.% ZnO are characterized by low optical and compositional uniformity and high probability of precipitation of the Li6ZnNb4O14 mixed phase [6]. Thereby they are not suitable for practical applications as high-quality non-linear optical materials. It is better to use crystals with a concentration of ≈4.0–6.5 mol.% ZnO, i.e., crystals with a zinc concentration between the main concentration thresholds at ≈3.0 and ≈6.76 mol.% ZnO as non-linear optical materials with the lowest photorefraction effect. According to PILS data, LiNbO3:Zn crystal (4.5 mol.% ZnO) has the lowest photorefractive effect, Figure 17. A significant shift of the optical transmission edge to the shortwave region was detected in an LiNbO3:Zn crystal (4.5 mol.% ZnO), when compared with other Zn-doped crystals. This shift indicates a higher structural uniformity of the crystal compared to other LiNbO3: Zn crystals.
Table 3 shows frequencies of experimentally observed bands and calculated data for the LiNbO3 crystal. The data were obtained by ab initio calculations [57,58] and in the approximation of the valence-force field [68]. Table 3 shows that frequencies of bands corresponding to fundamental oscillations coincide well within the experimental errors in Raman spectra of SLN and CLN crystals, but SLN Raman bands are significantly narrower than that of the other crystals [5,36,37,38,39,59].
We observed only the bands corresponding to the fundamental lattice vibrations allowed by the selection rules for the space group C3V6 (R3c) in Raman spectrum of the SLN crystal. Low-intensity bands, which characterize the spectra of non-stoichiometric crystals (Figure 1) [5,11,36,37,38,39,40,41,42,43,44,45,46,47,56,59,60,61,62,63,64,65,66,67], were not found (Table 3). We observed only bands corresponding to the fundamental oscillations of the E(TO) symmetry type (Table 3) in the scattering geometry Y(ZX)Ȳ for all the studied crystals. Extra bands were not detected. The band with a frequency of 630 cm−1 is clearly manifested in the geometry Y(ZX)Ȳ on the shoulder of the intensive band 580 cm−1 (8E(TO), Figure 14). The 630 cm−1 band corresponds to the 4A1 (TO) oscillation and is manifested due to the photorefractive effect [5,36]; 180 and 610 cm−1 bands correspond to the E(TO) fundamental vibrations (Table 3). These two low intensity bands are located on the shoulders of high-intensity bands and are observed only in the spectrum of highly perfect SLN crystal. 180 and 610 cm−1 bands are masked with effects of structural disordering and are not observed in spectra of non-stoichiometric crystals [38,39,59].
LN Raman spectra in the Y(ZZ)Ȳ polarization geometry must contain only fundamental A1 (TO) vibrations. At the same time, we discovered much more bands than is allowed by the selection rules in the spectrum of crystals CLN, LiNbO3:Zn (4.5 mol.% ZnO), LiNbO3:Mg: Fe (5.01; 0.005), LiNbO3:Mg (5.1), LiNbO3:Mg (5.3 mol.% MgO) in this geometry (Figure 14 and Figure 15, Table 3). In addition to bands corresponding to the fundamental oscillations for the studied crystals at 100 K, extra bands with frequencies of 104, 120, 209, 230, 298, 337, 694, 880 cm–1 were observed. Their intensity is much less than the intensity of fundamental bands. 209, 230, 298 cm−1 bands are observed only in the Raman spectrum of heavily doped crystals when the concentration of the doping element is close to the threshold. Earlier, the manifestation of low-intensity extra bands in different polarization scattering geometries in Raman spectrum of the SLN crystal was reported in detail in [5,11,36,37,38,39,40,41,42,43,44,45,46,47,56,59,60,61,62,63,64,65,66,67]. A review of research is given in [5,11]. Since the frequencies of these extra bands (85, 92, 103, 117, 187, 305, 331, 412, 477, 535, 605, 668, 690, 739, 743, 825 cm−1, T = 293K) are well known in the literature (Figure 8) [5,11,36,37,38,39,40,41,42,43,44,45,46,47,56,59,60,61,62,63,64,65,66,67] for nominally pure CLN crystals of different origin, then in the Table 3 they are not given. Experimental data show that Zn2+ cations affect the LN structure less rigid than Mg2+: zinc cations cause significant local distortions of the structure which manifest themselves in Raman spectrum at higher concentrations than Mg2+ cations, Figure 14.
The most likely reason for the appearance of extra bands is errors of polarization measurements and effect of photorefraction. These phenomena are a possible cause of the manifestation of forbidden fundamental oscillations of A1 (LO) and E (TO, LO) symmetry types in the scattering geometry Y(ZZ)Ȳ where only A1 (TO) vibrations are active. Mixed phonons may also appear due to the photorefractive effect [5,11,36,56]. Effect of photorefraction in studied heavily doped crystals is substantially less than in nominally pure crystals [6,39,42,43,44,59]. Thereby effect of photorefraction cannot serve as an explanation for this phenomenon. Of course, we can try to attribute the 230 cm−1 band to forbidden fundamental oscillations of the E (TO) symmetry type, which manifest themselves in geometry Y(ZZ)Ȳ; 298 and 880 cm−1—to forbidden fundamental oscillations of A1 (LO) and E (LO) symmetry types. The 235, 298, and 880 cm−1 bands are intense in the spectrum of nominally pure LN crystals in scattering geometries, where oscillations of the E (TO), E (LO), and A1 (LO) symmetry types should manifest themselves. These bands were observed in many works and are reliably attributed to the fundamental oscillations of E (TO), E (LO), and A1 (LO) symmetry types [5,11,36,37,38,39,55,56,57,58,59,60,61,62]. Actually, there are two bands with frequencies near 880 cm−1 that correspond to A1 (LO) and E (LO) phonons [5,36,37,55,56,57,58]. A low-intensity 694 cm−1 band was previously observed in the Raman spectrum of a nominally pure CLN crystal [5,36,37,63,64]. Its attribution is still discussed [5,63,64]. Besides, we found a low-intensity extra band with a frequency of 327 cm−1 at 100 K in Raman spectrum of a CLN crystal near the 340 cm–1 band (3A1 (TO)). It is important that the detected band does not relate to a fundamental oscillation. The 327 cm−1 low-intensity extra band disappears in effects of structural disordering and is not observed in the spectrum at higher temperatures and of doped crystals, Figure 15.
Figure 18 shows Raman spectra in scattering geometries Y(ZZ)Ȳ and Y(ZX)Ȳ of nominally pure SLN and CLN, as well as doped LiNbO3:Zn (0.07, 5.84 mol.% ZnO) and LiNbO3:Er (2.67 mol.% Er2O3).
The 880 cm−1 band of is reliably attributed to forbidden fundamental vibration of A1(LO) symmetry type—stretching bridge vibration of oxygen atoms Nb-O-Me (Me-Li + or dopant) along the polar axis in the scattering geometry Y(ZX)Ȳ. However, this band also appears as an extra band in other scattering geometries, for example, in scattering geometry Y(ZZ)Ȳ (Figure 18a). Figure 18c shows the transformation of the shape of 880 cm−1 Raman band with a change in the composition of LN crystal and its complex contour. The contour separation program analysis revealed only one band in spectra of SLN, CLN, and LiNbO3:Zn (0.07 mol.% ZnO) in the region of stretching bridge vibrations of oxygen atoms along the polar axis (Figure 18, curves 2–4). Note that concentration of Zn-doped crystal in this case is relatively small. Two 873 and ≈900 cm−1 bands are clearly observed in the spectrum of congruent crystals doped with relatively large amounts of impurity ions (in our case, Er) in the region of the stretching bridge vibrations of oxygen atoms along the polar axis (Figure 18c, curve 1). A 900 cm−1 band is highlighted separately with a dotted line on the Figure 18c.
Thereby, nominally pure and lightly doped LN crystals demonstrate single-mode behavior within the homogeneity region. LN crystals show signs of two-mode behavior in the case of relatively high concentrations of dopants. Such a situation is possible when cations of the same type are located in different sites in oxygen octahedra due to the clusterization of the main and doping ions in the cation sublattice. This fact confirms the existence of superstructure ordered sublattices of cluster-like defects of different types; otherwise, it would be not a splitting but only a broadening of the corresponding band.
A low-intence 152 cm−1 band corresponds to fundamental vibration of 1E(TO) symmetry type (Table 3, Figure 15). It is forbidden for the Y(ZZ)Ȳ scattering geometry and reveals due to polarization measurement errors. A low-intensity 120 cm–1 band is observed in the low-frequency region of the Raman spectrum (Figure 15). The band intensity increases with an increase in temperature [5,36,37,39,55,56]. This band corresponds to quasi-particle oscillations—two-particle states of acoustic phonons with a zero total wave vector [5]. This band is split into two with frequencies of ~104 and 117 cm−1 in spectra of highly ordered LN crystals ( Figure 15 and Figure 19) [5,37]. The 120 cm−1 band nature is discussed in [69]. The intensity of this band is sensitive to very insignificant changes in the composition (including the number of NbLi defects) and fine features of the LN crystal structure. This feature allows the band to be an accurate experimental criterion stoichiometry of a LN single crystal composition [5,37,39].
The other spectroscopic criterion for stoichiometry of LN composition is only one band in OH-groups stretching vibrations area of its vibrational spectrum [10]. Appearance of complex defects with OH groups leads to splitting of this band into several components even at strictly stoichiomertic (Li/Nb = 1) composition [10,26,27,28,70]. The number of components depends on particularities of protons localization in LN crystal structure.
There is no certain opinion in the literature about 120 cm−1 band attribution. Authors of studies [60,65] associate it with phonons of E symmetry. The latter are forbidden in the scattering geometry X(ZZ)Y but manifest in it due to internal stresses in the crystal. The authors of the study [61] associated the origin of the band with the scattering of radiation on the different optical phonons of A1 (soft mode) and E symmetry type. Authors of [61] believe that the interaction of phonons of different symmetry is possible due to violation of the selection rules for E-type phonons. Violation of the selection rules is caused by intrinsic and impurity defects characteristic of a LN crystal. At the same time, they interpret the band in the region of 120 cm−1 as a zone of different tones of three low-frequency branches of A1 and E symmetry type optical oscillations. Thus, the region of 120 cm−1 should not contain a band at low temperatures, since the intensity of the difference tones in this case is zero. This opinion was taken as the main one until recent times. Later detailed measurements of the temperature evolution of the spectra in polarized radiation with different scattering geometries, performed in [55], suggested that a band in the 120 cm−1 region corresponds to two-phonon acoustic excitations: the pattern of the Raman spectral intensity distribution in the low-frequency region is characteristic of Fermi phonon resonance. The manifestation of two-phonon acoustic excitations in the Raman spectrum is explained by the effective attraction between acoustic phonons. The attraction takes place considering the anharmonic interaction of the lowest-frequency optical A1 symmetry type phonon (254 cm−1, quasi-soft mode) with a two-phonon acoustic continuum [61].
We used the intensity of the 120 cm−1 band when developing the obtaining technology of SLN(K2O) by HTTSSG method. Potassium does not incorporate into the LN structure due to the large ionic radius. Figure 20 shows the approach of a LN crystal to a stoichiometric composition with an increas in K2O concentration in the melt. When the content of K2O in the melt is 6.0 wt. %, ratio Li/Nb = 1 and the crystal composition corresponds to the stoichiometric. The stoichiometric crystal is characterized by a zero intensity of the 120 cm−1 band and minimal values of the Raman bands widths, Figure 20.
Stoichiometric crystals grown by the HTTSSG method with the addition of K2O flux are characterized by a uniform refractive index along the growth axis. At the same time, crystals grown due to a conventional technology from the melt with 58.6 mol.% Li2O are characterized by ununiformity of the refractive index along the growth axis. Such crystals are unsuitable for practical applications.
The periodic (discontinuous) structure of the laser beam along the direction of its propagation is observed in SLN crystal, Figure 21. At the same time, LN crystals are not gyrotropic. The discontinuous structure of the laser beam is not observed in non-stoichiometric crystals or in a stoichiometric crystal grown by the HTTSSG method. The high intensity of laser radiation in the region of the focal waist can lead to the formation of bound states of two photons (baundtons) [71]. The latter move in a crystal and break up into two photons. Thus, the discontinuous trajectory of the laser beam can be realized not only in gyrotropic crystals. This effect may be due to the formation of bound states of two photons as a result of various nonlinear-optical processes: two-photon absorption, stimulated Raman scattering, etc. [71]. The periodic structure of a laser beam in a crystal does not affect the Raman spectrum corresponding to the fundamental oscillations of the LNcrystal lattice.
Extra bands with frequencies 209, 230, 298 cm−1 are observed only in Raman spectra of heavily doped crystals LiNbO3: Zn (4.5 mol.% ZnO), LiNbO3:Mg:Fe (5.01; 0.005), LiNbO3: Mg (5.1), LiNbO3: Mg (5.3 mol.% MgO), (Figure 14 and Figure 18a). Their intensity depends on the crystal composition and increases as the concentration of dopants approaches threshold. These bands are not observed in the spectrum of nominally pure crystals. At the same time, various authors observed a sufficiently large number of other extra bands in the Raman spectrum of congruent crystals (85, 92, 100, 120, 187, 305, 331, 412, 477, 535, 605, 668, 690, 739, 743, 825 cm−1 (Figure 1). These extra bands did not correspond to the fundamental lattice vibrations [5,11,36,37,38,39,40,41,42,43,44,45,46,47,56,59,60,61,62,63,64,65,66,67]. There may be several reasons for the appearance of extra bands in the Raman spectrum of nonstoichiometric (nominally pure and doped) LN crystals. Polarization measurement errors are not the only reason. Strong phonon-phonon interaction is characteristic of defective and anharmonic crystals, such as LN. This can lead not only to the broadening of bands corresponding to the fundamental lattice vibrations but also to the appearance of new bands in the spectrum. This happens because quasiparticles are formed from interacting phonons (optical and acoustic) and mix one-phonon with two-phonon states due to Fermi resonance [5,72]. First of all, quasiparticles with a zero total wave vector should manifest themselves in the processes of Raman and IR absorption, [5,36,55,56]. Regulation of the conditions of anharmonic interaction can be carried out either by varying the order of cations in the cation sublattice or by changing the temperature [5,55]. With an increase in temperature (as well as an increase in the disordering of the structural units of the cation sublattice), maxima of 104 and 119 cm−1 merge into a wide maximum with a frequency of 120 cm−1. [5,39,55]. This is a confirmation of the anharmonic nature of these Raman bands.
The phases of other lithium niobates are likely to precipitate as microstructures, and the crystals are multiphase in heavily doped crystals, Figure 9, Figure 10, Figure 11, Figure 12 and Figure 13. However, none of the possible phases of other lithium niobates (LiNb3O8 or Li3NbO4) that may precipitate during crystallization of LiNbO3 (lithium metaniobate) [5] does not have bands with frequencies 209, 230, 298 cm−1 or close to it in its Raman spectrum [4,5,37,73]. At the same time, according to the data of study [51], the precipitation of the Li6ZnNb4O14 phase is possible in the form of microinclusions at dopant concentrations above the threshold.
The appearance of extra bands in the Raman spectrum can be caused by chaotic disturbances of perfect cation sublattice, such as point defects NbLi, Li□, Nb□, and other. Such chaotic violations should lead to the dephasing of oscillations in the crystal [5,74,75,76,77]. At this corresponding atoms of each unit cell of the crystal cease to oscillate in phase. The “opening” of the Brillouin zone is possible [74,77] at high dopant concentrations in the structure when point defects NbLi, Li□, Nb□ and other are located randomly. Then, the observation has access not only to the limiting (kp = 0) frequencies of the optical branches, but also to other frequencies in the Brillouin zone in the Raman spectrum with an intensity proportional to the concentration of defects. Frequencies in the Brillouin zone are determined by the wave vector spread |Δk|~2π/l [74,77]. Taking into account the small dispersion of optical branches [5], this can lead to the appearance in a LN crystal spectrum of rather narrow additional (extra) bands that are not allowed by the selection rules for a given spatial group. Due to numerous literature data (the review is given in [5]), when R = Li/Nb decreases, several changes occur in Raman spectra: widths of bands corresponding to fundamental lattice vibrations of nominally pure crystals increase; widths of extra bands in the 120 cm−1 region also increase (this band corresponds to the two-particle states of acoustic phonons with a zero total wave vector). At the same time, the spectrum fully retains its individuality [5,11,36,39].
Factors listed above and the increase in the number of spatial defects in the form of clusters and microstructures with a structure distorted compared to the crystal matrix (i.e., an increase in the microheterogeneity of the crystal) can lead to significant local changes in the crystal symmetry. Bands may appear that correspond to forbidden acoustic optical vibrations of (A1 and E) and A2 symmetry type in the Raman spectrum. The distortion of the perfect structure of a LN crystal is especially significant at high concentrations of doping metals close to threshold values. The whole spectrum of fundamental oscillations of a crystal should be radically broadened and significantly deformed for such strongly deformed structures. This is observed experimentally, Figure 14. Thus, it is important to compare the frequencies of experimentally observed 104, 119, 209, 230, 298, 694, 880 cm−1 bands in the Raman spectrum of non-stoichiometric LN crystals (Table 2) with calculated data.
The LN crystal lattice dynamics was analyzed both by ab initio methods [57,58] and in the valence-force field approximation [68]. Results of ab initio calculations of frequencies, vibration modes, atomic coordinates, and unit cell parameters turned out to be very close to the experiment [57,58]. Ab initio calculations give the unit cell parameters: a = 5.1378 Å и c = 13.4984 Å. This is only 2% to 3% less than the experimental values. The discrepancy between the frequencies calculated in [57,58] and those experimentally observed by us of A1 (TO) and E (TO) of types symmetry does not exceed 5%. This indicates a high accuracy of ab initio calculations. Fundamental oscillations of A2 symmetry type calculated ab initio in [57,58] in the center of the Brillouin zone (k = 0) and prohibited by the selection rules for the space group C3V6 (R3c) are listed in Table 3 and labeled by 2. Table 3 shows that there is a satisfactory coincidence of the frequencies of the experimentally observed low-intensity extra bands with frequencies of 209, 230 and 880 cm−1 and vibration frequencies of 1A2, 2A2, 5A2 symmetry type calculated ab initio. At the same time, there is a serious discrepancy between the calculated frequencies of 3A2 and 4A2 and the experimentally observed bands with frequencies of 298 and 694 cm−1, Table 2. Unfortunately, it is impossible to calculate the frequency of A2 the symmetry type oscillations prohibited by the selection rules in the approximation of the valence-force field [68].
Raman spectra that we studied clearly show that doped LN crystals have super-structure lattice of cluster defects several unit cell in diameter (which are probably the structure elements revealed on Figure 6). Thus we conclude that LN crystals grown in conditions far form thermodynamic equilibrium have periodic fractal-like structures ~1 nm to 1000 μm. Thus, when we write that extra Raman bands appear because of domains we mean not classic ferroelectric domains that have spontaneous polarization and structure of the domains is identical to the structure of matrix lattice. We mean micro- and nano-structures and clusters connected with classic domains (as on Figure 2, Figure 3, Figure 4, Figure 5, Figure 6, Figure 7, Figure 8, Figure 9, Figure 10, Figure 11, Figure 12, Figure 13 and Figure 14). The exact nature of these structures is unfortunately yet unclear. Intrinsic structure of such clusters is different from that of a crystal matrix. We believe that it is these clusters and these nano-structures that cause appearance of low-intensity extra Raman bands.
3.3. X-ray Studies of Super-Structures in LiNbO3 Crystals
The presence of some extra bands in the LN Raman spectrum may be due to the formation of a superstructural ordered sublattice of defects in the structure of the LN crystal, which provides its own Raman spectrum. This is possible due to the fact that LN is a nonstoichiometric phase of variable composition with a wide range of homogeneity on the phase diagram and has a widely developed defect structure [2,5,22,48]. Thus, precision X-ray studies of LN crystals of different composition are important [48].
Figure 22 shows X-ray diffraction patterns of crystals CLN, LiNbO3:Er (0.062 mol.% Er2O3) and LiNbO3:Zn (6.52 mol.% ZnO). The areas of additional reflections are marked separately. Radiographs of all the investigated crystals are similar. The first reflection, corresponding to the R3c phase of LiNbO3, appears on radiographs at a scattering angle of 23.7°. This reflection is most intense. Additional lines are observed in the regions of scattering angles from 11° to 22° and from 25.3° to 31° on all the X-ray patterns obtained, in addition to the main reflections of the LiNbO3 phase. The most intense maximum corresponds to the scattering angle ~11.8°. Table 4 shows results of calculating the scattering angles and interplanar distances for additional bands on the X-ray patterns of the investigated crystals CLN, LiNbO3:Er (0.062 mol.% Er2O3) and LiNbO3: Er (2.67).
Extra bands appear not only on X-ray patterns of doped crystals (characterized by the most disordered cation sublattice) but also on X-ray patterns of CLN. This means that these reflections are not the result of doping. The distribution of the intensity and positions of additional reflections barely change with an increase in the concentration of the doping impurity in all the samples studied.
The entire set of additional reflections was used to perform a qualitative phase analysis based on the ICSD database. The list of phases data available in the database is presented in Table 5. None of reflections of 5 phases given in the Table 5 coincide with the extra band positions on X-ray patterns of studied samples.
Probably, these extra bands are not reflections of the second phase but rather may result from the formation of an ordered superstructure in nonstoichiometric samples of LN. In order to verify this assumption, X-ray patterns were fully syndicated along with all extra bands. Above mentioned additional reflections are not displayed in the process of indexing in a hexagonal lattice with parameters a = 5.14941, c = 13.86186 Å (Table 5). The same result is fixed when indexing with parameters a’ = a, c’ = 2c. Thus, there are no atomic displacements along the c axis leading to a doubling of the c parameter. Weak extra bands were indexed as a result of indexing in a hexagonal syngony with a doubled a parameter of a unit cell: a’ = 2a, c’ = c. A typical result of the X-ray indexing is shown in Table 6. Reflections of the first and second order from the same system of planes are denoted by the same icons in the Table 6. The band with indices (226) (second order of reflection from planes (113)) falls into the region of overlapping reflections (330) and (421). Direct (auto) indexing performed in hexagonal syngony using the assumption of basic bands, but without the assumption of lattice period values, led to the same result: a’ = 2a, c’ = c. De Wolff criterion M20 was equal to 22 after clarifying the parameters obtained as a result of auto-identification. This indicates a high degree of reliability of results. An analysis of the values of the indices shows that all the weak bands are reflections of the first order from the planes of the main lattice.
Weak reflections observed on X-ray patterns of doped and undoped LN crystals are superstructural bands forbidden by the space symmetry group R3c of the lattice with parameters a = 5.1494 Å; c = 13.862 Å. The formation of a superstructure leads to a doubling of the a parameter of the unit cell, i.e., to a hexagonal lattice. The volume of its unit cell is 4 times larger. It is possible that numerous low-intensity extra bands (Figure 8) observed by many authors in the Raman spectrum correspond to the spectrum of fundamental oscillations of this superstructural hexagonal lattice. Two different unit cell shapes of a CLN crystal are possible: hexagonal (a = 5.150 Å, c = 13.816 Å) and rhombohedral (a = 5.482 Å, α = 56°08′).
3.4. Effects of Ordering of Structural Units of Cation Sublattice in LiNbO3:Zn Crystals and Their Manifestation in Raman Spectra
When doping a LN crystal with “non-photorefractive” Me cations (Me = Zn2+, Mg2+, Gd3+, In3+, etc.) following processes change non-monotonously: ordering of the structural units of the cation sublattice along the polar axis, deformation of the oxygen octahedra NbO6, the state of defectiveness of the crystal as a whole [3,4,5,6,14,15,16,37,73,78]. At the same time, pronounced anomalies are observed, indicating a “threshold” nature of the impurity cations incorporation into the structure on concentration dependences of physical characteristics at certain dopant concentrations [5,6,14,15]. For example, doping a congruent LiNbO3 crystal with Zn2+ cations leads to a change in the polarizability of the oxygen octahedra NbO6, parameters of the unit cell of the crystal and electro-optical characteristics [5,6,14,15,16]. The impurity incorporation mechanism has a “threshold” character and is determined by the concentration of Zn2+ [5,6,14,15]. The coefficients of a linear electro-optical effect in a LiNbO3:Zn single crystal are less than in a CLN crystal and show a minimum at concentrations of ~2–3 mol.% ZnO and a maximum at ≈7 mol.% ZnO [5,14]. At a concentration above 7 mol.% ZnO, the photorefractive effect is small and with a further increase in zinc concentration remains almost unchanged [5,6,14]. At a concentration of Zn2+ above 7 mol.%, point defects NbLi are completely absent, and Zn2+ cations in certain proportions occupy the main sites of Li+ and Nb5+ cations in an LiNbO3:Zn crystal [6,14].
It is important to investigate fine features of the concentration restructuring of the LiNbO3:Zn crystal structure before the first threshold concentration of Zn2+, i.e., in the concentration range 0–2 mol.% ZnO [15]. The greatest decrease in the photorefractive effect occurs in this area [5]. The photorefractive effect decreases from 3.1 × 10² to 6.6 × 10² W/cm2 in the concentration range 0–3 mol.% ZnO, and in the concentration range 5–7 mol.% Zn2+ photorefractive effect decreases from 7.1 × 10² to 9.8 × 10² W/cm2. The greatest change in the photorefractive effect is observed in the region of the first concentration threshold, and the smallest photorefractive effect is characteristic of the region of the second concentration threshold.
Figure 23 shows Raman spectra of SLN, CLN, LiNbO3:Zn (0–1.59 mol.% ZnO) single crystals in scattering geometries Y(ZX)Ȳ and Y(ZZ)Ȳ (the fundamental phonons of the E (TO) and A1 (TO) symmetry types are active, respectively, [5]). Changes in the main parameters of the bands (frequencies, widths, and intensities) depending on the composition of the crystal are presented in Table 7. Table 7 shows that frequencies of most bands practically do not change with a change in the composition of the crystal. This indicates the invariance of quasi-elastic oscillation constants. However, widths of bands change noticeably. Widths of all bands are minimal in the spectrum of a SLN crystal due to the most ordered cation sublattice.
In Table 7 v (cm−1) is a frequency, s (cm−1) is a bandwidth, I (%) is a relative spectral intensity. It calculates as an intencity of a studied band, relates to an intencity of 580 cm−1 band, [Zn] (mol.%)—concentration of Zn2+ cations in a crystal.
Concentration dependences of widths of many bands in the spectra of LiNbO3: Zn crystals have a minimum in the concentration region of 0.05–1.12 mol%, Figure 24. Figure 24 demonstrates that widths of some bands change nonlinearly with increasing Zn2+ concentration in a LiNbO3:Zn crystal. The bandwidths decrease in concentration ranges of Zn2+ 0–0.94 mol.%, and then they increase in concentration range of Zn2+ 0.94–1.59 mol.%. The minimum is the lowest for concentration dependences of band widths with frequencies of 156, 240, 268, 371, 434, 576 and 876 cm−1 (E (TO)) and 254 and 274 cm−1 (A1 (TO)). These frequencies correspond to the vibrations of the Nb5+ and Li+ cations in oxygen octahedra and vibrations of oxygen octahedra. A decrease in widths of bands with frequencies of 254 and 274 cm–1 corresponding to totally symmetric (A1 (TO)) vibrations of Nb5+ and Li+ ions along the polar axis, clearly indicates the ordering of the cationic sublattice of LN crystal along the polar axis in the concentration range of Zn2+ 0.05–1.12 mol%. A decrease in the width of a band with a frequency of 626 cm–1 corresponding to totally symmetric (A1 (TO)) vibrations of oxygen octahedra means that oxygen octahedra become more perfect, Figure 24.
There is a region of increased ordering of the structure in LiNbO3:Zn crystals (0.05–0.94 mol.% ZnO) when the order of alternation of the main, impurity cations and vacancies along the polar axis is increased in the cation sublattice, and the oxygen octahedra are close to perfect. The maximal ordering of the LiNbO3:Zn crystal structure the is observed at Zn2+ concentrations of ≈0.05–0.94 mol.% ZnO. At the same time, the band widths in the Raman spectrum of LiNbO3:Zn crystals ([Zn] ≈ 0.05–0.94 mol.% ZnO) are smaller than in the spectrum of a CLN crystal and approach widths of bands in the spectrum of the SLN crystal, Figure 24. This indicates a high degree of ordering of the structural units of the cationic sublattice of LiNbO3:Zn (0.05–0.94 mol.% ZnO) crystals and its approach to the degree of ordering of a SLN crystal. We obtained similar results earlier on Raman spectra for congruent lithium niobate crystals doped with Mg2+ and Gd3+ [5,78,79].
Our spectroscopic data for LiNbO3: Zn crystals ([Zn] = 0–1.59 mol.%) correlate well with the concentration dependence of the unit cell parameters determined by X-ray diffraction [5,80]. The minimum is observed in the concentration range 1–2 mol.% ZnO on the concentration dependence of the parameter c the unit cell. While, according to Vegard’s law, there should be an increase in the parameter c with an increase in the ionic radius of the dopant cation in comparison with the replaced cation of the matrix. The ionic radii of Zn2+, Li+, and Nb5+ are 0.74, 0.68, and 0.68 Å [5].
A low-intensity 682 cm−1 band is present in the spectra of CLN, LiNbO3: Zn etc. crystals (Figure 1, Figure 14, Figure 18 and Figure 23). Its manifestation, according to the data of [55], is due to the activity of biphonons in the Raman scattering. However, according to other studies [57,58,63,64], this band belongs to fundamental phonons of the A1 (TO) symmetry type. We did fail to find a band with a frequency of 682 cm−1 as well as a band with a frequency of 120 cm−1 (Figure 18) corresponding to two-particle states of acoustic phonons with a zero total wave vector equal in the Raman spectrum of a SLN single crystal.
Figure 24 and Figure 25 show that in the region of 0–1.12 mol.% ZnO width and intensity of the 682 cm−1 band monotonously increase with increasing Zn2+ concentration, and frequency, on the contrary, decreases. However, with a further increase in the Zn2+ concentration to 1.59 mol.%, there is a significant decrease in the band width (at 9 cm−1, Figure 24, Table 7). This indicates the manifestation of ordering effects. In this case, the frequency and the intensity of the band, on the contrary, increase. According to [55], an increase in the intensity of the 682 cm−1 band corresponds to an increase in the concentration of NbLi defects. However, this contradicts the results of [5,14,15,80,81]. The mentioned studies unambiguously show that the number of NbLi defects decreases in LiNbO3:Zn crystals with an increase in the concentration of Zn2+. At Zn2+ concentrations from 0 to 5 mol.% ZnO, NbLi point defects are mostly substituted with Zn2+ cations. The 682 cm−1 band is manifested in spectra of LiNbO3:Zn crystals and does not appear in the spectrum of the SLN. It also has a high sensitivity to the concentration of Zn2+ cations in the crystal structure, and the behavior of its basic parameters (Figure 24 and Figure 25) may indicate a threshold incorporation of Zn2+ in the crystal structure at concentrations ≈0.94–1.12 mol.% ZnO.
The width of 876 cm−1 band (E (TO), corresponds to the stretching bridge oscillations of oxygen atoms along the polar axis), behaves similarly to the 682 cm−1 band width. The 876 cm−1 band is forbidden by the selection rules in the spectrum of the centrosymmetric paraelectric phase of a LN crystal [63,64]. The change in the behavior of the 876 cm−1 band width is observed at a concentration of 1.12 mol.% ZnO, Figure 25. In the literature, the intensity of the 876 cm−1 band is used to assess the quality of ferroelectrics properties of crystals with an oxygen-octahedral structure [5,82]. An increase in the intensity of this band means more ordered cation sublattice along the polar axis, which in its turn indicates an increase in the spontaneous polarization of the crystal.
The presence of a region of increased ordering of the structural units of the cation sublattice in LiNbO3:Zn crystals can be explained as follows. The main point defects of CLN (Li/Nb = 0.946) are NbLi—Nb5+ cations in lithium sites. Niobium occupies the position of Li+ cations of a perfect stoichiometric structure [3,5,22]. For electroneutrality reasons, the formation of NbLi defect leads to the appearance of four-point defects in the form of vacant oxygen octahedra. Zn2+ cations шncorporating into the congruent crystal structure displace NbLi defects, which is energetically efficient [5,45]. Small amounts of Zn2+ cations occupying lithium oxygen octahedra (in which NbLi defects were located), order the alternation of cations and vacancies along the polar axis and reduce the crystal deficiency with respect to Li+ vacancies [5,45]. The addition of Zn2+ cation to the vacant oxygen octahedron of a perfect structure along with a decrease in Li+ vacancies leads to an additional increase in the structure’s defects due to the violation of the existing order of cations and vacancies along the polar axis of the crystal.
Thus, when small amounts of Zn2+ cations are introduced into the cation sublattice of a congruent lithium niobate crystal, two mechanisms compete with each other. One leads to the ordering of cations along the polar axis and a decrease in cation vacancies. The other leads to disruption of the order of the cations along the polar axis by the impurity cations Zn2+. At low concentrations of Zn2+ cations, the ordering mechanism prevails. It leads to a decrease in widths of bands in the Raman spectrum and the c parameter of the unit cell. With an increase in the concentration of Zn2+ cations, the disordering mechanism begins to predominate, and widths of bands and parameter c increase.
The data obtained allow us to state that there is a smooth change in the ordering of the structural units of the cation sublattice and crystal properties when the Zn2+ cations incorporate into the structure of the congruent lithium niobate crystal. This is explained by the fact that with an increase in Zn2+ concentration, two interrelated processes take place simultaneously—the displacement of NbLi defects and the entry of Zn2+ cations into vacant octahedra of a perfect structure. According to the data of [6,14,15], even at 3 mol.% ZnO, NbLi defects are present in the crystal. And their final displacement occurs only when the concentration of Zn2+ ≥ 8 mol.% ZnO. Thus, Zn2+ cations can be quite fine and effective regulators of the number of NbLi defects in the structure of the LN crystal. This is important for the purposeful creation of optical materials with specified characteristics.
Figure 26 shows a fragment of the Raman spectrum of SLN, CLN, LiNbO3:Zn single crystals in the low-frequency region (50–140 cm−1). This region contains no bands corresponding to the fundamental phonons [5,36,55]. A low-intensity wide 120 cm−1 band is observed in the spectrum of the CLN crystal in scattering geometry Y(ZZ)Ȳ (phonons of A1 (TO) symmetry type are active). The band corresponds to quasi-particle oscillations—two-particle states of acoustic phonons with a zero total wave vector. At the same time, this bands is absent from the Raman spectrum of a highly ordered SLN single crystal. It is important that the intensity of this band is sensitive to changes in the acoustic Q-factor of the LN crystal [83]: the higher the intensity of the 120 cm−1 band is, the lower the acoustic Q-factor quality is. The SLN single crystal has the highest acoustic Q-factor quality, thus the 120 cm−1 band is absent from its spectrum.
The processing of the spectra by the programs for the separation of the contours of the spectral bands shows that the band with a frequency of ≈120 cm−1 has a structure and is a superposition of two bands with frequencies ≈104 and 117 cm−1 in the spectra of LN crystals, Figure 26. The presence of components is also confirmed by calculations of the density of phonon states, performed in [83,84]. Figure 26 shows that the intensity of the 120 cm–1 band changes with a change in the concentration of Zn2+ in LiNbO3:Zn crystals. With an increase in Zn2+ concentration, the structure of the 120 cm−1 band gradually disappears, Figure 26. At a concentration of 1.59 mol.%, only one maximum appears at a frequency of 120 cm−1. For crystals of LiNbO3:Mg and LiNbO3:Gd, the incorporation of an impurity cation into the lattice occurs stepwise and is more sharp than for LiNbO3:Zn crystals [5,6,16,44]. The broadening of the 254 and 274 cm−1 bands (A1 (TO)), the disappearance of the structure and an increase in the intensity of the 120 cm−1 band occur in these crystals a narrower range of impurity concentrations [5,78,79].
The observed effects for the 120 cm−1 band, in our opinion, can be explained by the resonant interaction of fundamental oscillations with frequencies of 254 and 274 cm−1 A1 (TO) between themselves and with two-particle states of acoustic phonons in the region of 120 cm−1 with a zero total wave vector. The manifestation of such an interaction in the vibrational spectrum of an anharmonic crystal was considered in [83,84]. For a highly ordered LN cation sublattice (in particular, for crystals close to the stoichiometric composition), the interaction covers a relatively narrow part of the spectrum. For such highly ordered structures, fundamental vibrations with frequencies of 254 and 274 cm−1 (A1 (TO)) interact with two-particle states of acoustic phonons (A1 (TO)) almost independently of each other. This is expressed in the appearance of two maxima 104 and 117 cm−1 in the spectrum in the region of two-particle excitations of acoustic phonons. With increasing disorder in the cation sublattice (as well as increasing anharmonicity with increasing crystal temperature), fundamental oscillations with frequencies of 254 and 274 cm−1 begin to interact with each other. At the same time, the magnitude of the part of the spectrum where the resonant interaction of fundamental oscillations and two-particle states of acoustic phonons occurs is expanding. This is expressed in an increase in the intensity and width of the bands corresponding to the two-particle states of acoustic phonons with a zero total wave vector. With a sufficiently strong interaction, the maxima of 104 and 117 cm−1 merge into a wide maximum with a frequency of 120 cm−1, Figure 15, Figure 18, Figure 19 and Figure 26.
Thus, the appearance of a 120 cm−1 band in the Raman spectrum may be caused by the deviation of the order of cations (Li+, Nb5+, vacant octahedra) along the polar axis in non-stoichiometric crystals from the order of cations in a perfect structure of stoichiometric composition. At this an increase in the number of NbLi defects is observed. Probably, the intensity of the 120 cm−1 band increases with an increase in the number of defects (including NbLi defects) associated with the disruption of the order of alternation of Li+, Nb5+ cations and vacant octahedra along the polar axis. The splitting of the band into two components can then be due to an improvement in the selection rules for the wave vector of two-particle states of acoustic phonons of the A1 (TO) symmetry type. This occurs due to a decrease in the uncertainty of the quasiparticle wave vector when ordering the alternation of cations and voids along the polar axis [83,84]. An increase in disorder in the cation sublattice, on the contrary, should lead to an increase in the uncertainty in the wave vector of two-particle states of acoustic phonons of the A1 (TO) symmetry type and the probability of two-phonon transitions [83,84]. Oscillations will appear in an ever-increasing region of the Brillouin zone in the Raman spectrum. All this should lead to a blurring of the structure of the 120 cm–1 band, an increase in its intensity and a broadening of the bands corresponding to totally symmetric fundamental vibrations of cations. The experimental data obtained also indicate a decrease in the number of NbLi defects with an increase in the concentration of Zn2+ in LiNbO3:Zn crystals. However, to reliably establish the dependence of the band intensity with a frequency of 120 cm−1 on the number of NbLi defects, further studies of the Raman spectra of LiNbO3:Zn crystals at high Zn2+ concentrations, up to 8 mol.%, are necessary. At such high Zn2+ concentrations, NbLi defects are practically absent [5,6], and the band intensity with a frequency of 120 cm−1 can be close to zero.
4. Conclusions
The Raman spectra, defect structure, conoscopic, PILS and X-ray patterns were studied in nominally pure SLN, CLN crystals; in lightly doped congruent LN crystals (LiNbO3:Zn (0–1.59 mol.%. ZnO)); in heavily doped LN crystals (when concentration alloying element is close to the second threshold value) LiNbO3:Zn (4.5 mol.% ZnO), LiNbO3:Mg:Fe (5.01; 0.005), LiNbO3:Mg (5.1), LiNbO3:Mg (5.3). All crystals were grown by Czochralski from a charge of different genesis.
Structural defects of macrolevels are formed during growth of LN crystals of different chemical composition. Defects have a quite noticeable but very difficult to interpret effect on the processes of the Raman scattering in nominally pure and doped LN crystals.
Conoscopic patterns of the studied LN crystals indicate their high compositional uniformity. In scattering geometry Y(ZZ)Ȳ in the Raman spectrum and in the X-ray diffraction patterns of non-stoichiometric LiNbO3 crystals, weak superstructural bands were found. The bands are forbidden by the space symmetry group of the R3c lattice. Superstructural bands were detected not to be reflections of the second phase. The distribution of the intensity and position of additional reflections on X-ray patterns and the frequency and intensity of the extra bands in the spectra practically do not change with changes in stoichiometry, concentration and type of dopant, and the method of doping a charge.
In the Raman spectrum and on X-ray patterns, extra bands may be a result of the formation of an ordered superstructure in the crystal matrix. The ordered superstructure must have hexagonal sublattice with a doubled a parameter of the unit cell relative to the main cell.
For the first time, extra bands with frequencies of 209, 230, 298, 694, 880 cm−1 were found in the Raman spectra of highly doped with magnesium and zinc LN crystals. Ab initio calculations, made in [57,58], do not allow us to state unequivocally that these extra bands can correspond to A2 fundamental symmetry type oscillations prohibited by the selection rules for the space group C3V6 (R3c). Nevertheless, their manifestation in the spectrum is possible with significant distortion by doping cations (in the threshold concentration range) of the local structure of LN crystals, when clusters with a structure significantly different from the structure of the crystalline matrix are present in the crystal.
At the same time, ab initio calculations unequivocally indicate that the experimentally observed low-intensity extra bands with frequencies of 104 and 119 cm−1 cannot correspond to the forbidden oscillations A2 of symmetry type and have a completely different nature. Most likely, they correspond to two-particle states of acoustic phonons with a zero total wave vector [5]. The intermittent structure of the laser beam was found in nominally pure non-gyrotropic SLN crystal. This structure may be due to the formation of bound states of two photons as a result of various nonlinear-optical processes: two-photon absorption, the stimulated Raman scattering, etc.
Raman spectra of LiNbO3:Zn crystals revealed a region of increased structure ordering when the order of alternation of the main, doping cations and vacancies along the polar axis is increased in the cation sublattice, and oxygen octahedra are almost perfect. The maximum ordering of the structure is observed at Zn2+ concentrations ~0.05 to 0.94 mol.%. Widths of bands in the Raman spectrum of LiNbO3:Zn (0.05–0.94 mol.%) crystals are narrower than in the spectrum of the CLN crystal and approach widths of bands in the spectrum of a SLN crystal. The region of enhanced structure ordering can be realized due to the fact that small amounts of Zn2+ cations displacing NbLi defects order the alternation of cations and vacancies along the polar axis and reduce the crystal deficiency with respect to Li+ vacancies.
Author Contributions
Conceptualization, methodology, data curation, writing—original draft preparation, project administration, N.S.; software, A.K.; validation, investigation, visualization, supervision, N.S. and M.P.; formal analysis, N.S. and A.K.; resources, writing—review and editing, funding acquisition, M.P.
Funding
This research was funded by the Ministry of Science and Higher Education Russian Federation scientific topic No 0226-IC-2018-0004 (registration # AAAA-A18-118022190125-2).
Acknowledgments
Authors would like to thank I.V. Birukova, S.M. Masloboeva, A.A. Yanichev, P.G. Chufyrev, A.A. Gabain, O.B. Shcherbina, O.V. Makarova, N.A. Teplyakova, V.V. Efremov, D.V. Manukovskaya of Tananaev Institute of Chemistry for help in preparation of this work.
Conflicts of Interest
The authors declare no conflict of interest. The funders had no role in the design of the study; in the collection, analyses, or interpretation of data; in the writing of the manuscript, or in the decision to publish the results.
References
- Lines, M.E.; Glass, A.M. Principles and Application of Ferroelectrics and Related Materials; Clarendon Press: Oxford, UK, 1977; p. 680. [Google Scholar]
- Kuzminov, Y.S. Electroptic and Nonlinear Optical Lithium Niobate Crystal; Nauka: Moscow, Russia, 1987; p. 262. (In Russian) [Google Scholar]
- Volk, T.; Wohlecke, M. Lithium Niobate. Defects, Photorefraction and Ferroelectric Switching; Springer: Berlin, Germany, 2008; p. 250. [Google Scholar]
- Palatnikov, M.N.; Sidorov, N.V. Some fundamental points of technology of lithium niobate and lithium tantalite single crystals. In Oxide Electronics and Functional Properties of Transition Metal Oxides; Pergament, A., Ed.; NOVA Sience Publichers: Hauppauge, NY, USA, 2014; pp. 31–168. [Google Scholar]
- Sidorov, N.V.; Volk, T.R.; Mavrin, B.N.; Kalinnikov, V.T. Lithium Niobate: Defects, Photorefraction, Vibrational Spectra, Polaritons; Nauka: Moscow, Russia, 2003; p. 255. (In Russian) [Google Scholar]
- Palatnikov, M.N.; Sidorov, N.V.; Makarova, O.V.; Biryukova, I.V. Fundamental Aspects of the Technology of Heavily Doped Lithium Niobate Crystals; Izdatel’stvo ICTREMS KNS RAN: Apatity, Russia, 2017; p. 241. (In Russian) [Google Scholar]
- Sadovnikov, A.V.; Nikitov, S.A. Toward nonlinear magnonics: Intensity-dependent spin-wave switching in insulating side-coupled magnetic stripes. Phys. Rev. B 2017, 96, 144428. [Google Scholar] [CrossRef]
- Sadovnikov, A.V.; Beginin, E.N.; Sheshukova, S.E.; Sharaevskii, Y.P.; Stognij, A.I.; Novitski, N.N.; Sakharov, V.K.; Khivintsev, Y.V.; Nikitov, S.A. Route toward semiconductor magnonics: Light-induced spin-wave nonreciprocity in a YIG/GaAs structure. Phys. Rev. B 2019, 99, 054424. [Google Scholar] [CrossRef]
- Goulkov, M.; Imlau, M.; Woike, T. Photorefractive parameters of lithium niobate crystals from photoindused light scattering. Phys. Rev. B Condens. Matter Mater. Phys. 2008, 77, 235110. [Google Scholar] [CrossRef]
- Lengyel, K.; Peter, A.; Kovacs, L.; Corradi, G.; Palfavi, L.; Hebling, J.; Unferdorben, M.; Dravecz, G.; Hajdara, I.; Szaller, Z.; et al. Growth, defect structure, and THz application of stoichiometric lithium niobate. Appl. Phys. Rev. 2015, 2, 040601. [Google Scholar] [CrossRef] [Green Version]
- Fontana, M.D.; Bourson, P. Microstructure and defects probed by Raman spectroscopy in lithium niobate crystals and devices. Appl. Phys. Rew. 2015, 2, 040602. [Google Scholar] [CrossRef]
- Sidorov, N.V.; Palatnikov, M.N.; Kalinnikov, V.T. Effect of secondary structure on the optical properties of ferroelectric crystals of lithium niobate with a low photorefraction effect. Proc. Kola Sci. Center RAS Chem. Mater. Sci. 2015, 9, 464–468. (In Russian) [Google Scholar]
- Palatnikov, M.N.; Makarova, O.V.; Sidorov, N.V. Growth and Technological Defects of Lithium Niobate Crystals of Different Chemical Composition; Izdatel’stvo ICTREMS KNS RAN: Apatity, Russia, 2018; p. 90. (In Russian) [Google Scholar]
- Chernaya, T.S.; Volk, T.R.; Verin, I.A.; Simonov, V.I. Threshold concentrations in zinc-doped lithium niobate crystals and their structural conditionality. Cryst. Rep. 2008, 53, 573–578. [Google Scholar] [CrossRef]
- Chernaya, T.S.; Maksimov, B.A.; Volk, T.R.; Rubinina, N.M.; Simonov, V.I. Zn atoms in lithium niobate and mechanism of their insertion into crystals. JETP Lett. 2001, 73, 103–106. [Google Scholar] [CrossRef]
- Naumova, I.I.; Kitaeva, G.K.; Penin, A.N.; Kuznetsov, K.A. Influence of structural defects on the optical properties of Mg:LiNbO3 single crystals. Quant. Electron. 2000, 30, 726–732. [Google Scholar] [CrossRef]
- Aillerie, M.; Bourson, P.; Mostefa, M.; Abdi, F.; Fontana, M.D. Photorefractive Damage in congruent LiNbO3. Part I. Zinc doped Lithium Niobate Crystals. J. Phys. Conf. Ser. 2013, 416, 012001. [Google Scholar] [CrossRef] [Green Version]
- Syuy, A.V.; Sidorov, N.V.; Palatnikov, M.N.; Teplyakova, N.A.; Shtarev, D.S.; Prokopiv, N.N. Optical properties of lithium niobate crystals. Optik 2018, 156, 239–246. [Google Scholar] [CrossRef]
- Fridkin, V.M. Ferroelectrics–Semiconductor; Nauka: Moscow, Russia, 1976; p. 408. (In Russian) [Google Scholar]
- Obuckhovskij, V.V.; Stoyanov, A.V. Photoinduced light scattering in crystals. Opt. Spectrosc. 1985, 58, 378–385. (In Russian) [Google Scholar]
- Maksimenko, V.A.; Syuy, A.V.; Karpets, Y.M. Photo-Induced Processes in Lithium Niobate Crystals; Fizmatlit: Moscow, Russia, 2008; p. 96. (In Russian) [Google Scholar]
- Abrahams, S.C.; March, P. Defect Structure Dependence on Composition in Lithium Niobate. Acta Cryst. B 1986, 42, 61–68. [Google Scholar] [CrossRef]
- Donnerberg, H.J.; Tomlinson, S.M.; Catlow, C.R.A.; Schirmer, A.F. Computer-simulation studies of intrinsic defects in LiNbO3 crystals. Phys. Rev. B 1989, 40, 11909. [Google Scholar] [CrossRef] [PubMed]
- Donnerberg, H.J.; Tomlinson, S.M.; Catlow, C.R.A. Defects in LiNbO3–II. Computer simulation. J. Phys. Chem. Solids 1991, 52, 201–210. [Google Scholar] [CrossRef]
- Zotov, N.; Boysen, H.; Frey, F.; Metzger, T.; Born, E. Cation Substitution Models of congruent LiNbO3 Investigated by X-ray and Neutron Powder Diffraction. J. Phys. Chem. Solids 1994, 55, 145–152. [Google Scholar] [CrossRef]
- Cabrera, J.M.; Olivares, J.; Carrascosa, M.; Rams, J.; Müller, R.; Diéguez, E. Hydrogen in lithium niobate. Adv. Phys. 1996, 45, 349–392. [Google Scholar] [CrossRef]
- Sidorov, N.V.; Palatnikov, M.N.; Bobreva, L.A.; Novikova, N.N. Manifestation of structural features of LiNbO3:Zn and LiNbO3:Mg crystals in their IR absorption spectra in the stretching region of OH– groups. Inorg. Mater. 2017, 53, 713–717. [Google Scholar] [CrossRef]
- Sidorov, N.V.; Teplyakova, N.A.; Palatnikov, M.N.; Bobreva, L.A. Investigation of Structural Re-Ordering of Hydrogen Bonds in LiNbO3:Mg Crystals around the Threshold Concentration of Magnesium. J. Appl. Specrosc. 2017, 84, 549–554. [Google Scholar] [CrossRef]
- Voskresenskii, V.M.; Starodub, O.R.; Sidorov, N.V.; Palatnikov, M.N. Investigation of the cluster formation in lithium niobate crystals by computer modeling method. Cryst. Rep. 2017, 62, 205–209. [Google Scholar] [CrossRef]
- Voskresenskii, V.M.; Starodub, O.R.; Sidorov, N.V.; Palatnikov, M.N.; Kalinnikov, V.T. Modeling of Energetically Equilibrium Clusters in a Lithium Niobate Crystal. Dokl. Phys. Chem. 2014, 454, 29–31. [Google Scholar] [CrossRef]
- Li, Y.; Li, L.; Cheng, X.; Zhao, X. Microscopic Properties of Mg in Li and Nb Sites of LiNbO3 by First-Principle Hybrid Functional: Formation and Related Optical Properties. J. Phys. Chem. C 2017, 121, 8968–8975. [Google Scholar] [CrossRef]
- Makarova, O.V.; Palatnikov, M.N.; Biryukova, I.V.; Teplyakova, N.A.; Sidorov, N.V. Structure and Properties of Boron-Doped LiNbO3 Single Crystals. Inorg. Mater. 2018, 54, 49–54. [Google Scholar] [CrossRef]
- Sidorov, N.V.; Palatnikov, M.N.; Yanichev, A.A.; Titov, R.A.; Teplyakova, N.A. Structural disorder and optical properties of congruent lithium niobate crystals doped with zinc and boron. Opt. Spectrosc. 2016, 121, 36–44. [Google Scholar] [CrossRef]
- Sidorov, N.V.; Palatnikov, M.N.; Yanichev, A.A.; Titov, R.A.; Teplyakova, N.A. Structural Disorder of LiNbO3:B Crystals and its Manifestation in Raman Spectra. J. Appl. Spectrosc. 2016, 83, 707–714. [Google Scholar] [CrossRef]
- Palatnikov, M.N.; Manukovskaya, D.V.; Sidorov, N.V.; Efremov, V.V.; Makarova, O.V. Formation of ordered defect structures in lithium niobate crystals of different chemical composition at non-equilibrium processes of different nature. Opt. Mater. 2019, 90, 51–56. [Google Scholar] [CrossRef]
- Sidorov, N.V.; Mavrin, B.N.; Chufyrev, P.G.; Palatnikov, M.N. Phonon Spectra of Lithium Niobate Single Crystals; Kalinnikov, V.T., Ed.; Izdatel’stvo ICTREMS KNS RAN: Apatity, Russia, 2012; p. 215. (In Russian) [Google Scholar]
- Sidorov, N.V.; Palatnikov, M.N.; Kalinnikov, V.T. Raman scattering spectra and structural features of lithium niobate crystals. Opt. Spectrosc. 1997, 82, 38–45. (In Russian) [Google Scholar]
- Ridah, A.; Bourson, P.; Fontana, M.D.; Malovichko, G. The composition dependence of the Raman spectrum and new assignment of the phonons in LiNbO3. J. Phys. Condens. Matter. 1997, 9, 9687–9693. [Google Scholar] [CrossRef]
- Sidorov, N.V.; Kruk, A.A.; Yanichev, A.A.; Palatnikov, M.N.; Mavrin, B.N. Temperature investigations of Raman spectra of stoichiometric and congruent lithium niobate crystals. Opt. Spectrosc. 2014, 117, 560–571. [Google Scholar] [CrossRef]
- Quispe-Siccha, R.; Mejia-Uriarte, E.V.; Villagran-Muniz, M.; Jaque, D.; Garsia Sole, J.; Jaque, F.; Sato-Berru, R.Y.; Camarillo, E.; Hernandez, A.; Murrieta, S. The effect on Nd and Mg doping on the micro-Raman spectra of LiNbO3 single-crystals. J. Phys. Condens. Matter 2009, 21, 145401. [Google Scholar] [CrossRef]
- Mouras, R.; Fontana, M.D.; Bourson, P.; Postnikov, A.V. Lattice site of Mg ion in LiNbO3 crystal determined by Raman spectroscopy. J. Phys. Condens. Matter 2000, 12, 5053–5060. [Google Scholar] [CrossRef]
- Sidorov, N.V.; Pikoul, O.Y.; Kruk, A.A.; Teplyakova, N.A.; Yanichev, A.A.; Palatnikov, M.N. Complex Investigations of Structural and Optical Homogeneities of Low-Photorefractivity Lithium Niobate Crystals by the Conoscopy and Photoinduced and Raman Light Scattering Methods. Opt. Spectrosc. 2015, 118, 259–268. [Google Scholar] [CrossRef]
- Sidorov, N.V.; Palatnikov, M.N.; Kruk, A.A.; Teplyakova, N.A.; Makarova, O.V. Structure of Lithium Niobate Crystals with Low Photorefractive Effect. J. Appl. Spectrosc. 2014, 81, 633–639. [Google Scholar] [CrossRef]
- Sidorov, N.V.; Gabain, A.A.; Yanichev, A.A.; Efremov, I.N.; Biryukova, I.V.; Palatnikov, M.N. Raman Spectra of Crystals LiNbO3:Zn(4.5), LiNbO3:Mg:Fe(5.01, 0.005), LiNbO3:Mg(5.1), and LiNbO3:Mg(5.3 mol %). Opt. Spectrosc. 2015, 118, 269–276. [Google Scholar] [CrossRef]
- Sidorov, N.V.; Yanichev, A.A.; Palatnikov, M.N.; Gabain, A.A. Effects of the Ordering of Structural Units of the Cationic Sublattice of LiNbO3:Zn Crystals and Their Manifestation in Raman Spectra. Opt. Spectrosc. 2014, 116, 281–290. [Google Scholar] [CrossRef]
- Sidorov, N.V.; Yanichev, A.A.; Palatnikov, M.N.; Gabain, A.A.; Pikoul, O.Y. Optical homogeneity, defects, and photorefractive properties of stoichiometric, congruent, and zinc-doped lithium niobate crystals. Opt. Spectrosc. 2014, 117, 72–81. [Google Scholar] [CrossRef]
- Sidorov, N.V.; Palatnikov, M.N. Raman spectra of lithium niobate crystals heavily doped with zinc and magnesium. Opt. Spectrosc. 2016, 121, 842–850. [Google Scholar] [CrossRef]
- Abrahams, S.C.; Reddy, J.M.; Bernstein, J.L. Ferroelectric Lithium Niobate. 3. Single Crystal X-ray Diffraction study at 24 °C. J. Phys. Chem. Sol. 1966, 27, 997–1012. [Google Scholar] [CrossRef]
- Palatnikov, M.N.; Biryukova, I.V.; Sidorov, N.V.; Denisov, A.V.; Kalinnikov, V.T.; Smith, P.G.R.; Shur, V.Y. Growth and concentration dependencies of rare-earth doped lithium niobate single crystals. J. Cryst. Growth 2006, 291, 390–397. [Google Scholar] [CrossRef]
- Palatnikov, M.N.; Biryukova, I.V.; Masloboeva, S.M.; Makarova, O.V.; Manukovskaya, D.V.; Sidorov, N.V. The search of homogeneity of LiNbO3 crystals grown of charge with different genesis. J. Cryst. Growth 2014, 386, 113–118. [Google Scholar] [CrossRef]
- Palatnikov, M.N.; Masloboeva, S.M.; Biryukova, I.V.; Makarova, O.V.; Sidorov, N.V.; Efremov, V.V. Effect of the method used to prepare solid precursors Nb2O5:Mg on the characteristics of LiNbO3:Mg crystals produced on their basis. Rus. J. Inorg. Chem. 2014, 59, 178–182. [Google Scholar] [CrossRef]
- Palatnikov, M.N.; Biryukova, I.V.; Masloboeva, S.M.; Makarova, O.V.; Kravchenko, O.E.; Yanichev, A.A.; Sidorov, N.V. Structure and optical homogeneity of LiNbO3 Mg crystals grown from different charges. Inorg. Mater. 2013, 49, 715–720. [Google Scholar] [CrossRef]
- Palatnikov, M.N.; Sidorov, N.V.; Biryukova, I.V.; Shcherbina, O.B.; Kalinnikov, V.T. Granulated charge for growth of lithium niobate single crystals. Perspectivnyje Materialy 2011, 2, 93–97. (In Russian) [Google Scholar] [CrossRef]
- Pikul, O.Y.; Sidorov, N.V. Laser Conoscopy of Crystals; Palatnikov, M.N., Ed.; Izdatel’stvo ICTREMS KNS RAN: Apatity, Russia, 2014; p. 161. (In Russian) [Google Scholar]
- Gorelik, V.S. A research of connected and continuous states of dielectric crystals by Raman spectra. Trudy FIAN 1982, 132, 15–140. (In Russian) [Google Scholar]
- Gorelik, V.S.; Sverbil’, P.P. Raman scattering by longitudinal and transverse optical vibrations in lithium niobate single crystals. Inorg. Mater. 2015, 51, 1104–1110. [Google Scholar] [CrossRef]
- Caciuc, V.; Postnikov, A.V. Ab initio zone-center phonons in LiTaO3: Comparison to LiNbO3. Phys. Rev. B 2001, 64, 224303. [Google Scholar] [CrossRef]
- Parlinski, K.; Li, Z.Q.; Kawazoe, Y. Ab initio calculations of phonons in LiNbO3. Phys. Rev. B 2000, 61, 272–278. [Google Scholar] [CrossRef]
- Sidorov, N.; Yanichev, A.; Palatnikov, M.; Manukovskaya, D. Comparative investigation of LiNbO3 crystal Raman spectra in the temperature range 100–400 K. Vibr. Spectrosc. 2018, 96, 19–25. [Google Scholar] [CrossRef]
- Barker, A.S.; Loudon, R. Dielectric properties and optical phonons in LiNbO3. Phys. Rev. 1967, 158, 433–445. [Google Scholar] [CrossRef]
- Claus, R.; Borstel, G.; Wiesendanger, E.; Steffan, L. Directional Dispersion and Assignment of Optical Phonon in LiNbO3. Z. Naturforsch. A 1972, 27, 1187–1192. [Google Scholar] [CrossRef]
- Yang, X.; Lan, G.; Li, B.; Wang, H. Raman Spectra and Directional Dispersion in LiNbO3 and LiTaO3. Phys. Stat. Sol. 1987, 142, 287–300. [Google Scholar] [CrossRef]
- Voronko, Y.K.; Kudryavtsev, A.B.; Osiko, V.V.; Sobol, A.A.; Sorokin, E.V. Investigation of phase transformations in lithium niobate and tantalate using Raman scattering. Phys. Sol. State 1987, 29, 1348–1355. (In Russian) [Google Scholar]
- Voronko, Y.K.; Kudryavtsev, A.B.; Sobol, A.A.; Sorokin, E.V. High-temperature Raman spectroscopy—A method for studying phase transformations in laser crystals. Trudy IOFAN 1991, 29, 50–100. (In Russian) [Google Scholar]
- Kaminov, I.P.; Johnston, W.D. Qualitative determination of sources of the electro-optic effect in LiNbO3 and LiTaO3. Phys. Rev. 1967, 160, 519–524. [Google Scholar] [CrossRef]
- Margueron, S.; Bartasyte, A.; Glazer, A.M.; Simon, E.; Hinka, J.; Gregora, I.; Gleize, J. Resolved E-symmetry zone-centre phonons in LiTaO3 and LiNbO3 crystals. J. Appl. Phys. 2012, 111, 104105. [Google Scholar] [CrossRef]
- Sanna, S.; Neufeld, S.; Rusing, M.; Berth, G.; Zrenner, A.; Schidt, W.G. Raman scattering efficiency in LiTaO3 and LiNbO3 crystals. Phys. Rev. B 2015, 91, 224302. [Google Scholar] [CrossRef]
- Repelin, Y.; Husson, E.; Bennani, F.; Proust, C. Raman spectroscopy of lithium niobate and lithium tantalite. Force field calculations. J. Phys. Chem. Solids 1999, 60, 819–825. [Google Scholar] [CrossRef]
- Surovtsev, N.V.; Malinovsky, V.K.; Pugachev, A.M.; Shebanin, A.P. The nature of low-frequency Raman scattering in congruent melting crystals of lithium niobite. Phys. Solid State 2003, 45, 534–541. [Google Scholar] [CrossRef]
- Sidorov, N.V.; Bobreva, L.A.; Palatnikov, M.N. Concentration dependences of IR absorption spectra in the range of stretching vibrations of OH groups of congruent lithium-niobate crystals doped with zinc and magnesium. Opt. Spectrosc. 2017, 123, 258–263. [Google Scholar] [CrossRef]
- Sidorov, N.V.; Gorelik, V.S. Intermittent trajectory of focused laser radiation and laser excitation of bound states of two photons in dielectric crystals. In Proceedings of the VI International Conference on Photonics and Information Optics, Moscow, Russia, 1–3 February 2017; pp. 286–287. (In Russian). [Google Scholar]
- Lisitsa, M.P.; Yaremko, A.M. Fermi Resonance; Naukova Dumka: Kiev, Ukraine, 1984; p. 262. (In Ukrainian) [Google Scholar]
- Sidorov, N.V.; Palatnikov, M.N.; Serebryakov, Y.A.; Lebedeva, E.L.; Kalinnikov, V.T. Features of the structure, properties and spectra of Raman light scattering of lithium niobate crystals of different chemical composition. Inorg. Mater. 1997, 33, 496–506. (In Russian) [Google Scholar]
- Zhizhin, G.N.; Mavrin, B.N.; Shabanov, V.F. Optical Vibrational Spectra of Crystals; Nauka: Moscow, Russia, 1984; p. 232. (In Russian) [Google Scholar]
- Gorelik, V.S. Idealized lattice models and real crystal spectra. Trudy FIAN USSR 1987, 180, 87–126. (In Russian) [Google Scholar]
- Poulet, H.; Mathieu, J.-P. Spectres de Vibration et Symetrie des Cristaux; Gordon and Breach: Paris, France, 1970; p. 437. (In French) [Google Scholar]
- Maradudin, A.A. Defects and Vibrational Spectrum of Crystals: Theoretical and Experimental Aspects of the Influence of Point Defects and Disorder on Oscillations of Crystals; Mir: Moscow, Russia, 1968; p. 410. (In Russian) [Google Scholar]
- Sidorov, N.V.; Serebryakov, Y.A. Investigation of structural peculiarities of impure lithium niobate crystals by Raman spectroscopy. Vibr. Spectrosc. 1994, 6, 215–223. [Google Scholar] [CrossRef]
- Sidorov, N.V.; Serebryakov, Y.A.; Lebol’d, V.V. Manifestation of the disordering of the structure of lithium niobate impurity crystals in the Raman spectra. J. Appl. Spectrosc. 1992, 56, 319–322. (In Russian) [Google Scholar]
- Abdi, F.; Aillerie, M.; Fontana, M.; Bourson, P.; Volk, T.; Maximov, B.; Sulyanov, S.; Rubinina, N.; Wöhlecke, M. Influence of Zn doping on electrooptical properties and structure parameters of lithium niobate crystals. Appl. Phys. B 1999, 68, 795–799. [Google Scholar] [CrossRef]
- Zhang, Y.; Guilbert, L.; Bourson, P. Characterization of Ti:LiNbO3 waveguides by micro-raman and luminescence spectroscopy. Appl. Phys. B 2004, 78, 355–361. [Google Scholar] [CrossRef]
- Sidorov, N.V.; Palatnikov, M.N.; Teplyakova, N.A.; Kalinnikov, V.T. Ferroelectric Solid Solutions LixNa1-xTayNb1-yO3. Synthesis, Structure, Properties; Nauka: Moscow, Russia, 2015; p. 232. (In Russian) [Google Scholar]
- Anikiev, A.A.; Umarov, M.F. Quasi-Elastic Light Scattering in Congruent Lithium Niobate Crystals. Opt. Spectrosc. 2018, 125, 22–27. [Google Scholar] [CrossRef]
- Anikiev, A.A. The density of one- and two-particle states in lithium niobate crystals. Eng. J. Sc. Innov. 2013, 19, 837–842. (In Russian) [Google Scholar] [CrossRef]
Figure 1.
Raman spectra of a CLN single crystal at T = 77 K. The upper figure is the spectrum of a CLN single crystal heated at 1200 K for 6 h. Extra bands are marked with arrows.
Figure 1.
Raman spectra of a CLN single crystal at T = 77 K. The upper figure is the spectrum of a CLN single crystal heated at 1200 K for 6 h. Extra bands are marked with arrows.

Figure 2.
Self-similar domain microstructures of the fractal type: (a) in a LiNbO3:Tm (1.18 wt.%) crystal; (b) in an LiNbO3 crystal irradiated with a dose of 106 Gy of γ-radiation. Images were captured with Thixomet Image Analyzer.
Figure 2.
Self-similar domain microstructures of the fractal type: (a) in a LiNbO3:Tm (1.18 wt.%) crystal; (b) in an LiNbO3 crystal irradiated with a dose of 106 Gy of γ-radiation. Images were captured with Thixomet Image Analyzer.

Figure 3.
Microdomains in LN single crystals doped with REE: (a) 1.6 μm hexagonal microdomain nanostructure in an LiNbO3:Gd (0.44 wt.%) crystal on the Z-orientation etched surface; (b) the accumulation of triangular microdomains in the Z plane of the LiNbO3:Sm (1.1 wt.%) crystal. The image was obtained using an atomic-force microscope SMM-2000.

Figure 4.
Wedge-shaped nanoscale (≈100 nm) domains, in the region of the periodic domain structure in the Z-plane of the LiNbO3:Er (2.77 wt.%) crystal. Image obtained using the atomic force microscope SMM-2000.
Figure 4.
Wedge-shaped nanoscale (≈100 nm) domains, in the region of the periodic domain structure in the Z-plane of the LiNbO3:Er (2.77 wt.%) crystal. Image obtained using the atomic force microscope SMM-2000.

Figure 5.
An image of a RDS in an LiNbO3:Gd (0.44 wt.%.) crystal. Obtained using an atomic force microscope Nano-R. The figure is reproduced with the permission of Pleiades Publishing, Ltd. from the paper Cryst. Rep., V. 55, 2010, p.p. 811–814, Iss. 5, doi:10.1134/S1063774510050160.
Figure 5.
An image of a RDS in an LiNbO3:Gd (0.44 wt.%.) crystal. Obtained using an atomic force microscope Nano-R. The figure is reproduced with the permission of Pleiades Publishing, Ltd. from the paper Cryst. Rep., V. 55, 2010, p.p. 811–814, Iss. 5, doi:10.1134/S1063774510050160.

Figure 6.
Periodic nanoscale structures of the fractal type. They are registered on the negative wall of a domain structure in a LiNbO3:Gd (0.44 wt.%) single crystal. The image was obtained using an SMM-2000 atomic force microscope after intense etching of the sample in a mixture of HF and HNO3 acids. The figure is reproduced with the permission of Pleiades Publishing, Ltd. from the paper Cryst. Rep., V. 55, 2010, p.p. 811–814, Iss. 5, doi:10.1134/S1063774510050160.

Figure 7.
Growth domain structure of a LiNbO3:Gd (0.44 wt.%) crystal in a plane perpendicular to the growth axis. (a) Panorama; (b) growth domain structure at the periphery of the plate.
Figure 7.
Growth domain structure of a LiNbO3:Gd (0.44 wt.%) crystal in a plane perpendicular to the growth axis. (a) Panorama; (b) growth domain structure at the periphery of the plate.

Figure 8.
Growth domain structure of LiNbO3:Gd (0.26 wt.%) crystal in a plane perpendicular to the growth axis. (a) Panorama; (b) growth domain structure at the periphery of the plate.
Figure 8.
Growth domain structure of LiNbO3:Gd (0.26 wt.%) crystal in a plane perpendicular to the growth axis. (a) Panorama; (b) growth domain structure at the periphery of the plate.

Figure 9.
Separation of the second phase with incoherent boundaries: (a) crystal LiNbO3:Mg ([MgO] = 5.0 mol.% in the melt); (b) crystal LiNbO3:Zn ([ZnO] ≈ 3.95 mol.% in a crystal). Z-cut.
Figure 9.
Separation of the second phase with incoherent boundaries: (a) crystal LiNbO3:Mg ([MgO] = 5.0 mol.% in the melt); (b) crystal LiNbO3:Zn ([ZnO] ≈ 3.95 mol.% in a crystal). Z-cut.

Figure 10.
The second phase with incoherent boundaries formed in a crystal LiNbO3:Zn ([ZnO] ≈ 3.95 mol.% in a crystal). Z-cut.
Figure 10.
The second phase with incoherent boundaries formed in a crystal LiNbO3:Zn ([ZnO] ≈ 3.95 mol.% in a crystal). Z-cut.

Figure 11.
The separation of the second phase, connected to the crystal matrix by semi-coherent boundaries in an LiNbO3:Zn ([ZnO] ≈ 6.52 mol.% in the melt) crystal. Z-cut.
Figure 11.
The separation of the second phase, connected to the crystal matrix by semi-coherent boundaries in an LiNbO3:Zn ([ZnO] ≈ 6.52 mol.% in the melt) crystal. Z-cut.

Figure 12.
Separation of the second phase with coherent boundaries in the crystal LiNbO3:Zn ([Zn] = 4.77 mol.% in the crystal). Z-cut.
Figure 12.
Separation of the second phase with coherent boundaries in the crystal LiNbO3:Zn ([Zn] = 4.77 mol.% in the crystal). Z-cut.

Figure 13.
Separation of the second phase in a SLN(K2O) crystal. X-cut.

Figure 14.
Fragments of Raman spectra of heavily doped LN single crystals in the scattering geometries Y(ZZ)Ȳ and Y(ZX)Ȳ: 1—CLN; 2—LiNbO3:Zn (4.5 mol.%); 3—LiNbO3:Mg:Fe (5.01; 0.005); 4—LiNbO3:Mg (5.1); 5—LiNbO3:Mg (5.3). T = 100 K. The figure is reproduced with the permission of Pleiades Publishing, Ltd. from the paper Opt. Spectrosc. 2016, V. 121, P. 842–850. doi:10.1134/S0030400X16120225.

Figure 15.
Fragments of the Raman spectrum of a CLN crystal in the region of 70–180 and 300–360 cm−1. Extra bands are marked with arrows. T = 100 K. The figure is reproduced with the permission of Pleiades Publishing, Ltd. from the paper Opt. Spectrosc. 2016, V. 121, P. 842–850. doi:10.1134/S0030400X16120225.

Figure 16.
Conoscopic patterns of crystals: (a) SLN; (b) SLN(K2O); (c) LiNbO3:Zn (4.5 mol.% ZnO); (d) LiNbO3:Mg:Fe (5.01; 0.005); (e) LiNbO3:Mg (5.1, solid phase doping); (f) LiNbO3:Mg (5.3, homogeneous doping). λ = 532 nm. p = 0.039 and 3.54 W/cm2. The figure is reproduced with the permission of Pleiades Publishing, Ltd. from the paper Inorg. Mater.: Appl. Res. 2016, V. 7, P. 170–176. doi:10.1134/S2075113316020209.

Figure 17.
PILS patterns of crystals: (a) SLN; (b) SLN(K2O); (c) LiNbO3:Zn (4.5 mol.% ZnO); (d) LiNbO3:Mg:Fe (5.01; 0.005); (e) LiNbO3:Mg (5.1, solid phase doping); (f) LiNbO3:Mg (5.3, homogeneous doping). λ = 532 nm. p = 6.29 W/cm2. The figure is reproduced with the permission of Pleiades Publishing, Ltd. from the paper Inorg. Mater.: Appl. Res. 2016, V. 7, P. 170–176. doi:10.1134/S2075113316020209.

Figure 18.
Raman spectra of LN single crystals in the scattering geometry Y(ZZ)Ȳ: (a) a general curve of the Raman spectra: 1—SLN; 2—CLN; 3—LiNbO3:Zn (5.84 mol.% ZnO). Extra band are marked with arrows. (b) fragments of the Raman spectrum of LN crystals in the region of 80–140 cm–1: 1—SLN; 2—CLN; 3—LiNbO3:Zn (5.84 mol.% ZnO). (c) fragments of the Raman spectrum of LN crystals in the frequency region of stretching bridge vibrations Nb-O-Nb in the Y(ZX)Ȳ geometry: 1—LiNbO3:Er (2.67 mol.% Er2O3); 2—LiNbO3:Zn (0.07 mol.% ZnO); 3—CLN; 4—SLN. Figure 18c is reproduced with the permission of Pleiades Publishing, Ltd. from the paper Cryst. Rep. 2016 2016, V. 61, P. 1031–1038. doi:10.1134/S1063774516040167.

Figure 19.
Fragments in the region of 100–150 cm−1 of Raman spectra of different LN single crystals: 1—SLN; 2—stoichiometric LiNbO3: Gd3+ (0.001 wt.%); 3—CLN; 4—congruent LiNbO3:Mg2+ (0.36 wt.%); 5—congruent LiNbO3:Gd3+: Mg2+ (0.25; 0.75 wt.%). T = 293 K.
Figure 19.
Fragments in the region of 100–150 cm−1 of Raman spectra of different LN single crystals: 1—SLN; 2—stoichiometric LiNbO3: Gd3+ (0.001 wt.%); 3—CLN; 4—congruent LiNbO3:Mg2+ (0.36 wt.%); 5—congruent LiNbO3:Gd3+: Mg2+ (0.25; 0.75 wt.%). T = 293 K.

Figure 20.
Fragments of the Raman spectrum of LN single crystals of different composition in the low-frequency region: 1—SLN; 2—SLN(K2O); 3—SLN (4.5 wt.% K2O); 4—CLN. The figure is reproduced with the permission of Pleiades Publishing, Ltd. from the paper Cryst. Rep., 2010, V. 55, P. 1019–1024, doi 10.1134/S1063774510060192.

Figure 21.
The discontinuous structure of a focused laser beam (λ = 514.5 nm) in a SLN single crystal. The laser beam is directed along the polar axis of the crystal; period m ≈ 0.33 mm.
Figure 21.
The discontinuous structure of a focused laser beam (λ = 514.5 nm) in a SLN single crystal. The laser beam is directed along the polar axis of the crystal; period m ≈ 0.33 mm.

Figure 22.
(a) X-ray diffraction pattern of the crystal LiNbO3:Er (0.062 mol.% Er2O3), areas of additional reflections are marked in red circles; (b) Additional weak reflections on an enlarged scale from marked areas on (a); (c) Additional reflections on X-ray pattern of a CLN crystal; (d) Additional reflections on X-ray pattern of a crystal LiNbO3:Zn (6.52 mol.% ZnO, homogeneous doping).

Figure 23.
Raman spectra of SLN (1); CLN (2); LiNbO3:Zn, [Zn, mol.% ZnO] = 0.03 (3); 0.05 (4); 0.94 (5); 1.12 (6) and 1.59 (7) crystals in scattering geometries Y(ZX)Ȳ (a) and Y(ZZ)Ȳ (b). The figure is reproduced with the permission of Pleiades Publishing, Ltd. from the paper Opt. Spectrosc. 2014, V. 116, P. 281–290. doi:10.1134/S0030400X14010202.

Figure 24.
Dependence of widths of Raman bands of LiNbO3:Zn crystals on the Zn2+ concentration. The dotted line indicates the change in widths of the bands upon transition from a SLN (1) to a CLN crystal (0). The figure is reproduced with the permission of Pleiades Publishing, Ltd. from the paper Inorg. Mater.: Appl. Res. 2016, V. 7, P. 170–176. doi:10.1134/S2075113316020209.

Figure 25.
Dependence of frequencies (ν, cm−1), widths (S, cm−1) and intencities (I, rel. un.) of 626 (A1(TO)), 682, 876 cm−1 bands in Raman spectra of LiNbO3:Zn crystals on the Zn2+ concentration. The figure is reproduced with the permission of Pleiades Publishing, Ltd. from the paper Opt. Spectrosc. 2014, V. 116, P. 281–290. doi:10.1134/S0030400X14010202.

Figure 26.
Fragments of the Raman spectra of crystals SLN (1), CLN (2), LiNbO3:Zn, [Zn, mol.%] = 0.03 (3); 0.05 (4); 0.94 (5); 1.12 (6) and 1.59 (7) in the two-particle states of acoustic phonons area. The figure is reproduced with the permission of Pleiades Publishing, Ltd. from the paper Opt. Spectrosc. 2014, V. 116, P. 281–290. doi:10.1134/S0030400X14010202.


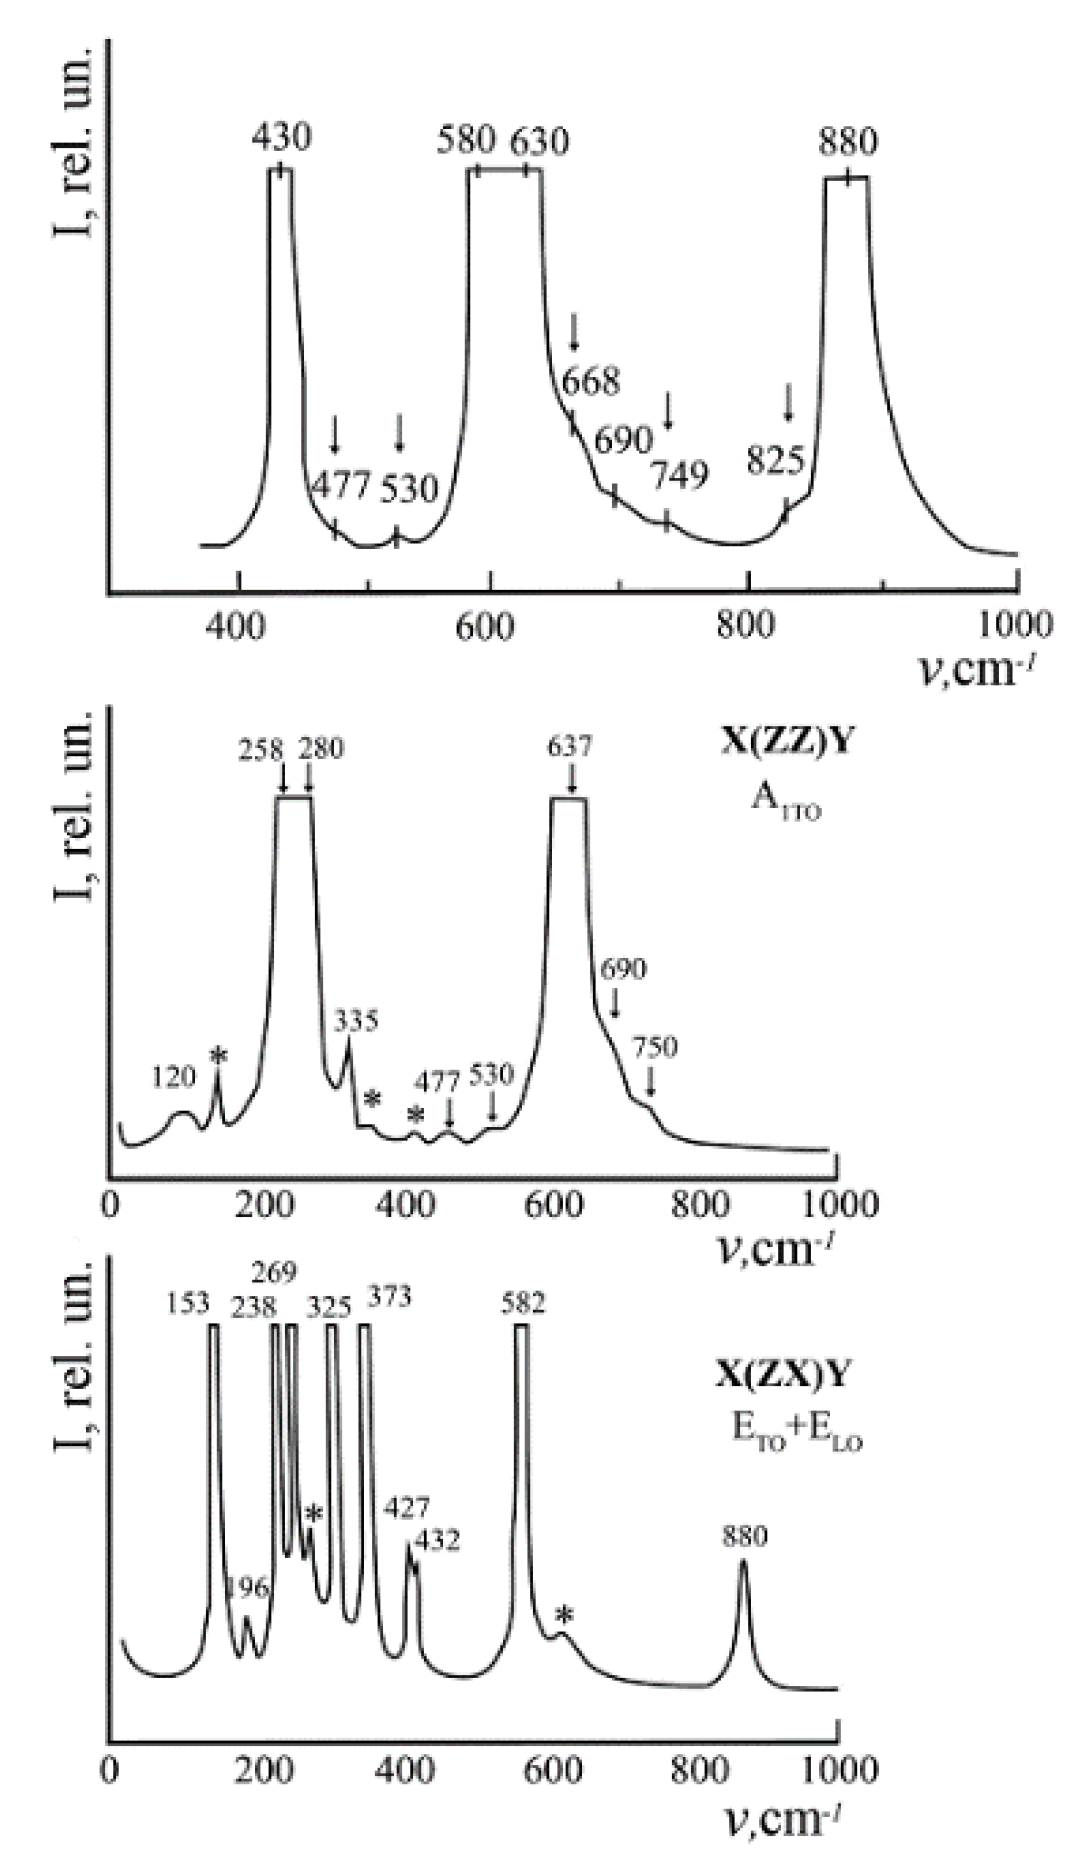
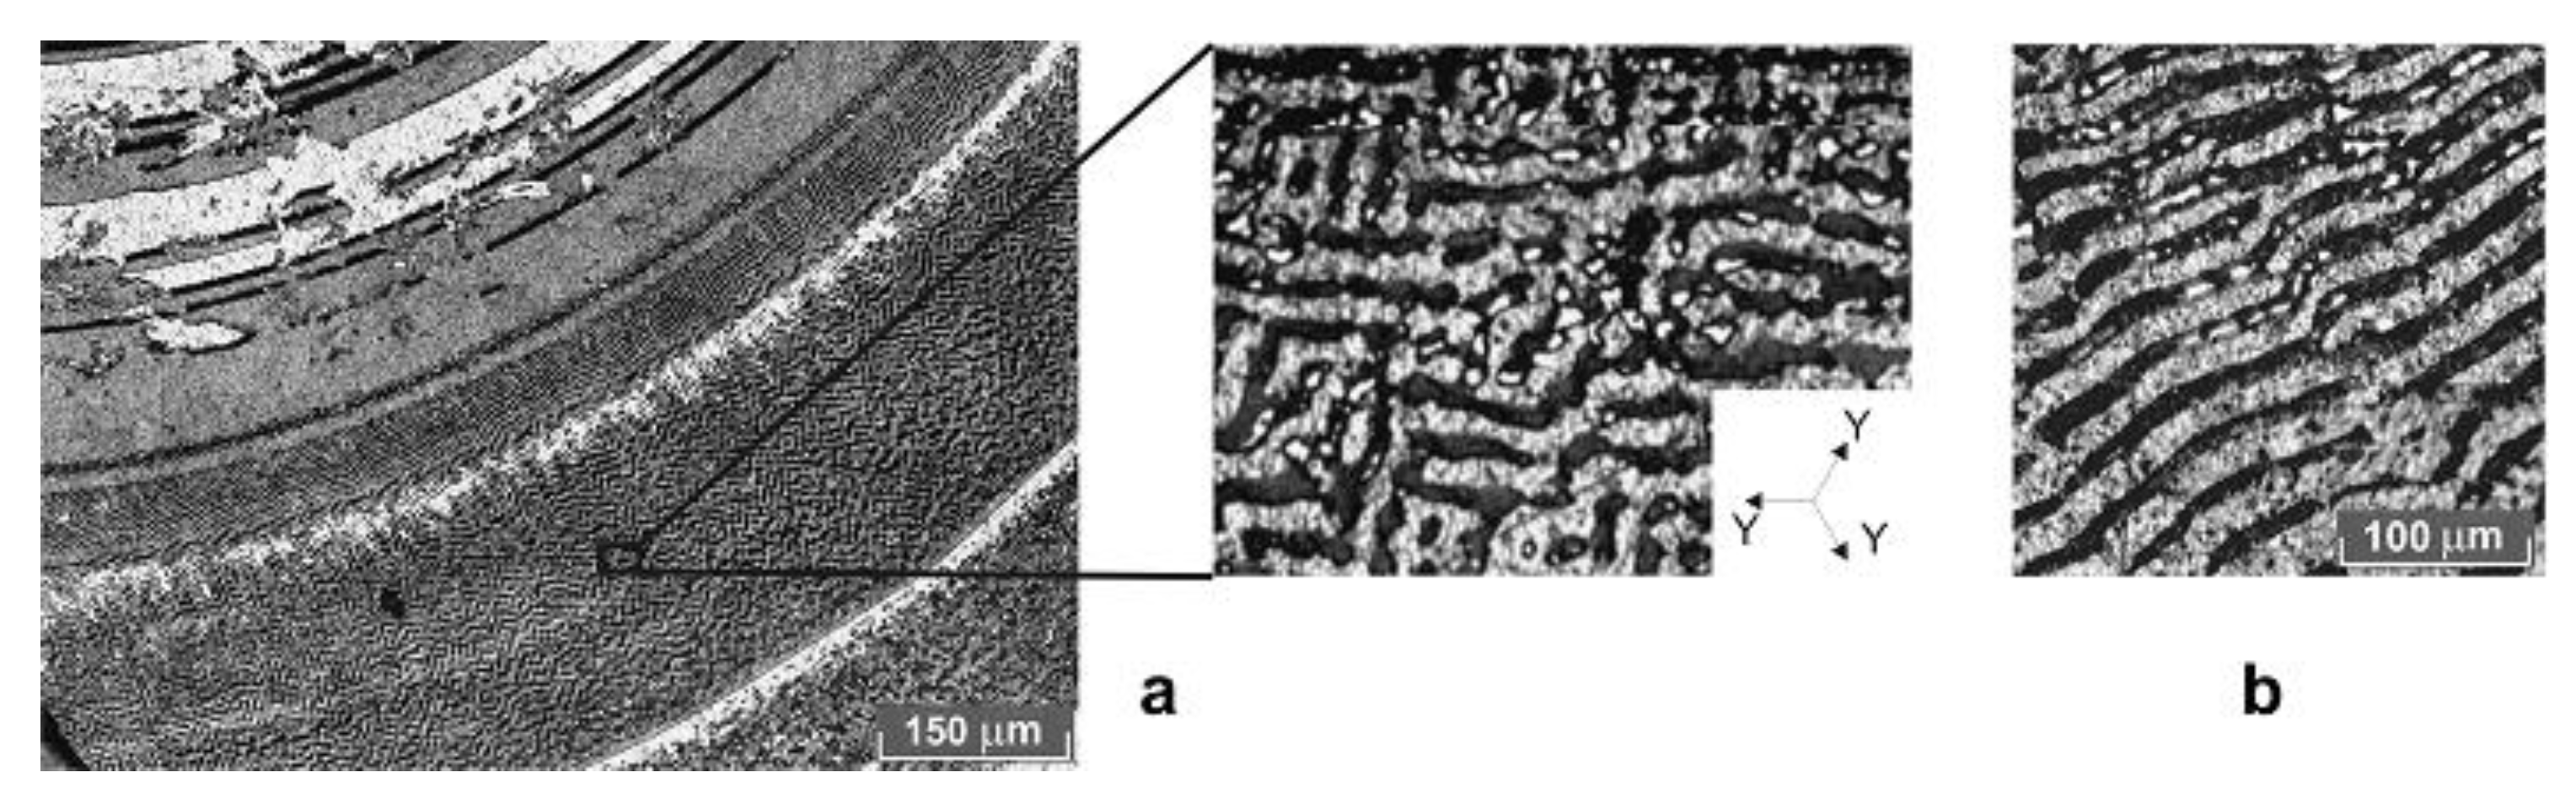
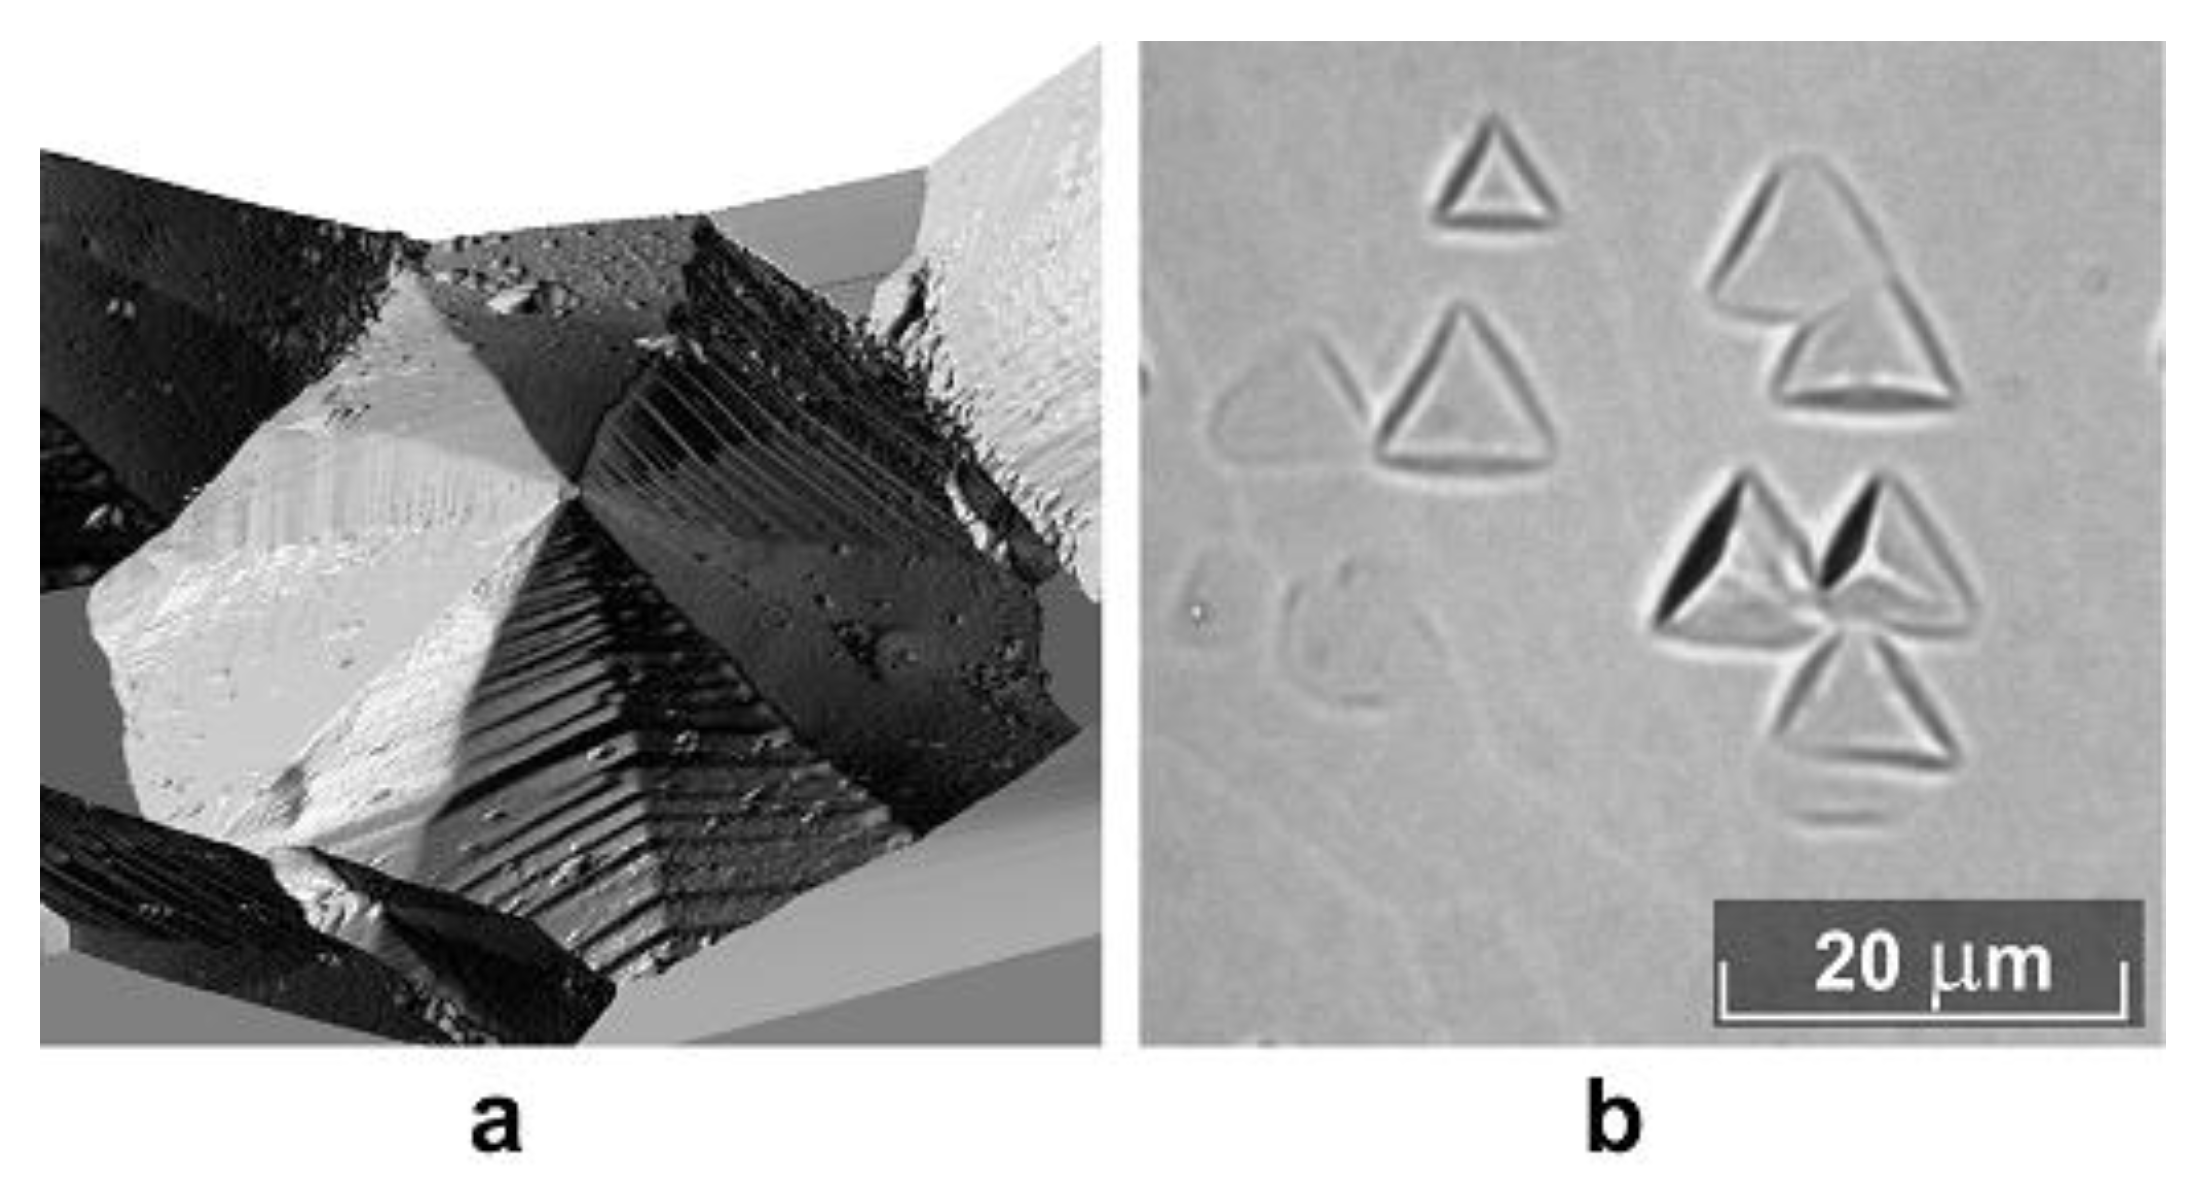
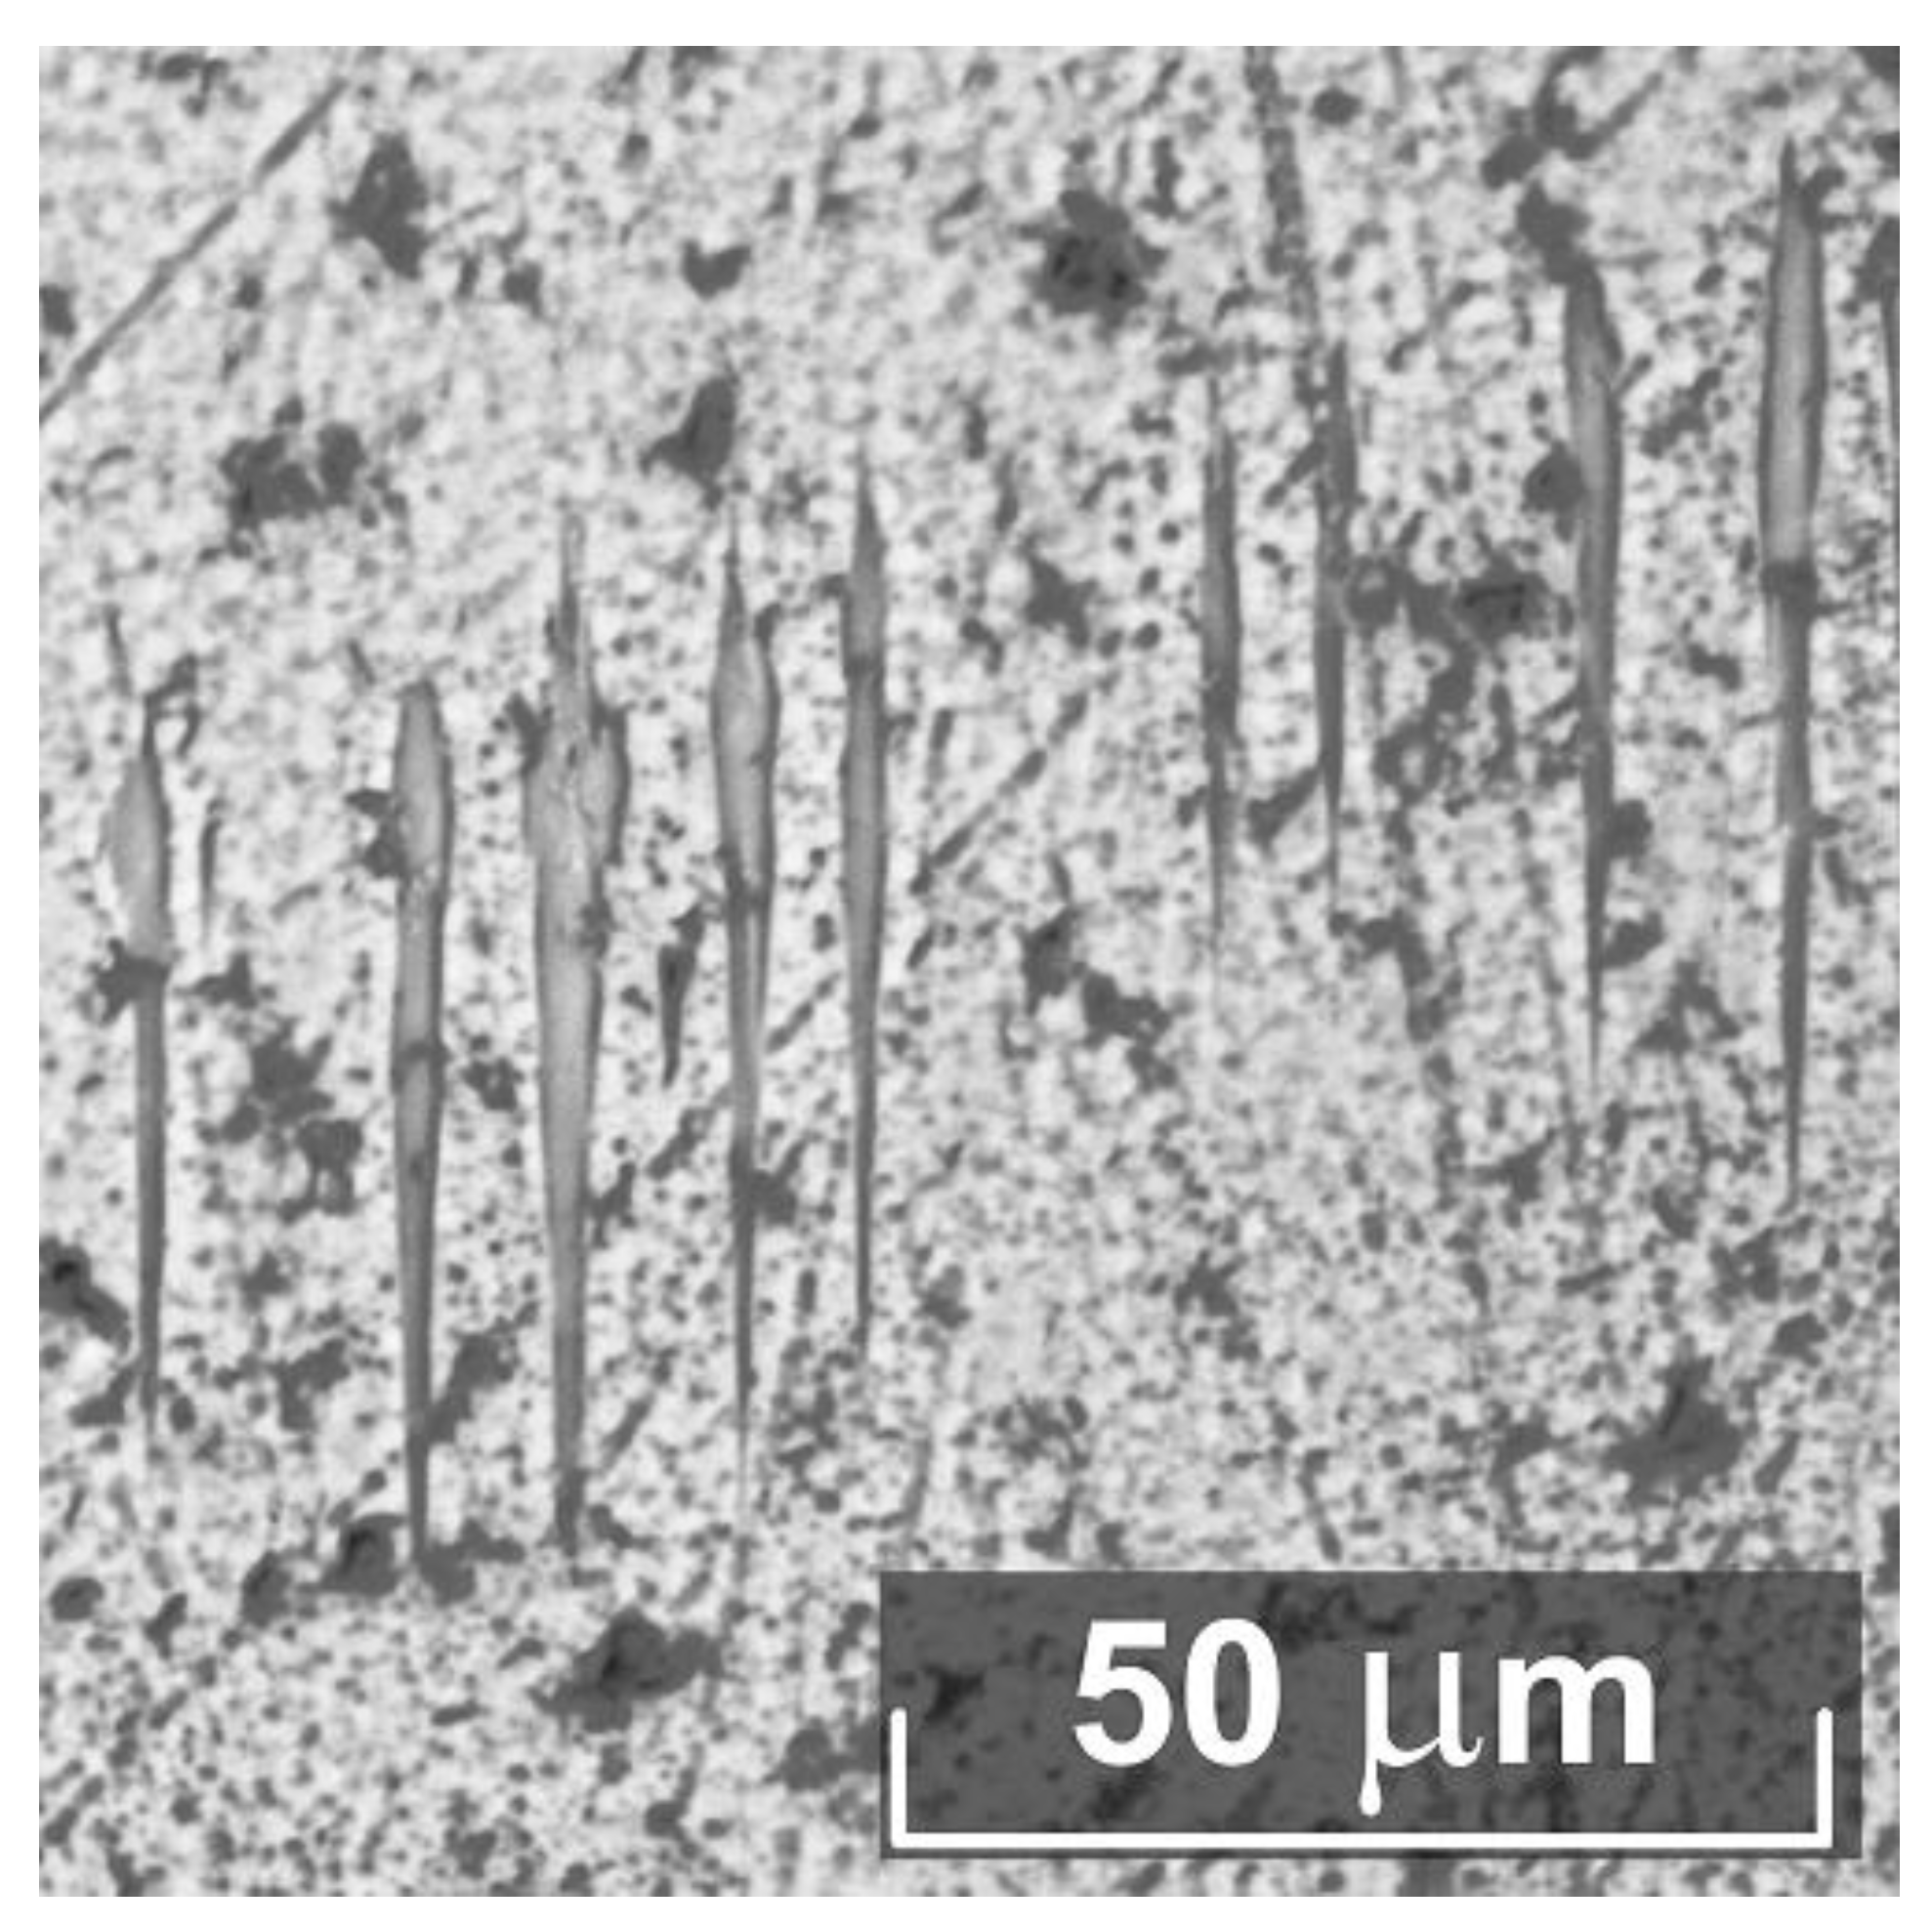
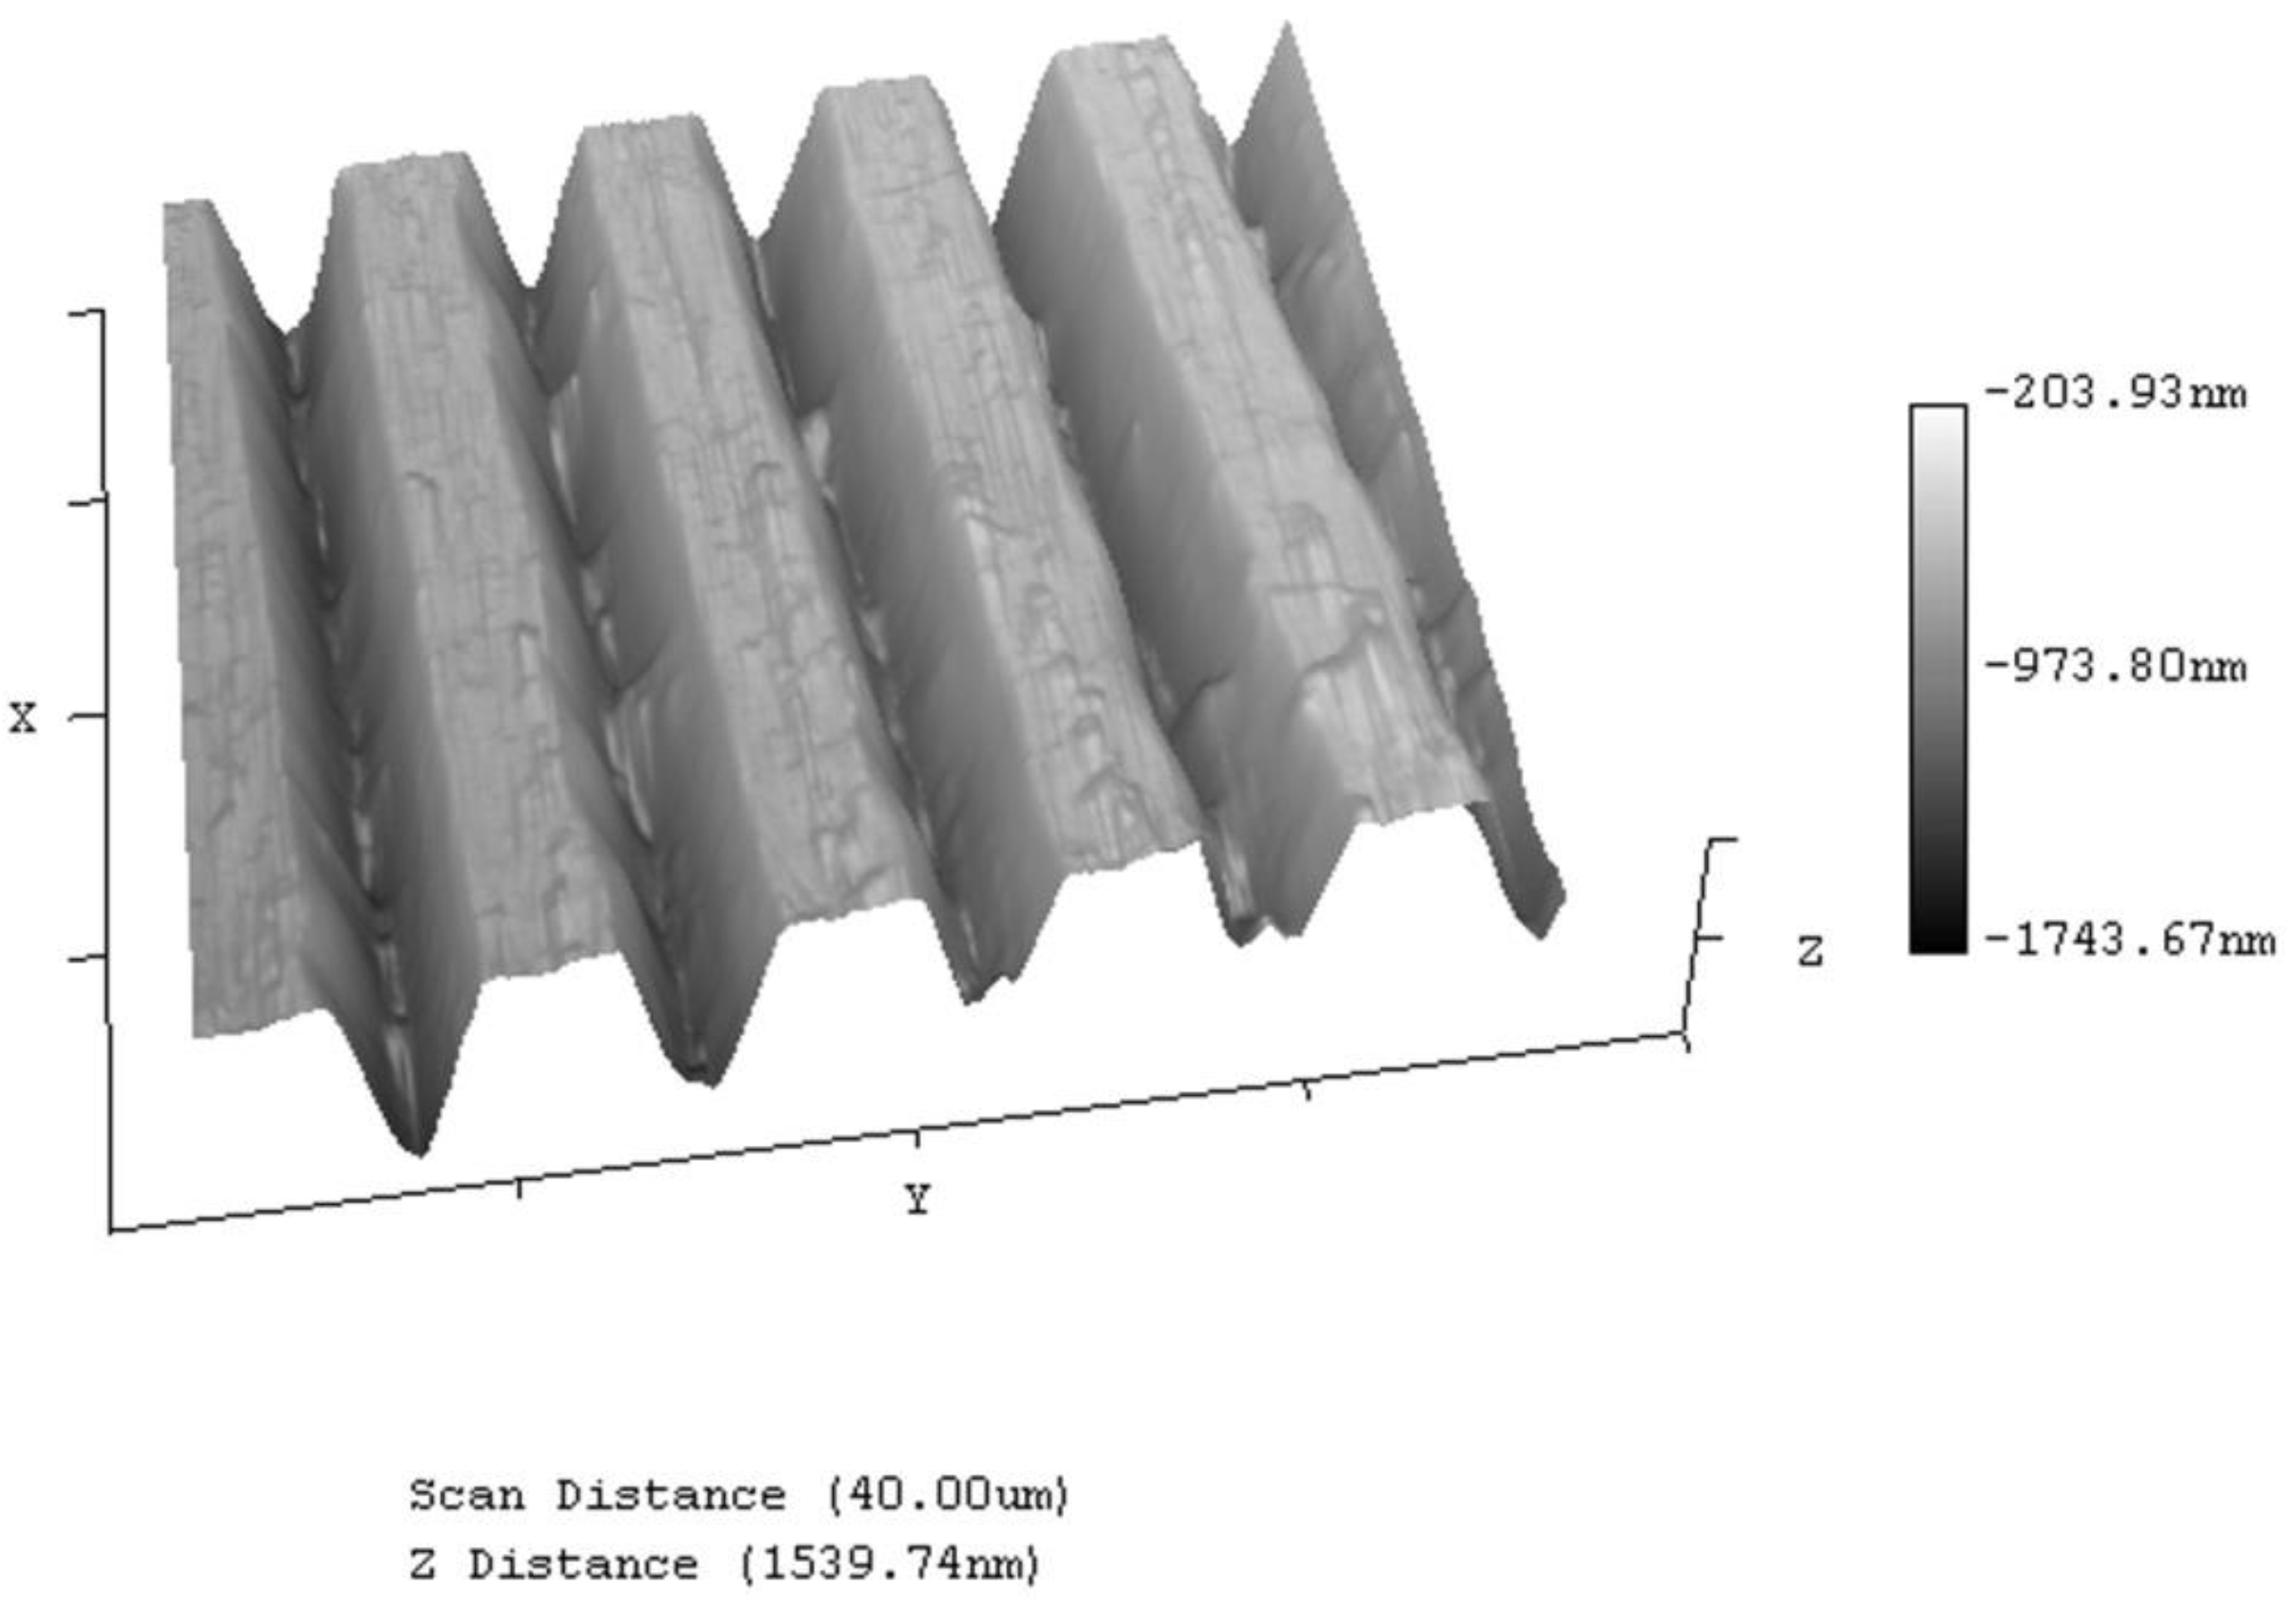
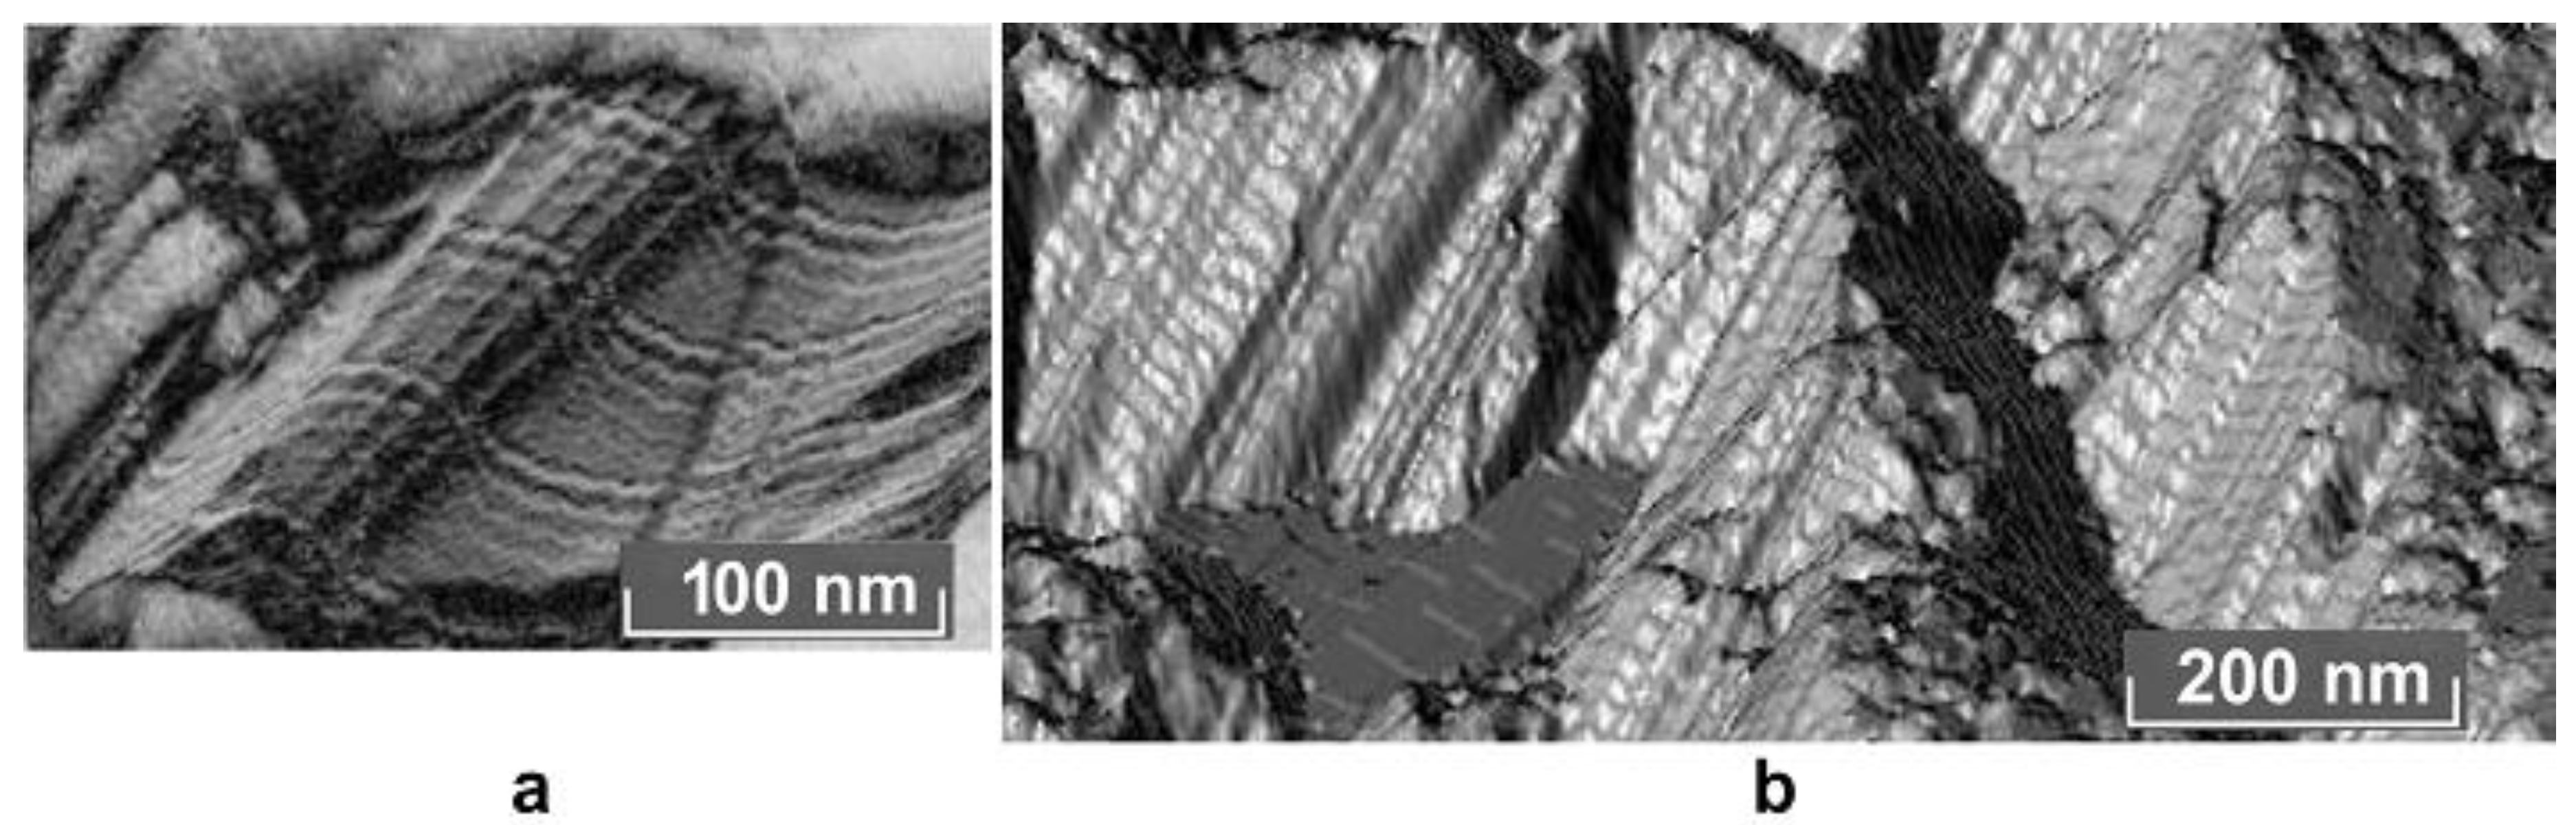
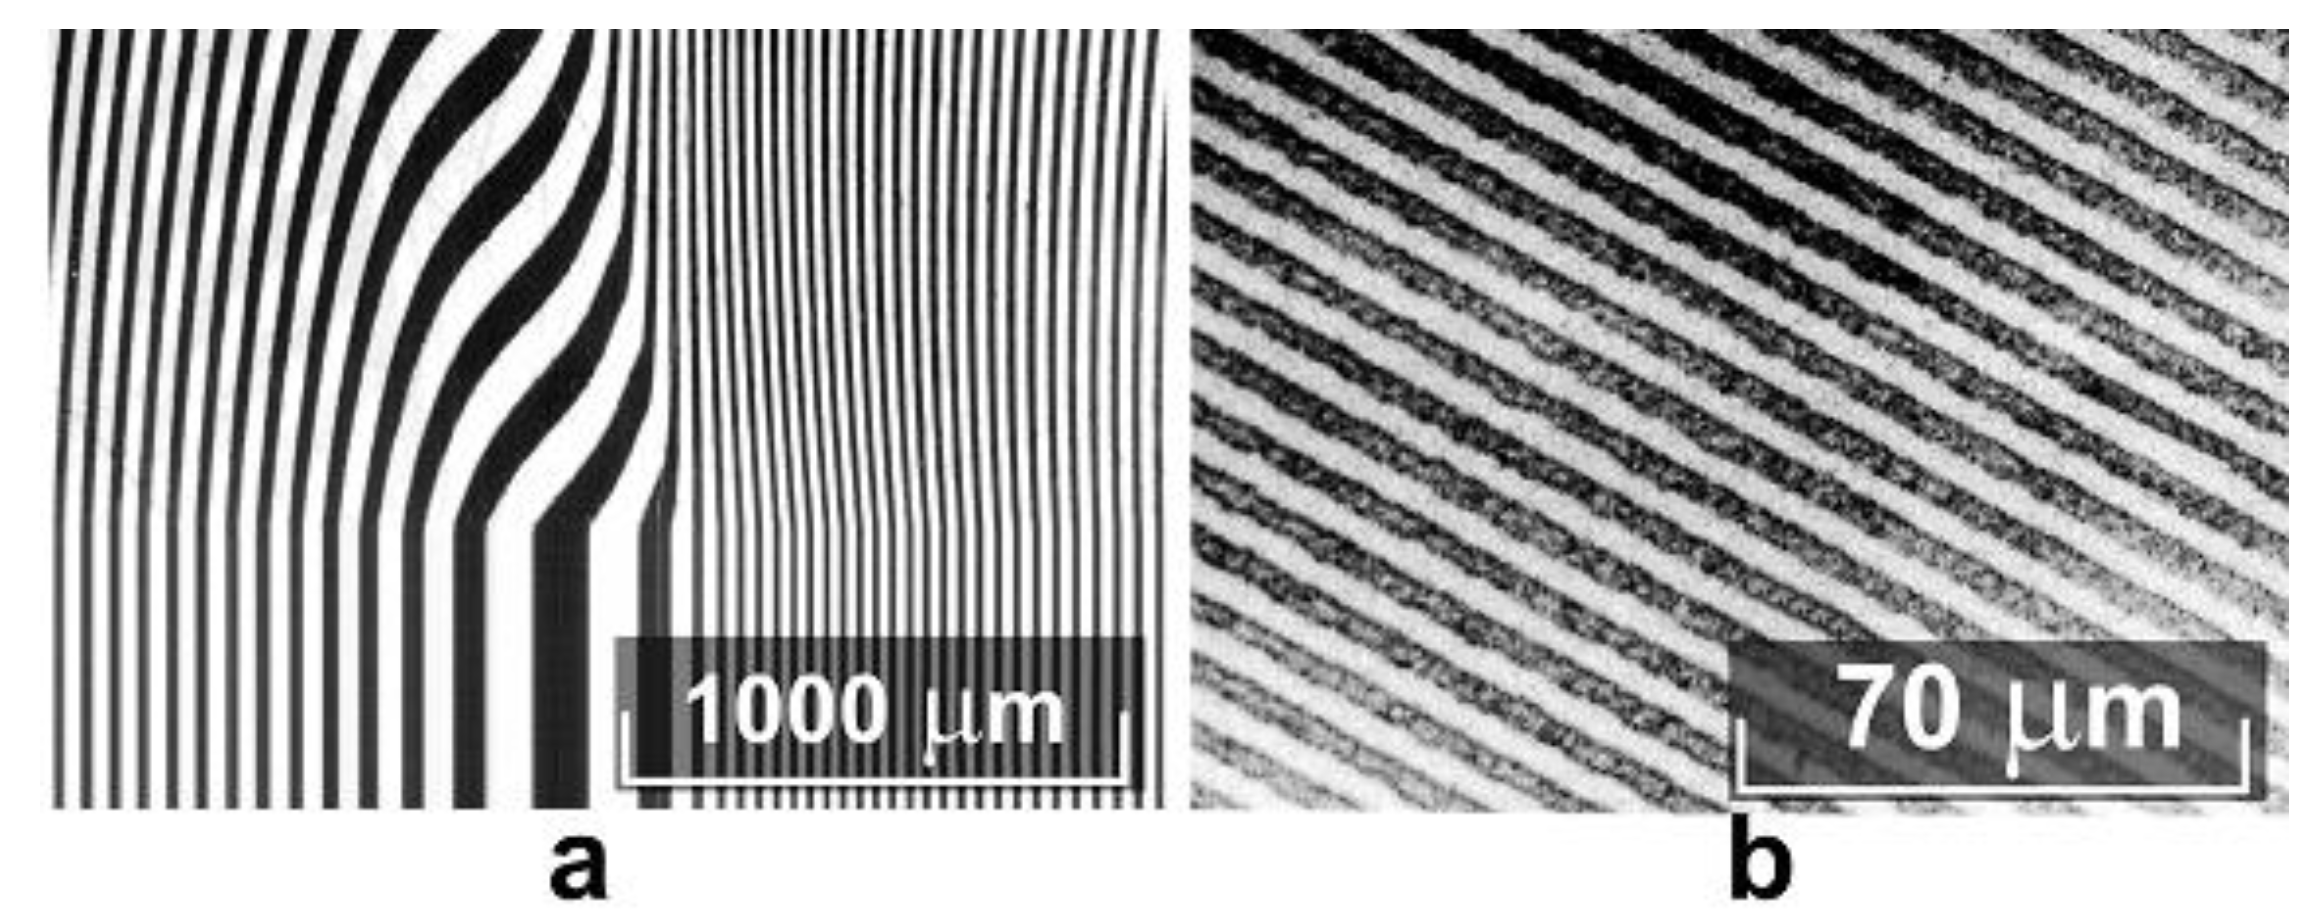
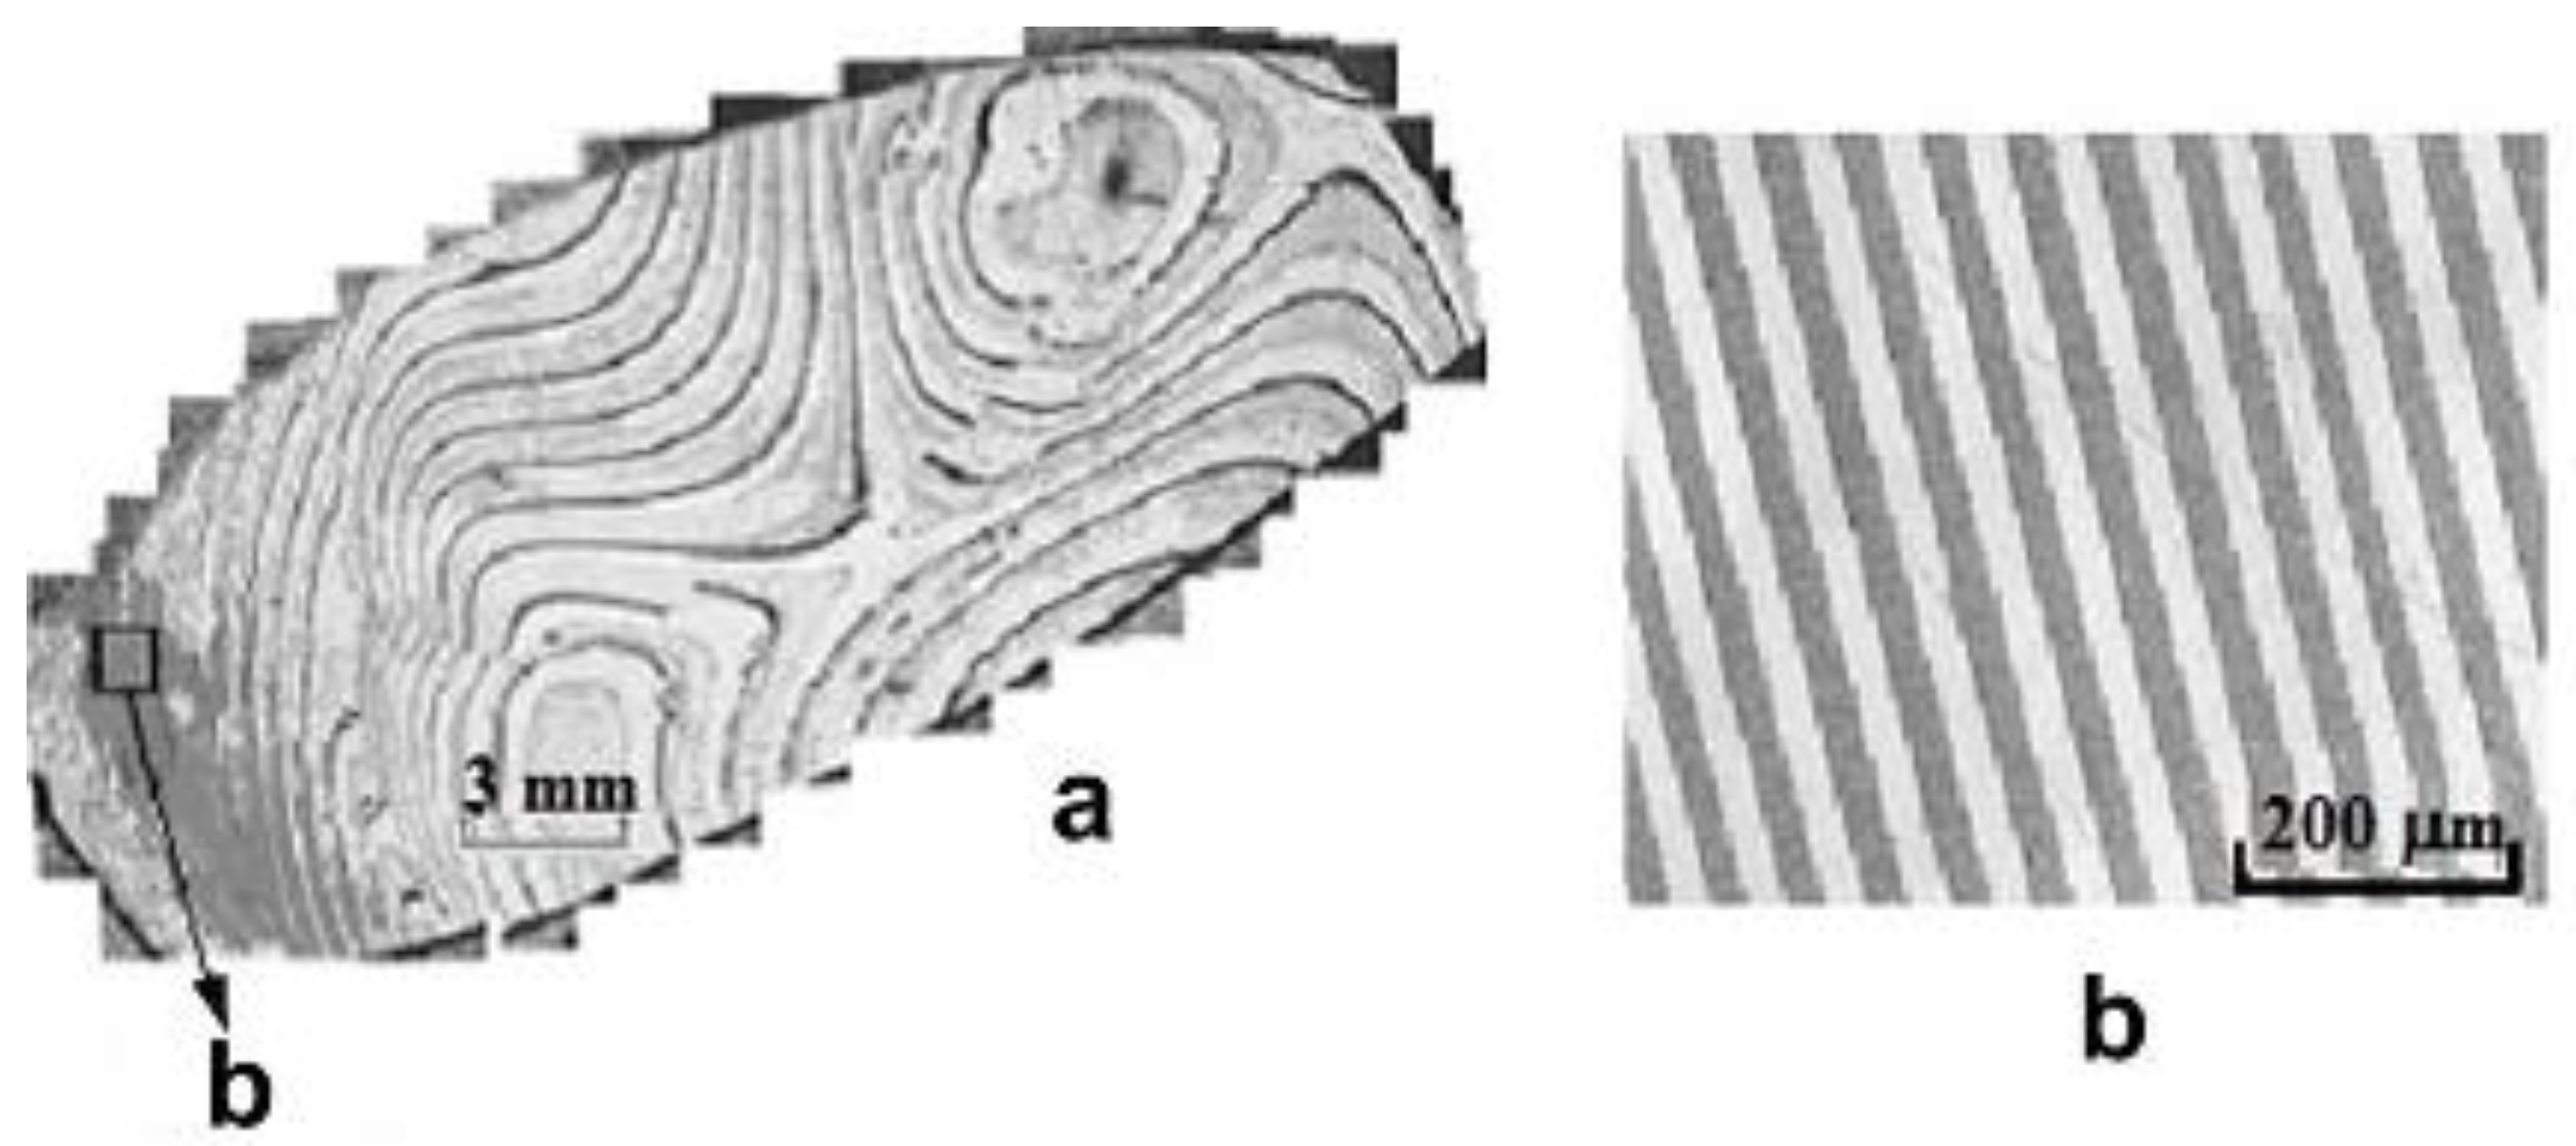
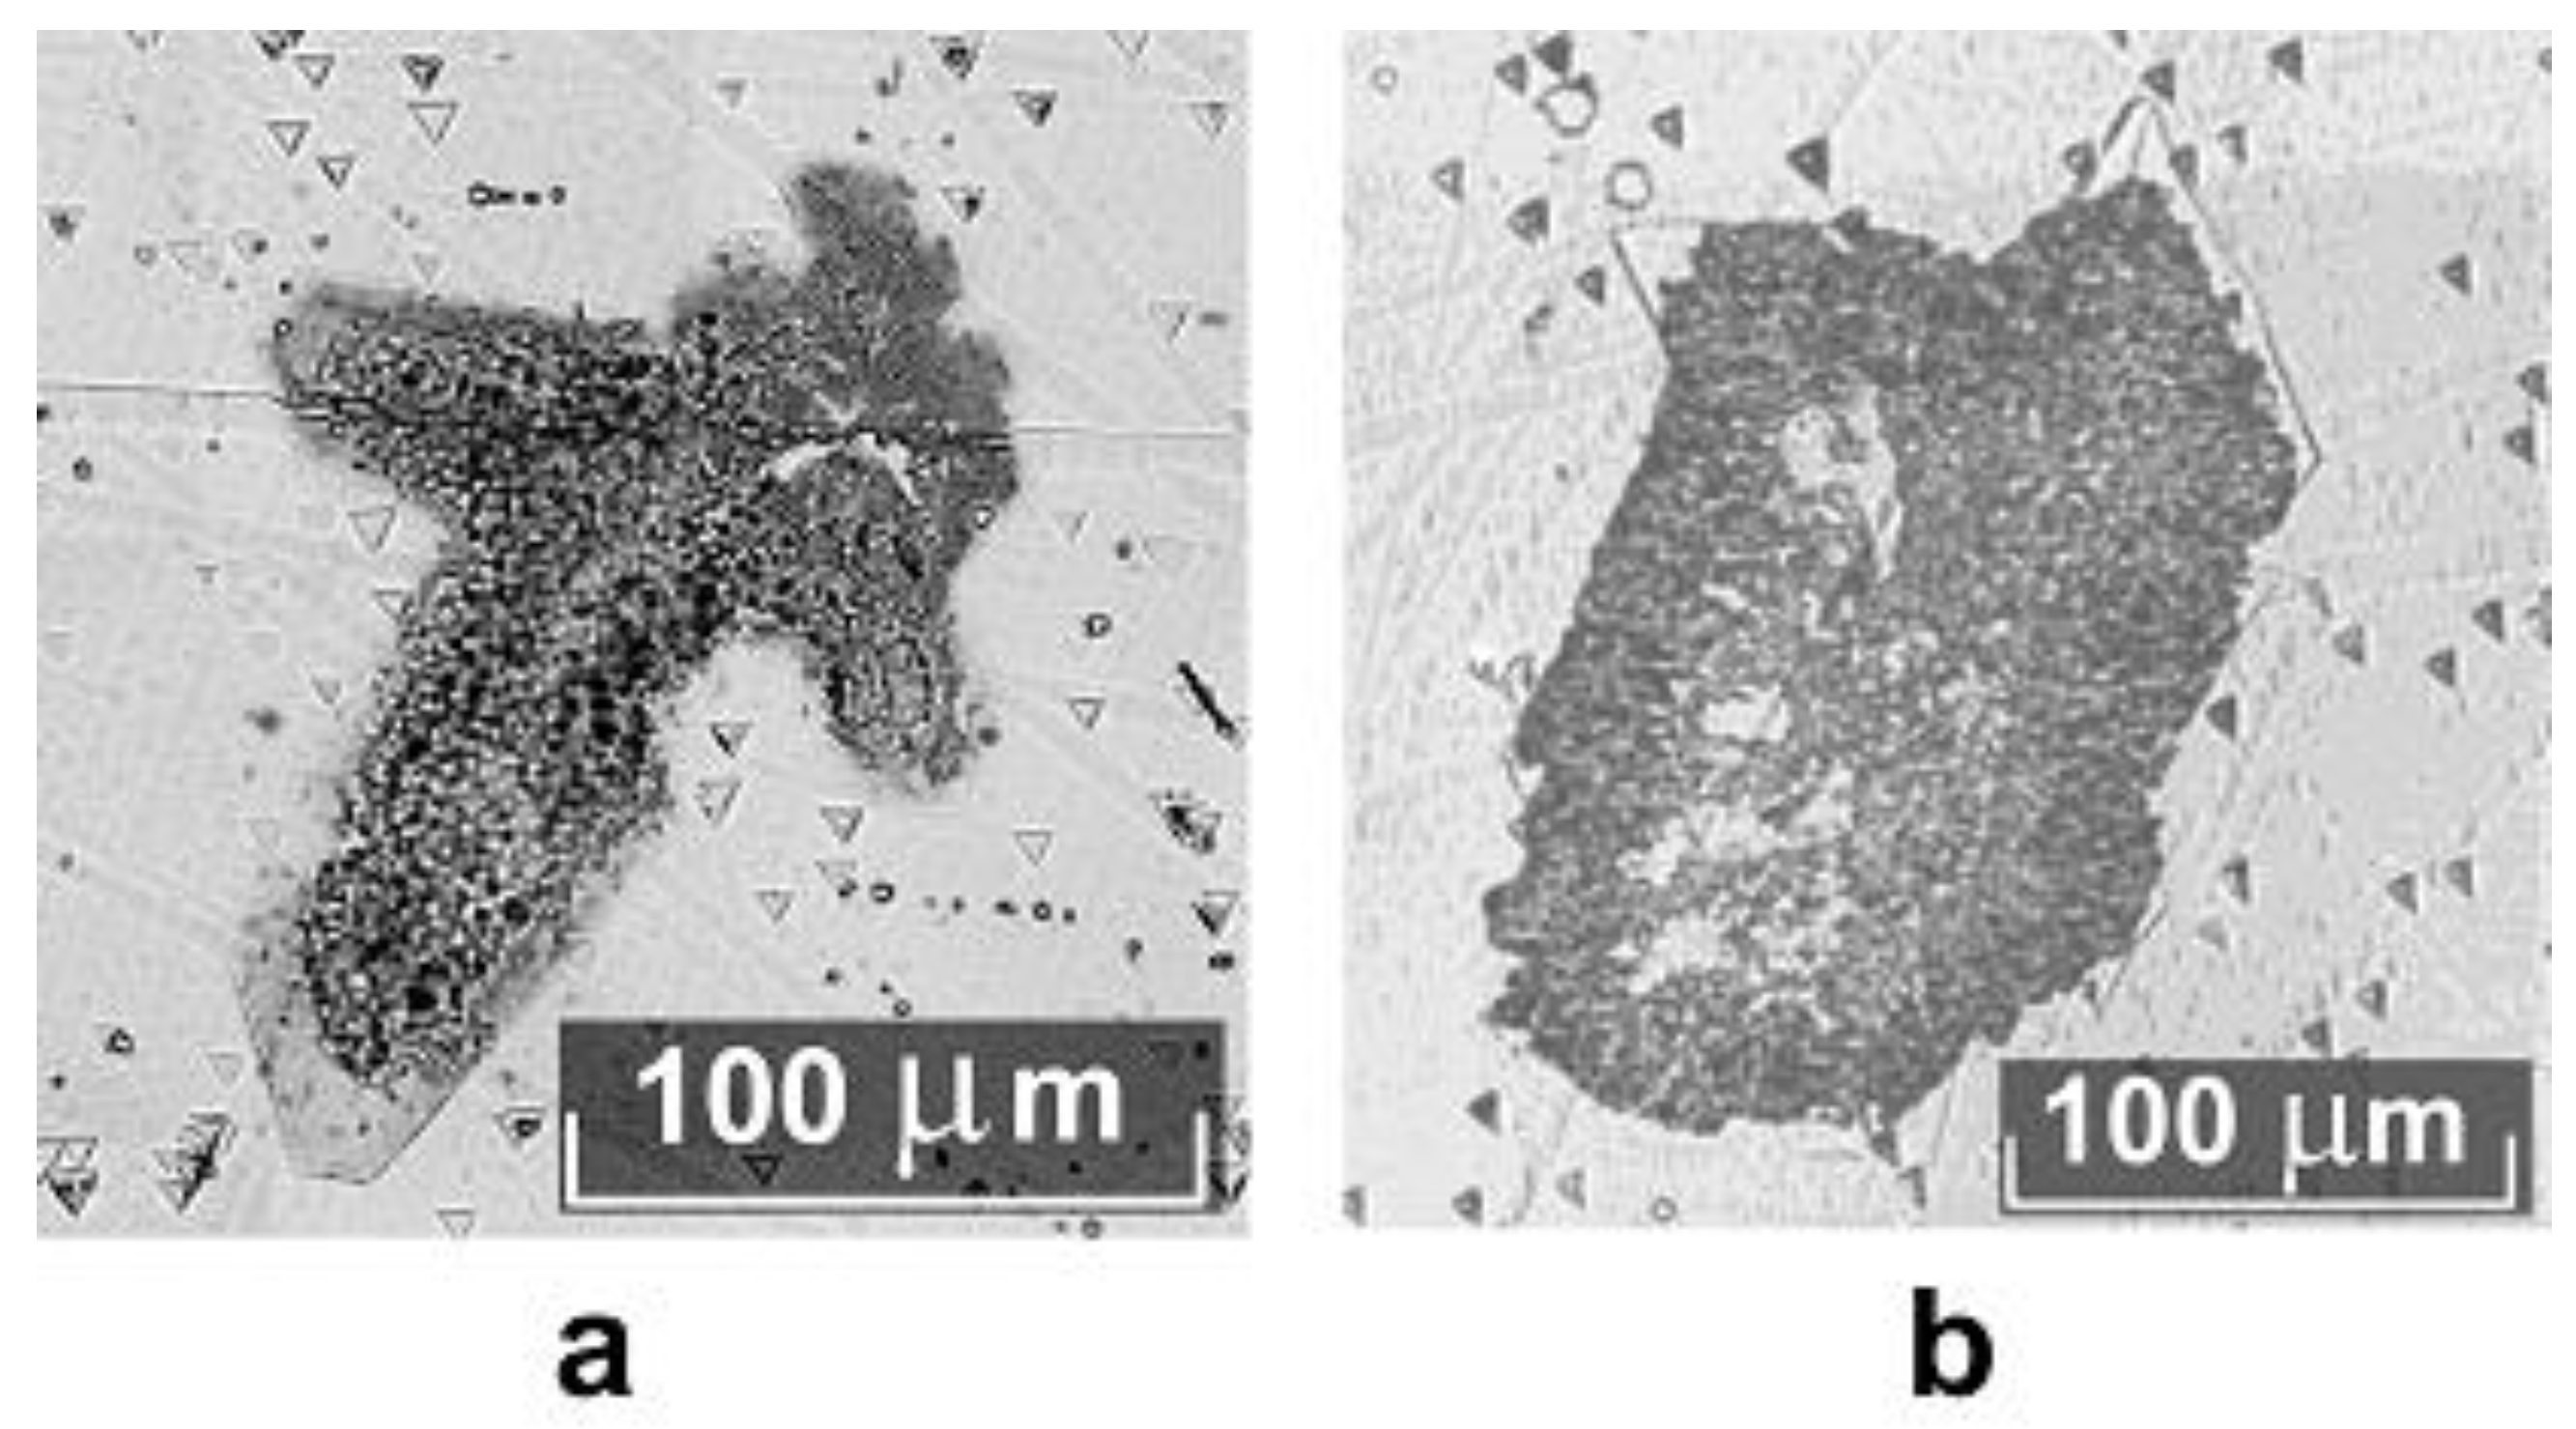
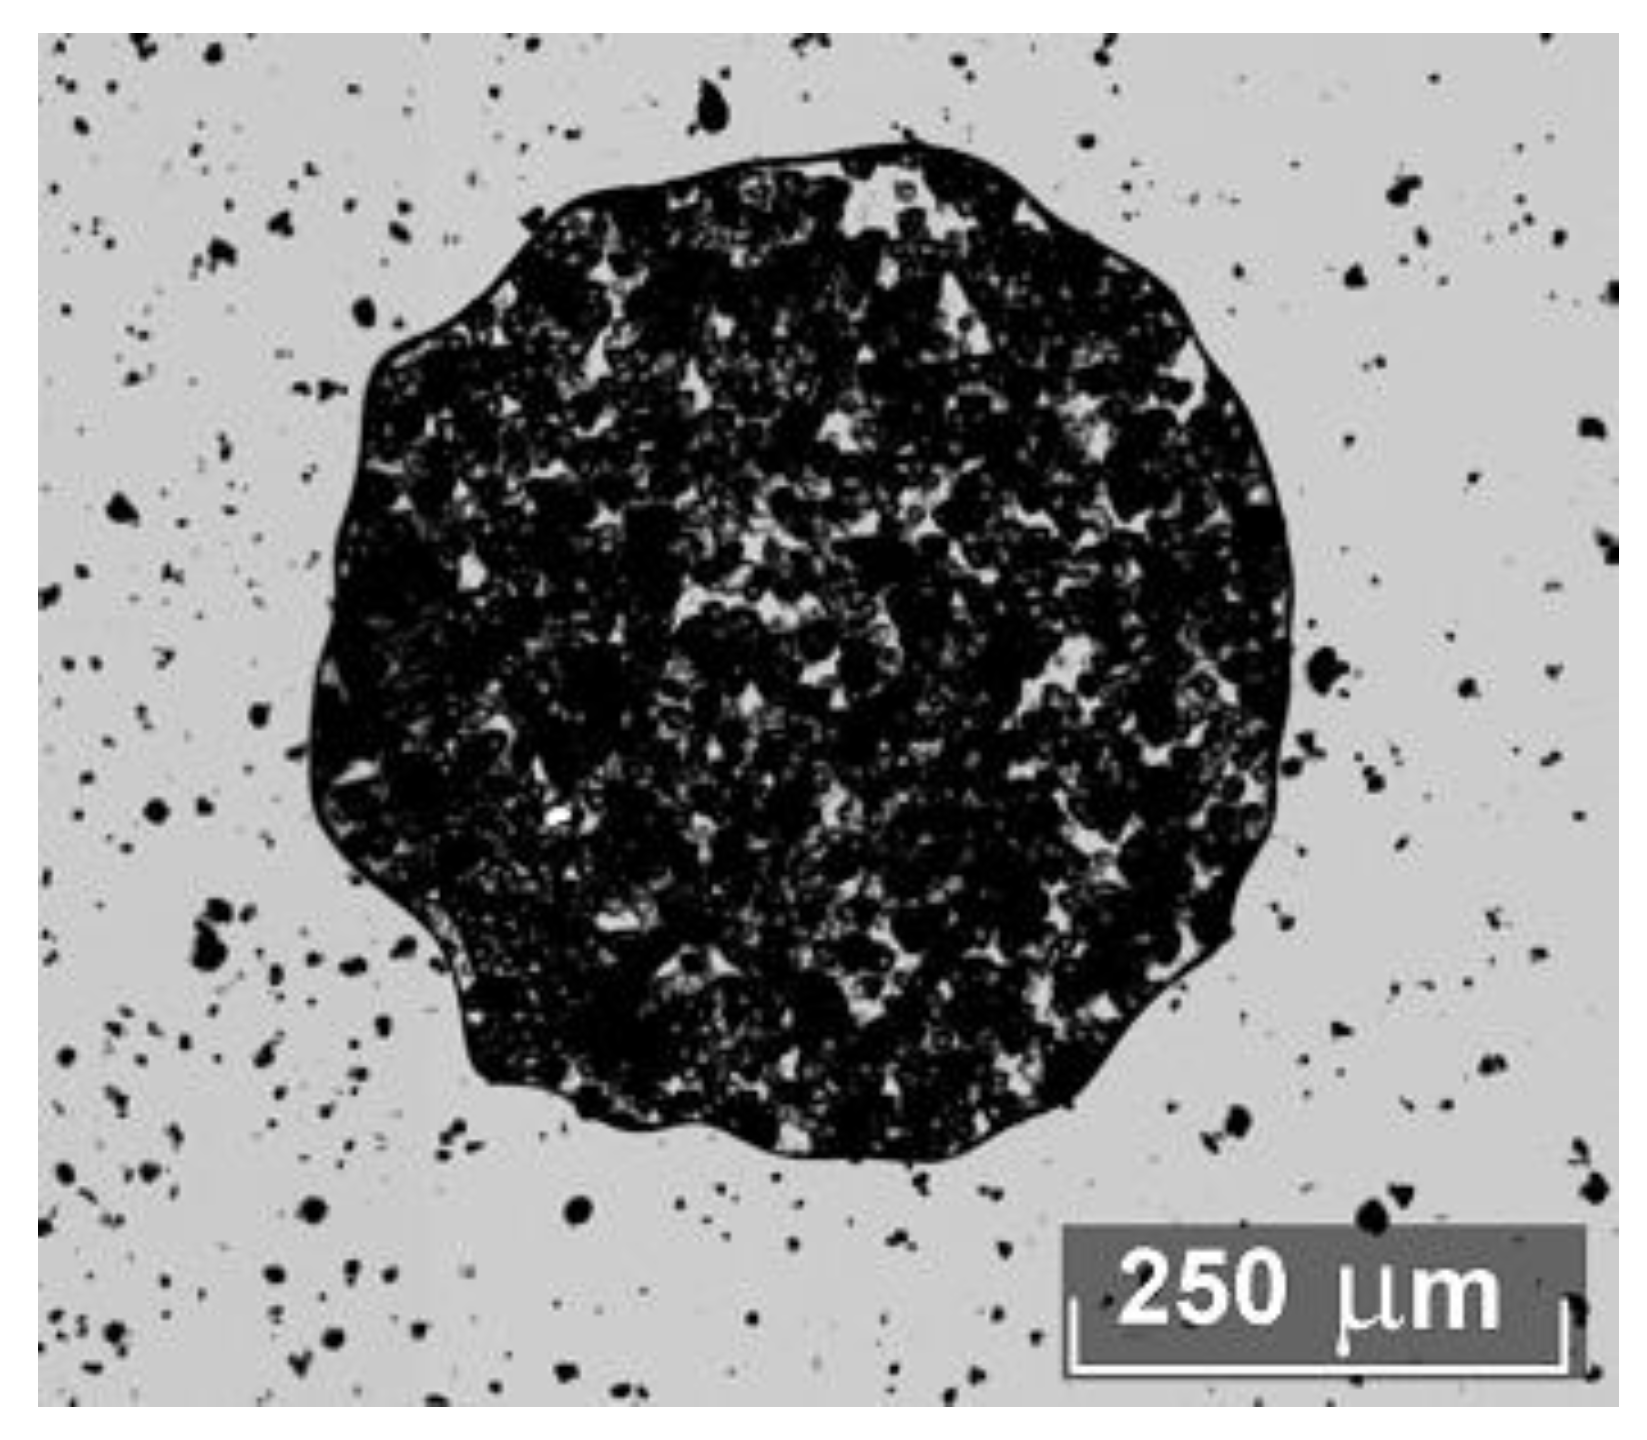
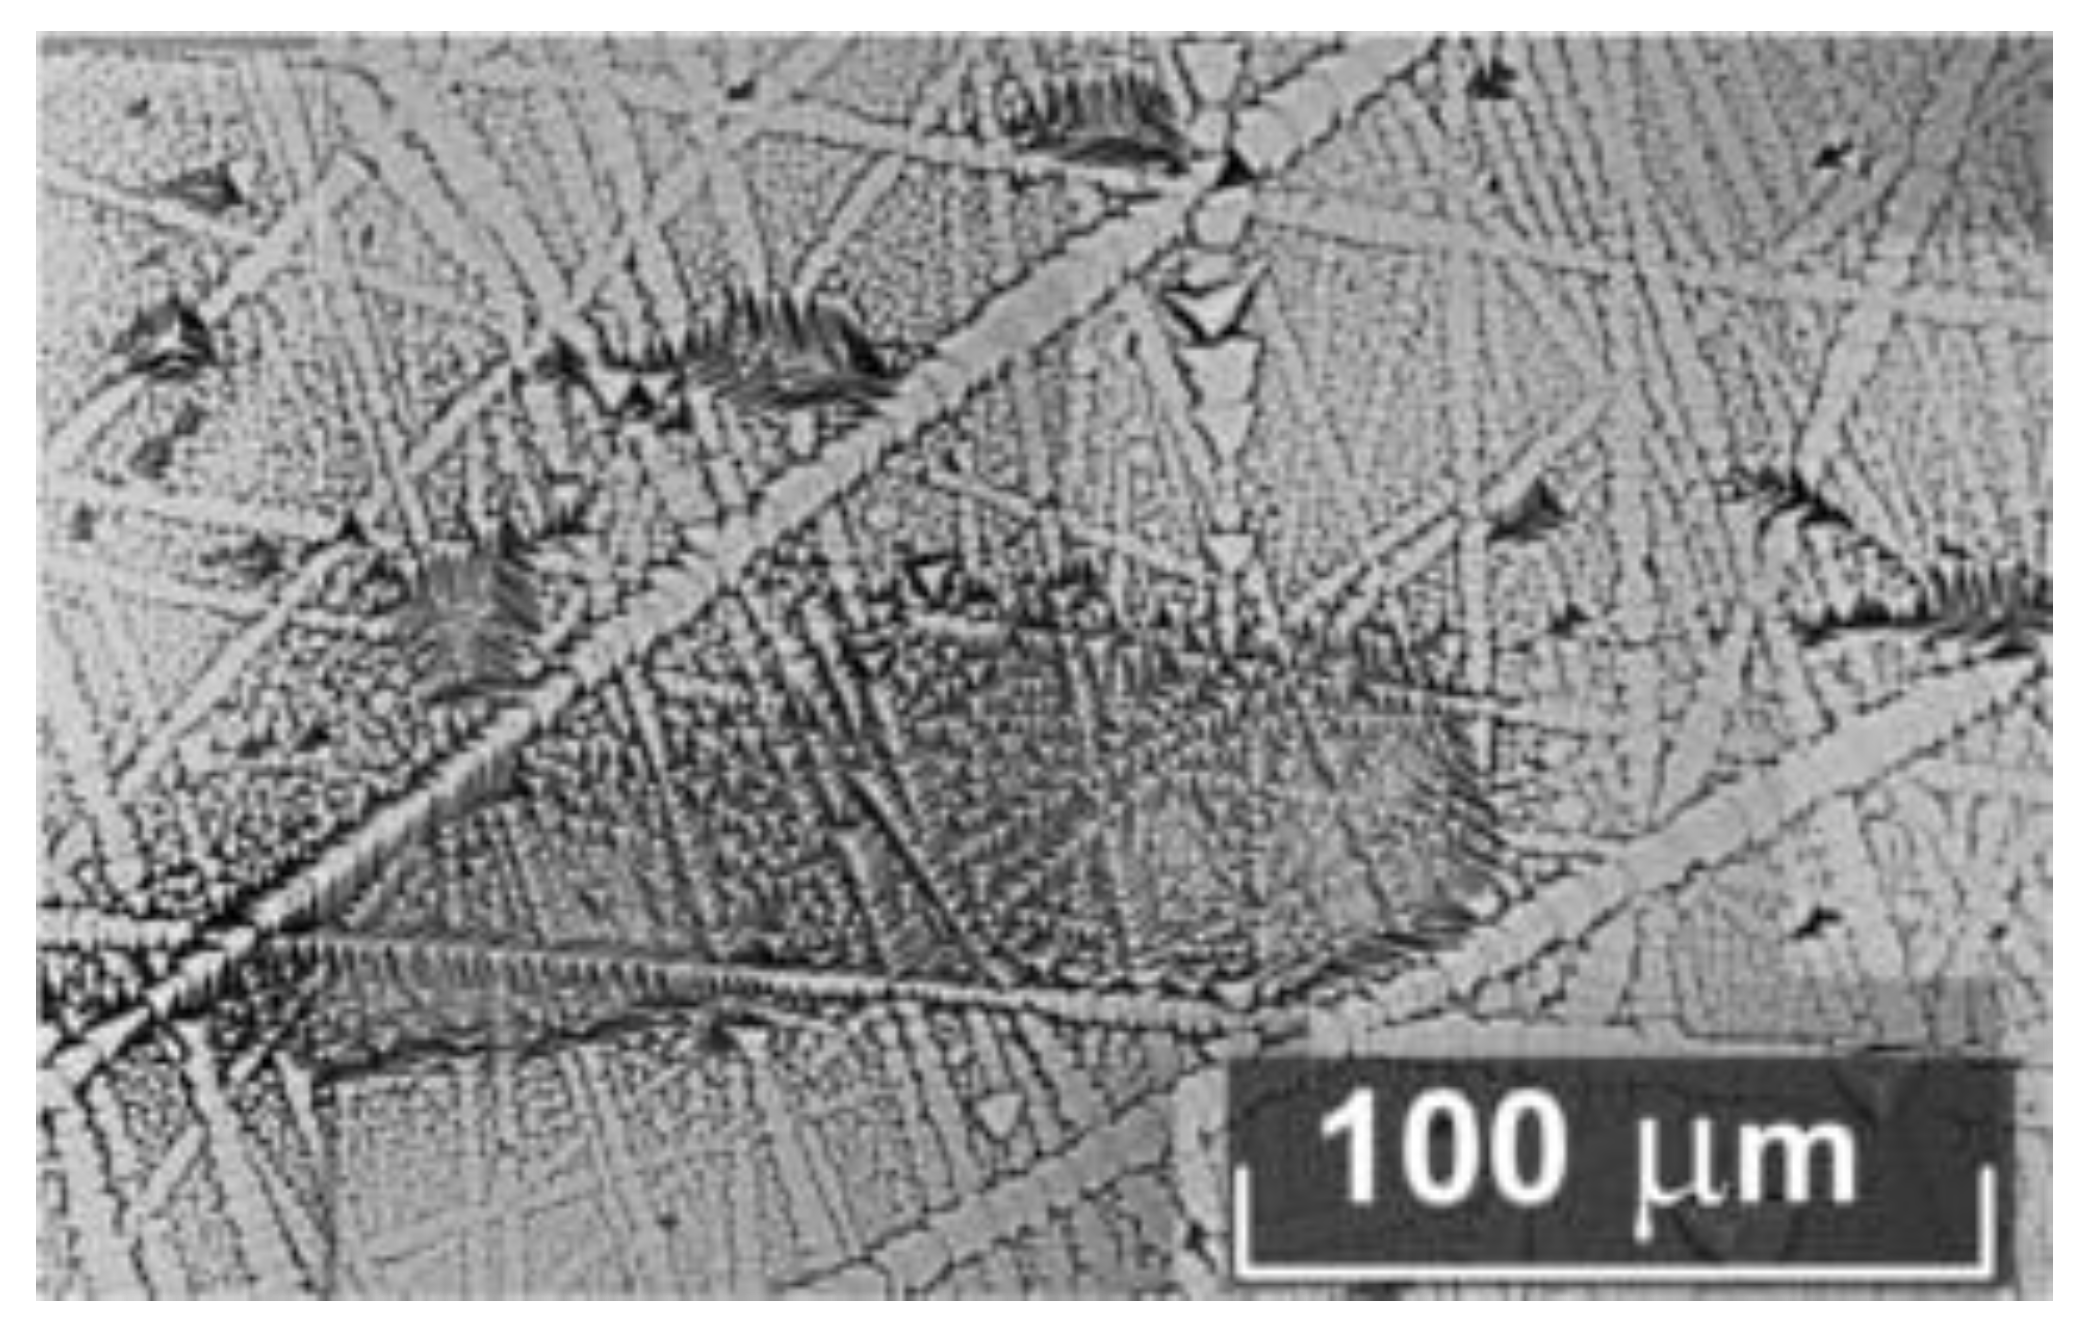
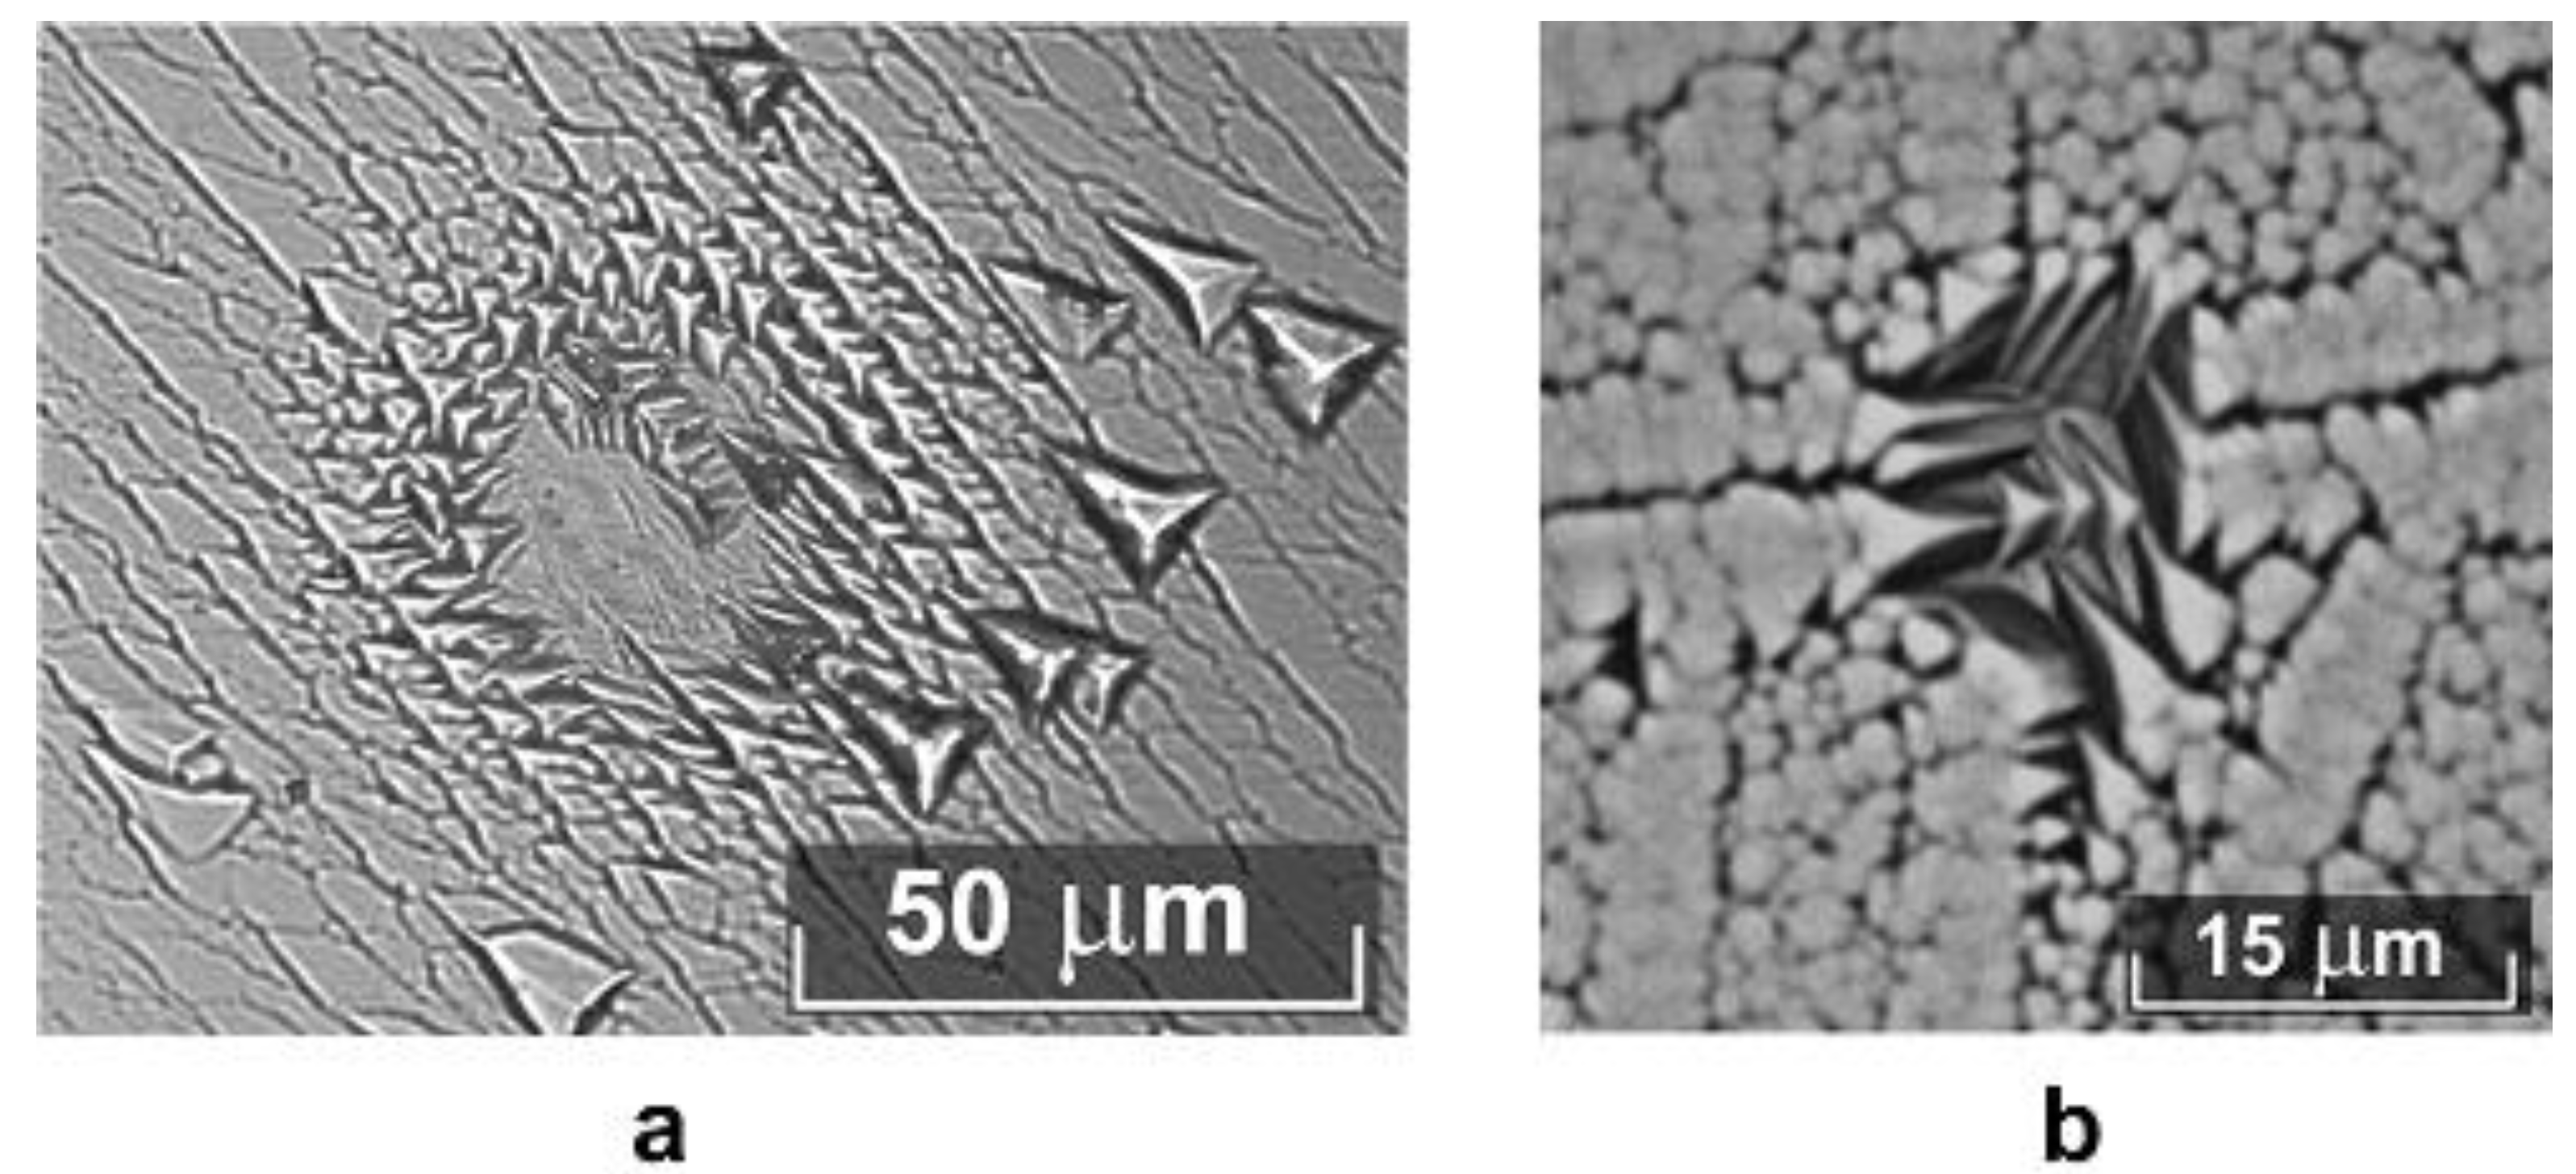
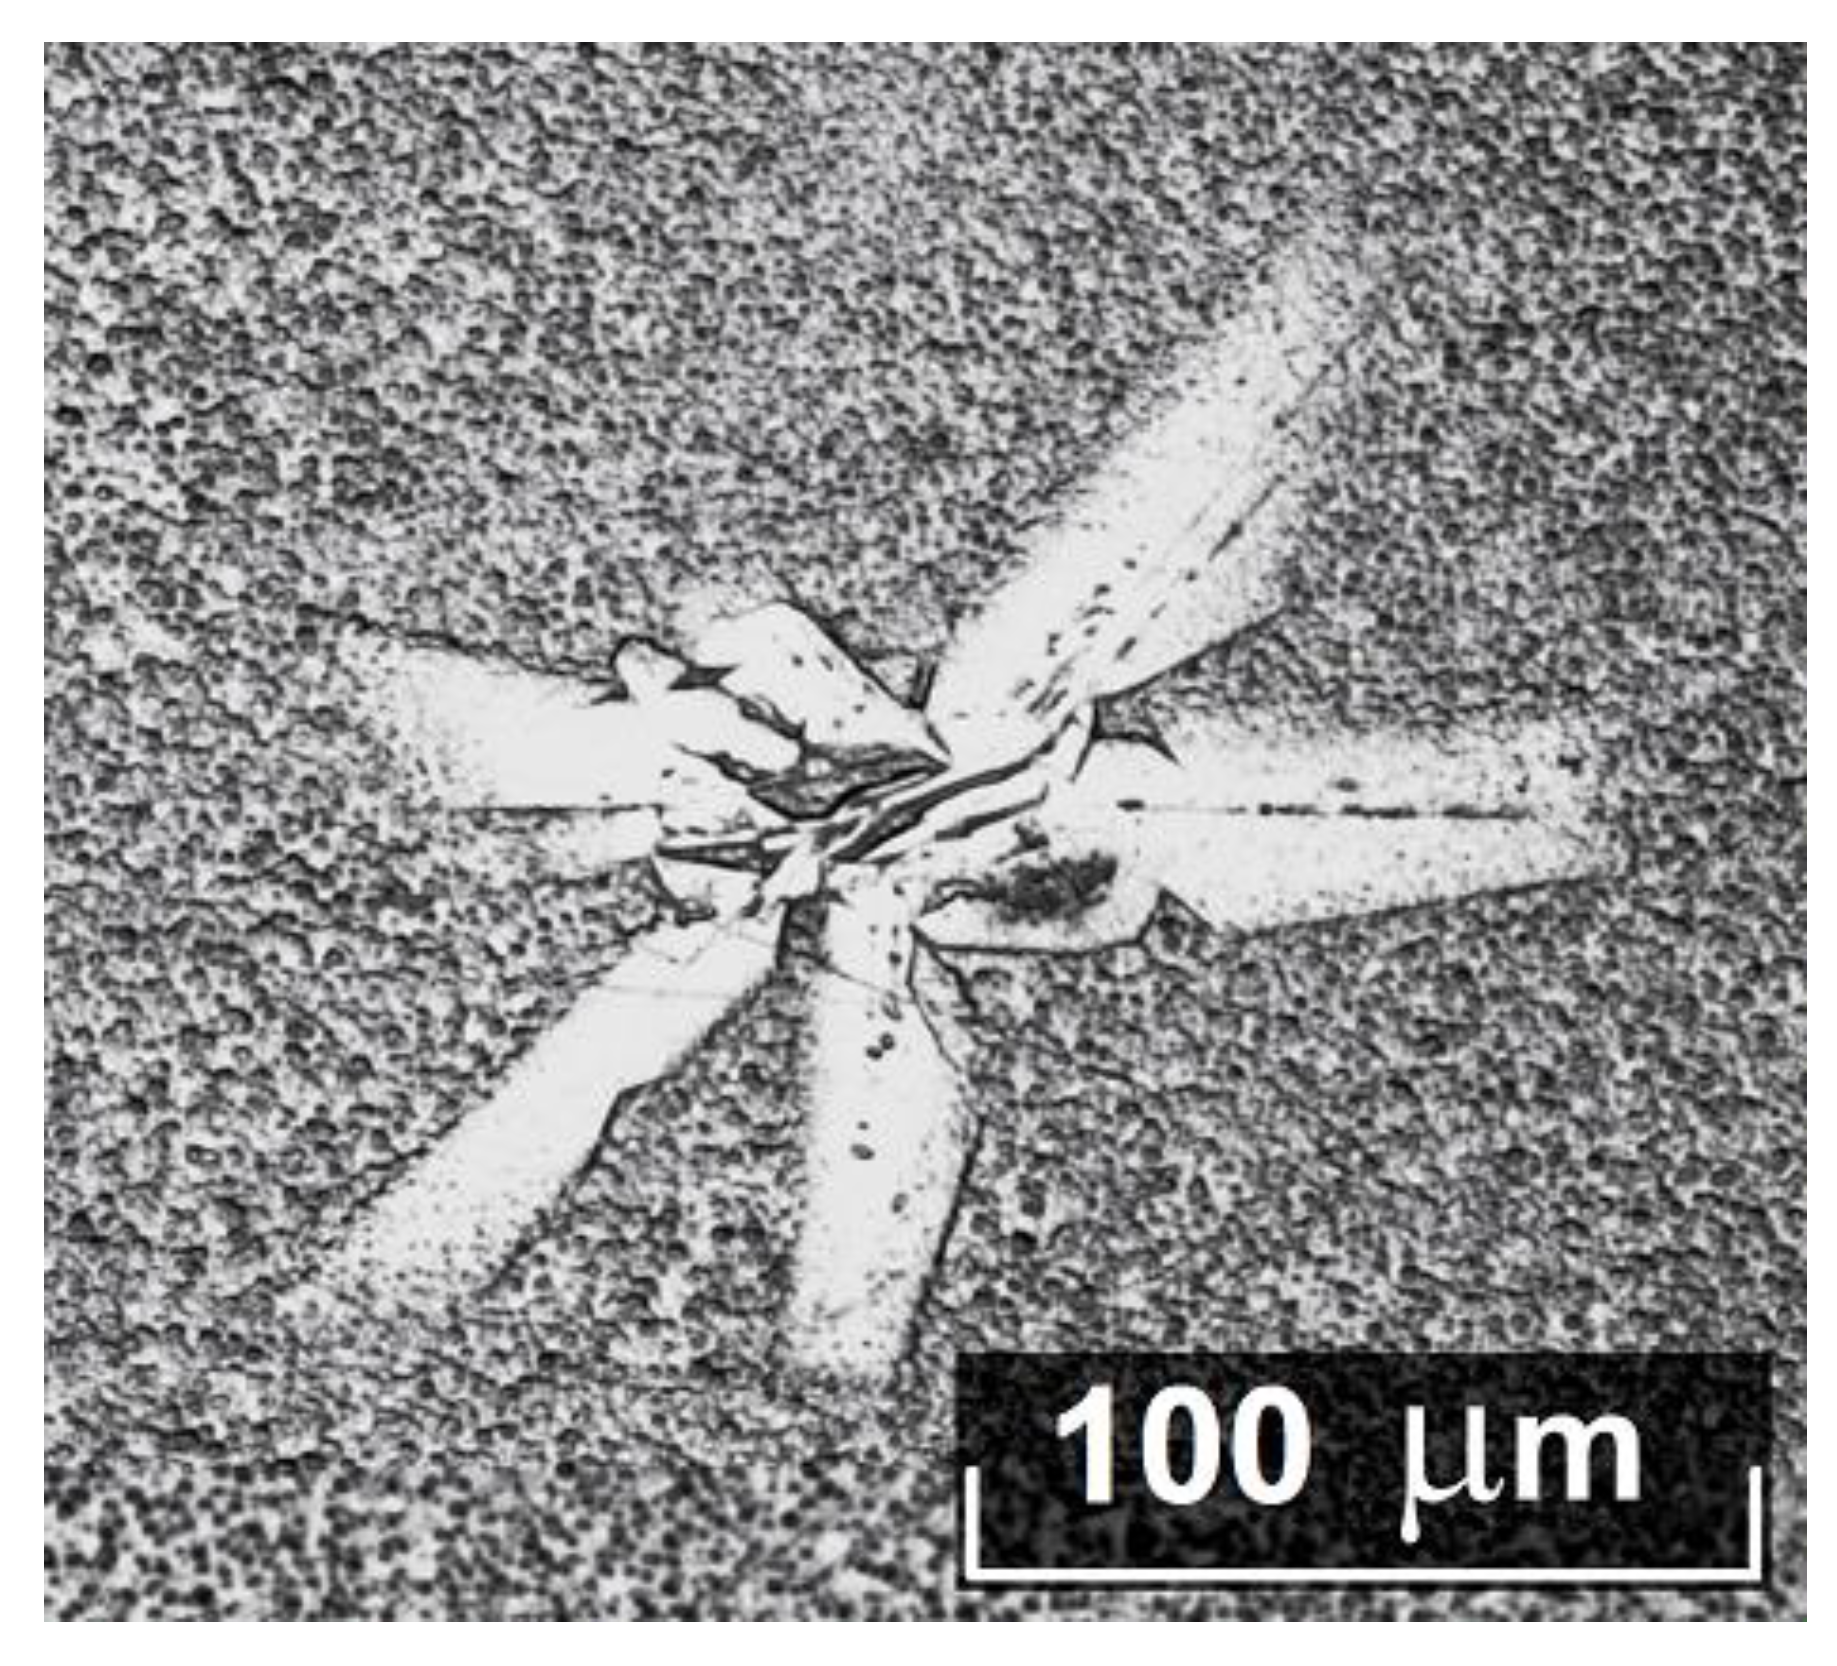
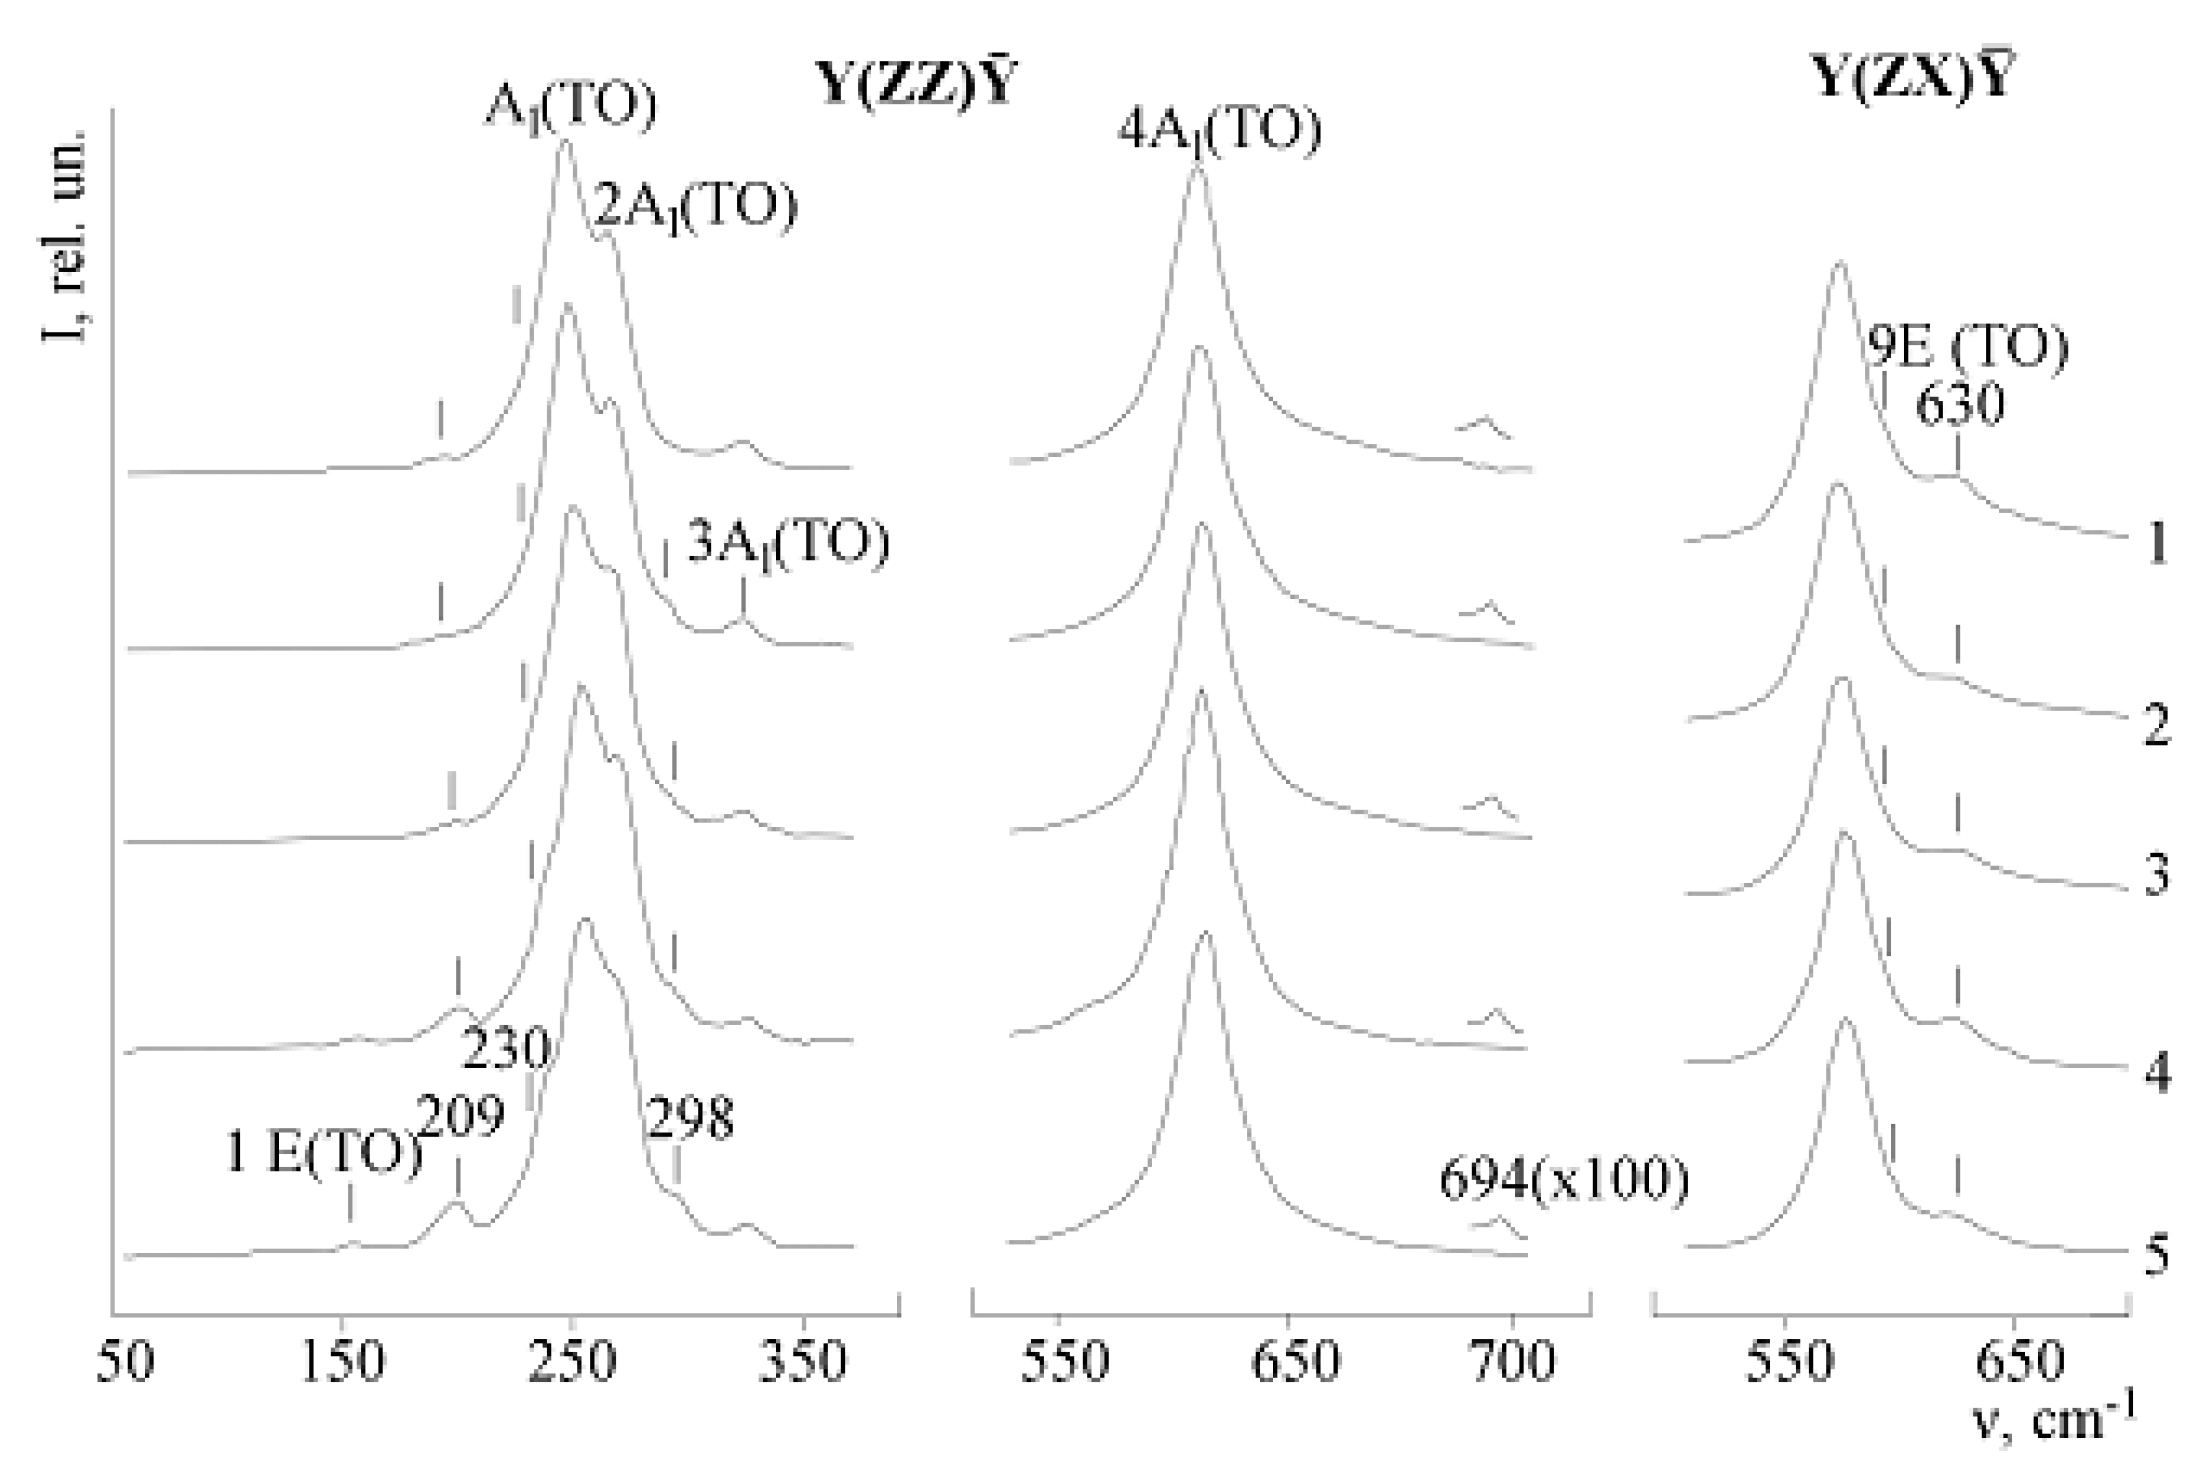
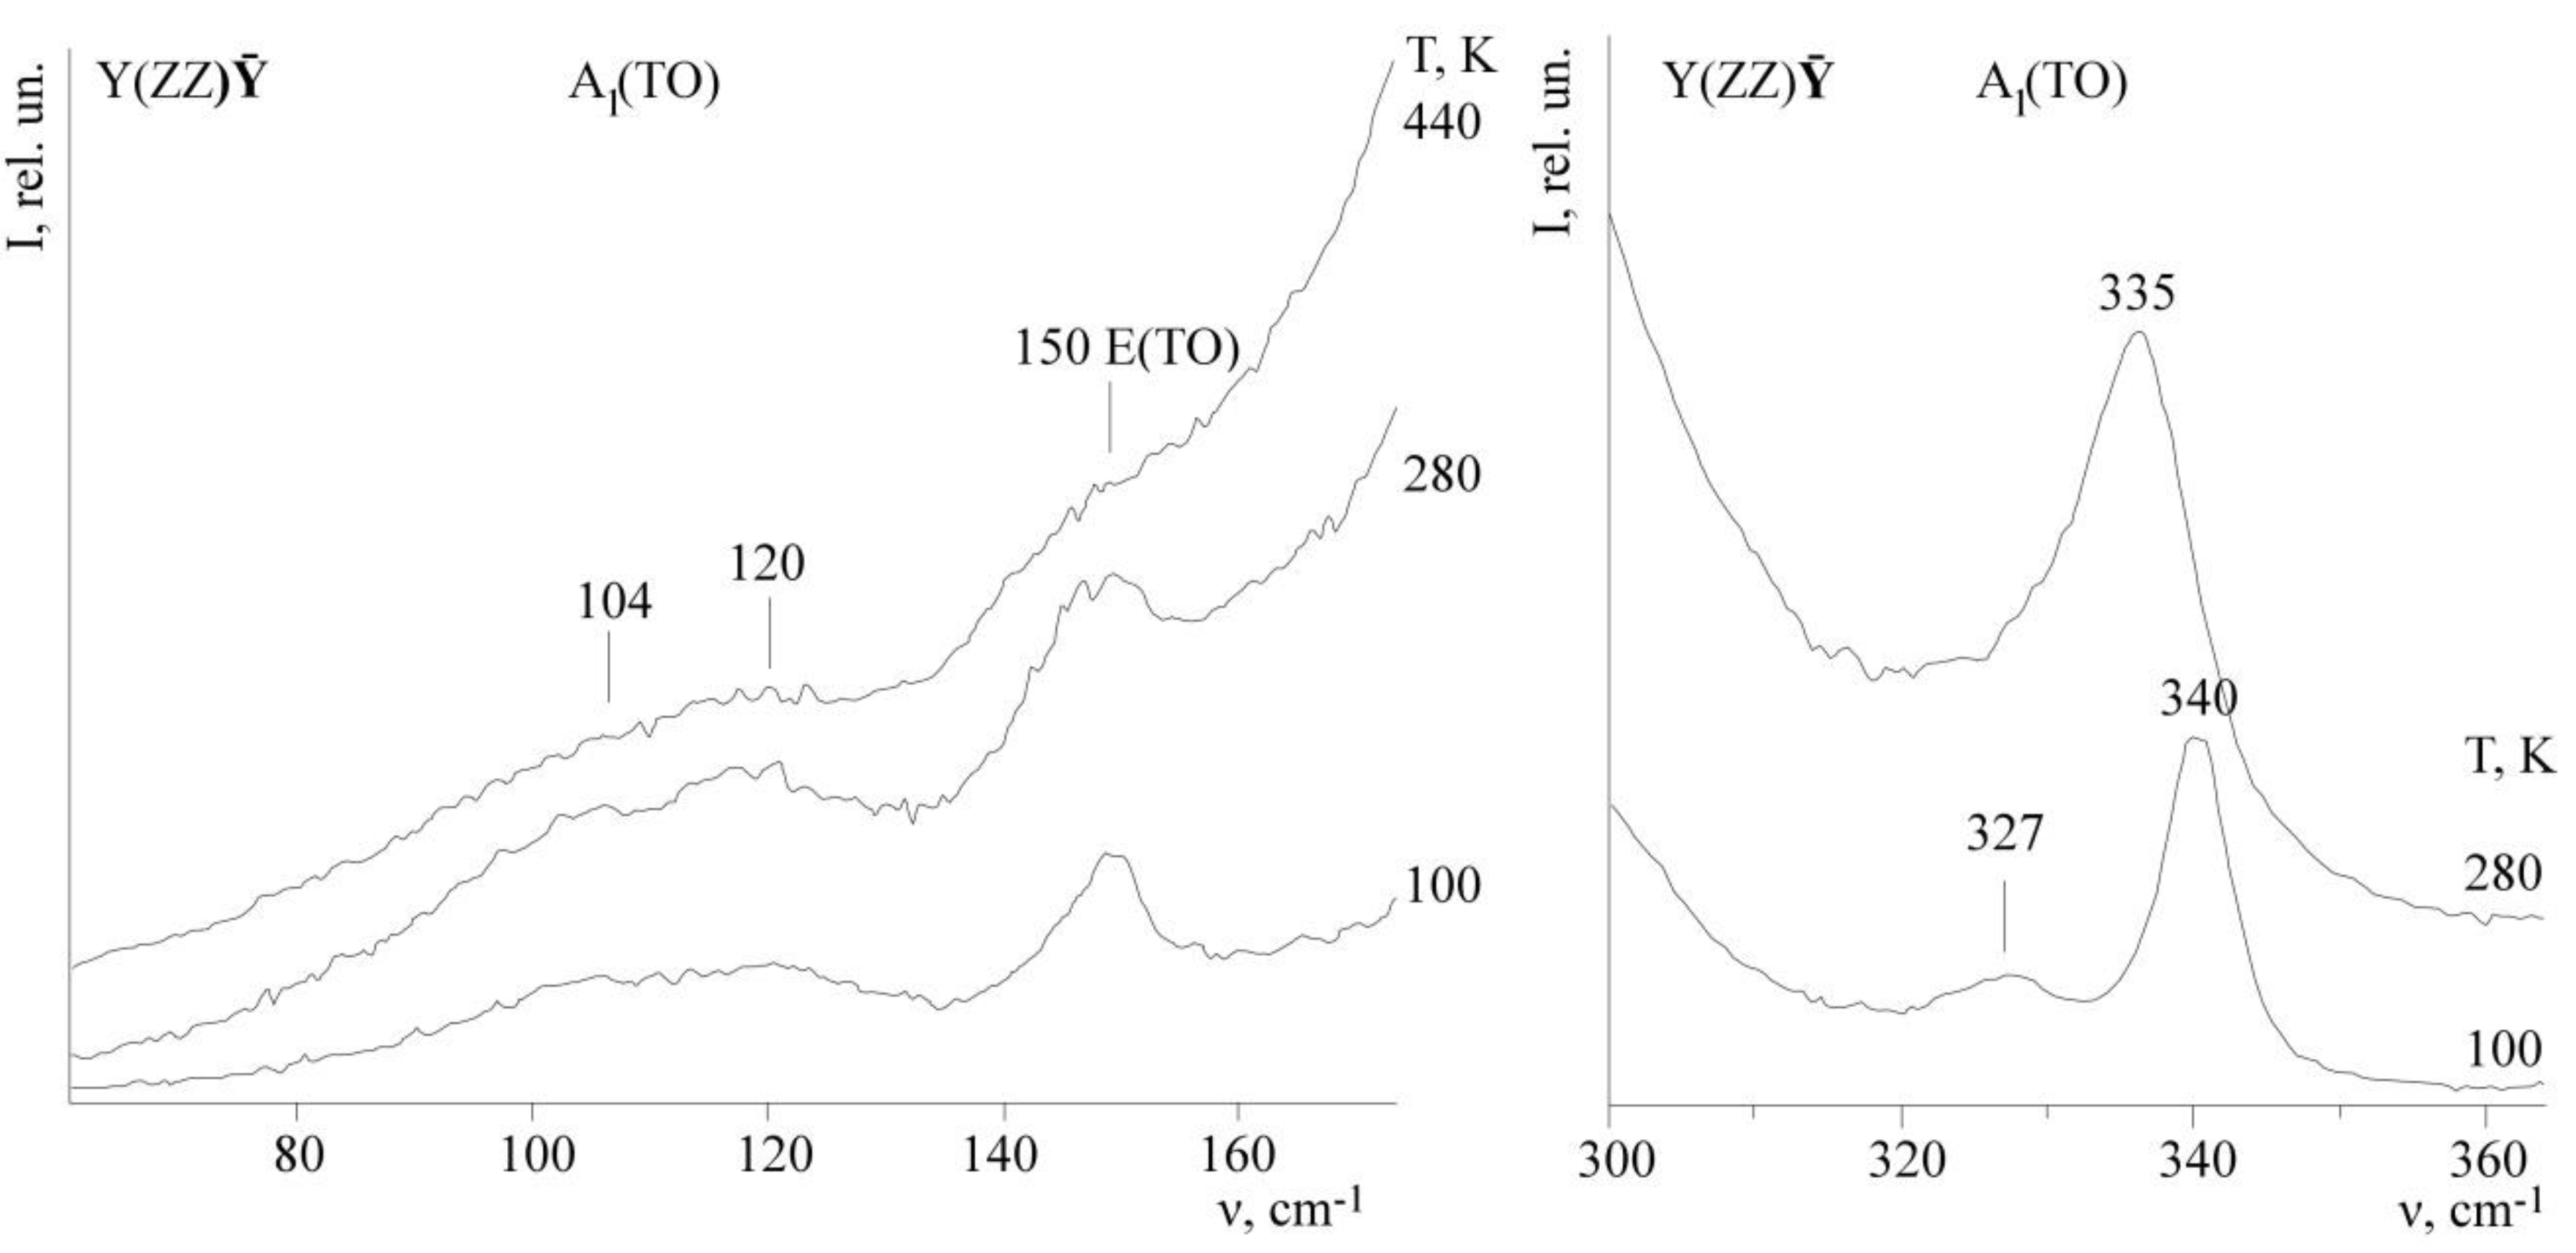
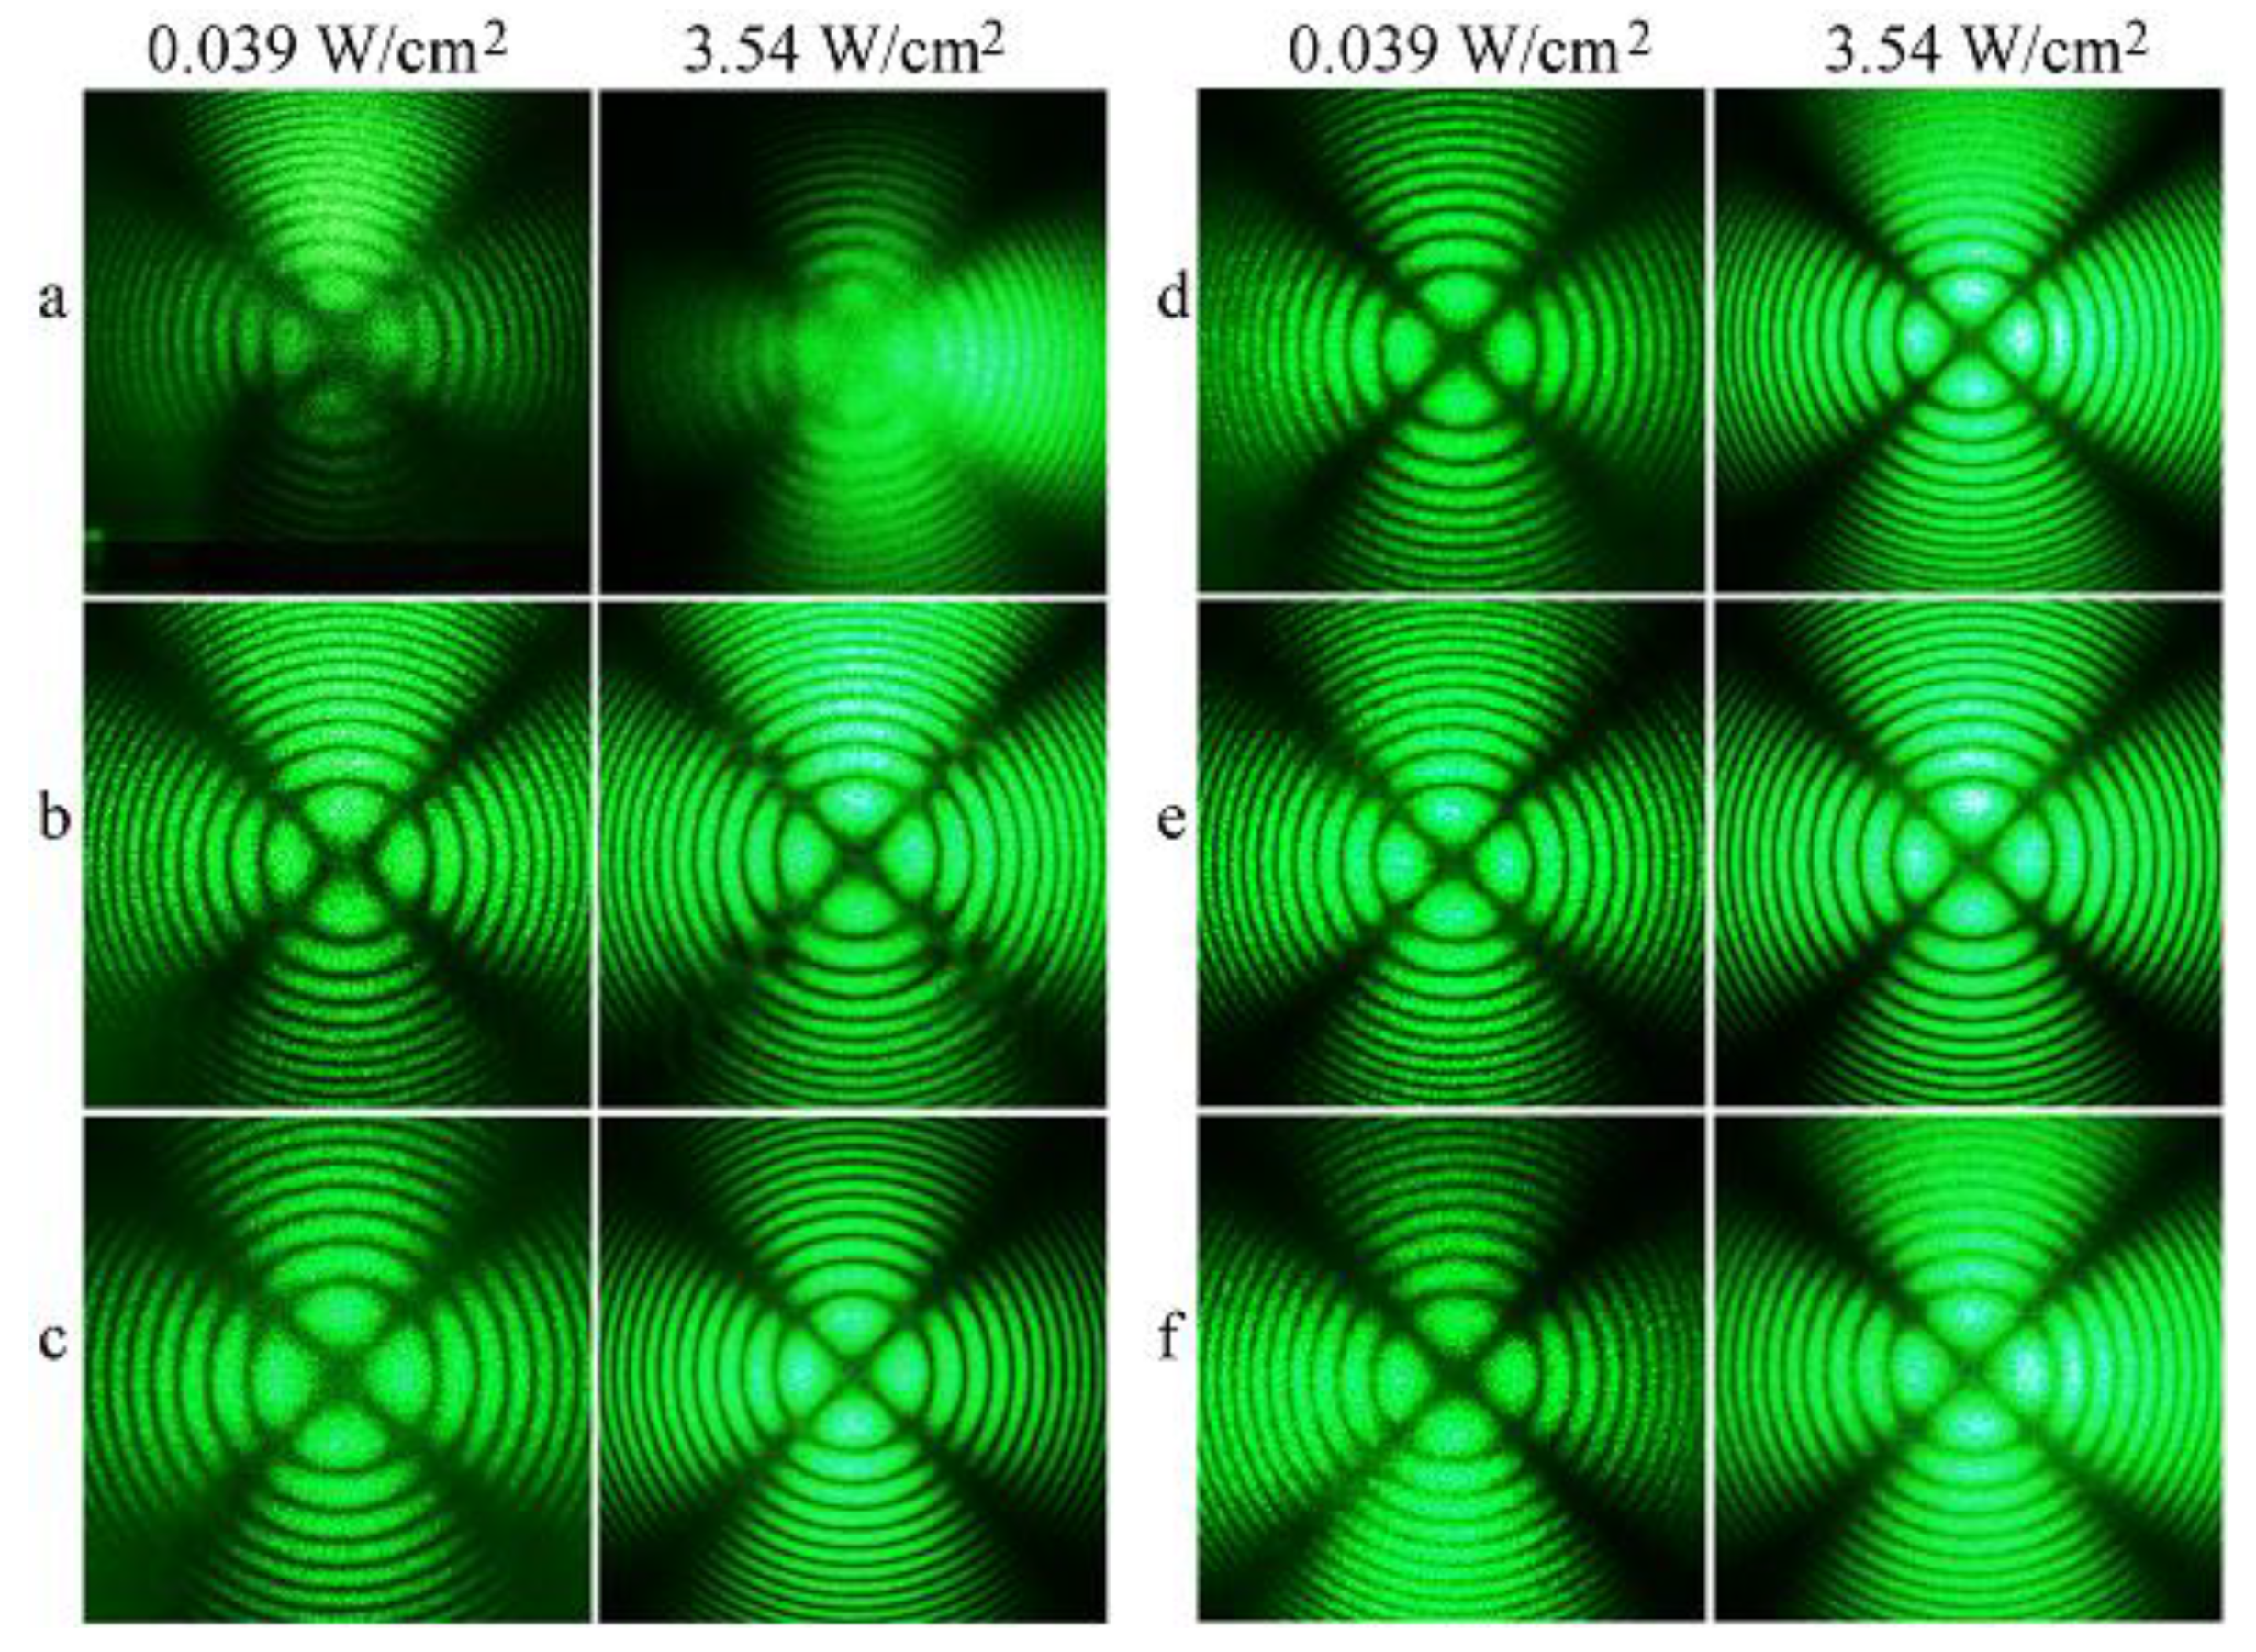
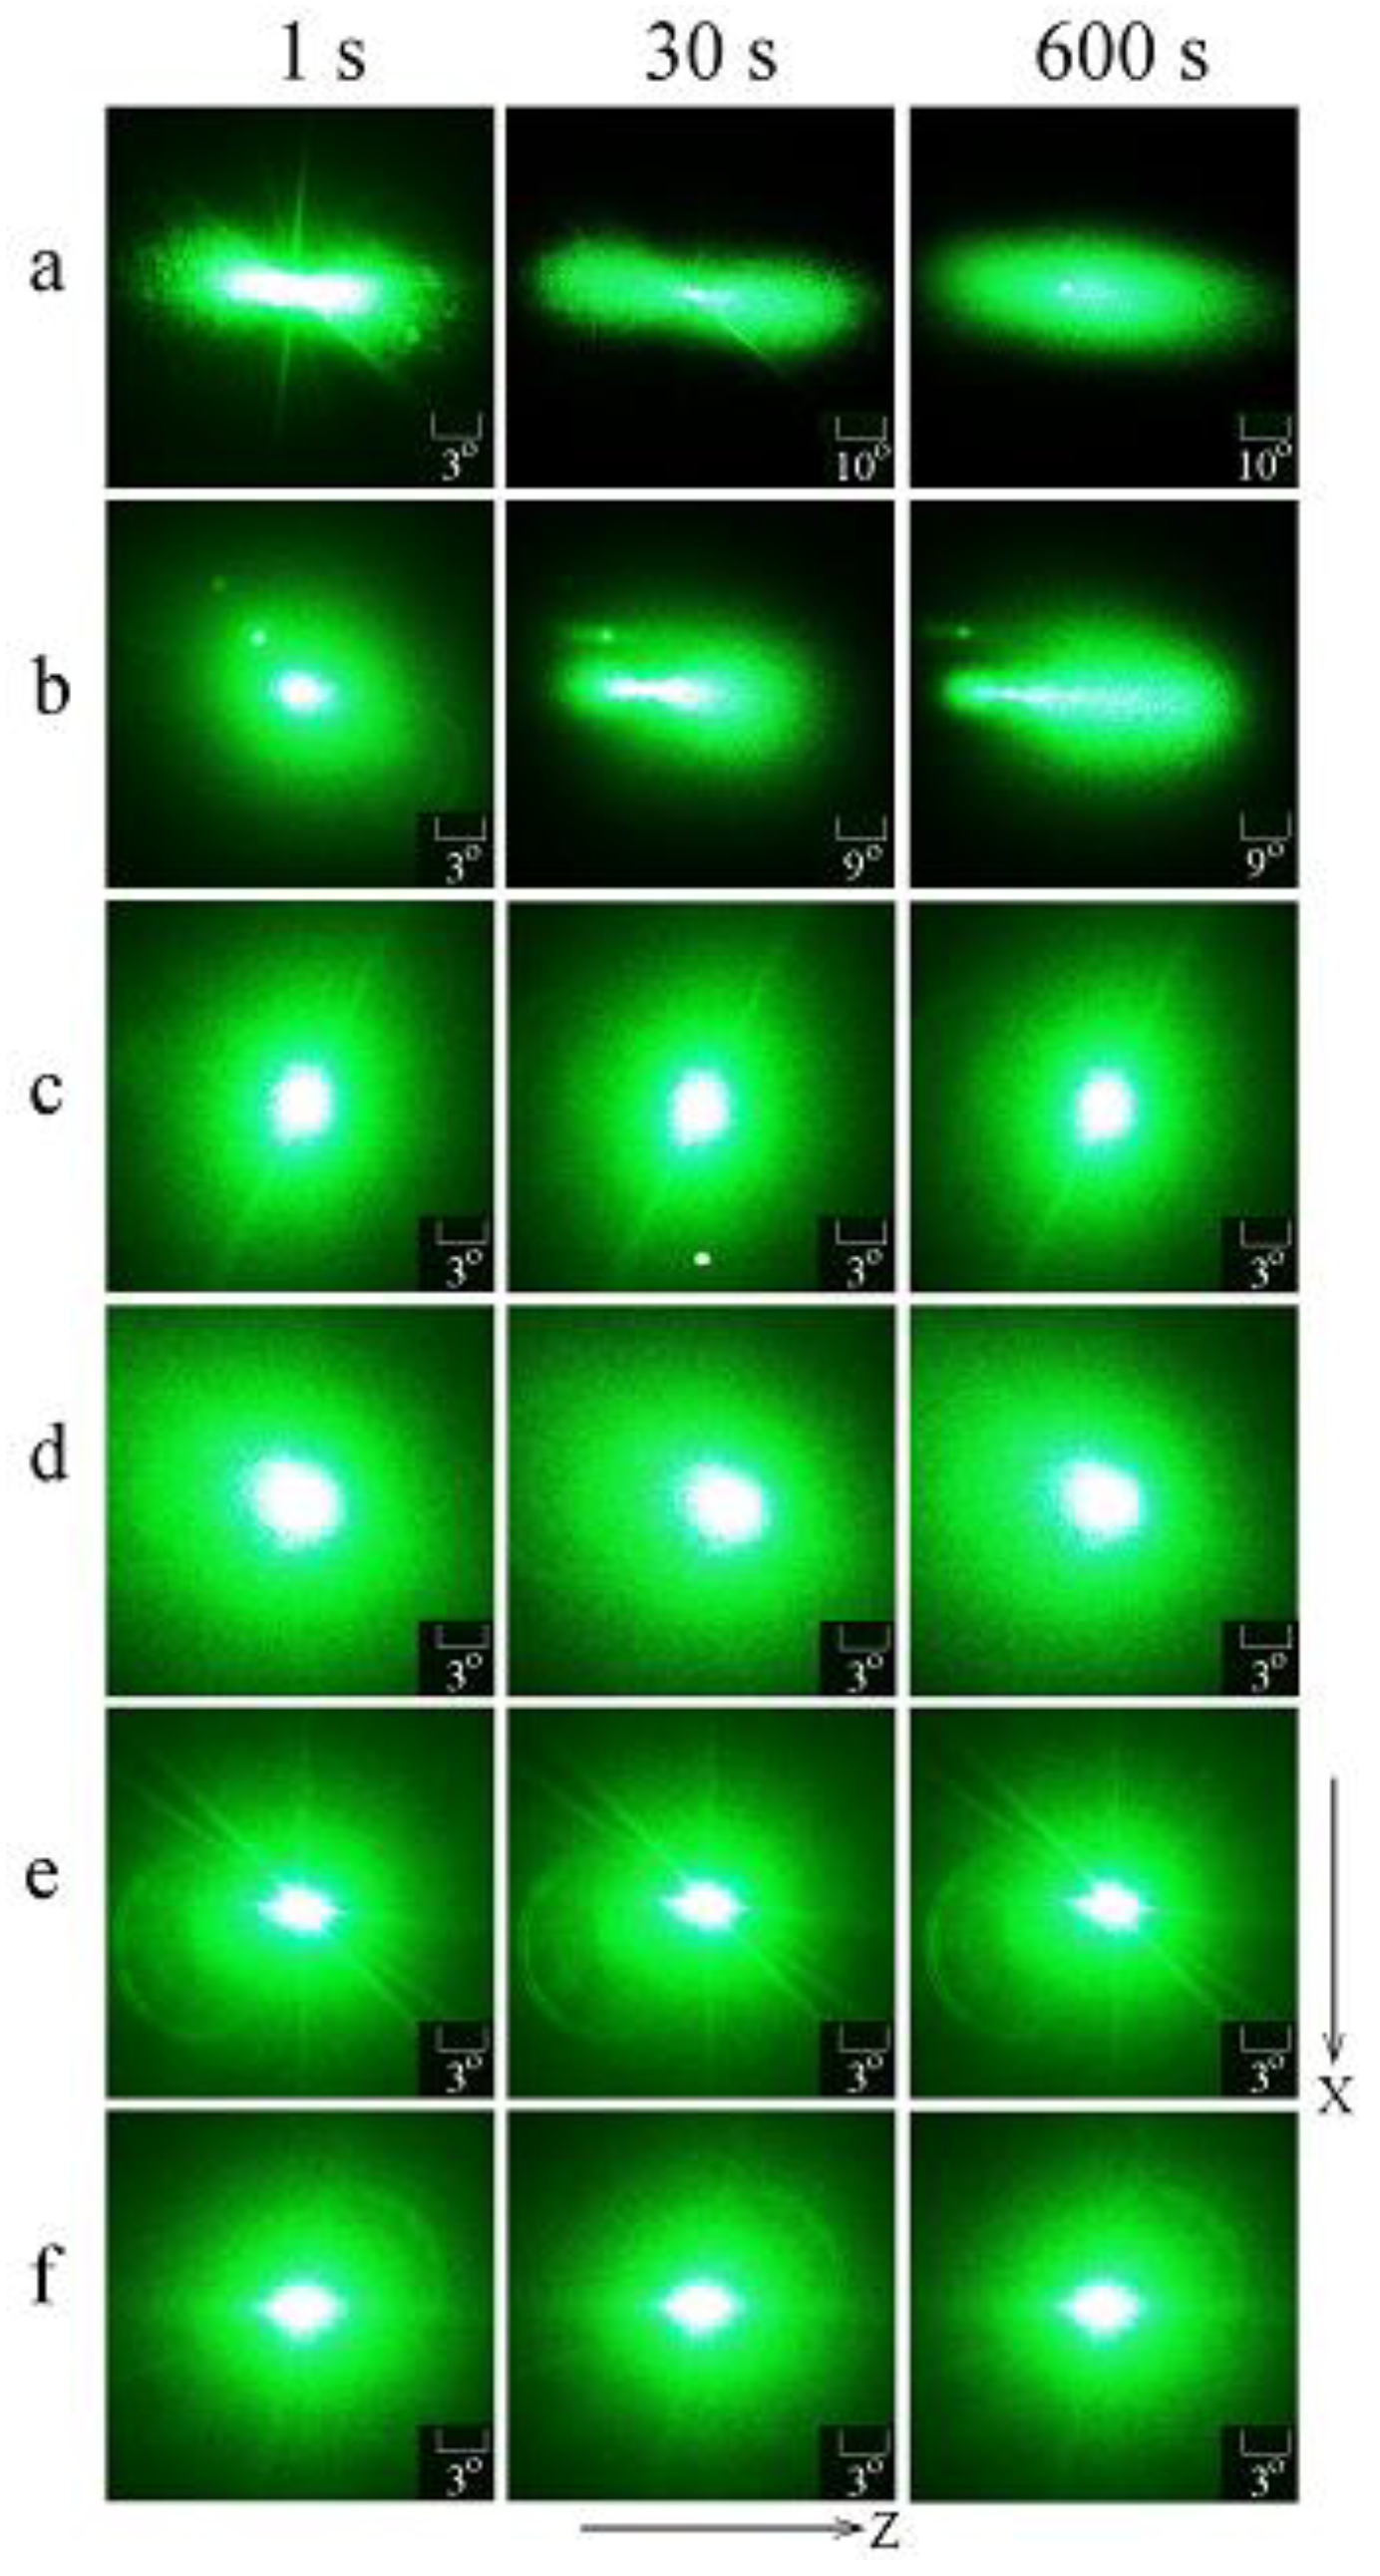
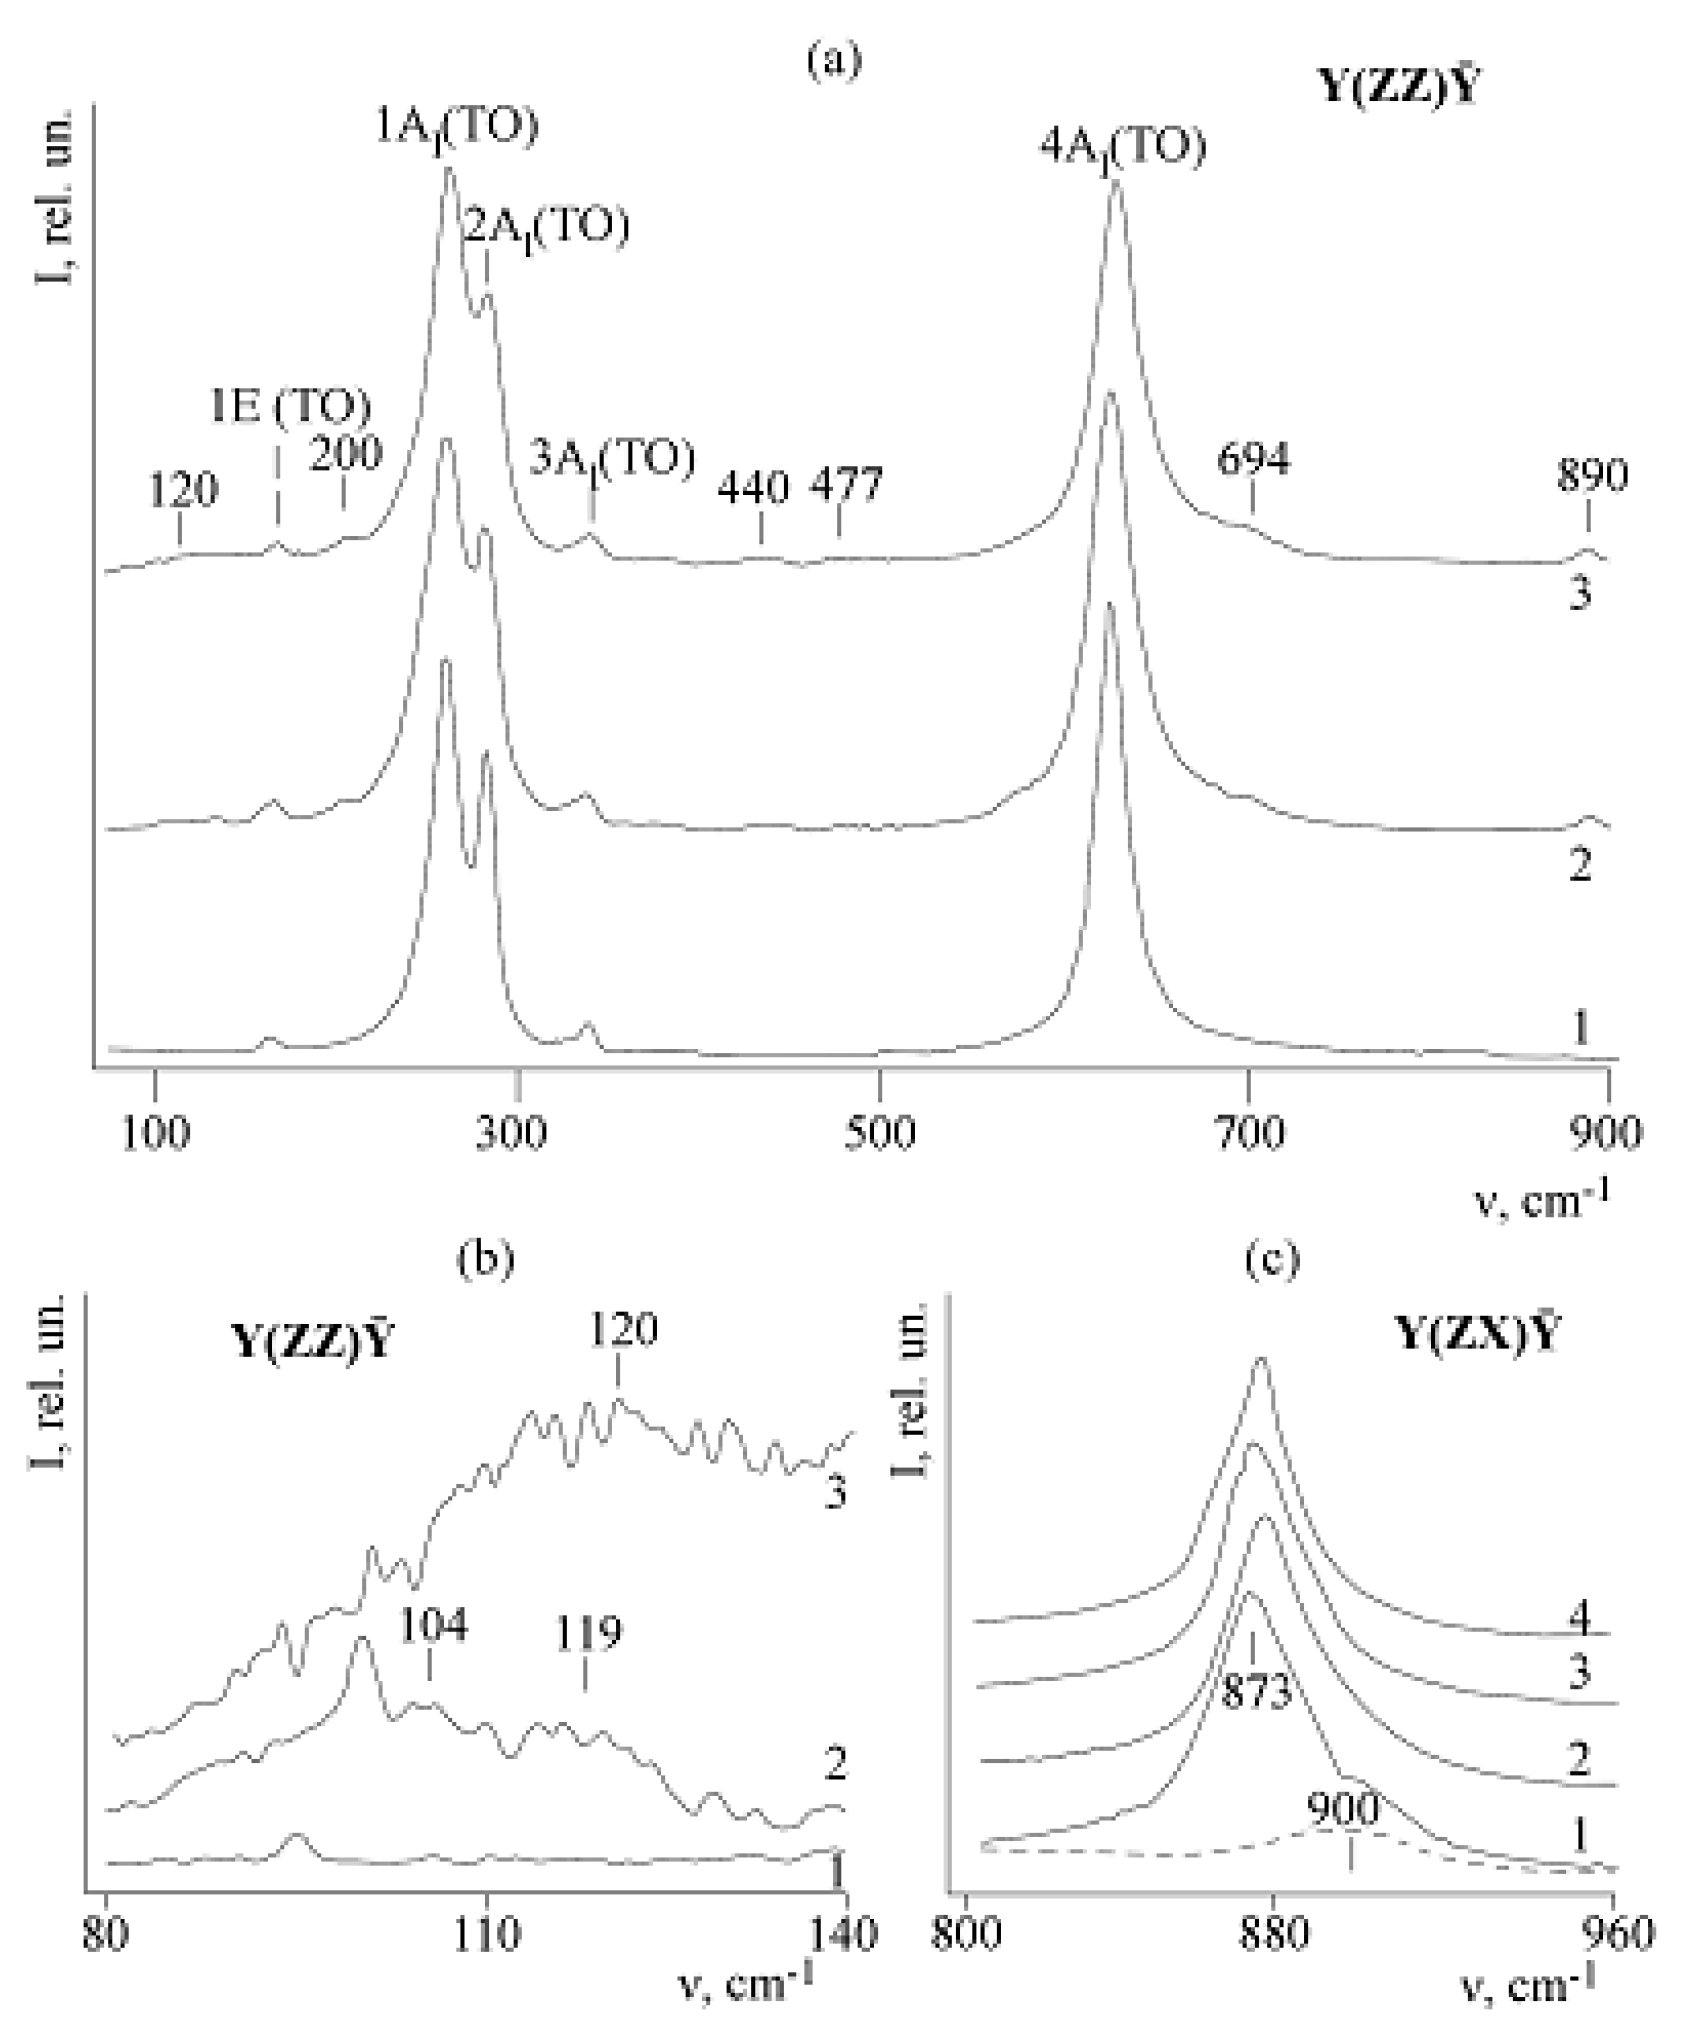
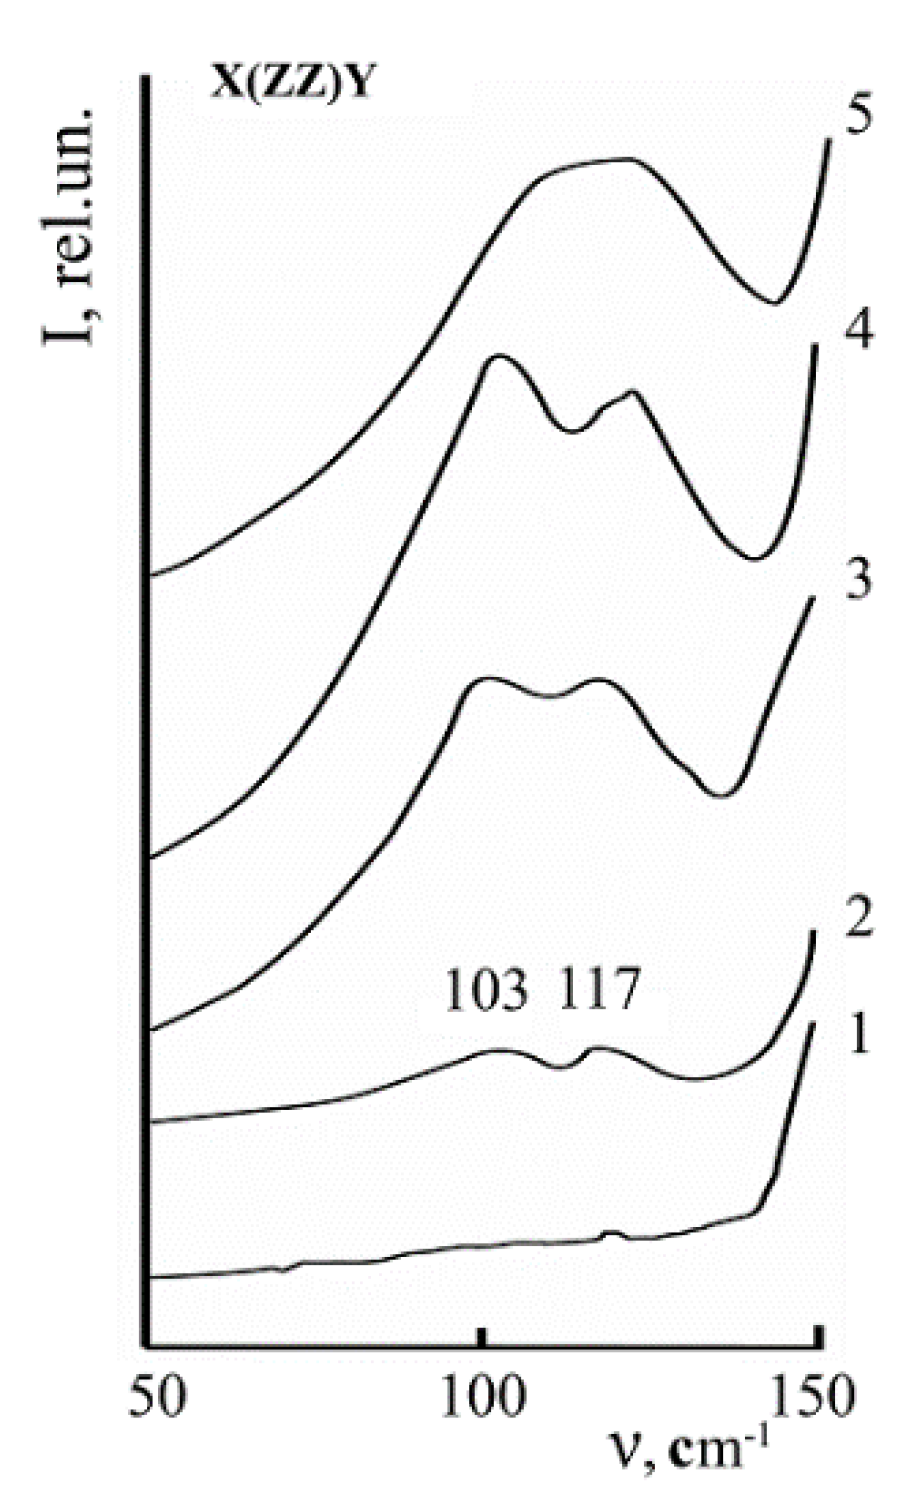
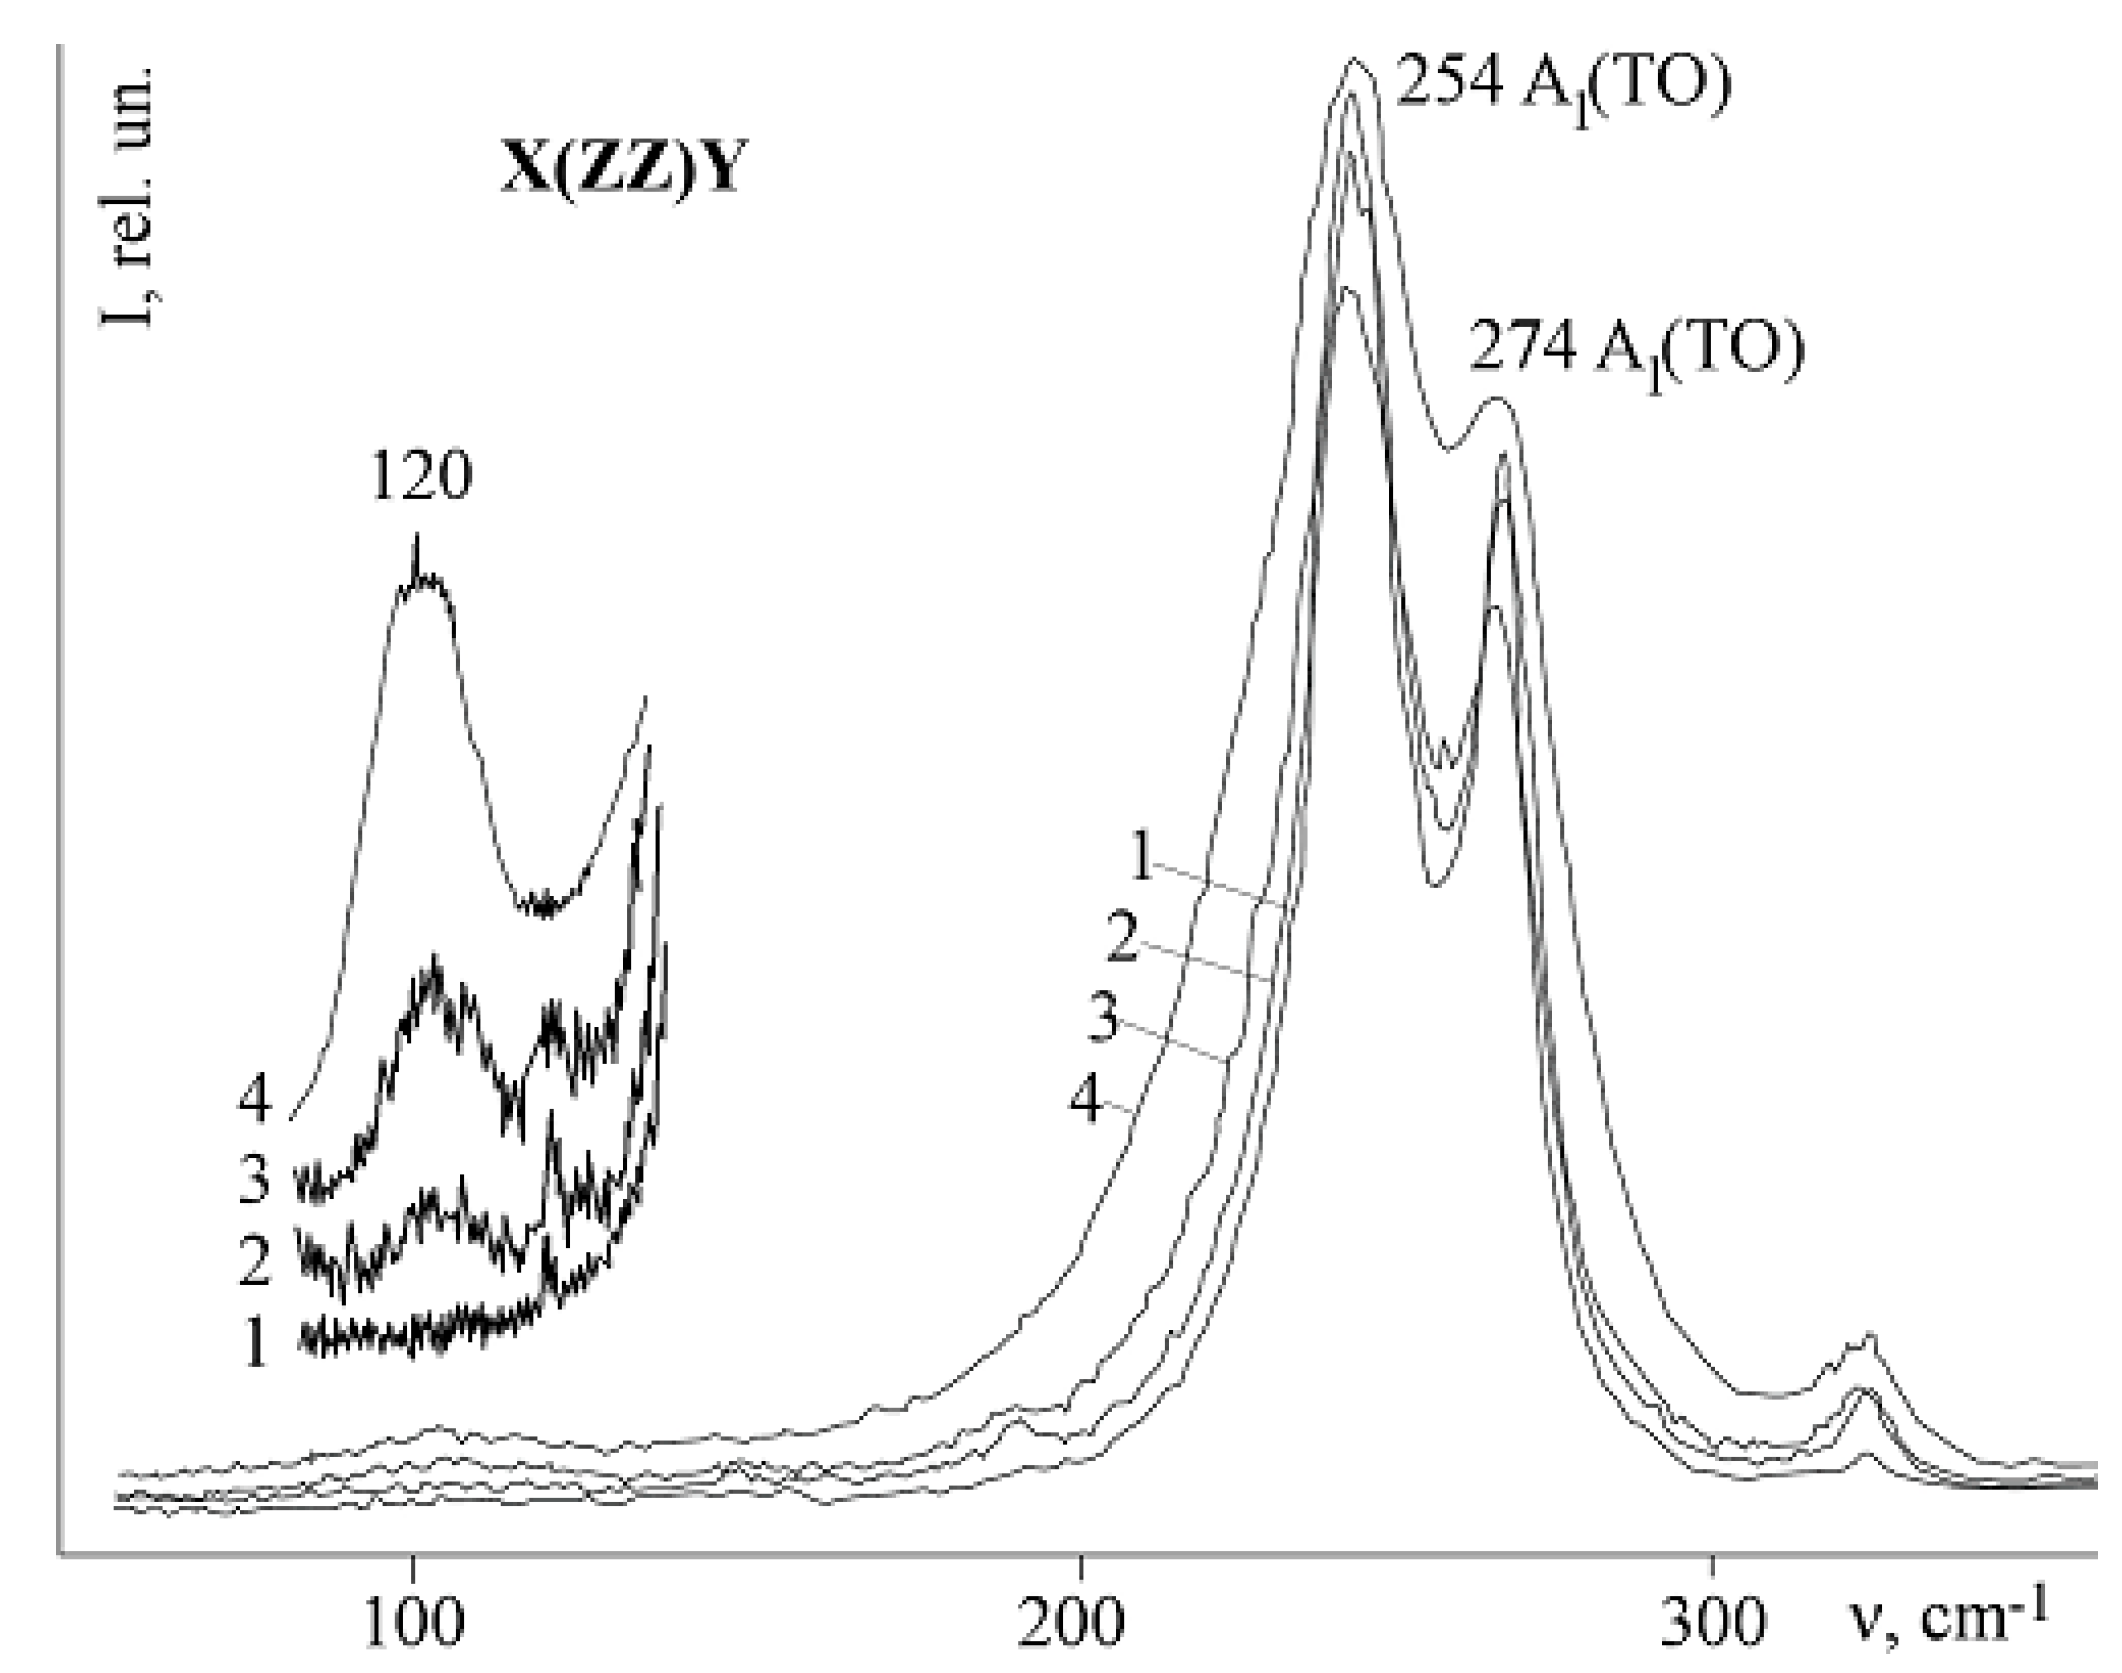
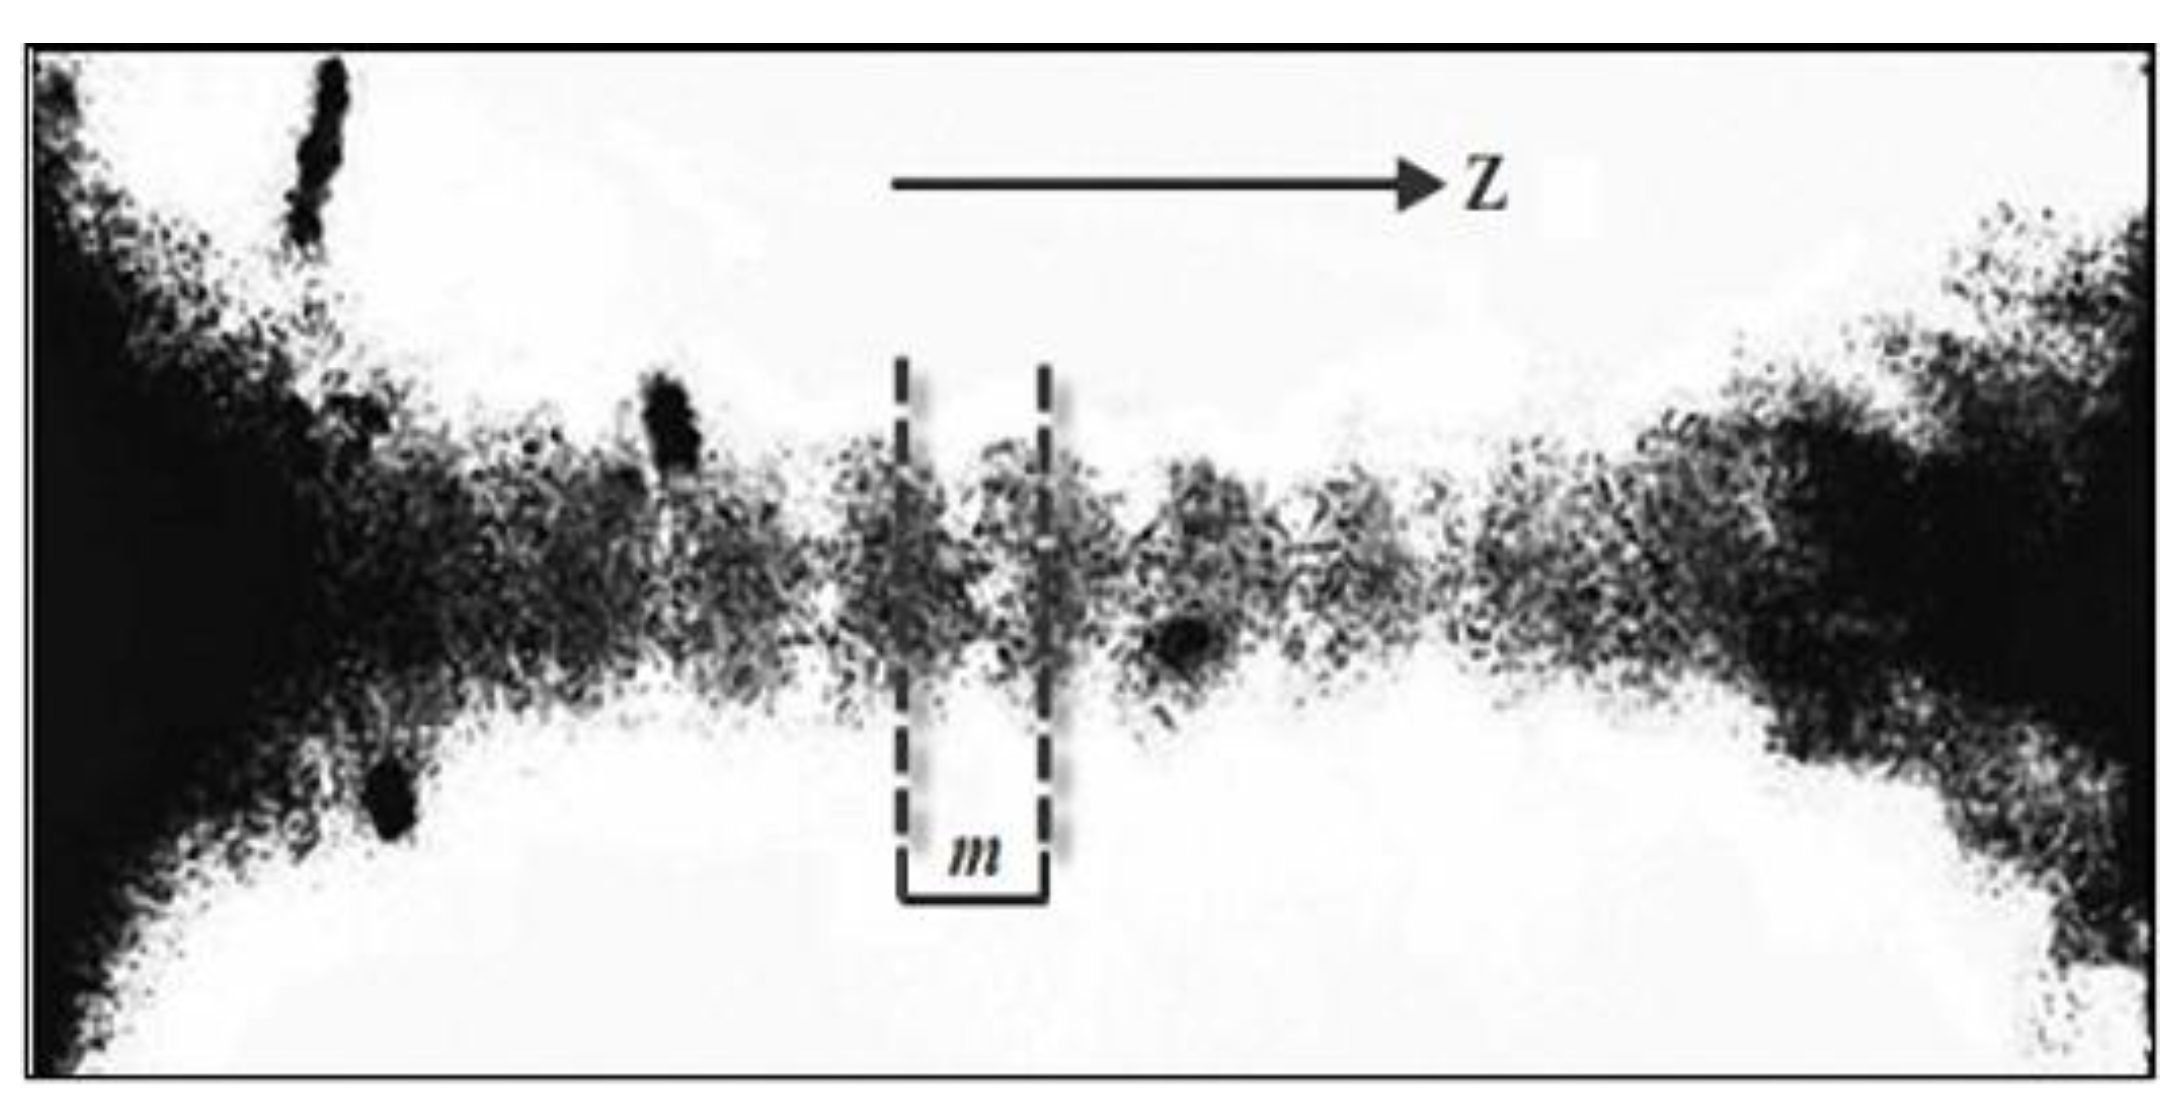
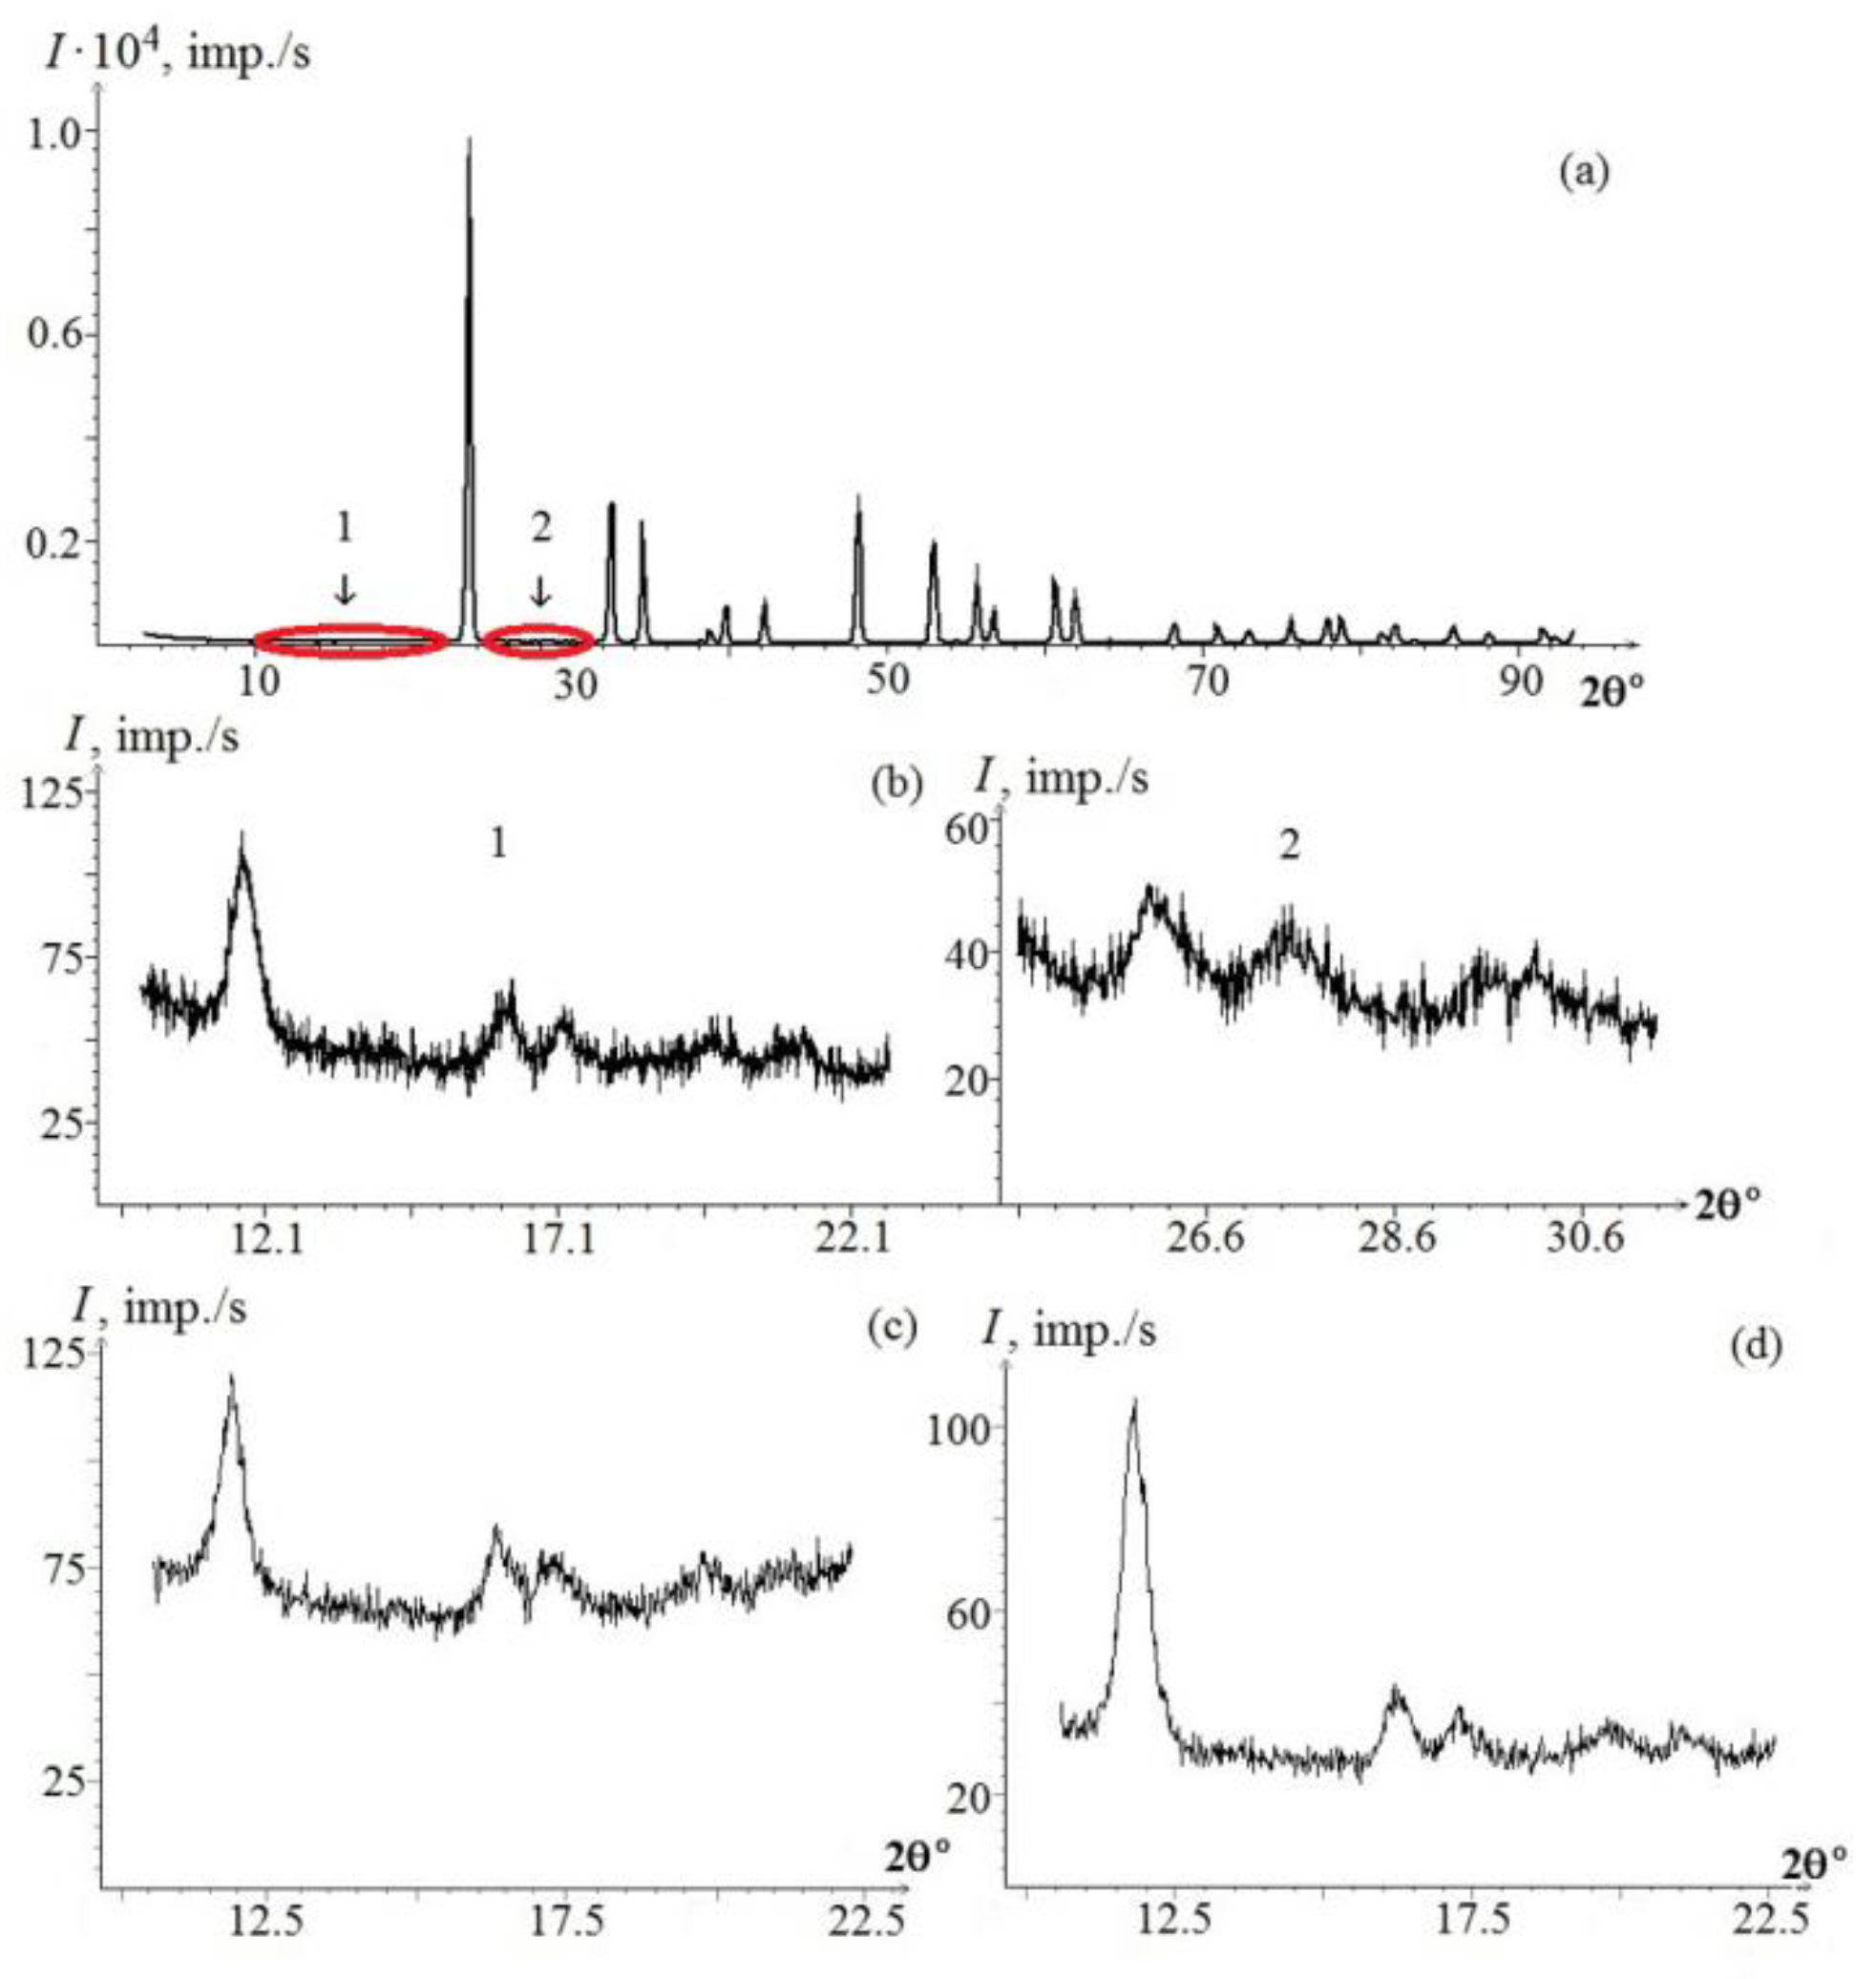
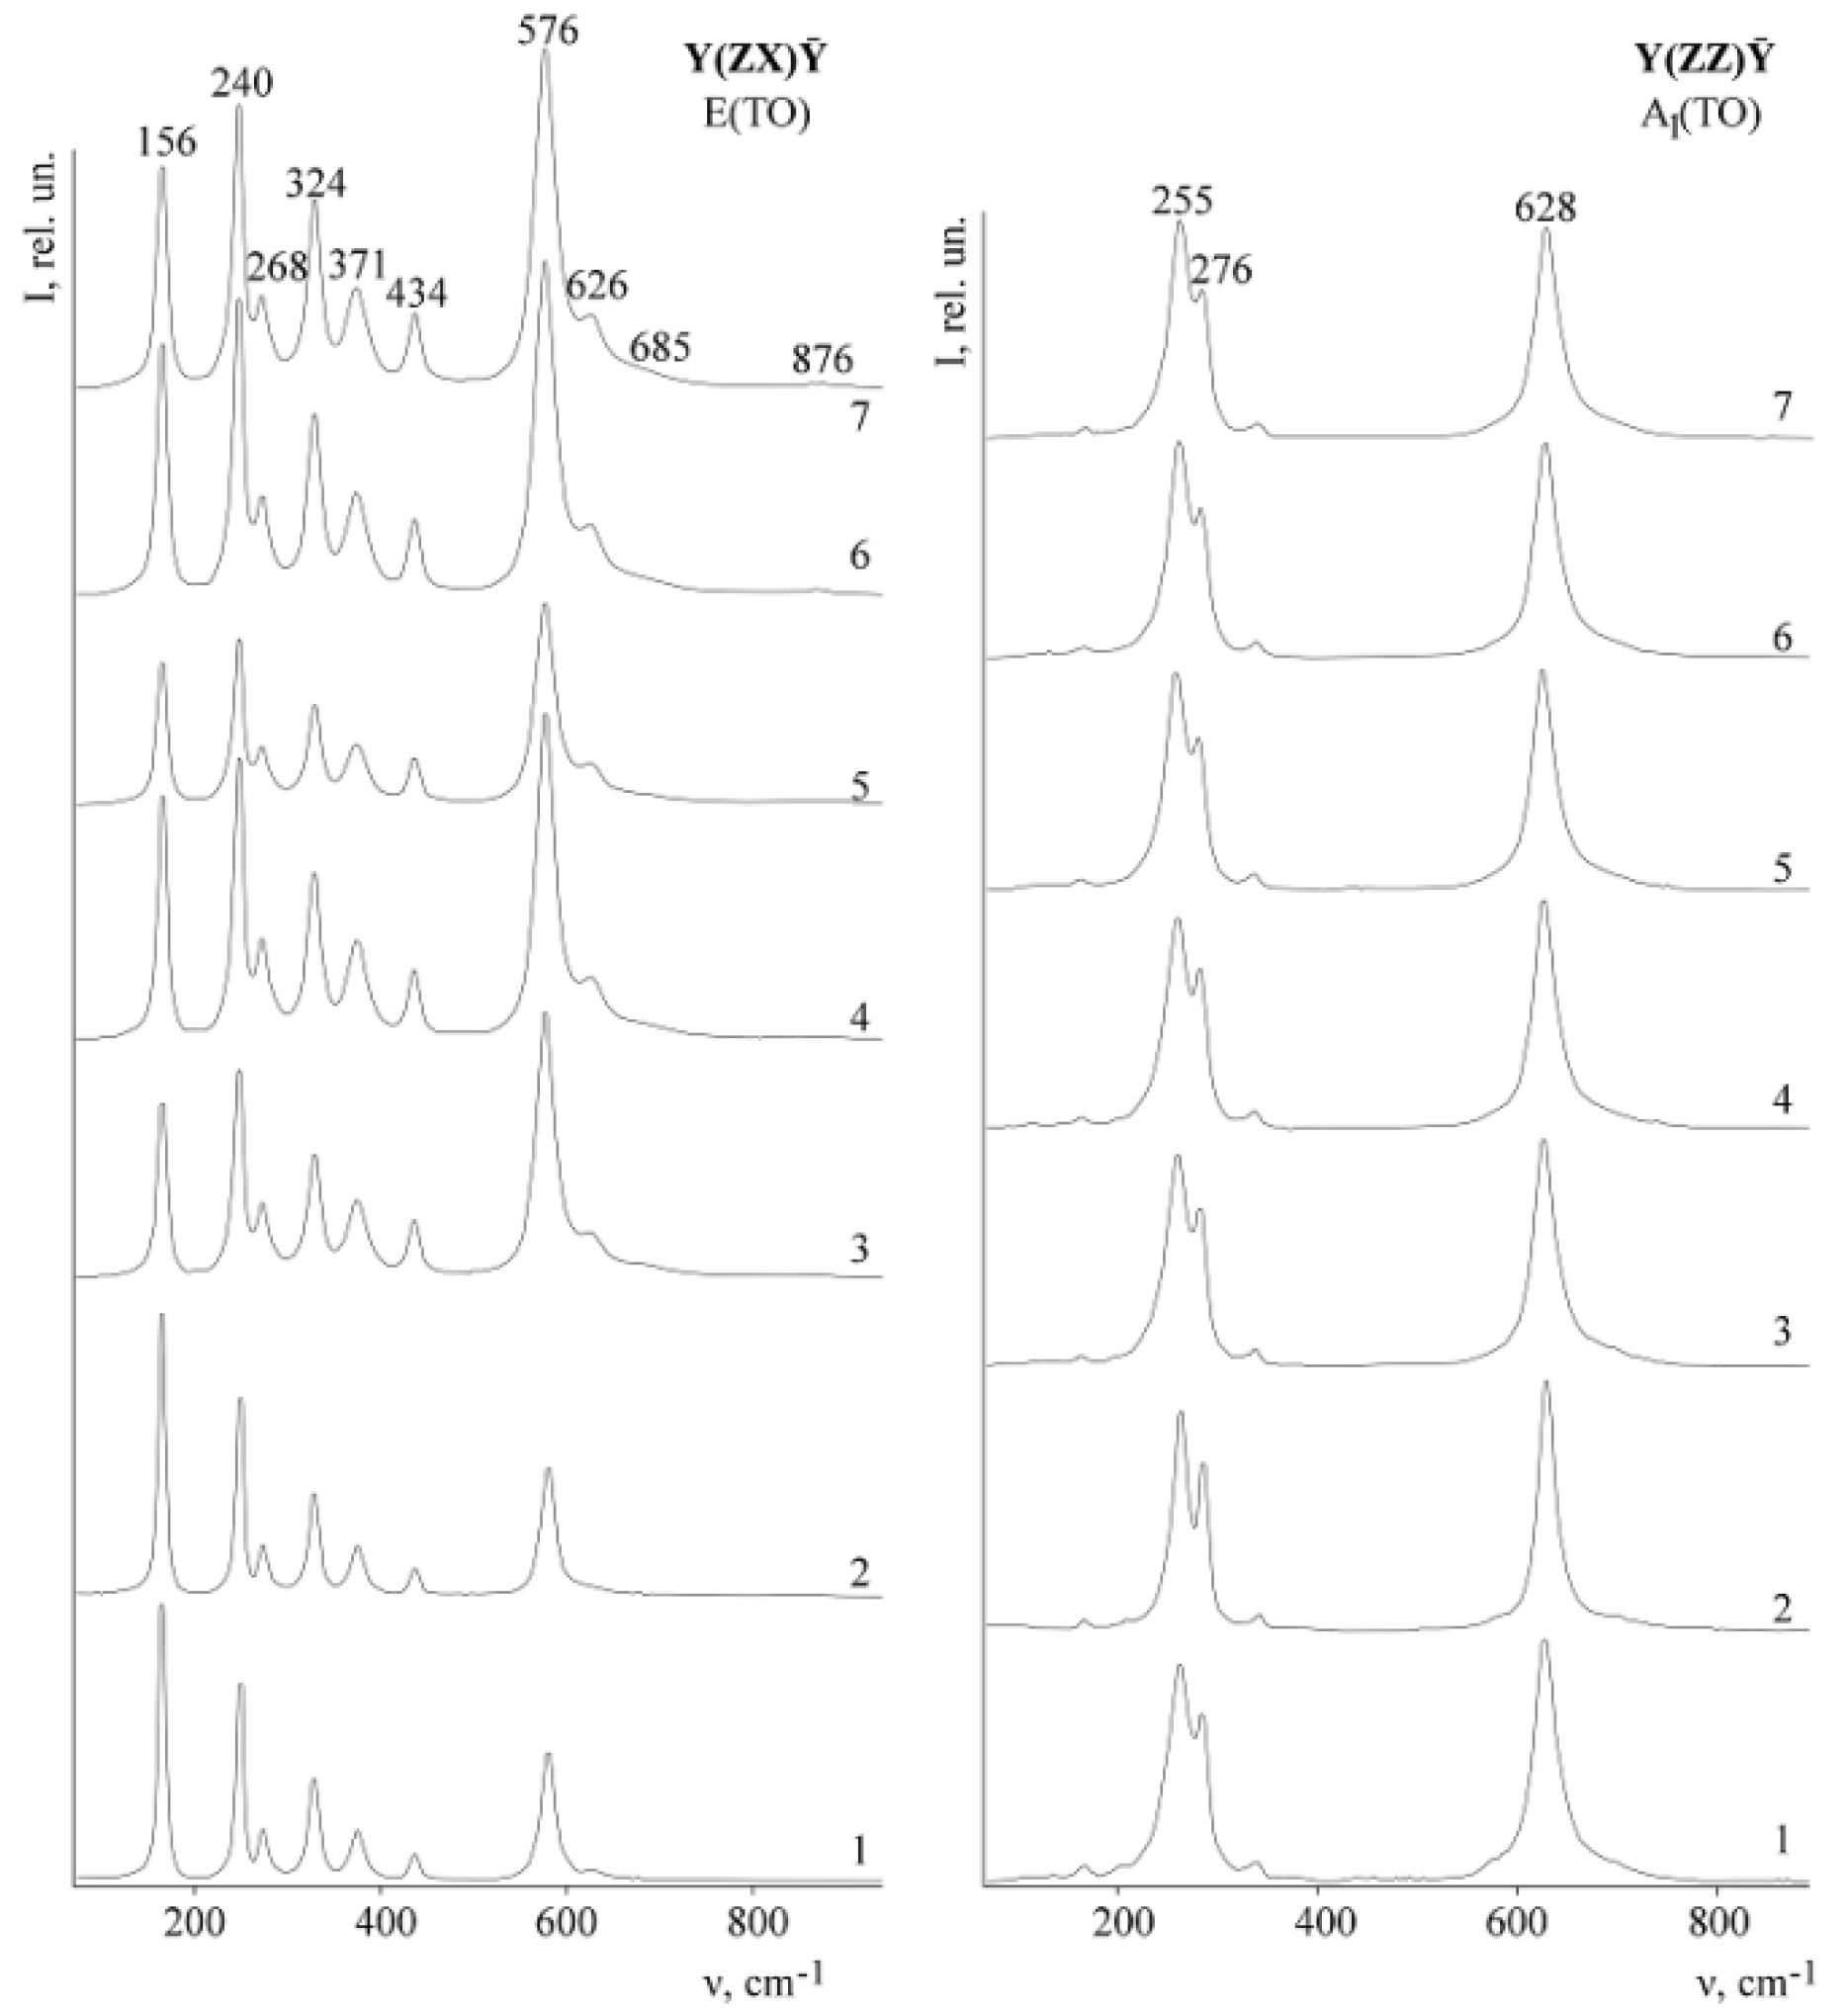
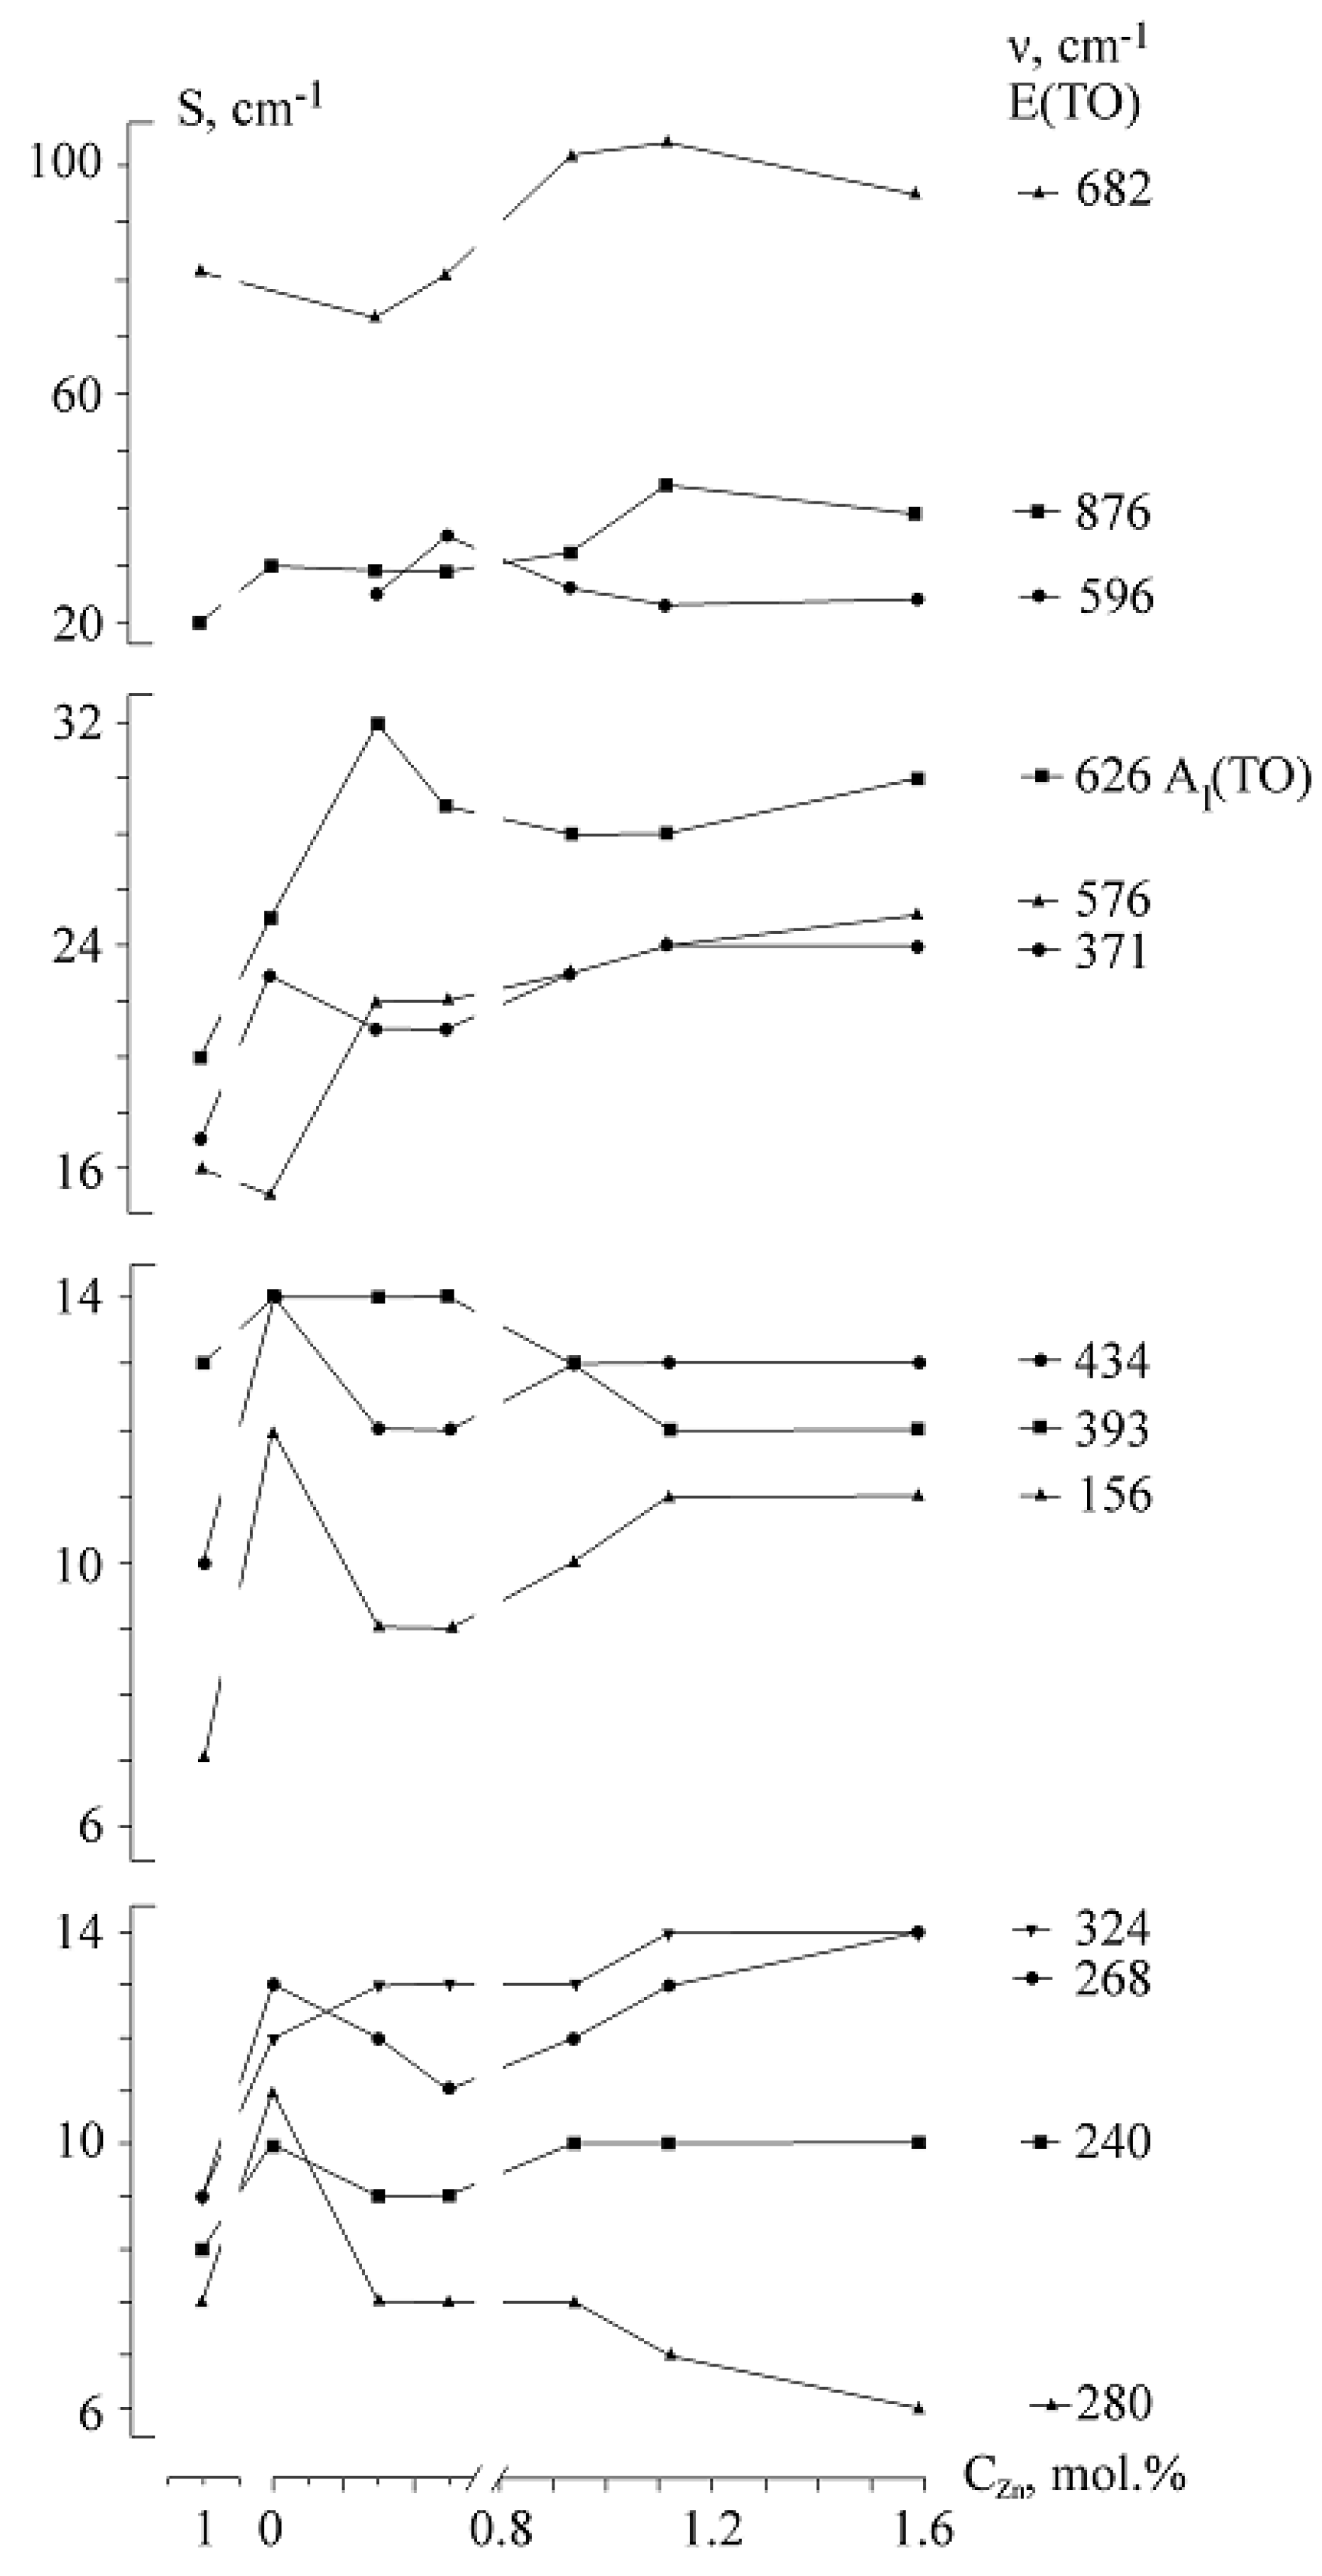
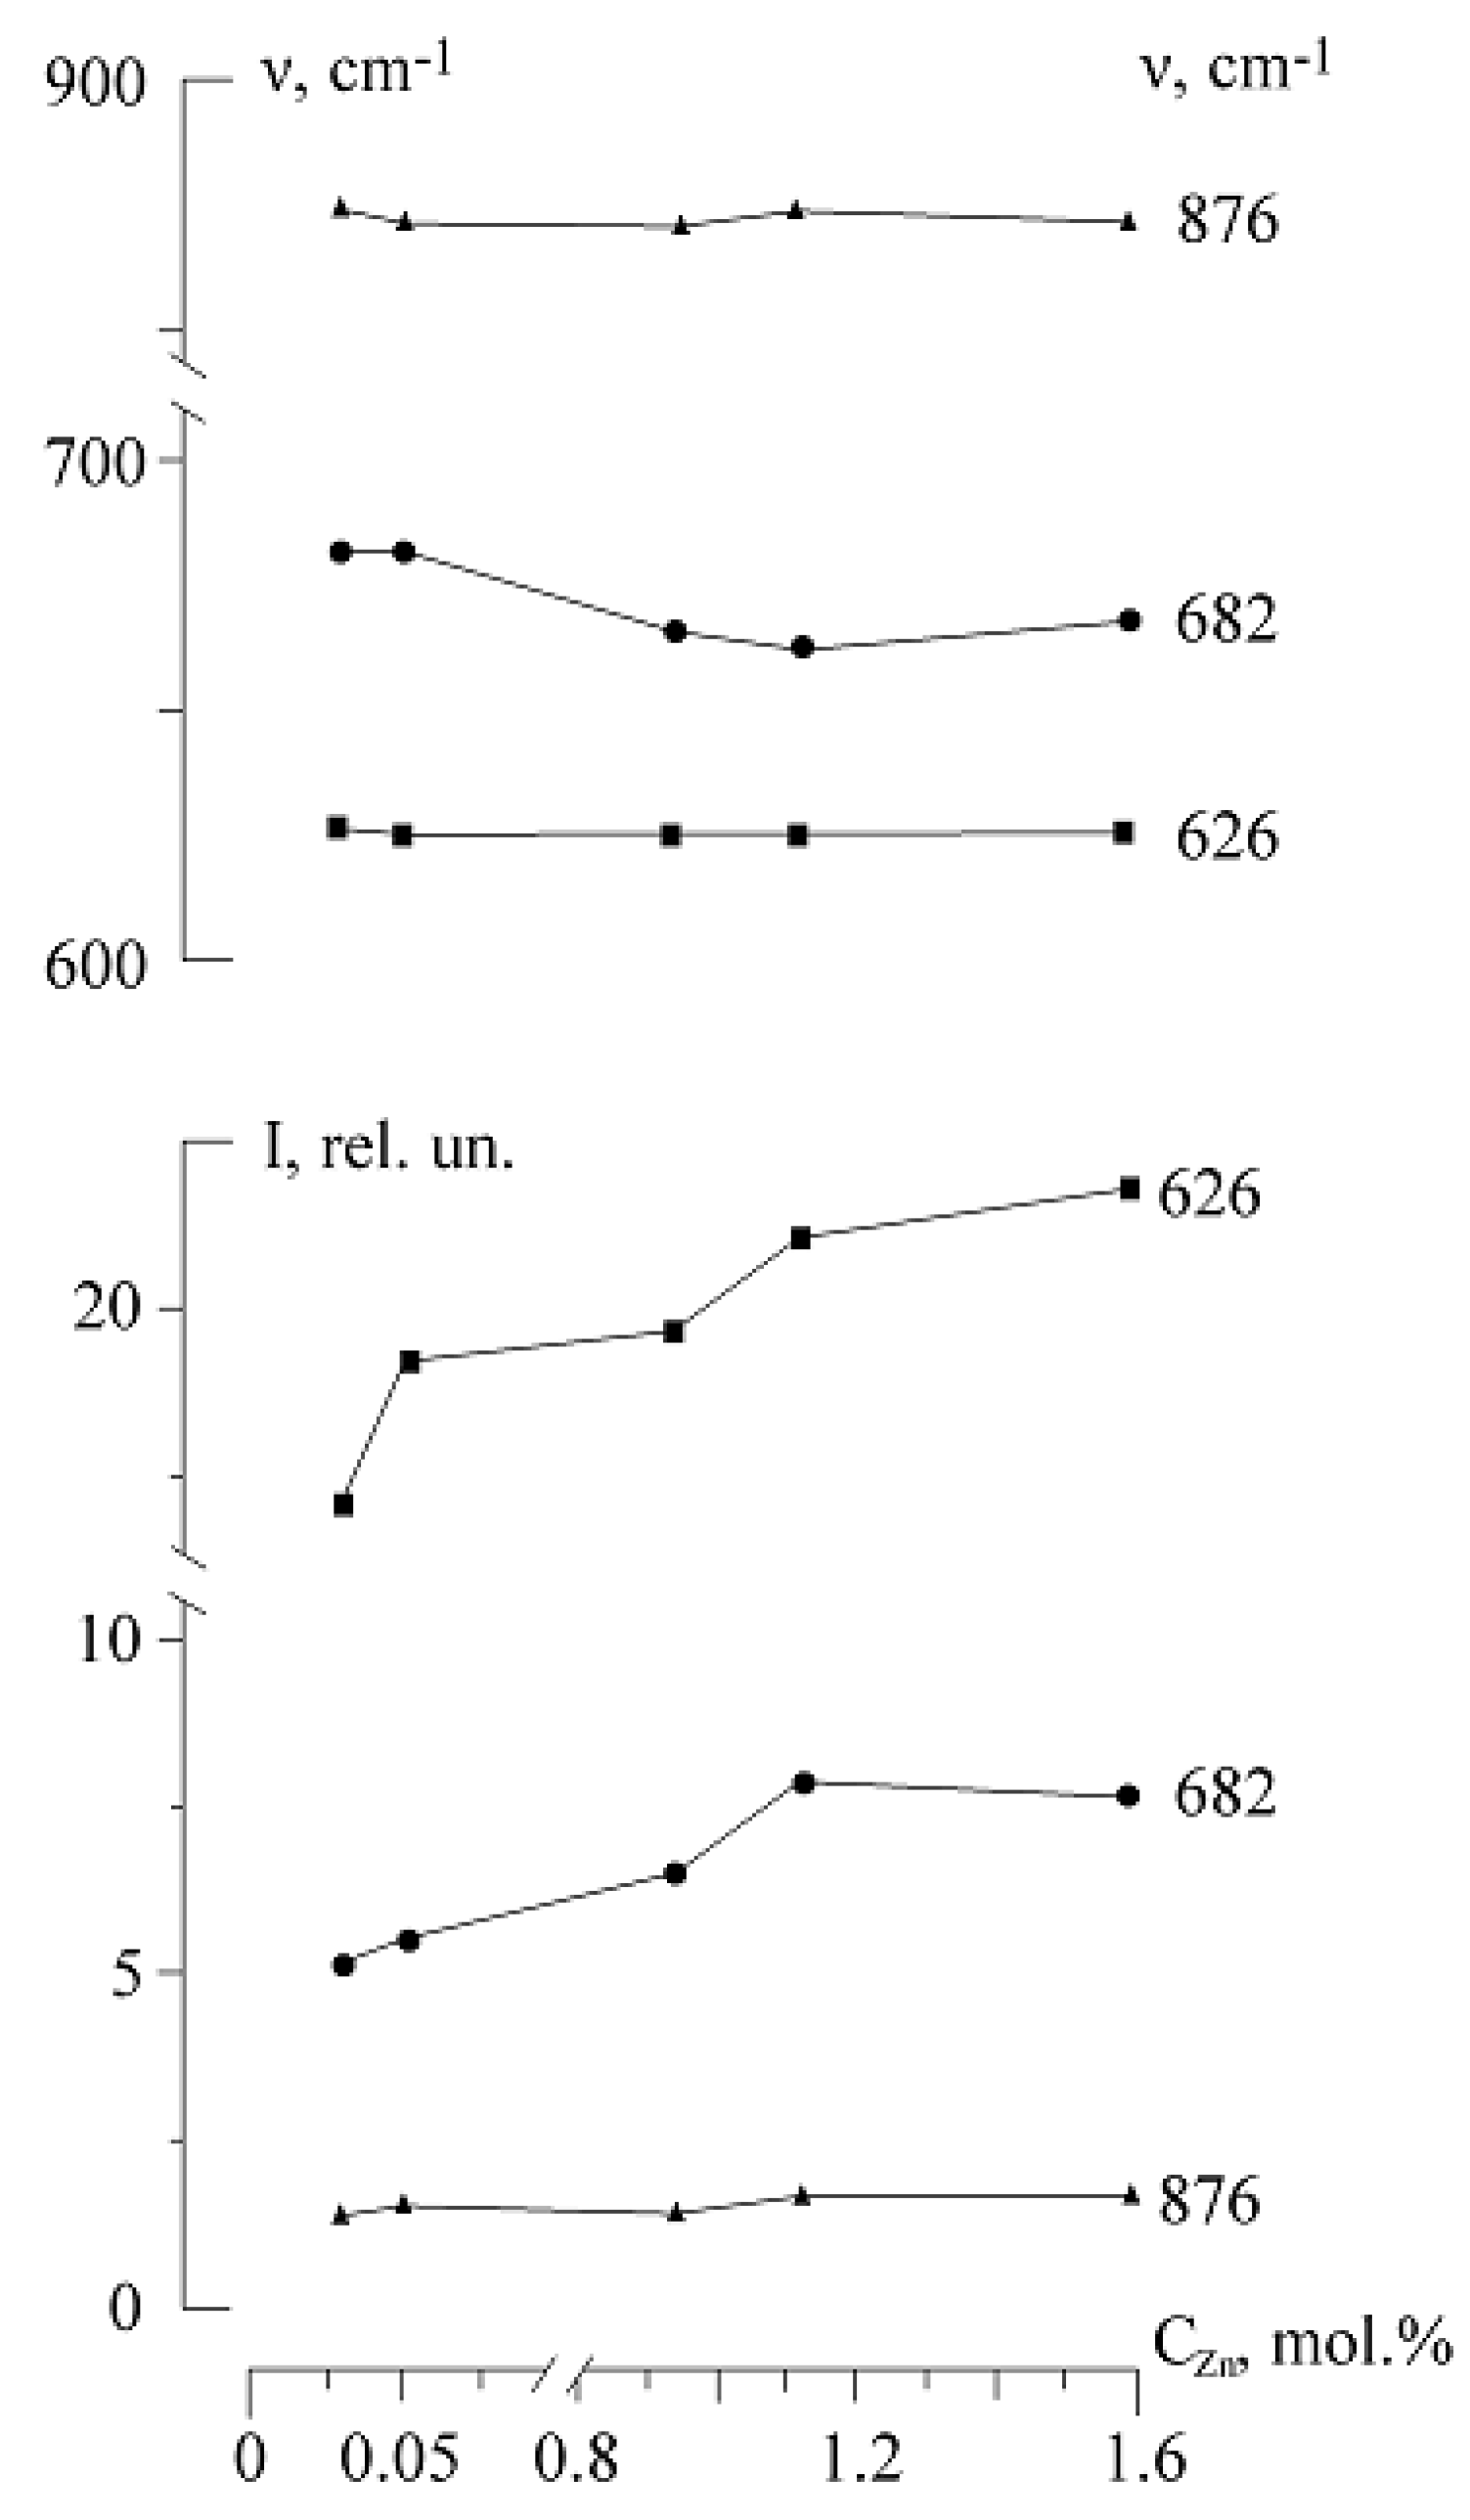
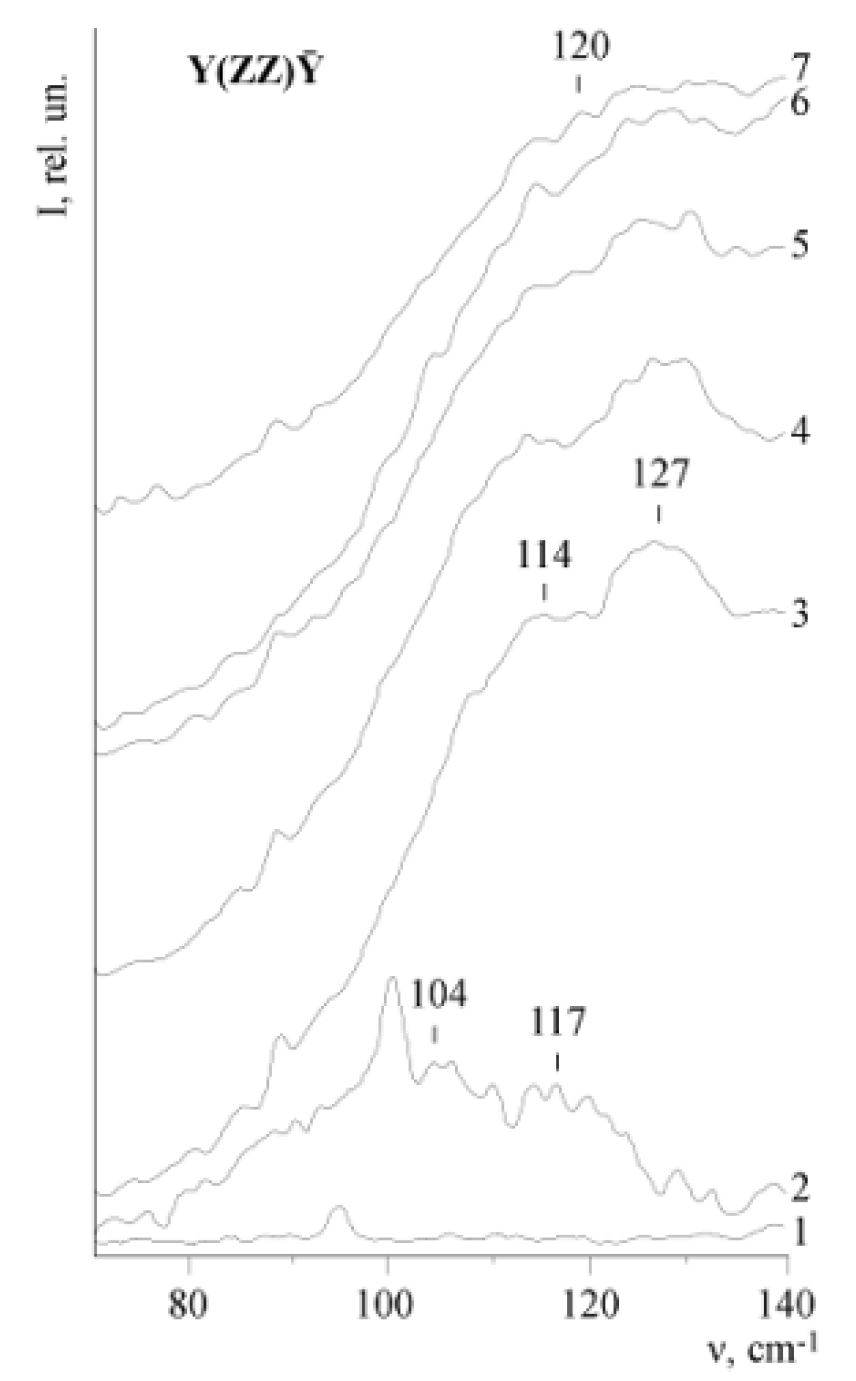
Table 1.
Character of a point group representations; ā = 1/2 (ā1 + ā2 + ā3)—avector of partial translation of a space group C3V6 (R3c); ai, aij are the components of a vector and a symmetric second-rank tensor, respectively; aijk is a third-rank tensor symmetric with respect to the first two indices. They are transformed by the corresponding irreducible representations of the C3V group.
| C3v; C3V6 (R3c) | E | C3±1(Z) | 3σV | ai | aij | aijk |
|---|---|---|---|---|---|---|
| ā = 1/2 (ā1 + ā2 + ā3) | 0 | 0 | ||||
| A1 | 1 | 1 | 1 | Z | XX, YY, ZZ | XXZ, YYZ, ZZX, ZZY |
| A2 | 1 | 1 | −1 | XXY, YYX | ||
| E | 2 | −1 | 0 | X, Y | XX, YY, XY, XZ, YZ | XXZ, YYZ, XYY, XZY, YZX, YZY, |
| V | 3 | 0 | 1 | |||
| Ṽ | 3 | 0 | −1 | |||
| [V]2 | 6 | 0 | 2 | |||
| [V]2 × V | 18 | 0 | 2 |
Table 2.
Breakup periods of fractal-type nanostructures on the Z-plane of a LiNbO3:Gd (0.44 wt.%) crystal.
Table 2.
Breakup periods of fractal-type nanostructures on the Z-plane of a LiNbO3:Gd (0.44 wt.%) crystal.
| The Group | The Average Period Length, nm | Standard Deviation | Confidence Interval | Relative Observation Error, % |
|---|---|---|---|---|
| Horizontal split | 57 | 0.0066 | 0.004 | 6.92 |
| Horizontal split | 13 | 0.0021 | 0.00083 | 6.55 |
| Vertical split | 13 | 0.0025 | 0.0015 | 11.4 |
Table 3.
Experimentally observed Raman bands (T = 100 K) of crystals: 1—SLN; 2—CLN; 3—LiNbO3:Zn (4.5 mol.% ZnO); 4—LiNbO3:Mg (5.1 mol.% MgO); 5—LiNbO3:Mg (5.3). Calculated frequencies of fundamental oscillations of A2, A1(TO) and E(TO) symmetry types.
Table 3.
Experimentally observed Raman bands (T = 100 K) of crystals: 1—SLN; 2—CLN; 3—LiNbO3:Zn (4.5 mol.% ZnO); 4—LiNbO3:Mg (5.1 mol.% MgO); 5—LiNbO3:Mg (5.3). Calculated frequencies of fundamental oscillations of A2, A1(TO) and E(TO) symmetry types.
| Cryst. No. | Frequency of A Phonons, ν, cm−1, Experimentally Observed | ||||||||||
|---|---|---|---|---|---|---|---|---|---|---|---|
| 1A2 | 2A2 | 1A1(TO) | 2A1(TO) | 3A1(TO) | 3A2 | 4A2 | 4A1(TO) | 5A2 | |||
| 1 | 254 | 275 | 335 | 630 | |||||||
| 2 | 104 1 | 119 1 | 254 | 276 | 333 | 694 | 632 | 880 | |||
| 3 | 120 1 | 209 | 230 | 258 | 280 | 335 | 298 | 694 | 624 | 880 | |
| 4 | 120 1 | 209 | 230 | 265 | 282 | 338 | 298 | 694 | 625 | 880 | |
| 5 | 120 1 | 209 | 230 | 265 | 281 | 337 | 298 | 694 | 636 | 880 | |
| Calc. | |||||||||||
| [58] | 220 2 | 321 2 | 239 | 320 | 381 | 432 2 | 462 2 | 607 | 893 2 | ||
| [57] | 153 2 | 287 2 | 208 | 279 | 344 | 417 2 | 439 2 | 583 | 883 2 | ||
| [68] | 239 | 271 | 328 | 633 | |||||||
| Cryst. No. | Frequency of E(TO) Phonons, ν, cm−1, Experimentally Observed | ||||||||||
| 1E(TO) | 2E(TO) | 3E(TO) | 4E(TO) | 5E(TO) | 6E(TO) | 7E(TO) | 8E(TO) | 9E(TO) | |||
| 1 | 152 | 180 | 237 | 262 | 322 | 368 | 435 | 579 | 610 | ||
| 2 | 151 | 235 | 264 | 320 | 370 | 430 | 581 | ||||
| 3 | 154 | 244 | 271 | 328 | 372 | 436 | 573 | ||||
| 4 | 157 | 249 | 274 | 330 | 375 | 439 | 576 | ||||
| 5 | 157 | 249 | 274 | 331 | 375 | 439 | 576 | ||||
| Calc. | |||||||||||
| [58] | 157 | 214 | 269 | 349 | 419 | 423 | 446 | 605 | 690 | ||
| [57] | 151 | 167 | 236 | 307 | 334 | 352 | 432 | 526 | 617 | ||
| [68] | 163 | 200 | 249 | 267 | 324 | 372 | 424 | 572 | 619 | ||
Table 4.
2θ scattering angles for additional reflections and the interplanar spacings of CLN and LiNbO3:Er calculated from them.
Table 4.
2θ scattering angles for additional reflections and the interplanar spacings of CLN and LiNbO3:Er calculated from them.
| Crystal | Reflection | 1 | 2 | 3 | 4 | 5 | 6 | 7 | 8 | 9 |
|---|---|---|---|---|---|---|---|---|---|---|
| CLN | 2θ° | 11.82 | 16.26 | 17.35 | 19.87 | 21.09 | 26.22 | 27.55 | 30.07 | |
| d, Å | 7.49 | 5.45 | 5.11 | 4.47 | 4.21 | 3.39 | 3.24 | 2.97 | ||
| Er: 0.062 mol.% | 2θ° | 11.76 | 16.18 | 17.20 | 19.69 | 21.14 | 26.08 | 27.51 | 29.55 | 30.15 |
| d, Å | 7.52 | 5.48 | 5.16 | 4.51 | 4.20 | 3.42 | 3.24 | 3.02 | 2.96 | |
| Er: 2.67 mol.% | 2θ° | 12.12 | 16.32 | 17.23 | 19.81 | 21.13 | 26.18 | 27.79 | 30.0 | |
| d, Å | 7.30 | 5.43 | 5.14 | 4.82 | 4.21 | 3.40 | 3.21 | 2.98 |
Table 5.
A list of phases from the ICSD database.
| Symmetry Group | Z | Formal Unit | a, Å | b, Å | c, Å | α, ° | β, ° | γ, ° |
|---|---|---|---|---|---|---|---|---|
| P63/MMC | 2 | LiNbO2 | 2.9 | - | 10.46 | 90 | 90 | 120 |
| P121/A1 | 8 | LiNbO3 | 9.433 | 8.226 | 6.213 | 90 | 90.228 | 90 |
| R3CR | 2 | LiNbO3 | 5.4934 | 5.4934 | 5.4934 | 55.915 | 55.915 | 55.915 |
| I23 | 8 | Li3NbO4 | 8.429 | 8.429 | 8.429 | 90 | 90 | 90 |
| P121/C1 | 4 | LiNb3O8 | 7.459 | 5.034 | 15.27 | 90 | 107.33 | 90 |
| P121/A1 | 4 | LiNb3O8 | 15.262 | 5.033 | 7.457 | 90 | 107.34 | 90 |
| P-1 | 2 | Li16Nb4O18 | 15.21 | 8.815 | 5.858 | 109.8 | 101.4 | 87 |
| P-1 | 1 | Li7NbO6 | 5.3793 | 5.9194 | 5.3792 | 117.003 | 119.602 | 63.257 |
| I-43M | 8 | Li3NbO4 | 8.412 | 8.412 | 8.412 | 90 | 90 | 90 |
| P-3M1 | 4 | Li0.795NbO2 | 2.9239 | 2.9239 | 20.913 | 90 | 90 | 120 |
| FM-3M | 1 | Li3NbO4 | 4.214 | 4.214 | 4.214 | 90 | 90 | 90 |
| P4322 | 4 | LiNbO4Zn | 6.08 | 6.08 | 8.40 | 90 | 90 | 90 |
Table 6.
Results of indexing: columns 2–6, for the structure R3c; 8–13, for a lattice with a super-structure; 1 and 7, experimental values; do, experimental values of interplanar distance; dc, interplanar distance calculates due to indexed lattice parameters and reflection indexes (hkl).
Table 6.
Results of indexing: columns 2–6, for the structure R3c; 8–13, for a lattice with a super-structure; 1 and 7, experimental values; do, experimental values of interplanar distance; dc, interplanar distance calculates due to indexed lattice parameters and reflection indexes (hkl).
| a = 5.1494 Ǻ; b =13.862 Ǻ; V = 318.3 Å3 | a = 10.301 Ǻ; c = 13.876 Ǻ; V = 1277 Å3 | |||||||||||
|---|---|---|---|---|---|---|---|---|---|---|---|---|
| 1 | 2 | 3 | 4 | 5 | 6 | 7 | 8 | 9 | 10 | 11 | 12 | 13 |
| do, Å | dc, Å | do–dc, Å | h | k | l | do, Å | dc, Å | do–dc, Å | h | k | l | |
| 7.52491 | 7.52491 | 7.50807 | 0.01684 | 1 | 0 | 1 | * | |||||
| 5.47881 | 5.47881 | 5.47843 | 0.00038 | 1 | 0 | 2 | ♦ | |||||
| 5.15647 | 5.15647 | 5.15439 | 0.00208 | 1 | 1 | 0 | ~ | |||||
| 4.50788 | 4.50788 | 4.46383 | 0.04405 | 2 | 0 | 0 | • | |||||
| 4.20278 | 4.20278 | 4.24939 | −0.04661 | 2 | 0 | 1 | ° | |||||
| 3.76110 | 3.75033 | 0.01077 | 1 | 0 | 2 | 3.76110 | 3.75404 | 0.00706 | 2 | 0 | 2 | * |
| 3.41621 | 3.41621 | 3.44262 | −0.02640 | 1 | 1 | 3 | ||||||
| 3.24131 | 3.24131 | 3.23364 | 0.00767 | 1 | 0 | 4 | ∨ | |||||
| 3.02314 | 3.02314 | 3.03451 | −0.01137 | 2 | 1 | 2 | + | |||||
| 2.96424 | 2.96424 | 2.97589 | −0.01164 | 3 | 0 | 0 | ◊ | |||||
| 2.74090 | 2.73641 | 0.00449 | 1 | 0 | 4 | 2.74090 | 2.73922 | 0.00168 | 2 | 0 | 4 | ♦ |
| 2.57820 | 2.57474 | 0.00346 | 1 | 1 | 0 | 2.57820 | 2.57719 | 0.00101 | 2 | 2 | 0 | ~ |
| 2.31260 | 2.31034 | 0.00226 | 0 | 0 | 6 | 2.31260 | 2.31280 | −0.00020 | 0 | 0 | 6 | |
| 2.25110 | 2.24913 | 0.00197 | 1 | 1 | 3 | 2.25110 | 2.25134 | −0.00024 | 4 | 0 | 0 | • |
| 2.12440 | 2.12265 | 0.00175 | 2 | 0 | 2 | 2.12440 | 2.12469 | −0.00029 | 4 | 0 | 2 | |
| 1.87630 | 1.87517 | 0.00113 | 2 | 0 | 4 | 1.87630 | 1.87564 | 0.00066 | 4 | 0 | 4 | ° |
| 1.72010 | 1.71956 | 0.00054 | 1 | 1 | 6 | 1.72010 | 1.72131 | −0.00121 | 3 | 3 | 0 | |
| 1.67370 | 1.67324 | 0.00046 | 2 | 1 | 1 | 1.67370 | 1.67484 | −0.00114 | 4 | 2 | 1 | |
| 1.63840 | 1.63782 | 0.00058 | 2 | 1 | 2 | 1.63840 | 1.63940 | −0.00100 | 4 | 2 | 2 | |
| 1.61580 | 1.61512 | 0.00068 | 1 | 0 | 8 | 1.61580 | 1.61682 | −0.00102 | 2 | 0 | 8 | ∨ |
| 1.51630 | 1.51578 | 0.00052 | 2 | 1 | 4 | 1.51630 | 1.51726 | −0.00096 | 4 | 2 | 4 | + |
| 1.48680 | 1.48653 | 0.00028 | 3 | 0 | 0 | 1.48680 | 1.48794 | −0.00114 | 6 | 0 | 0 | ◊ |
| 1.44000 | 1.44026 | −0.00026 | 2 | 1 | 5 | 1.44000 | 1.43902 | 0.00098 | 2 | 2 | 8 | |
Table 7.
Basic parameters of bands corresponding to E (TO) and A1 (TO) symmetry types oscillations in Raman spectra of SLN, CLN, and LiNbO3:Zn (0.03–1.59 mol.%).
Table 7.
Basic parameters of bands corresponding to E (TO) and A1 (TO) symmetry types oscillations in Raman spectra of SLN, CLN, and LiNbO3:Zn (0.03–1.59 mol.%).
| SLN | CLN | LiNbO3:Zn | ||||||||||||||||
|---|---|---|---|---|---|---|---|---|---|---|---|---|---|---|---|---|---|---|
| [Zn] = 0.03 | [Zn] = 0.05 | [Zn] = 0.94 | [Zn] =1.12 | [Zn] = 1.59 | ||||||||||||||
| E(TO) | ||||||||||||||||||
| v | s | v | s | v | s | I | v | s | I | v | s | I | v | s | I | v | s | I |
| 156 | 7 | 156 | 12 | 156 | 9 | 71.77 | 155 | 9 | 81.78 | 155 | 10 | 75.75 | 155 | 11 | 80.95 | 155 | 11 | 68.83 |
| 240 | 9 | 240 | 11 | 240 | 10 | 84.59 | 240 | 10 | 95.83 | 240 | 11 | 90.39 | 240 | 11 | 95.81 | 240 | 11 | 89.94 |
| 268 | 10 | 268 | 14 | 268 | 13 | 29.03 | 268 | 12 | 32.1 | 268 | 13 | 30.18 | 268 | 14 | 30.23 | 268 | 15 | 28.4 |
| 280 | 8 | 280 | 12 | 280 | 8 | 11.47 | 280 | 8 | 13.28 | 279 | 8 | 12.89 | 280 | 7 | 12.55 | 279 | 6 | 12.74 |
| 324 | 10 | 324 | 13 | 324 | 14 | 47.96 | 324 | 14 | 52.85 | 324 | 14 | 50.36 | 324 | 15 | 55.67 | 324 | 15 | 57.18 |
| 371 | 17 | 371 | 23 | 371 | 21 | 28.9 | 371 | 21 | 30.59 | 371 | 23 | 29.81 | 371 | 24 | 30.74 | 370 | 24 | 29.76 |
| 393 | 13 | 393 | 14 | 393 | 14 | 9.89 | 393 | 14 | 10.27 | 394 | 13 | 9.46 | 394 | 12 | 10.14 | 394 | 12 | 10.13 |
| 434 | 10 | 434 | 14 | 434 | 12 | 22.73 | 434 | 12 | 22.66 | 434 | 13 | 23.73 | 435 | 13 | 23.96 | 435 | 13 | 23.36 |
| 576 | 16 | 576 | 15 | 576 | 22 | 100 | 576 | 22 | 100 | 576 | 23 | 100 | 576 | 24 | 100 | 576 | 25 | 100 |
| - | - | - | - | 596 | 25 | 26.53 | 597 | 35 | 28.11 | 598 | 26 | 26.63 | 598 | 23 | 27.22 | 598 | 24 | 28.42 |
| - | - | - | - | 682 | 73 | 5.15 | 682 | 81 | 5.5 | 666 | 102 | 6.5 | 662 | 104 | 7.9 | 668 | 95 | 7.64 |
| 876 | 20 | 876 | 30 | 876 | 29 | 1.35 | 874 | 29 | 1.54 | 873 | 32 | 1.39 | 876 | 44 | 1.7 | 874 | 39 | 1.67 |
| A1(TO) | ||||||||||||||||||
| v | s | v | s | v | s | I | v | s | I | v | s | I | v | s | I | v | s | I |
| 255 | 18 | 255 | 26 | 255 | 25 | - | 255 | 24 | - | 255 | 23 | - | 255 | 23 | - | 255 | 23 | - |
| 276 | 11 | 276 | 14 | 276 | 14 | - | 276 | 14 | - | 276 | 15 | - | 276 | 15 | - | 276 | 16 | - |
| 626 | 20 | 626 | 25 | 626 | 32 | 17.07 | 625 | 29 | 19.25 | 625 | 28 | 19.63 | 625 | 28 | 21.1 | 625 | 30 | 21.81 |
© 2019 by the authors. Licensee MDPI, Basel, Switzerland. This article is an open access article distributed under the terms and conditions of the Creative Commons Attribution (CC BY) license (http://creativecommons.org/licenses/by/4.0/).
Share and Cite
MDPI and ACS Style
Sidorov, N.; Palatnikov, M.; Kadetova, A. Raman Scattering in Non-Stoichiometric Lithium Niobate Crystals with a Low Photorefractive Effect. Crystals 2019, 9, 535. https://0-doi-org.brum.beds.ac.uk/10.3390/cryst9100535
AMA Style
Sidorov N, Palatnikov M, Kadetova A. Raman Scattering in Non-Stoichiometric Lithium Niobate Crystals with a Low Photorefractive Effect. Crystals. 2019; 9(10):535. https://0-doi-org.brum.beds.ac.uk/10.3390/cryst9100535
Chicago/Turabian StyleSidorov, Nikolay, Mikhail Palatnikov, and Alexandra Kadetova. 2019. "Raman Scattering in Non-Stoichiometric Lithium Niobate Crystals with a Low Photorefractive Effect" Crystals 9, no. 10: 535. https://0-doi-org.brum.beds.ac.uk/10.3390/cryst9100535
Note that from the first issue of 2016, this journal uses article numbers instead of page numbers. See further details here.