Article

A Combined Experiment and Crystal Plasticity FEM Study of Microstructure and Texture in Aluminium Processed by Reverse and Unidirectional Accumulative Roll-Bonding

School of Mechanical, Materials, Mechatronic and Biomedical Engineering, University of Wollongong, Wollongong, NSW 2522, Australia
*
Authors to whom correspondence should be addressed.
Submission received: 23 January 2019 / Revised: 15 February 2019 / Accepted: 21 February 2019 / Published: 24 February 2019
(This article belongs to the Section Crystalline Materials)

Abstract

:
In this report, reverse accumulative roll-bonding (ARB) was conducted for the first time. It was found that the microstructure after reverse ARB was relatively coarser than that after unidirectional ARB, and texture intensity was slightly weaker. In addition to the experimental study, the crystal plasticity finite element method was applied to the ARB-processed polycrystalline aluminium. The simulation followed the real deformation of reverse ARB and unidirectional ARB, and the predictions were validated by the experimental observations. Compared to the second cycle of unidirectional ARB, the crystal orientations (after the first cycle) were relatively unstable during the second cycle of reverse ARB, which is believed to be the reason for the relatively coarser microstructure after reverse ARB.

1. Introduction

The texture and microstructure evolution in materials processed by accumulative roll-bonding (ARB) are complex due to the repeated cycles of cutting, stacking, and roll-bonding [1,2]. In each ARB cycle, the imposed shear strain is not uniform through the thickness. The large shear strain at the surface results in fast microstructure refinement and shear-type texture [1], while the low shear strain near the centre leads to coarse microstructure and rolling-type texture. In the next cycle, the surface moves to the centre due to the cutting and stacking, and thus the grain refinement becomes slow [1] and the shear texture evolves into rolling texture. Multi-cycle ARB results in a complicated distribution of through-thickness shear strain. The evolution of microstructure and texture in ARB is associated with the imposed shear strain [2,3]. However, how the strain path change influences the transition of microstructure and texture during rolling has not been well studied.
In addition to experimental methods, texture modelling has become a powerful tool, but it has not been widely applied to ARB, as modelling of ARB is challenging [2,4]. Texture evolution in polycrystalline aluminium has been statistically studied by the Taylor model [5], ALAMEL model [4,6], and viscoplastic self-consistent model [7,8,9]. Unlike these ”mean-field” crystal plasticity (CP) models, no homogenization is assumed in the ”full-field” theory—crystal plasticity finite element method (CPFEM). In CPFEM, the CP constitutive law is incorporated into the finite element method (FEM) framework, and the stress equilibrium and strain compatibility in each time increment are reached by basic mechanics principles for all elements. CPFEM simulations in two prior studies [3,10] captured the reversal of crystal rotation during ARB. They suggested that the reversal was due to the cutting and stacking of the material, and the starting materials used in both reports were single crystals. The CPFEM model has also been applied to ARB-processed polycrystals [11,12,13], but in these studies the ARB process was simplified to plain strain compression (PSC), and accordingly, the transition of microstructure and texture associated with strain path change is not reachable.
In the current research, reverse ARB (RevARB) was conducted for the first time. In RevARB, the rolling direction (RD) was reversed in the second ARB cycle, that is, rotating the sheet 180° about the normal direction (ND). Compared to unidirectional ARB (UniARB) or conventional ARB, multi-cycle RevARB can generate a different combination of shear strain through the thickness. The microstructure and texture after RevARB were characterized and compared to those after UniARB. Moreover, the CPFEM model was applied to ARB-processed polycrystals and the simulation followed the real ARB process, including RevARB and UniARB, and the predictions were validated by the experimental observations. Finally, the effect of rolling direction on microstructure and texture was investigated, which is the purpose of this study.

2. Experiment

The starting material was fully annealed commercial aluminium alloy AA1050 sheets with an initial thickness of 1 mm. Two pieces of the starting material were stacked after surface treatment then joined together by metal wires at the four corners. The sheets were introduced into the rolling gap in the same direction for UniARB (Figure 1), while they were turned end for end for the second cycle of RevARB. The ARB experiment was performed at room temperature under dry conditions, and the nominal reduction was 50% in a cycle. The experiment was conducted with a laboratory rolling mill consisting of 250 mm diameter rolls, and the rolls were newly polished. After ARB, electron backscattered diffraction (EBSD, JEOL, Wollongong, NSW, Australia) was utilized to characterize the through-thickness microstructure and deformation texture, and the measurements were taken on the RD–ND plane. The observed surfaces were mechanically grinded and polished, then finished with electropolishing (16 °C, 25 V, and A3 Struers electrolyte). The EBSD scans were carried out with an accelerating voltage of 15 kV and a working distance of 15 mm. The scanned region in each cycle covered 400 µm along the RD and ~1000 µm along the ND. The step size was 2 µm for the first cycle of ARB (1-ARB) and 0.5 µm for the second ARB cycle (2-ARB).
In order to measure the imposed through-thickness shear strain, embedded-pin tests were used in 1-ARB—the exact same method used in a prior study [1]. In this measurement, AA1050 sheets with an initial thickness of 2 mm were used and they received the same annealing treatment. The pins (also 2 mm in thickness) were electrospark-machined from the sheets and embedded at the midpoint along the width of the sheets. In 1-ARB, only one piece of the 2 mm sheets was rolled (without stacking). After rolling, the curves of the deformed embedded-pins on the RD–ND plane were observed using an optical microscope (OM, Leica, Wollongong, NSW, Australia), and the flection of the pins was used to validate the friction coefficient in the simulation.

3. Texture Modelling

Figure 1 shows the FEM model, which was two-dimensional under plain strain conditions. Two sets of FEM models were developed in 1-ARB and in each of them a single-layered sheet (2 mm in thickness) was considered. The sheet was partitioned into two parts representing the two stacked sheets, that is, the A and B layers in the first set and the C and D layers in the second set. After 50% reduction in 1-ARB, the two sheets (comprising of four layers; A, B, C, and D) were stacked and rolled again at a 50% reduction in 2-ARB. A relatively large friction coefficient, 0.25, was applied to the interface in 2-ARB because in the experiment the wire-brushing would increase the surface roughness. As there was no remeshing between cycles, the deformation solution (e.g., strain and crystal rotation) after 2-ARB is the cumulative value. The imposed deformation in 2-UniARB was in the same direction as in 1-ARB, while it was reversed in 2-RevARB, as indicated by the red arrows in Figure 1. The sheet was rolled by rotating rolls via surface friction. The friction coefficient between the sheet and rolls was tested by matching the deformed FEM mesh to the curve of the embedded-pins, and thus a coefficient of 0.15 was chosen after comparing a series of coefficients. Figure 1 also shows the polycrystal structure before ARB. A part of the sheet was selected from the region with a steady state of deformation in each set. The four layers A, B, C, and D were meshed into 9600 elements, and they were assigned to ~384 grains. On average, a grain included 25 elements—5 along the RD and 5 along the ND. All elements in a grain have the same initial orientation, and thus in-grain subdivision is accessible. To avoid the grains being perfectly square in shape, a certain deviation was introduced when generating the polycrystal structure (Figure 1). The remainder of the sheet also had a polycrystal structure. This was not included in the analysis because of the effect of the ends, which have a non-steady state of deformation. The element type was CPE4R, which can provide efficient numerical formulation. A random initial texture was used to reduce the influence of the starting texture on deformation texture.
A well-recognized kinematic scheme [14,15] was adopted, which is described in Appendix A. This scheme was implemented into the commercial FEM code ABAQUS/Standard ver.6.9-1 by the user-defined material (UMAT) subroutine. The slip plane in FCC structured aluminium is {111} and slip direction <110>. The Bassani–Wu hardening model [16] was employed, which is regarded as the best texture predictor following a comparative study of five different hardening models [17]. The material parameters in the hardening model were evaluated by fitting the simulated stress–strain curve with the experimental measurements under PSC. The hardening model and material parameters are described in Appendix B. This CPFEM model and the set of material parameters have been used in prior research to investigate texture evolution after different rolling processes [3,18], and accurate predictions have been obtained.

4. Results and Discussion

Figure 2a shows an inverse pole figure (IPF) and high angle grain boundaries (HAGBs) EBSD map after 1-ARB. The microstructure was almost uniform through the thickness, and it seems that the observed HAGBs in Figure 2a were the initial HAGBs before processing but were not developed during 1-ARB. This is similar to the experimental observations after lubricated ARB [1]. Rolling texture evolved after 1-ARB (Figure 2d), which typically consisted of {112}<111>, {123}<634>, and {110}<112>. The positions of these three texture components are shown in Figure 3e. After 2-ARB (Figure 2b,c), the grains were further elongated along the RD. The microstructure after 2-UniARB was relatively finer than after 2-RevARB, especially in the B and C layers. This can be confirmed by the distribution of grain size in Figure 2g, in which the fraction of relatively large grains (≥20 µm) after 2-RevARB was noticeably higher than after 2-UniARB. Meanwhile, the area fraction of HAGBs after 2-UniARB was obviously higher than after 2-RevARB (Figure 2h). It was still rolling texture after 2-ARB (Figure 2e,f), and the texture intensity of 2-UniARB (4.46) was slightly higher than that of 2-RevARB (4.11).
Generally, after unlubricated ARB, shear texture is found at the surface and rolling texture near the centre [1,2], and the grain size is respectively small and large at the surface and centre. However, in this study the through-thickness microstructure was almost uniform and rolling texture developed through almost the whole thickness, differing from the typical findings after unlubricated ARB [1,2], but similar to those after lubricated ARB [1]. This difference was due to the fact that the imposed shear strain in the current ARB experiment was very low, as measured by the deformed pins in Figure 2i. The magnitude of shear strain in Figure 2i was surprisingly close to after lubricated ARB [1]. This is probably because the rolls were newly polished and thus the surface roughness was greatly reduced. As Su et al. [19] suggested, high roll surface roughness would result in a large surface friction, and hence fast grain refinement and increased shear texture at the surfaces.
In the simulation, the macroscopic distortion of the FEM mesh after 1-ARB (Figure 3a) was close to the curve of the deformed pin (Figure 2i). The local distortion of the FEM mesh was slightly influenced by the grains, which can also be seen from the curve of the deformed pin, as marked by red arrows in Figure 2i. The elongation of grains and crystal rotation increased again after 2-ARB, as shown in Figure 3b. The {111} pole figures in Figure 3f–h show the deformation texture after 1-ARB, 2-UniARB, and 2-RevARB, respectively, which were constructed from all four (A, B, C, and D) layers by a Matlab toolbox, MTEX [20]. The predicted textures after 1-ARB and 2-ARB were rolling-type textures, and the texture intensity after 2-UniARB was slightly higher than after 2-RevARB, in agreement with the experimental observations (Figure 2d–f). The agreement indicates the reasonability of the chosen friction coefficient (0.15). In other numerical studies [2,4], larger friction coefficients resulted in shear-type texture during ARB. The dominance of rolling texture in the simulation is consistent with the low shear strain represented by the distorted FEM mesh after 1-ARB (Figure 3a). Figure 3c,d show the change in crystal rotation (relative to that after 1-ARB) in 2-UniARB and 2-RevARB, respectively. ”Increased rotation” and ”Decreased rotation” mean that the crystal rotation was larger and lower than after 1-ARB, respectively. Decreased rotation angles occurred after both 2-UniARB and 2-RevARB, and they distributed through the whole thickness, where the decreased crystal rotation means the crystal orientation rotated towards the starting orientation during 2-ARB. It can be seen that the area fraction of decreased crystal rotation after 2-RevARB (32.75%) was higher than that after 2-UniARB (14.42%).
Figure 4a shows the distribution of rotation angles in all elements of the four layers. The distribution of rotation angles, relative to the initial orientations (‘1-ARB, relative to initial’), peaks at 9° after 1-ARB. It reached the maximum at 7° after 2-UniARB and 2-RevARB alone (“2-ARB, relative to 1-ARB”), while the fraction of large rotation angles (>15°) dropped. The distribution of cumulative rotation angles in 2-ARB (“2-UniARB, relative to initial” and ”2-RevARB, relative to initial”) peaks at 17°, and possessed a high fraction of large rotation angles (>37°), while these large rotation angles (>37°) could not be seen from that after only a single cycle (1-ARB or 2-ARB). The crystal rotation in each element was further partitioned into crystal rotation about the RD, transverse direction (TD), and ND in the manner proposed by Wert et al. [21]. In an element, only the rotation axis corresponding to the maximum partitioned rotation angle among these three components (RD-, TD-, or ND-rotation) was considered. The distribution of rotation axes is shown in Figure 4b. After 1-ARB, TD was the main axis, while RD was the secondary axis. This is consistent with the findings of CPFEM simulation of rolling [22]. In 2-UniARB alone, the fractions of these three axes were comparable. In contrast, the fraction of the TD-axis increased greatly in 2-RevARB alone, and it was even higher than after 1-ARB, while the RD and ND axes dropped slightly. The increasing fraction of the ND- and RD-axis in 2-UniARB resulted from ND- and RD-rotation being larger than TD-rotation, that is, the texture previously developed after 1-ARB was stable during 2-UniARB. In contrast, the increased TD-axis in 2-RevARB means that the crystal orientations that had reached relatively stable positions after 1-ARB became unstable during 2-RevARB.
Texture evolution is a pronounced function of the starting texture and imposed deformation [3]. The texture evolution and plastic deformation are coupled during material processing, and this coupling is realized in the CPFEM model. In this simulation, the random initial texture resulted in strong grain interaction in 1-ARB and thus large rotation angles and the dominance of TD-rotation (Figure 4). The rate of crystal rotation became slow in 2-ARB (Figure 4a) because the grain interaction was reduced in 1-ARB and crystal orientations rotated into relatively stable positions (rolling texture). The cumulative crystal rotation after 2-UniARB (“2-UniARB, relative to initial” in Figure 4a) was larger than after 2-RevARB, but the crystal rotation developed in 2-UniARB alone (“2-UniARB, relative to 1-ARB” in Figure 4a) was smaller than after 2-RevARB alone. This means the crystal orientations after 1-ARB were still stable in 2-UniARB, while they were relatively unstable in 2-RevARB. This also indicates that the crystal rotation in 2-RevARB, compared to that in 2-UniARB, was relatively towards the initial orientation. Compared to that after 2-UniARB, the coarser microstructure after 2-RevARB is believed to be caused by the relatively larger crystal rotation in 2-RevARB. This is consistent with the fraction of decreased crystal rotation in 2-UniARB being lower than that after 2-RevARB, and also consistent with the prediction that the texture intensity after 2-UniARB is slightly higher than after 2-RevARB (Figure 3f,g). The imposed strain was the same in magnitude after 2-UniARB and 2-RevARB, but the microstructure (Figure 2b,c) and crystal rotation (Figure 4a) were different. This demonstrates that not only the magnitude of strain, but also the strain path influences microstructural refinement, though the shear strain is very low. The strain path changes even in conventional ARB [2], and the cutting and stacking in conventional ARB would result in a complicated distribution of shear strain. This study shows that the microstructure and texture in ARB can be controlled by introducing different combinations of strain (e.g., reverse ARB, asymmetric-ARB [23], and cross-ARB [24]).

5. Conclusions

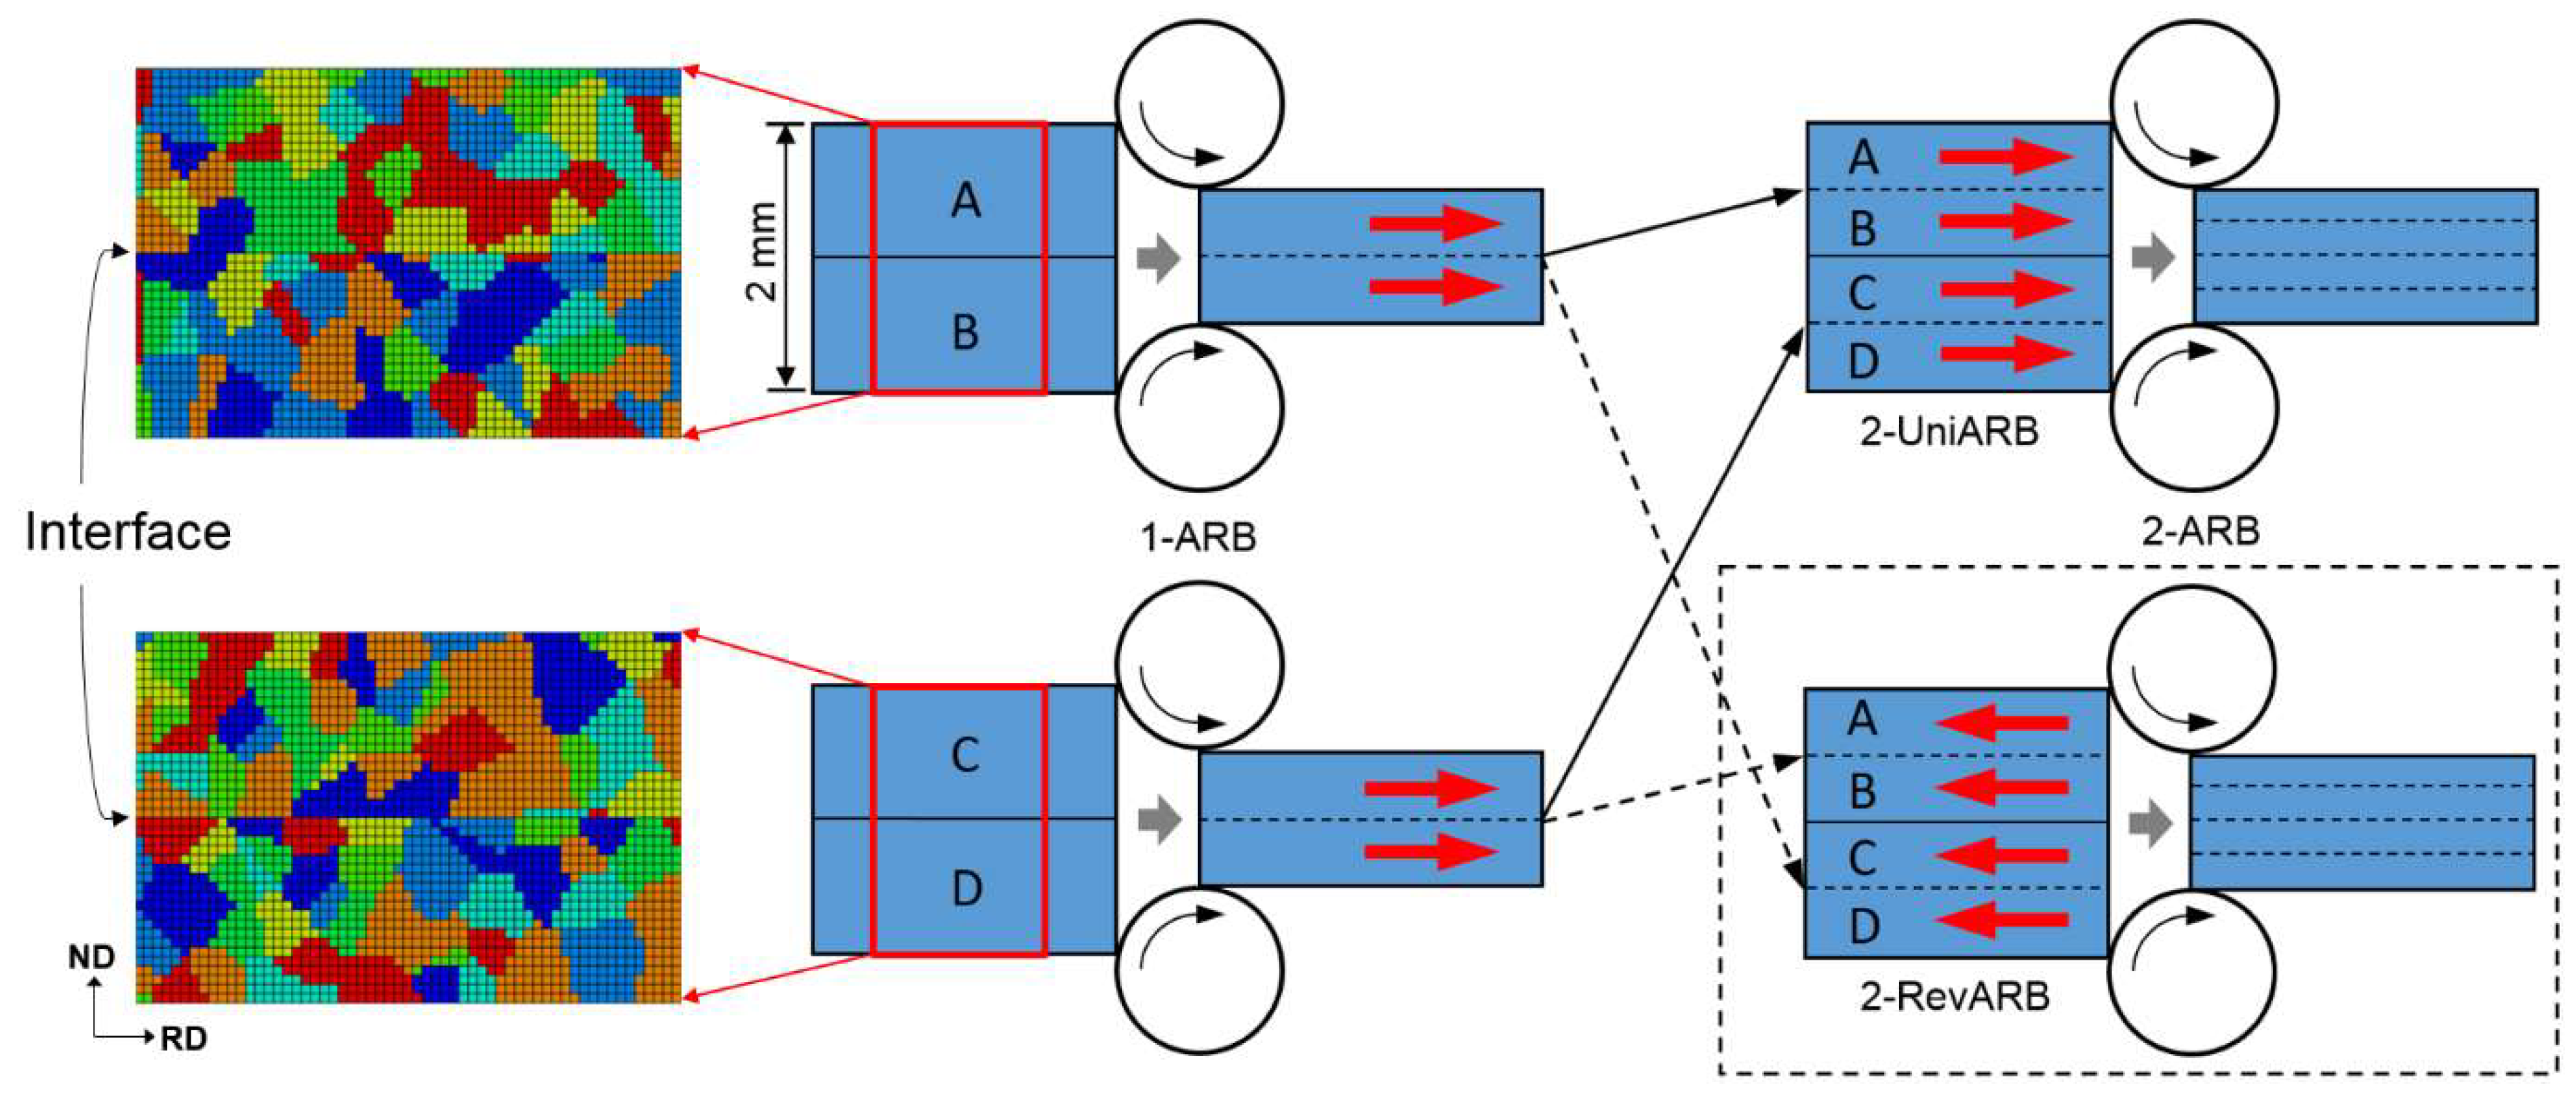
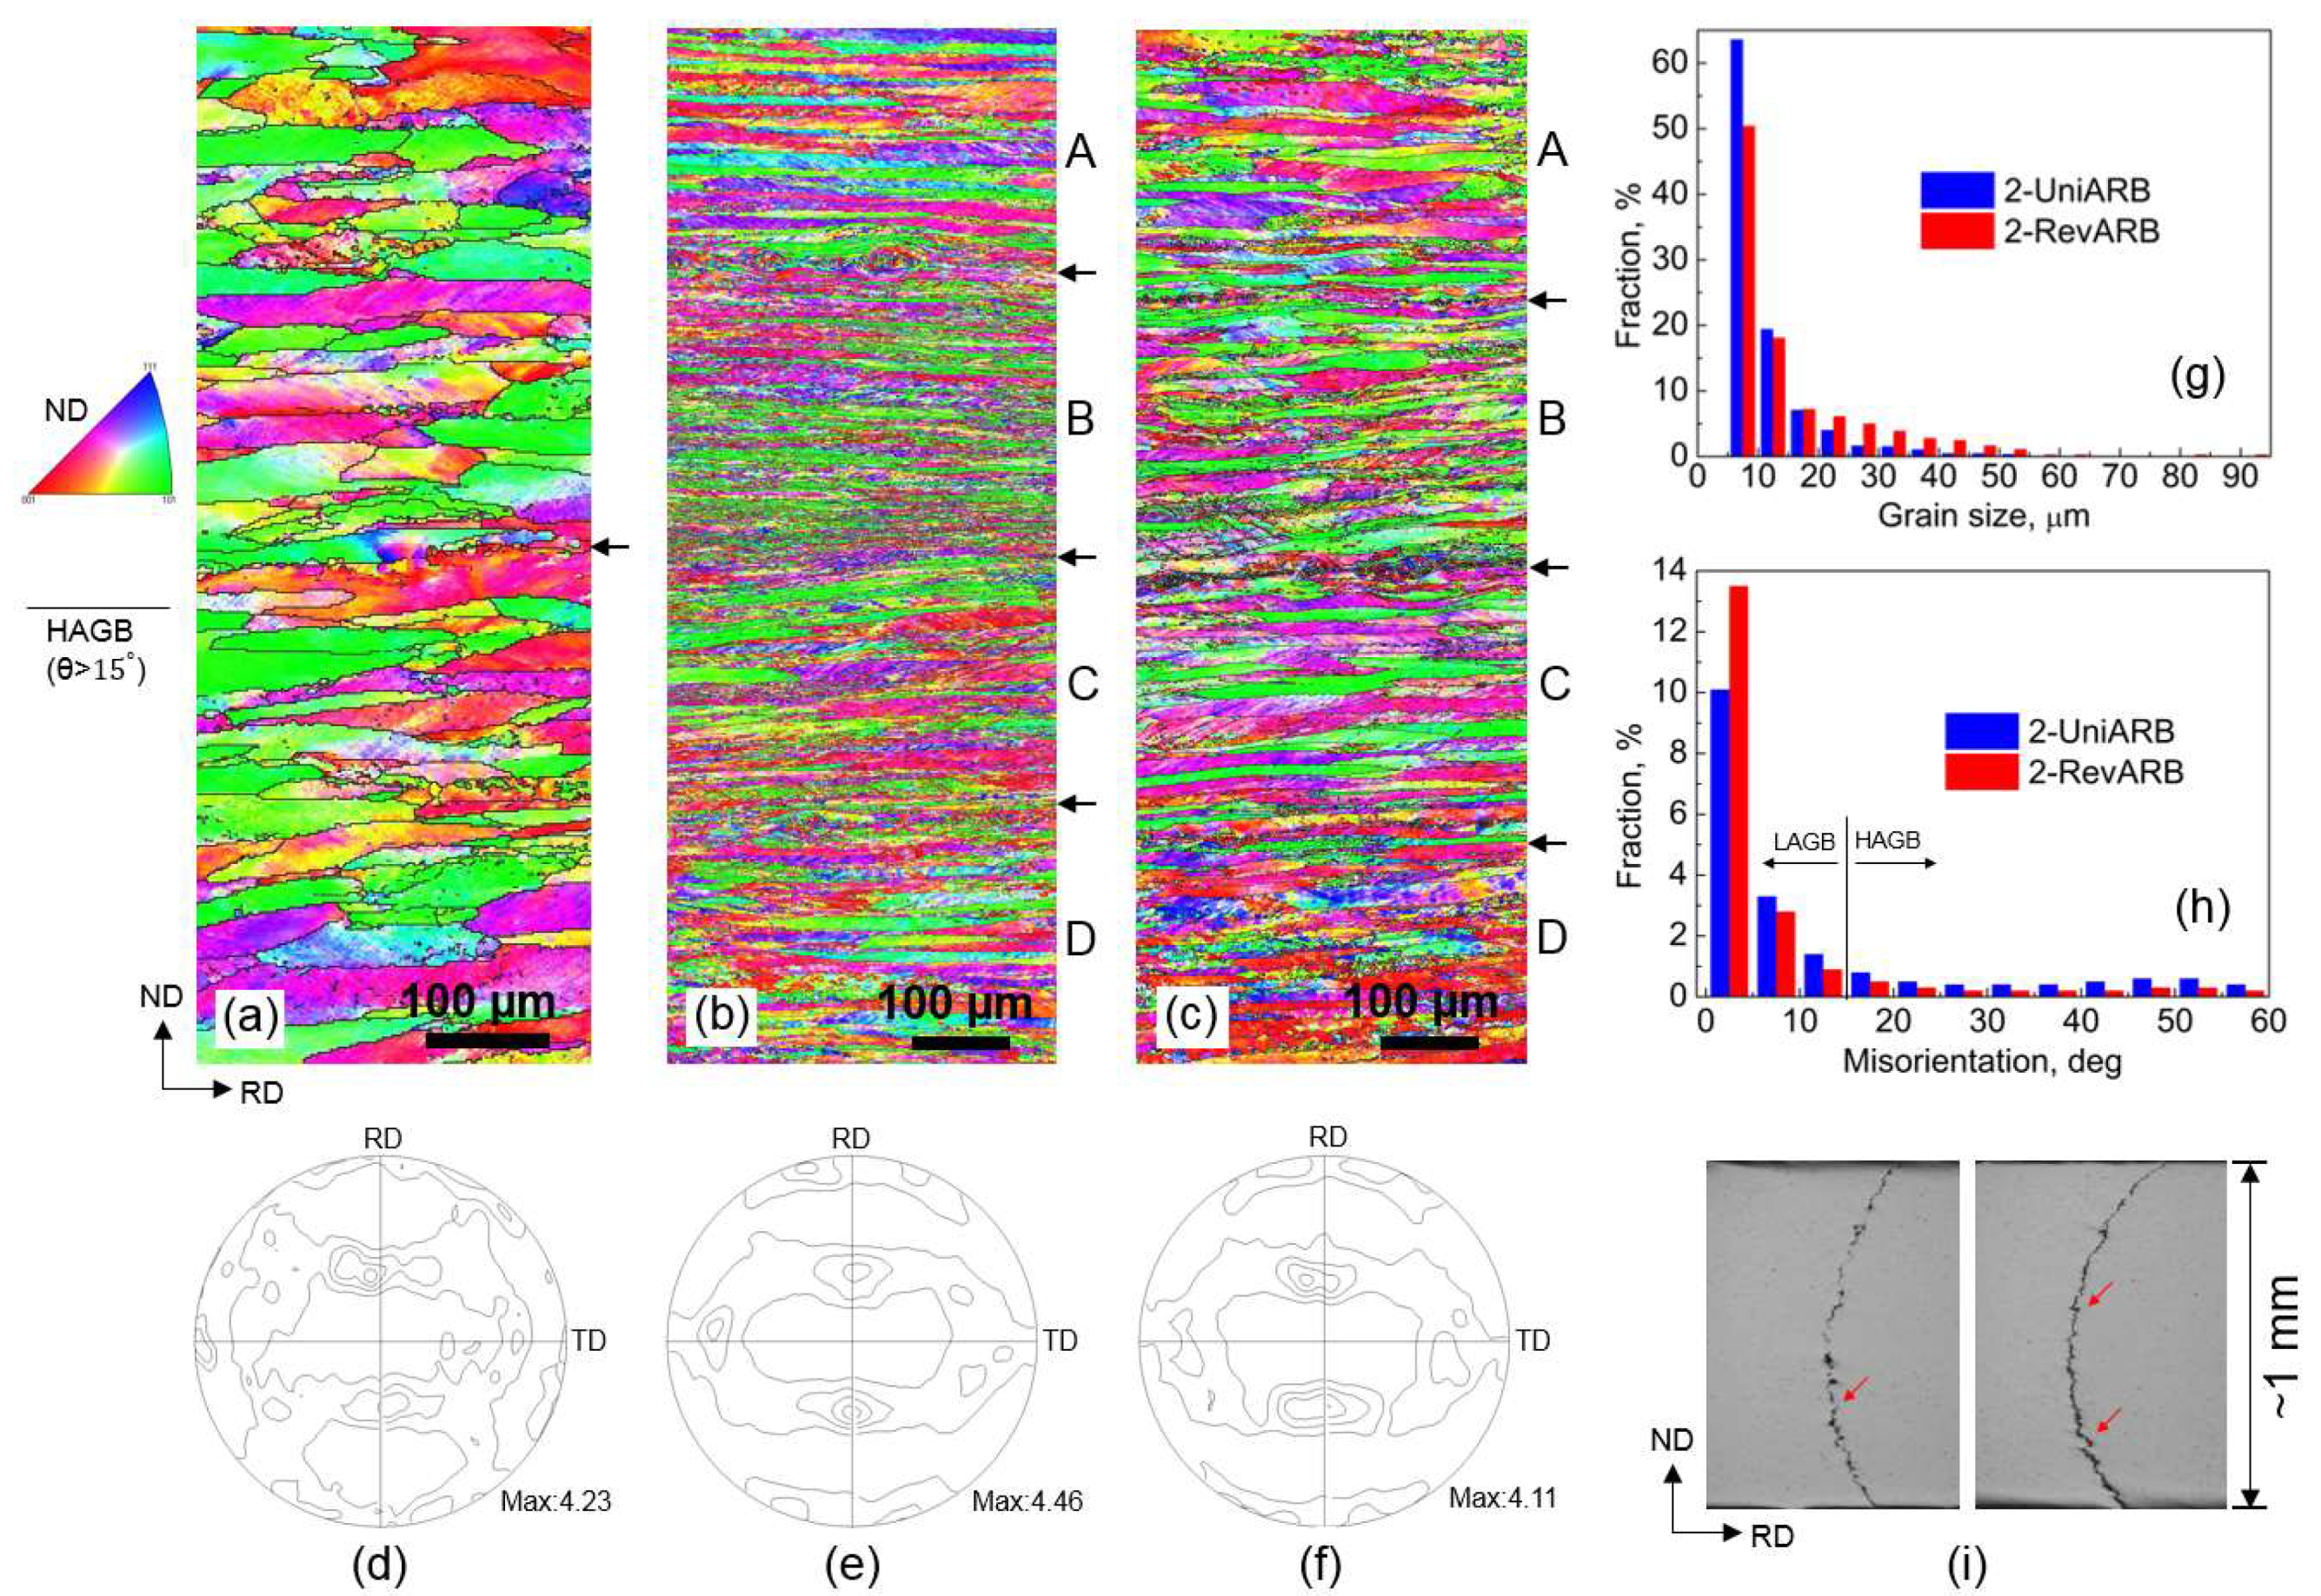
  • Reverse ARB was conducted for the first time. It was found that the microstructure after reverse ARB was relatively coarser than after unidirectional ARB.
  • The low shear strain resulted in rolling texture and almost uniform through-thickness microstructure, since the rolls were newly polished.
  • The CPFEM model was applied to ARB-processed polycrystals, and the simulation followed the real ARB process. The predictions matched well with the experimental observations.
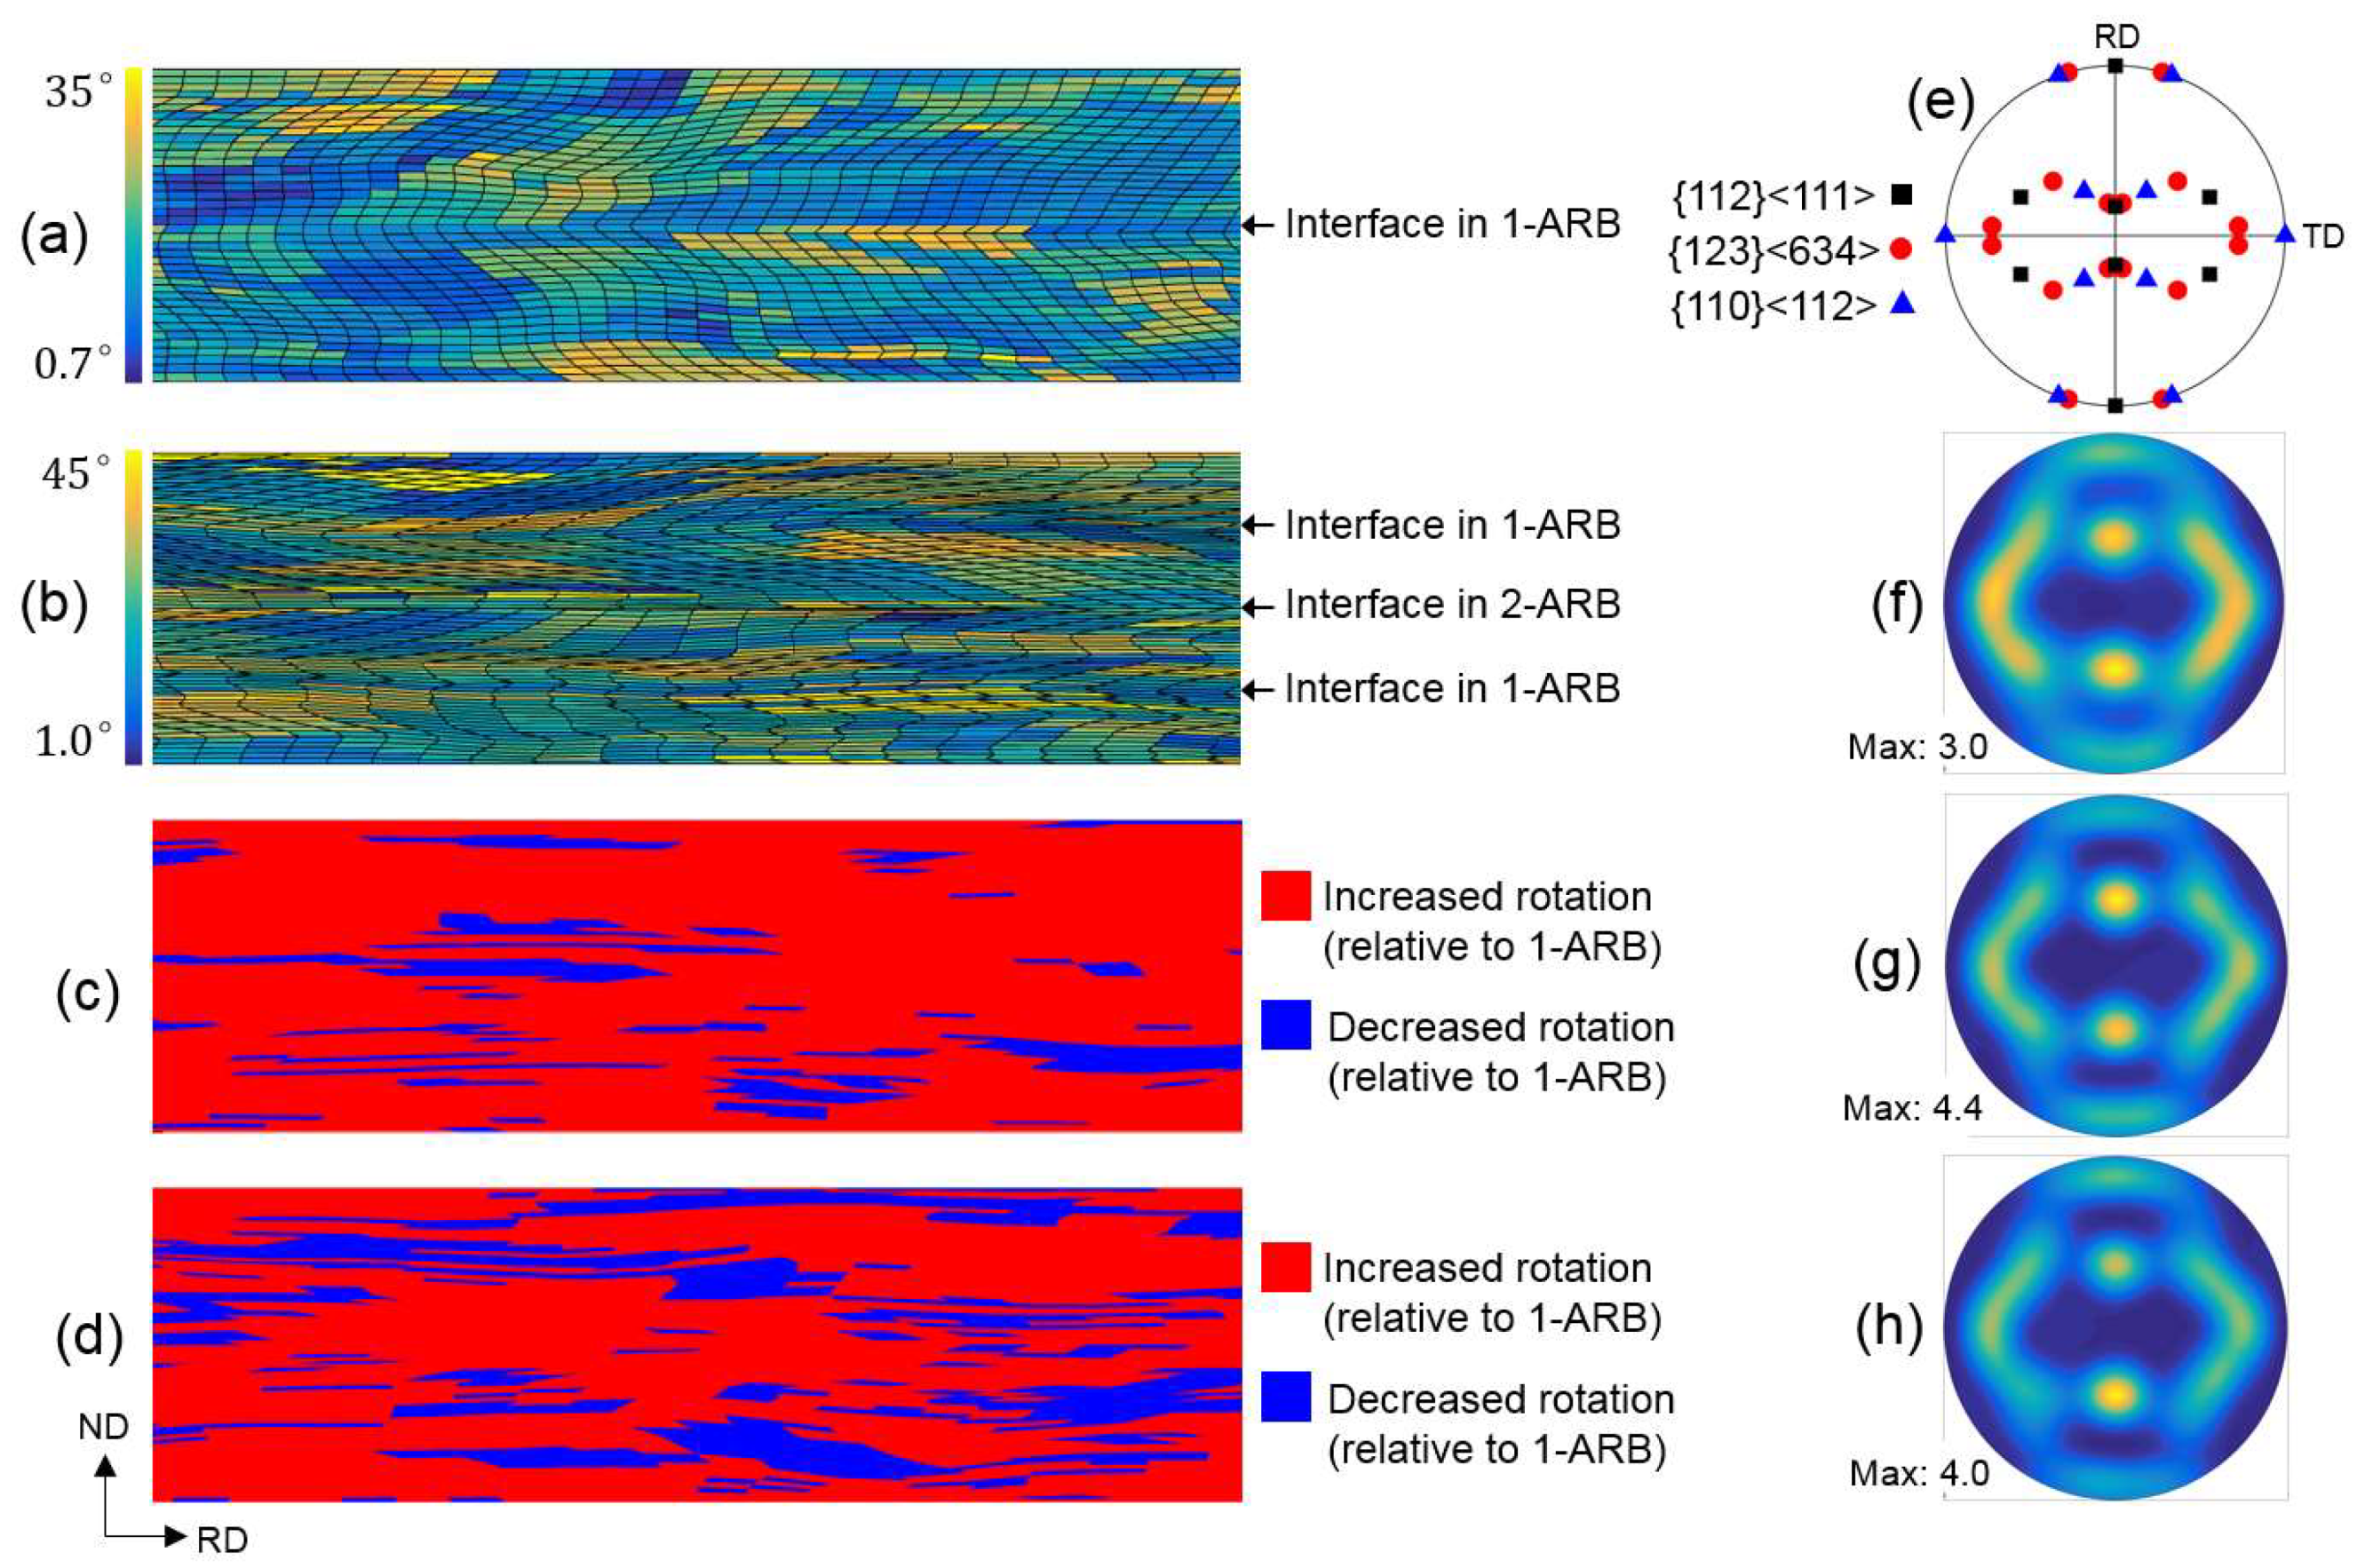
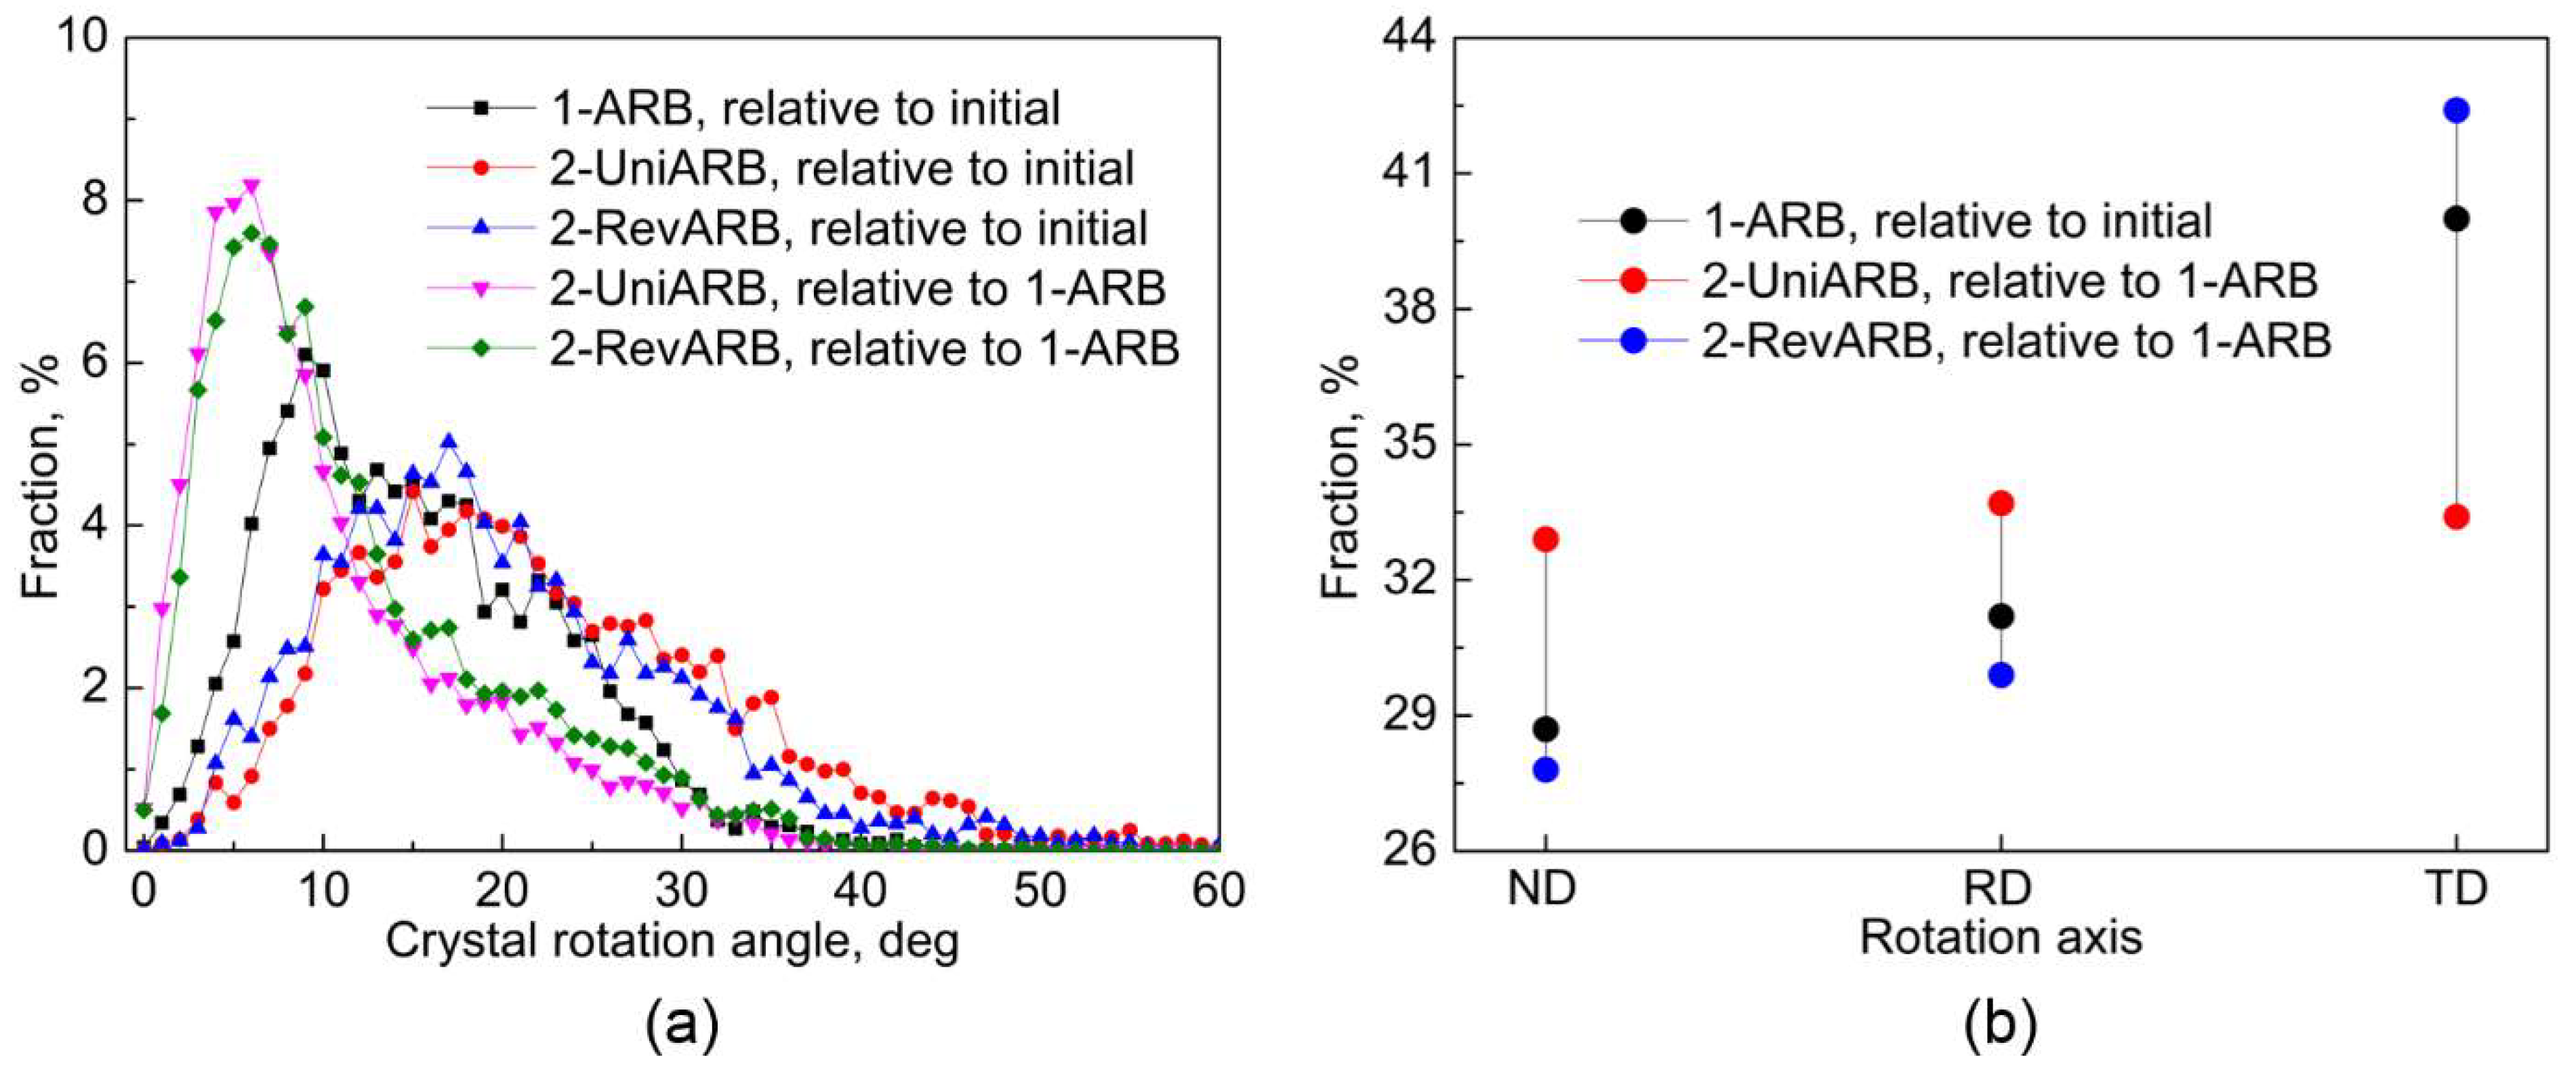
  • The crystal orientations previously rotated in 1-ARB were relatively stable in the second cycle of unidirectional ARB, while they became relatively unstable in the second cycle of reverse ARB.

Author Contributions

Investigation, H.W.; Writing—original draft, H.W.; Writing—review & editing, C.L. and K.T.

Acknowledgments

This work was supported by the Australian Research Council Discovery Project (DP170103092). The authors acknowledge the use of facilities within the UOW Electron Microscopy Centre (LE0882613).

Conflicts of Interest

The authors declare that they have no conflict of interest.

Appendix A. Kinematics

The crystal plasticity model follows the well-recognized kinematic scheme developed by Asaro [14] and Peirce [15]. In this scheme, the deformation gradient F is decomposed into two components as
F = F * · F P ,
where F * embodies the elastic deformation and rigid body rotation, and F P consists of crystallographic slip on slip systems. The velocity gradient L is evaluated from the deformation gradient by
L = F ˙ F 1 = L * + L P .
The velocity gradient can be uniquely decomposed into a symmetrical part and a skewed-symmetrical part as
L = D + Ω ,
D = 1 2 ( L + L T ) ,
Ω = 1 2 ( L L T ) ,
where D and Ω are called the stretch rate tensor and spin tensor, respectively. Ω can be represented by the rigid rotation of a finite region or redundant shear strain, and it can also be decomposed into the elastic stretching and lattice rotation part Ω * and plastic part Ω P , namely
Ω = Ω * + Ω P .
Ω * is due to distortion and rotation of the crystal lattice, which is the reason for texture evolution. The plastic spin Ω P is caused by the motion of dislocation on slip planes and along slip directions, which is calculated according to
Ω P = α = 1 12 1 2 ( s ( α ) · m ( α ) m ( α ) · s ( α ) ) γ ˙ ( α ) ,
where s ( α ) and m ( α ) are the slip direction and slip plane normal, respectively.

Appendix B. Hardening Model

The adopted Bassani–Wu hardening model [16] is a rate-dependent hardening model. In this hardening model, the shear strain rate γ ˙ ( α ) is decided by the resolved shear stress τ ( α ) on slip system α , as expressed by Equation (6), where γ ˙ 0 ( α ) is the reference value of the shear strain rate, n is the rate-sensitive exponent, and τ c ( α ) is the critical resolved shear stress of the slip system α . The values of γ ˙ 0 ( α ) , n , and τ c ( α ) are listed in Table A1.
γ ˙ ( α ) = γ ˙ 0 ( α ) sgn ( τ ( α ) ) | τ ( α ) τ c ( α ) | n for   τ ( α ) τ c ( α )
γ ˙ ( α ) = 0   for   τ ( α ) < τ c ( α )
The   sgn ( x ) = { 1     for   x 0 1     for   x < 0
The τ c ( α ) represents the strength of activating the slip system α , and its increase rate in value, τ ˙ c ( α ) , is determined by:
τ ˙ c ( α ) = β = 1 N h α β | γ ˙ ( β ) | ,
where h α β is the hardening modulus. As expressed in Equation (8), the activation of all slip systems would affect the hardening of each slip system. It is self-hardening, that is, h α α , when α is equal to β , while it is latent hardening h α β when α is not equal to β . The h α α and h α β are expressed by:
h α α = [ ( h 0 h s ) sech 2 ( ( h 0 h s ) γ ( α ) τ 1 τ 0 ) + h s ] [ 1 + β = 1 β α N f α β tanh ( γ ( β ) γ 0 ) ] , α = β ,
h α β = q h α α ,   α β ,
where h 0 is the hardening modulus after initial yield, h s is the hardening modulus of easy slip, τ 1 is the critical stress when plastic flow begins, τ 0 is the initial critical resolved shear stress, q is the ratio between latent hardening modulus and self-hardening modulus, and f α β is the interaction between slip system α and β . Material parameters in Equations (6) and (8) are listed in Table A1, which were evaluated by fitting the simulated stress–strain curve with the experimental results of an aluminium single crystal under plain strain compression [25]. The three elastic moduli are C 11 = 112,000   MPa , C 12 = 66,000   MPa and C 44 = 28,000   MPa .
Table A1. Material parameters used in the Bassani–Wu hardening model.
n γ 0 ˙   ( s 1 ) h 0   ( MPa ) h s   ( MPa ) τ 1   ( MPa ) τ 0   ( MPa ) q
3000.00011000.016.361

References

  1. Kamikawa, N.; Sakai, T.; Tsuji, N. Effect of redundant shear strain on microstructure and texture evolution during accumulative roll-bonding in ultralow carbon IF steel. Acta Mater. 2007, 55, 5873–5888. [Google Scholar] [CrossRef]
  2. Wang, H.; Su, L.; Yu, H.; Lu, C.; Tieu, A.K.; Liu, Y.; Zhang, J. A new finite element model for multi-cycle accumulative roll-bonding process and experiment verification. Mate. Sci. Eng. A 2018, 726, 93–101. [Google Scholar] [CrossRef]
  3. Wang, H.; Lu, C.; Tieu, K.; Wei, P.; Yu, H. Texture modelling of accumulative roll-bonding processed aluminium single crystal {1 2 3}<6 3 4> by crystal plasticity FE. Adv. Eng. Mater. 2018, in press. [Google Scholar]
  4. Li, S.; Sun, F.; Li, H. Observation and modeling of the through-thickness texture gradient in commercial-purity aluminum sheets processed by accumulative roll-bonding. Acta Mater. 2010, 58, 1317–1331. [Google Scholar] [CrossRef]
  5. Heason, C.P.; Prangnell, P.B. Grain refinement and texture evolution during the deformation of Al to ultra-high strains by accumulative roll bonding (ARB). Mater. Sci. Fourm 2002, 396–402, 429–434. [Google Scholar] [CrossRef]
  6. Pirgazi, H.; Akbarzadeh, A.; Petrov, R.; Sidor, J.; Kestens, L. Texture evolution of AA3003 aluminum alloy sheet produced by accumulative roll bonding. Mater. Sci. Eng. A 2008, 492, 110–117. [Google Scholar] [CrossRef]
  7. Verstraete, K.; Azzedine, H.; Helbert, A.L.; Brisset, F.; Bradai, D.; Baudin, T. Accumulative Roll Bonding at Room Temperature of a Bi-Metallic AA5754/AA6061 Composite: Impact of Strain Path on Microstructure, Texture, and Mechanical Properties. Adv. Eng. Mate. 2017, in press. [Google Scholar] [CrossRef]
  8. Prakash, A.; Nöhring, W.G.; Lebensohn, R.A.; Höppel, H.W.; Bitzek, E. A multiscale simulation framework of the accumulative roll bonding process accounting for texture evolution. Mater. Sci. Eng. A 2015, 631, 104–119. [Google Scholar] [CrossRef]
  9. Knezevic, M.; Nizolek, T.; Ardeljan, M.; Beyerlein, I.J.; Mara, N.A.; Pollock, T.M. Texture evolution in two-phase Zr/Nb lamellar composites during accumulative roll bonding. Int. J. Plast. 2014, 57, 16–28. [Google Scholar] [CrossRef]
  10. Wang, H.; Lu, C.; Tieu, K.; Wei, P.; Yu, H. Texture Stability and Transition in an Accumulative Roll-Bonding-Processed Aluminum Single Crystal. Metall. Mater. Trans. A 2019, in press. [Google Scholar] [CrossRef]
  11. Hansen, B.L.; Carpenter, J.S.; Sintay, S.D.; Bronkhorst, C.A.; McCabe, R.J.; Mayeur, J.R.; Mourad, H.M.; Beyerlein, I.J.; Mara, N.A.; Chen, S.R.; et al. Modeling the texture evolution of Cu/Nb layered composites during rolling. Inter. J. Plast. 2013, 49, 71–84. [Google Scholar] [CrossRef]
  12. Ardeljan, M.; Knezevic, M.; Nizolek, T.; Beyerlein, I.J.; Mara, N.A.; Pollock, T.M. A study of microstructure-driven strain localizations in two-phase polycrystalline HCP/BCC composites using a multi-scale model. Int. J. Plast. 2015, 74, 35–57. [Google Scholar] [CrossRef]
  13. Ardeljan, M.; Beyerlein, I.J.; Knezevic, M. A dislocation density based crystal plasticity finite element model: Application to a two-phase polycrystalline HCP/BCC composites. J. Mech. Phys. Solids 2014, 66, 16–31. [Google Scholar] [CrossRef]
  14. Asaro, R.J. Crystal plasticity. J. Appl. Mech. 1983, 50, 921–934. [Google Scholar] [CrossRef]
  15. Peirce, D.; Asaro, R.J.; Needleman, A. An analysis of nonuniform and localized deformation in ductile single crystals. Acta Metall. 1982, 30, 1087–1119. [Google Scholar] [CrossRef]
  16. L.Bassani, J.; Wu, T.-Y. Latent Hardening in Single Crystals II. Analytical Characterization and Predictions. Pro. Roy. Soc. A 1991, 435, 21. [Google Scholar] [CrossRef]
  17. Lin, G.; Havner, K.S. A comparative study of hardening theories in torsion using the Taylor polycrystal model. Int. J. Plast. 1996, 12, 695–718. [Google Scholar] [CrossRef]
  18. Wang, H.; Lu, C.; Tieu, A.K.; Su, L.; Deng, G. Coupled effects of initial orientation scatter and grain-interaction to texture evolution: A crystal plasticity FE study. Int. J. Mater. Form. 2019, 12, 161–171. [Google Scholar] [CrossRef]
  19. Su, L.; Lu, C.; Gazder, A.A.; Saleh, A.A.; Deng, G.; Tieu, K.; Li, H. Shear texture gradient in AA6061 aluminum alloy processed by accumulative roll bonding with high roll roughness. J. Alloys Comp. 2014, 594, 12–22. [Google Scholar] [CrossRef]
  20. Bachmann, F.; Hielscher, R.; Schaeben, H. Texture analysis with MTEX—Free and open source software toolbox. Solid State Phen. 2010, 160, 63–68. [Google Scholar] [CrossRef]
  21. Wert, J.A.; Liu, Q.; Hansen, N. Dislocation boundary formation in a cold-rolled cube-oriented Al single crystal. Acta Mater. 1997, 45, 2565–2576. [Google Scholar] [CrossRef]
  22. Quey, R.; Driver, J.H.; Dawson, P.R. Intra-grain orientation distributions in hot-deformed aluminium: Orientation dependence and relation to deformation mechanisms. J. Mech. Phys. Solids 2015, 84, 506–527. [Google Scholar] [CrossRef] [Green Version]
  23. Ng, H.P.; Przybilla, T.; Schmidt, C.; Lapovok, R.; Orlov, D.; Höppel, H.W.; Göken, M. Asymmetric accumulative roll bonding of aluminium-titanium composite sheets. Mater. Sci. Eng. A 2013, 576, 306–315. [Google Scholar] [CrossRef]
  24. Ruppert, M.; Höppel, H.W.; Göken, M. Influence of cross-rolling on the mechanical properties of an accumulative roll bonded aluminum alloy AA6014. Mater. Sci. Eng. A 2014, 597, 122–127. [Google Scholar] [CrossRef]
  25. Liu, Q.; Maurice, C.; Driver, J.; Hansen, N. Heterogeneous Microstructures and Microtextures in CubeOriented Al crystals after channel die compression. Metall. Mater. Trans. A 1998, 29, 2333–2344. [Google Scholar] [CrossRef]
Figure 1. Finite element method (FEM) model of unidirectional accumulative roll-bonding (UniARB) and reverse accumulative roll-bonding (RevARB), and two representative regions of polycrystal structures. The red arrows indicate the direction of the imposed deformation. 1-ARB: first ARB cycle; 2-ARB: second ARB cycle; ND: normal direction; RD: rolling direction.
Crystals 09 00119 g001
Figure 2. Through-thickness inverse pole figure (IPF), high angle grain boundaries (HAGBs) electron backscattered diffraction (EBSD) maps, and {111} pole figures after (a,d) 1-ARB, (b,e) 2-UniARB, and (c,f) 2-RevARB. (g) Distribution of grain size. (h) Misorientation angles after 2-UniARB and 2-RevARB. (i) An optical microscope (OM) image shows the flection of the deformed embedded-pin after 1-ARB.
Crystals 09 00119 g002
Figure 3. Distribution of crystal rotation angles and deformed FEM meshes after (a) 1-ARB and (b) 2-RevARB. Distribution of increased and decreased crystal rotation (relative to that after 1-ARB) after (c) 2-UniARB, and (d) 2-RevARB. (e) A {111} pole figure shows the positions of three rolling texture components. {111} pole figures after (f) 1-ARB, (g) 2-UniARB, and (h) 2-RevARB.
Crystals 09 00119 g003
Figure 4. (a) Distribution of crystal rotation angles, and (b) fraction of RD-, ND-, and TD-axis.
Crystals 09 00119 g004

