Element Segregation and Electrical Properties of PMN-32PT Grown Using the Bridgman Method
by
Sijia Wang
1,2, 
Zengzhe Xi
1,2,3,*,
Pinyang Fang
2,3,
Xiaojuan Li
2,3,
Wei Long
2,3 and
Aiguo He
2,3 1
School of Science, Xi’an Technological University, Xi’an 710021, China
2
Shaanxi Key Laboratory of Photoelectric Functional Materials and Devices, Xi’an 710021, China
3
School of Materials and Chemical Engineering, Xi’an Technological University, Xi’an 710021, China
*
Author to whom correspondence should be addressed.
Crystals 2019, 9(2), 98; https://0-doi-org.brum.beds.ac.uk/10.3390/cryst9020098
Submission received: 5 January 2019
/
Revised: 29 January 2019
/
Accepted: 13 February 2019
/
Published: 15 February 2019
(This article belongs to the Special Issue Synthesis and Characterization of Ferroelectrics)
Abstract
:A single crystal with nominal composition Pb(Mg1/3Nb2/3)O3-32PbTiO3 (PMN-32PT) was grown by the Bridgman technique. Crystal orientation was determined using the rotating orientation X-ray diffraction (RO-XRD). Element distribution was measured along different directions using inductively coupled plasma-mass spectrometry (ICP-MS). The effect of the element segregation along axial and radial directions on the electrical properties of the PMN-32PT crystal was investigated. It is indicated that the electrical properties of the samples along the axial direction were strongly dependent on the PT (PbTiO3) content. With the increase of the PT content, the piezoelectric coefficient and remnant polarization were improved. Differently, the electrical properties of the samples along the radial direction were mainly determined by the ratio of the Nb and Mg. The reasons for the element segregation and electrical properties varied with the composition were discussed.
1. Introduction
Relaxor-based ferroelectric single crystals Pb(Mg1/3Nb2/3)O3-PbTiO3 (PMN-PT) have an ultrahigh piezoelectric coefficient (d33 > 2500 pC/N), an electromechanical coupling factor (k33 > 0.95), and a low dielectric loss compared to traditional piezoelectric ceramics [1,2,3,4,5]. Based on these superior properties, PMN-PT single crystals are usually considered promising materials in sensors, ultrasonic transducers, and motors applications [6,7,8,9].
Large sized PMN-PT single crystals are grown mainly using the Bridgman technique [10,11,12]. Based on this technique, researchers have further managed to improve the di/piezoelectric properties of the PMN-PT system through some effective ways [13,14,15,16,17]. Hu et al. [18] verified that the high-temperature poling technique was contributed to the enhanced piezoelectric properties. Recently, it was discovered that the optical properties could be induced by rare-earth ions doping in the PMN-PT system [19,20]. Xi et al. [21] confirmed that the specific absorption at the UV-VIS-NIR band and the strong green and red up-conversion photoluminescence (UC PL) under 980 nm laser excitation were observed in the Er3+- and Er3+/Yb3+-modified Pb(Sc1/2Nb1/2)O3-Pb(Mg1/3Nb2/3)O3-PbTiO3 (PSN-PMN-PT) crystals using the flux method. For the Bridgman technique, it is confirmed that the element segregation exists in the single crystals and the electrical properties of the single crystals are strongly dependent on the compositions [22,23,24]. These results indicate that the element segregation occurred during the growth of the PMN-PT single crystals, and the segregation of PT led to inhomogeneity in electrical properties along the axial direction. Unfortunately, the element segregation along the radial direction and the reasons for the Nb and Mg segregation of the PMN-PT single crystals using the Bridgman technique was rarely reported in the literature.
In this study, the single crystal with nominal compositional PMN-32PT was grown by the Bridgman technique. The element distribution along the axial and radial directions was confirmed by the inductively coupled plasma–mass spectrometry (ICP-MS). The effect of the element segregation along the axial and radial direction on the electrical properties of the PMN-32PT crystals was investigated. The reasons that the element segregation and electrical properties varied with the composition along the axial direction were also discussed.
2. Experimental Procedure
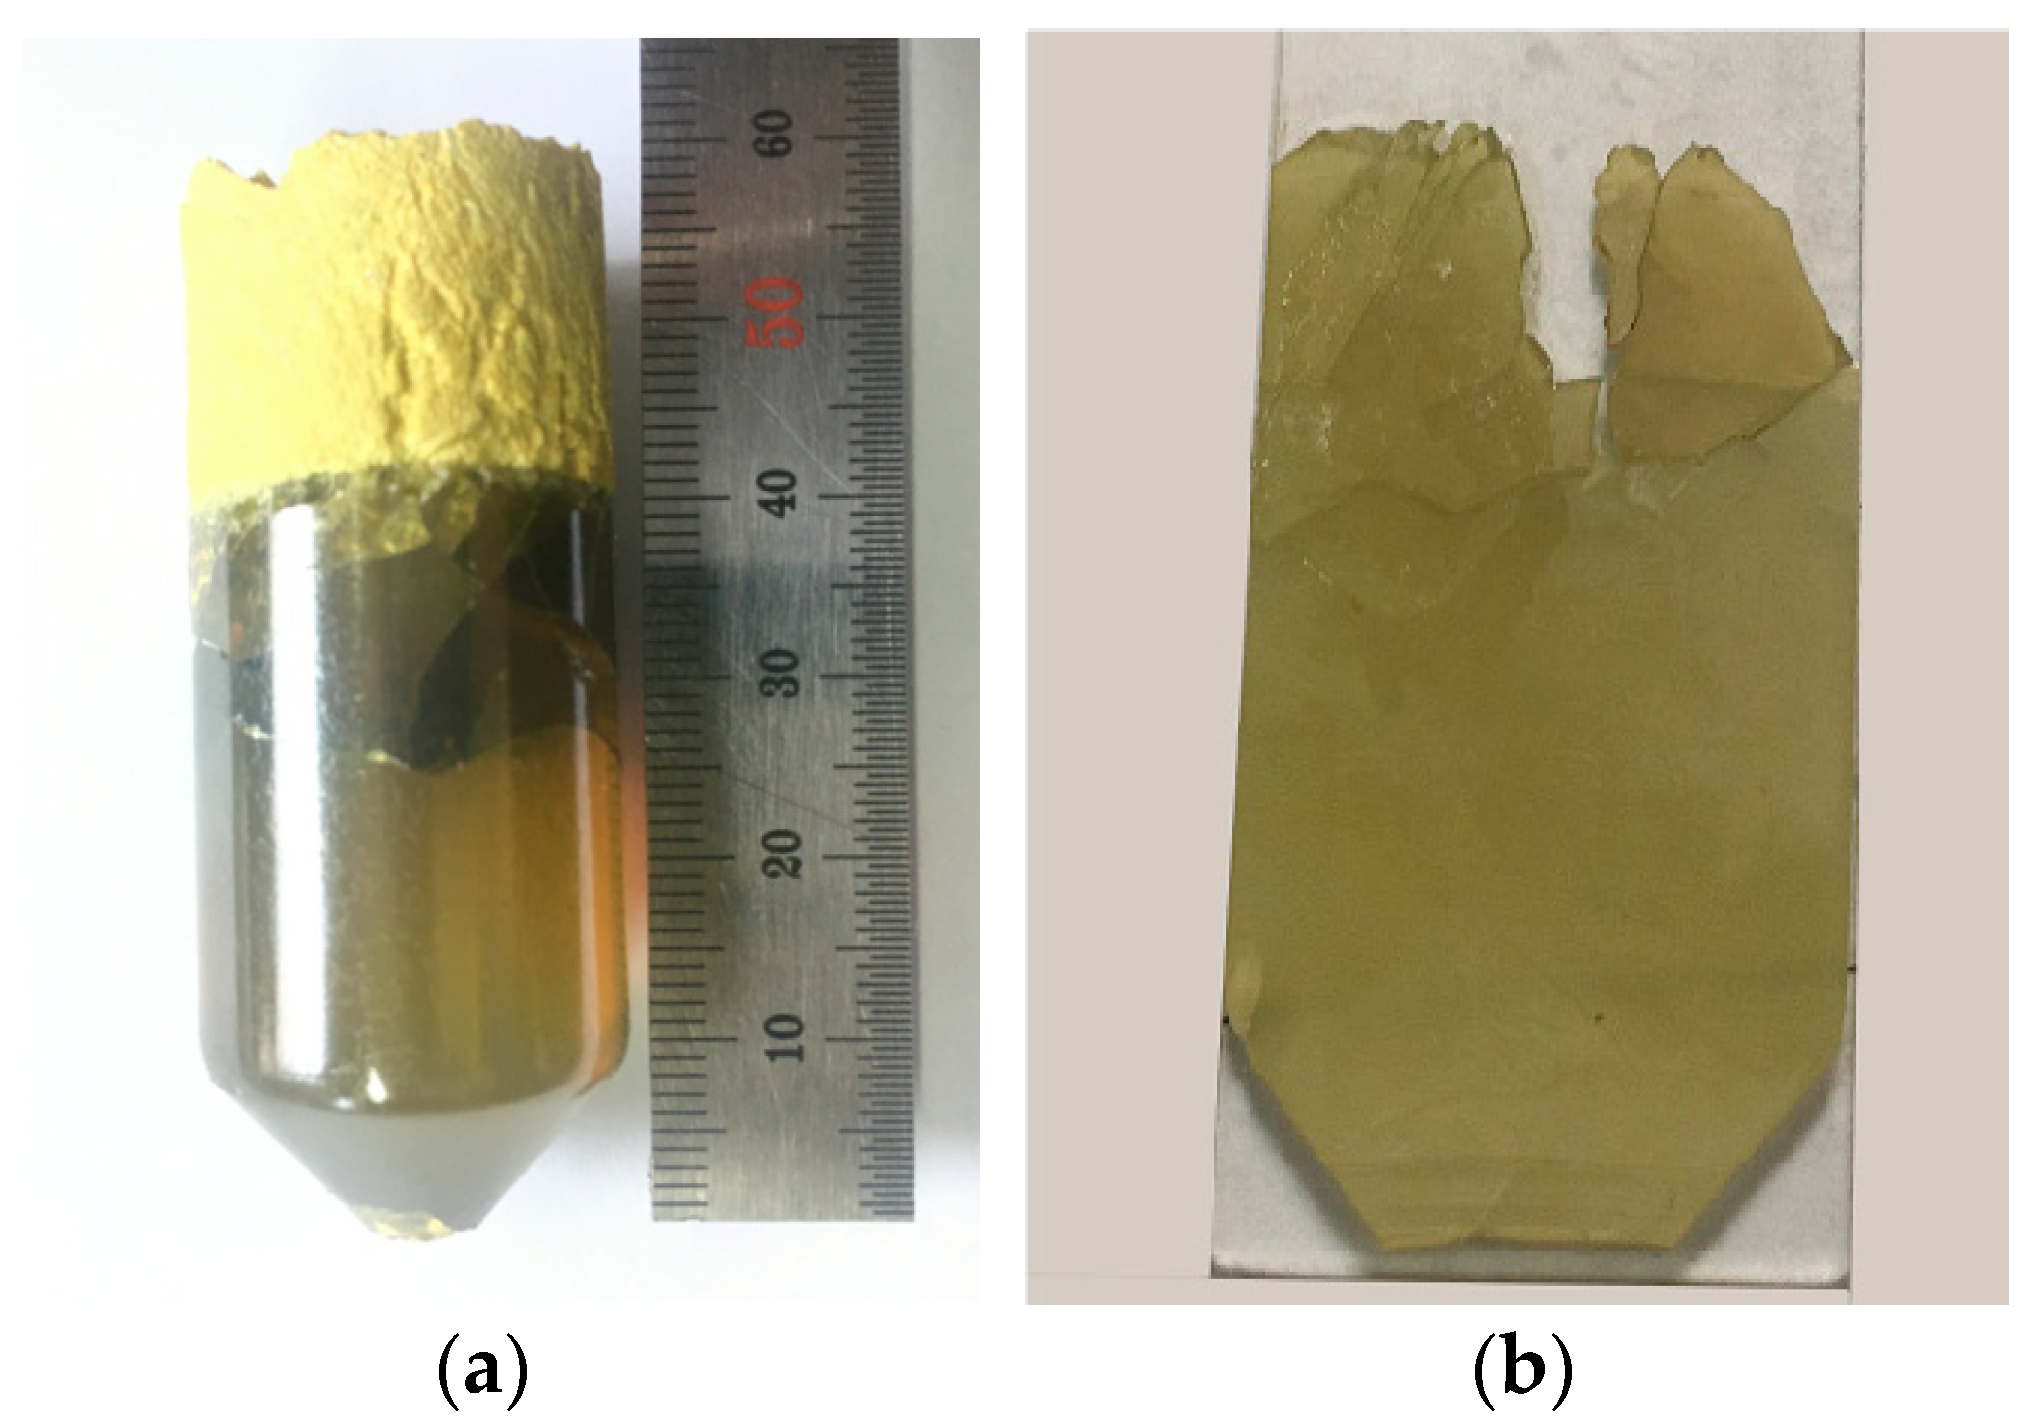
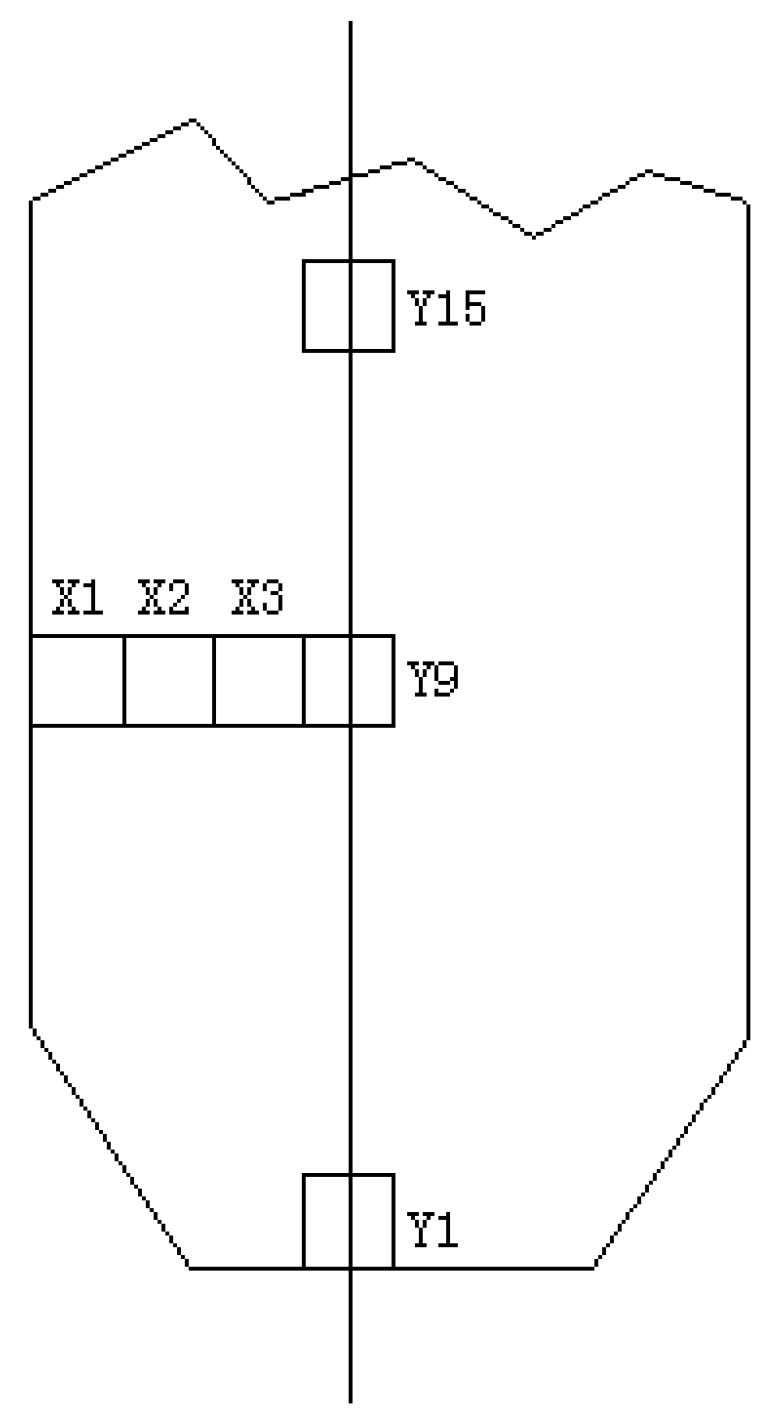
A PMN-32PT single crystal (Ø25 mm) was grown by the Bridgman method (Figure 1a). The crystal was faint yellow with good transparency. Some stress-induced cracks were presented on the top of the crystal. A sheet with a thickness of 0.8 mm was cut from the as-grown crystal boule along the axial direction (Figure 1b), which showed a poor uniformity in color. The sheet was divided along axial and radial directions with a size of 2 × 2 mm. The specimens were named as test points from Y1 to Y15 along the axial direction and test points from X1 to X4 along the radial direction. The Y9 and X4 test points were the same (shown in Figure 2).
The orientation of the single crystal was analyzed using rotating orientation X-ray diffraction (RO-XRD) (D/max-2550, Rigaku Corporation, Tokyo, Japan, 2004). Before the electrical property measurements, the obtained specimens were annealed at 300 °C for 1.5 h to eliminate stress. Silver paste was used to cover the two faces of the crystal sample that were used as electrodes. The dielectric properties were measured using an impedance analyzer (Agilent 4294A, Agilent Technologies Inc., Santa Clara, CA, USA, 2012) at 1 kHz at room temperature. The ferroelectric properties were measured using a ferroelectric analyzer (Radiant Precision PremierⅡ, Radiant Technologies Inc., Albuquerque, NM, USA, 2005) at room temperature. For the piezoelectric constant (d33) test, the specimens were poled at room temperature in silicone oil under an applied electric field of 1280 kV/mm for 15 min. The piezoelectric constant was measured using a quasistatic meter (ZJ-6A, Institute of Acoustics Academic Sinica, Beijing, China, 2005). The element analysis was performed using the ICP-MS (NexION 350D, PerkinElmer, Waltham, MA, USA, 2017) after the samples were dissolved in a mixture of concentrated nitric acid and hydrofluoric acid. In order to calibrate the errors of the quantitative analysis, blank experiments were used before the element analysis.
3. Results and Discussion
3.1. RO-XRD
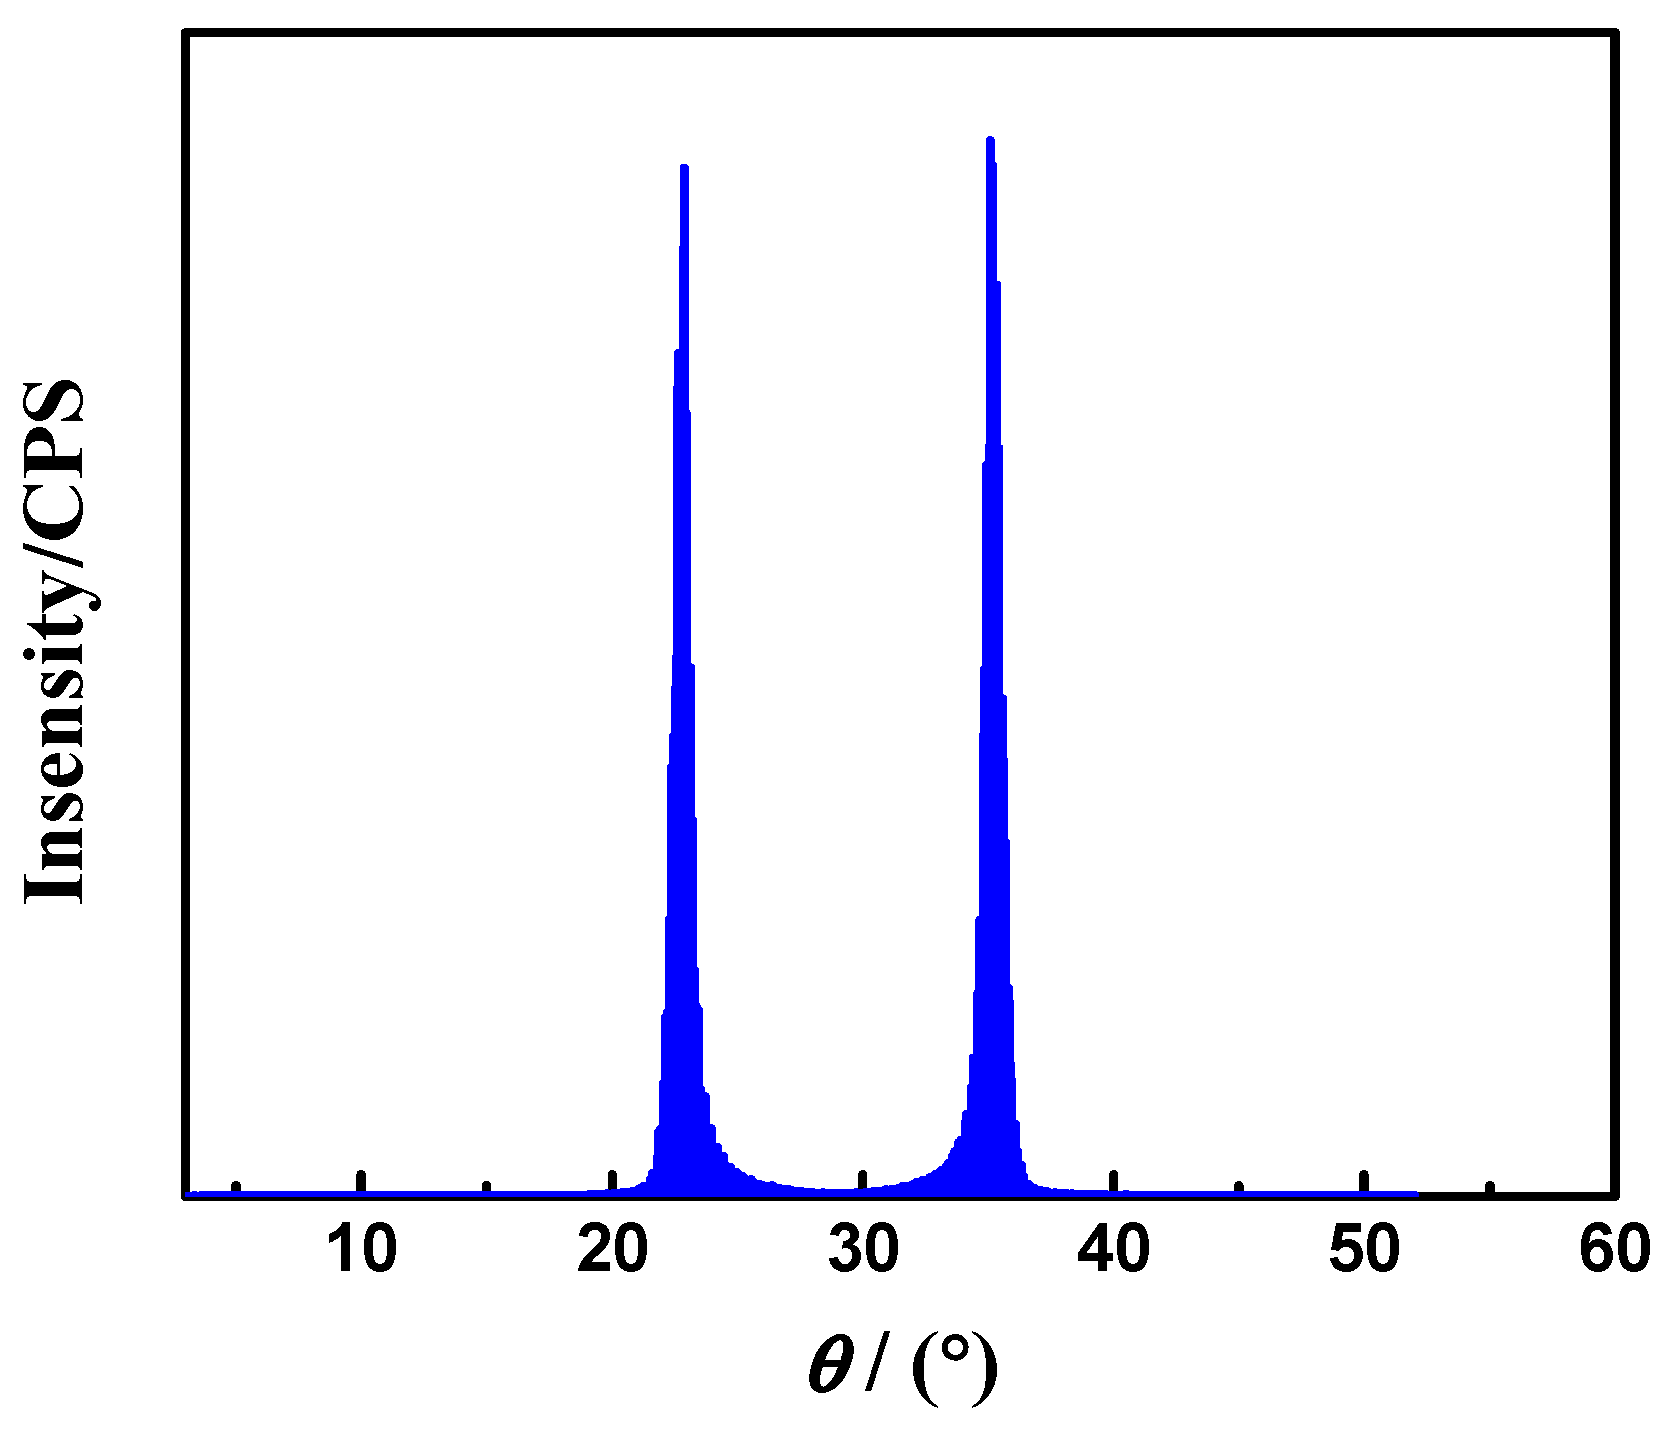
The RO-XRD patterns of the PMN-PT sample are shown in Figure 3. Two strong peaks were observed at 22.88° and 35.09° and there were no other diffraction peaks between them, indicating that the sample is a single crystal. Based on the fixed angle φ between the two crystal planes, the oriented direction of one crystal plane can be determined by the other [25,26]. In this study, the (211), (220) and (222) crystal planes were selected to calculate the orientation of the samples according to the following equation [27,28]:
where θ1 and θ2 are the degrees of the strong diffraction peaks, respectively. The calculated results show the crystal plane perpendicular to the axial direction is (432). Along the axial direction, the crystal plane belongs to {771}.
3.2. Axis Distribution
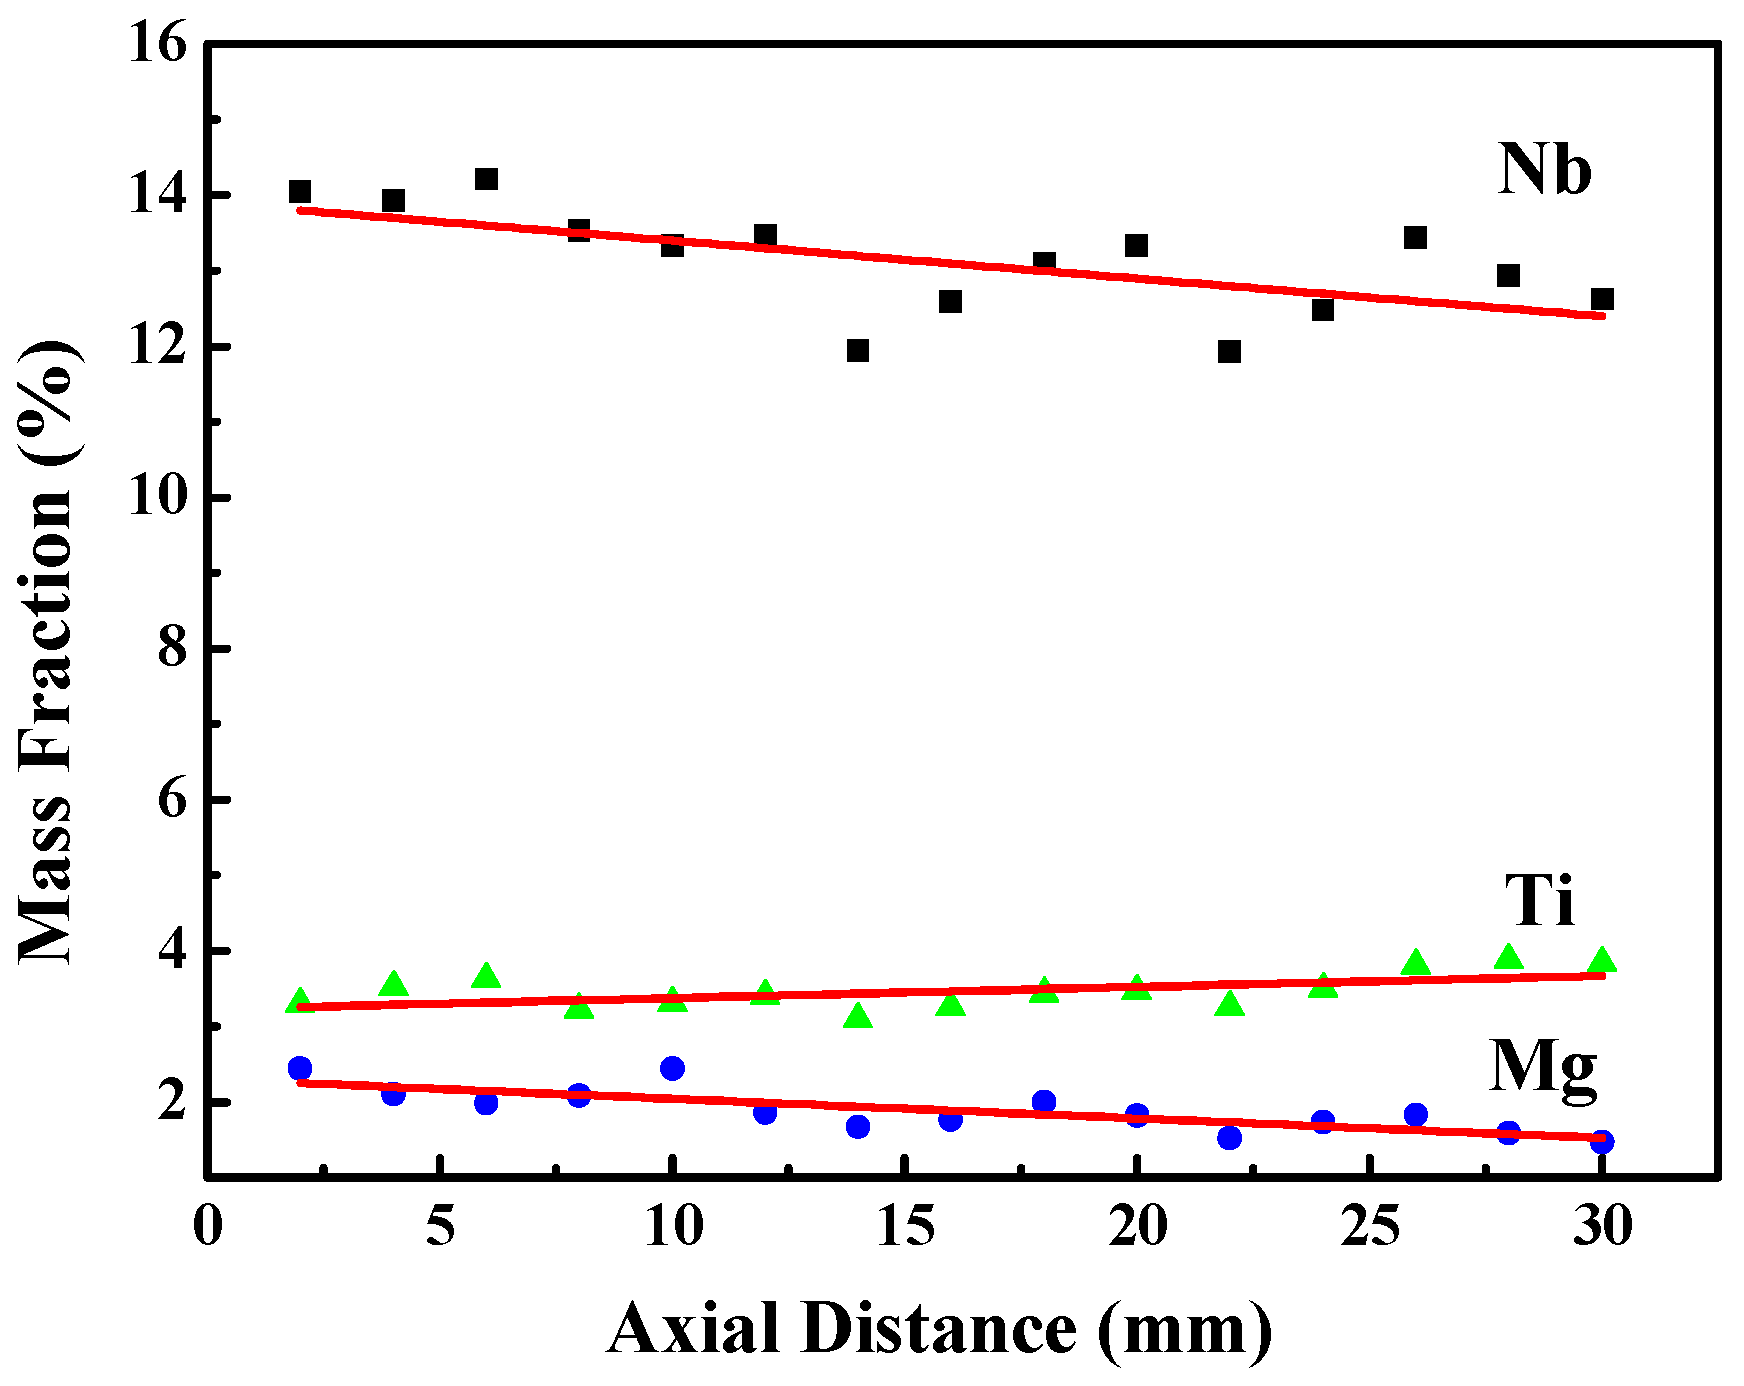
The distribution of elements along the axial direction for the PMN-32PT single crystals is shown in Figure 4. Obviously, the Ti content exhibits an increasing trend along the axial direction from the bottom to the top. On the other hand, the content of the Nb and Mg decreases from the bottom to the top. The variations of the mass fraction of the Nb and Mg are calculated to be about 2.29% and 0.97%, respectively. The segregation during the growth of the PMN-PT single crystals is responsible for the variation of the elements [29].
Generally, the segregation of the element depends on its the effective segregation coefficient k during the crystal growth process, which can be obtained from the following equation [30]:
where CS and C0 are the concentrations of the solid and initial melt, respectively, and f is the fraction of the melt solidified corresponding to CS. Normally, as the effective segregation coefficient is less than 1 (k < 1), the element content displays an increasing tendency along the axial direction from the bottom to the top. As the effective segregation coefficient is more than 1 (k > 1), the element content shows a decreasing tendency from the bottom to the top of the crystal. In this work, the effective segregation coefficients k are 1.20, 1.03 and 0.82 for Mg, Nb and Ti, respectively. The k for Ti is slightly lower than that obtained by Benayad [23] in a PMN-40PT system (k = 0.849) and Zawilski [24] in a PMN-35PT system (k = 0.84), which is attributed to the slower solidification rate of the present work. Table 1 provides the molar percentages of Mg, Nb and Ti along the axial direction of the crystal from the bottom to the top.
The mole fractions of the PMN (Pb(Mg1/3Nb2/3)O3) and PT for different samples calculated from the ICP-MS data are shown in Figure 5. The PMN content decreases along the axial direction from the bottom to the top, while the PT content increases from 21 mol% to 29 mol%, which is consistent with that of the previous reports [22,23,24]. These results can be explained by the phase diagram of PMN-PT and the solidification law of the binary solid solution as follows: the PMN crystallizes firstly from the melt because of the higher freezing point of the PMN, which results in the higher content of the PMN at the bottom and the higher PT content in the liquid.
The distribution of the molar ratio Nb/Mg along the axial direction is shown in Figure 6. It is seen that the molar ratio Nb/Mg exhibits an increasing trend from the bottom to the top. The molar ratio Nb/Mg fluctuates greatly at the initial stage of the crystal growth. During the crystal growth, it approaches to 2 in the middle part, and even >2 at the top boule. Theoretically, there are two Nb5+ near a Mg2+ in the lattice or melt to balance the valence state [31], namely (Mg1/3Nb2/3)4+. However, Nb5+ and Mg2+ in the actual lattice occupancy are not completely subject to theory due to the segregation.
The measured distance dependence of the electrical properties for the specimens along the axial direction is shown in Figure 7. From Figure 7a, we can see the permittivity firstly decreases at the bottom of the crystal and then tends to stabilize at the middle of the crystals. In addition, a sharp rise process for the dielectric constant is observed at the top. The distribution of dielectric loss exhibits a similar tendency, except for the sharp decrease at the top. The sharp variation of the dielectric properties at the top could originate from the presence of cracks. The piezoelectric constant d33 increases gradually from 350 pC/N to 850 pC/N along the axial direction from the bottom to the top, as shown in Figure 7b. The coercive field Ec and remnant polarization Pr verse the measured distance for the PMN-32PT crystals are shown in Figure 7c,d. It is seen that the coercive field at room temperature fluctuates from 2 kV/cm to 3 kV/cm along the axial direction of the crystal. The remnant polarization of the crystal increases gradually except for some fluctuations from the bottom to the top. These results indicate that the segregation affects the electric properties dominantly in the PMN-PT single crystal grown by Bridgman method. In Figure 4 and Figure 7a, it is obvious that the variation tendency of Ti content along the axial direction is opposite to that of the dielectric properties. Differently, the variations of the piezoelectric coefficient and remnant polarization are consistent with that of the PT content, as shown in Figure 5 and Figure 7b,d. It is well known that it is multi-phase coexistence at the MPB composition for PMN-PT, in which the spontaneous polarization orientations increase. Therefore, the switch of domains and the motion of domain walls are easy under the external electric field, which makes it beneficial to obtain the ultrahigh piezoelectric constant and remnant polarization. The PT content increases gradually and approaches the MPB composition which is the reason for the increase of the piezoelectric coefficient and remnant polarization along the axial direction.
3.3. Radial Distribution
The mass fraction of different elements in a PMN-32PT single crystal along the radial direction is calculated and plotted in Figure 8. It is demonstrated that the Nb and Mg content increases by 0.71% 0.54%, respectively. By contrast, the content of Ti is relatively stable and increases only by 0.18%. The segregation of the radial direction is attributed to an uneven growth interface and the convection near growth interface [32,33,34,35], which is different from the segregation of the axial direction caused by the solute redistribution.
The variation of PMN and PT along the radial direction are presented in Figure 9. The mole fraction of PT nearly remains a constant of 24%, which means that PT is insensitive to the component segregation in the radial direction. Figure 10 illustrates the variation of Nb/Mg along the radial direction. The value decreases firstly and then increases slightly.
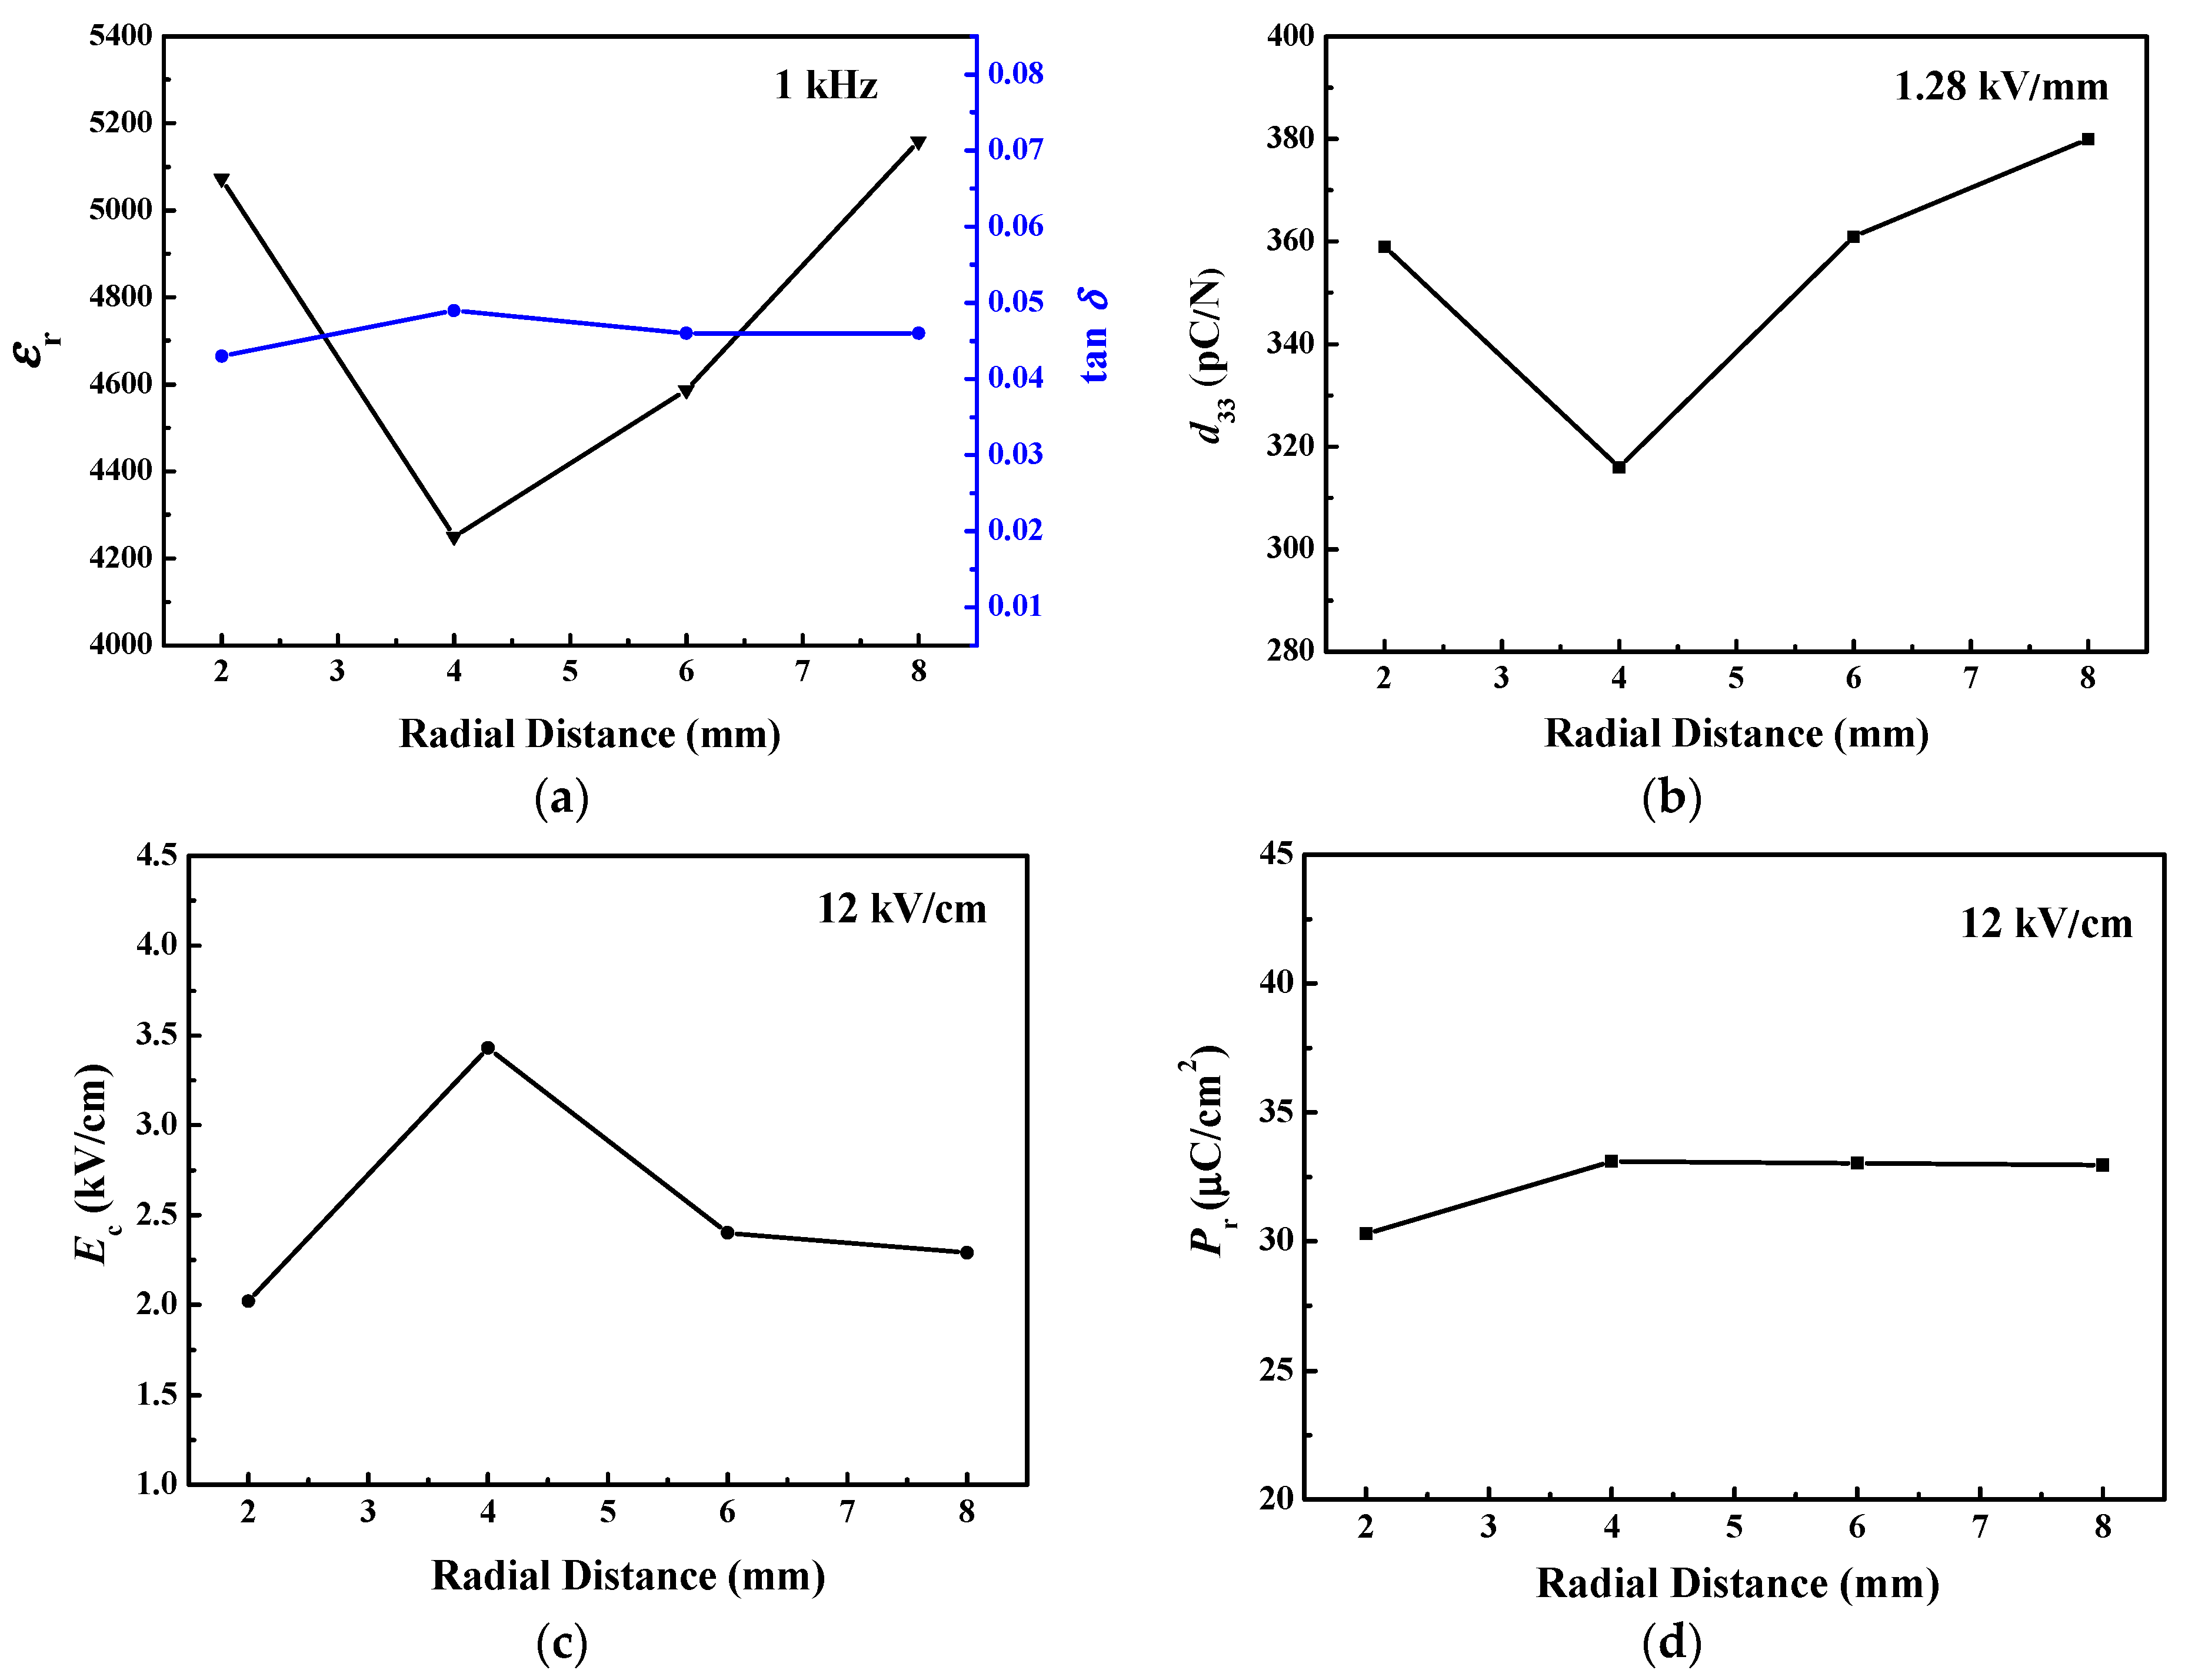
The measured distance dependence of the electrical properties for the specimens along the radial direction is shown in Figure 11. The permittivity and piezoelectric constant decrease firstly and then increase from the sample X1 to X4, which are similar to that of Nb/Mg as shown in Figure 10 and Figure 11a,b. The coercive field increases firstly and then decreases, which varies from the range of 2 kV/cm to 3 kV/cm shown in Figure 11c. The remnant polarization is almost maintained at 30–33 µC/cm2. The relationship among the permittivity, piezoelectric constant and remnant polarization of the radial samples are basically obedient to the formula reported in the literature: d33 = 2ε0εrPrQ11 [13,36]. The dependence of the dielectric constant, piezoelectric constant and coercive field on Nb/Mg can be explained as follows: as the Nb/Mg decreases, the concentration of the oxygen vacancies increases in the lattice, which pinches the domain and restrains the switch of the domain. As a result, the coercive field increases and the dielectric constant and piezoelectric constant decrease; and vice versa.
4. Conclusions
The single crystal with the nominal compositional PMN-32PT was grown using the Bridgman method. The distribution of the elements along the axial direction could be described by the effective segregation coefficient k. The effective segregation coefficients k were 1.20, 1.03 and 0.82 for Mg, Nb and Ti, respectively. The relationship between the composition and electrical properties of the PMN-PT crystals was investigated. It was indicated that the piezoelectric constant and remnant polarization were consistent with the distribution of PT along the axial direction. The electrical properties were attributed to the distribution of the Nb and Mg along the radial direction.
Author Contributions
Writing-review & editing, Z.X.; writing-original draft, S.W.; formal analysis, P.F.; X.L.; investigation, W.L.; data curation, A.H.
Funding
This work was supported by the National Natural Science Foundation of China (Grant No. 51472197), the Key Laboratory of Optoelectronic Materials Chemistry Physics, Chinese Academy of Science (Grant No. 2016DP173016) and and Foundamental Research Foundation of XATU of china (Grant No. XAGDXJJ16020).
Conflicts of Interest
The authors declare no conflict of interest.
References
- Xue, A.X.; Fang, C.; Wang, C.; Jia, Y.M.; Liu, Y.S.; Luo, H.S. Uniaxial stress-induced ferroelectric depolarization in <001>-oriented 0.72Pb(Mg1/3Nb2/3)O3-0.28PbTiO3 single crystal. J. Alloys Compd. 2015, 647, 14–17. [Google Scholar] [CrossRef]
- Li, Z.R.; Xu, Z.; Xi, Z.Z.; Cao, L.H.; Yao, X. Dielectric loss anomalies of 0.68PMN-0.32PT single crystal and ceramics at cryogenic temperature. J. Electroceram. 2008, 21, 279–282. [Google Scholar] [CrossRef]
- Wang, Z.; Zhang, R.; Sun, E.W.; Cao, W.W. Temperature dependence of electric-field-induced domain switching in 0.7Pb(Mg1/3Nb2/3)O3-0.3PbTiO3 single crystal. J. Alloys Compd. 2012, 527, 101–105. [Google Scholar] [CrossRef] [PubMed]
- Sun, E.W.; Cao, W.W. Relaxor-based ferroelectric single crystals: Growth, domain engineering, characterization and applications. Prog. Mater. Sci. 2014, 65, 124–210. [Google Scholar] [CrossRef] [PubMed] [Green Version]
- Li, F.; Zhang, S.; Xu, Z.; Wei, X.Y.; Luo, J.; Shrout, T.R. Composition and phase dependence of the intrinsic and extrinsic piezoelectric activity of domain engineered (1−x)Pb(Mg1/3Nb2/3)O3−xPbTiO3 crystals. J. Appl. Phys. 2010, 108, 074106. [Google Scholar] [CrossRef] [PubMed]
- Guerra, J.D.L.S.; Lente, M.H.; Eiras, J.A. Non-linear dielectric properties in based-PMN relaxor ferroelectrics. J. Eur. Ceram. Soc. 2017, 27, 4033–4036. [Google Scholar] [CrossRef]
- Zhou, Q.F.; Lam, K.H.; Zheng, H.R.; Qiu, W.B.; Shung, K.K. Piezoelectric single crystal ultrasonic transducers for biomedical applications. Prog. Mater. Sci. 2014, 66, 87–111. [Google Scholar] [CrossRef] [Green Version]
- Shkuratov, S.I.; Baird, J.; Antipov, V.G.; Talantsev, E.F.; Chase, J.B.; Hackenberger, W.; Luo, J.; Jo, H.R.; Lynch, C.S. Ultrahigh energy density harvested from domain-engineered relaxor ferroelectric single crystals under high strain rate loading. Sci. Rep. 2017, 7, 46758. [Google Scholar] [CrossRef] [Green Version]
- Guo, M.S.; Dong, S.X.; Ren, B.; Luo, H.S. A double-mode piezoelectric single-crystal ultrasonic micro-actuator. IEEE Trans. Ultrason. Ferroelectr. Freq. Control 2010, 57, 2596–2600. [Google Scholar]
- Xu, G.S.; Luo, H.S.; Wang, P.C.; Xu, H.Q.; Yin, Z.W. Ferroelectric and piezoelectric properties of novel relaxor ferroelectric single crystals PMNT. Chin. Sci. Bull. 2000, 45, 491–495. [Google Scholar] [CrossRef]
- Tian, J.; Han, P.D. Crystal growth and property characterization for PIN-PMN-PT ternary piezoelectric crystals. J. Adv. Dielectr. 2014, 4, 1350027. [Google Scholar] [CrossRef]
- Tian, J.; Han, P.D.; Huang, X.L.; Pan, H.X.; Carroll, J.F.; Payne, D.A. Improved stability for piezoelectric crystals grown in the lead indium niobate-lead magnesium niobate-lead titanate system. Appl. Phys. Lett. 2007, 91, 222903. [Google Scholar] [CrossRef]
- Li, F.; Lin, D.B.; Chen, Z.B.; Cheng, Z.X.; Wang, J.L.; Li, C.C.; Xu, Z.; Huang, Q.W.; Liao, X.Z.; Chen, L.Q.; et al. Ultrahigh piezoelectricity in ferroelectric ceramics by design. Nature. Mater. 2018, 17, 349–354. [Google Scholar] [CrossRef] [PubMed]
- Xu, J.L.; Deng, H.; Zeng, Z.; Zhang, Z.; Zhao, K.Y.; Chen, J.W.; Nakamori, N.M.; Wang, F.F.; Ma, J.P.; Li, X.B.; et al. Piezoelectric performance enhancement of Pb(Mg1/3Nb2/3)O3-0.25PbTiO3 crystals by alternating current polarization for ultrasonic transducer. Appl. Phys. Lett. 2018, 112, 182901. [Google Scholar] [CrossRef]
- Wang, D.; Yuan, G.L.; Luo, H.S.; Li, J.F.; Viehland, D.; Wang, Y.J. Structural origin of room temperature poling enhanced piezoelectricity in modified Pb(Mg1/3Nb2/3)O3-30%PbTiO3 crystals. J. Am. Ceram. Soc. 2017, 100, 4938–4944. [Google Scholar] [CrossRef]
- Jiao, S.; Tang, Y.X.; Zhao, X.Y.; Wang, T.; Duan, Z.H.; Wang, F.F.; Sun, D.Z.; Luo, H.S.; Shi, W.Z. Growth and electrical properties of epitaxial 0.7Pb(Mg1/3Nb2/3)O3-0.3PbTiO3 thin film by pulsed laser deposition. J. Mater. Sci. 2018, 29, 6779–6784. [Google Scholar] [CrossRef]
- Li, F.; Zhang, S.J.; Yang, T.N.; Xu, Z.; Zhang, N.; Liu, G.; Wang, J.L.; Wang, J.L.; Cheng, Z.X.; Ye, Z.G.; et al. The origin of ultrahigh piezoelectricity in relaxor-ferroelectric solid solution crystals. Nat. Common. 2016, 7, 13807. [Google Scholar] [CrossRef] [Green Version]
- Hu, W.H.; Xi, Z.Z.; Fang, P.Y.; Long, W.; Li, X.J.; Bu, Q.Q. A novel poling technique to obtain excellent piezoelectric properties of Pb(Mg1/3Nb2/3)O3-0.32PbTiO3 single crystals. J. Mater. Sci. Mater. Electron. 2015, 26, 3282–3286. [Google Scholar] [CrossRef]
- He, A.G.; Xi, Z.Z.; Li, X.J.; Long, W.; Fang, P.Y.; Zhao, J.; Yu, H.N.; Kong, Y.L. Optical properties of Ho3+- and Ho3+/Yb3+-modified PSN-PMN-PT crystals. Mater. Lett. 2018, 219, 64–67. [Google Scholar] [CrossRef]
- Long, W.; Chu, X.; Xi, Z.Z.; Fang, P.Y.; Li, X.J.; Cao, W.W. Growth and property enhancement of Er3+-doped 0.68Pb(Mg1/3Nb2/3)O3-0.32PbTiO3 single crystal. J. Rare. Earth. 2018, 36, 832–837. [Google Scholar] [CrossRef]
- Xi, Z.Z.; He, A.G.; Fang, P.Y.; Li, X.J.; Long, W. Electric and optical properties of Er3+- and Er3+/Yb3+-modified PSN-PMN-PT crystals. J. Alloys Compd. 2017, 722, 375–380. [Google Scholar] [CrossRef]
- Luo, H.S.; Xu, G.S.; Xu, H.Q.; Wang, P.C.; Yin, Z.W. Compositional homogeneity and electrical preperties of lead magnesium niobate titanate single crystals grown by a Modified Bridgman technique. J. Appl. Phys. 2000, 39, 5581–5585. [Google Scholar] [CrossRef]
- Benayad, A.; Sebald, G.; Lebrun, L.; Guiffard, B.; Pruvost, S.; Guyomar, D.; Beylat, L. Segregation study and segregation modeling of Ti in Pb[(Mg1/3Nb2/3)0.60Ti0.40]O3 single crystal grown by Bridgman method. Mater. Res. Bull. 2006, 41, 1069–1076. [Google Scholar] [CrossRef]
- Zawilski, K.T.; Custodio, M.C.C.; Demattei, R.C.; Lee, S.G.; Monteiro, R.G.; Odagawa, H.; Feigelson, R.S. Segregation during the vertical Bridgman growth of lead magnesium niobate-lead titanate single crystals. J. Cryst. Growth 2003, 258, 353–367. [Google Scholar] [CrossRef]
- Guo, Z.Q.; Fu, T.; Fu, H.Z. Crystal Orientation Measured by XRD and Annotation of the Butterfly Diagram. Mater. Charact. 2000, 44, 431–434. [Google Scholar] [CrossRef]
- Guo, Z.Q.; Jin, L.; Li, F.; Bai, Y. Applications of the rotating orientation XRD method to oriented materials. J. Appl. Phys. D 2009, 42, 012001. [Google Scholar] [CrossRef]
- Guo, Z.Q.; Fu, T.; Wang, N.; Fu, H.Z. A sample XRD method for determining crystal orientation and its distribution. J. Inorg. Mater. 2002, 17, 460–464. [Google Scholar]
- Guo, Z.Q.; Li, F.; Xu, Z. Application of new equipment to determine the orientation of single crystal by XRD. Lab. Sci. 2011, 14, 92–96. [Google Scholar]
- Zhang, Y.Y.; Li, X.B.; Liu, D.A.; Zhang, Q.H.; Wang, W.; Ren, B.; Lin, D.; Zhao, X.Y.; Luo, H.S. The compositional segregation, phase structure and properties of Pb(In1/2Nb1/2)O3-Pb(Mg1/3Nb2/3)O3-PbTiO3 single crystal. J. Cryst. Growth 2011, 318, 890–894. [Google Scholar] [CrossRef]
- Zhang, S.J.; Li, F. High performance ferroelectric relaxor-PbTiO3 single crystals: Status and perspective. J. Appl. Phys. 2012, 111, 031301. [Google Scholar] [CrossRef]
- Song, K.X.; Li, Z.R.; Guo, H.S.; Xu, Z.; Fan, S.J. Compositional segregation and electrical properties characterization of [001]-and [011]-oriented co-growth Pb(In1/2Nb1/2)O3-Pb(Mg1/3Nb2/3)O3-PbTiO3 single crystal. J. Appl. Phys. 2018, 123, 154107. [Google Scholar] [CrossRef]
- Ganaoui, M.E.; Bontoux, P. Gravity effects on solidification: The case of an unsteady melt affecting the growth interface. Adv. Space Res. 1999, 24, 1423–1426. [Google Scholar] [CrossRef]
- Volkov, P.K.; Zakharov, B.G.; Serebryakov, Y.A. Numerical and experimental investigations of convection and heat/mass transfer effect in melts on inhomogeneity formation during Ge crystal growth by the Bridgman method. J. Cryst. Growth 1999, 204, 475–486. [Google Scholar] [CrossRef]
- Yang, C.; Xu, Q.Y.; Liu, B.C. Study of dendrite growth with natural convection in superalloy directional solidification via a multiphase-field-lattice Boltzmann model. Comp. Mater. Sci. 2019, 158, 130–139. [Google Scholar] [CrossRef]
- Antar, B.N. Convective instabilities in the melt for solidifying mercury cadmium telluride. J. Cryst. Growth 1991, 113, 92–102. [Google Scholar] [CrossRef]
- Lines, M.E.; Glass, A.M. Principles and Applications of Ferroelectrics and Related Materials; Oxford Univ. Press: Oxford, UK, 1977. [Google Scholar]
Figure 1.
The as-grown PMN-32PT single crystal and its axial section: (a) the as-grown PMN-32PT single crystal; (b) the axial section along the length of the crystal.
Figure 1.
The as-grown PMN-32PT single crystal and its axial section: (a) the as-grown PMN-32PT single crystal; (b) the axial section along the length of the crystal.

Figure 2.
A sketch of specimen cutting.

Figure 3.
The RO-XRD pattern with 2θ = 56° of the PMN-32PT crystal.

Figure 4.
The composition distribution along the axis of the PMN-32PT: points represent the experimental data and solid lines represent the fitting.
Figure 4.
The composition distribution along the axis of the PMN-32PT: points represent the experimental data and solid lines represent the fitting.

Figure 5.
The distribution of the PMN and PT molar fractions along the axial direction: points represent the experimental data and solid lines represent the fitting.
Figure 5.
The distribution of the PMN and PT molar fractions along the axial direction: points represent the experimental data and solid lines represent the fitting.

Figure 6.
The molar ratio of Nb and Mg along the axial direction: points represent the experimental data and dashed lines represent the fitting.
Figure 6.
The molar ratio of Nb and Mg along the axial direction: points represent the experimental data and dashed lines represent the fitting.

Figure 7.
The variation of the electric properties along the axial direction: (a) the variation of the permittivity ε and loss tanδ at 1 kHz; (b) the variation of the piezoelectric constant d33 poled under 1.28 kV/mm; (c) the variation of the coercive field Ec; (d) the variation of the remnant polarization Pr.

Figure 8.
The composition distribution along the radial direction of PMN-32PT: points represent experimental data and the solid lines represent the fitting.
Figure 8.
The composition distribution along the radial direction of PMN-32PT: points represent experimental data and the solid lines represent the fitting.

Figure 9.
The distribution of PMN and the PT molar fraction along the radial direction.

Figure 10.
The distribution of the molar ratio of Nb and Mg along the radial direction.

Figure 11.
The variation of the electric properties along the radial direction: (a) the variation of permittivity ε and loss tanδ at 1 kHz; (b) the variation of the piezoelectric constant d33 poled under 1.28 kV/mm; (c) the variation of the coercive field Ec; (d) the variation of the remnant polarization Pr.


Table 1.
The variation of composition from the bottom to the top.
| Distance(mm) | Mg (mol%) | Nb (mol%) | Ti (mol%) |
|---|---|---|---|
| 0–2 | 31.40 ± 0.16 | 47.11 ± 0.22 | 21.49 ± 0.38 |
| 2–4 | 28.31 ± 0.28 | 48.12 ± 0.58 | 23.57 ± 0.76 |
| 4–6 | 26.02 ± 0.14 | 49.44 ± 0.28 | 24.54 ± 0.42 |
| 6–8 | 28.69 ± 0.01 | 48.77 ± 0.04 | 22.55 ± 0.06 |
| 8–10 | 32.52 ± 0.24 | 45.53 ± 0.34 | 21.95 ± 0.58 |
| 10–12 | 26.09 ± 0.10 | 49.58 ± 0.19 | 24.32 ± 0.29 |
| 12–14 | 25.91 ± 0.03 | 49.23 ± 0.06 | 24.85 ± 0.09 |
| 14–16 | 25.96 ± 0.26 | 49.34 ± 0.49 | 24.69 ± 0.75 |
| 16–18 | 28.03 ± 0.25 | 47.65 ± 0.44 | 24.32 ± 0.69 |
| 18–20 | 25.72 ± 0.19 | 48.86 ± 0.36 | 25.40 ± 0.55 |
| 20–22 | 23.76 ± 0.21 | 49.89 ± 0.45 | 26.35 ± 0.66 |
| 22–24 | 25.42 ± 0.01 | 48.29 ± 0.02 | 26.29 ± 0.03 |
| 24–26 | 25.35 ± 0.19 | 48.17 ± 0.36 | 26.47 ± 0.55 |
| 26–28 | 23.13 ± 0.14 | 48.56 ± 0.28 | 28.31 ± 0.42 |
| 28–30 | 21.47 ± 0.23 | 49.37 ± 0.53 | 29.16 ± 0.78 |
| Stoichiometry | 22.67 | 45.33 | 32.00 |
© 2019 by the authors. Licensee MDPI, Basel, Switzerland. This article is an open access article distributed under the terms and conditions of the Creative Commons Attribution (CC BY) license (http://creativecommons.org/licenses/by/4.0/).
Share and Cite
MDPI and ACS Style
Wang, S.; Xi, Z.; Fang, P.; Li, X.; Long, W.; He, A. Element Segregation and Electrical Properties of PMN-32PT Grown Using the Bridgman Method. Crystals 2019, 9, 98. https://0-doi-org.brum.beds.ac.uk/10.3390/cryst9020098
AMA Style
Wang S, Xi Z, Fang P, Li X, Long W, He A. Element Segregation and Electrical Properties of PMN-32PT Grown Using the Bridgman Method. Crystals. 2019; 9(2):98. https://0-doi-org.brum.beds.ac.uk/10.3390/cryst9020098
Chicago/Turabian StyleWang, Sijia, Zengzhe Xi, Pinyang Fang, Xiaojuan Li, Wei Long, and Aiguo He. 2019. "Element Segregation and Electrical Properties of PMN-32PT Grown Using the Bridgman Method" Crystals 9, no. 2: 98. https://0-doi-org.brum.beds.ac.uk/10.3390/cryst9020098
Note that from the first issue of 2016, this journal uses article numbers instead of page numbers. See further details here.