2. Simulation Method
The MD simulations were carried out by using a hybrid Fe-C interatomic potential, which is a combination of three interatomic potentials and has been used previously in the literature to understand the effect of C on the kinetics of fcc-to-bcc phase transformation [
5]. Fe-Fe interaction is described by an embedded atom method (EAM) potential created by Meyer-Entel [
6]. This potential describes both the bcc-to-fcc and fcc-to-bcc transformations and has been used in several studies to understand the martensitic transformations [
1,
5]. This potential qualitatively describes the nature of the stacking fault energy (SFE) of the fcc phase. The SFE magnitude is
mJ/m
, which matches qualitatively to first principles results [
7].
The fcc-to-bcc transition temperature of Meyer-Entel potential is 550±50 K, which is less than the experimental value [
3,
8]. This is the inherent limitation of the Meyer-Entel potential used in this work. The other Fe potentials available in the literature do not show the bcc-to-fcc and fcc-to-bcc transformations [
8] and we have to rely on this potential to study fcc-to-bcc transformation. In addition, the focus of this work is on the planar defects as well. Therefore it is important that this potential satisfactorily describes the nature of the SFE as negative, which indicates the spontaneous formation and the natural stability of planar defects in fcc phase using this potential [
1].
The Fe-C interaction is described by a pair potential [
9] which reproduces the migration energy of C in Fe. The other EAM potentials for Fe-C only describe the bcc phase accurately and do not have a stable fcc phase at higher temperature, and therefore are not considered in the present work [
10,
11,
12,
13]. The C–C interaction is described by the Tersoff potential [
14], which has been converted to EAM format [
10]. The hybrid potential is a combination of the three potentials discussed: Fe-Fe Meyer-Entel EAM potential, Fe-C pair potential, and C-C Tersoff potential. Sak-Saracino et al. [
3] used this hybrid potential to calculate and analyze free energy of Fe-C alloys, dissolution energy of C interstitial at octahedral sites, migration energy of C interstitial between octahedral sites, binding energy of a C interstitial on an octahedral site to a Fe vacancy, and the tetragonal distortion of martensite phase. They concluded that this potential satisfactorily describes the properties of isolated C interstitials in both bcc and fcc phases. In addition, they concluded that the C-C Tersoff potential cutoff is only 2.1 Å and therefore C-C interaction has virtually no influence on the results, because C atoms are not close enough to interact directly. We also used the same initial settings to create the simulation configurations in the present work. This ensured that there is no short range C-C interaction in the simulation system. In addition, a recent MD work on the elastic properties of
-Fe-C alloys using several different potentials concludes that the Fe-C potential used in this work satisfactorily describes the elastic properties in comparison with the experiments and different potentials as well [
15].
The EAM type potential used in this work does not consider magnetism explicitly. However, it is fitted to the ab initio data to incorporate the effects of magnetism, implying a stable bcc phase at room temperature. The purpose of this paper is to semi-quantitatively understand the effects of C on martensitic transformation in the presence of planar defect configurations, and therefore magnetic effects are not explicitly considered here.
Single crystal supercells of pure Fe with fcc crystal symmetry at 1600 K were used as starting point for the Fe-C simulations. These pure Fe supercells were generated from bcc phase at 50 K with 15 × 15 × 15 unit cells in each direction after heating to 1600 K at 1 K/ps heating rate. The heating transforms bcc phase to fcc phase with SF and TB. These planar defects are formed within the fcc matrix of the pure Fe simulation system to relieve high internal stresses which would be generated in a perfect single crystal fcc phase. The negative magnitude of the SFE, as described previously, indicates the spontaneous formation of SF and TB in the fcc phase. These defects are also observed in the experimental characterization of Fe alloys [
16].
Three arrangements or configurations of these defects are observed in the fcc phase as:
- (i)
TB which are parallel to each other,
- (ii)
SF which intersect each other, and
- (iii)
TB and SF which intersect each other.
MD simulations were carried out for two C concentrations, 0.25 at. %C and 0.5 at. %C. C atoms were randomly distributed at 1600 K in fcc phase at octahedral positions and equilibrated for 100 ps to reduce the internal stresses to less than ±10 MPa. We simulated five different C distributions for each kind of extended defects. This makes 15 different C distributions for a particular C concentration. The C atoms were added after annealing pure Fe crystal with fcc structure at 1600 K with a particular defect configuration. These are the starting simulation systems for cooling to study the martensitic transformation mechanisms. This enabled us to understand the effect of C addition by comparing simulation systems with exactly same defect configurations in pure Fe and Fe-C compositions. The formation of extended defects depends on the C concentration. However, if we start with bcc phase of Fe-C alloys and then heat them up to 1600 K, the defect configurations were not exactly the same as pure Fe because of C addition. In such systems it is not possible to uniquely identify the effect of C atoms. Therefore the Fe-C alloys were simulated by annealing pure Fe at 1600 K and then adding the C atoms in the fcc phase at the same temperature to achieve the desired C concentration.
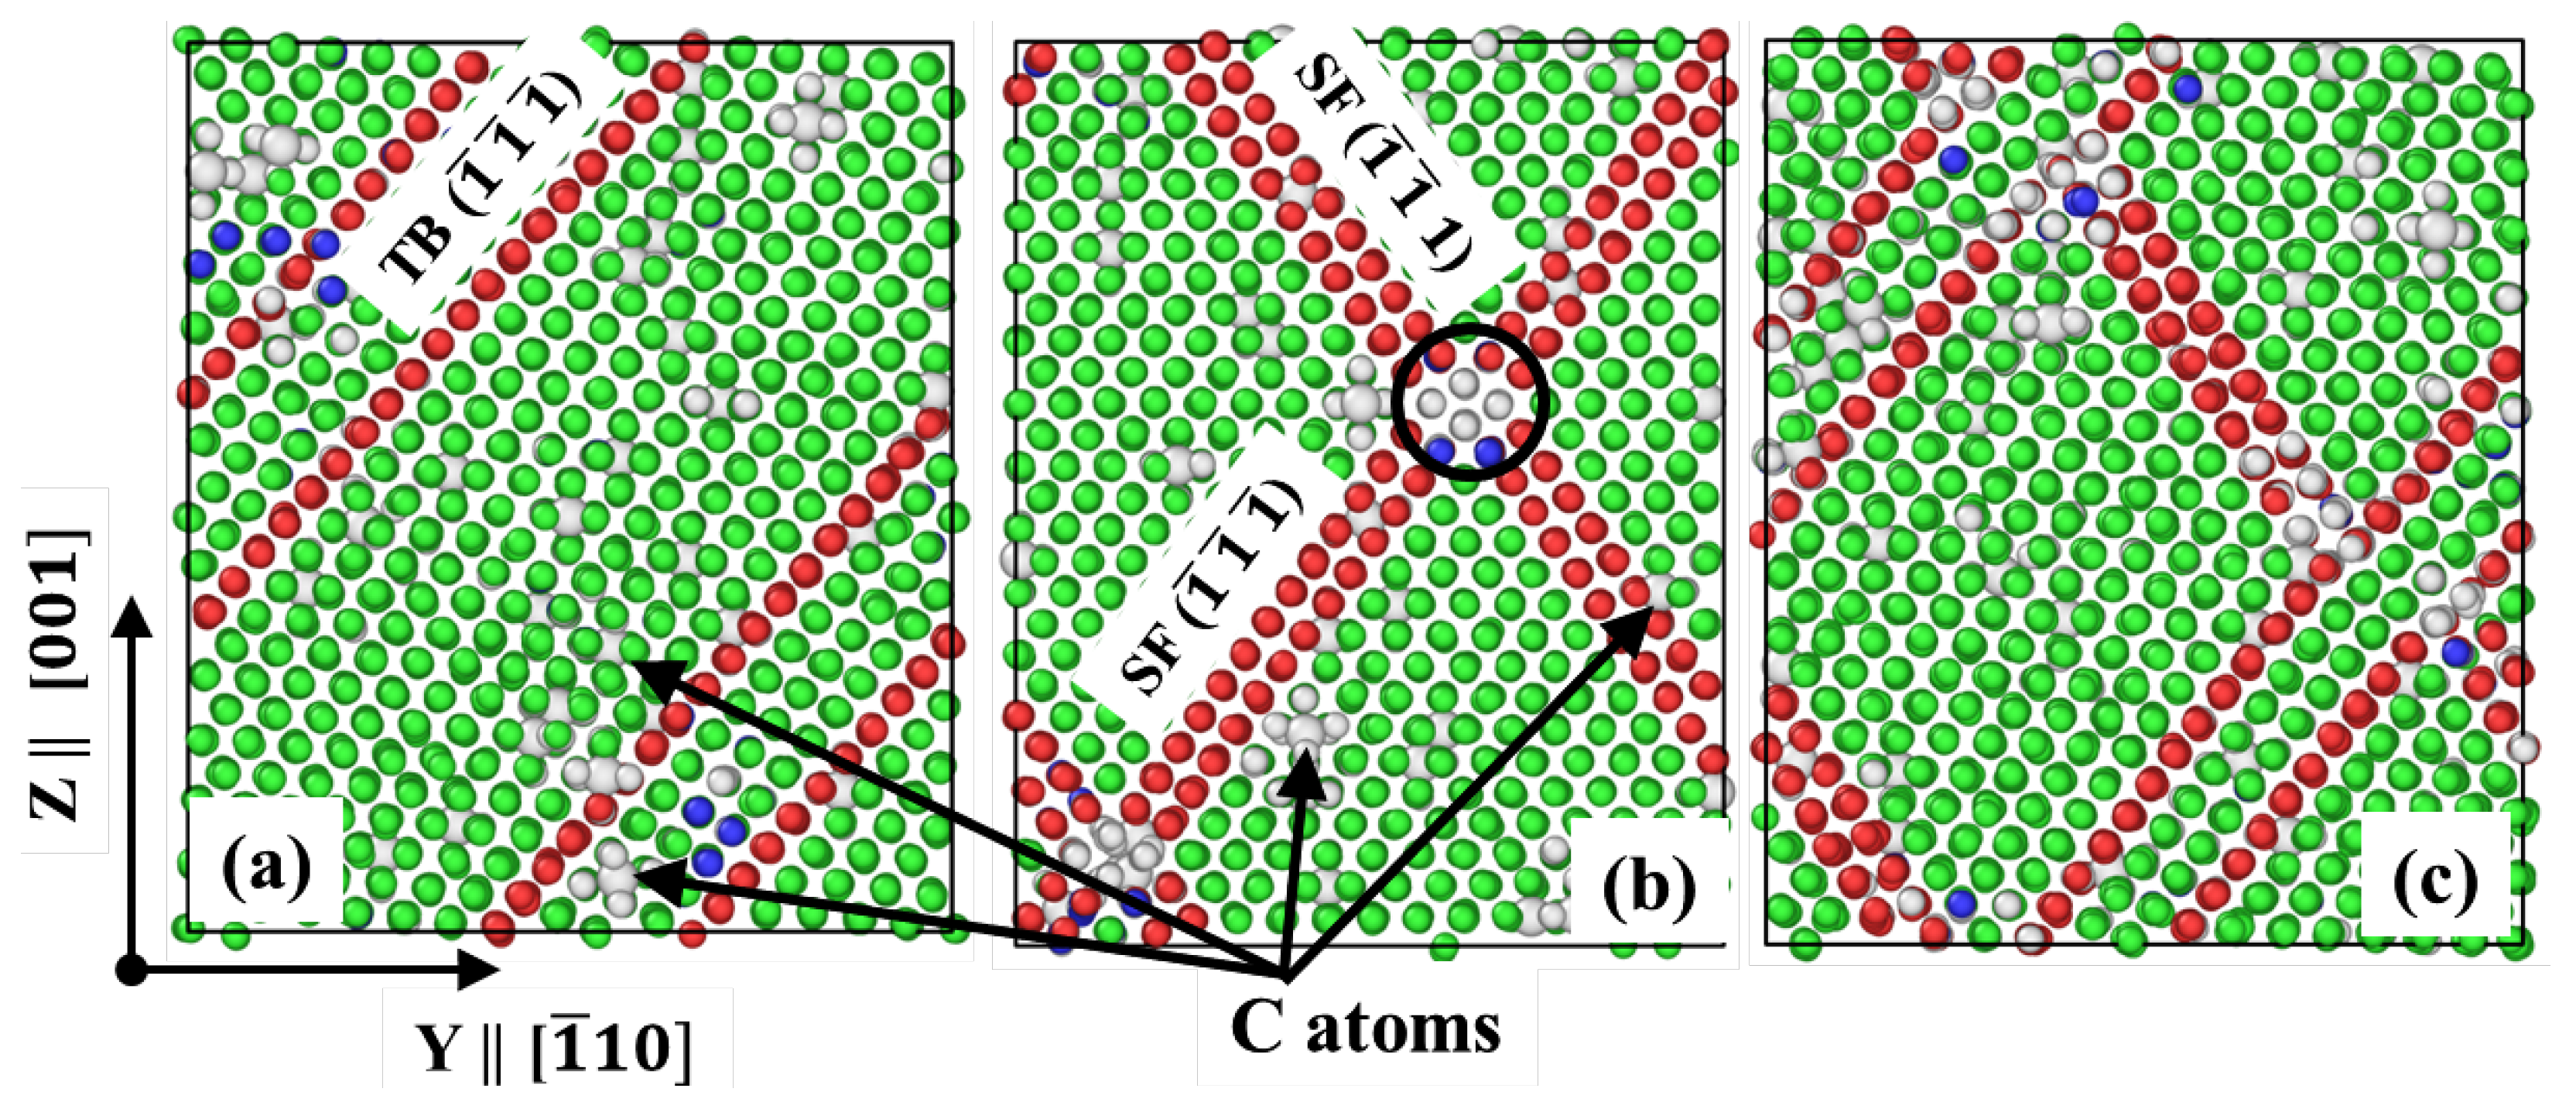
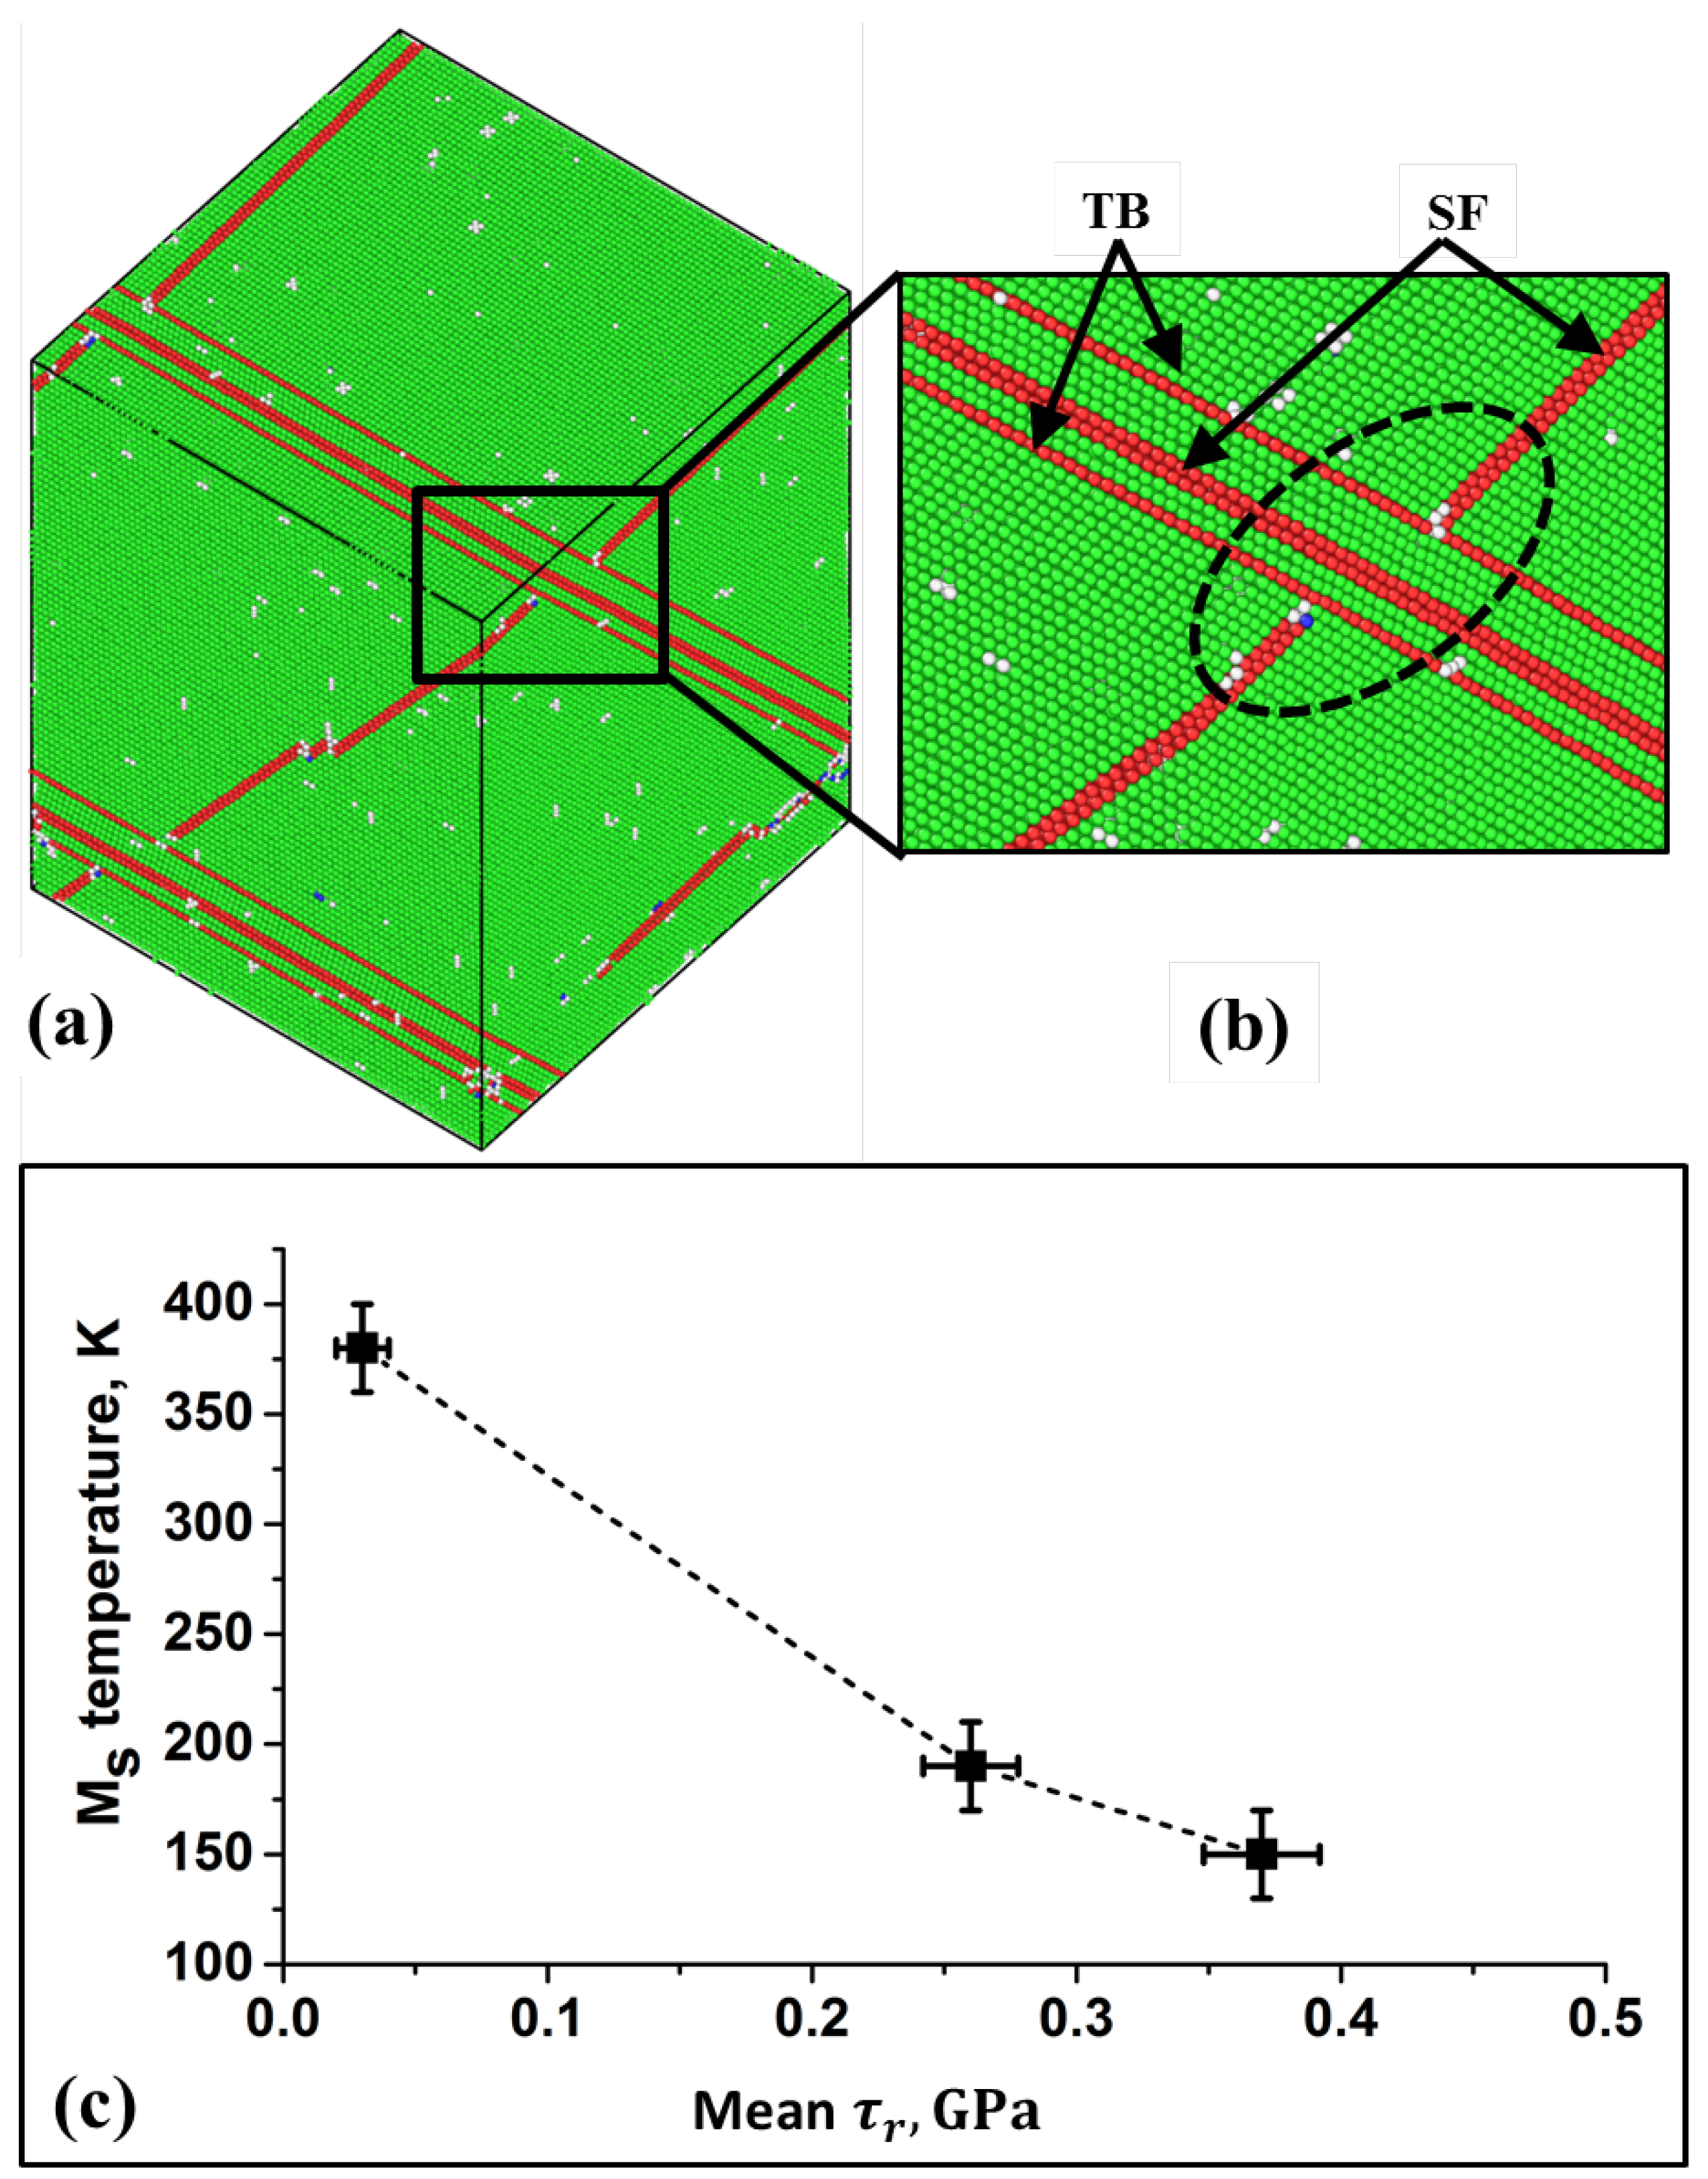
The three defects configurations in the fcc phase are shown for Fe-0.5 at. % C composition in
Figure 1.
Figure 1a shows the pre-existing TB (single layer of hcp atoms) which are parallel to each other within the fcc phase.
Figure 1b shows the SF which intersect each other on different
planes. The SF are identified as two layers of atoms in hcp structure by adaptive-common neighbour analysis method [
17]. The third defect configuration, i.e., fcc phase with intersecting TB and SF, is shown in
Figure 1c. The results of Fe-C alloys are then compared with pure Fe [
1] to analyze the effect of C addition. Periodic boundary conditions were used along all directions. MD timestep of 1 fs was used during simulation runs. NPT ensemble was used to control the temperature and pressure of the simulation system. During heating and cooling runs the shape and volume of the simulation box was allowed to change independently along three directions so as to keep the stress tensor close to zero. After equilibration, the simulation system was cooled from 1600 K to 50 K at 1 K/ps to analyze the temperature-induced fcc-to-bcc phase transformation. The heating and cooling rate of 1 K/ps was chosen based on previous atomistic study of Fe-C by Wang et al. [
2], which showed that it is a reasonable rate for the atomistic simulations and using a higher rate of 5 K/ps will suppress the martensitic transformation. LAMMPS MD code was used for the simulations [
18]. The crystal structures were characterized using the adaptive-common neighbour analysis (a-CNA) method in OVITO software [
17].
The simulations were also carried out for bigger simulation system sizes as well. For e.g., simulation systems with 70 × 70 × 70 and 80 × 80 × 80 unit cells along each direction with 686,000 and 1,024,000 atoms, respectively, were simulated. However, many defect configurations of planar defects were present in these larger simulation system sizes. This makes it impossible to understand the effect of one particular defect configuration, for e.g., the effect of parallel TB in fcc phase without the presence of intersecting SF. To make sure that the atomistic effects of C addition are same in smaller and bigger simulation system sizes, the results and analysis of bigger simulation systems are included in the discussion section. In these bigger simulation systems, C atoms were added in bcc crystal structure at 50 K, then heated to 1600 K, which is followed by cooling to 50 K to induce fcc-to-bcc transformation. C atoms were added in bcc phase itself during heating unlike smaller simulation system sizes where C atoms were added at 1600 K. The addition of C in bcc phase also affects the formation of planar defects in fcc phase. Similar to smaller system sizes, during heating and cooling runs the shape and volume of the simulation box was allowed to change independently along three directions. Five random distributions of C were simulated for each C concentration.
3. Results
The atomistic mechanisms governing fcc-to-bcc transformation in Fe-C alloys in the presence of pre-existing defects are the same as in pure Fe [
1]. We refer the reader to Karewar et al. [
1] for detailed description and visualizations of these mechanisms. The effects of different defect structures and configurations are summarized as: (i) The fcc phase with parallel TB changes the crystal structure to bcc phase by Nishiyama-Wasserman mechanism [
19]. The TB in the fcc phase aid the transformation by easing the shear on
slip system; (ii) the fcc phase with intersecting SF changes to bcc by a combination of two mechanisms—first, the atoms of SF change from hcp to bcc by Burgers path [
19], and then the rest of the fcc phase follows the Burgers-Bogers-Olson-Cohen [
20] model to change the crystal structure to bcc. The intersecting SF form a sessile Lomer-Cottrel (LC) and therefore create a higher barrier for the fcc-to-bcc transformation; (iii) the fcc phase with intersecting SF and TB shows a combination of both previous cases. It is observed that the different defects in the parent fcc phase create different atomic barriers for crystal structure change, and therefore they affect the transformation temperature and atomistic mechanisms. For fcc phase with parallel TB in it the atoms of the TB experience low shear stresses whereas the fcc phase with intersecting SF experience higher barrier for transformation because of the sessile LC lock formation. This difference results in different transformation temperatures for fcc phase with different defect configurations.
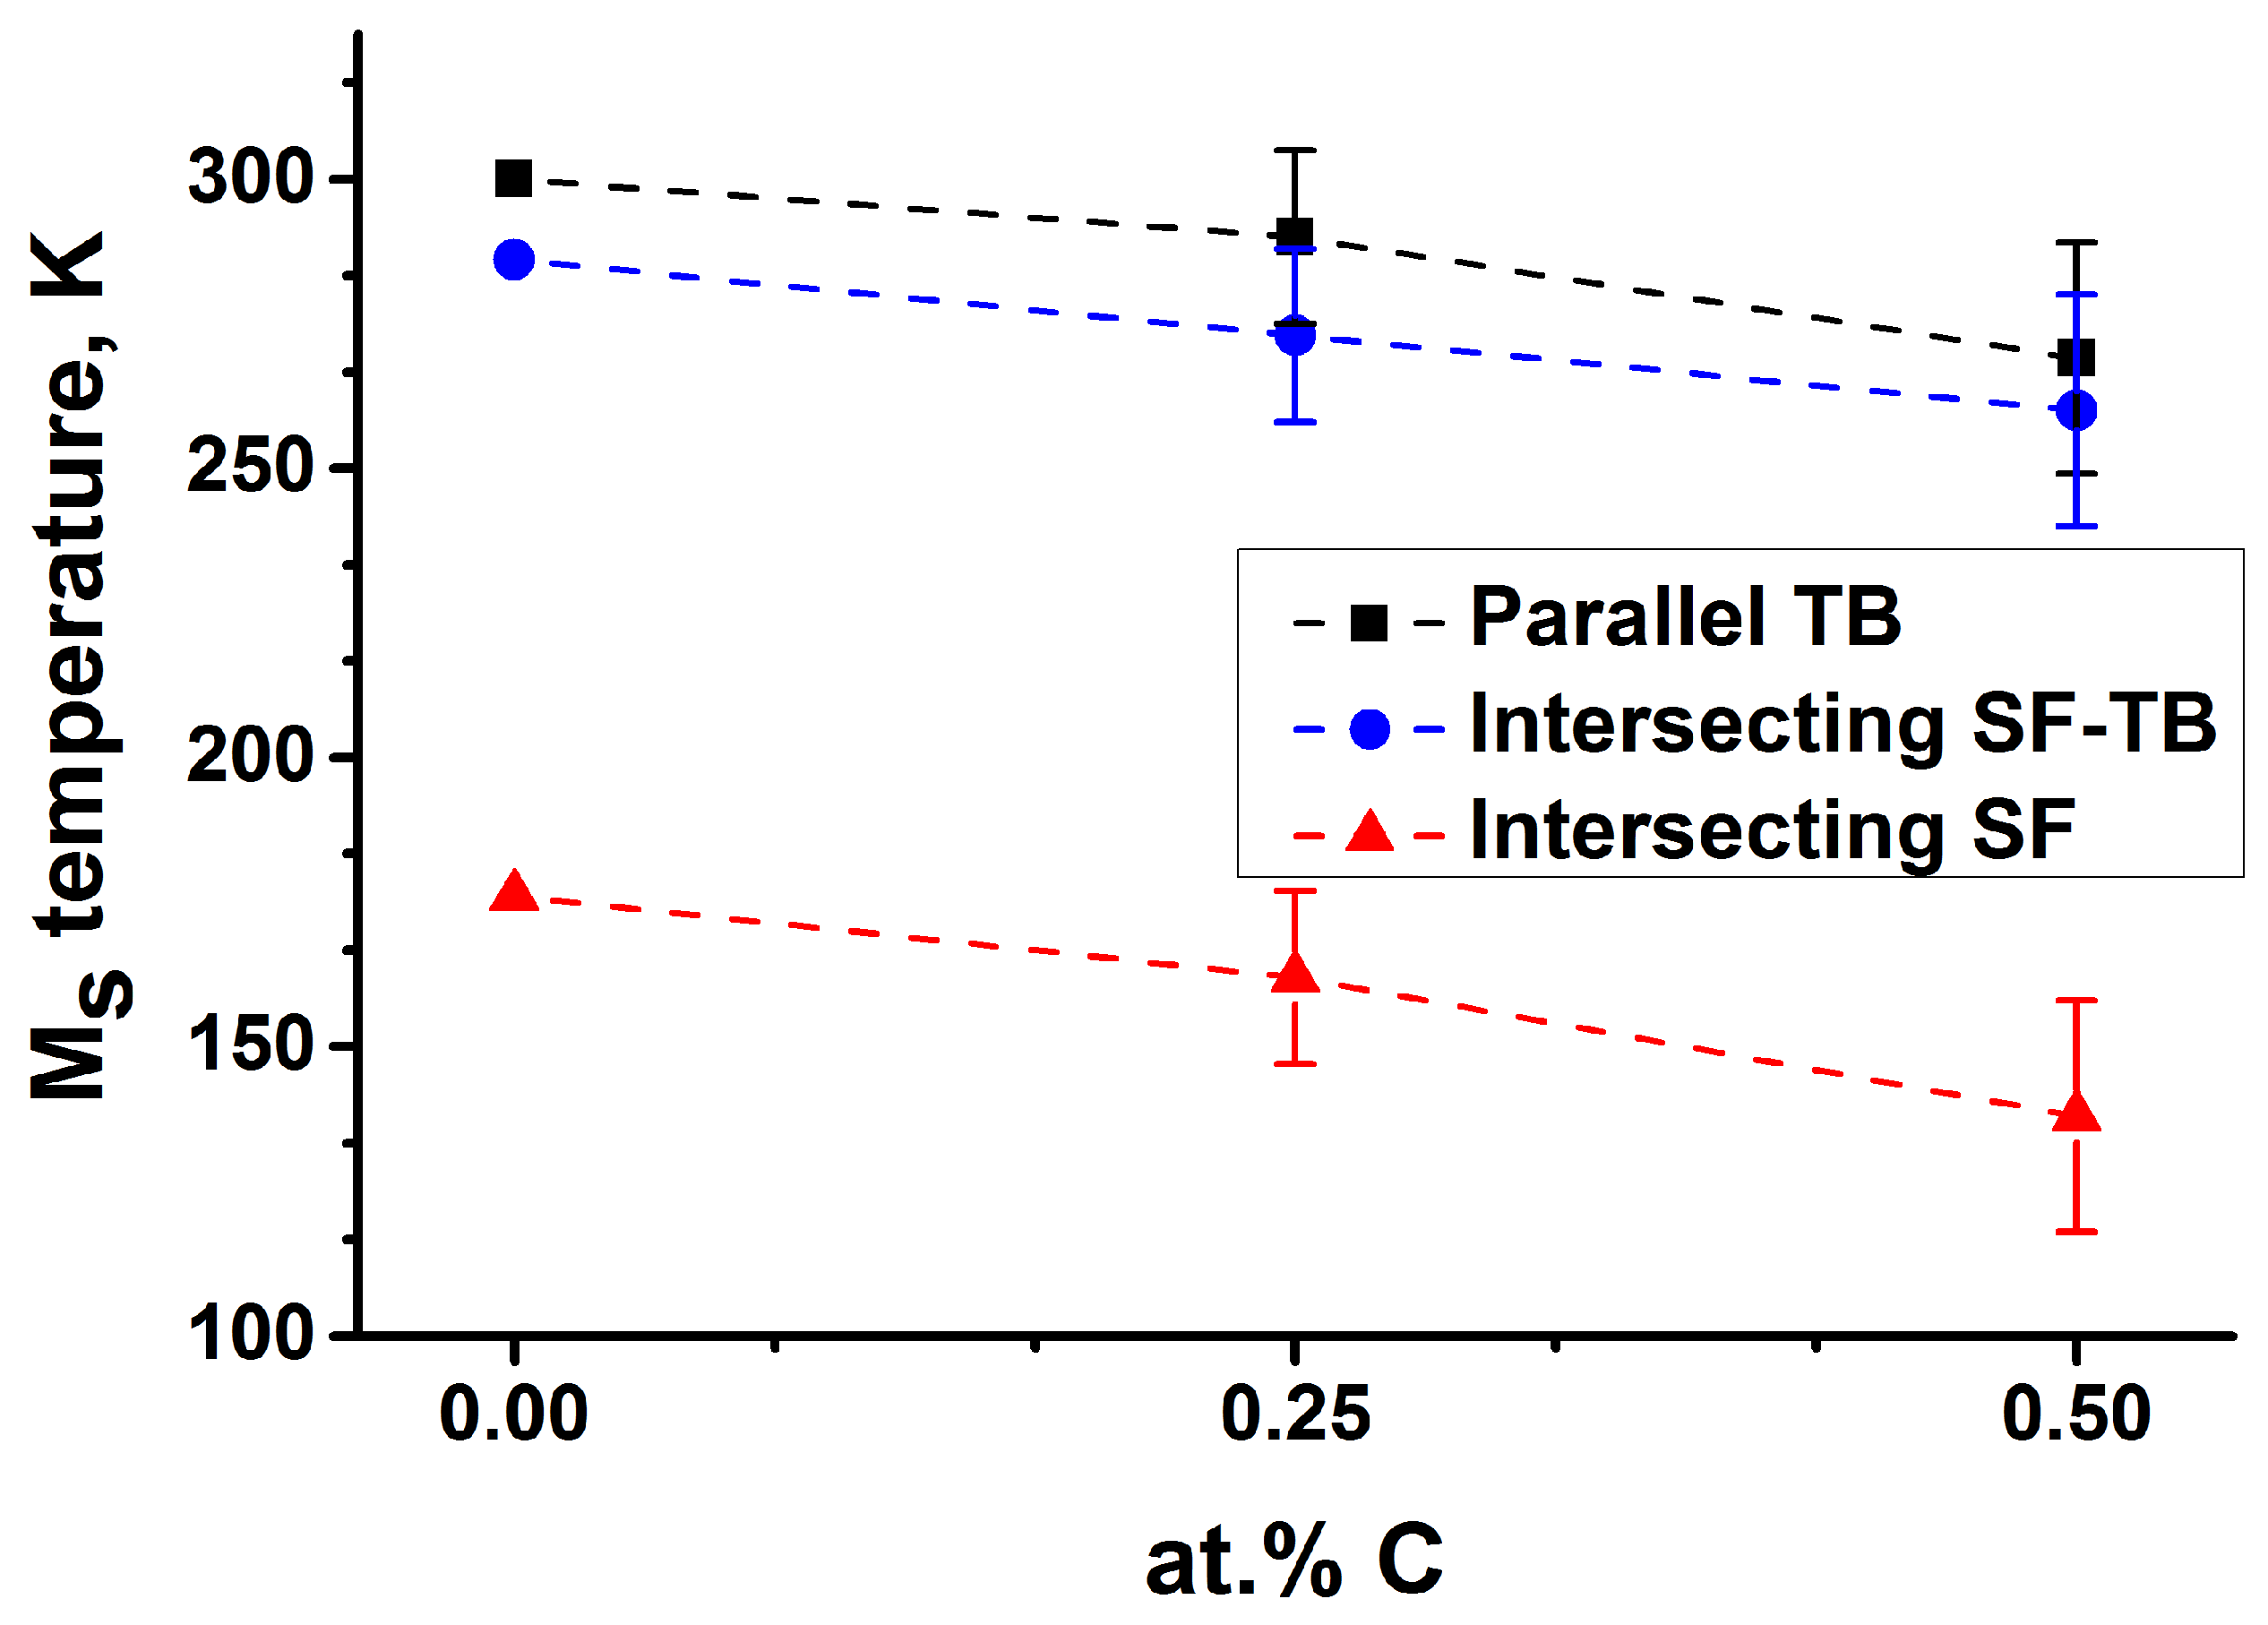
C addition in Fe affects the fcc-to-bcc transformation temperatures as shown in
Figure 2. The temperature at which the fcc-to-bcc crystal structure change starts during cooling is labelled as the martensite start temperature (M
), and is estimated by the visual analysis of the microstructure formed. As seen in
Figure 2, for the same defect type the M
temperature decreases with increase in C concentration for three defect configurations. The qualitative trend of the M
temperature is similar to experimental results, although the exact quantitative values differ [
19]. The trend matches well with the previous simulation studies [
2,
3].
Figure 2 also shows the error bars on M
temperature resulting from different C distributions at a specific C concentration.
To understand the variation of the transformation temperature with C addition, we analyzed three parameters for pure Fe and Fe-C alloys.
- (i)
Atomic shear stress, , at 400 K in the austenite phase,
- (ii)
Difference in atomic energy, , of fcc and bcc phases at 400 K,
- (iii)
Total energy of the single crystal bcc and fcc phases.
The first two parameters ( and ) were calculated at the same temperature for pure Fe and Fe-C alloys in the presence of pre-existing defects to analyze the effect of C at a temperature which is higher than the M temperature. The atomic stress states and energy states at this temperature will provide insight into the effect of C addition. The third parameter (total energy of the single crystal bcc and fcc phases) was calculated for pristine single crystal fcc and bcc phases without any pre-existing defects.
on the slip system
in fcc phase at 400 K was calculated as
, where
m is the Schmid factor, and
are the atomic stresses along the Z direction (The directions are indicated in
Figure 1). Positive and negative magnitudes of
stresses indicate the tensile and compressive stresses, respectively. The
was calculated based on
stresses for pure Fe and Fe-C alloys to qualitatively compare the magnitudes of atomic shear stresses needed for the atomic displacements. This comparison will show whether C addition increases or decreases the stresses for shear displacement during martensitic transformation. The atomic stresses were calculated as per the virial formulation of the stress [
21] and were time averaged over 1000 MD steps. The temporal averages were shown to be equivalent to Cauchy stress [
22].
The atomic shear stresses, , control the atomic displacements that lead to fcc-to-bcc change. The magnitude of the atomic shear stresses required for atomic displacements determines the barrier of the martensitic transformation, i.e., the ease or difficulty of the fcc-to-bcc transformation as a function of C addition: less shear stresses during the transformation indicate lower barrier for transformation, and high shear stresses indicate higher barrier for transformation.
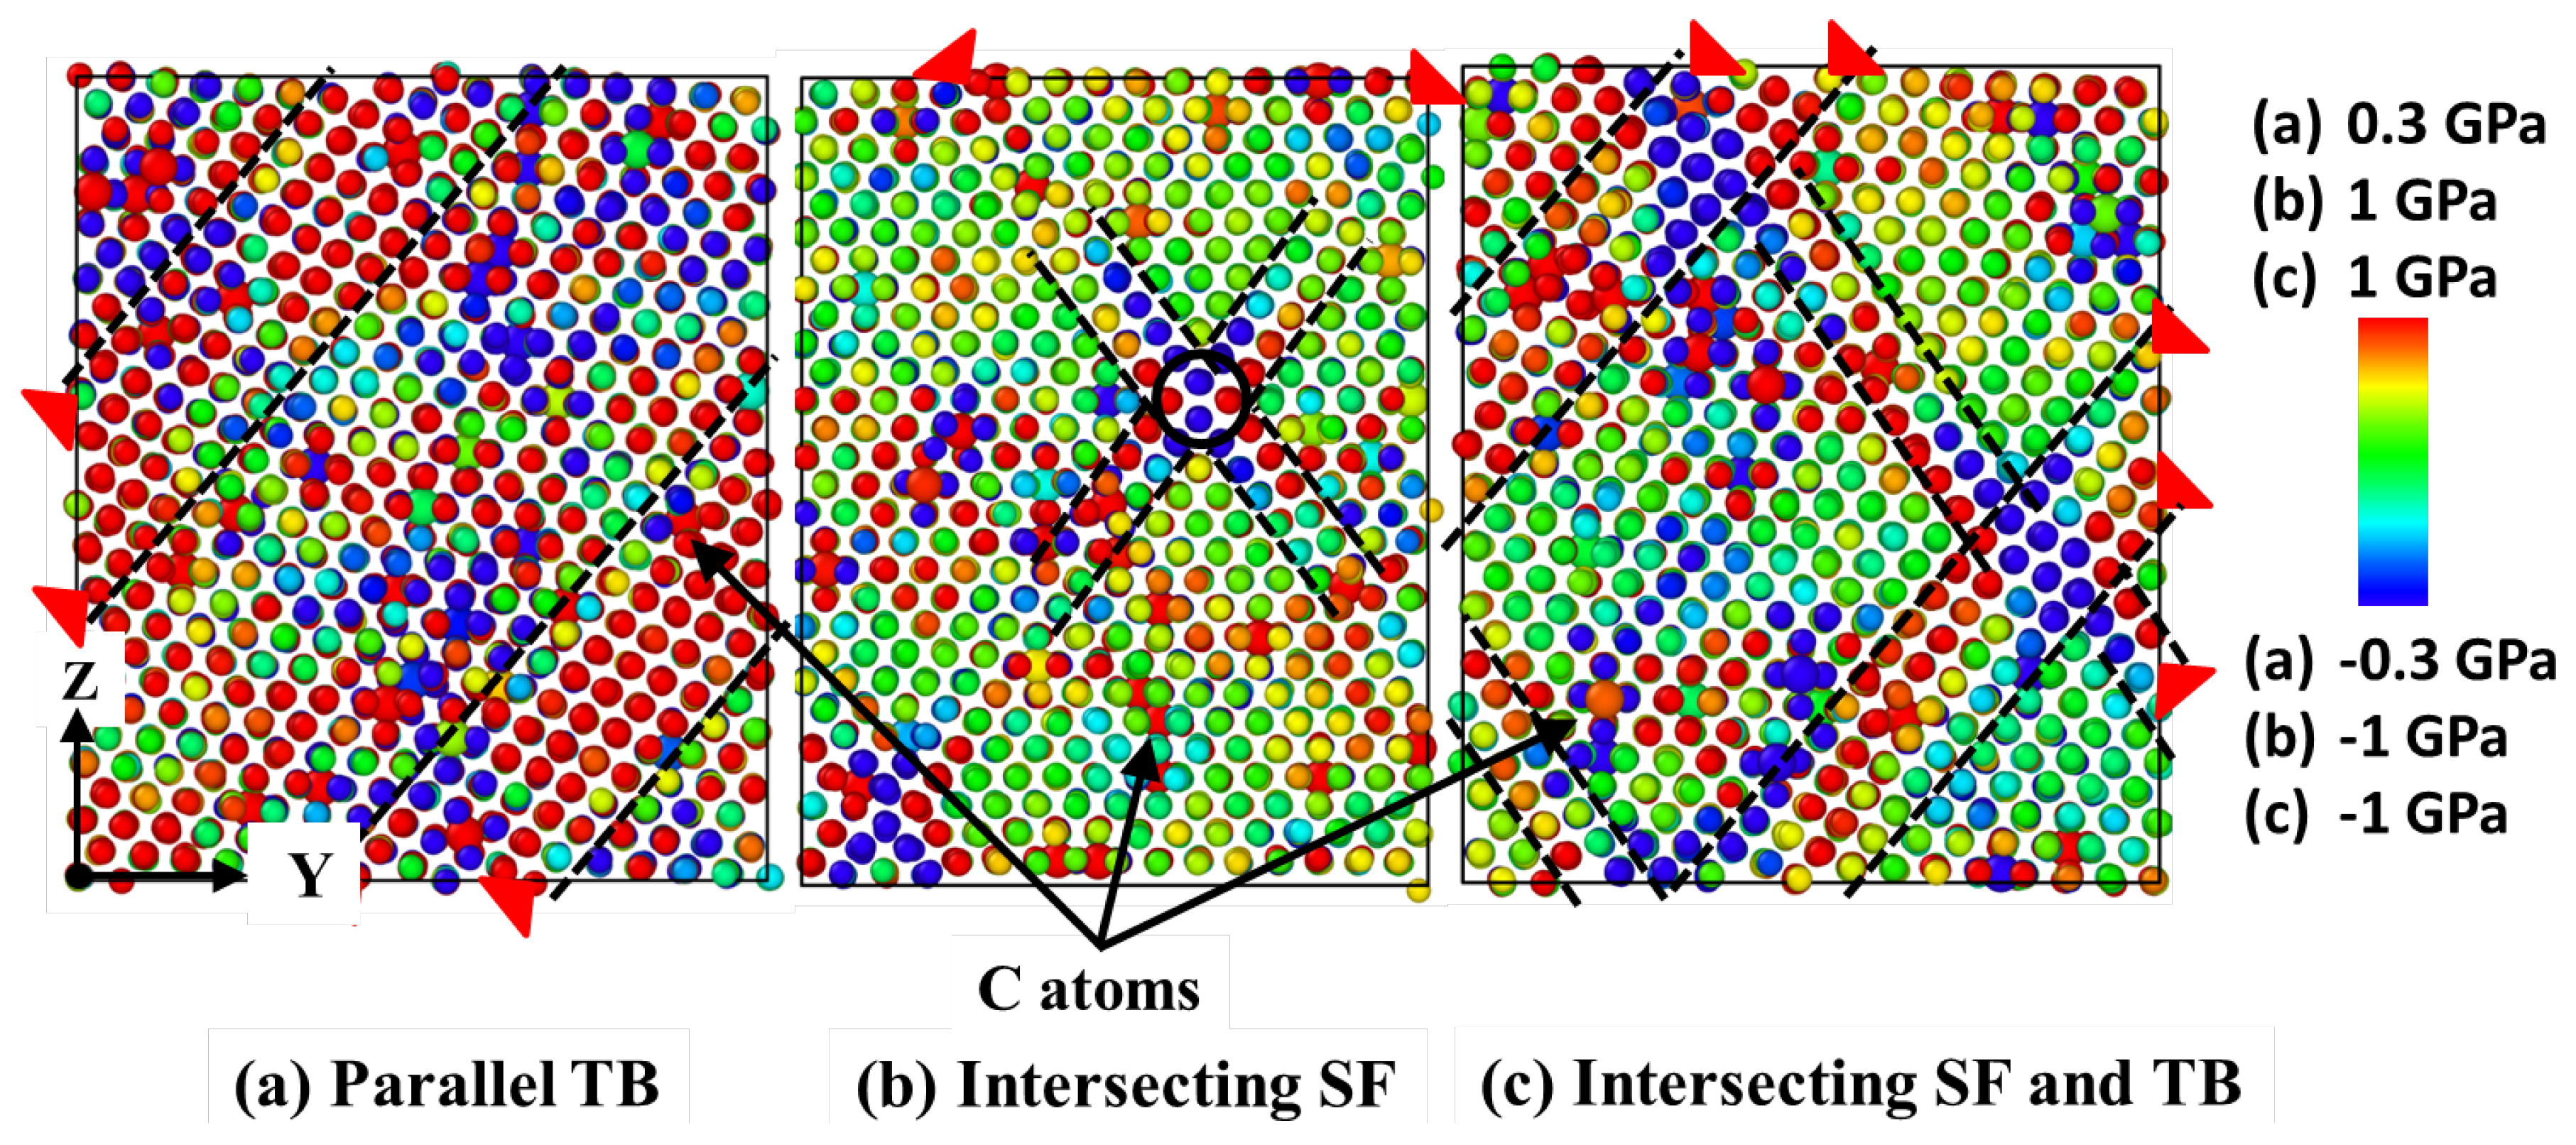
The atomic stresses for different defect configurations of Fe-0.5 at. %C at 400 K are shown in
Figure 3. For fcc phase with parallel TB as seen in
Figure 3a, the average resolved stresses are -0.02±0.01 GPa on the atoms of TB in the fcc phase. The atoms of TB experience lowest shear stresses in the fcc phase and aid the transformation. For fcc phase with intersecting SF, seen in
Figure 3b, the two layers of SF have maximum and opposite resolved shear stresses,
, at the intersection because of the formation of sessile LC lock. The opposite nature of
in the two atomic layers imparts opposite shear on the two atomic layers of SF surface and is responsible for hcp to bcc phase transition. The stresses are concentrated at the intersection which causes it to serve as a barrier for the atomic displacement. The two SF intersect on the two
planes to form a sessile LC lock and therefore create a barrier for the motion of the atoms. The four layers of the atoms of the LC are shown by a solid circle in
Figure 1b and
Figure 3b for easy identification. The sessile nature of the atoms at the LC creates high atomic shear stresses at the intersection until the barrier for the displacement is crossed for the atomic shear with decrease in temperature. The rest of the bulk fcc has average stresses closer to zero. The high atomic stress regions of SF are also shown in
Figure 3b between the dashed lines. The fcc phase with intersecting SF contains a higher barrier for the transformation because of the high stress concentrations at the SF intersection compared to the fcc phase with parallel TB. Thus atomic shear requires a greater thermal under-cooling to overcome the barrier for atomic displacements during fcc-to-bcc transformation. Thus the fcc phase with intersecting SF changes the crystal structure to bcc at a lower temperature than fcc phase with parallel TB. For the fcc phase with intersecting SF and TB, as seen in
Figure 3c, the stress state is a combination of the two previous cases as shown in
Figure 3a,b.
The magnitudes of the local atomic stresses close to the planar defects are greater for Fe-0.5 at. %C in comparison with pure Fe. The magnitudes of the atomic stresses vary from
to 0.3 GPa for pure Fe (Figure 8a–c from reference [
1]) whereas for Fe-0.5 at. %C it varies from
to 1 GPa as shown in
Figure 3b,c. For parallel TB in
Figure 3a, the average shear stresses at the atoms of TB are
GPa for Fe-0.5 at. %C whereas for pure Fe they are 0 GPa. The greater magnitude of local shear stresses for Fe-C alloys in comparison to pure Fe indicates higher barrier that needs to be overcome for fcc-to-bcc transformation in Fe-C alloys.
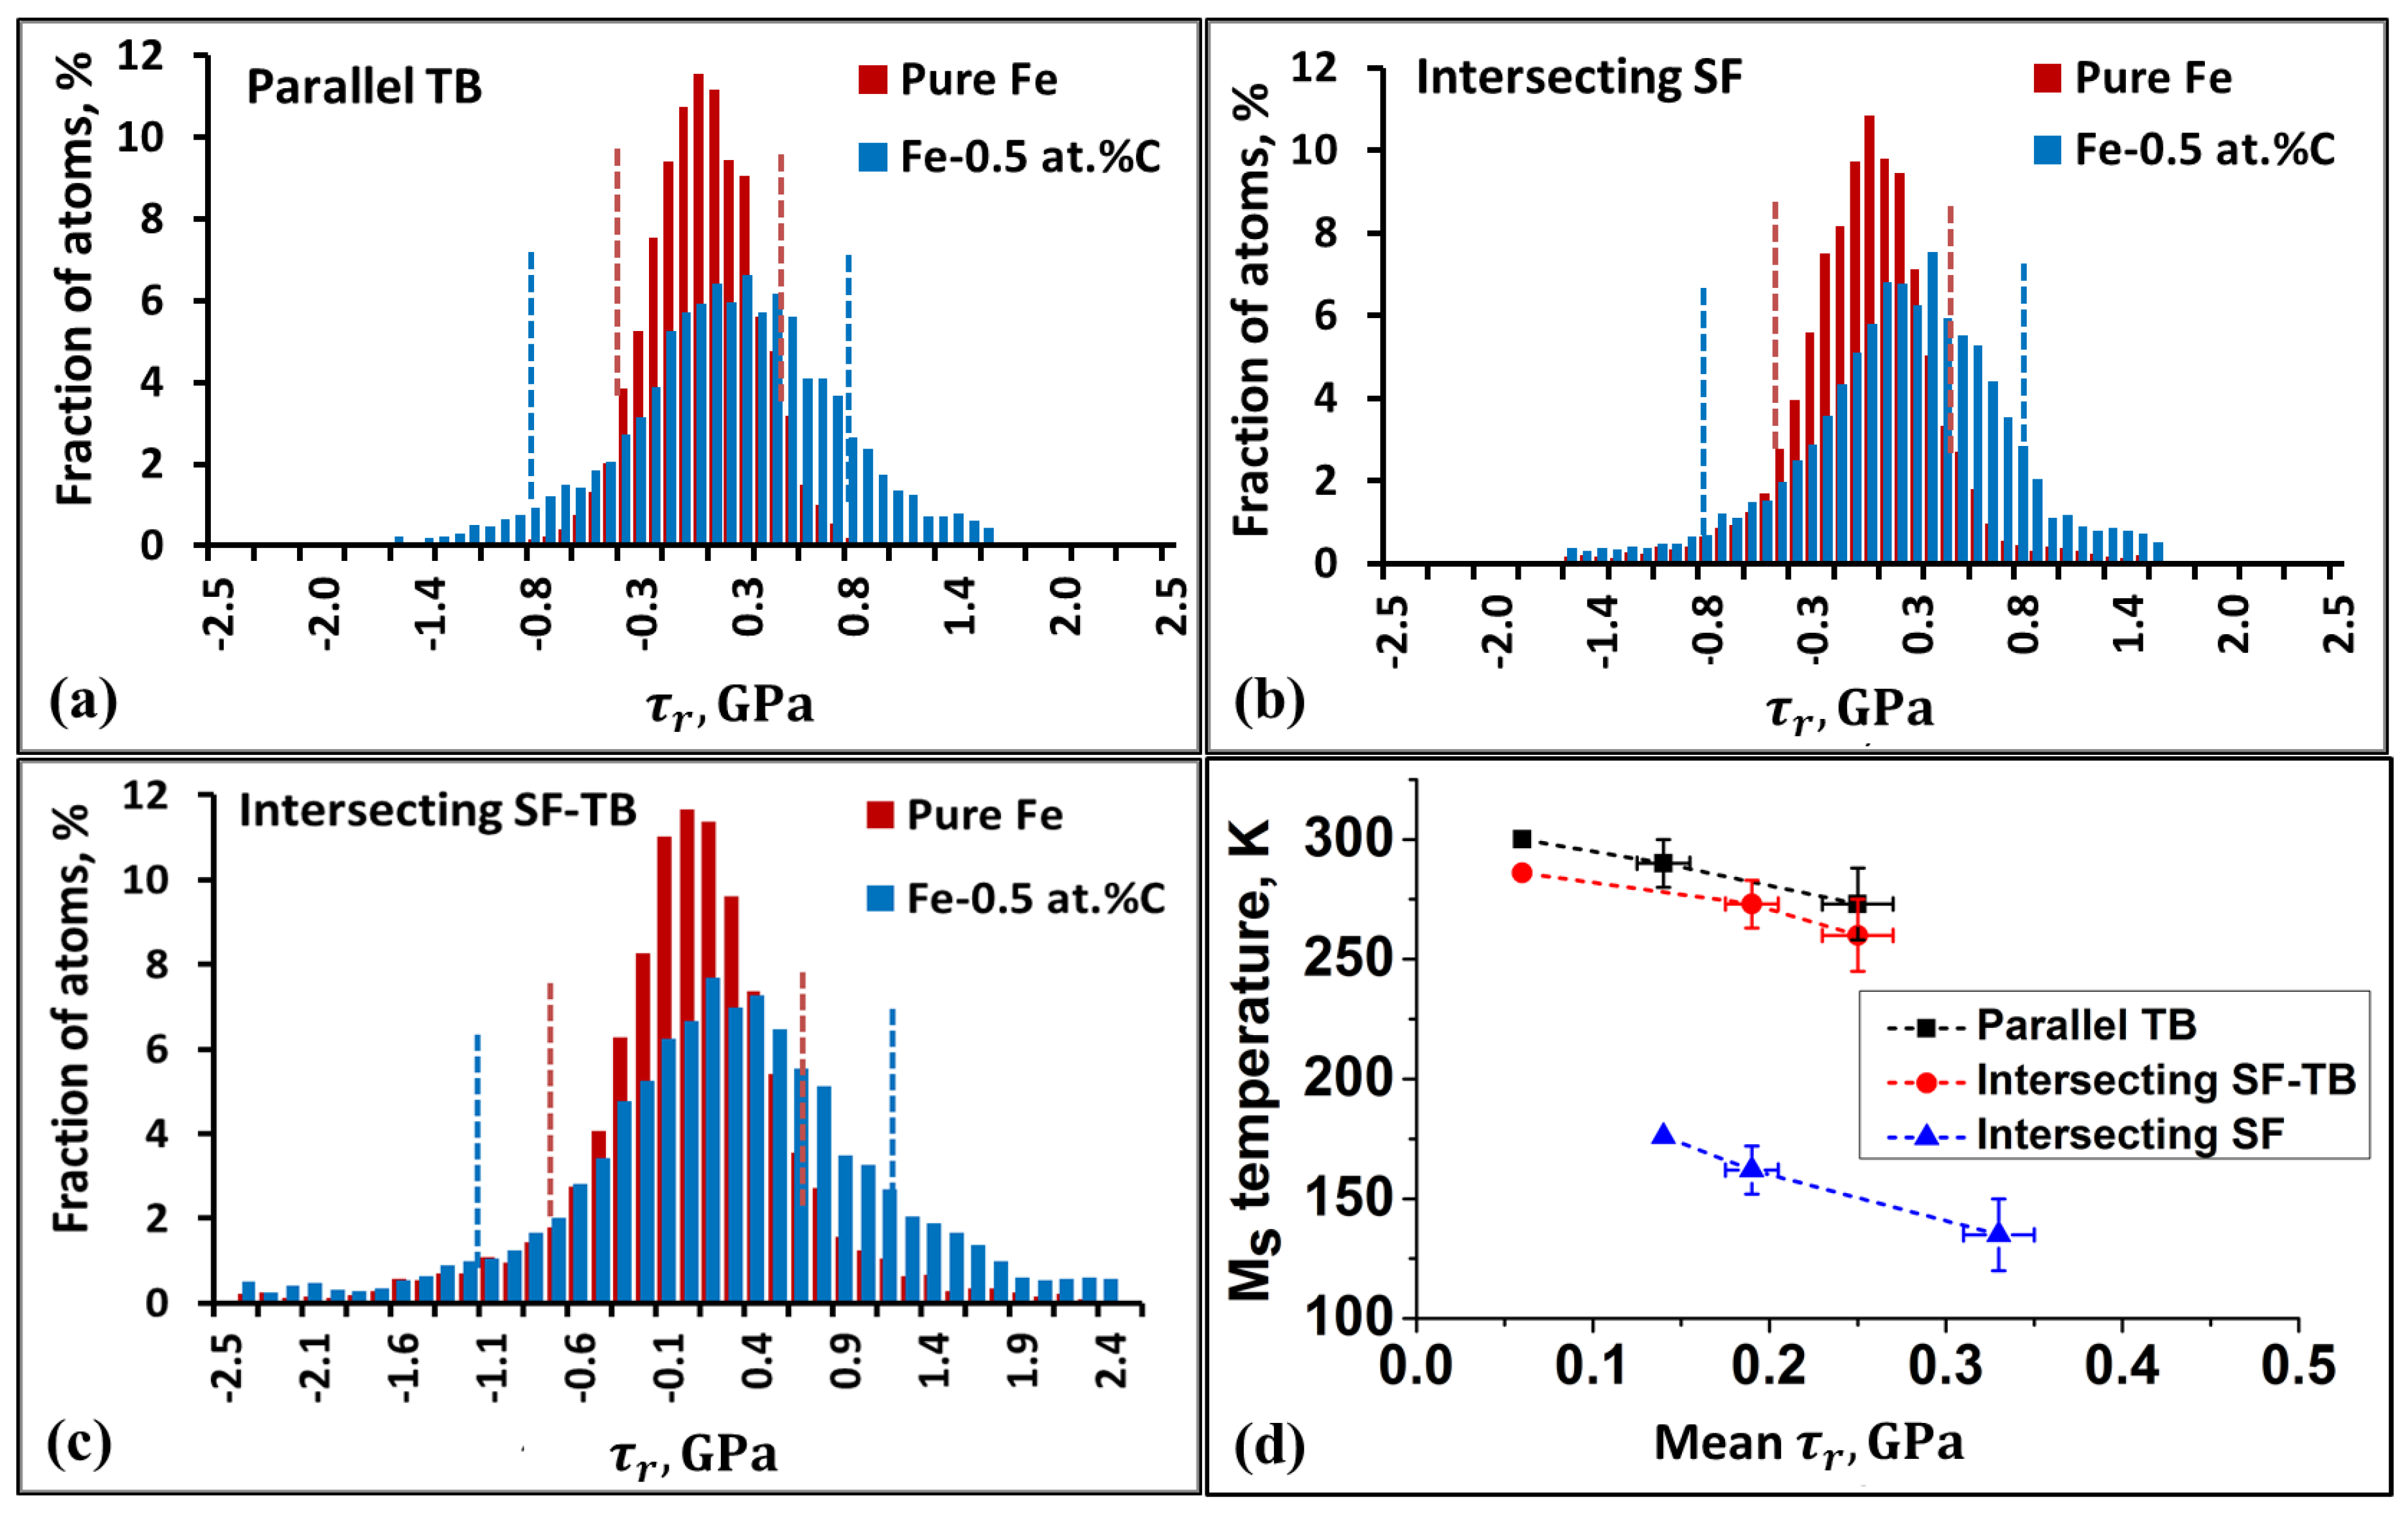
The comparison of atomic resolved shear stresses,
, for pure Fe and Fe-0.5 at. %C for different defect configurations is shown in
Figure 4a–c. We have plotted the atomic resolved shear stresses (from
Figure 3) in a histogram to further analyze it. The fraction of atoms were plotted against
values. The
values for majority, 80%, of the atoms in pure Fe vary from
to 0.4 GPa,
GPa to 0.45 GPa, and
GPa to 0.7 GPa, respectively, for fcc phase with parallel TB, intersecting SF, and intersecting SF and TB configurations. Whereas for the same configurations and for 80% fraction of the atoms in Fe-0.5 at. %C, it varies from
to 0.8 GPa,
GPa to 0.8 GPa, and
GPa to 1.1 GPa. The variations for these majority of the atoms are indicated by dashed red and blue lines, respectively, for pure Fe and Fe-0.5 at. %C. This indicates wider scale of atomic stresses for Fe-0.5 at. %C.
For pure Fe fcc phase with parallel TB, 80% of the atoms experience between and 0.4 GPa whereas only 43% atoms are observed in this range for Fe-0.5 at. %C. Similarly for intersecting SF case, 90% of the atoms experience stresses between and 0.6 GPa for pure Fe whereas only 70% of the atoms fall in this range for Fe-0.5 at. %C. In case of fcc phase with intersecting SF and TB, 88% of the atoms experience stresses between and 0.8 GPa for pure Fe whereas only 70% of the atoms are in between this range for Fe-0.5 at%C. The wider scale in atomic stresses indicates that higher stresses are required for the martensitic transformation in Fe-0.5 at. %C alloy. These higher stresses are in turn achieved by the greater degree of under-cooling and therefore for Fe-0.5 at. %C alloys the fcc-to-bcc transformation temperature is lower compared to pure Fe. This shows that the magnitude of the is lower in pure Fe than in Fe-0.5 at. %C alloy and therefore low barrier is needed for the transformation which can be achieved at higher temperature as compared to Fe-0.5 at. %C. The magnitudes of the atomic stresses for Fe-0.25 at. %C composition are in between the magnitudes of pure Fe and Fe-0.5 at. %C.
Figure 4d shows the M
temperature as a function of the mean value of
. The mean value of
was calculated from the histograms in
Figure 4a–c for different defect configurations and C concentrations. The error bars on X and Y axis in this figure indicate the deviations arising from different C distributions at the same C concentration. M
temperature vs
graph shows inverse relation between the two parameters where M
decreases with increase in mean value of
. The value of
in turn increases with C addition. For the three defect configurations, pure Fe has the lowest mean
values and highest M
temperature, whereas Fe-0.5 at. %C shows highest
values and lowest M
temperature. With the addition of C in pure Fe, the mean
value increases which suggests an increase in the barrier for the fcc-to-bcc temperature. The increase in barrier with the addition of C requires greater under-cooling for the transformation which results in lower M
temperature. Similar to the data in
Figure 2, the data in
Figure 4d shows the variation of M
temperature for a specific C concentration which arises from the different defect arrangements and different C distributions.
Note that the data in
Figure 3a–c and
Figure 4a–c represent the local atomic shear stresses whereas data in
Figure 4d represent the mean value of
in the entire fcc phase of the simulation system. The comparison of the local atomic shear stresses indicates the change in magnitude of the
values in the vicinity of the planar defect configurations with C addition, whereas the mean value of
represents the shear stress of the whole system. In the present context we interpret the mean stress values as a semi-quantitative indicator of the C addition on the barrier for martensitic transformation. Based on the above analysis of the atomic stresses, we can say that the addition of C atoms within the simulation system increases the shear stresses for atomic displacements locally. This local effect can be indicated by the mean value of shear stress in the entire simulation system which takes into account the effect of all C atoms in the simulation system. The increased shear stress of the whole system because of the addition of many C atoms can thus be seen as a semi-quantitative indicator of the barrier for transformation.
Sakamoto [
23] proposed the concept of shape change stress (SCS) during thermally induced martensitic transformation (TIMT). As per SCS, in TIMT the transforming region generates stress to deform the surrounding region. In addition, the volume change during transformation can also generate stresses. In the present simulations, the slip deformation, i.e., the atomic shear displacements on a particular slip plane and along a particular slip direction during fcc-to-bcc transformations happen because of thermally induced shear stresses acting on the slip systems. In accordance with SCS, these shear stresses are the result of stress relief during the martensitic transformation. Thus the shear stress represents the slip deformation barrier for the fcc-to-bcc transformation and a quantifiable parameter as a function of C concentration. We note that the mean value of shear stress (
) indicates the inherent resistance of the entire simulation system, in other words the slip deformation barrier, for fcc-to-bcc transformation as a function of C addition. The greater magnitude of mean shear stresses for Fe-C alloys indicate higher barrier for transformation. The higher barrier is overcome by decrease in temperature and therefore lower M
temperature with C addition. The shear stress in the present context is not an externally applied quantity but originates from the thermally induced driving force.
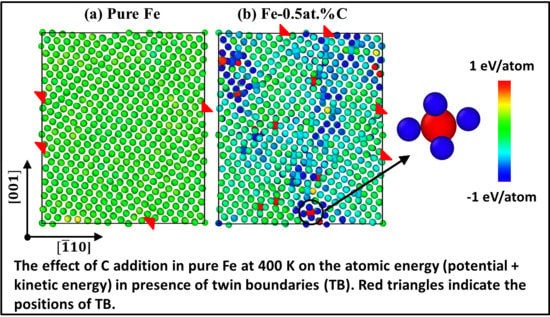
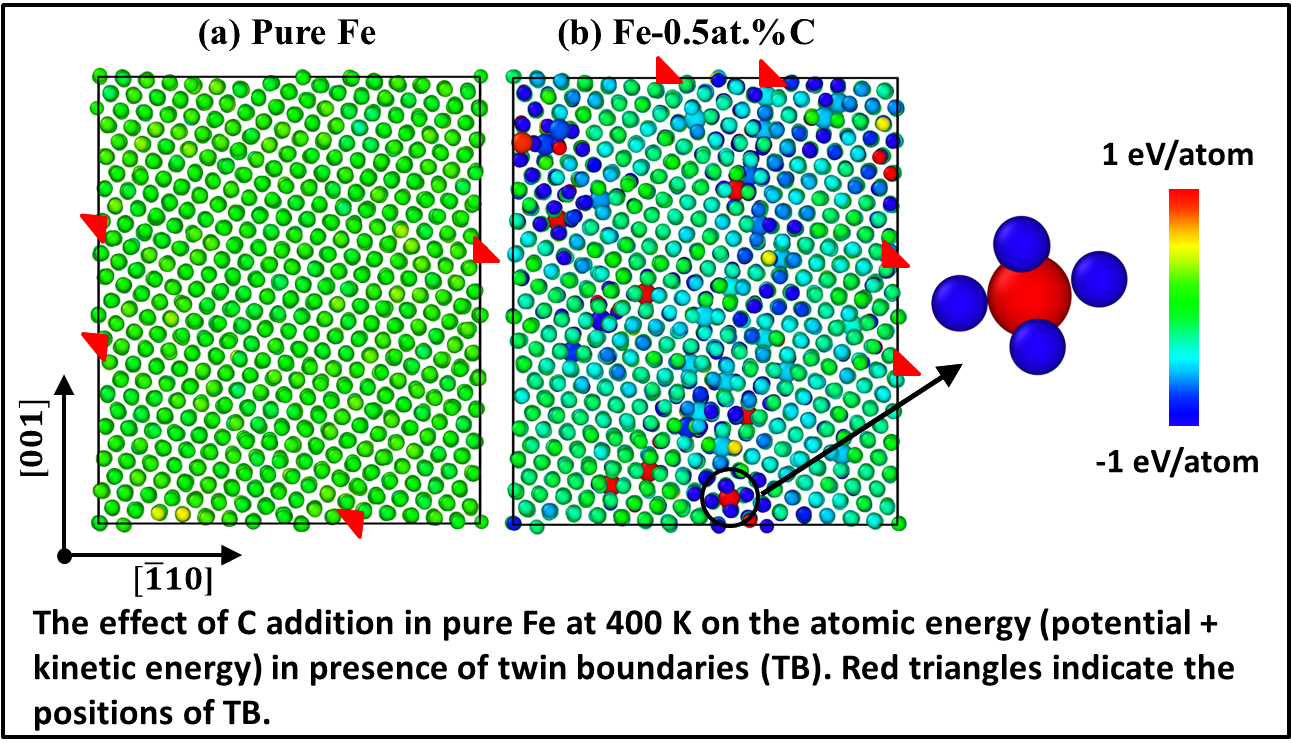
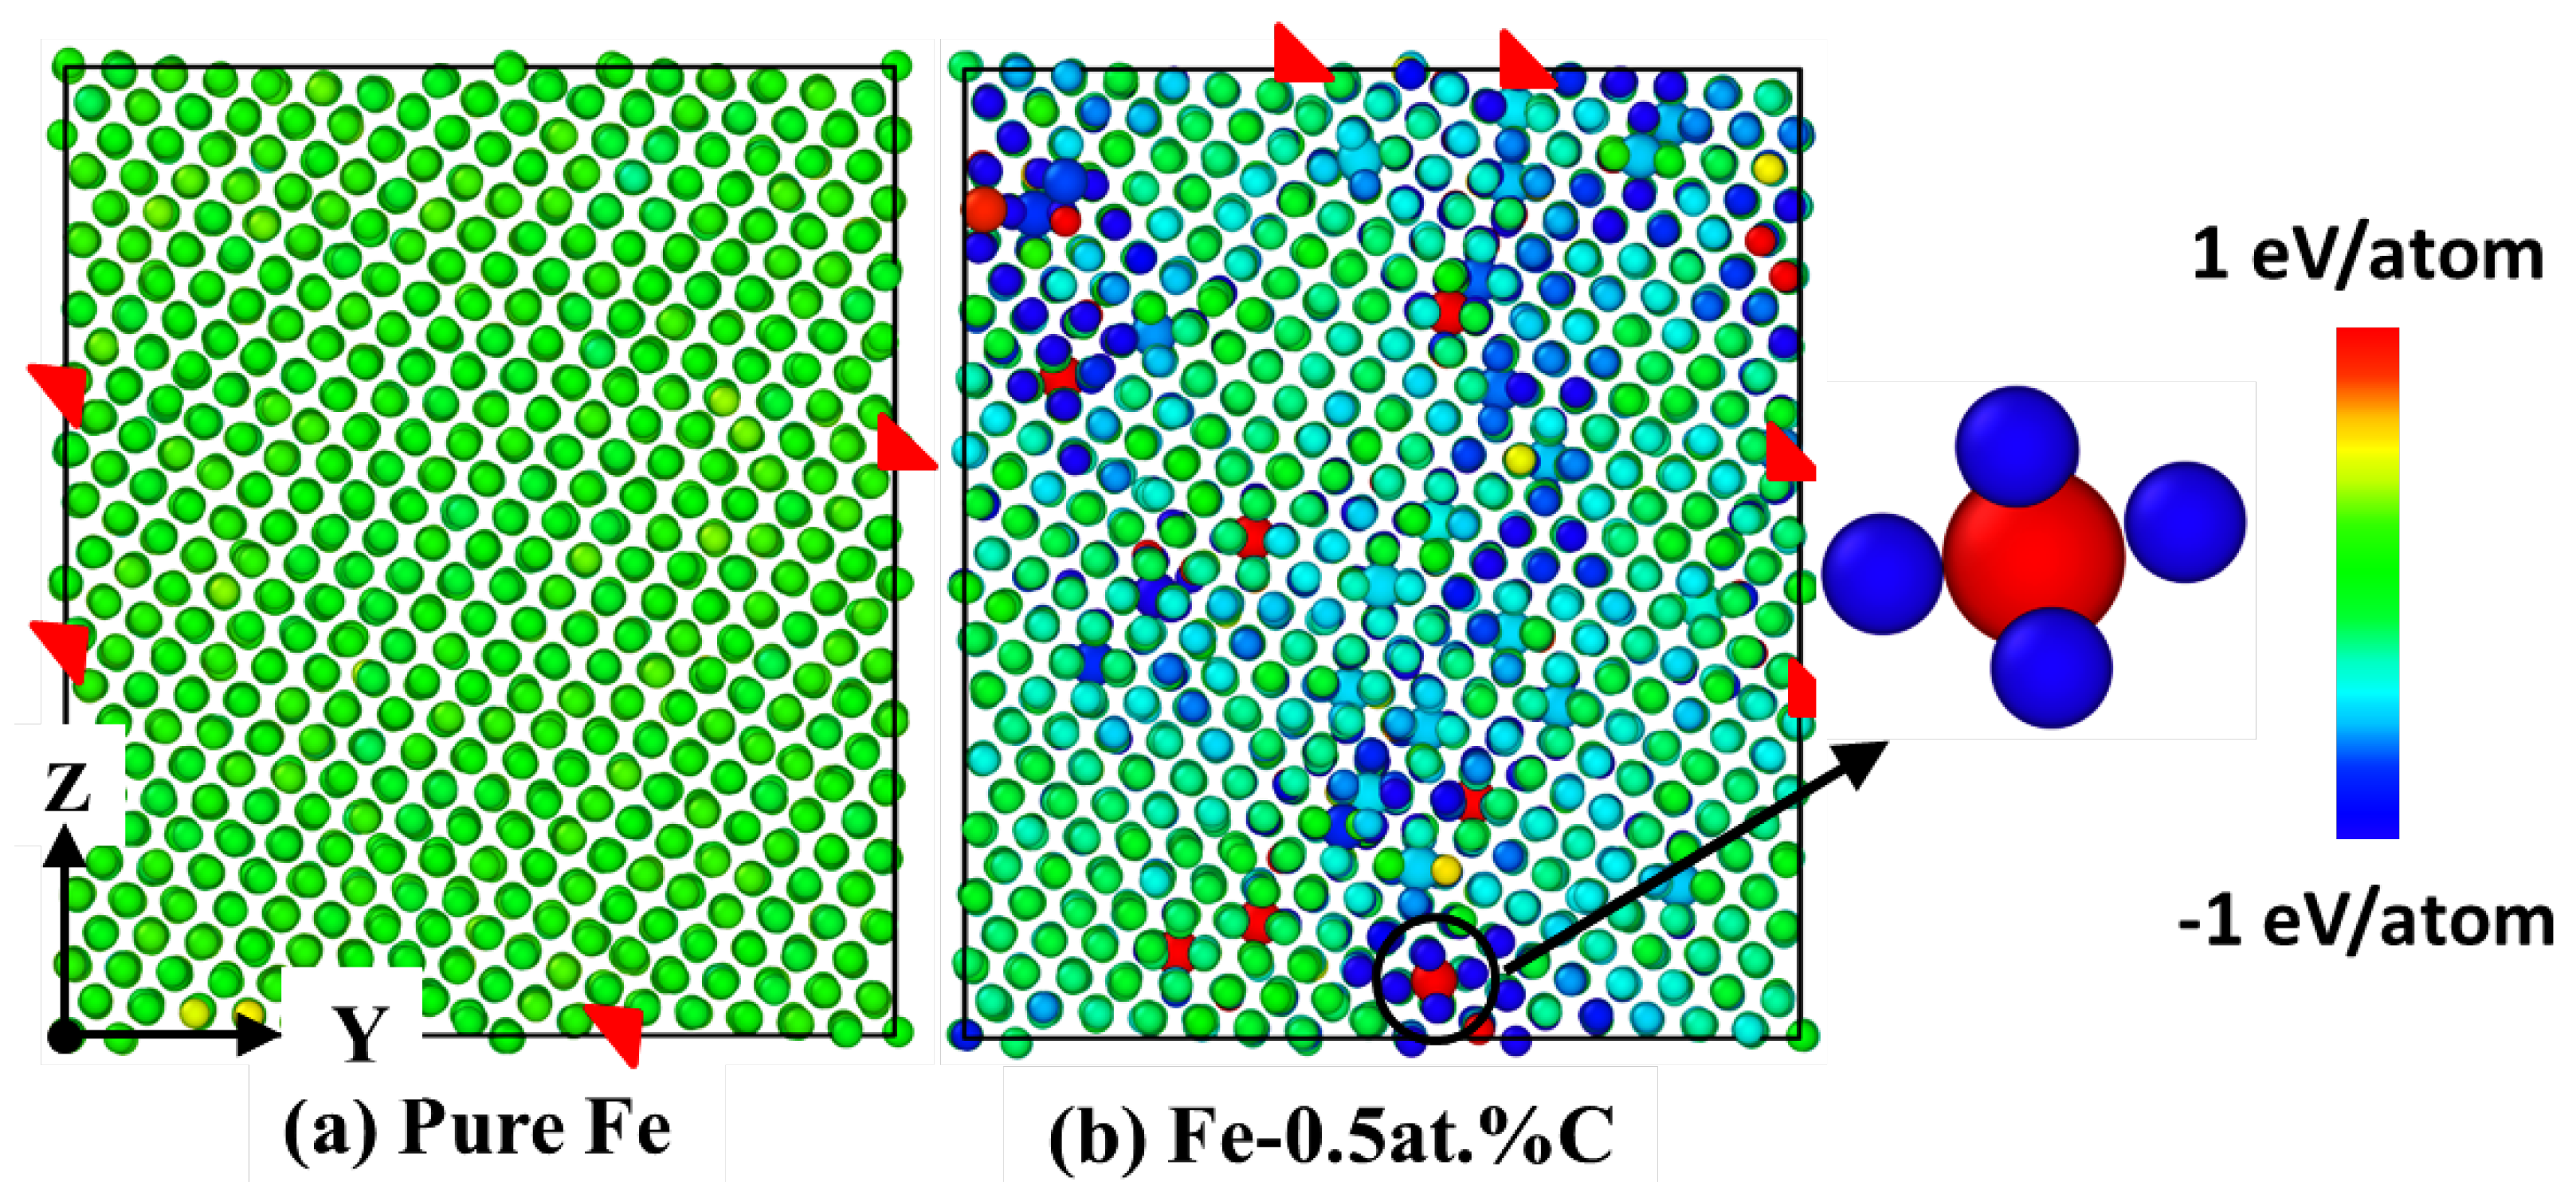
Secondly,
of the fcc and bcc phases at 400 K for pure Fe and Fe-0.5 at. %C was calculated as
, and is shown in
Figure 5. Here,
and
indicate the total atomic energy consisting of potential and kinetic contributions of fcc and bcc phases, respectively, at 400 K. The comparison of this difference between pure Fe and Fe-0.5 at. %C indicates the thermodynamic stabilization or destabilization of fcc phase with C addition in pure Fe. In this work, we analyzed the atomic energy in order to reveal the effect of C addition at the atomic level. As seen in this figure, the addition of C reduces the atomic energy of the nearest neighbour Fe atoms to a value less than 0 eV/atom. This decrease indicates that the addition of C atoms stabilizes the fcc phase and thereby increases the barrier for transformation to bcc phase during cooling. The stabilization of fcc phase is another reason for decrease in fcc-to-bcc transformation temperature with the addition of C. The same effect is observed in the other two defect configurations as well in the presence of C. The close-up view of one C atom and its surrounding Fe atoms is shown in
Figure 5b.
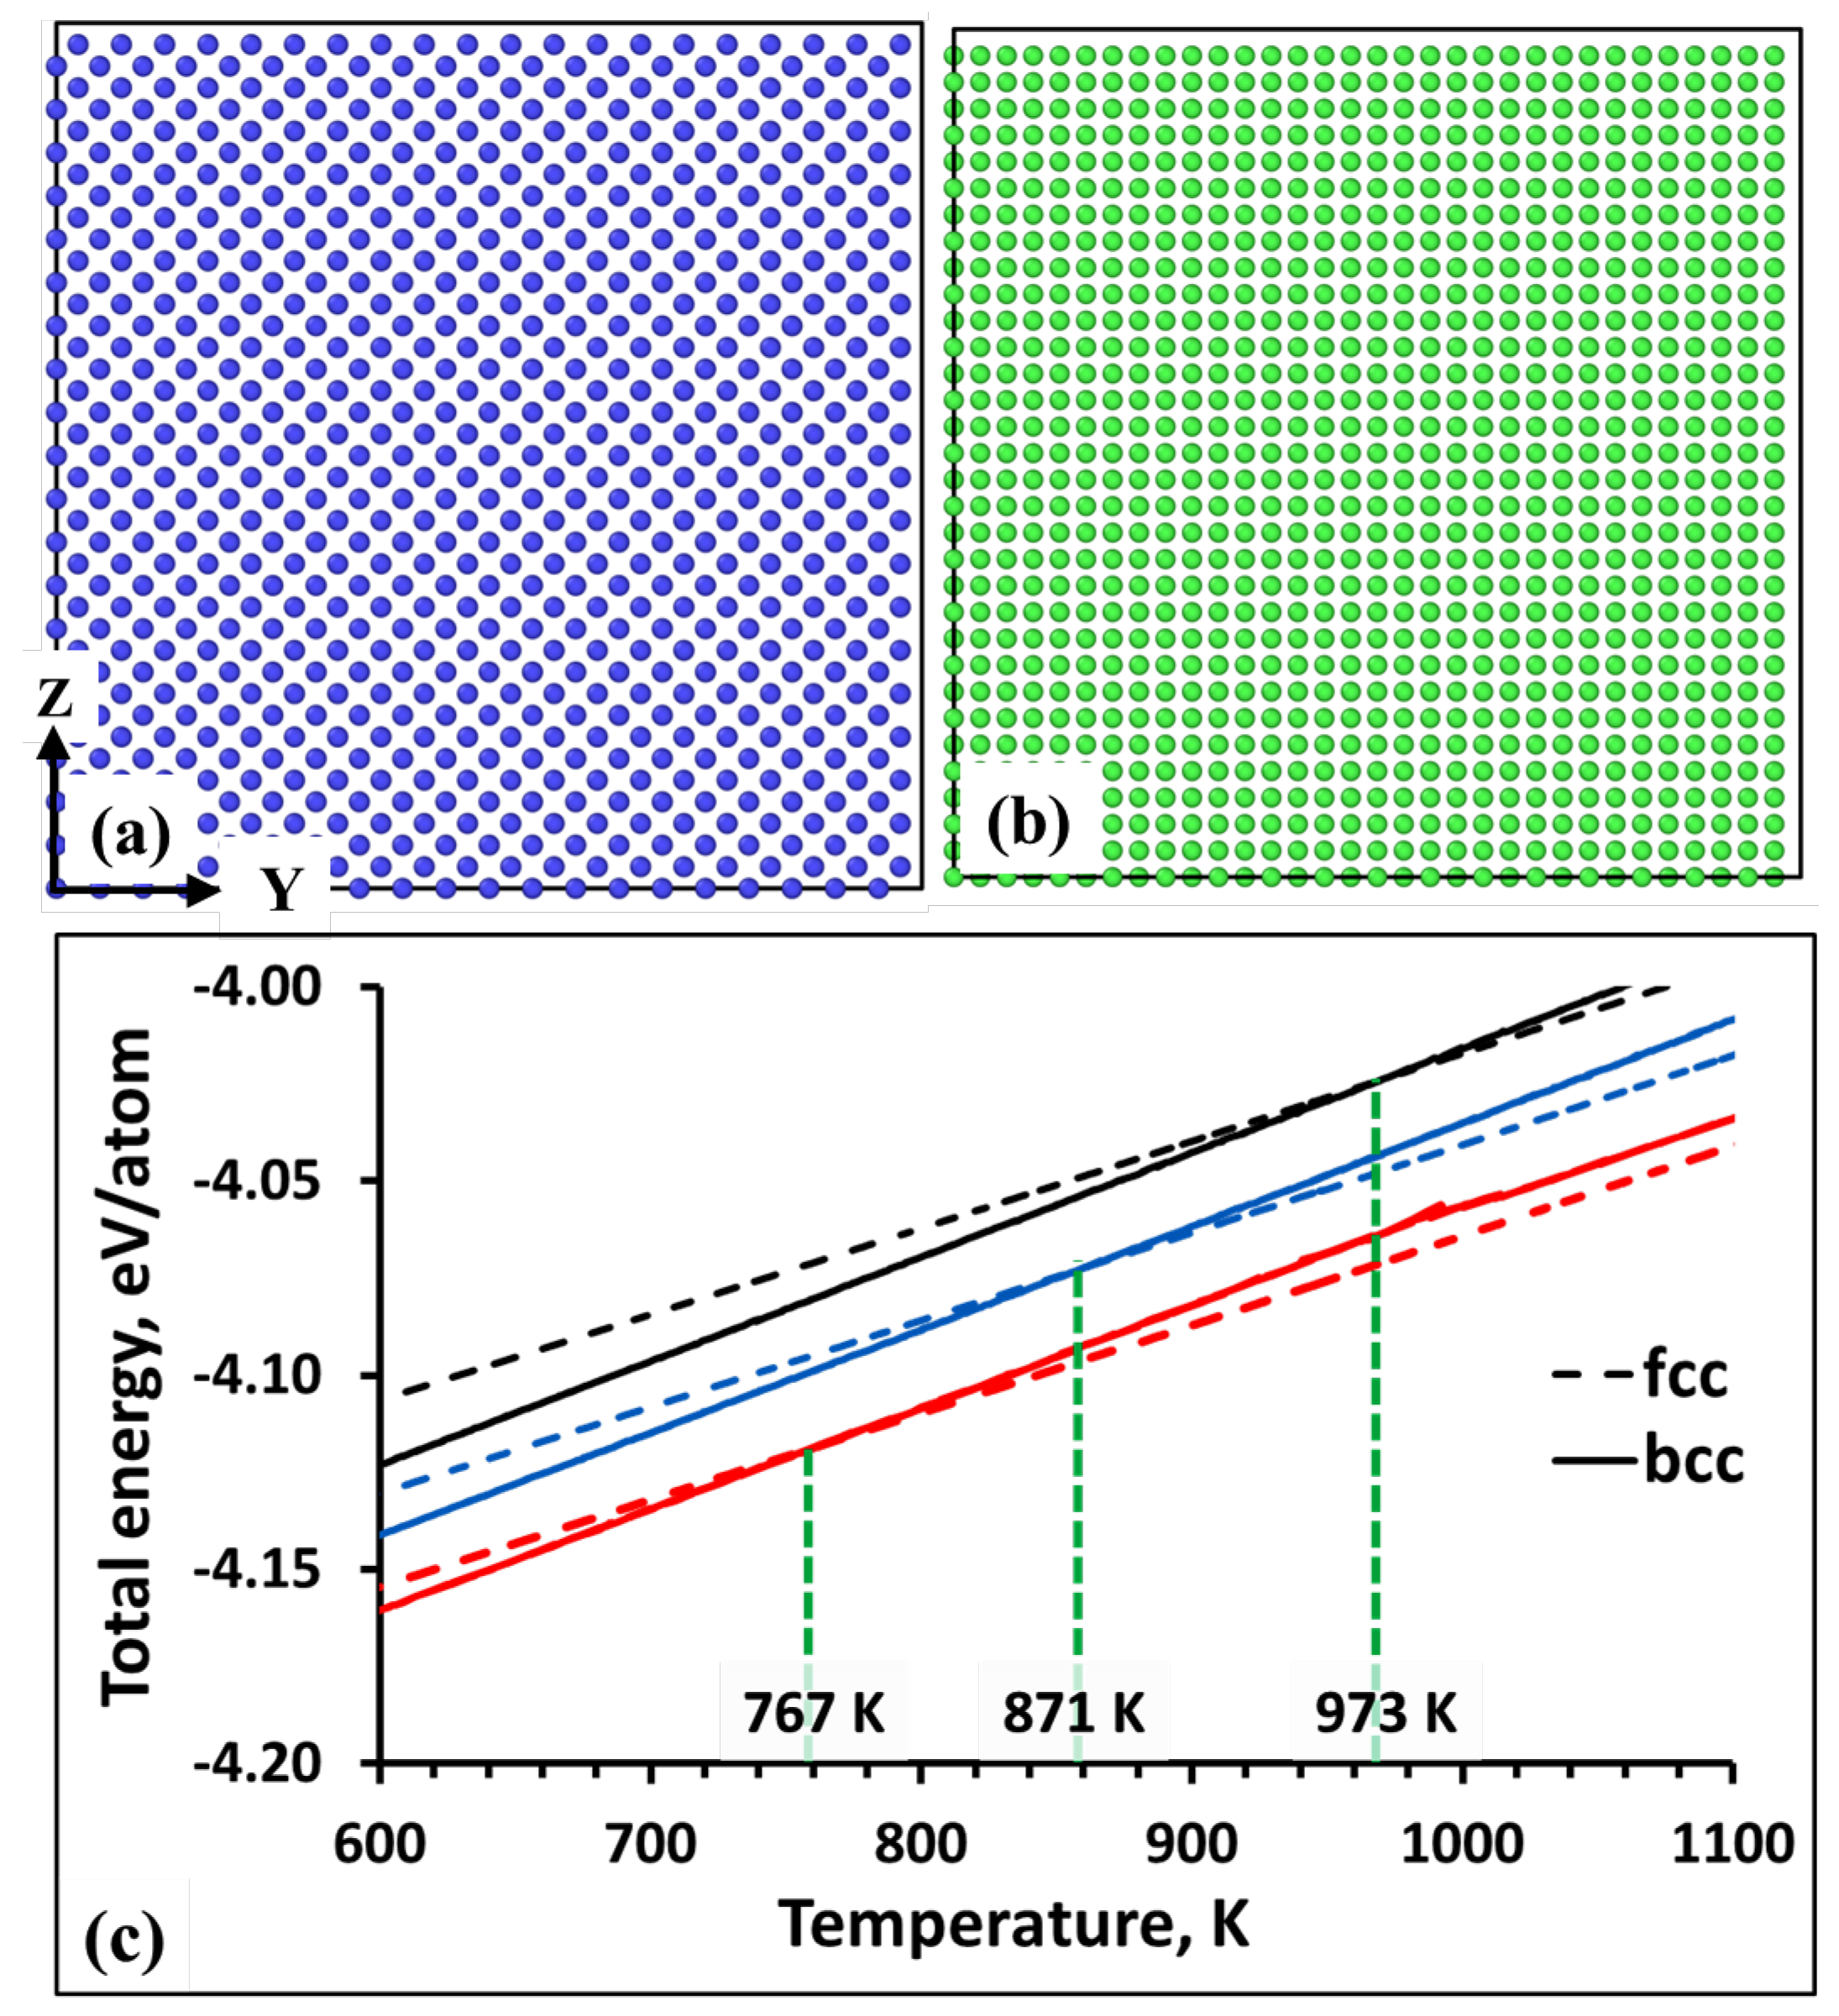
Thirdly, the total energy of the single crystal bcc and fcc phases without pre-existing defect configurations as function of temperature from 50 K to 1200 K for pure Fe and Fe-C alloys were calculated as shown in
Figure 6. The total energy consists of kinetic and potential energy contributions as a function of temperature. The examples of single crystal fcc and bcc phases without pre-existing defects are shown for pure Fe in
Figure 6a,b. The crystallographic directions are
,
, and
for pristine fcc and bcc single crystals. For Fe-C alloys, C atoms were added randomly at octahedral positions in these single crystal simulation systems. Five different C distributions are studied for each phase. The total energy analysis as a function of temperature reveals the stability of a particular phase. It can be seen that the total energy values for fcc and bcc phases intersect at 973 K, 871 K, and 767 K, respectively, for pure Fe, Fe-0.25 at. %C, and Fe-0.5 at. %C. The error bars that arise because of different C distributions for the intersection points are ±10 K and ±15 K for Fe-0.25 at. %C and Fe-0.5 at. %C, respectively. The decrease in the intersection point of the total energies of the two phases indicates an increase in the stability of the fcc phases with increase in C concentration. It also indicates that the addition of C decreases the stability of the bcc phase. The respective increase and decrease of the stability of fcc and bcc phases is the reason why addition of C decreases the transformation temperatures.
The results of the total energy of single crystal fcc and bcc phases without pre-existing defects for different C concentrations in the present work are in good agreement with the recent MD study by Sak-Saracino and Urbassek [
3]. They calculated free energy of fcc and bcc phases in Fe-C alloys to conclude that the C addition increases the stability of fcc austenite phase which qualitatively agrees with the experimental data [
24].
4. Discussion
The effect of simulation system size and C addition in bcc phase is discussed in this section. As mentioned in the simulation methodology section, we simulated bigger simulation system sizes by adding C atoms in the bcc phase at 50 K. An example of defect configurations for these bigger simulation system sizes at 400 K during cooling is shown in
Figure 7a,b for Fe-0.25 at. %C composition. The defect configuration in this simulation system consists of parallel SF and TB, and intersecting SF and TB. This is a combination of defect configurations (i), (ii), and (iii) from the smaller simulation system sizes as shown in
Figure 1a–c. The atomic stresses at each of the defect configurations are same as that for smaller simulation system sizes.
Figure 7c shows the mean shear stresses,
, as a function of C addition. The error bars resulting from different C distributions at a particular C concentration and different defect configurations are also shown in this figure. For pure Fe, the error bars represent the variation of M
temperature and
values resulting from different defect configurations in the fcc phase that are formed because of the different initial velocity distributions of the atoms of bcc phase at 50 K. As seen in
Figure 7c, the mean value of
increases with C addition which decreases the M
temperature with C addition. This trend matches qualitatively with the smaller simulation system sizes consisting of individual defect configurations. The values of M
temperature and mean shear stresses are different than the smaller system sizes as bigger simulation system consists of different defect configurations and different C distributions. Albeit, the qualitative trend of C addition is same in smaller and bigger simulation systems, i.e., C addition increases
values and decreases M
temperature. This proves that the qualitative trend of the M
temperature vs mean shear stresses remains same for three factors: bigger simulation system sizes, addition of C in bcc phase, and relaxation of shape and volume of the simulation.
Although martensitic transformation is one of the most highly studied phenomena in the metals science, the atomistic processes governing the transformations are still overlooked partly because of the difficulty to obtain and process the atomistic information from the experiments or other simulation methods. Even less understood are the effect C addition on these mechanisms. This work presents the effects of C addition at the level of distinct atoms in the presence of pre-existing planar defects on the martensitic transformation. In this view, our work represents major contribution towards the role of C addition in Fe in the presence of pre-existing planar defects. In particular, the analysis of atomic shear stresses and potential energies in the presence of pre-existing planar defects is presented for the first time.


