Effect of Crowding Agent Polyethylene Glycol on Lyotropic Chromonic Liquid Crystal Phases of Disodium Cromoglycate


1
Advanced Materials and Liquid Crystal Institute, Chemical Physics Interdisciplinary Program, Kent State University, Kent, OH 44242, USA
2
Department of Physics, Kent State University, Kent, OH 44242, USA
*
Author to whom correspondence should be addressed.
Crystals 2019, 9(3), 160; https://0-doi-org.brum.beds.ac.uk/10.3390/cryst9030160
Submission received: 20 February 2019
/
Revised: 13 March 2019
/
Accepted: 15 March 2019
/
Published: 19 March 2019
(This article belongs to the Special Issue New Trends in Lyotropic Liquid Crystals)
Abstract
:Adding crowding agents such as polyethylene glycol (PEG) to lyotropic chromonic liquid crystals (LCLCs) formed by water dispersions of materials such as disodium cromoglicate (DSCG) leads to a phase separation of the isotropic phase and the ordered phase. This behavior resembles nanoscale condensation of DNAs but occurs at the microscale. The structure of condensed chromonic regions in crowded dispersions is not yet fully understood, in particular, it is not clear whether the condensed domains are in the nematic (N) or the columnar (C) state. In this study, we report on small angle X-ray scattering (SAXS) and wide-angle X-ray scattering (WAXS) measurements of mixtures of aqueous solutions of DSCG with PEG and compare results to measurements of aqueous solutions of pure DSCG. X-ray measurements demonstrate that addition of PEG to DSCG in the N phase triggers appearance of the C phase that coexists with the isotropic (I) phase. Within the coexisting region, the lateral distance between the columns of the chromonic aggregates decreases as the temperature is increased.
1. Introduction
Lyotropic Chromonic Liquid Crystals (LCLCs) are a class of liquid crystals in which the phase transitions are caused by both temperature changes as well as changes in concentration of a solute in a solvent [1,2,3,4]. They are formed by water-soluble rigid plank-like molecules with polyaromatic cores and polar peripheries [1,5]. Due to the hydrophilic nature of the peripheries and the hydrophobic nature of the core, LCLC molecules dispersed in water form elongated aggregates by stacking on top of each other, to avoid contact of water with the core. As the concentration of chromonic molecules is raised, the number and length of aggregates increase and one observes a transition from an isotropic dispersion to a uniaxial nematic phase with parallel alignment of the aggregates, followed by a formation of the columnar phase, in which the parallel aggregates pack into a two-dimensional hexagonal lattice [1,2,3,4,5]. Molecules capable of forming LCLCs often show interesting functionalities, such as pharmaceutical activity or light absorption in a certain spectral range [1,2,3,6]; chromonic type of aggregation is also met in aqueous dispersions of nucleic acids [7,8]. As compared to surfactant-based lyotropic liquid crystals, LCLCs are not toxic and can be successfully interfaced with biological cells [9,10].
LCLC aggregates show a striking similarity to the double-strand B-DNA molecules. For example, the chromonic molecules of disodium cromoglycate (DSCG) stack on top of each other with a typical separation of about 0.33–34 nm. When the polar groups of DSCG molecules are fully ionized, the line density of electric charge along the aggregate is 6/nm, where is the electron’s charge. Although the LCLC aggregates are not stabilized by any covalent bonds, these molecular scale similarities extend also to macroscopic behavior. It is known that neutral additives such as poly-ethylene glycol (PEG) can, in the presence of salt, condense and align macromolecular B-DNAs through the excluded volume effect [11,12,13,14]. Similar effects have been demonstrated for noncovalent assembly in chromonics, which can be controlled by adding neutral and weakly charged additives that crowd the solution [15,16,17]. In particular, crowding agents such as PEG were reported [15] to cause condensation of DSCG aggregates and phase separation into isotropic and ordered phases with nontrivial geometries of coexistence, such as toroids. Qualitatively, these results correlate with the theoretical models by Madden and Herzfeld [18,19] who predicted that the mixing of an aggregating chromonic with neutral nonaggregating spheres will result in the phase separation to a liquid crystalline state with a high concentration of chromonics and an isotropic (I) phase with a low concentration of chromonics and a high concentration of neutral-aggregating spheres. However, the experimental data on the structure of condensed LCLC regions in crowded dispersions remain scarce. In particular, it is not clear whether the crowding-induced phase separation produces a coexistence of the isotropic phase with a nematic (N), columnar hexagonal (C) phase, or both these phases; the result depends strongly on the concentration of ingredients and the temperature [15].
The concentration of DSCG, PEG and temperature define the shape of the phase-separated mesomorphic regions coexisting with the isotropic phase [15]. When a low (≤0.005 mol/kg) concentration of PEG is added to DSCG, the condensed regions appear in the form of tactoids, the interior of which is a nematic [20]. The interior order is of prime importance in defining the shape of phase-separated regions. In a nematic, the director specifying the local orientation of chromonic aggregates, can experience splay, twist, bend, and saddle-splay. As a result, the N tactoids show a spindle-like shape that results from a balance of anisotropic surface tension with all modes of the director distortions [20]. However, if the interior is a C phase with two-dimensional positional order, only the bend of is allowed by the requirement of columns’ equidistance, and the phase-separated inclusions adopt a very different toroidal shape [15]. The size of LCLC toroids is , nearly three orders of magnitude larger than the length scale of toroids found in DNA condensates. Because of their large size, C toroids can be studied in detail by optical microscopy [15,20], and are thus ideally suited to explore the equilibrium shape of the columnar nuclei from an isotropic environment, which is our long-term goal. However, optical studies cannot provide a direct insight into the interior ordering of the phase-separated regions, whether it is indeed a C or an N phase, perhaps close to the N-to-C phase transition. X-ray diffraction provides an excellent insight of this type for LCLCs [15,16,17,21,22]. The pioneering X-ray studies [15] reported a clear columnar hexagonal ordering when the concentrations of PEG added to DSCG was in the range . At smaller , the optical and X-ray studies could not distinguish well between the N + I coexistence and C + N + I coexistence [15]. The goal of the present work is to explore by X-ray diffraction what kind of molecular ordering is triggered by weak concentrations of PEG, and , and how this ordering depends on temperature. Furthermore, we compare the behavior of PEG-condensed phases of DSCG with the highly condensed phases of an additive-free DSCG and present the structural characteristics such as inter-and intra-aggregate separations of molecules for concentrations of DSCG that exceeds the range previously studied by Agra-Koojiman et al. [21].
2. Materials and Methods
We performed the X-ray studies of mixtures of electrically neutral polymer PEG (purchased from Sigma Aldrich, St. Louis, MO, United States, molecular weight 3.35 kg/mol) and DSCG of purity 98% (purchased from Alfa Aesar, Tewksbury, MA, United States) for two different concentrations of PEG (0.011 and 0.022 mol/kg, or 3.5 and 7 wt%, respectively). PEG of a molecular weight of 3350 g/mol was chosen because it was previously reported to cause condensation of DSCG aggregates [15,20], whereas PEG of a lower (0.60–1.50 kg/mol) molecular weight is known to produce no condensing effects on LCLCs [23]. In the experiments with PEG, the concentration of DSCG in de-ionized water (with resistivity of ≥) was fixed at or 15 wt %; at this concentration, DSCG forms a nematic phase. PEG is known to be a crowding agent that causes aqueous DSCG solutions to phase separate into an isotropic phase and an ordered phase, such as a nematic or columnar. Since PEG partitions into the isotropic regions, it causes condensation of the ordered regions, which contain higher concentrations of DSCG as compared to the original solution [15,18,19]. In order to perform a comparative analysis of the PEG-induced condensation and the effect of a simple increase of DSCG concentration, we also explored aqueous solutions of pure DSCG, at three different concentrations ( or , respectively). This range extends the prior studies of pure DSCG dispersions in water reported by Agra-Kooijman et al. [21] for .
About thirty-six hours prior to the X-ray measurements, DSCG mixtures were filled in 2 mm inner-diameter quartz capillaries in the isotropic phase, sealed with epoxy, and mounted into a custom-built aluminum cassette which was fit into a hot stage (Instec model HCS402) with an accuracy better than 0.01 °C. Experiments were performed at Brookhaven National Laboratory (11-BM CMS). The beamline was configured for a collimated X-ray beam of size 0.2 mm by 0.2 mm and a divergence of 0.1 mrad by 0.1 mrad with energy of 17 keV. The background scattering was collected from an empty capillary and the sample-to-detector distance was calibrated using a silver behenate calibration standard.
The optical textures of the samples were obtained by sandwiching the material between two glass slides separated by 20 µm spacers, sealing all four sides of the cell using epoxy to prevent evaporation, placing them inside a hot stage (Linkam model PE94) and making observations under an optical microscope with two crossed linear polarizers, upon cooling the sample from the isotropic phase at 0.1 °C/min.
3. Results and Discussions
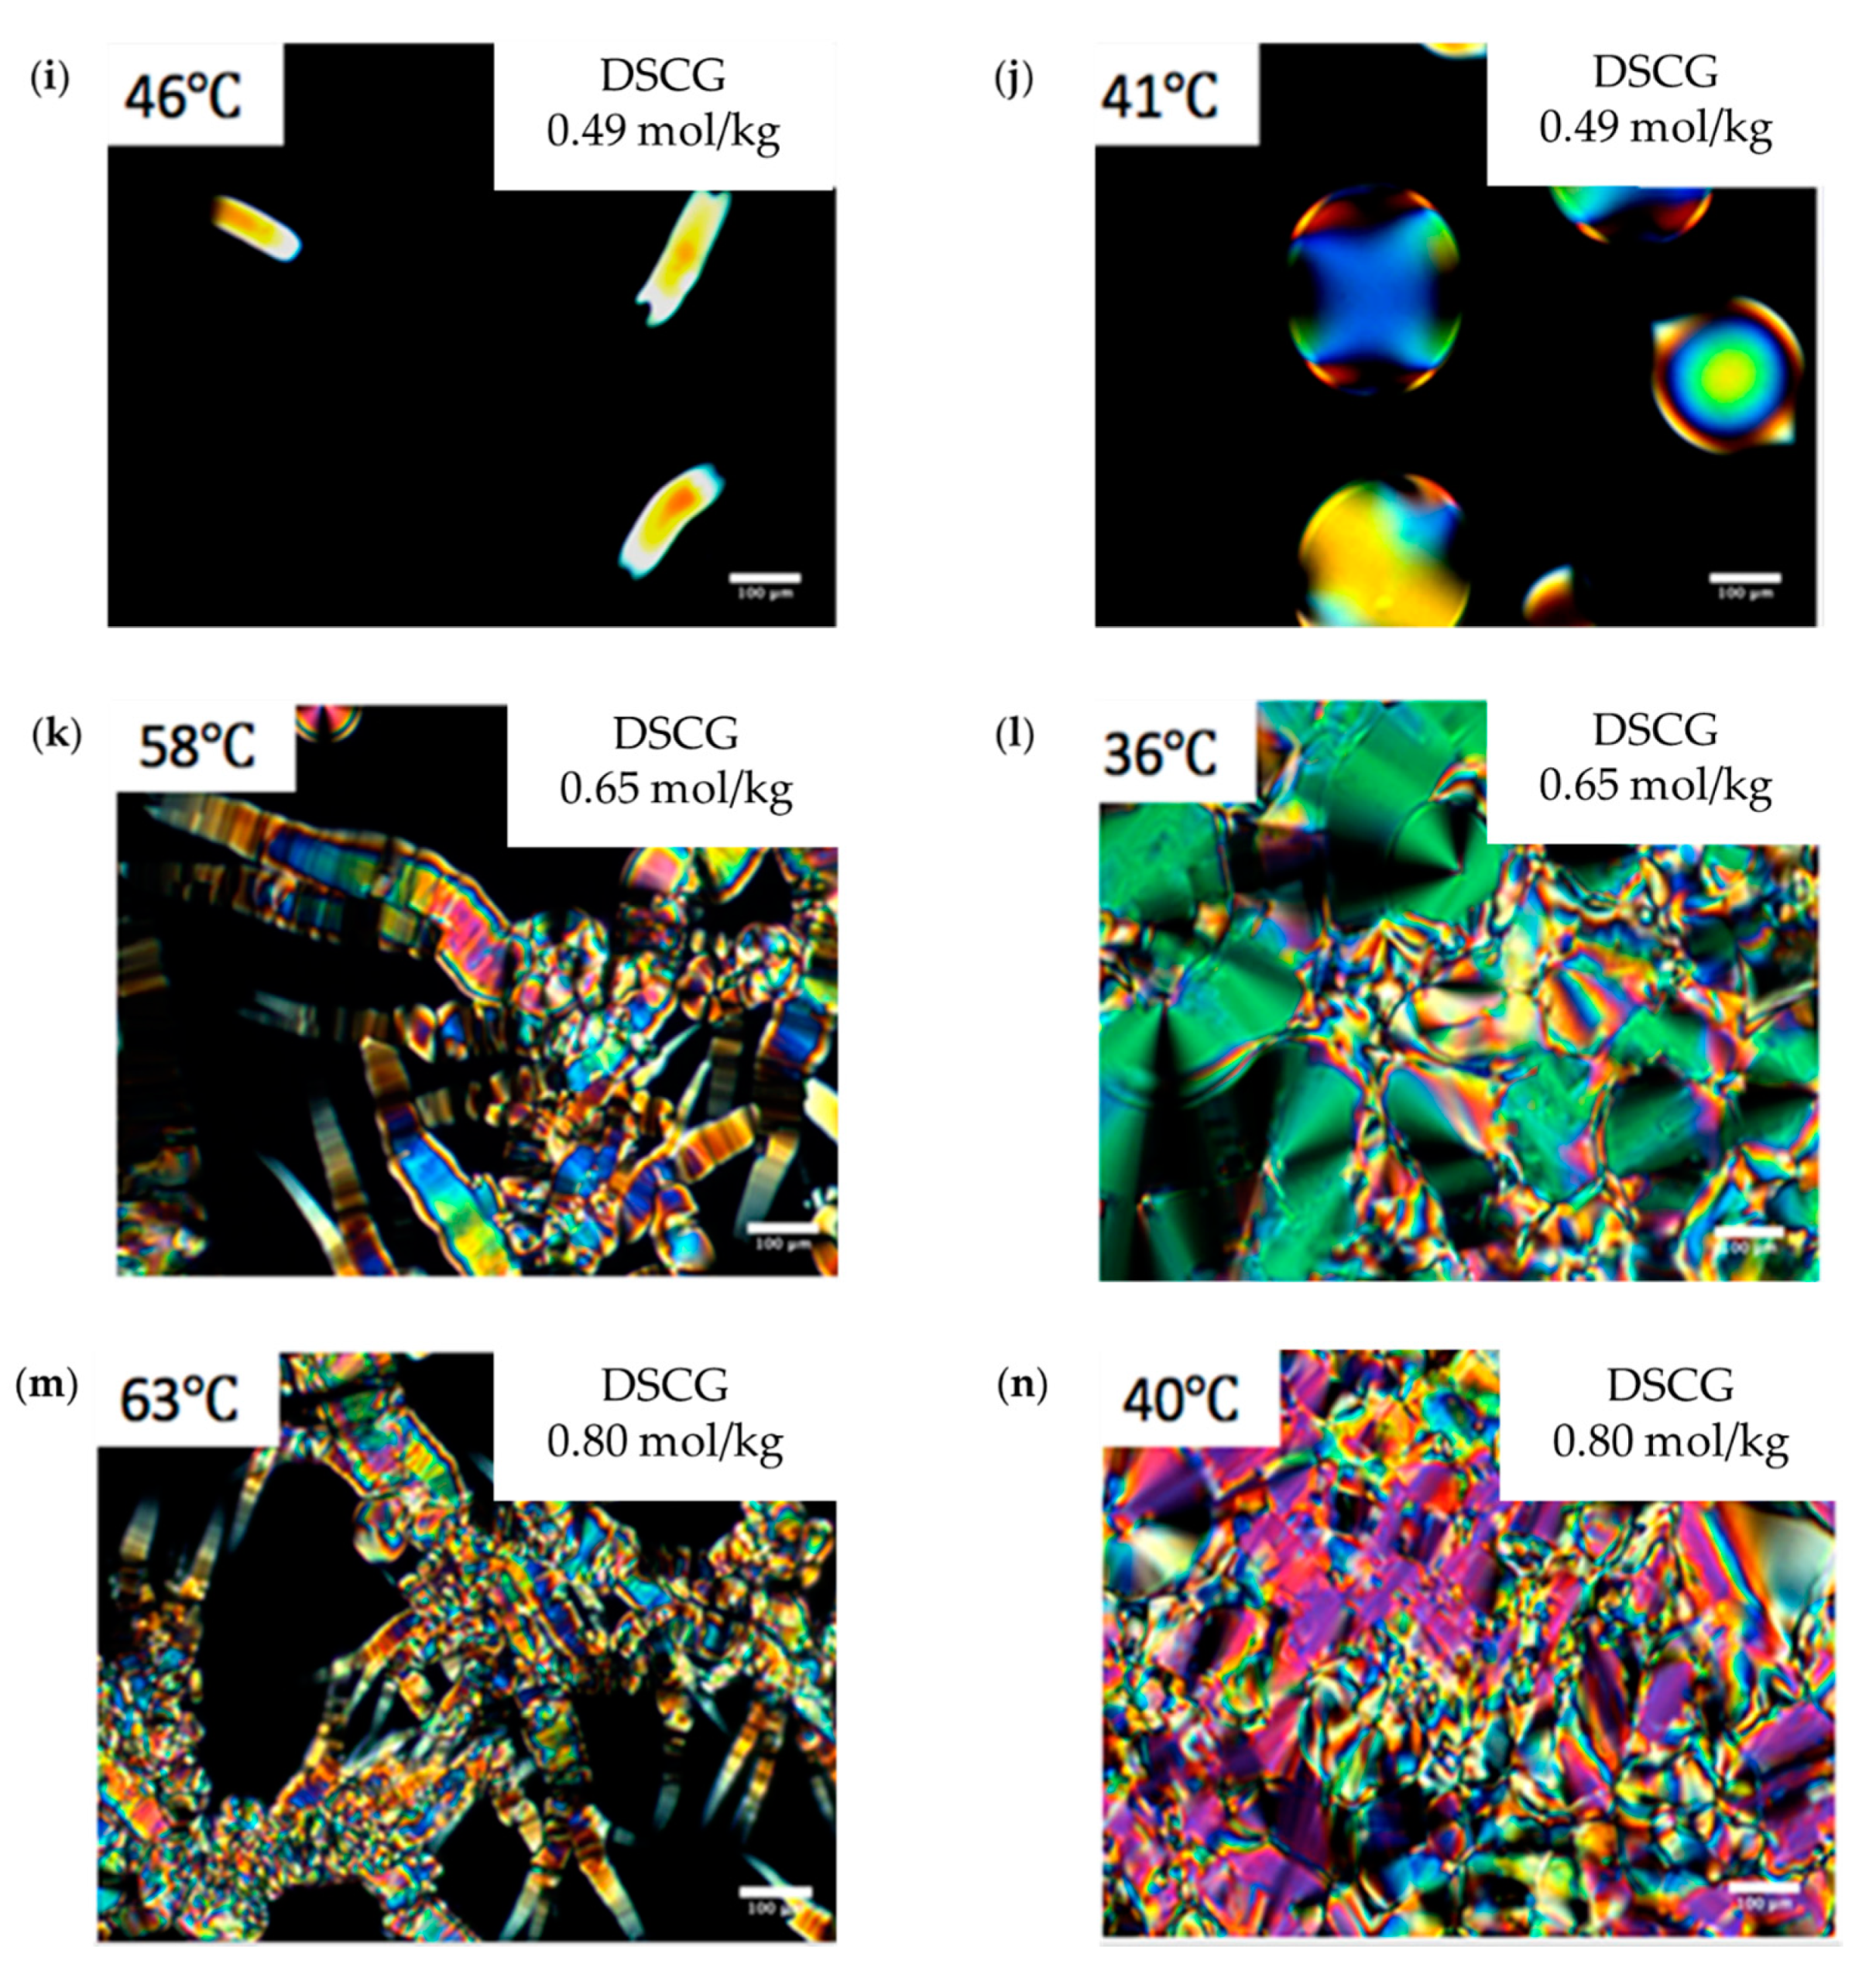
In order to perform preliminary characterization of the explored mixtures, we used polarizing microscopy. The phase diagrams of aqueous solutions of the DSCG (0.34 mol/kg) + PEG mixtures and pure DSCG mixtures established by polarizing microscopy upon cooling, are shown in Figure 1a,b, respectively. Figure 1c–h show the optical textures of all mixtures, taken at different temperatures. For 0.49 mol/kg, 0.65 mol/kg, and 0.80 mol/kg DSCG solutions, cooling from the I phase results first in the formation of the biphasic I + C region, see, for example, Figure 1i, T = 46 °C. Further cooling produces either an I + N coexistence, Figure 1j, 0.49 mol/kg, T = 41 °C, or C + N coexistence, Figure 1l, T = 36 °C.
The I phase appears under the crossed polarizers as a dark region, while the coexisting N and C phases show birefringent textures with different arrangements of the optic axis which is also the director. The C phase that coexists with the I phase forms elongated inclusions, with the optic axis along the direction of elongation, see Figure 1k, T = 58 °C and Figure 1m, T = 63 °C, as the interfacial tension is not strong enough to overcome bulk elasticity and to make the C inclusions more compact. When the volume fraction of the C phase is large, as in Figure 1l, T = 36 °C, one observes characteristic textures of the so-called developable domains, in which the director experiences bend deformations but no splay nor twist. The reason is in the two-dimensional periodic order of the columnar structure; the requirement of inter-columnar equidistance prohibits splay and twist but allows bend [24]. In 0.49 mol/kg solution, cooling from the I + C state results in a formation of the I + N coexistence, Figure 1j, T = 41 °C, with compact inclusions of the N phase, called tactoids. Tactoids exhibit characteristic cusps at the two poles [15,25,26]. As discussed by van der Schoot [27,28,29] and others [25,30,31], the shape of N tactoids is a result of fine balance of the bulk elasticity that permits splay, bend, and twist deformations of the director, and an anisotropic interfacial tension that tends to align the chromonic aggregates parallel to the I–N interface.
The I + C coexistence region is narrow, less than 5 °C, for 0.49 mol/kg DSCG solution, but expands as the concentration of DSCG increases, Figure 1b. In 0.34 mol/kg DSCG without any PEG, the C phase does not form; as the solution is cooled down, we observe nucleation of the N phase from the I phase. The coexistence I + N region transforms into the homogeneous N phase around room temperature. Polarizing microscopy textures in Figure 1c suggest that addition of PEG to 0.34 mol/kg DSCG causes the appearance of the C phase in coexistence with the I phase. To prove the appearance of the C phase and to characterize its structure in terms of symmetry and distance between the chromonic aggregates, we turn to small-angle-X-ray scattering (SAXS, using SAXS detector Pilatus 2M from Dectris at Brookhaven National Laboratory, Upton, NY, United States) and wide-angle-X-ray scattering (WAXS, using WAXS detector ImageStar 135 mm CCD from Photonic Science at Brookhaven National Laboratory, Upton, NY, United States) studies.
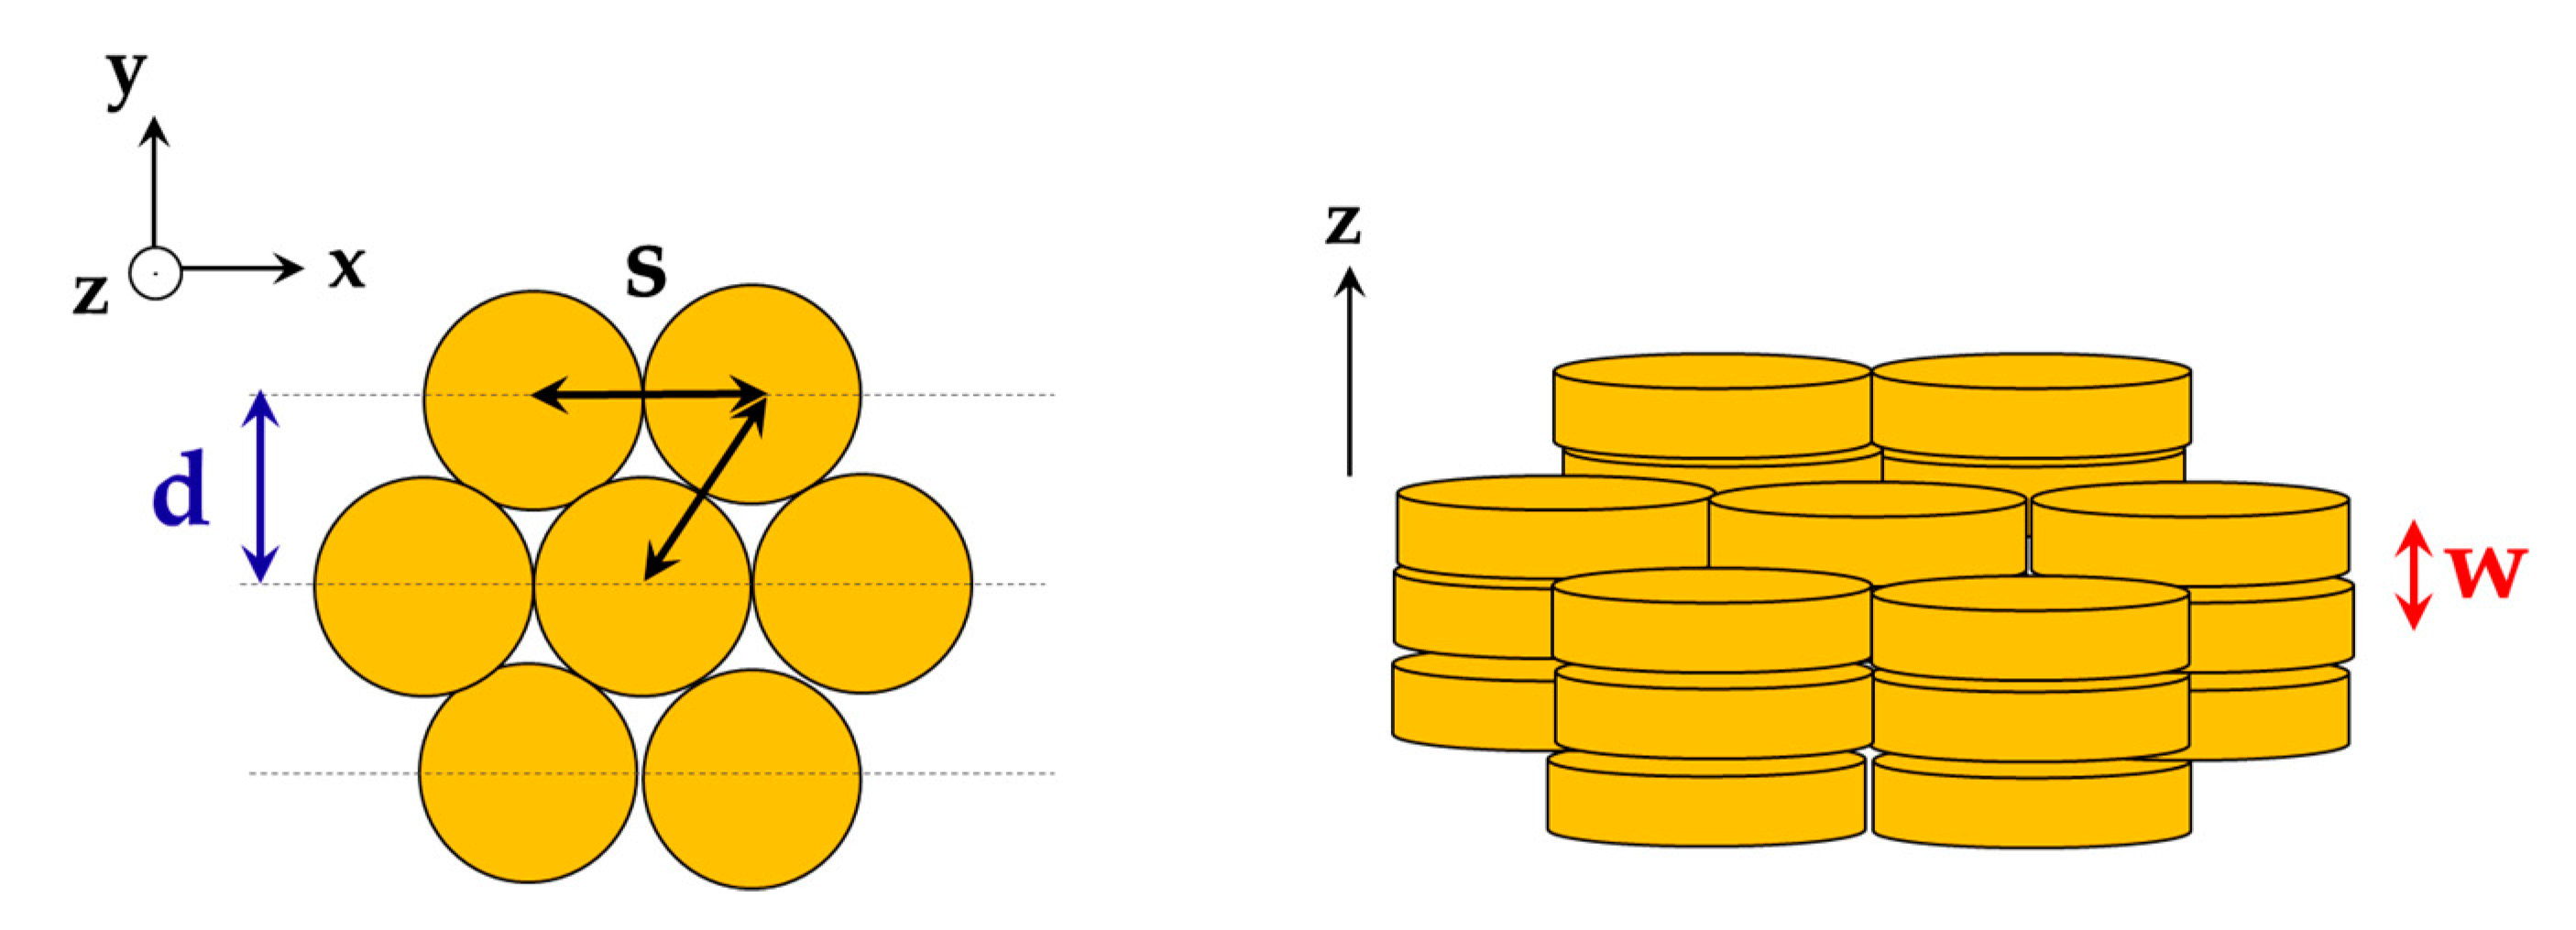
The structure of the phase can be determined by the position of the peaks obtained from SAXS and WAXS. For a columnar phase with hexagonal packing, the position of the peaks should obey the ratio [32,33]. The lateral distance , the distance between the centers of neighboring columnar stacks , and the stacking distance are defined as shown in Figure 2. Parameter can be obtained from WAXS, and parameters and can be obtained from the position of the first peak from SAXS:
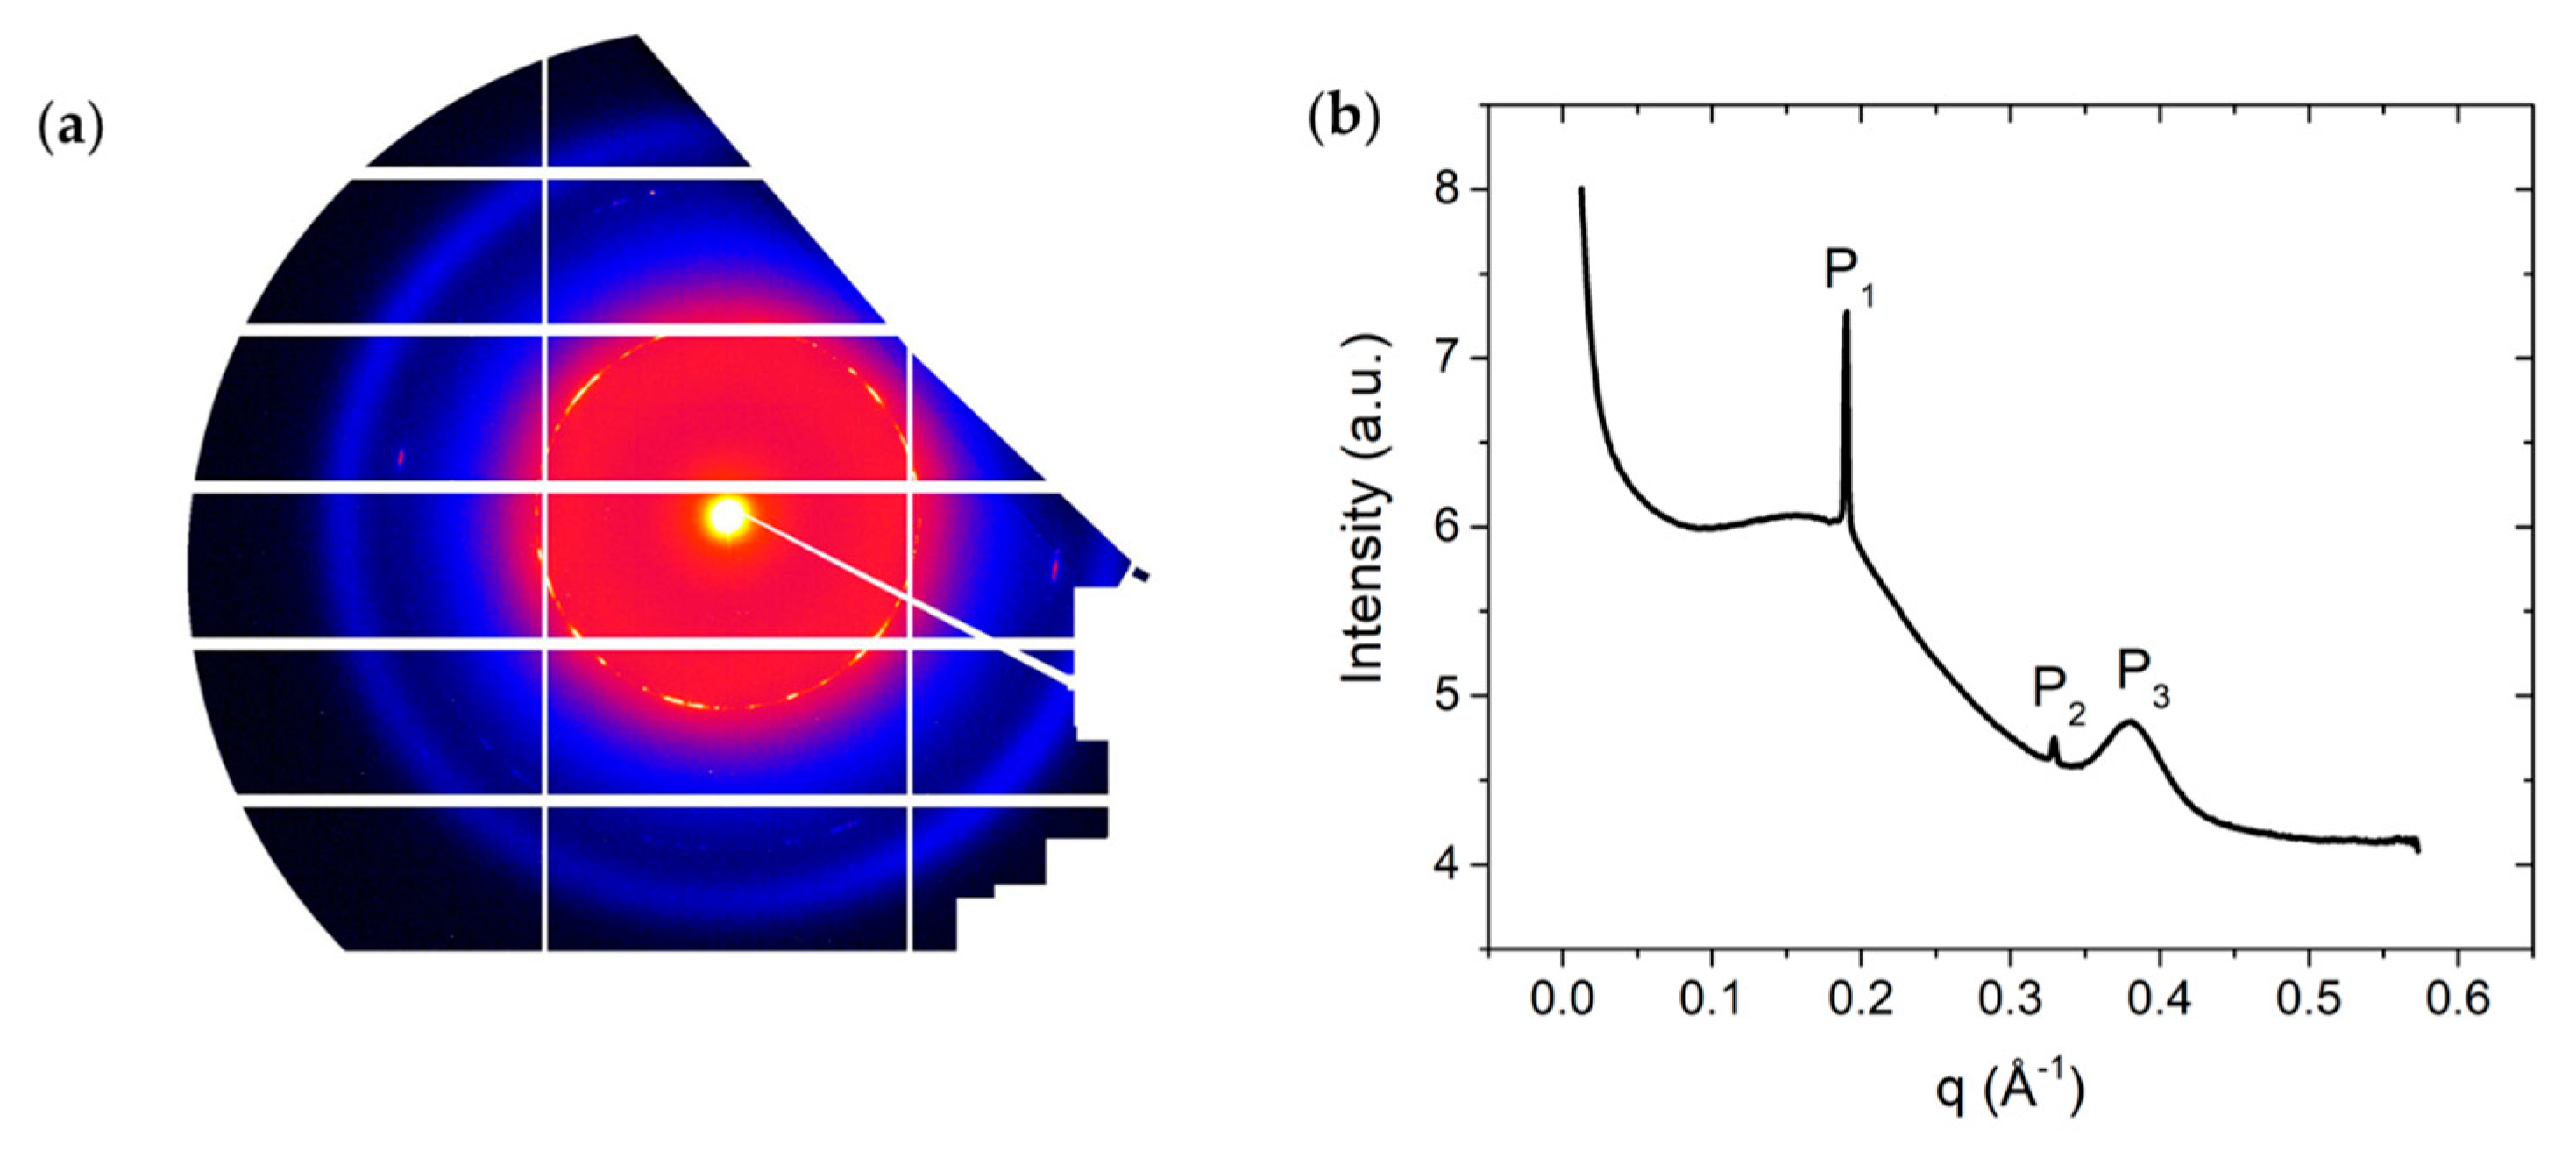
X-ray diffraction patterns for DSCG (0.34 mol/kg) + PEG (0.011 mol/kg) mixture confirm the phase diagram assignments shown in Figure 1a. In particular, at high temperature, , the material exhibits three strong reflexes, located at and , and . Peaks and correspond to the lateral spacings and respectively. The peak corresponds to Kapton reflexes and does not characterize the DSCG structure. The ratio of the position of peaks and is , thereby indicating the existence of the C phase. There is a broad peak to the left shoulder of peak , located around . This indicates the coexistence of the I phase with the C phase, confirming phase separation that is caused as a result of the addition of PEG to DSCG.
In WAXS diffraction patterns at , Figure 3c,d, there is a peak positioned at , from which we can get the stacking distance .
Upon further cooling down the mixture to , the diffraction pattern changes, Figure 5e,f, and there are two strong reflexes, located at and (due to Kapton). The peak corresponds to the lateral spacing . Peak is broad compared to peak and indicates the existence of the N phase. The change in temperature does not affect the stacking distance . Based on WAXS diffraction patterns at , Figure 3g,h, there is a peak located at , corresponding to the stacking distance .
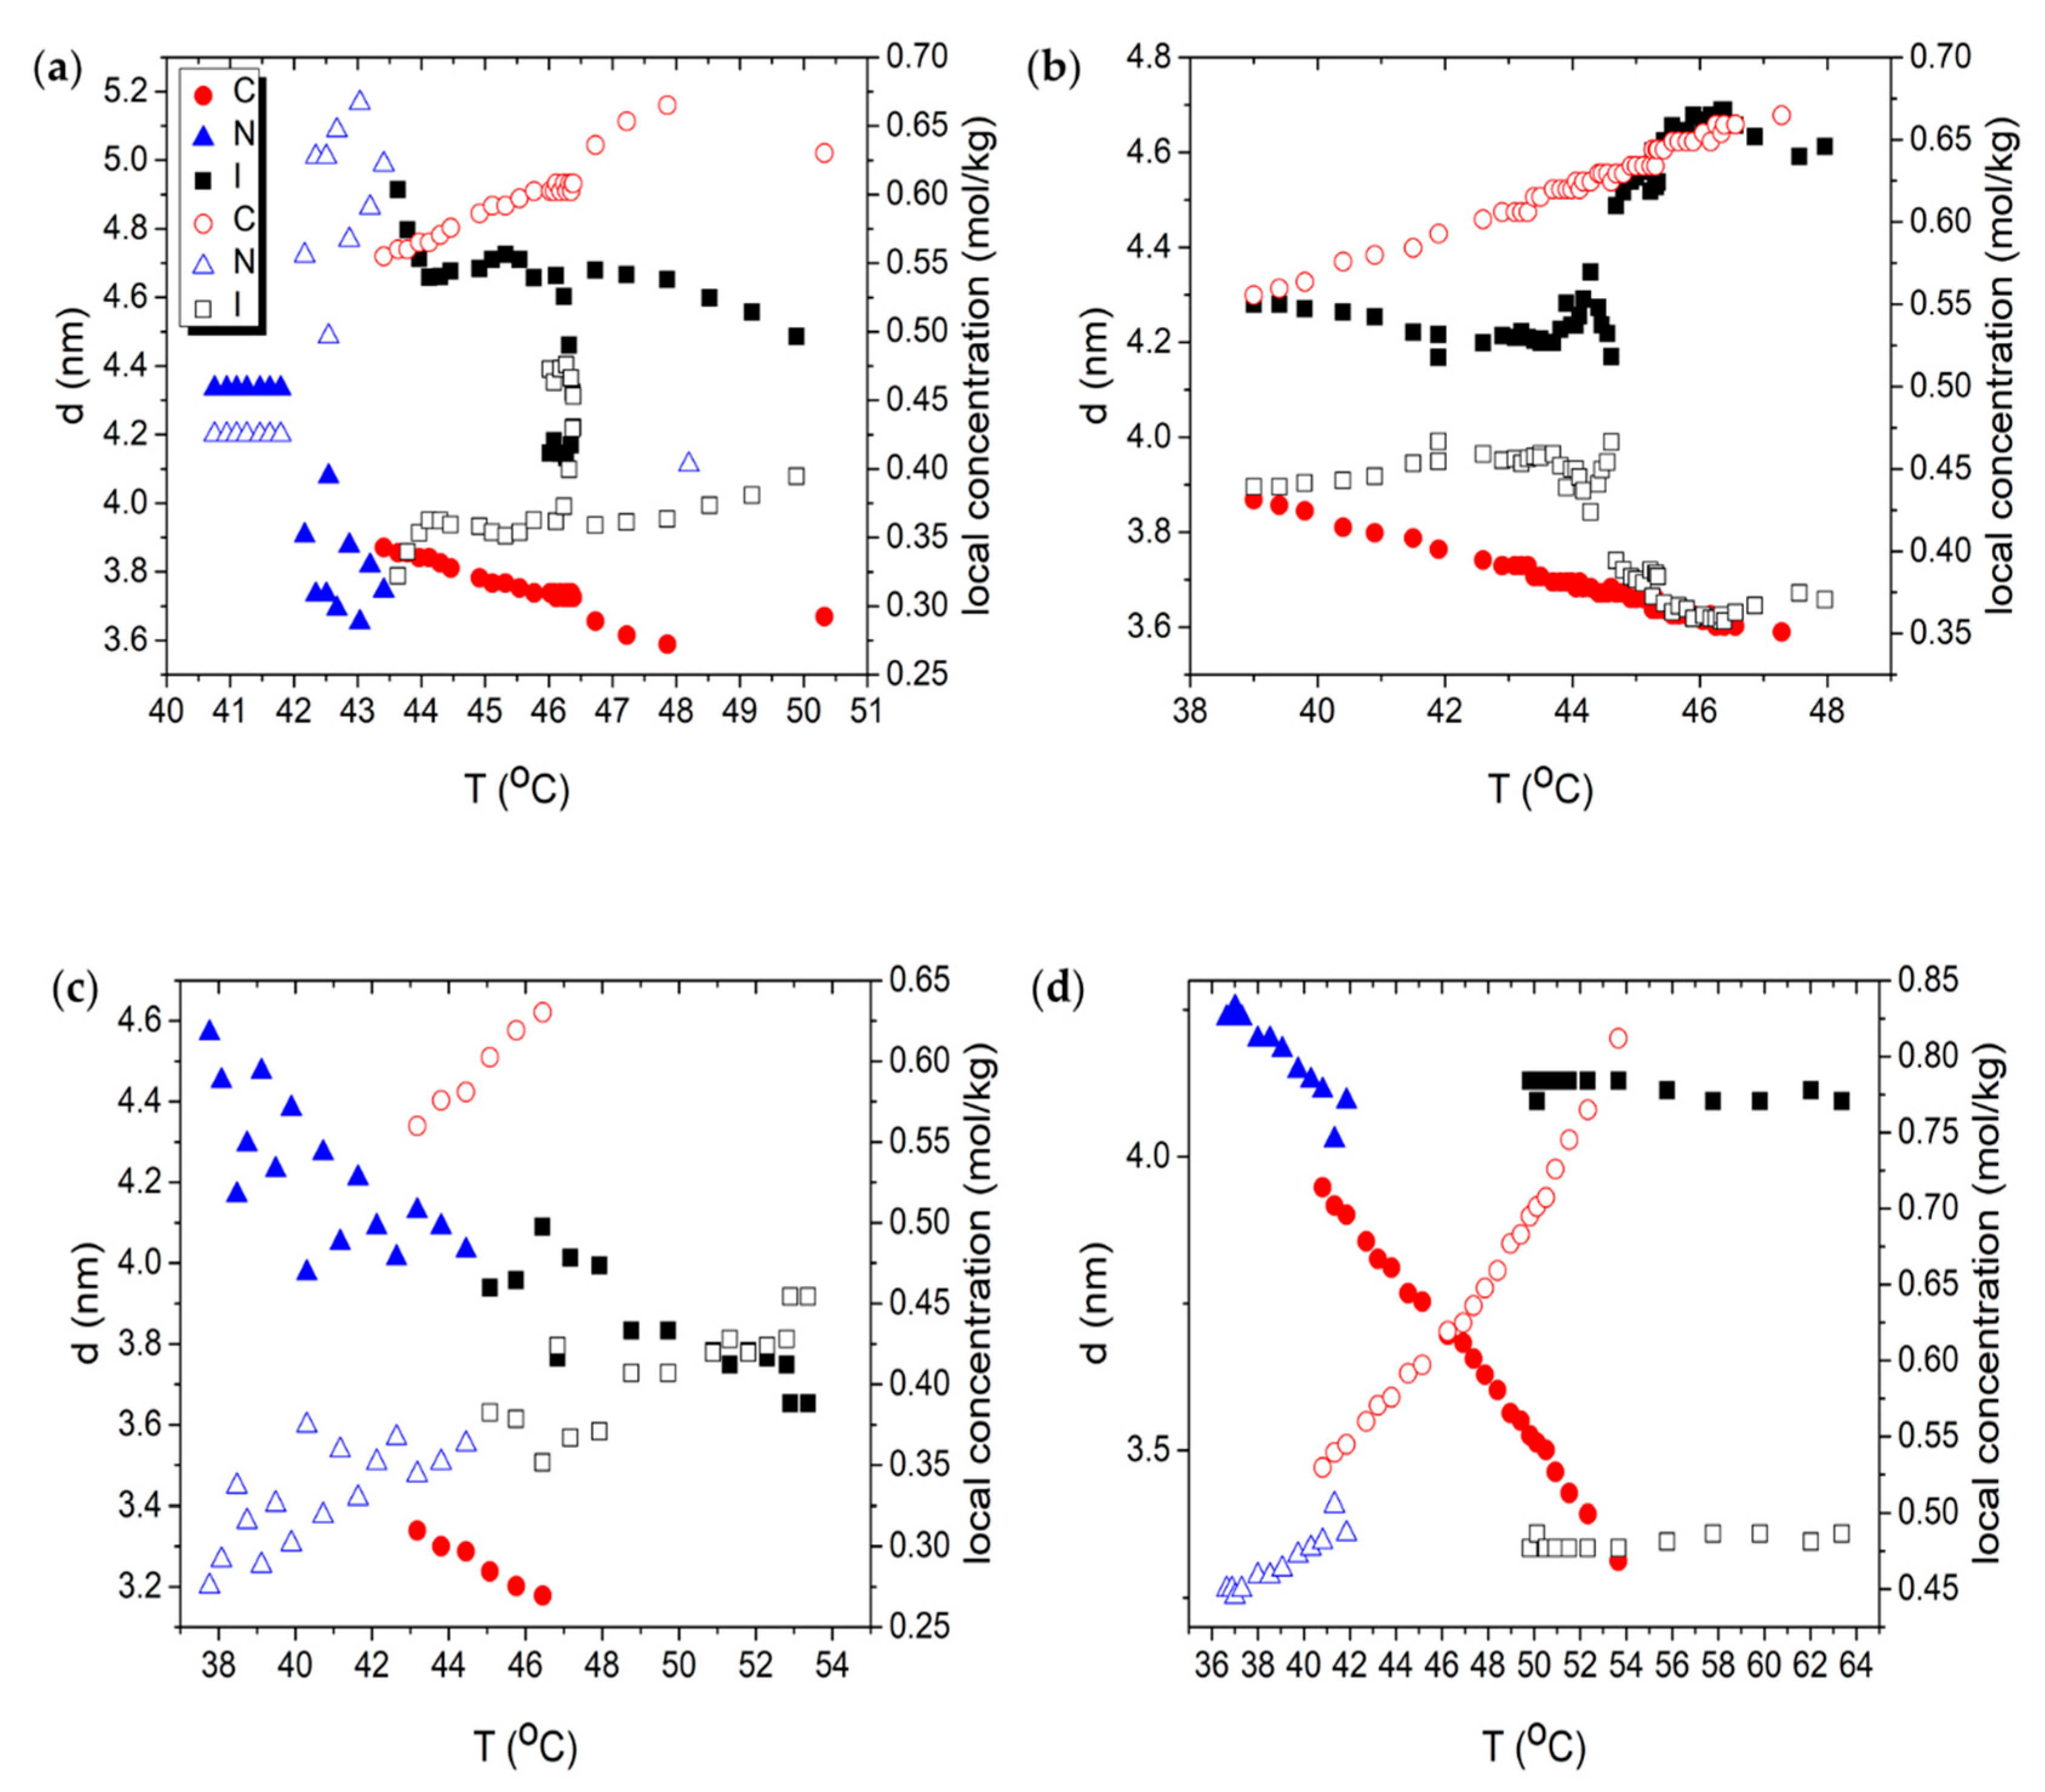
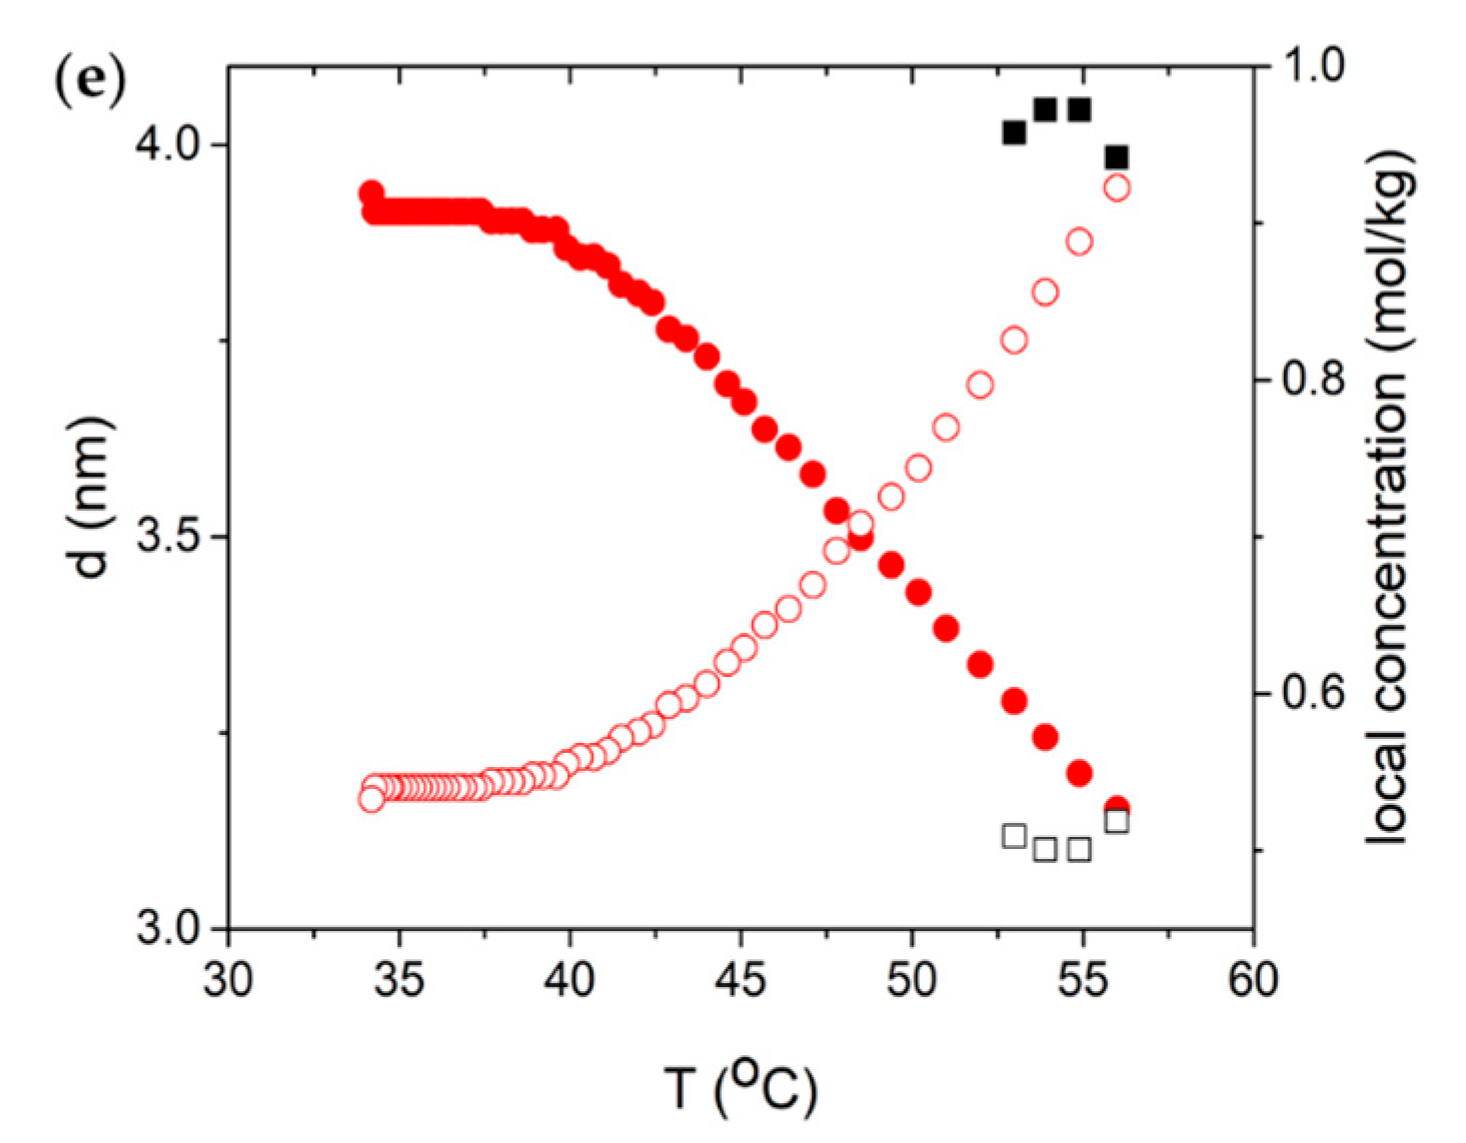
Based on SAXS measurements, we obtain the temperature dependences of the lateral distance (nm, closed symbols) as well as the local concentration (mol/kg, open symbols) for different mixtures, as shown in Figure 4. was estimated from the following relation [34,35]
where nm is the diameter of the columns [35], kg/mol is the molecular weight of DSCG, is the density of pure DSCG [35], and is the density of water at room temperature.
Adding PEG into 15 wt% DSCG results in the appearance of the C phase, Figure 4a,b, which would not occur without the presence of PEG. This agrees with the phase diagram obtained from polarizing microscopy, shown in Figure 1a. Furthermore, there is a sudden drop in the lateral distance when the mixtures transition from the I phase to the C phase, because the columns pack closely together via hexagonal packing in the C phase. Note that grows as the temperature is decreased. This counterintuitive behavior might be related to restructuring of the molecular stacking in the aggregates, or counterionic clouds surrounding them, or both. Although the mechanism is not clear, we note that Agra-Kooijman et al. found a similar trend for DSCG 15 wt%, 20 wt%, and 25 wt% dispersions [21].
The difference between the calculated local concentration mol/kg and the actual concentration of DSCG comes from the inhomogeneity of the liquid crystalline materials in the aqueous solution of DSCG. Adding PEG to 0.34 mol/kg DSCG also raises from 0.34 mol/kg, the initial concentration of DSCG contained in the mixture, to values in the range of 0.55 mol/kg to 0.76 mol/kg, Figure 4a,b.
The comparison of the stacking distance and lateral distance in the C phase at for all mixtures is shown in Table 1. The increase in the concentration of PEG from 0.011 mol/kg to 0.022 mol/kg results in closer packing of columns, which is accompanied by a slight decrease in . , on the other hand, remains more or less constant for all mixtures. The values of and for 0.34 mol/kg DSCG and 0.80 mol/kg DSCG have been reported previously [22], and the values we found show close resemblance to previously reported values.
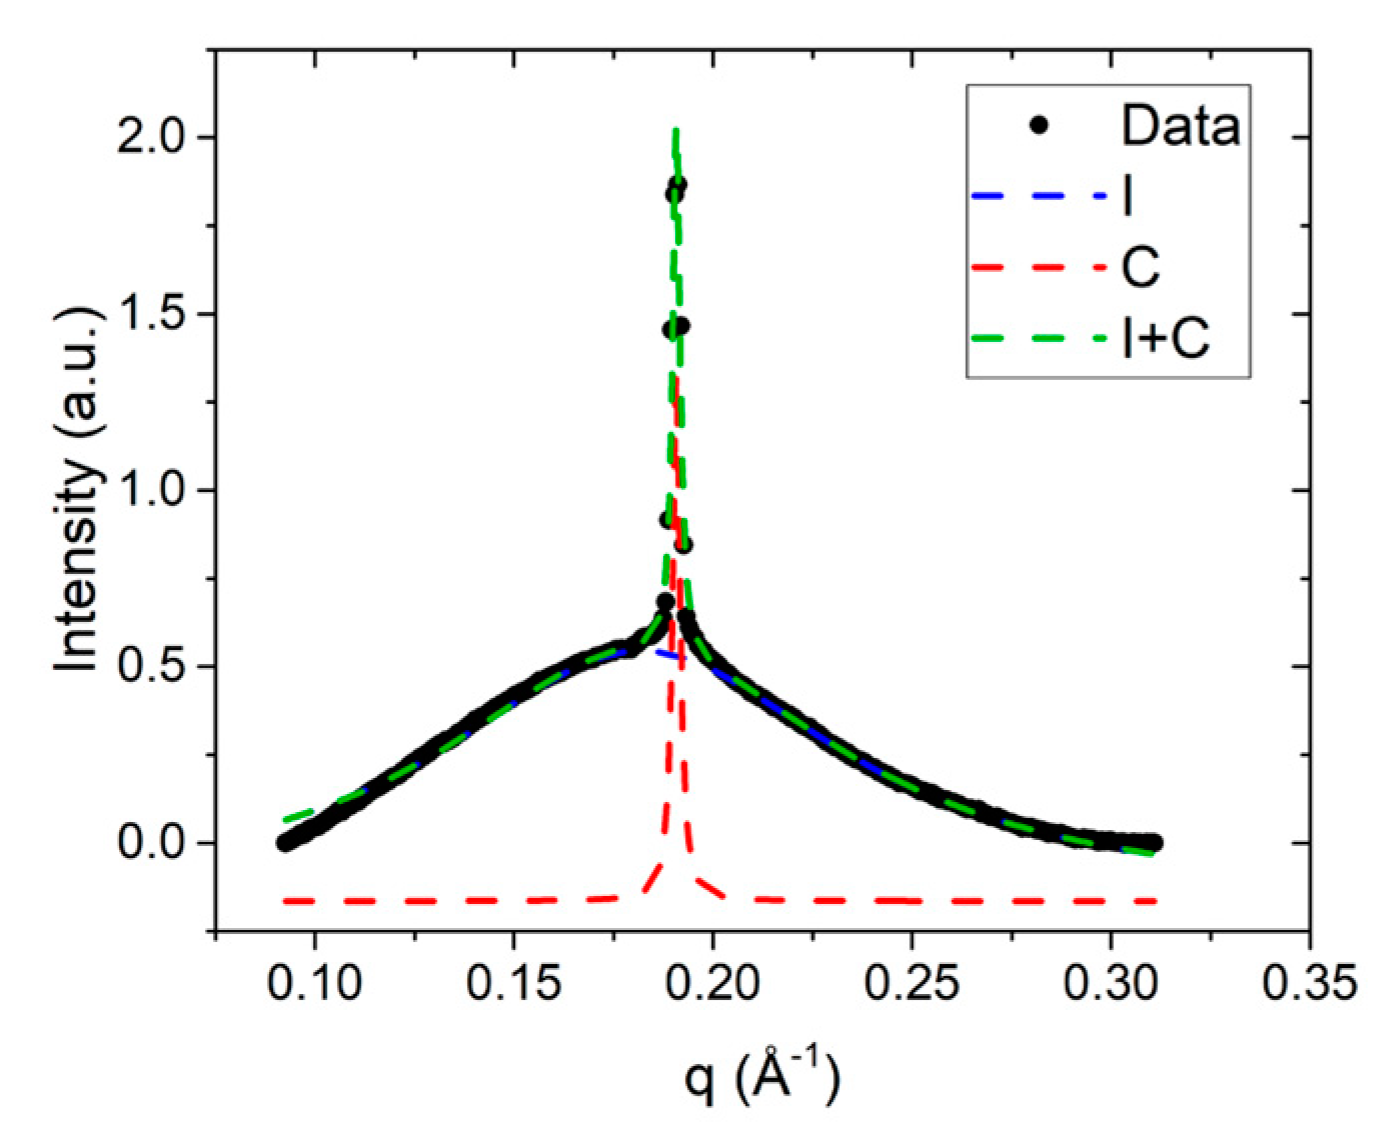
Small angle diffraction, or SAXS, is used to measure the average distance between the columnar aggregates. Hence, the full width at half maximum (FWHM) of the SAXS peak is used to determine the correlation length associated with interaggregate distances, . The FWHM were determined by fitting the corresponding diffraction peak to a sum of Lorentzian peaks, as shown in Figure 5 for the DSCG 0.34 mol/kg + PEG 0.011 mol/kg mixture at . The entire peak can be fit well by the linear sum of two Lorentzian peaks corresponding to the I phase and C phase, thereby confirming the coexistence of these two phases at this temperature.
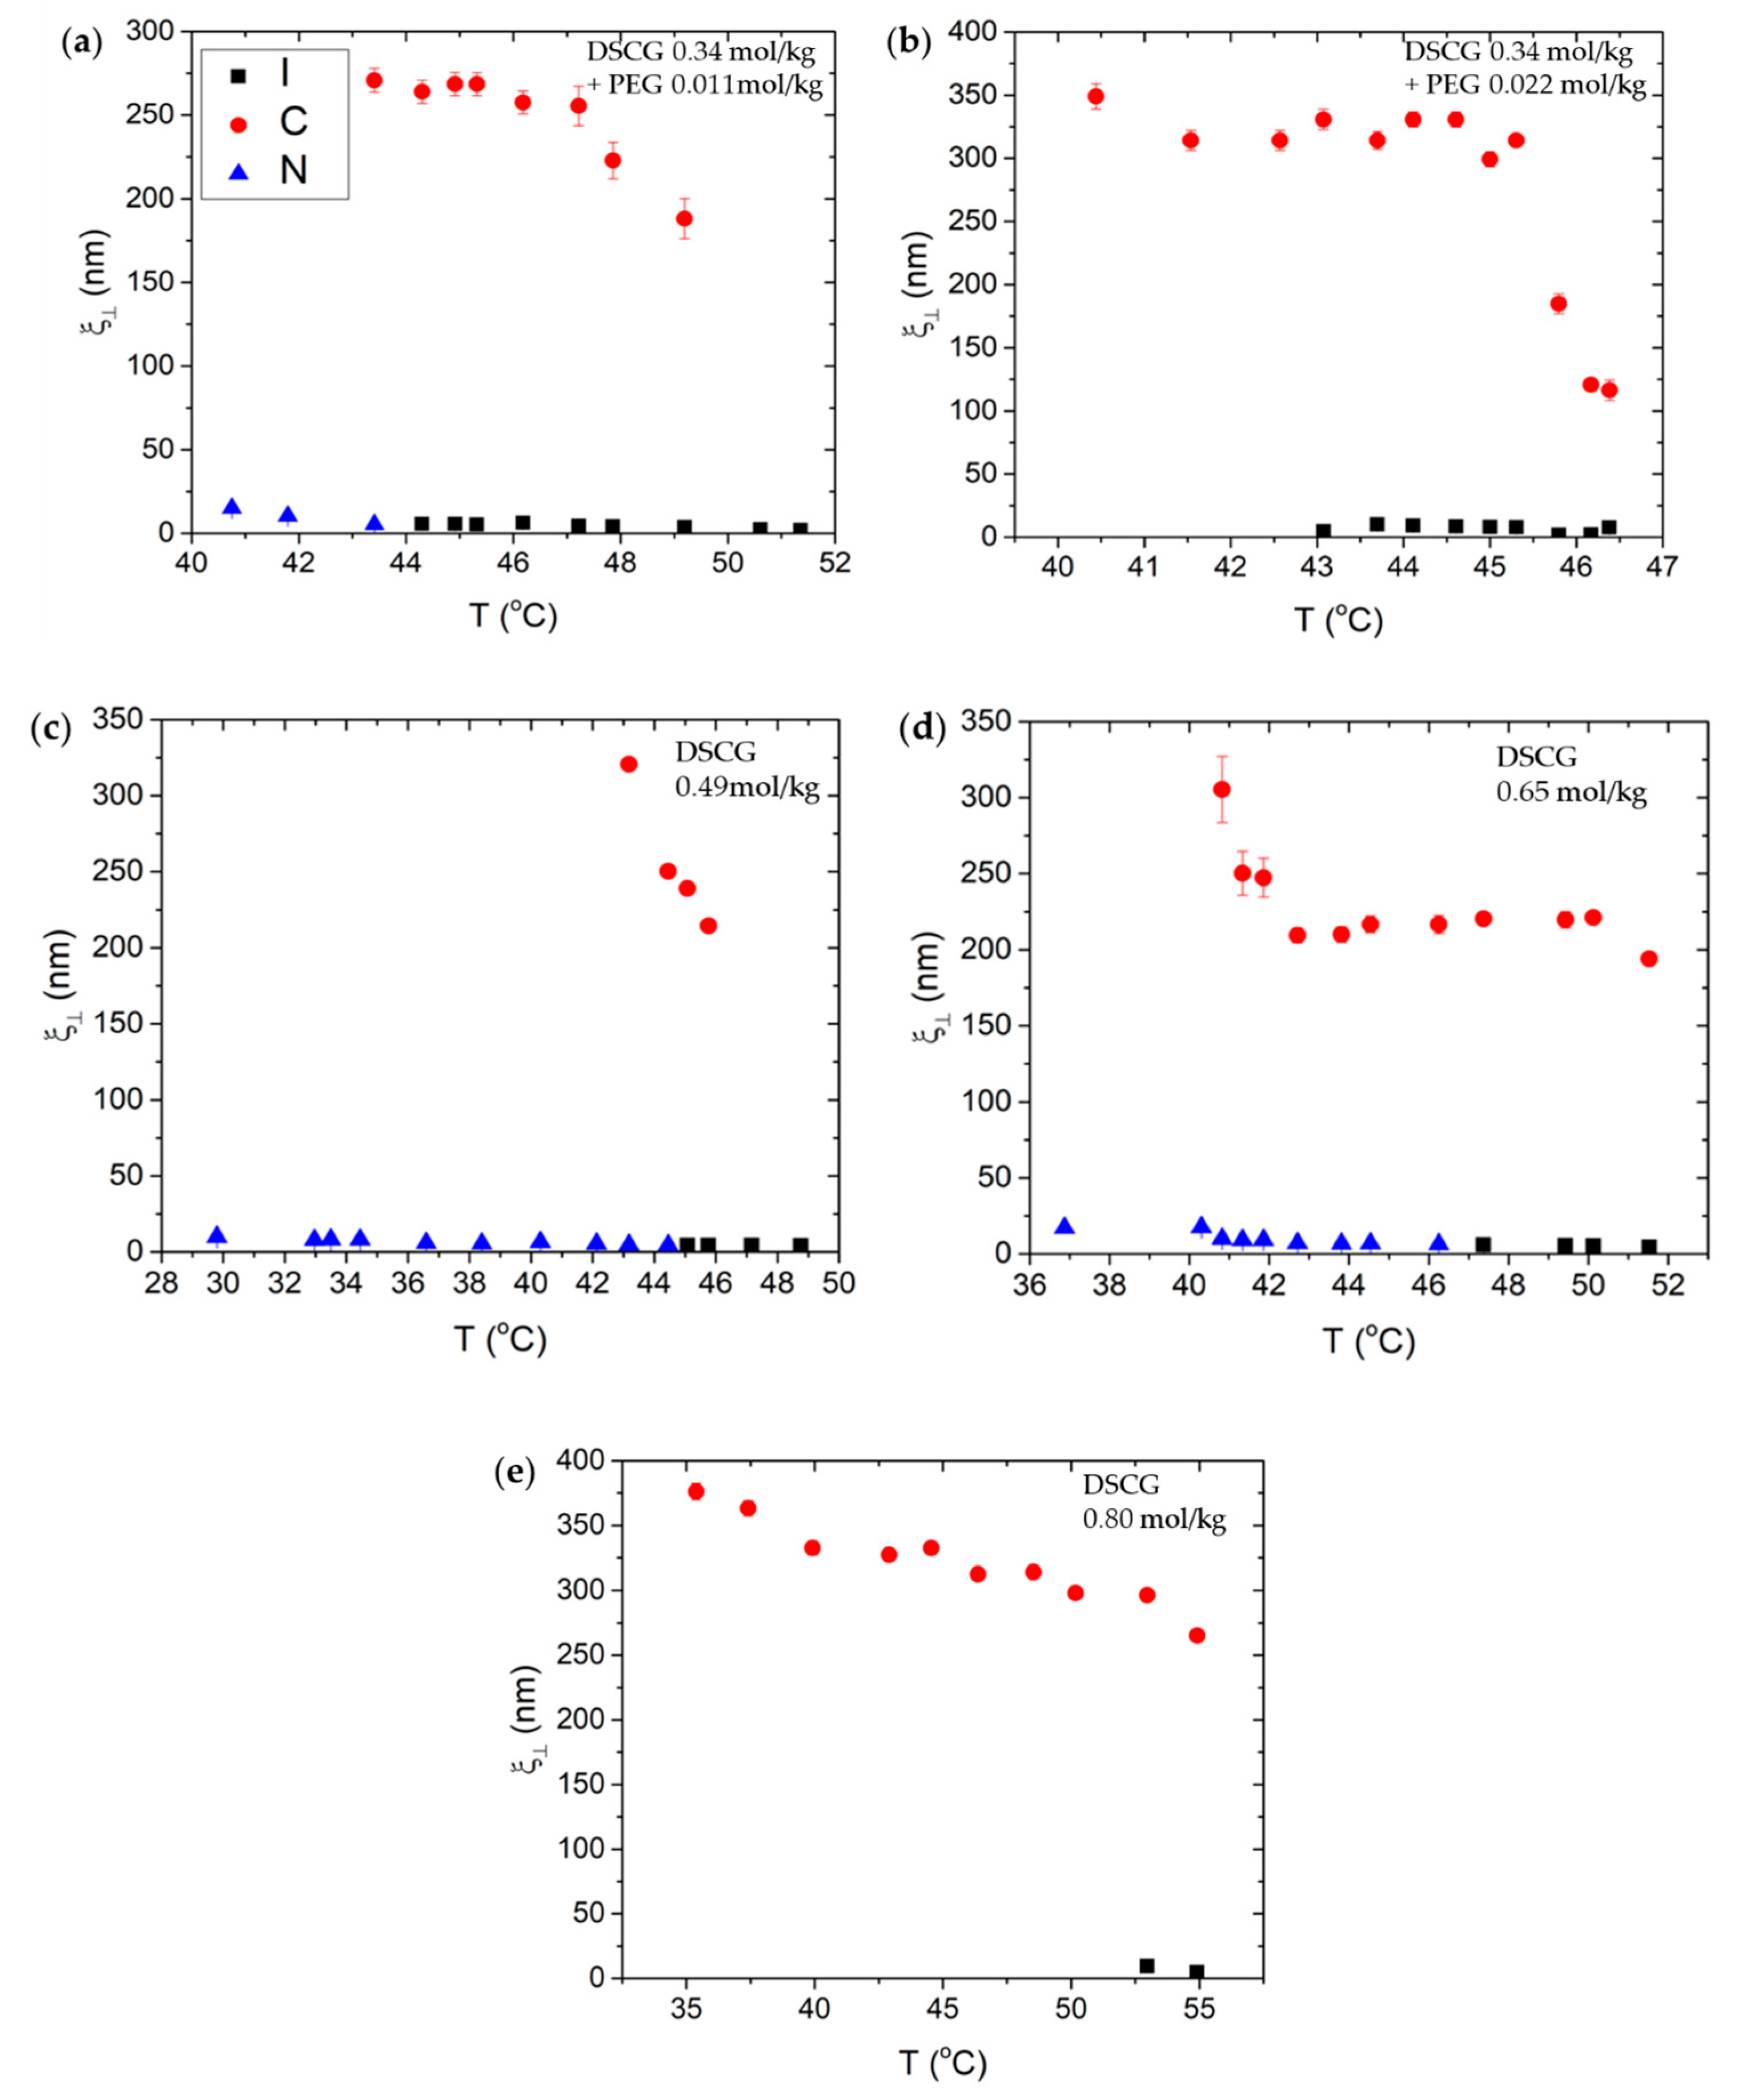
Figure 6 shows the temperature dependences of for all mixtures. The value of in the C phase is significantly higher than that in the N phase, by more than an order of magnitude, Figure 6, because of positional order in hexagonal packing of the columns. For all mixtures, increases as the temperature is decreased, which might be related with the decreased distance between the DSCG aggregates, and with an increased stiffness of the aggregates at lower temperatures. For DSCG 0.34 mol/kg + PEG 0.011 mol/kg and DSCG 0.34 mol/kg + PEG 0.022 mol/kg mixtures, increases rather quickly soon after the appearance of the C + I condensed phase until it saturates and becomes more or less temperature independent. The saturated value of in the condensed I + C regions is higher for the mixture containing a higher concentration of PEG; for DSCG 0.34 mol/kg + PEG 0.022 mol/kg mixture, nm, Figure 6b, whereas for DSCG 0.34 mol/kg + PEG 0.011 mol/kg mixture, nm, Figure 6a.
Note that although in the N phase is more than an order of magnitude smaller than in the C phase, it still takes nonzero values that are slightly greater than in the I phase. For example, for DSCG 0.34 mol/kg + PEG 0.011 mol/kg mixture, nm, and for DSCG 0.49 mol/kg, nm. These values might be indicative of pre-transitional fluctuations.
Similarly, the FWHM of large angle diffraction, or WAXS, is used to determine the correlation length of stacking along the aggregate axis. Figure 7 shows the temperature dependences of for all mixtures.
Here, is associated with the short scale correlated stacking of molecules along the aggregates, and does not give the actual contour length L of the entire aggregate [17]. This implies that obtained from X-ray measurements might be smaller than the actual length of stacking, due to stacking defects such as molecular shift junctions, as suggested by Park et al. [17]. Indeed, if we assume that and take the diameter of stacks as 1.6 nm to calculate the ratio of the length and width for, say, 0.49 mol/kg DSCG mixture at , we find . If we multiply this value of by the volume fraction where [17]:
We obtain . Here, mol/kg is the concentration of DSCG solution in molality units and kg/mol is the molecular weight of DSCG. This value of is much smaller than the critical value estimated by the Onsager theory [36] for a monodisperse system of rigid rods to obtain orientational order and form the N phase. Thus, at this value of , the system should not have any orientational order unless is of a much greater value. However, our experimental data clearly show the existence of the N phase at this temperature for this concentration, Figure 1b,c. This discrepancy confirms that is smaller than .
The most plausible reason for to be smaller than the actual aggregate length is the existence of structural defects—stacking faults that interrupt positional correlations along the aggregates’ long axes. These stacking faults were proposed by Park et al. [17], to explain a discrepancy between the length of chromonic aggregates expected within the framework of the Onsager theory and the length inferred from X-ray diffraction. The defects can be in the shape of shift junctions (in a shape of a letter “C”) and 3-fold Y junctions, and have been shown to contribute to the dynamic light scattering at DSCG-based LCLCs by Zhou et al. [37]. They are also evident in numerical simulations by Sidky and Whitmer [38]. Finally, NMR data and numerical simulations by Xiao et al. [39] demonstrated that similar shift junctions can be observed in another LCLC Sunset Yellow; the authors concluded that the shift junctions lead to the underestimated length of the chromonic aggregates by X-ray scattering; Y-junctions were found to be of a transient nature, devolving in pairs of disconnected stacks.
In the I + C coexistence region, increases as the concentration of pure DSCG is increased, Figure 7. Furthermore, in this coexistence region, DSCG 0.34 mol/kg + PEG 0.011 mol/kg shows that is higher than that in DSCG 0.49 mol/kg, but similar to in DSCG 0.65 mol/kg. In other words, addition of PEG mimics the effect of increasing the concentration of DSCG.
Understanding the structure of condensed chromonic regions in crowded dispersions is crucial for the understanding of nanoscale condensation of DNAs. Previous studies provided indirect insight into the phase state and structure of the condensed domains by comparing the birefringence of the condensed and isotropic regions [15]. Here, we provide a direct characterization of the nature of the phase separated regions through the X-ray measurements.
The X-ray measurements show that the addition of PEG mimics the effect of an increased concentration of DSCG. This is illustrated by an increase in interaggregate correlation length and short-range stacking correlation length with the addition of PEG. The phase separation and co-existence of the C and I phases in mixtures with PEG is confirmed by X-ray diffraction patterns showing hexagonal ordering and a dramatic increase of in the C phase, by more than an order of magnitude as compared to the I phase and the N phase. Both and increase as the temperature is decreased for all mixtures, indicating a better ordering at lower temperatures. Furthermore, also increases with the concentration of DSCG. The values of in DSCG 0.34 mol/kg + PEG 0.011 mol/kg and DSCG 0.65 mol/kg are close, implying that the addition of PEG helps to enhance the short-range molecular stacking of aggregates. However, the experimental values of are much smaller than what is expected by the Onsager theory [36] for the actual contour length of the aggregates that is necessary to form an ordered phase. Although the Onsager theory, developed for monodisperse systems, cannot be used directly for the description of the polydisperse chromonic solutions, the discrepancy between and the expected is too big (by a factor of 5–6) to be explained solely by polydispersity. As discussed above, defects in molecular packing within the chromonic aggregates can contribute significantly to the inequality .
4. Summary
To summarize, in this work, we present the analysis of phase formations of mixtures of DSCG and crowding agent PEG using polarizing microscopy and X-ray diffraction measurements. Adding PEG to 0.34 mol/kg DSCG results in phase separation of the isotropic phase and the liquid crystalline phase; polarizing microscopy suggest that this liquid crystalline phase is columnar, which is confirmed by detailed X-ray measurements. The effect of adding the crowding agent PEG mimics an increase of the concentration of DSCG. We also find that in all chromonic samples explored, with and without PEG, the interaggregate separation in the nematic and columnar hexagonal phases decreases as the temperature is increased. Increasing the content of PEG leads to a smaller in the columnar phase, i.e., PEG-generated osmotic pressure condenses the chromonic aggregates closer to each other. The next task is to explore the shape of the columnar nuclei embedded into the isotropic environment; the shape is expected to be controlled by the compressional and bending stiffness of the material and by the anisotropic surface tension at the columnar–isotropic interface.
Author Contributions
R.K. and B.-X.L. contributed equally to this work. R.K. and B.-X.L. did the experiments. R.K., B.-X.L. and O.D.L. wrote the paper. O.D.L. conceived and directed the project.
Funding
This research was funded by NSF grant DMREF DMS-1729509 and supported by the Brookhaven National Laboratory, NSLS II Project ID 302111.
Acknowledgments
We are thankful to Masafumi Fukuto, Brookhaven National Laboratory, for the help with the X-ray experiments, and to D. Golovaty, M. C. Calderer and N. J. Walkington for discussions that stimulated this work. This research used the 11-BM CMS beamline of National Synchrotron Light Source-II (NSLS-II), Brookhaven National Laboratory (BNL), a U.S. Department of Energy User Facility operated for the Office of Science by BNL under Contract DE-SC0012704.
Conflicts of Interest
The authors declare no conflict of interest.
References
- Lydon, J.E. Chromonic liquid crystal phases. Curr. Opin. Colloid Interface 1998, 3, 458–466. [Google Scholar] [CrossRef]
- Tam-Chang, S.W.; Huang, L. Chromonic liquid crystals: Properties and applications as functional materials. Chem. Commun. 2008, 1957–1967. [Google Scholar] [CrossRef] [PubMed]
- Dickinson, A.J.; LaRacuente, N.D.; McKitterick, C.B.; Collings, P.J. Aggregate structure and free energy changes in chromonic liquid crystals. Mol. Cryst. Liq. Cryst. 2009, 509, 751–762. [Google Scholar] [CrossRef]
- Park, H.S.; Lavrentovich, O.D. Lyotropic Liquid Crystals: Emerging Applications. In Liquid Crystals beyond Displays: Chemistry, Physics, and Applications; Li, Q., Ed.; John Wiley & Sons: Hoboken, NJ, USA, 2012. [Google Scholar]
- Lydon, J.E. Chromonics. In Handbook of Liquid Crystals; Demus, D., Goodby, J.W., Gray, G.W., Speiss, H.-W., Vill, V., Eds.; Wiley-VCH: New York, NY, USA, 1998; pp. 981–1007. [Google Scholar]
- Edwards, D.J.; Jones, J.W.; Lozman, O.; Ormerod, A.P.; Sintyureva, M.; Tiddy, G.J.T. Chromonic liquid crystal formation by Edicol Sunset Yellow. J. Phys. Chem. B 2008, 112, 14628–14636. [Google Scholar] [CrossRef] [PubMed]
- Nakata, M.; Zanchetta, G.; Chapman, B.D.; Jones, C.D.; Cross, J.O.; Pindak, R.; Bellini, T.; Clark, N.A. End-to-end stacking and liquid crystal condensation of 6 to 20 base pair DNA duplexes. Science 2007, 318, 1276–1279. [Google Scholar] [CrossRef] [PubMed]
- Mariani, P.; Saturni, L. Measurement of intercolumnar forces between parallel guanosine four-stranded helices. Biophys. J. 1996, 70, 2867–2874. [Google Scholar] [CrossRef]
- Woolverton, C.J.; Gustely, E.; Li, L.; Lavrentovich, O.D. Liquid crystal effects on bacterial viability. Liq. Cryst. 2005, 32, 417–423. [Google Scholar] [CrossRef]
- Zhou, S.; Sokolov, A.; Lavrentovich, O.D.; Aranson, I.S. Living liquid crystals. Proc. Natl. Acad. Sci. USA 2014, 111, 1265–1270. [Google Scholar] [CrossRef] [PubMed] [Green Version]
- Raspaud, E.; De La Cruz, M.O.; Sikorav, J.L.; Livolant, F. Precipitation of DNA by polyamines: A polyelectolyte behavior. Biophys. J. 1998, 74, 381–393. [Google Scholar] [CrossRef]
- Hud, N.V.; Vilfan, I.D. Toroidal DNA Condensates: Unraveling the Fine Structure and the Role of Nucleation in Determining Size. Annu. Rev. Biophys. Biomol. Struct. 2005, 34, 295–318. [Google Scholar] [CrossRef]
- Zhou, H.-X.; Rivas, G.; Minton, A.P. Macromolecular crowding and confinement: Biochemical, biophysical, and potential physiological consequences. Annu. Rev. Biophys. 2008, 37, 375–397. [Google Scholar] [CrossRef] [PubMed]
- Zanchetta, G.; Nakata, M.; Buscaglia, M.; Bellini, T.; Clark, N.A. Phase separation and liquid crystallization of complementary sequences in mixtures of nanoDNA oligomers. Proc. Natl. Acad. Sci. USA 2008, 105, 1111–1117. [Google Scholar] [CrossRef] [PubMed] [Green Version]
- Tortora, L.; Park, H.-S.; Kang, S.-W.; Savaryn, V.; Hong, S.-H.; Kaznatcheev, K.; Finotello, D.; Sprunt, S.; Kumar, S.; Lavrentovich, O.D. Self-assembly, condensation, and order in aqueous lyotropic chromonic liquid crystals crowded with additives. Soft Matter 2010, 6, 4157–4167. [Google Scholar] [CrossRef]
- Park, H.S.; Kang, S.W.; Tortora, L.; Kumar, S.; Lavrentovich, O.D. Condensation of self-assembled lyotropic chromonic liquid crystal sunset yellow in aqueous solutions crowded with polyethylene glycol and doped with salt. Langmuir 2011, 27, 4164–4175. [Google Scholar] [CrossRef] [PubMed]
- Park, H.S.; Kang, S.W.; Tortora, L.; Nastishin, Y.; Finotello, D.; Kumar, S.; Lavrentovich, O.D. Self-assembly of lyotropic chromonic liquid crystal Sunset Yellow and effects of ionic additives. J. Phys. Chem. B 2008, 112, 16307–16319. [Google Scholar] [CrossRef] [PubMed]
- Madden, T.L.; Herzfeld, J. Exclusion of Spherical Particles from the Nematic Phase of Reversibly Assembled Rod-Like Particles. MRS Proc. 1991, 248. [Google Scholar] [CrossRef]
- Madden, T.L.; Herzfeld, J. Liquid Crystal Phases of Self-Assembled Amphiphilic Aggregates. Philos. Trans. Phys. Sci. Eng. 1993, 344, 357–375. [Google Scholar]
- Tortora, L.; Lavrentovich, O.D. Chiral symmetry breaking by spatial confinement in tactoidal droplets of lyotropic chromonic liquid crystal. Proc. Natl. Acad. Sci. USA 2011, 108, 5163–5168. [Google Scholar] [CrossRef]
- Agra-Kooijman, D.M.; Singh, G.; Lorenz, A.; Collings, P.J.; Kitzerow, H.S.; Kumar, S. Columnar molecular aggregation in the aqueous solutions of disodium cromoglycate. Phys. Rev. E 2014, 89, 062504. [Google Scholar] [CrossRef]
- Yamaguchi, A.; Smith, G.P.; Yi, Y.; Xu, C.; Biffi, S.; Serra, F.; Bellini, T.; Zhu, C.; Clark, N.A. Phases and structures of sunset yellow and disodium cromoglycate mixtures in water. Phys. Rev. E 2016, 93, 012704. [Google Scholar] [CrossRef]
- Simon, K.A.; Sejwal, P.; Gerecht, R.B.; Luk, Y.-Y. Water-in-water emulsions stabilized by non-amphiphilic interactions: Polymer-dispersed lyotropic liquid crystals. Langmuir 2007, 23, 1453–1458. [Google Scholar] [CrossRef] [PubMed]
- Kleman, M.; Lavrentovich, O.D. Soft Matter Physics: An Introduction; Springer: New York, NY, USA, 2003. [Google Scholar]
- Kim, Y.K.; Shiyanovskii, S.V.; Lavrentovich, O.D. Morphogenesis of defects and tactoids during isotropic-nematic phase transition in self-assembled lyotropic chromonic liquid crystals. J. Phys. Condens. Matter 2013, 25, 404202. [Google Scholar] [CrossRef] [PubMed]
- Nastishin, Y.A.; Liu, H.; Schneider, T.; Nazarenko, V.; Vasyuta, R.; Shiyanovskii, S.V.; Lavrentovich, O.D. Optical characterization of the nematic lyotropic chromonic liquid crystals: Light absorption, birefringence, and scalar order parameter. Phys. Rev. E 2005, 72, 041711. [Google Scholar] [CrossRef] [PubMed]
- Prinsen, P.; van der Schoot, P. Shape and director-field transformation of tactoids. Phys. Rev. E 2003, 68, 021701. [Google Scholar] [CrossRef]
- Prinsen, P.; van der Schoot, P. Continuous director-field transformation of nematic tactoids. Eur. Phys. J. E 2004, 13, 35–41. [Google Scholar] [CrossRef]
- Prinsen, P.; van der Schoot, P. Parity breaking in nematic tactoids. J. Phys. Condens. Matter 2004, 16, 8835–8850. [Google Scholar] [CrossRef] [Green Version]
- Kaznacheev, A.V.; Bogdanov, M.M.; Taraskin, S.A. The nature of prolate shape of tactoids in lyotropic inorganic liquid crystals. J. Exp. Theor. Phys. 2002, 95, 57–63. [Google Scholar] [CrossRef]
- Zhang, C.; Acharya, A.; Walkington, N.J.; Lavrentovich, O.D. Computational modelling of tactoid dynamics in chromonic liquid crystals. Liq. Cryst. 2018, 45, 1084–1100. [Google Scholar] [CrossRef]
- Van der Beek, D.; Petukhov, A.V.; Oversteegen, S.M.; Vroege, G.J.; Lekkerkerker, H.N. Evidence of the hexagonal columnar liquid-crystal phase of hard colloidal platelets by high-resolution SAXS. Eur. Phys. J. E 2005, 16, 253–258. [Google Scholar] [CrossRef] [Green Version]
- Alexandridis, P.; Olsson, U.; Lindman, B. A Record Nine Different Phases (Four Cubic, Two Hexagonal, and One Lamellar Lyotropic Liquid Crystalline and Two Micellar Solutions) in Ternary Isothermal System of an Amphiphilic Block Copolymer and Selective Solvents (Water and Oil). Langmuir 1998, 14, 2627–2638. [Google Scholar] [CrossRef]
- Luzzati, V. Biological Membranes; Chapman, D., Ed.; Academic Press: New York, NY, USA, 1968; p. 78. [Google Scholar]
- Park, H.S. Self-Assembly of Lyotropic Chromonic Liquid Crystals: Effects of Additives and Applications. Ph.D. Dissertation, Kent State University, Kent, OH, USA, 2010. [Google Scholar]
- Onsager, L. The effects of shape on the interaction of colloidal particles. Ann. N. Y. Acad. Sci. 1949, 51, 627–659. [Google Scholar] [CrossRef]
- Zhou, S.; Neupane, K.; Nastishin, Y.A.; Baldwin, A.R.; Shiyanovskii, S.V.; Lavrentovich, O.D.; Sprunt, S. Elasticity, viscosity, and orientational fluctuations of a lyotropic chromonic nematic liquid crystal disodium cromoglycate. Soft Matter 2014, 10, 6571–6581. [Google Scholar] [CrossRef]
- Sidky, H.; Whitmer, J.K. The Emergent Nematic Phase in Ionic Chromonic Liquid Crystals. J. Phys. Chem. B 2017, 121, 6691–6698. [Google Scholar] [CrossRef]
- Xiao, W.; Hu, C.; Carter, D.J.; Nichols, S.; Ward, M.D.; Raiteri, P.; Rohl, A.L.; Kahr, B. Structural Correspondence of Solution, Liquid Crystal, and Crystalline Phases of the Chromonic Mesogen Sunset Yellow. Cryst. Growth Des. 2014, 14, 4166–4176. [Google Scholar] [CrossRef]
Figure 1.
Phase diagram of (a) Mixture of 0.34 mol/kg disodium cromoglicate (DSCG) with polyethylene glycol (PEG); (b) Aqueous solution of pure DSCG; Optical textures of DSCG mixtures observed with crossed polarizers (c–n). (c) DSCG 0.34 mol/kg + PEG 0.011 mol/kg mixture at (c) ; (d) ; DSCG 0.34 mol/kg + PEG 0.022 mol/kg mixture at (e) ; (f) ; DSCG 0.34 mol/kg mixture at (g) ; (h) ; DSCG 0.49 mol/kg mixture at (i) ; (j) ; DSCG 0.65 mol/kg mixture at (k) ; (l) ; DSCG 0.80 mol/kg mixture at (m) ; (n) . Scale bar .


Figure 2.
Definitions of the parameters (lateral distance), (neighboring columnar stacks), and (stacking distance).
Figure 2.
Definitions of the parameters (lateral distance), (neighboring columnar stacks), and (stacking distance).

Figure 3.
X-ray data for DSCG 0.34 mol/kg + PEG 0.011 mol/kg at . (a) Diffraction pattern from small angle X-ray scattering (SAXS); (b) Intensity profile from SAXS; (c) Diffraction pattern from wide-angle X-ray scattering (WAXS); (d) Intensity profile from WAXS; (e) Diffraction pattern from SAXS at ; (f) Intensity profile from SAXS at ; (g) Diffraction pattern from WAXS at ; (h) Intensity profile from WAXS at . Peak in (b), in (f), and the multiple peaks seen below in (d,h) correspond to background scattering from Kapton windows and do not characterize the DSCG structure.


Figure 4.
Temperature dependence of lateral distance (left axis, closed symbol) and local concentration (right axis, open symbol). Red circles correspond to C phase, blue triangles to N phase, and black squares to I phase. (a) DSCG 0.34 mol/kg + PEG 0.011 mol/kg; (b) DSCG 0.34 mol/kg + PEG 0.022 mol/kg; (c) DSCG 0.49 mol/kg; (d) DSCG 0.65 mol/kg; (e) DSCG 0.80 mol/kg.


Figure 5.
SAXS peak for DSCG 0.34 mol/kg + PEG 0.011 mol/kg mixture, fit to a sum of two Lorentzian peaks; I peak (blue dotted line), C peak (red dotted line), and I + C peak (green dotted line).
Figure 5.
SAXS peak for DSCG 0.34 mol/kg + PEG 0.011 mol/kg mixture, fit to a sum of two Lorentzian peaks; I peak (blue dotted line), C peak (red dotted line), and I + C peak (green dotted line).

Figure 6.
Temperature dependence of the positional correlation length for (a) DSCG 0.34 mol/kg + PEG 0.011 mol/kg; (b) DSCG 0.34 mol/kg + PEG 0.022 mol/kg; (c) DSCG 0.49 mol/kg; (d) DSCG 0.65 mol/kg; (e) DSCG 0.80 mol/kg.
Figure 6.
Temperature dependence of the positional correlation length for (a) DSCG 0.34 mol/kg + PEG 0.011 mol/kg; (b) DSCG 0.34 mol/kg + PEG 0.022 mol/kg; (c) DSCG 0.49 mol/kg; (d) DSCG 0.65 mol/kg; (e) DSCG 0.80 mol/kg.

Figure 7.
Temperature dependence of the positional correlation length for DSCG 0.34 mol/kg + PEG 0.011 mol/kg (magenta triangle base-up), DSCG 0.49 mol/kg (black square), DSCG 0.65 mol/kg (red circle), and DSCG 0.80 mol/kg (blue triangle base-down).
Figure 7.
Temperature dependence of the positional correlation length for DSCG 0.34 mol/kg + PEG 0.011 mol/kg (magenta triangle base-up), DSCG 0.49 mol/kg (black square), DSCG 0.65 mol/kg (red circle), and DSCG 0.80 mol/kg (blue triangle base-down).


Table 1.
Comparison of stacking distance nm, lateral distance nm, and distance between the centers of neighboring columnar stacks nm for each mixture in the C phase at .
Table 1.
Comparison of stacking distance nm, lateral distance nm, and distance between the centers of neighboring columnar stacks nm for each mixture in the C phase at .
| Parameters | DSCG 0.34 mol/kg, PEG 0.011 mol/kg | DSCG 0.34 mol/kg, PEG 0.022 mol/kg | DSCG 0.49 mol/kg | DSCG 0.65 mol/kg | DSCG 0.80 mol/kg |
|---|---|---|---|---|---|
| 0.34 | 0.34 | 0.34 | 0.34 | 0.32 | |
| 3.74 | 3.62 | 3.20 | 3.70 | 3.63 | |
| 4.32 | 4.18 | 3.70 | 4.27 | 4.19 |
© 2019 by the authors. Licensee MDPI, Basel, Switzerland. This article is an open access article distributed under the terms and conditions of the Creative Commons Attribution (CC BY) license (http://creativecommons.org/licenses/by/4.0/).
Share and Cite
MDPI and ACS Style
Koizumi, R.; Li, B.-X.; Lavrentovich, O.D. Effect of Crowding Agent Polyethylene Glycol on Lyotropic Chromonic Liquid Crystal Phases of Disodium Cromoglycate. Crystals 2019, 9, 160. https://0-doi-org.brum.beds.ac.uk/10.3390/cryst9030160
AMA Style
Koizumi R, Li B-X, Lavrentovich OD. Effect of Crowding Agent Polyethylene Glycol on Lyotropic Chromonic Liquid Crystal Phases of Disodium Cromoglycate. Crystals. 2019; 9(3):160. https://0-doi-org.brum.beds.ac.uk/10.3390/cryst9030160
Chicago/Turabian StyleKoizumi, Runa, Bing-Xiang Li, and Oleg D. Lavrentovich. 2019. "Effect of Crowding Agent Polyethylene Glycol on Lyotropic Chromonic Liquid Crystal Phases of Disodium Cromoglycate" Crystals 9, no. 3: 160. https://0-doi-org.brum.beds.ac.uk/10.3390/cryst9030160
Note that from the first issue of 2016, this journal uses article numbers instead of page numbers. See further details here.