Article

Study of Liquid Crystals Showing Two Isotropic Phases by 1H NMR Diffusometry and 1H NMR Relaxometry

1
Department of Solid State Physics, Jožef Stefan Institute, SI-1000 Ljubljana, Slovenia
2
Dipartimento di Chimica e Chimica Industriale, Università di Pisa, 56124 Pisa, Italy
3
Department of Chemistry, University of Warsaw, 02-093 Warsaw, Poland
4
Department of Chemistry, KTH Royal Institute of Technology, SE-100 44 Stockholm, Sweden
5
Laboratory of Biomolecular NMR, St. Petersburg 198504, Russia
*
Author to whom correspondence should be addressed.
Crystals 2019, 9(3), 178; https://doi.org/10.3390/cryst9030178
Submission received: 24 February 2019 / Revised: 21 March 2019 / Accepted: 23 March 2019 / Published: 26 March 2019
(This article belongs to the Special Issue Nuclear Magnetic Resonance of Liquid Crystals)

Abstract

:
In this work, we report a study of two thermotropic liquid crystalline samples showing a not common mesophase behavior. The samples, namely a di-benzyloxy biphenyl derivative labelled 9/2 RS/RS, and a bimesogenic liquid crystal labelled L1, show a direct transition between two isotropic phases followed, at lower temperatures, by the optically isotropic, 3D structured, cubic phase. These systems have been investigated by means of 1H NMR diffusometry and 1H NMR relaxometry in order to characterize their isotropic–isotropic’–cubic mesophase behavior, mainly on the dynamic point of view. In particular, the temperature trend of the self-diffusion coefficients measured for both samples allowed us to significantly distinguish between the two isotropic phases, while the temperature dependence of the 1H spin-lattice relaxation time (T1) did not show significant discontinuities at the isotropic–isotropic’ phase transition. A preliminary analysis of the frequency-dependence of 1H T1 at different temperatures gives information about the main motional processes active in the isotropic mesophases.

1. Introduction

In the last two decades, liquid crystalline (LC) phases characterized by three-dimensional (3D) optically isotropic structures, such as the cubic phases, have attracted much attention in the field of partially ordered systems [1,2,3,4,5,6,7,8]. While these 3D-ordered mesophases are very common and well known in lyotropic liquid crystals [9], they are rarely observed in thermotropic liquid crystals [1,2,3]. In lyotropic systems, the occurrence of cubic and other intermediate phases, characterized by isotropic structures, long-range positional order, and no long-range orientational order, between the lamellar (smectic) and columnar phases, has been associated with the presence of incompatible chemical parts such as hydrophilic and hydrophobic chemical components [1,2,3]. The nanoscale segregation of different chemical constituents in binary or ternary systems [1,2,3,10,11] is at the basis of several fundamental properties of lyotropic LCs, such as the selective ion- or mass- transportation, with potential applications in cosmetic, industrial and pharmaceutic fields. An analogous principle, invoking the nano-segregation between non-compatible chemical moieties (i.e., polar and apolar fragments), was successfully applied to explain the occurrence of highly ordered optically isotropic phases in thermotropic LCs [1,2,3,4,5,6,7,8]. Rod-like mesogens forming cubic mesophases are characterized by highly anisotropic molecular shapes, long aliphatic (and/or branched) chains, and relatively big rigid aromatic cores [1,2,3,4,5]. Recently, sequences of three dimensionally ordered isotropic phases have also been observed in bent-core LCs [12,13] and bimesogenic systems [14,15], such as LC dimers, built of two different rigid cores connected by a flexible spacer. Despite the variability of self-assembling organizations of cubic phases [1,2,3], those typically observed in thermotropic LCs are the bicontinuous cubic phases. These cubic phases are made of isotropically distributed networks of nano-channels filled with the aromatic fragments of mesogens, separated by an external space filled with alkyl chains [8,16,17]. Depending on the molecular structure and supramolecular organization, different types of cubic phases can be classified, such as those having a single gyroid cubic structure with I4132 symmetry, a double gyroid structure with Ia3d symmetry, the tricontinuous cubic phase with Im3m symmetry, and a multicontinuous type Pm3m structure [1,2,3,8,14,15,16,17,18,19,20].
Other kinds of optically isotropic mesophases observed in thermotropic liquid crystals are the so-called blue phases [21,22,23,24,25], characterized by a three-dimensional arrangement of cholesteric-like mesogen distribution, very low viscosity, fast molecular and collective dynamics. These low ordered optically isotropic mesophases are formed by chiral mesogens, and they are typically associated with the occurrence of higher ordered ‘frustrated’ LC phases, such as the twist grain boundaries (TGB) as well as the tetragonal phases [26].
Among thermotropic LC systems showing 3D optically isotropic structures, in a few cases a direct transition between two consecutive isotropic phases has been observed [8,13,14,27,28], leading to several speculations about the relationship between the mesogenic structure and the local molecular arrangement within these isotropic phases. Motivated by the need of an understanding of the molecular origin of such unique phase sequences, several structural studies based on X-ray diffraction (small angle X-ray scattering, SAXS, and wide-angle X-ray scattering, WAXS), and nuclear magnetic resonance (NMR) have been recently published [8,13,14,29].
NMR spectroscopy is a powerful experimental technique whose principles and main applications to investigate thermotropic liquid crystals are reported in several books and reviews [30,31,32,33,34,35]. Among different NMR-active nuclei, 2H and 13C have been widely used to get information about the average molecular conformations, supramolecular organization, and orientational properties of LC mesophases [36,37,38,39]. Multinuclear NMR approaches demonstrated to be of help in understanding the short-range orientational properties and the peculiar dynamics in the isotropic phase formed by bent-core LCs [40,41,42]. 1H NMR spectroscopic techniques have also been used to investigate different dynamic processes active in the different liquid crystalline phases, such as single molecular motions (i.e., self-diffusion and reorientational motions) and collective processes (i.e., order director fluctuations and layer undulations). Different NMR techniques can be used to explore different dynamic processes having characteristic correlation times, τc. For instance, exchange diffusion processes can be investigated by means of 2H 2D NMR or 2H NMR line-shape analysis [30,31,32,33]; their characteristic time being in the range of 10−5–10−4 s. Self-diffusion molecular processes, either isotropic or anisotropic ones, are better studied by means of 1H NMR diffusometry, where the signals are averaged over characteristic times in the range of 10−1–10−3 s [43,44,45,46,47,48,49,50]. 2H NMR spin-lattice relaxation times, T1, typically measured at high Larmor frequencies (hundreds of MHz), are sensitive to fast motions, such as overall molecular motions having 10−11 < τc < 10−7 s, while 2H NMR spin-spin relaxation times, T2, can be used to investigate collective and other slow motions, with τc ranging from 10−6 s up to 10s [31,40,41,42,49,50]. Another important NMR technique is represented by 1H NMR relaxometry, based on the experimental measurement of 1H spin-lattice relaxation times, T1, at different 1H Larmor frequencies, typically from few KHz to several tens of MHz [49,50,51,52]. The analyses of the frequency-dependence of 1H NMR T1 can be done invoking different dynamic contributions by means of suitable theoretical models [51,52,53,54,55,56,57,58,59].
To the best of our knowledge, few papers have been published about 1H NMR diffusometry [29,60,61,62,63], and 1H NMR relaxometry [64,65] of 3D ordered optically isotropic phases.
In this paper, we have investigated two thermotropic LCs showing the mesophase sequence isotropic–isotropic’–cubic phases; the first mesogen, labelled 9/2 RS/RS, has a highly anisotropic molecular shape and it shows a sponge-type cubic phase with Im3m symmetry [8], the second mesogen, labelled L1, is an asymmetric dimer, having a double gyroid cubic phase with Ia3d symmetry [14]. The dynamic properties of these two LC systems will be discussed based on 1H NMR diffusometry and 1H NMR relaxometry data.

2. Materials and Methods

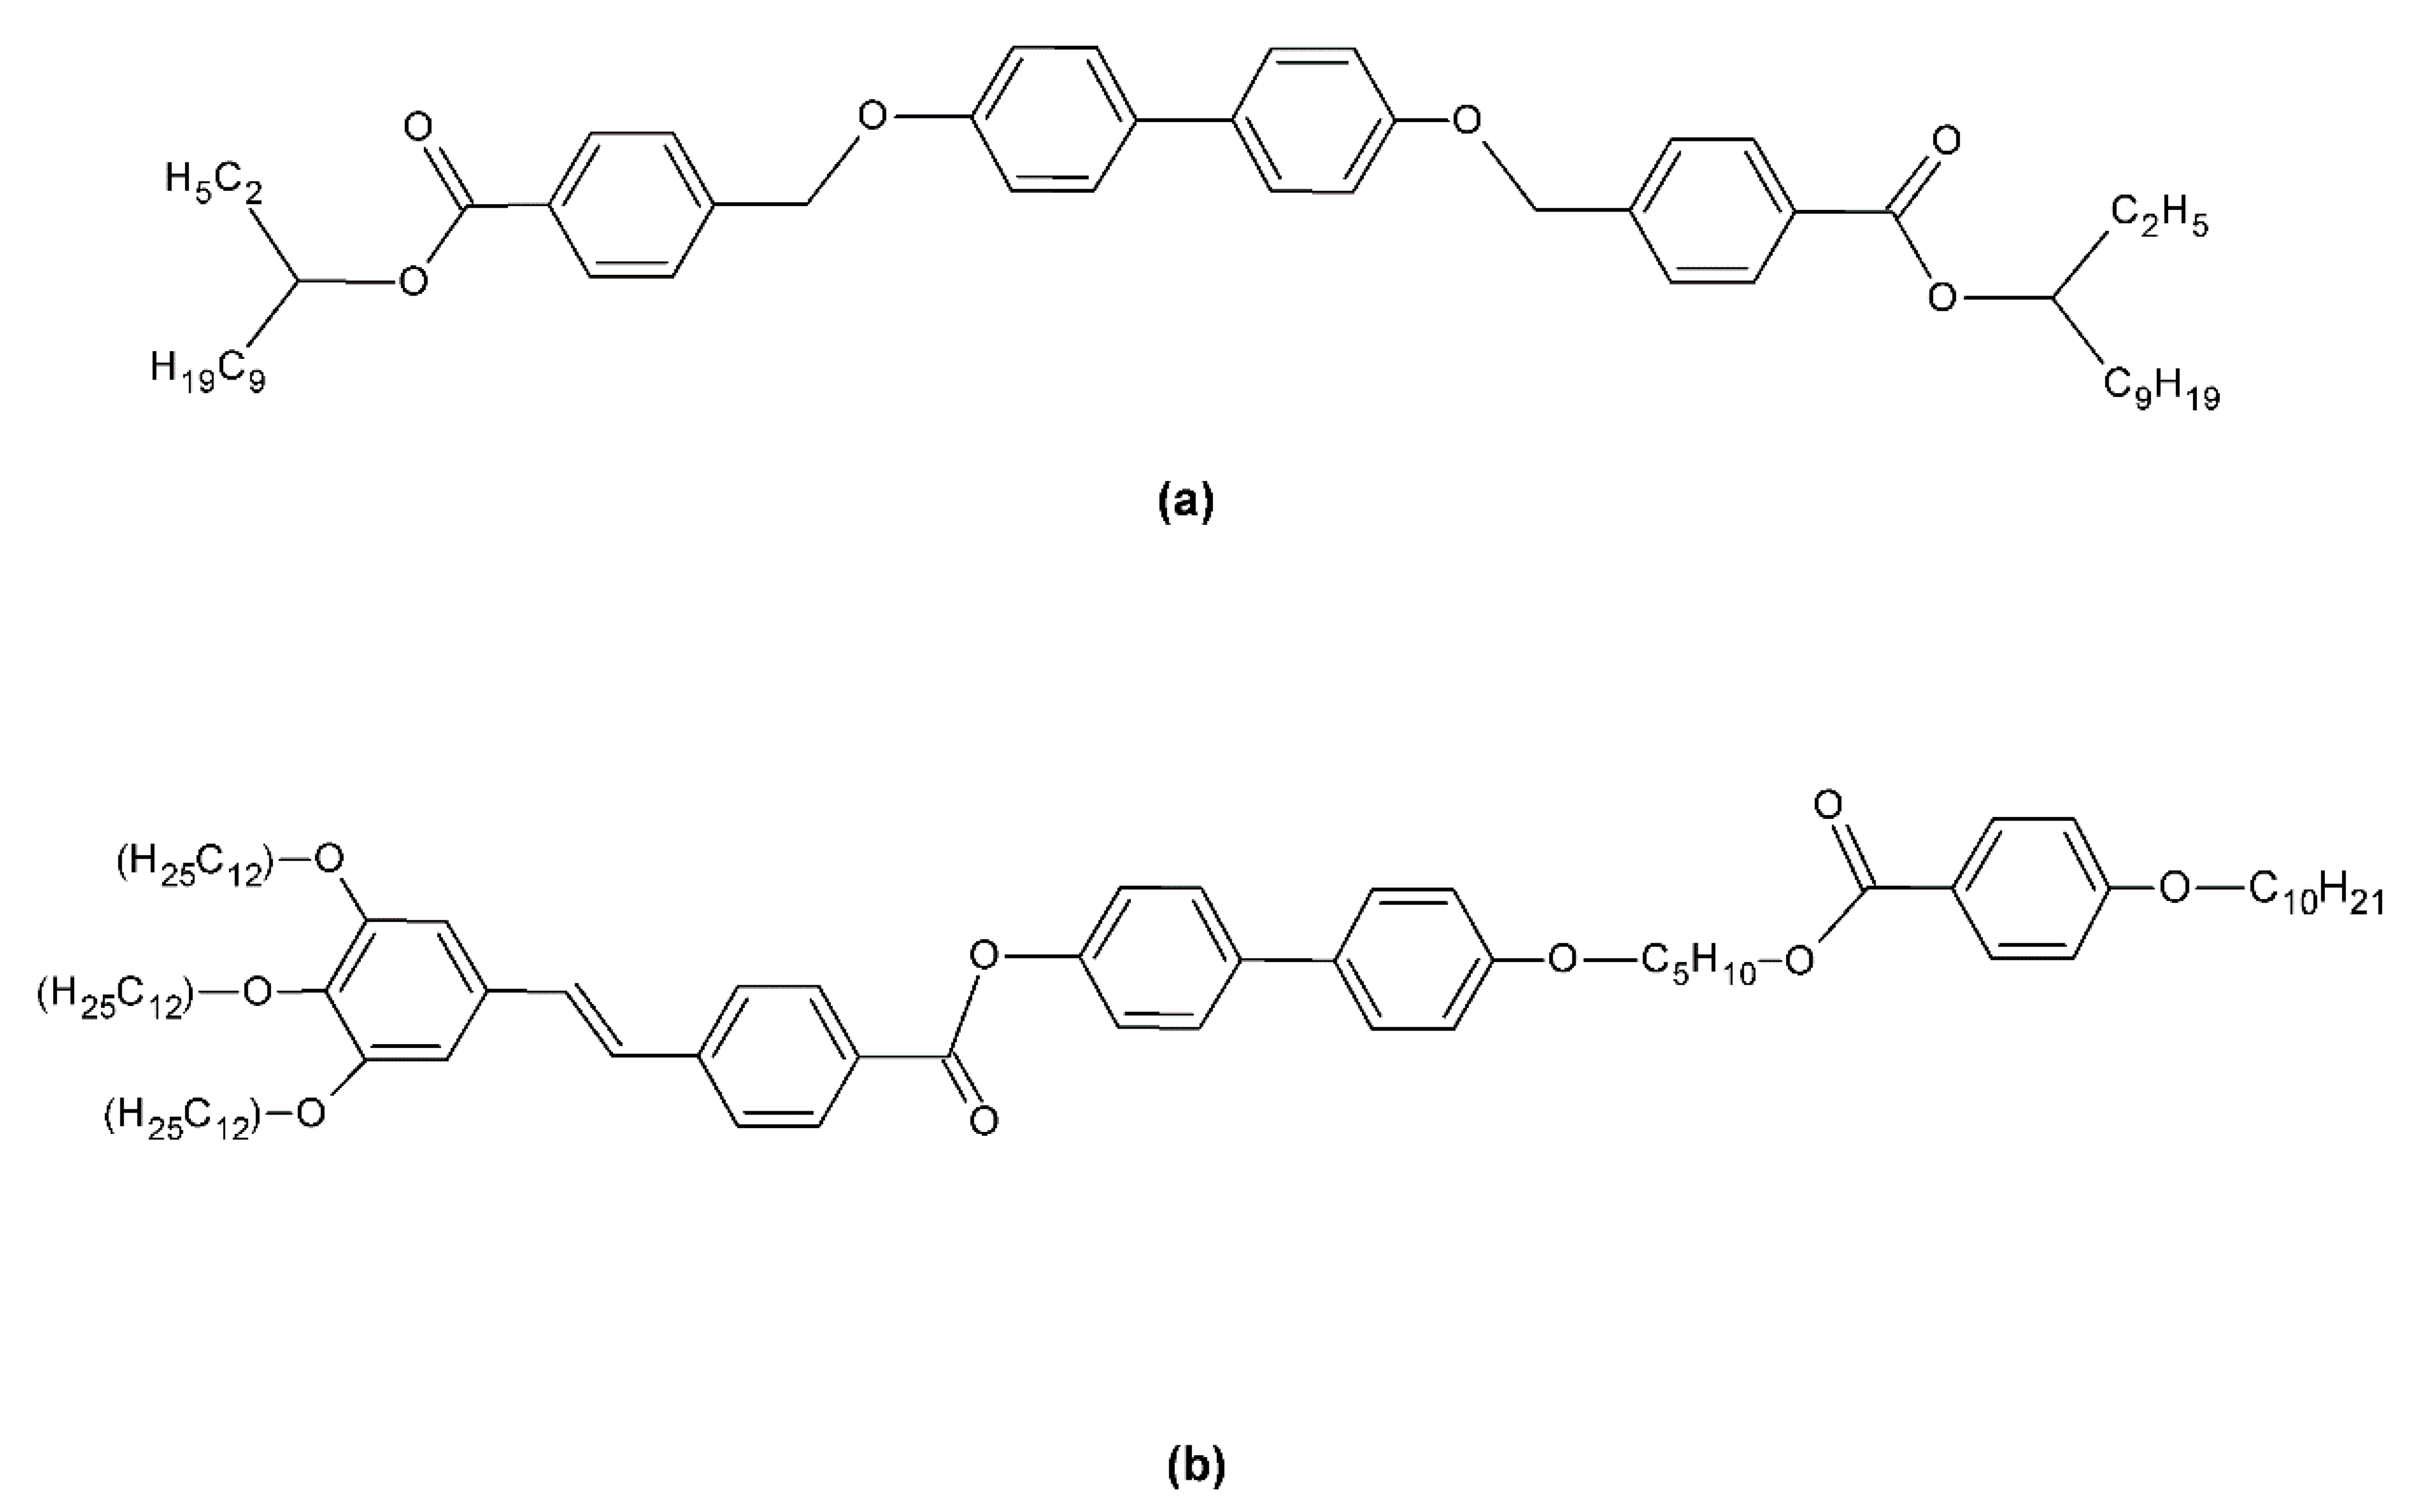
2.1. Liquid Crystalline Samples

The molecular structure of the two LC mesogens object of the present study is reported in Figure 1. The first mesogen is the [(RS/RS)-2ethyldecyl]-4,4′-bis(4″-carboxybenzyloxy)biphenyl benzoate, labeled 9/2 RS/RS; it is a symmetric molecule, having a 4,4′-bis(4″-carboxybenzyloxy) biphenyl mesogenic core, belonging to the series of compounds whose synthesis and mesomorphic characterization are reported in Ref. [8]. The second mesogen is the 4′-{5-pentylenate-[phenyloxycarbonyl-(4′-decyloxy)]}-4-[(E)-2-(4-methoxyphenyl)ethenyl]benzoate, labelled L1; it belongs to a series of asymmetric dimeric compounds [14] formed by two rigid cores: a trans-stilbene moiety connected by an ester bond to a biphenyl fragment (first rigid part) and a benzoate derivative (second rigid part) linked by a flexible chain of five carbons length.
The mesophase behavior of these two LCs has been investigated by means of differential scanning calorimetry (DSC), small angle X-ray scattering (SAXS) and polarized optical microscopy (POM) and results have been published in previous works [8,14]. Despite their different molecular structures, both samples showed a relatively similar mesophase behaviour, as reported in Table 1, including a direct transition between two isotropic phases and a further transition at lower temperatures between an isotropic phase and a cubic phase. The occurrence of a direct transition between the two isotropic phases was previously demonstrated by the presence of a reproducible peak in the DSC curves, observed either by cooling and heating the samples [8,14].
The symmetry of the cubic phase formed by the two compounds has been deeply investigated by means of X-ray diffraction techniques, giving rise to a hypothesis of molecular arrangement and local 3D orientation compatible with an Im3m symmetry for compound 9/2 RS/RS and an Ia3d symmetry for compound L1. In the case of the mesogen 9/2 RS/RS, a metastable columnar phase having a 2D hexagonal symmetry appears by cooling the sample from the isotropic phases [8,29]. This columnar phase converts into the cubic phase with relatively fast kinetics (as detected by NMR spectroscopy [29]). In the case of L1, a metastable columnar phase is only detectable by POM [14]. The symmetric mesogen 9/2 RS/RS has been previously investigated by means of a multinuclear NMR approach, including 13C and 2H NMR spectroscopy to study its ordering properties, and 1H NMR diffusion measurements [29].

2.2. 1H NMR Diffusometry

Self-diffusion NMR measurements [66,67] were performed on a 500 MHz Bruker Advance III spectrometer (Bruker, Germany) (11.7 T) operating at Larmor Frequency of 500 MHz. A micro-imaging probe MIC5 with gradients strength up to 280 G/cm in three orthogonal directions (x,y,z), and a diffusion probe Diff30 with a gradient along the z of 900 G/cm maximum strength were used. The 90° pulse width was calibrated to 5.9 μs for both probes and temperature was regulated with an accuracy of ± 0.1 °C. Measurements in the isotropic and liquid crystalline phases were all carried out with a Pulsed Field Gradient Stimulated Echo (STE-PFG) sequence [68], shown in Figure 2, with diffusion time ranging from 70 to 700 ms.
Sinebell gradient shapes of effective length δ = 1 ms to 3 ms were used supplemented with stabilization delay (st) = 50 μs long enough to avoid transient effects and interferences with radio frequency (r.f.) pulses. To compensate for eddy current fields, gradient waveforms were adjusted using pre-emphasis method [68]. Finally, the extension of the sequence with LED (Longitudinal Eddy current Delay) period of 5 ms allowed for suppression of eddy current effect during signal acquisition [69]. Diffusion coefficient along the gradient direction is measured by fitting the echo decay with the Stejskal-Tanner equation [68] as the gradient strength increases leaving all the other parameters constant:
A ( γ , δ , G , Δ ) exp ( b D ) b = ( γ δ G ) 2 ( Δ δ / 3 )
where G and δ are the pulse gradient strength and length respectively, Δ is the diffusion time, and D is the diffusion coefficient along the gradient direction.
Measurements on sample 9/2 RS/RS were previously reported in Ref. [29].

2.3. 1H NMR Relaxometry

Proton spin-lattice relaxation measurements as a function of temperature were carried out using two different setups—a superconducting magnet with a magnetic field of 2.35 T, corresponding to proton Larmor frequency of 100 MHz, and a fast field-cycling setup (SPINMASTER FFC-2000, Stelar, s.l.r. Stelar, Mede, Italy). For measurements in a static field of a superconducting magnet, the saturation recovery sequence was used for relaxation measurement. In the fast field-cycling setup, the nonpolarized (NP) sequence was used for measurements at 18 MHz while pre-polarized (PP) sequence was used for measurements at 4 MHz, 1 MHz, 100 kHz, and 10 kHz. The acquisition frequency in both sequences was 9.25 MHz. All other parameters were optimized according to each experiment. For both LC systems, the measurements were carried out in a cooling run, with first heating the sample well above the isotropic–isotropic’ transition temperature. As the measurements were carried out in small temperature steps with over 5 min waiting time for thermal equilibration, we can treat the cooling rate slow enough that no metastable phases, such as the columnar phase, were expected to be observed.

3. Results and Discussion

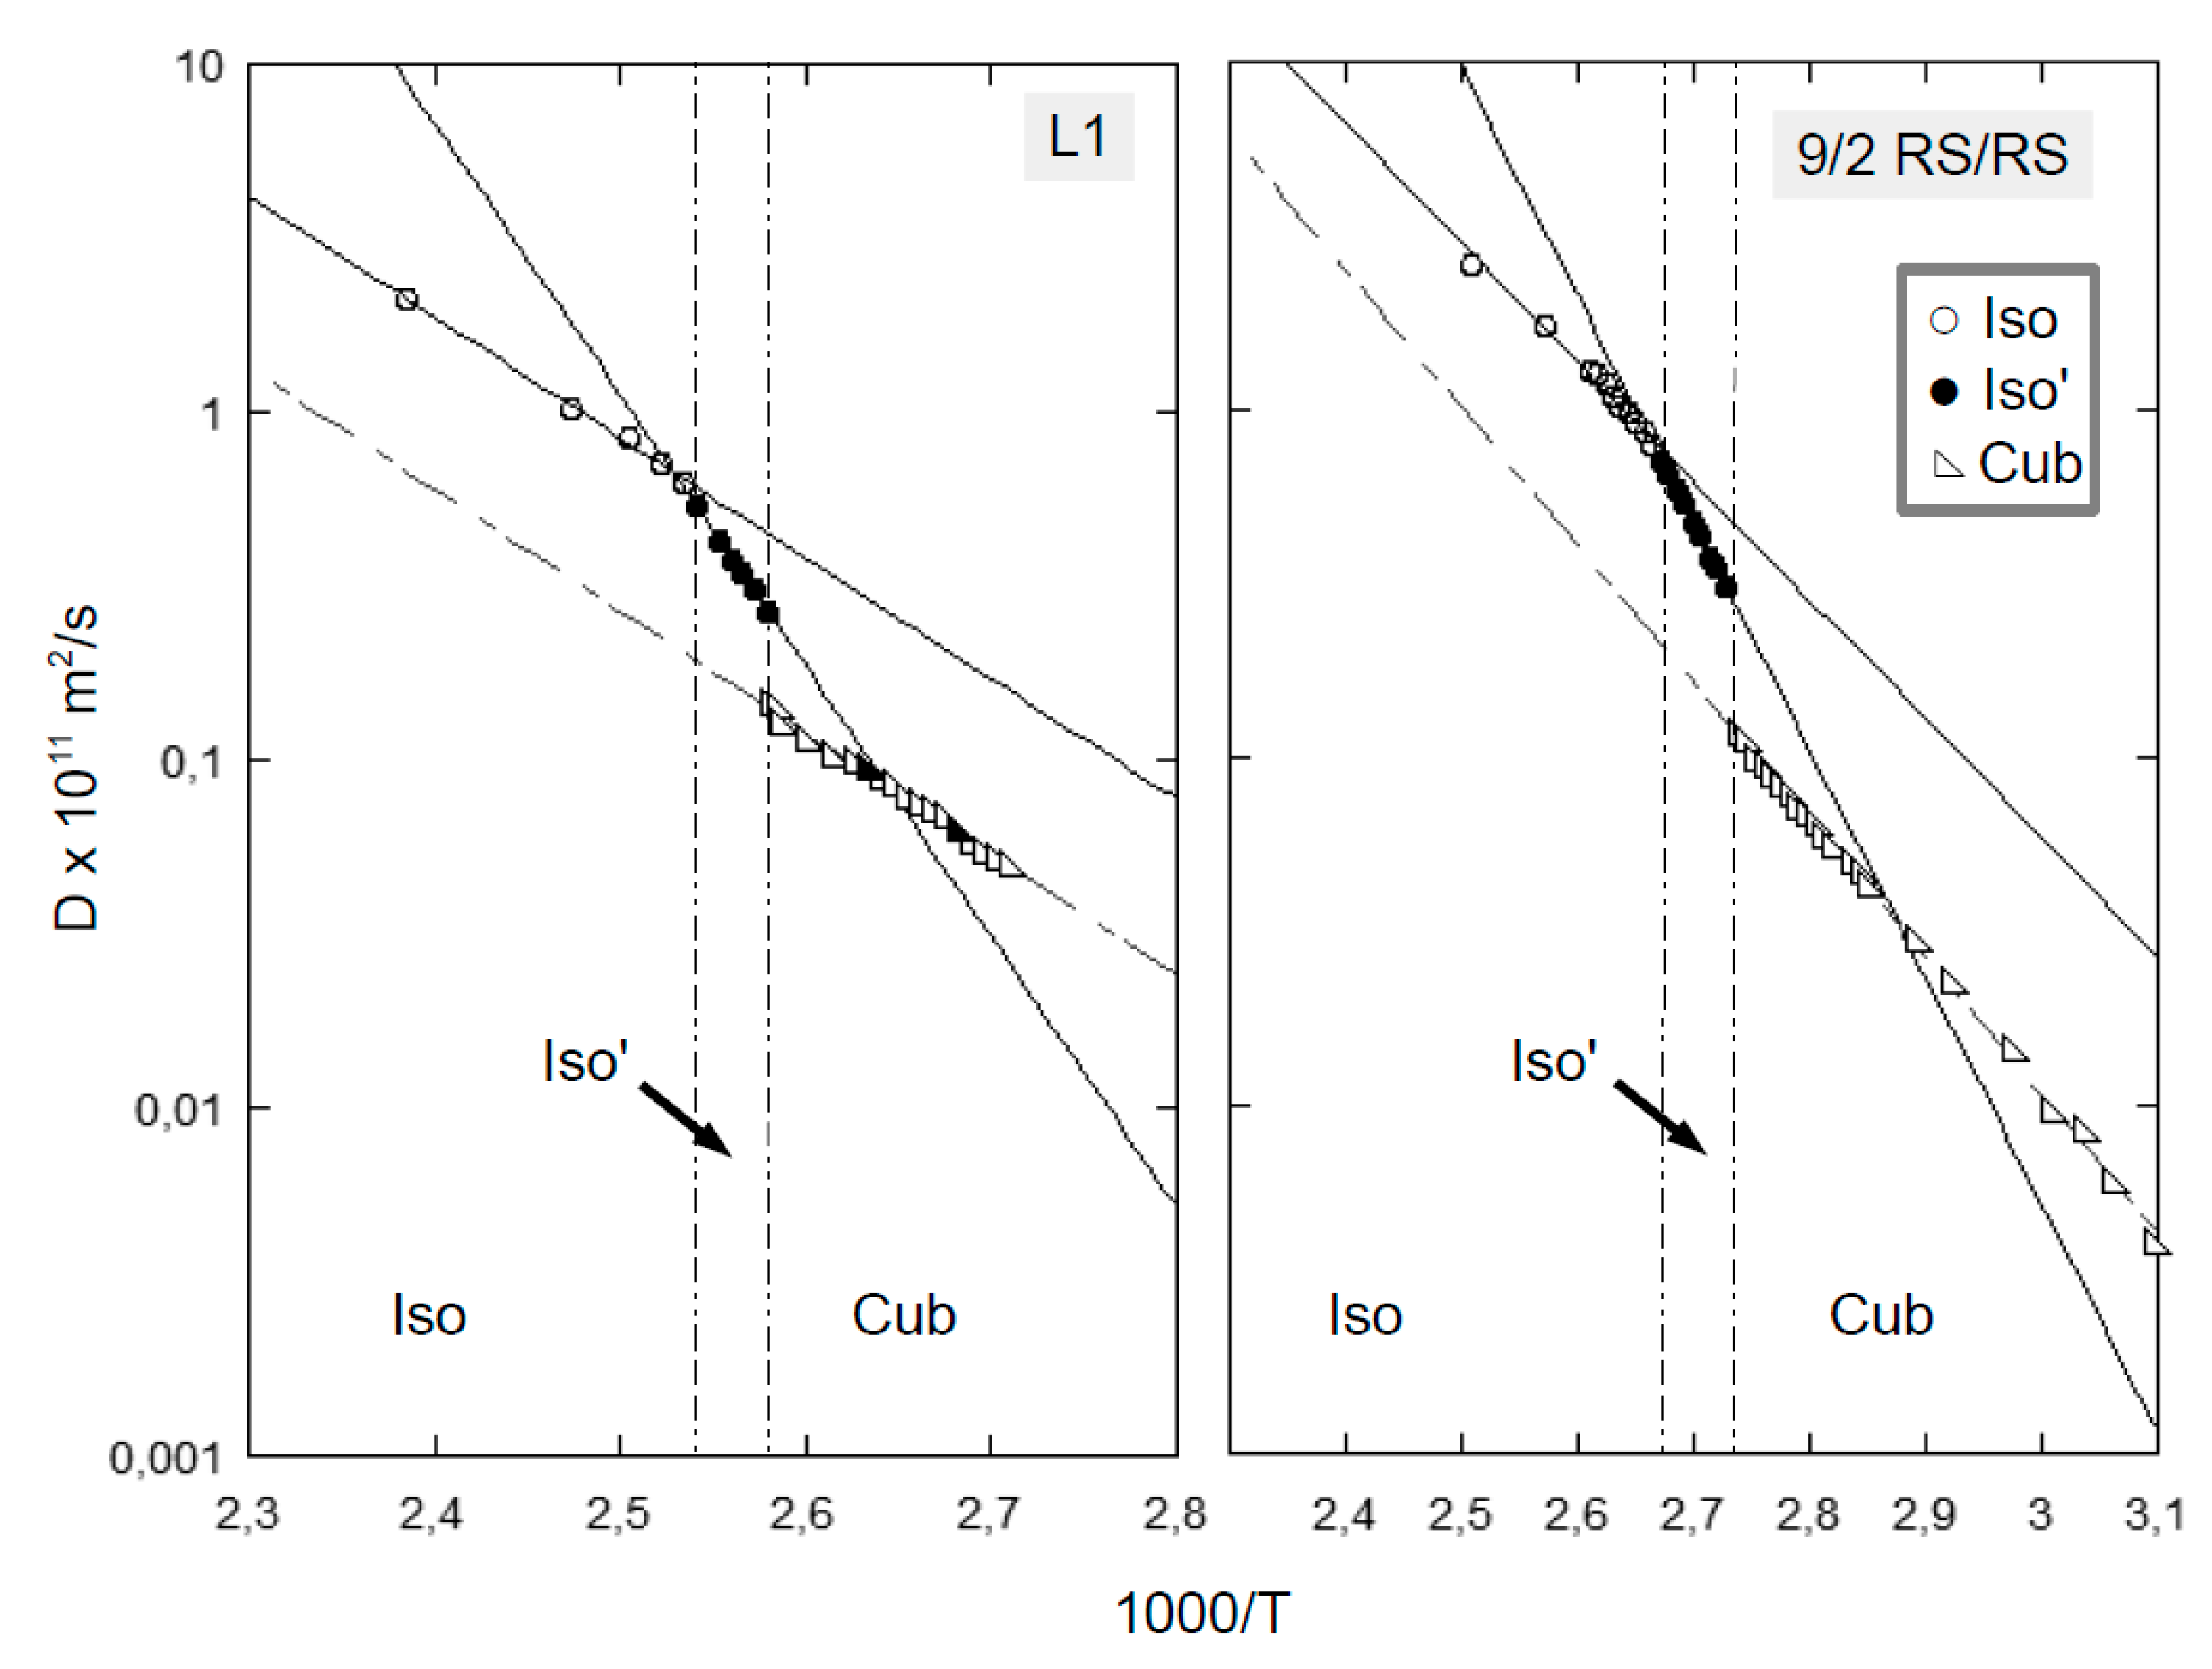
3.1. 1H NMR Diffusometry

Translational self-diffusion coefficients of the two investigated samples, measured on cooling from the higher temperature isotropic phase, as a function of the reduced temperature 1000/T are reported in Figure 3.
As shown in the picture, the presence of two distinct isotropic phases can be identified by the change in the temperature dependence of the diffusion coefficient D measured along the gradient direction in both samples. In particular, the temperature dependence of diffusion coefficients can be fitted with the well-known Arrhenius equation for temperature activated processes:
D ( T ) = D e E A R T
where EA is the activation energy. In the L1 sample, the values of 67 kJ/mol and 152 kJ/mol were obtained for the isotropic and isotropic’ phases, respectively. In the case of 9/2 RS/RS sample, the values of 65.4 kJ/mol and 124 kJ/mol were obtained [29]. As already noted for the sample 9/2 RS/RS [29], the increase in activation energy moving from the isotropic to the isotropic’ phases could be ascribed to the formation of a so-called “spongy” cubic phase, the precursor of the lower-temperature cubic phase. In this second isotropic phase, molecules move partially free or aggregated in metastable very flexible LC “cybotactic” clusters that are supposed to increase in dimensions/stability as temperature decreases, until the formation of the LC phase with total disappearance of isotropic local residue. It should be noticed that, on the self-diffusion time-scale, differences among molecules experiencing a free environment and those experiencing a locally oriented environment are completely averaged out, as can be deduced from the fact that a single isotropic self-diffusion coefficient, D, could be measured in the whole mesophasic range. As observed in Figure 3, the isotropic’–cubic phase transition is identified by a first-order change, namely a sudden decrease of D as molecules assemble completely in the 3D long-range pattern of the cubic phase. Here, the temperature dependence of D is associated with the activation energy of 68 kJ/mol and 74.6 kJ/mol for sample L1 and 9/2 RS/RS, respectively.
In line with previously published results for 9/2 RS/RS [29], in order to test possible effects of the supra-molecular phase structure on translational diffusion, 1H NMR diffusion measurements were performed both changing the gradient directions, as well as varying the diffusion time, ranging from 70 ms to 700 ms, by changing the gradient delay accordingly from 1 ms to 3 ms to preserve the same decay rate in all the STE-PG experiments. As shown in Figure 3 (for cubic L1), change in the time diffusion does not affect the results, as well as varying the direction on the measurement. For instance, the diffusion coefficient D measured at T = 380 K and T = 373 K (in the cubic phase), resulted in a diffusion coefficient D = 9.6 × 10⁻¹³ m2/s and D = 6.4 × 10⁻¹³ m2/s within a 5% experimental error, independently from the diffusion time Δ and the gradient direction. According to these measurements, we can state that also in the case of L1 sample the cubic phase assembles in the magnetic field with a completely isotropic distribution of domains that averages molecular translational diffusion to a scalar value. In particular, considering a diffusion length scale, , calculated as:
= 2 D Δ
we can also estimate that this diffusion “isotropic” averaging occurs in a length scale smaller than the smallest distance travelled by molecules during the experiments, that is, the diffusion length scale corresponding to the shortest diffusion time Δ. A picture of this effect is represented in Scheme 1.
As an example, for L1 sample at T = 373 K, the diffusion coefficient measured, D = 6.4 × 10⁻¹³ m2/s, with Δ = 70 ms indicates that the averaging occurs within 300 nm, while, in the case of the 9/2 RS/RS sample, the limit was even smaller; about 170 nm at T = 346 K, with a diffusion coefficient D = 2.3 × 10⁻¹³ m2/s [29]. Consequently, we can also estimate, in the cubic phase, the average domain dimension to be smaller than 300 nm and 170 nm in the L1 and 9/2 RS/RS samples respectively. The difference between the two investigated samples could also be explained with the different structural features of the two cubic phases (Ia3d and Im3m in the case of L1 and 9/2 RS/RS, respectively), but this aspect would need further investigations. An important aspect, from the self-diffusion measurement point of view, is that no differences in terms of diffusion motion among different directions can be detected in the whole investigated temperature range.

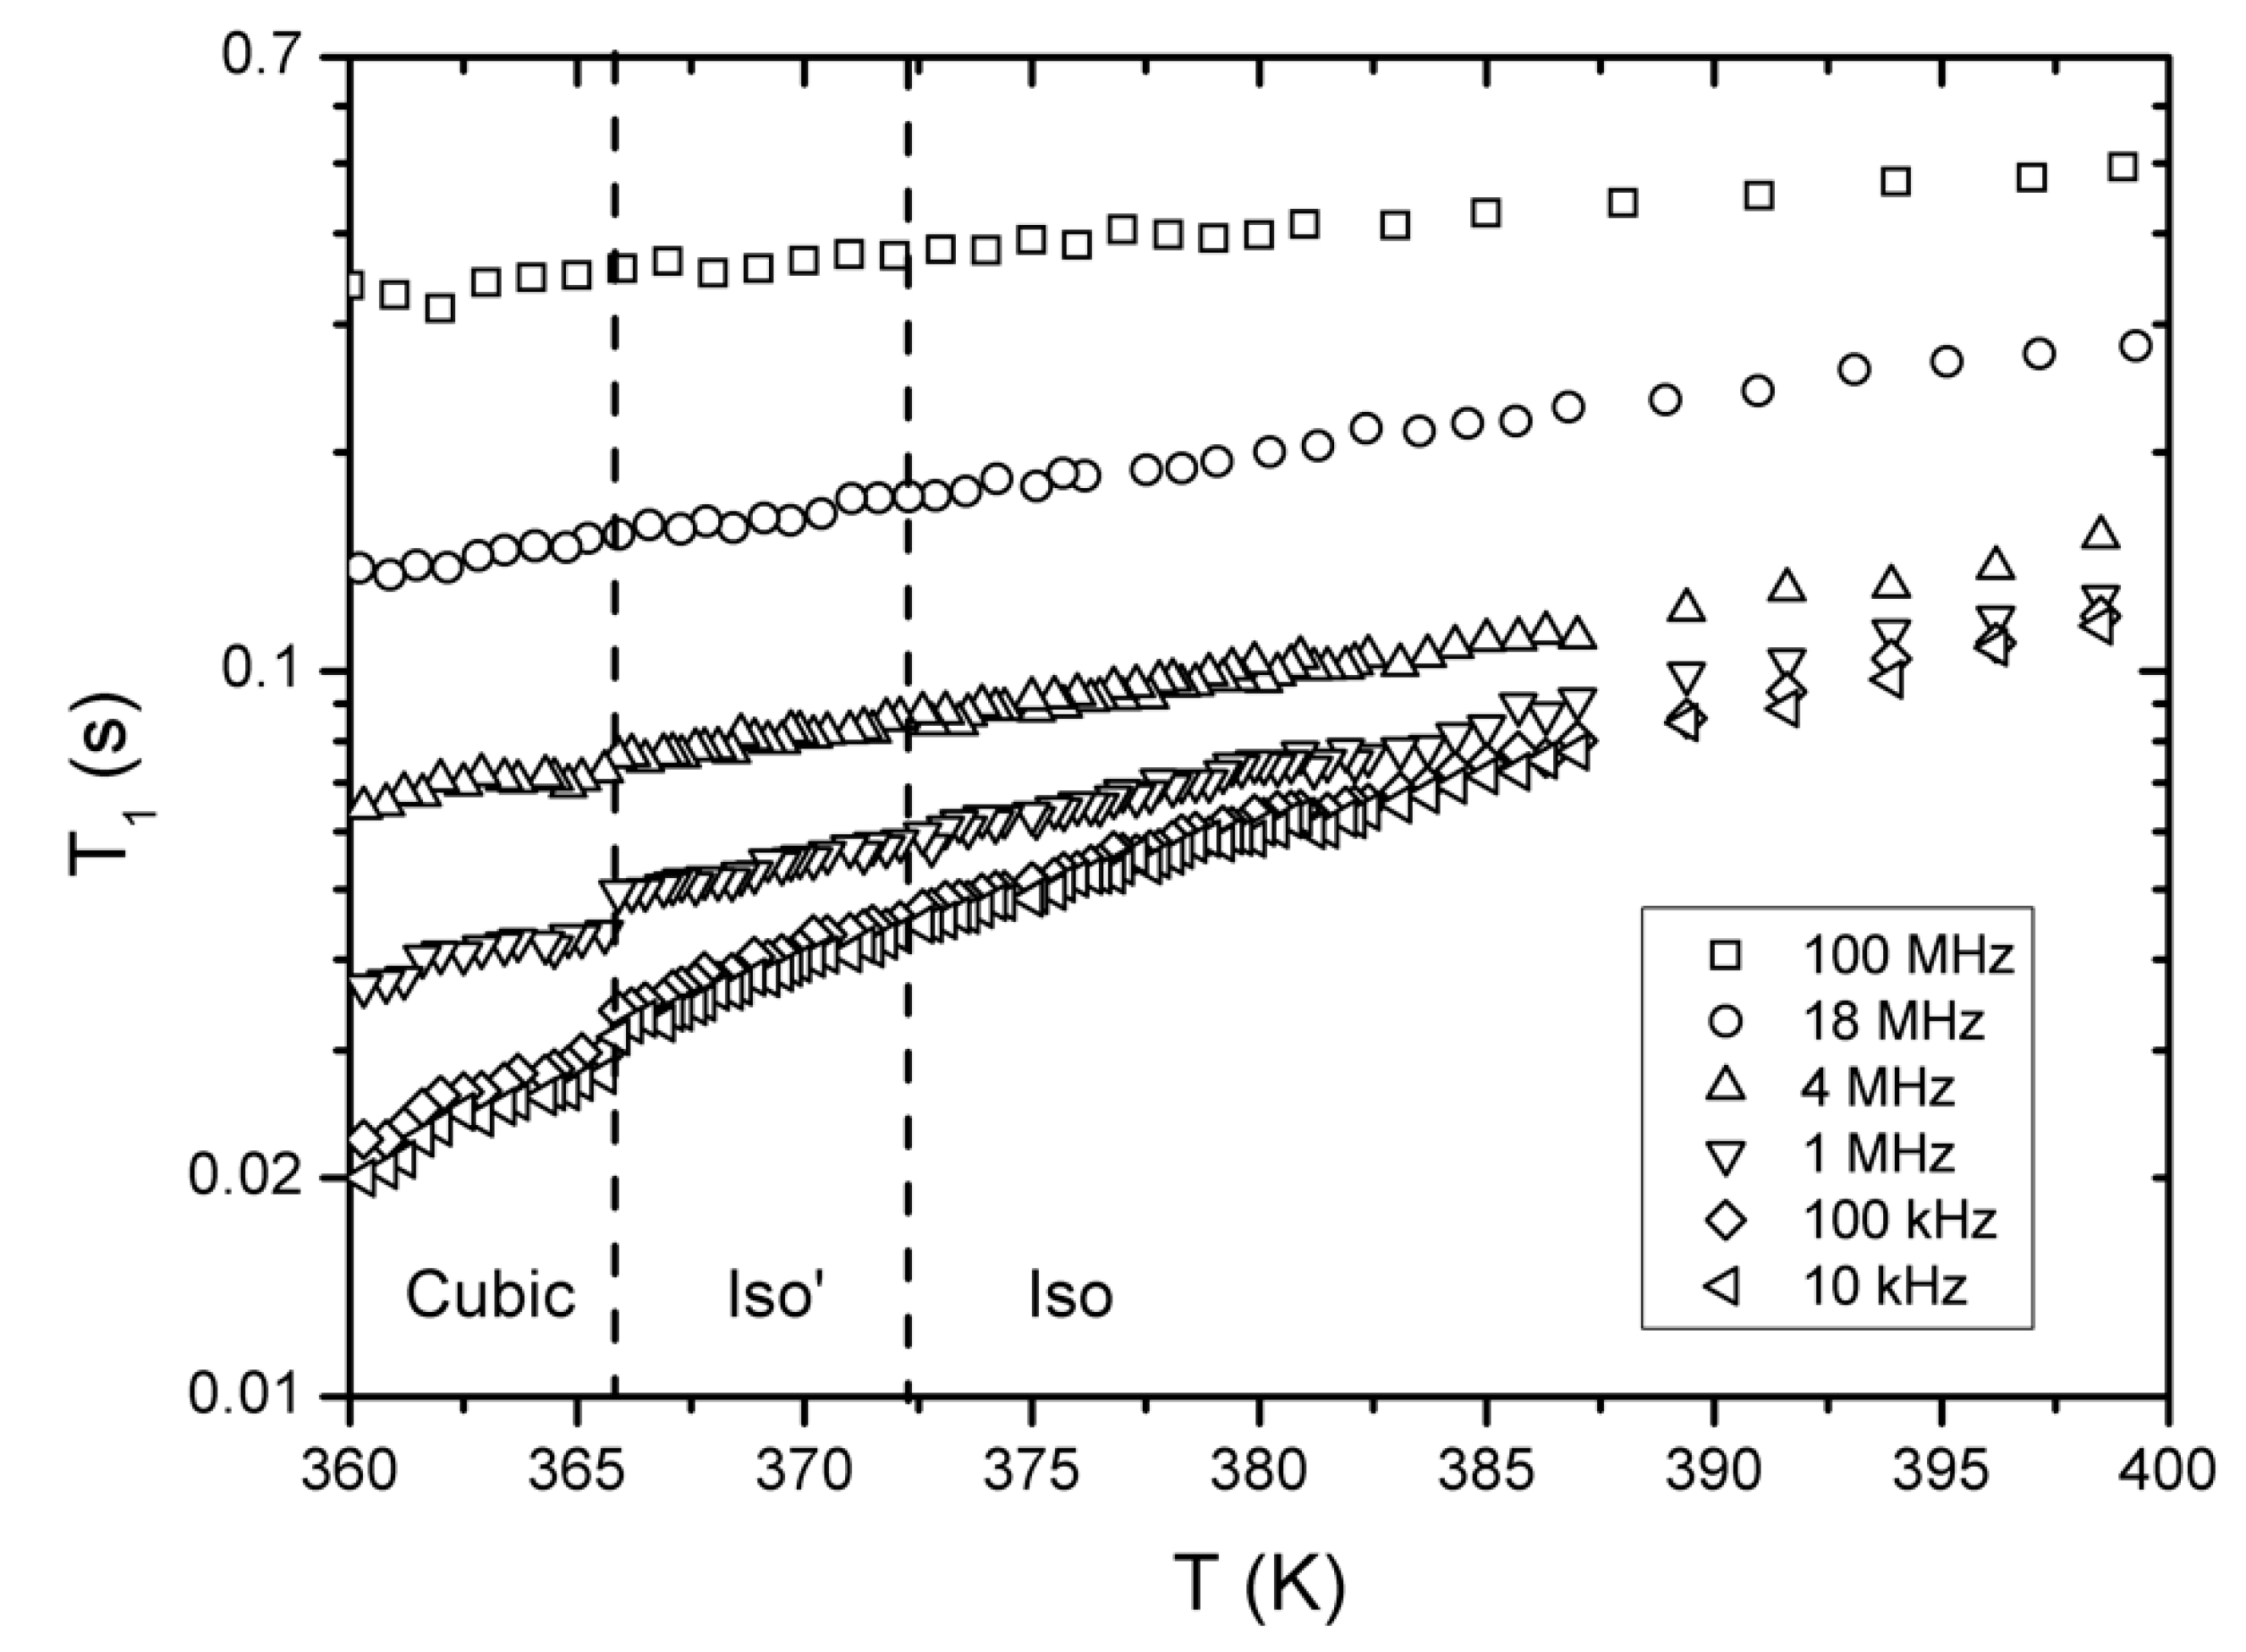
3.2. 1H NMR Relaxometry

Figure 4 and Figure 5 show temperature dependencies in a cooling run for L1 and 9/2 RS/RS, respectively, at chosen Larmor frequencies. Here, we should note that the magnetization decay/recovery curves for T1 measurements could be clearly described by a single-exponent function, corresponding to a single spin-lattice relaxation time for all protons in the molecule, only at higher fields. At lower fields (4 MHz and below), slight deviations from a single exponent model could be observed, hinting that spin-lattice relaxation can instead be interpreted using two components. An example of two-exponential and single-exponential fittings of the magnetization recorded at high and low fields for the sample L1 in the isotropic phase reported Figure S1 (Supplementary Materials). Similar phenomena have been observed before, for example in HZL 7/* [56] and 10BBL [57] liquid crystals, where multi-exponential functions gave better fitting of the magnetization than a single-exponential function. In such cases [56,57], the different components were attributed to the relaxation of methyl, methylene, and aromatic protons in the LC molecule. In the present case, despite the fact that a bi-exponential function gives a better fitting than a single-exponential one at low fields, in order to consistently present the spin-lattice relaxation results, we have shown the total relaxation rate—i.e., using only a single exponential function to describe the magnetization decay/recovery curves.
Proton spin-lattice relaxation in liquid crystals is governed by fluctuations of dipolar spin interactions, which are strongly influenced by molecular and collective motions. These could be either motions of individual molecules, such as molecular rotations/reorientations, internal conformational motions, molecular self-diffusion, or collective motions such as order director fluctuation or layer undulations found in macroscopically ordered (for example nematic or smectic) phases [51].
In the isotropic phase, relaxation data is typically interpreted in view of only molecular rotations/reorientations and self-diffusion, although a closer look unveils the effects of local molecular ordering on short time-scales close to the transition temperature as well [56]. These pre-transitional effects have been found to be relevant in bent-core liquid crystals at temperature much higher the isotropic-nematic phases transition [40,41,42,49,70], and they were associated to the occurrence of “cybotactic” clusters [40,41,70]. In all other cases, reorientational and self-diffusion motions, which are two fast dynamic processes, typically represent the most prominent contribution [51,52,56,57] to the relaxation at higher Larmor frequencies in the ordered phases as well. On the other hand, collective motions typically take place on slower timescales and therefore affect the relaxation at lower frequencies, especially below the 1 MHz range. Changes in T1 when crossing the phase transitions are strong indicators of the onset of additional dynamic processes in the system mainly due to changes in local order. Looking at Figure 4 and Figure 5, in both LC systems, T1 temperature dependencies at higher frequencies are flat throughout both isotropic–isotropic’ and isotropic’–cubic phase transitions, indicating that there is no change in fast dynamic processes. The same can be observed when crossing the isotropic–isotropic’ phase transition at lower frequencies: there is no discontinuity and not even a change of the slope, in agreement with what already seen from the NMR diffusion measurements. However, we can spot a clear jump in T1 when crossing from isotropic’ to cubic phase at the lowest frequencies, which represents an indication of the onset of collective motions, which are expected in the locally ordered cubic phase. Additional low-frequency contribution in ordered liquids are commonly attributed to collective molecular dynamics. However some other mechanisms—such as cross-relaxation—cannot be excluded [71].
In the present work, we are focusing on the two consecutive isotropic phases: here, the lack of any discontinuity at the isotropic–isotropic’ phase transition in the temperature dependent T1 trend could be related to the fact that the dominating dynamic contributions are the fast reorientations, namely the overall molecular spinning and internal reorientations. This interpretation agrees with previous 1H NMR relaxometry studies on rod-like LC systems having a relatively similar molecular structure [56,57]. To confirm such a hypothesis, a more detailed study about the frequency dependent T1 trends can be done. In Figure 6 and Figure 7, a selection of T1-dispersions recorded at different temperatures is reported for L1 and 9/2 RS/RS, respectively.
As a general comment, in the L1 sample, we can see a significant difference between the T1-dispersions in the high-temperature isotropic phase (T = 405 K and T = 396 K) with respect to those obtained in the lower temperature isotropic phase (T = 389 K) and in the cubic phase (T = 379 K and T = 371 K). These last T1-dispersions are, indeed, quite similar, as shown in Figure 6. In the case of 9/2 RS/RS sample, on the contrary, the T1-dispersion recorded in the lower temperature isotropic phase (T = 369 K) presented intermediate features between the higher temperature isotropic phase (T = 386 K and T = 377 K) and the cubic phase (T = 360 K and T = 351 K), as seen in Figure 7.
In the present work, we have analyzed in more detail the dynamic behavior of the two samples in the two isotropic phases by fitting the T1-dispersions [51]. In a first approximation, in the isotropic phases, the relaxation rates, R1 (1/T1), can be modelled as the sum of independent contributions due to reorientational motions and to self-diffusion [40,43,70], as reported here:
( 1 T 1 ) = ( 1 T 1 ) R O T + ( 1 T 1 ) S D +
In particular, the following relationships are usually adopted to model the rotational contribution (Equation (5)) and the self-diffusion (Equation (6)) to the relaxation rate in LCs:
( 1 T 1 ) R O T = A ( τ 1 + τ 2 ω 2 + 4 τ 1 + 4 τ 2 ω 2 )
( 1 T 1 ) S D = C D ω
Equation (5) describes the contribution to the proton relaxation rate due to the reorientation motion according to the well-known Blomberger–Purcell–Pound (BPP) model, with A and τ as variable parameters to be optimized [72]. Equation (6) is the contribution to the rate of the proton relaxation depending on the molecular self-diffusion process, when the relationship ω L τ D < 1 is valid, being ω L the Larmor frequency and τ D the average time of the diffusion displacement length [73]. In the case of the high-temperature isotropic phase of L1, a good reproduction of the experimental R1-dispersion curves is obtained by assuming two relevant reorientational motions, modelled according to the BPP model, active in the range between 10 MHz and 5 KHz, and the self-diffusion process, modelled by using Equation (6), active in the MHz regime. Here, we are reporting, as an example, the fitting curves (i.e., the total relaxation rate and the single motion contributions to the relaxation rate) obtained for the L1 sample at 396 K (Figure 8).
Relevant fitting parameters are reported in Table 2. Lowering the temperature to the isotropic’ and cubic phases, these three motional processes are not able alone to give a good reproduction of the experimental data, thus indicating the need of additional processes, most probably related to the occurrence of local orientational ordering (i.e., order director fluctuations) or more complex relaxation processes.
In the case of the 9/2 RS/RS sample, the three motional processes, namely two reorientational motions modelled according to Equation (5) and the molecular self-diffusion process described as reported in Equation (6), give a good reproduction of the total proton spin-lattice relaxation rate, R1, in both isotropic phases. For example, the fitting obtained in the high-temperature isotropic phase at T = 377 K is reported in Figure 9, and relevant fitting parameters are reported in Table 1. As in the case of the L1 system, these three motional processes are not able to reproduce the R1-dispersions in the cubic phase, indicating the need to include additional dynamic contributions.
In a first approximation, single temperature fitting of 1H NMR relaxation curves of the two samples in the isotropic phase indicates that three motional processes can be used to reproduce in a satisfying way the experimental data. By comparing the characteristic correlation times of the two reorientational motions, modelled according to the BPP model [72], namely τROT1 and τROT2, with the average time of the diffusion displacement length, τD, [73], we can see that they differ by one order of magnitude in both samples (see Table 1). In particular, the self-diffusion process is faster than the other two motions, which can be ascribed to the overall molecular spinning (ROT2) and molecular tumbling or other internal reorientations (ROT1). Further investigations, however, are needed in order to extend this preliminary analysis to lower temperature phases by including the temperature dependence of relevant parameters and additional motional and/or relaxation mechanisms in low-temperature phases.

4. Conclusions

In this work, two thermotropic liquid crystalline samples showing the isotropic–isotropic’–cubic phase transition behavior were investigated by means of 1H NMR diffusometry and 1H NMR relaxometry. 1H NMR diffusometry allowed us to distinguish among the different phases. The temperature dependence of the self-diffusion coefficient, D, which is isotropic in all the mesophases, show a clear slope variation at the isotropic–isotropic’ transition and a first-order jump at the isotropic’–cubic phase transition. Based on previous works and on the observed change in the diffusion slope at the isotropic–isotropic’ transition, a plausible explanation is that in the lower temperature isotropic phase local “sponge-like” cubic domains start growing until the cubic phase is reached. On the NMR diffusion time-scale, the measured diffusion coefficient is isotropic, and it results from the time-average between a completely free environment and a locally ordered cluster one. 1H NMR relaxometry added information on the active dynamic processes in the two samples. 1H NMR spin-lattice relaxation times recorded at high frequency do not show any evident discontinuity among the mesophase transitions. However, slightly different behavior was observed between the two samples when moving to frequencies below 1 MHz. A preliminary analysis of the frequency T1-dispersions in the isotropic phase of the two samples allowed us to have a good reproduction of the experimental data by assuming three main motional processes responsible for the proton relaxation rates. These motions were the molecular self-diffusion, active in the MHz regime, and two slower reorientational motions, which were described according to the BPP model, ascribable to overall molecular spinning or internal reorientations (faster processes) and to flipping around the short axis or overall molecular tumbling motion (slower process). However, a more detailed analysis is required in order to better characterize the dynamic motional profiles as a function of temperature and to describe the isotropic’–cubic phase transition and the cubic phases by considering additional relaxation mechanisms.

Supplementary Materials

The following are available online at https://0-www-mdpi-com.brum.beds.ac.uk/2073-4352/9/3/178/s1, Figure S1: Fitting of the magnetization trends recorded for L1 sample at 396K at high field (a) and at low field (b), by using a single- and two-exponential function.

Author Contributions

Conceptualization, V.D. and E.G.; methodology and data analysis, M.C., V.D., T.A., S.V.D. and A.G.; writing—original draft preparation, V.D. and A.G.; writing—review and editing, all authors.

Funding

A.G., T.A. and V.D. acknowledge the support of the CA15209 COST Action (EURELAX). A.G. thanks COST Action CA15209 for the STSM entitled “Molecular dynamics study in a liquid crystal with two isotropic phases using field-cycling relaxometry” (reference code: ECOST -STSM-CA15209- 270317-083751). E.G. thanks the Polish NCN project UMO-2016/22/A/ST5/00319. S.V.D. acknowledges support by the Swedish Research Council VR and by the Russian Foundation for Basic Research (project no. 17-03-00057).

Conflicts of Interest

The authors declare no conflict of interest.

References

  1. Tschierske, C. Liquid crystalline materials with complex mesophase morphologies. Curr. Opin. Colloid Interface Sci. 2002, 7, 69–80. [Google Scholar] [CrossRef]
  2. Tschierske, C. Development of Structural Complexity by Liquid-Crystal Self-assembly. Angew. Chem. Int. Ed. 2013, 52, 8828–8878. [Google Scholar] [CrossRef] [PubMed]
  3. Diele, S. On thermotropic cubic mesophases. Curr. Opin. Colloid Interface Sci. 2002, 7, 333–342. [Google Scholar] [CrossRef]
  4. Zeng, X.; Ungar, G.; Imperor-Clerc, M. A triple-network tricontinuous cubic liquid crystal. Nat. Mater. 2005, 4, 562–567. [Google Scholar] [CrossRef]
  5. Zeng, X.; Cseh, L.; Mehl, G.H.; Ungar, G. Testing the triple network structure of the cubic Imm (I) phase by isomorphous replacement and model refinement. J. Mater. Chem. 2008, 18, 2953–2961. [Google Scholar] [CrossRef]
  6. Ozawa, K.; Yamamura, Y.; Yasuzuka, S.; Mori, H.; Kutsumizu, S.; Saito, K. Coexistence of Two Aggregation Modes in Exotic Liquid-Crystalline Superstructure: Systematic Maximum Entropy Analysis for Cubic Mesogen, 1,2-Bis(4′-n-alkoxybenzoyl)hydrazine [BABH(n)]. J. Phys. Chem. B 2008, 112, 12179–12181. [Google Scholar] [CrossRef]
  7. Zeng, X.; Prehm, M.; Ungar, G.; Tschierske, C.; Liu, F. Formation of a Double Diamond Cubic Phase by Thermotropic Liquid Crystalline Self-Assembly of Bundled Bolaamphiphiles. Angew. Chem. Int. Ed. 2016, 55, 8324–8327. [Google Scholar] [CrossRef]
  8. Vogrin, M.; Vaupotic, N.; Wojcik, M.M.; Mieczkowski, J.; Madrak, K.; Pociecha, D.; Gorecka, E. Thermotropic cubic and tetragonal phases made of rod-like molecules. Phys. Chem. Chem. Phys. 2014, 16, 16067–16074. [Google Scholar] [CrossRef]
  9. Luzzati, V.; Spegt, P.A. Polymorphism of lipids. Nature 1967, 215, 701–704. [Google Scholar] [CrossRef]
  10. Baalbaki, N.H.; Kasting, G.B. A pseudo-quantitative ternary surfactant ion mixing plane phase diagram for a cationic hydroxyethyl cellulose with dodecyl sulfate counterion complex salt. Colloids Surf. A Physicochem. Eng. Asp. 2017, 522, 361–367. [Google Scholar] [CrossRef]
  11. Serrano, L.A.; Fornerod, M.J.; Yang, Y.; Gaisford, S.; Stellacci, F.; Guldin, S. Phase behaviour and applications of a binary liquid mixture of methanol and a thermotropic liquid crystal. Soft Matter 2018, 14, 4615–4620. [Google Scholar] [CrossRef] [Green Version]
  12. Matraszek, J.; Zapala, J.; Mieczkowski, J.; Pociecha, D.; Gorecka, E. 1D, 2D and 3D liquid crystalline phases formed by bent-core mesogens. Chem. Commun. 2015, 51, 5048–5051. [Google Scholar] [CrossRef]
  13. Jasinski, M.; Pociecha, D.; Monobe, H.; Szczytko, J.; Kaszynski, P. Tetragonal Phase of 6 Oxoverdazyl Bent-Core Derivatives with Photoinduced Ambipolar Charge Transport and Electro-optical Effects. J. Am. Chem. Soc. 2014, 136, 14658–14661. [Google Scholar] [CrossRef]
  14. Wolska, J.M.; Pociecha, D.; Mieczkowski, J.; Gorecka, E. Double gyroid structures made of asymmetric dimers. Liq. Cryst. 2016, 43, 235–240. [Google Scholar] [CrossRef]
  15. Archbold, C.T.; Davis, E.J.; Mandle, R.J.; Cowling, S.J.; Goodby, J.W. Chiral dopants and the twist-bend nematic phase--induction of novel mesomorphic behaviour in an apolar bimesogen. Soft Matter 2015, 11, 7547–7557. [Google Scholar] [CrossRef] [PubMed]
  16. Demurtas, D.; Guichard, P.; Martiel, I.; Mezzenga, R.; Hebert, C.; Sagalowicz, L. Direct visualization of dispersed lipid bicontinuous cubic phases by cryo-electron tomography. Nat. Commun. 2015, 6, 8915. [Google Scholar] [CrossRef] [PubMed] [Green Version]
  17. Park, C.; La, Y.; An, T.H.; Jeong, H.Y.; Kang, S.; Joo, S.H.; Ahn, H.; Shin, T.J.; Kim, K.T. Mesoporous monoliths of inverse bicontinuous cubic phases of block copolymer bilayers. Nat. Commun. 2015, 6, 6392. [Google Scholar] [CrossRef] [Green Version]
  18. Kutsumizu, S. Recent progress in the synthesis and structural clarification of thermotropic cubic phases. Isr. J. Chem. 2012, 52, 844–853. [Google Scholar] [CrossRef]
  19. Mori, A.; Yamamoto, E.; Kubo, K.; Ujiie, S.; Baumeister, U.; Tschierske, C. Bicontinuous cubic phase with the Pn3m space group formed by N,N,N-tris(5-alkoxytroponyl)-1,5,9-triazacyclododecanes. Liq. Cryst. 2010, 37, 1059–1065. [Google Scholar] [CrossRef]
  20. Liu, F.; Prehm, M.; Zeng, X.; Tschierske, C.; Ungar, G. Skeletal Cubic, Lamellar, and Ribbon Phases of Bundled Thermotropic Bolapolyphiles. J. Am. Chem. Soc. 2014, 136, 6846–6849. [Google Scholar] [CrossRef] [PubMed]
  21. Kitzerow, H.S. Blue phases at work! ChemPhysChem 2006, 7, 63–66. [Google Scholar] [CrossRef]
  22. Kikuchi, H. Liquid crystalline blue phases. In Liquid Crystalline Functional Assemblies and their Supramolecular Structures, 1st ed.; Kato, T., Ed.; Springer: Berlin, Germany, 2008; pp. 99–117. ISBN 978-3-540-77866-0. [Google Scholar]
  23. He, W.L.; Wang, L.; Wang, L.; Cui, X.P.; Xie, M.W.; Yang, H. Wide Temperature Range Blue Phase Liquid Crystalline Materials. Prog. Chem. 2012, 24, 182–192. [Google Scholar]
  24. Yamamoto, J.; Nishiyama, I.; Inoue, M.; Yokoyama, H. Optical isotropy and iridescence in a smectic ‘blue phase’. Nature 2015, 437, 525–528. [Google Scholar] [CrossRef]
  25. Oton, E.; Netter, E.; Nakano, T.; Katayama, Y.D.; Inoue, F. Monodomain Blue Phase Liquid Crystal Layers for Phase Modulation. Sci. Rep. 2017, 7, 44575. [Google Scholar] [CrossRef] [Green Version]
  26. Yamamoto, T.; Nishiyama, I.; Yoneya, M.; Yokoyama, H. Novel Chiral Effect That Produces the Anisotropy in 3D Structured Soft Material: Chirality-Driven Cubic−Tetragonal Liquid Crystal Phase Transition. J. Phys. Chem. B 2009, 113, 11564–11567. [Google Scholar] [CrossRef] [PubMed]
  27. Nishiyama, I.; Yamamoto, J.; Goodby, J.W.; Yokoyama, H. A symmetric chiral liquid-crystalline twin exhibiting stable ferrielectric and antiferroelectric phases and a chirality-induced isotropic-isotropic liquid transition. J. Mater. Chem. 2001, 11, 2690. [Google Scholar] [CrossRef]
  28. Nishiyama, I.; Yamamoto, J.; Goodby, J.W.; Yokoyama, H. Ferrielectric and antiferroelectric chiral twin liquid crystals showing a stable chiral nematic phase. Liq. Cryst. 2002, 29, 1409. [Google Scholar] [CrossRef]
  29. Cifelli, M.; Domenici, V.; Gorecka, E.; Wojcik, M.; Dvinskikh, S.V. NMR investigation of a thermotropic liquid crystal showing isotropic-isotropic’-(columnar)-cubic phase transitions. Mol. Cryst. Liq. Cryst. 2017, 649, 20–30. [Google Scholar] [CrossRef]
  30. Dong, R.Y. Nuclear Magnetic Resonance of Liquid Crystals, 2nd ed.; Springer: New York, NY, USA, 1997; ISBN 978-1-4612-7354-7. [Google Scholar]
  31. Domenici, V. The role of NMR in the study of partially ordered materials: Perspectives and challenges. Pure Appl. Chem. 2011, 83, 67. [Google Scholar] [CrossRef]
  32. Domenici, V. Nuclear magnetic resonance: A powerful tool to study liquid crystals. Liq. Cryst. Today 2017, 46, 2–10. [Google Scholar] [CrossRef]
  33. Dong, R.Y. Recent NMR Studies of Thermotropic Liquid Crystals. In Annual Reports on NMR Spectroscopy; Webb, G.A., Ed.; Elsevier Academic Press Inc.: San Diego, CA, USA, 2016; pp. 41–174. ISBN 978-0-12-804711-8. [Google Scholar]
  34. Cifelli, M.; Domenici, V.; Veracini, C.A. Recent advancements in understanding thermotropic liquid crystal structure and dynamics by means of NMR spectroscopy. Curr. Opin. Colloid Interface Sci. 2013, 18, 190–200. [Google Scholar] [CrossRef]
  35. Cifelli, M.; Domenici, V.; Marini, A.; Veracini, C.A. NMR studies of the ferroelectric SmC* phase. Liq. Cryst. 2010, 37, 935. [Google Scholar] [CrossRef]
  36. Marini, A.; Domenici, V. H-2, C-13 NMR and Ab Initio Calculations Applied to the SmC* Phase: Methodology and Case Studies. Ferroelectrics 2010, 395, 46. [Google Scholar] [CrossRef]
  37. Domenici, V.; Marini, A.; Veracini, C.A.; Zhang, J.; Dong, R.Y. Effect of the magnetic field on the supramolecular structure of chiral smectic C phases: H-2 NMR studies. ChemPhysChem 2007, 8, 2575. [Google Scholar] [CrossRef]
  38. Domenici, V.; Lelli, M.; Cifelli, M.; Hamplova, V.; Marchetti, A.; Veracini, C.A. Conformational Properties and Orientational Order of a de Vries Liquid Crystal Investigated through NMR Spectroscopy. ChemPhysChem 2014, 15, 1485. [Google Scholar] [CrossRef]
  39. Domenici, V.; Veracini, C.A.; Novotna, V.; Dong, R.Y. Twist grain boundary liquid-crystalline phases under the effect of the magnetic field: A complete H-2 and C-13 NMR study. ChemPhysChem 2008, 9, 556. [Google Scholar] [CrossRef]
  40. Domenici, V. Dynamics in the isotropic and nematic phases of bent-core liquid crystals: NMR perspectives. Soft Matter 2011, 7, 1589. [Google Scholar] [CrossRef]
  41. Domenici, V.; Geppi, M.; Veracini, C.A.; Blinc, R.; Lebar, A.; Zalar, B. Unusual Dynamic Behavior in the Isotropic Phase of Banana Mesogens Detected by 2H NMR Line Width and T2 Measurements. J. Phys. Chem. B. 2005, 109, 769. [Google Scholar] [CrossRef] [PubMed]
  42. Cifelli, M.; Domenici, V. NMR investigation of the dynamics of banana shaped molecules in the isotropic phase: A comparison with calamitic mesogens behaviour. Phys. Chem. Chem. Phys. 2007, 9, 1202. [Google Scholar] [CrossRef] [PubMed]
  43. Furo, I.; Dvinskikh, S.V. NMR methods applied to anisotropic diffusion. Magn. Reson. Chem. 2002, 40, S3–S14. [Google Scholar] [CrossRef]
  44. Cifelli, M.; Domenici, V.; Dvinskikh, S.V.; Veracini, C.A.; Zimmermann, H. Translational self-diffusion in the smectic phases of ferroelectric liquid crystals: An overview. Phase Trans. 2012, 85, 861. [Google Scholar] [CrossRef]
  45. Dvinskikh, S.V.; Furó, I. Nuclear magnetic resonance studies of translational diffusion in thermotropic liquid crystals. Russ. Chem. Rev. 2006, 75, 497. [Google Scholar] [CrossRef]
  46. Cifelli, M.; Domenici, V.; Dvinskikh, S.V.; Glogarova, M.; Veracini, C.A. Translational self-diffusion in the synclinic to anticlinic phases of a ferroelectric liquid crystal. Soft Matter 2010, 6, 5999. [Google Scholar] [CrossRef]
  47. Cifelli, M.; Domenici, V.; Veracini, C.A. From the synclinic to the anticlinic smectic phases: A deuterium NMR and diffusion NMR study. Mol. Cryst. Liq. Cryst. 2005, 429, 167–179. [Google Scholar] [CrossRef]
  48. Cifelli, M.; Domenici, V.; Dvinskikh, S.V.; Luckhurst, G.R.; Timimi, B.A. The twist-bend nematic phase: Translational self-diffusion and biaxiality studied by H-1 nuclear magnetic resonance diffusometry. Liq. Cryst. 2017, 44, 204–218. [Google Scholar] [CrossRef]
  49. Domenici, V. Rod-like and Banana-Shaped Liquid Crystals by Means of Deuterium NMR; Lambert Academic Publishing: Saarbrucken, Germany, 2010; pp. 15–54. [Google Scholar]
  50. Hoatson, G.L.; Levine, Y.K. A comparative survey of the physical techniques used in studies of molecular dynamics. In The Molecular Dynamics of Liquid Crystals; Luckhurst, R.G., Veracini, C.A., Eds.; Nato ASI Series; NATO Publisher: London, UK, 1989. [Google Scholar]
  51. Sebastiao, P.J.; Cruz, C.; Ribeiro, A.C. Advances in Proton NMR Relaxometry in Thermotropic Liquid Crystals. In Nuclear Magnetic Resonance Spectroscopy of Liquid Crystals; Dong, R.Y., Ed.; World Scientific Co.: Oxford, UK, 2009; pp. 129–167. [Google Scholar]
  52. Noack, F. NMR field-cycling spectroscopy: Principles and applications. Prog. Nucl. Magn. Reson. Spectrosc. 1986, 18, 171–276. [Google Scholar] [CrossRef]
  53. Carvalho, A.; Sebastião, P.J.; Ribeiro, A.C.; Nguyen, H.T.; Vilfan, M. Molecular Dynamics in Tilted Bilayer Smectic Phases: A Proton Nuclear Magnetic Resonance Relaxometry Study. J. Chem. Phys. 2001, 115, 10484–10492. [Google Scholar] [CrossRef]
  54. Sebastião, P.J.; Ribeiro, A.C.; Nguyen, H.T.; Noack, F. Proton NMR Relaxation Study of Molecular Motions in a Liquid Crystal with a Strong Polar Terminal Group. Z. Naturforsch. A Phys. Sci. 1993, 48, 851–860. [Google Scholar] [CrossRef]
  55. Sebastião, P.J.; Gradišek, A.; Pinto, L.F.V.; Apih, T.; Godinho, M.H.; Vilfan, M. Fast Field-Cycling NMR Relaxometry Study of Chiral and Nonchiral Nematic Liquid Crystals. J. Phys. Chem. B 2011, 115, 14348–14358. [Google Scholar] [CrossRef]
  56. Apih, T.; Domenici, V.; Gradišek, A.; Hamplová, V.; Kaspar, M.; Sebastião, P.J.; Vilfan, M. 1H NMR Relaxometry Study of a Rod-Like Chiral Liquid Crystal in Its Isotropic, Cholesteric, TGBA*, and TGBC* Phases. J. Phys. Chem. B 2010, 114, 11993–12001. [Google Scholar] [CrossRef]
  57. Gradišek, A.; Apih, T.; Domenici, V.; Novotná, V.; Sebastião, P.J. Molecular Dynamics in a Blue Phase Liquid Crystal: A 1 H Fast Field-Cycling NMR Relaxometry Study. Soft Matter 2013, 9, 10746–10753. [Google Scholar] [CrossRef]
  58. Domenici, V.; Gradišek, A.; Apih, T.; Hamplová, V.; Novotná, V.; Sebastião, P.J. 1H NMR Relaxometry in the TGBA* and TGBC* Phases. Ferroelectrics 2016, 495, 17–27. [Google Scholar] [CrossRef]
  59. Gradišek, A.; Domenici, V.; Apih, T.; Novotná, V.; Sebastião, P.J. 1H NMR Relaxometric Study of Molecular Dynamics in a “de Vries” Liquid Crystal. J. Phys. Chem. B 2016, 120, 4706–4714. [Google Scholar] [CrossRef]
  60. Frise, A.E.; Ichikawa, T.; Yoshio, M.; Ohno, H.; Dvinskikh, S.V.; Kato, T.; Furó, I. Ion conductive behaviour in a confined nanostructure: NMR observation of self-diffusion in a liquid-crystalline bicontinuous cubic phase. Chem. Commun. 2010, 46, 728. [Google Scholar] [CrossRef] [PubMed]
  61. Pampel, A.; Strandberg, E.; Lindblom, G.; Volke, F. High-resolution NMR on cubic lyotropic liquid crystalline phases. Chem. Phys. Lett. 1998, 287, 468. [Google Scholar] [CrossRef]
  62. Momot, K.I.; Takegoshi, K.; Kuchel, P.W.; Larkin, T.J. Inhomogeneous NMR line shape as a probe of microscopic organization of bicontinuous cubic phases. J. Phys. Chem. B 2008, 112, 6636. [Google Scholar] [CrossRef]
  63. Hendrikx, Y.; Sotta, P.; Seddon, J.M.; Dutheillet, Y.; Bartle, E.A. NMR Self-diffusion measurements in inverse micellar cubic phases. Liq. Cryst. 1994, 16, 893. [Google Scholar] [CrossRef]
  64. Burnell, E.E.; Capitani, D.; Casieri, C.; Segre, A.L. A proton nuclear magnetic resonance relaxation study of C12E6/D2O. J. Phys. Chem. B 2000, 104, 8782–8791. [Google Scholar] [CrossRef]
  65. Schlienger, S.; Ducrot-Boisgontier, C.; Delmotte, L.; Guth, J.L.; Parmentier, J. History of the Micelles: A Key Parameter for the Formation Mechanism of Ordered Mesoporous Carbons via a Polymerized Mesophase. J. Phys. Chem. C 2014, 118, 11919–11927. [Google Scholar] [CrossRef]
  66. Jerschow, A.; Müller, N. Suppression of convection artifacts in stimulated-echo diffusion experiments. Double-stimulated-echo experiments. J. Magn. Reson. 1997, 125, 372. [Google Scholar] [CrossRef]
  67. Burstein, D. Stimulated echoes: Description, applications, practical hints. Concepts Magn. Reson. 1996, 8, 269. [Google Scholar] [CrossRef]
  68. Stejskal, E.O.; Tanner, J.E. Spin Diffusion Measurements: Spin Echoes in the Presence of a Time-Dependent Field Gradient. J. Chem. Phys. 1965, 42, 288. [Google Scholar] [CrossRef]
  69. Gibbs, S.J.; Johnson, C.S. A PFG NMR experiment for accurate diffusion and flow studies in the presence of eddy currents. J. Magn. Reson. 1991, 93, 395. [Google Scholar] [CrossRef]
  70. Domenici, V.; Apih, T.; Veracini, C.A. Molecular motions of banana-shaped liquid crystals studied by NMR spectroscopy. Thin Solid Films 2008, 517, 1402–1406. [Google Scholar] [CrossRef]
  71. Canet, D. Introduction to Nuclear Spin Cross-relaxation and Cross-correlation Phenomena in Liquids. In New Developments in NMR; book n. 12, Chapter 1; Canet, D., Ed.; Royal Society of Chemistry: London, UK, 2017; ISBN 1849739137. [Google Scholar]
  72. Bloembergen, N.; Purcell, E.M.; Pound, R.V. Relaxation Effects in Nuclear Magnetic Resonance Absorption. Phys. Rev. 1948, 73, 679. [Google Scholar] [CrossRef]
  73. Vilfan, M.; Rutar, V.; Zumer, S.; Lahajnar, G.; Blinc, R.; Doane, J.W.; Golemme, A. Proton spin-lattice relaxation in nematic microdroplets. J. Chem. Phys. 1988, 89, 597. [Google Scholar] [CrossRef]
Figure 1. Molecular structure of the two rod-like liquid crystals: (a) the symmetric mesogen, 9/2 RS/RS; (b) the asymmetric dimer, L1.
Crystals 09 00178 g001
Figure 2. Pulsed field gradient Stimulated echo with LED for suppression of eddy currents before echo acquisition. Spoil gradient during diffusion time is used to remove spin echo forming after the second radio frequency (r.f.) pulse.
Crystals 09 00178 g002
Figure 3. Diffusion coefficients measured in the three mesophases (isotropic, isotropic’ and cubic phases) of the two samples on cooling from the isotropic phase. (On the right) Data for 9/2 RS/RS are reproduced from Ref. [29] by permission of the publisher Taylor & Francis Ltd. (On the left) In the L1 sample, diffusion coefficients measured varying the diffusion time and gradient directions, as discussed in the text, are also shown as black triangles.
Crystals 09 00178 g003
Scheme 1. Representation of the self-diffusion motion of samples L1 and 9/2 RS/RS in their cubic phase, where the upper limit of the diffusion time scale length, , is evidenced. The sphere of radius indicates that, on the diffusion time scale, the motion of single molecules is isotropic within the cubic mesophase structure.
Crystals 09 00178 sch001
Figure 4. Temperature dependence of proton spin-lattice relaxation time of L1 at some chosen Larmor frequencies. Vertical dashed lines indicate the phase transition temperatures.
Crystals 09 00178 g004
Figure 5. Temperature dependence of proton spin-lattice relaxation time of 9/2 RS/RS at some chosen Larmor frequencies. Vertical dashed lines indicate the phase transition temperatures.
Crystals 09 00178 g005
Figure 6. Frequency (MHz) dependence of proton spin-lattice relaxation time T1 (s) of L1 at some chosen temperatures in the three mesophases: isotropic, isotropic’, and cubic phases.
Crystals 09 00178 g006
Figure 7. Frequency (MHz) dependence of proton spin-lattice relaxation time T1 (s) of 9/2 RS/RS at some chosen temperatures in the three mesophases: isotropic, isotropic’, and cubic phases.
Crystals 09 00178 g007
Figure 8. Frequency (MHz) dependence of proton spin-lattice relaxation rate, R1 (s−1) of L1 at T = 396 K, in a Logarithmic scale, recorded in the high-temperature isotropic phase. The black curve represents the best fitting curve of the R1-dispersion by using Equation (4) with two rotational processes (ROT1 and ROT2) described by the BBP model (Equation (5)) and the self-diffusion (SD) process (Equation (6)). Fitting data are reported in Table 2.
Crystals 09 00178 g008
Figure 9. Frequency (MHz) dependence of proton spin-lattice relaxation rate, R1 (s−1) of 9/2 RS/RS at T = 377 K, on a Logarithmic scale, in the high-temperature isotropic phase. The black curve represents the best fitting curve of the R1-dispersion by using Equation (4) with two rotational processes (ROT1 and ROT2) described by the BBP model (Equation (5)) and the self-diffusion (SD) process (Equation (6)). Fitting data are reported in Table 2.
Crystals 09 00178 g009
Table 1. Mesophase sequences and temperature transitions observed for the two rod-like mesogens from DSC on cooling the samples.
Sample LabelPhase Sequence
9/2 RS/RS [8]Isotropic 372.4 K Isotropic’ 365.6 K Columnar 1/Cubic 2
L1 [14] Isotropic 391.3 °C Isotropic’ 386.4 °C Cubic 3 347.7 °C Crystal
1 Columnar phase with hexagonal symmetry (Colh). 2 Cubic phase with Im3m symmetry. 3 Cubic phase with Ia3d symmetry.
Table 2. Values of T1 (s) at different frequencies (BRLX) and relevant best fitting parameters of the 1H NMR R1—dispersions for the two samples L1 and 9/2 RS/RS in the isotropic phase, as obtained by using Equations (4)–(6).
SamplesT1 (s) at BRLX = 100 MHzT1 (s) at BRLX = 10 MHzT1 (s) at BRLX = 5 KHzAROT1/AROT2τROT1
(10−8 s)
τROT2
(10−8 s)
τD
(10−9 s)
L1 (T = 396 K)0.520.0380.0153.2141.50.3
9/2 RS/RS
(T = 377 K)
0.410.0590.0471.4101.30.5

