Article

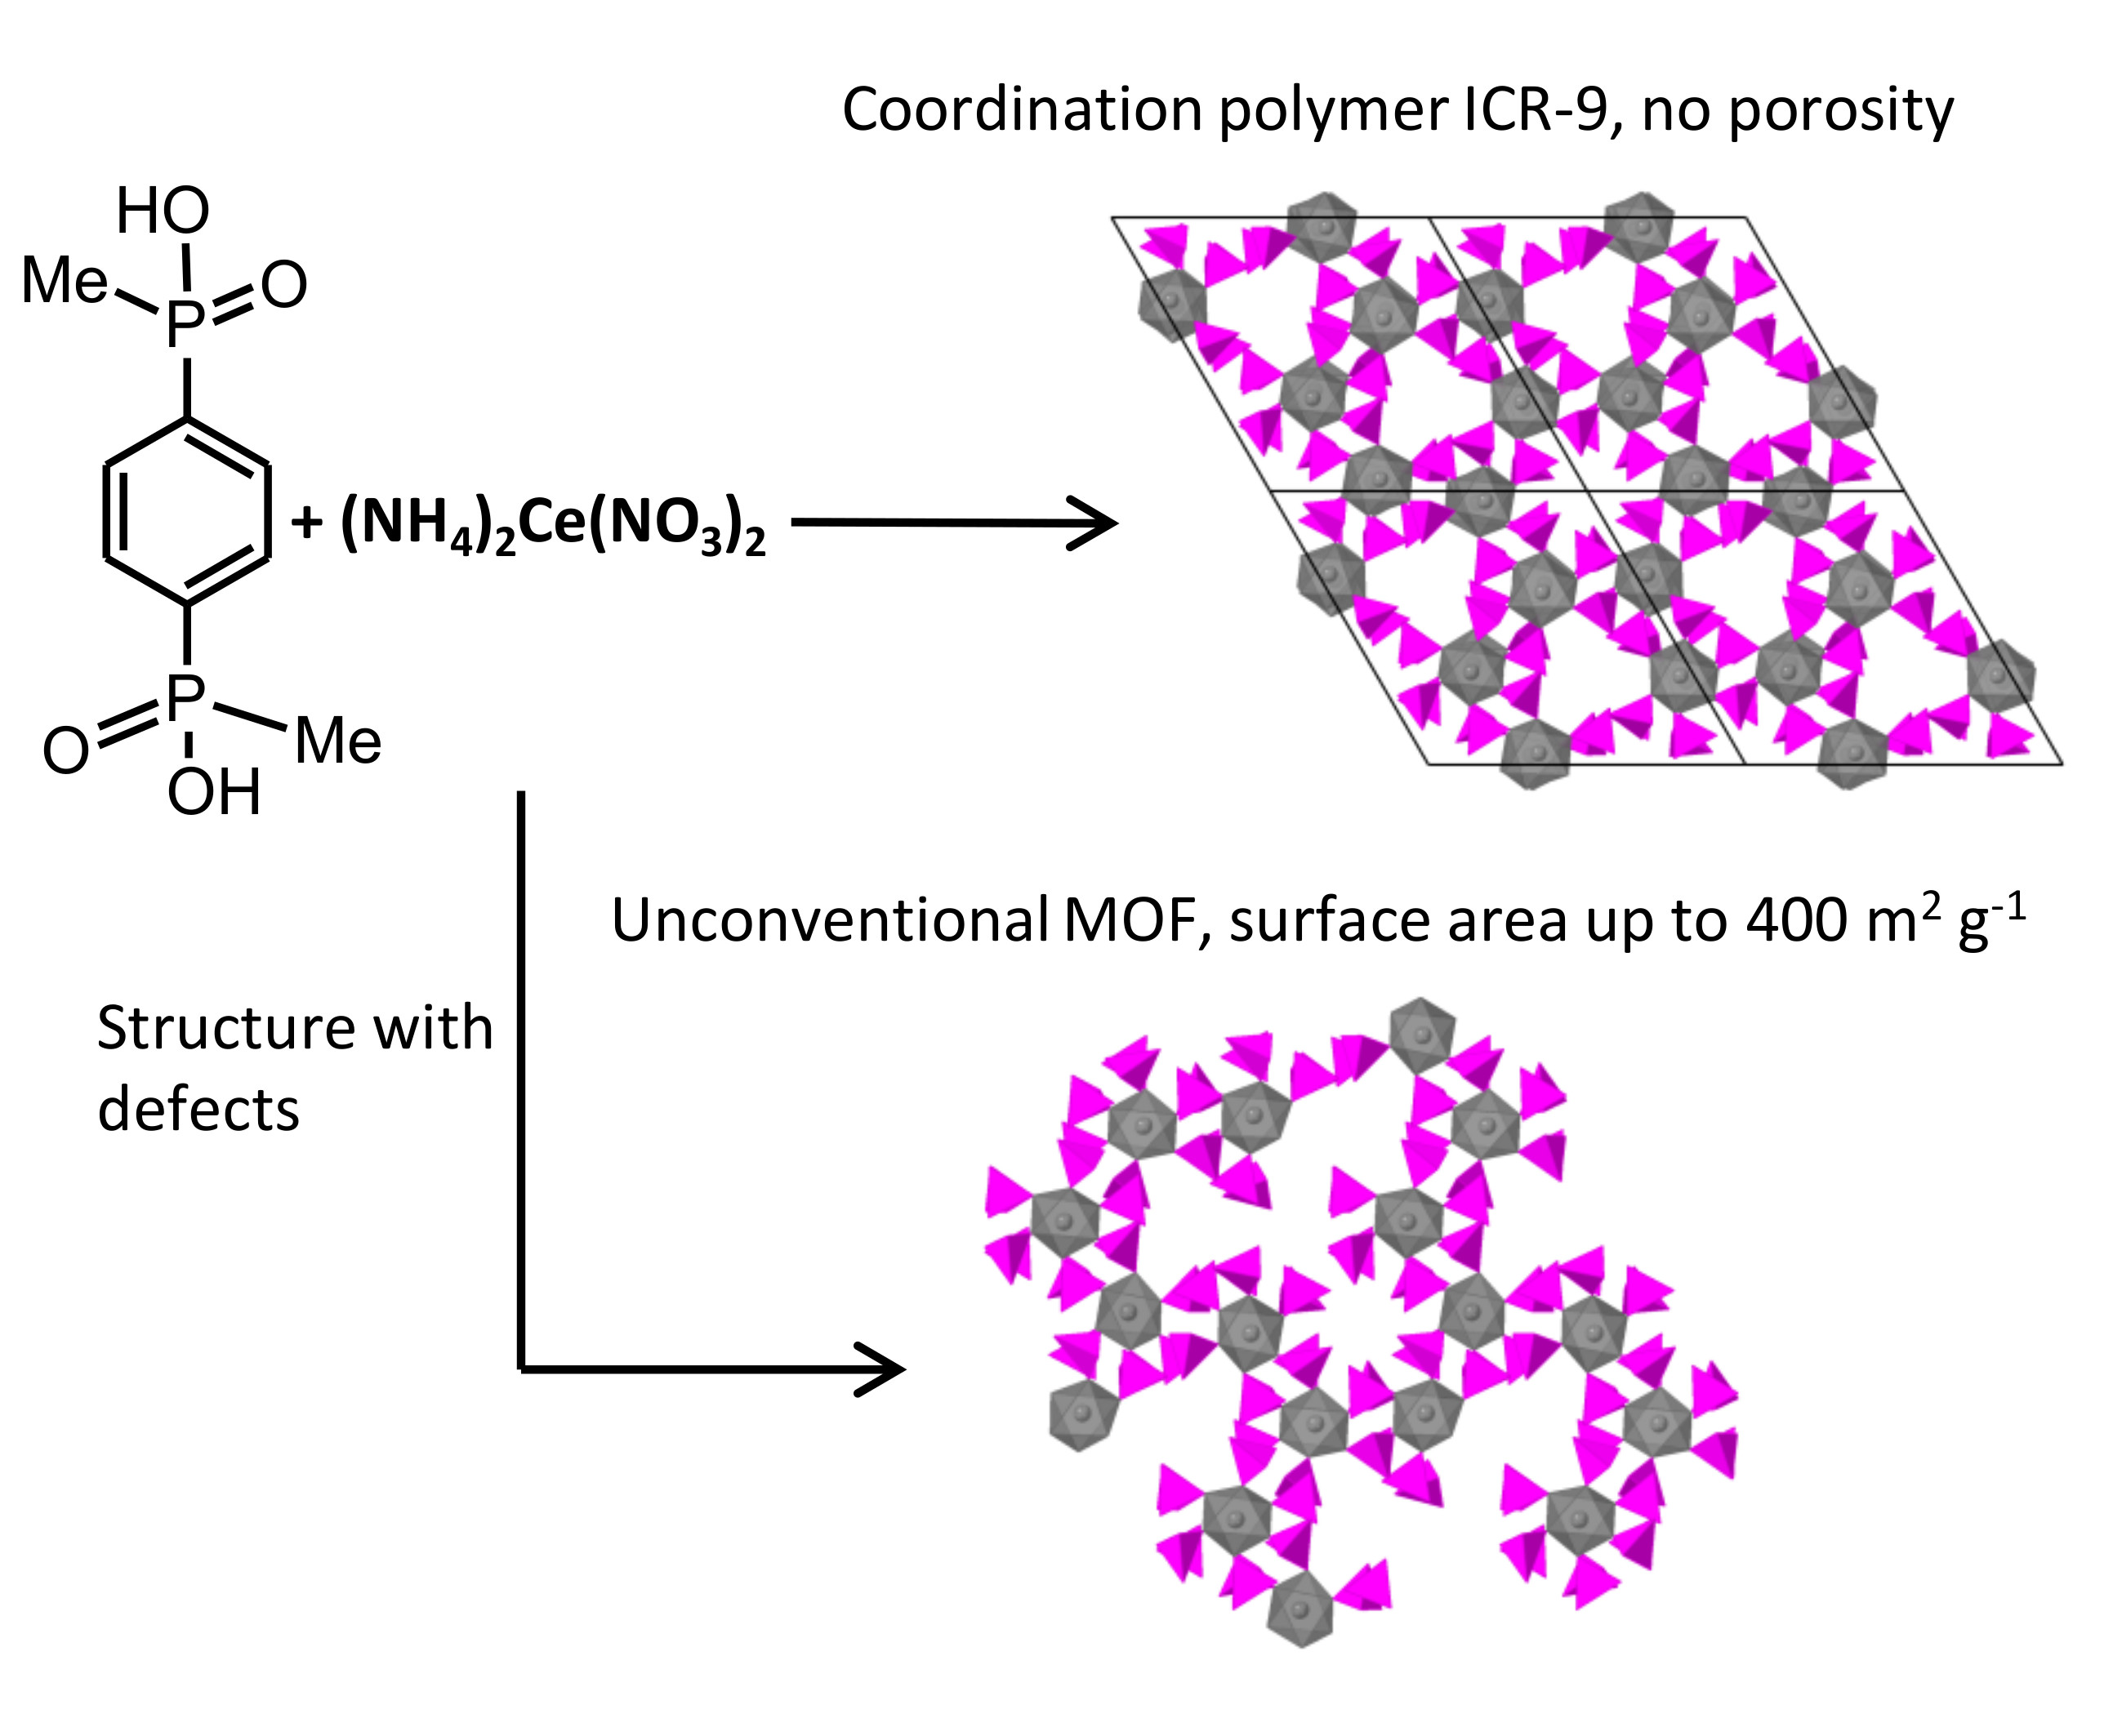
Novel Cerium Bisphosphinate Coordination Polymer and Unconventional Metal–Organic Framework

1
Institute of Physics of the Czech Academy of Sciences, 18221 Prague, Czech Republic
2
Institute of Inorganic Chemistry of the Czech Academy of Sciences, Husinec-Řež 1001, 250 68 Řež, Czech Republic
3
Institute of Macromolecular Chemistry of the Czech Academy of Sciences, Heyrovského nám. 2, 162 06 Prague 6, Czech Republic
*
Author to whom correspondence should be addressed.
Submission received: 30 April 2019 / Revised: 7 June 2019 / Accepted: 7 June 2019 / Published: 12 June 2019
(This article belongs to the Special Issue Metal Phosphonates and Phosphinates)

Abstract

:
The first Ce(III)-based coordination polymer ICR-9 (ICR stands for Inorganic Chemistry Řež), with the formula Ce2(C8H10P2O4)3, containing ditopic phenylene-1,4-bis(methylphosphinic acid) linker, was synthetized under solvothermal conditions. The crystal structure, solved using electron diffraction tomography (EDT), revealed 2D layers of octahedrally coordinated cerium atoms attached together through O-P-O bridges. The structure is nonporous, however, the modification of synthetic conditions led to unconventional metal–organic framework (or defective amorphous phase) with a specific surface area up to approximately 400 m2 g-1.

Graphical Abstract

1. Introduction

Coordination polymers, and particularly the porous subgroup referred to as metal–organic frameworks (MOFs), have been extensively studied during the past decades [1]. Since the early years, carboxylate linkers were in the spotlight, however, the high specific surface area and tunability of the structures is accompanied with generally low stability in air and aqueous environments, hindering their industrial applications [2,3,4].
The next logical step was to use linkers based on a phosphonate group (RPO32−) which forms stronger coordination bonds than carboxylates, however, the presence of three coordinating oxygen atoms results in many coordination modes and the resulting structures are often nonporous [5]. Despite progress in recent years, well crystalline porous structures are difficult to prepare [6], often utilizing high-throughput methods [5]. We kindly refer the reader to other papers included in this issue for more details [7]. On the other hand, syntheses of poorly crystalline or amorphous metal phosphonates, displaying porosity due to the presence of defects, referred to as unconventional metal–organic frameworks (UMOFs), have yielded a large number of highly stable materials [8].
Interestingly, phosphinate-(R1R2POOH) based coordination polymers have attracted much less attention [9]. Most of the reported phosphinate-based coordination polymers use (i) monophosphinic acids, e.g., diphenylphosphinic acid [10], ethylbutylphosphinic acid [11], or m-carboranylphosphininc acid [12,13] which act as bridging ligands forming 1D infinite chains; (ii) ligands with both carboxylic and phosphinic groups, e.g., (2-carboxyethyl)(phenyl)phosphinic acid which form 2D or 3D networks [14,15,16]; (iii) ligands bearing two phosphinic acid groups separated either by methylene bridge forming a 2D network [17], or by 1,1’-substituted ferrocene forming a flexible polymer chain [18,19]. Recently, we reported on the first permanently porous MOF made of bisphosphinate linkers [20].
Cerium in oxidation states Ce(III) and Ce(IV) is known to form stable salts. For this reason, cerium salts in both oxidation states were used for the preparation of coordination polymers, including MOFs. The first Ce-MOF was prepared with phosphonate linker [21], later several studies described the synthesis of cerium analogues of carboxylate Zr-MOFs composed of the [Ce6O4(OH)4]12+ secondary building units [22,23]. MOFs based on Ce(III) forming a linear inorganic building units were also reported [24]. For a recent review on Ce-MOFs, please see [25]. Interestingly, phosphinate coordination polymers with cerium have not been reported yet.
Here, we report on the synthesis and crystal structure of ICR-9 (ICR stands for Inorganic Chemistry Řež), a Ce(III) coordination polymer with phenylene-1,4-bis(methylphosphinic acid)–H2PBP(Me) linker. Because of the microcrystalline nature of the polymer, the crystal structure was determined using electron diffraction tomography (EDT). The pores in the structure are too small to accommodate gas molecules; however, when defective amorphous phase (UMOF) is formed along with the ICR-9 phase, the phase mixtures become microporous with a specific surface area up to approximately 400 m2 g−1.

2. Materials and Methods

2.1. Materials

Ammonium cerium(IV) nitrate (>99.99%), cerium(III) chloride heptahydrate (99.9%), and cerium(III) nitrate hexahydrate (99%) were purchased from Sigma–Aldrich. Phenylene-1,4-bis(methylphosphinic acid) (H2PBP(Me)) was synthetized according to a procedure described earlier [20]. N,N-Dimethylformamide (Penta, Czech Republic; abbreviated as DMF) and acetone (Lach-Ner, Czech Republic) were used as received. Reactions were performed using deionized water (conductivity < 0.15 µS cm−1).

2.2. Preparation of ICR-9

2.2.1. Synthesis of Well-Crystalline ICR-9

A Schlenk tube was charged with 40 mg (0.171 mmol) of H2PBP(Me) and 8 mL of water. The mixture was preheated in an oil bath at 100 °C under stirring. Then, the solution of 93.7 mg (0.171 mmol) of ammonium cerium(IV) nitrate dissolved in 4 mL of DMF was added. The Schlenk tube was sealed and the crystallization was carried out at 100 °C for 3 h under continuous stirring. The resulting white solid was centrifuged (Hettich Rotina 380 R, 5 min, 11,000 rpm), washed three times with DMF and five times with acetone, and air-dried, yielding 38 mg of yellow powder, denoted as ICR-9Cryst. Elemental analysis CHN calculated (%) for Ce2(C8H10P2O4)3: C 28.70, H 3.10, N 0.0; found C 29.13, H 3.08, N 0.0.
Well-crystalline ICR-9 was also prepared from Ce(III) salts—cerium chloride and nitrate. The procedure was identical to the one described above, using 63.7 mg CeCl3·7H2O or 74.3 mg Ce(NO3)3·6H2O (both 0.171 mmol) instead of ammonium cerium(IV) nitrate.

2.2.2. Synthesis of ICR-9 with UMOF Phase

The synthetic protocol was similar to the one used for the well-crystalline ICR-9, however, the solvents for preparing the reactant solutions were interchanged. Thus, a Schlenk tube was charged with 40 mg (0.171 mmol) of H2PBP(Me) and 8 mL of DMF. The mixture was preheated in an oil bath at 100 °C under stirring. Then, the solution of 93.7 mg (0.171 mmol) of ammonium cerium(IV) nitrate dissolved in 4 mL of water was added. The Schlenk tube was sealed and the crystallization was carried out at 100 °C for 0.5 and 1.5 h under continuous stirring to form ICR-9A and ICR-9B, respectively. The resulting white solids were centrifuged (Hettich Rotina 380 R, 5 min, 11,000 rpm), washed three times with DMF and five times with acetone, and air-dried. The yield was 35 and 41 mg for ICR-9A and ICR-9B, respectively. In the case of ICR-9A, the BET (Brunauer–Emmett–Teller) specific surface area varied from batch to batch as much as ±10%. On the other hand, the syntheses of ICR-9B were well reproducible with batch to batch BET specific surface differences within the experimental error. Elemental analysis CHN calculated (%) for Ce2(C8H10P2O4)3: C 28.70, H 3.10, N 0.0; ICR-9A found C 24.83, H 3.15, N 1.29; ICR-9B found C 25.22, H 3.00, N 0.74. The content of nitrogen is in line with a small amount of DMF trapped in the pores of UMOF, see below. The lower content of measured carbon can originate from defects in the structure of the UMOF phase.

2.3. Instrumental Methods

Electron diffraction tomography experiments were performed on a Philips CM120 microscope (120 kV) with a LaB6 cathode equipped with an Olympus SIS Veleta CCD camera (14 bit) (Olympus Corporation, Tokyo, Japan). Samples were measured at 100 K (sample holder tip temperature). The platelet crystals were twisted and preferentially oriented with [001] parallel to the electron beam. Due to large mosaicity and a lattice parameter c of 40.7 Å, it was not possible to use precession [26] to integrate the diffraction data. Finer sampling of the reciprocal space was used instead with a tilt step of 0.5°. Crystals were fished from the acetone suspension on a lacey-carbon Cu transmission electron microscopy (TEM) grid. Measurements were done in a micro-diffraction mode. Datasets were processed with the PETS program [27], indexed and refined in Jana2006 software package [28].
High-resolution scanning electron microscopy (SEM) was performed using a FEI Nova NanoSEM (Thermo Fisher Scientific, Waltham, MA, USA) equipped with a circular backscatter detector in the backscattered electron mode. An accelerating voltage was set to 5 kV. The samples were suspended in acetone in an ultrasonic bath, deposited onto a silicon wafer chip, and air-dried overnight. Thermal analyses (DTA/TGA) were carried out on a Setaram SETSYS Evolution-16-MS (Setaram, Caluire, France) instrument coupled with a mass spectrometer. The measurements were performed in synthetic air (30 mL min−1) from 20 to 650 °C with a heating rate of 10 °C min−1. Fourier transform infrared (FTIR) spectra were collected with a Nicolet NEXUS 670-FT spectrometer (Thermo Fisher Scientific, Waltham, MA, USA) in KBr pellets. Elemental analysis (CHN) was done using analyzer Thermo Scientific FlashSmartTM 2000 Elemental analyzer (Thermo Fisher Scientific, Waltham, MA, USA). A combustion tube was equipped by EA-2000 chromium oxidizer, high quality copper reducer, and silver cobaltous–cobaltic oxide. All the measurements were performed three times.
The polycrystalline bulk samples were measured at room temperature on a PANalytical Empyrean powder diffractometer (Malvern Pananalytical, Almelo, Netherlands) equipped with a Cu anode and a PIXCel3D detector (Malvern Pananalytical, Almelo, Netherlands). The sample was measured in the reflection Bragg–Brentano geometry. The result of the EDT experiment was confirmed by a simple Rietveld fit in Jana2006, where the structural model was fixed and only profile parameters together with unit cell and preferred orientation were refined, see Figure S1 with the final Rietveld plots. The solid state NMR (ssNMR) spectra were recorded at 11.7 T using a Bruker AVANCE III HD spectrometer (Bruker, Billerica, MA, USA). The 3.2-mm cross-polarization magic angle spinning (CP/MAS) probe was used for 13C and 31P characterization at Larmor frequencies of υ (13C) = 125.783 MHz and υ (31P) = 202.478 MHz, respectively. The 13C and 31P ssNMR spectra were collected at 20 kHz spinning speed. The 13C NMR isotropic chemical shifts were calibrated using α-glycine (13C: 176.03 ppm; carbonyl signal) and 31P NMR shift using liquid 85% H3PO4 in H2O at 0.0 ppm, both as external standards. High-power 1H decoupling rCwApA [29] and SPINAL64 were used to eliminate heteronuclear dipolar couplings, for 13C and 31P ssNMR spectra, respectively. Directly excited 13C and 31P MAS NMR experiments were performed with a recycle delay of 10 s. Five thousand one hundred and twenty and 128 scans were collected in each 13C and 31P MAS NMR experiment, respectively. The total of 4096 scans were accumulated for each 13C CP/MAS NMR spectrum with a recycle delay of 2 s and 1.75 ms cross-polarization (CP) mixing time. Each 31P CP/MAS NMR spectrum was recorded using 512 scans with a recycle delay of 2 s and 2 ms CP mixing time. Frictional heating of the spinning samples was compensated by active cooling [30] and the dried samples were placed into ZrO2 rotors. All NMR spectra were processed using the Top Spin 3.5 pl7 software package.

3. Results and Discussion

3.1. Synthesis

The coordination polymer ICR-9 with the formula Ce2(C8H10P2O4)3 was prepared by the solvothermal synthesis. H2PBP(Me) was dissolved in H2O and the formed solution was preheated to 100 °C, the DMF solution of Ce(IV) salt was added, and the reaction mixture was stirred at 100 °C for 3 h. The produced sample is further denoted as ICR-9Cryst. We used (NH4)2Ce(NO3)6 for the standard synthesis where Ce(IV) is reduced in situ to Ce(III), similarly as described earlier [31]. To confirm this hypothesis, we performed the syntheses using Ce(NO3)3·6H2O or CeCl3·7H2O, also yielding materials with the ICR-9 structure. Interestingly, when we exchanged the solvents in which the components were dissolved, i.e., H2PBP(Me) was dissolved in DMF, preheated, and then Ce(IV) salt was added in H2O, we obtained the mixture of the UMOF and ICR-9 phases. The amount of the crystalline ICR-9 increased with increasing reaction time. ICR-9A and ICR-9B were prepared with reaction times of 30 and 90 min, respectively. When the reaction was prolonged to 3 h, diffraction lines of additional unknown phase appeared (Figure S2).

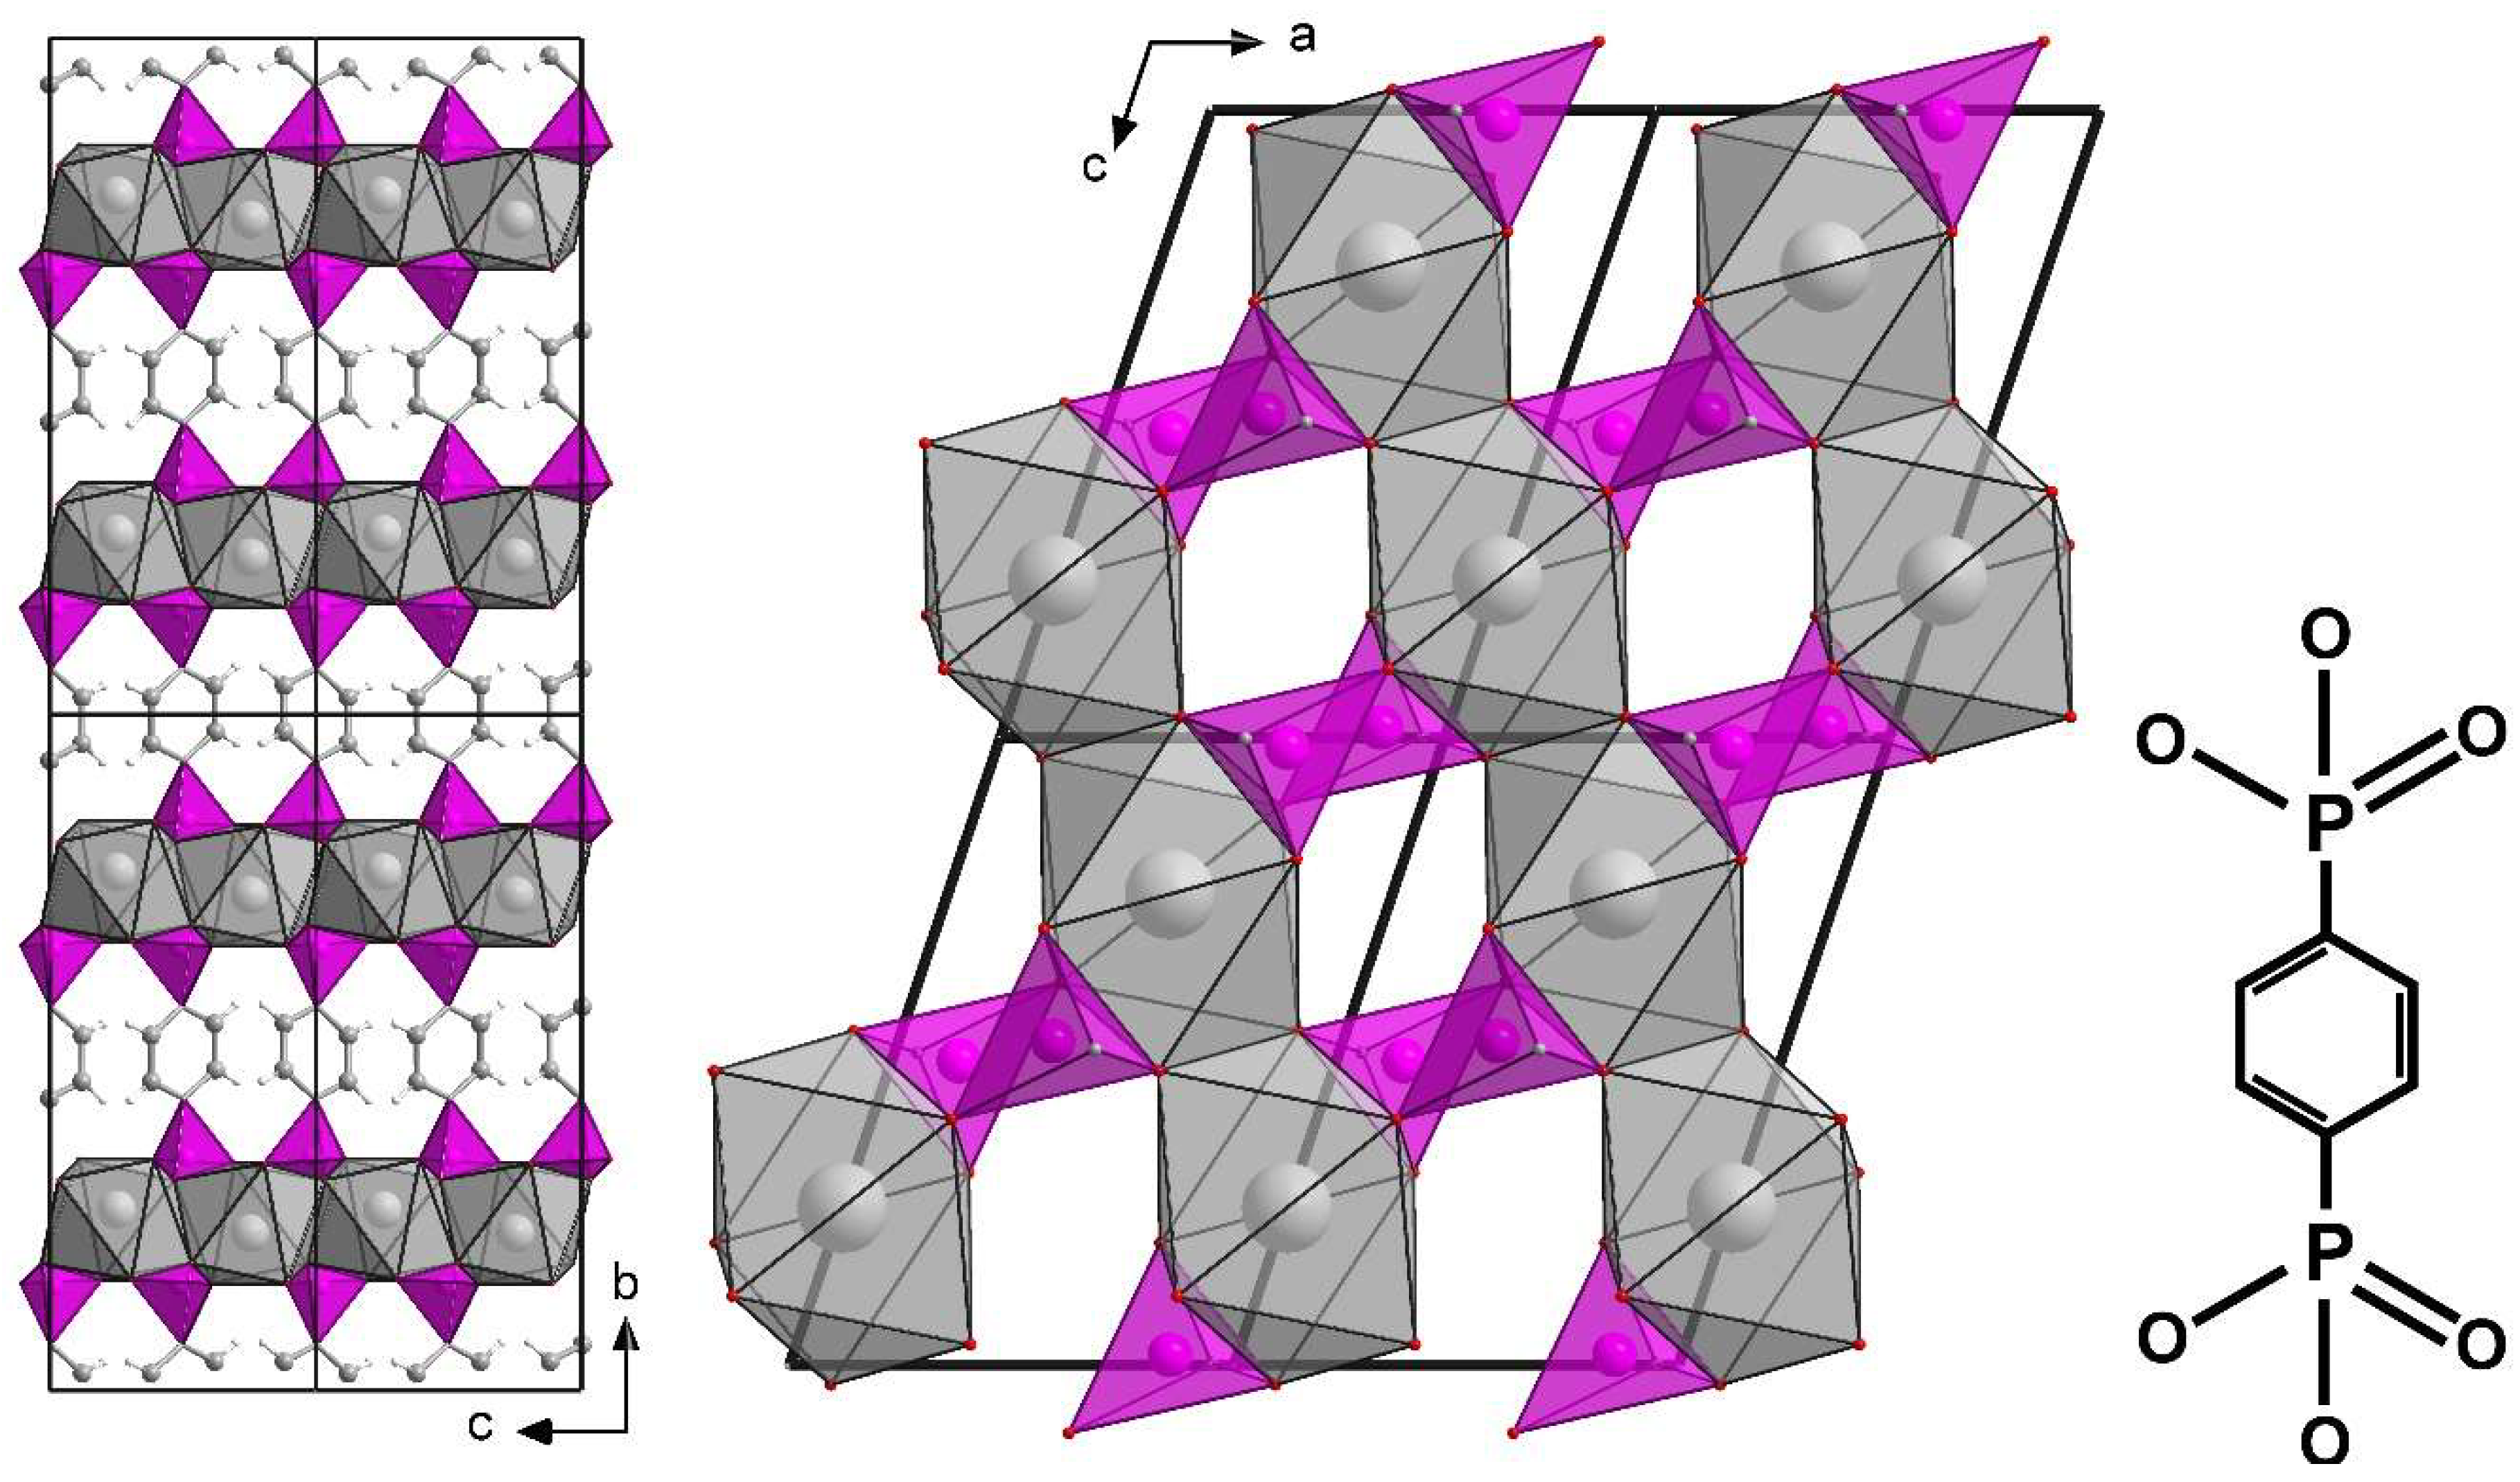
3.2. Structure of ICR-9

The structure was solved ab initio in the P63/m spacegroup using the SIR2014 software [32]. The lattice parameters were a = 17.4 (1), c = 40.7 (5) Å. Three out of five independent linker molecules were found in the solutions completely. The phenylene groups of the two remaining linkers were not clearly observed in the solution, the atomic positions were found in the difference potential map of the kinematically-refined structure model. The molecules were restrained using distance (0.001 sigma), angular (0.01 sigma), atomic displacement parameters (ADP), and planarity parameters. Hydrogen atoms were introduced in geometrically expected positions and their ADPs were set as riding with extension equal to two. Kinematical refinement resulted in R(obs) = 33.17% on 1704 observed reflections out of 3349 measured using 150 parameters. For crystallographic details see Table S1, the crystallographic data for ICR-9 are deposited at the Cambridge Crystallographic Data Centre (CCDC) no. 1913129 [33].
The crystal structure of ICR-9 consists of 2D layers of octahedrally coordinated cerium atoms bound together through O-P-O bridges, see Figure 1 right. The octahedral coordination of cerium atom is noticeably distorted. The phenylene bridges connect these 2D layers of cerium atoms into the 3D framework (Figure 1 left). There are two rows of differently oriented phenylene bridges. In the first row, containing a mirror plane perpendicular to [001], all three crystallographically independent phenylene groups are arranged perpendicularly to this mirror plane and thus to the 2D layers of cerium atoms, while in the second row the angles between bridging phenylene groups and 2D connecting layers are 67° and 75°. The structure contains voids with a calculated pore limiting diameter of approximately 1.3 Å and a maximal pore diameter in cavities of approximately 3.6 Å. Although the calculated values may be affected by an error, they confirm the nonporous nature of IRC-9Cryst (see below), because the size of the pore limiting diameter is too small for N2 molecules.
The structure of ICR-9 has a similar 2D layered arrangement to Ce(III) coordinated by 1,4-phenylenebis(phosphonate) with the formula Ce[O3P(C6H4)PO3H], see Figure 2 [34]. In this case, Ce(III) ions are coordinated by 8 oxygen atoms and create a slightly distorted dodecahedron bisdisphenoid. The connectivities in these layers are different than those in ICR-9. The dodecahedron bisdisphenoids are connected directly with each other through edge-sharing on two opposite sides and by O-P-O bridges forming the final 2D layer. The layers are connected by phenylene groups that are disordered in two positions. To the best of our knowledge, ICR-9 is the first structure with the motive of 2D layers of cerium atoms arranged in the hexagonal honeycomb, connected by oxygen atoms through phosphorus or through any other atoms —(O—Ce—O—X)6— where X = P, S, C, or any other atom.

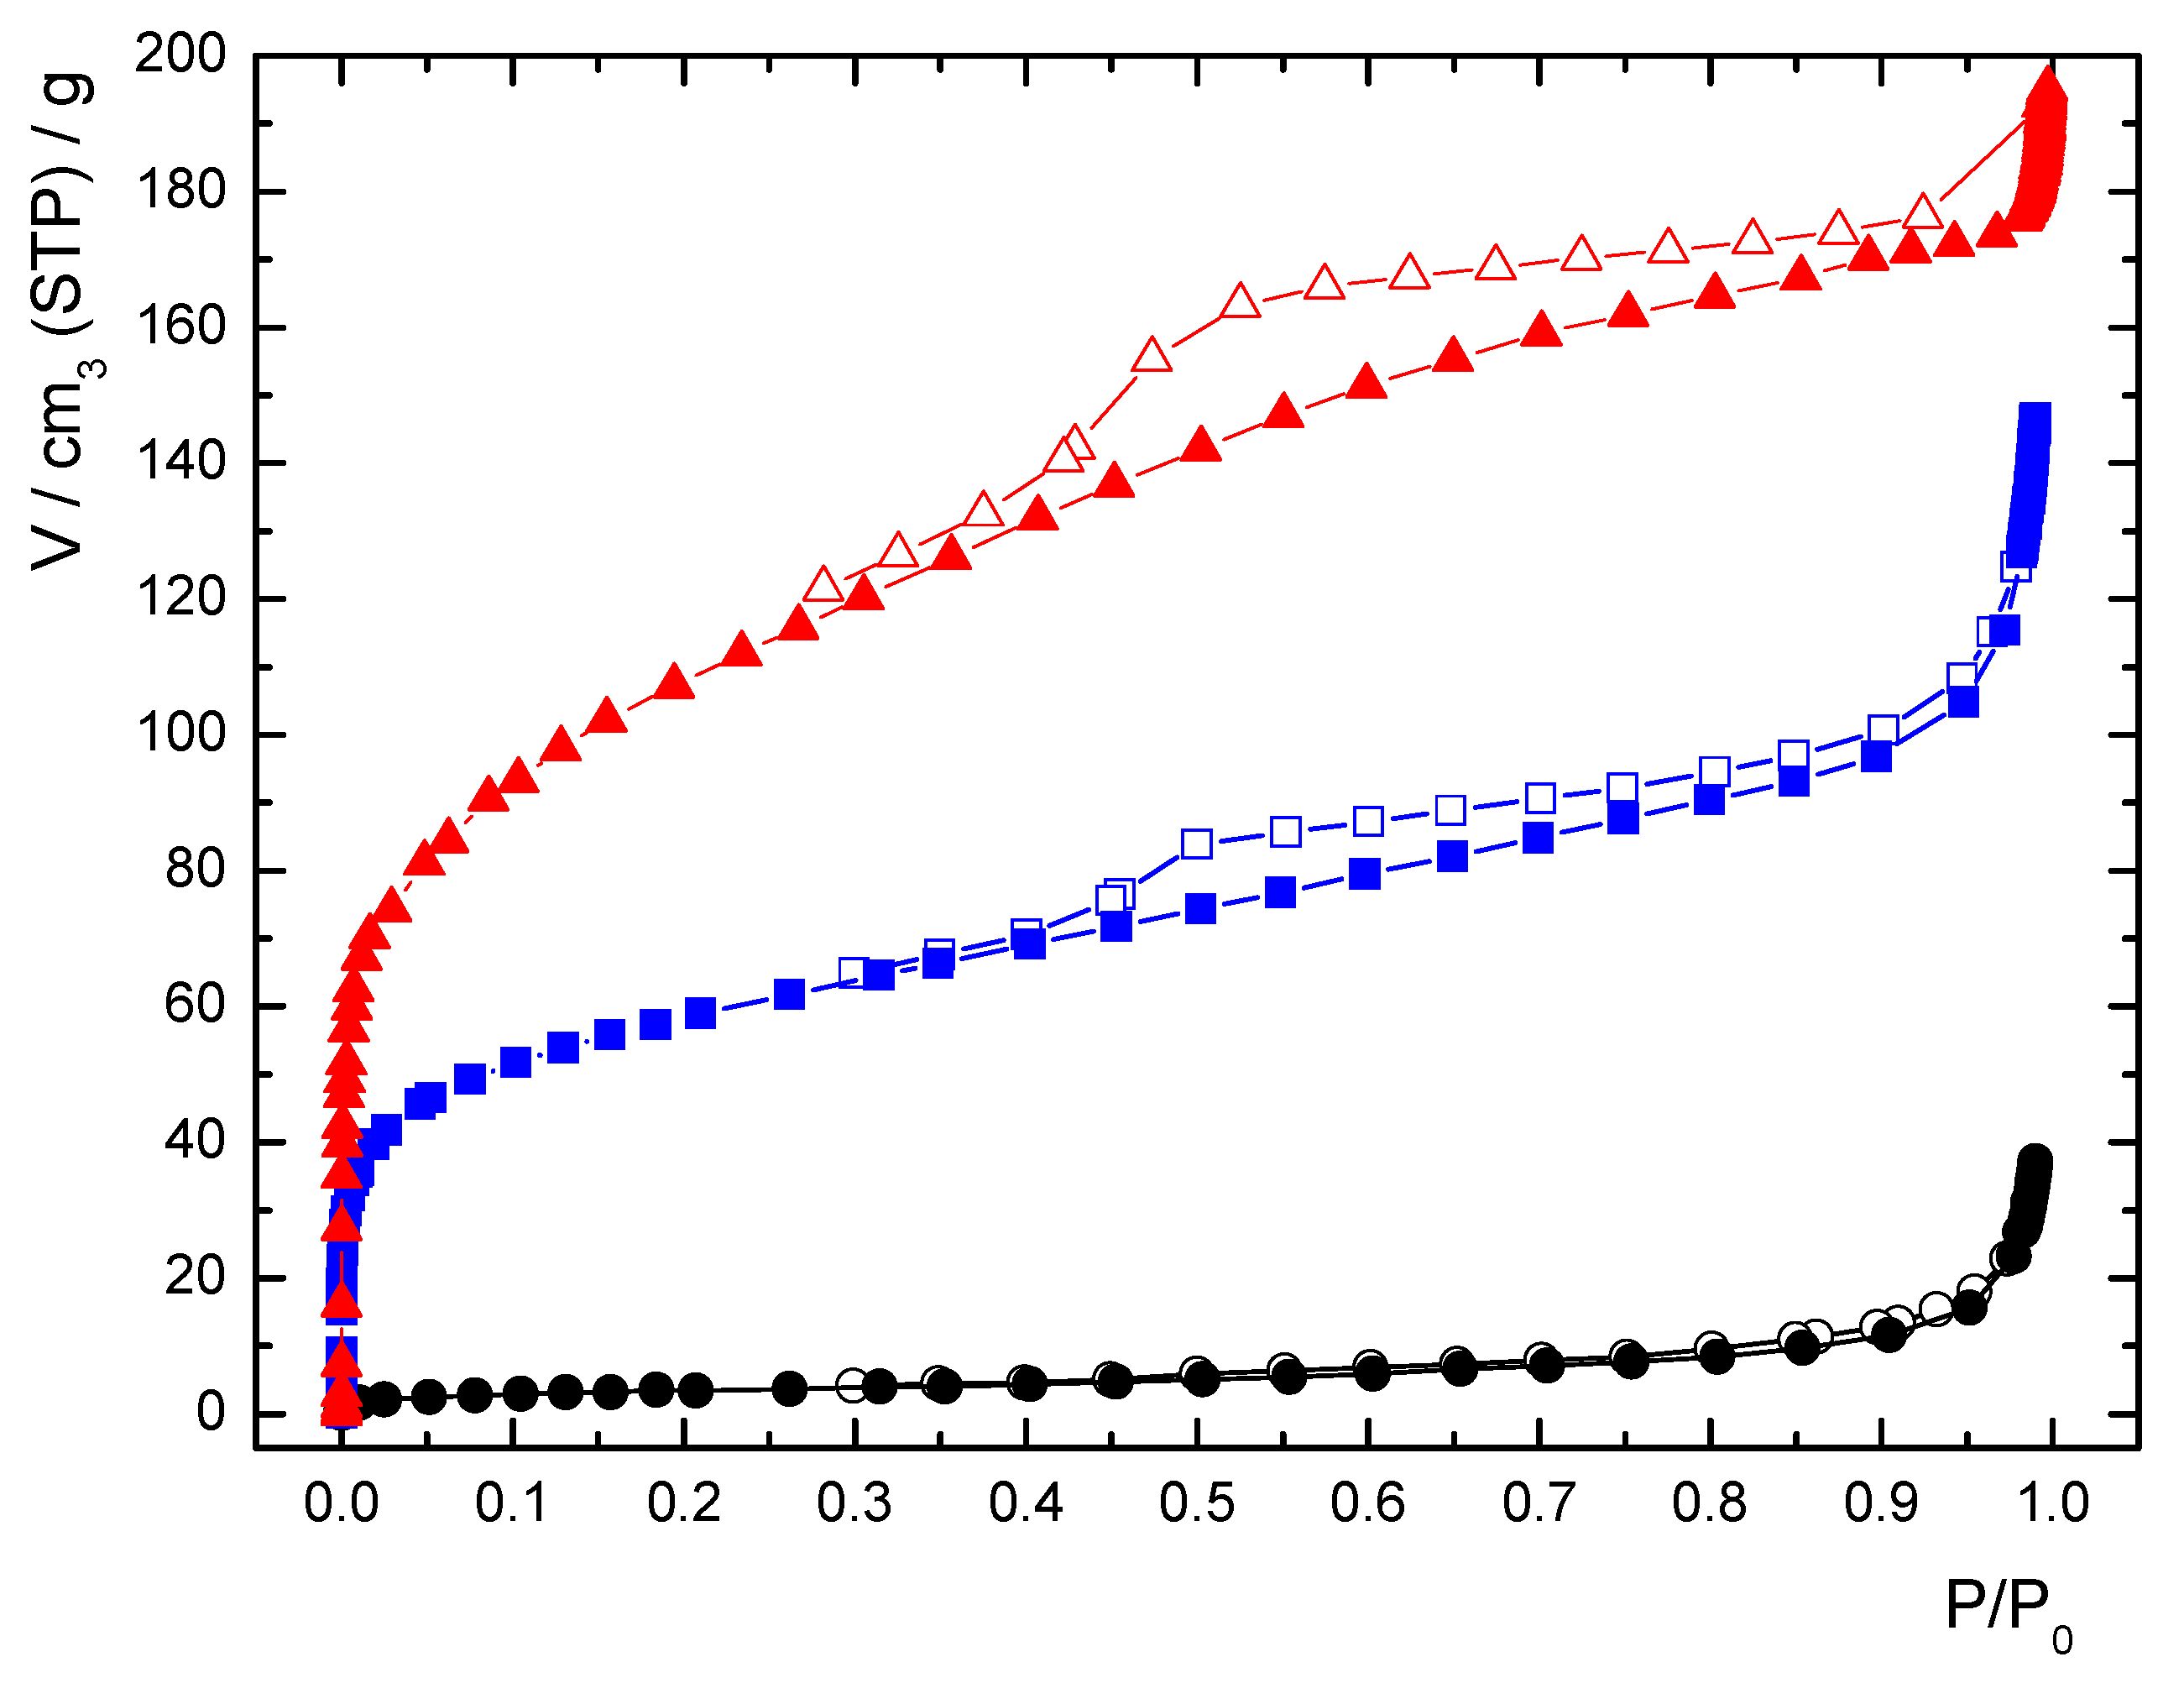
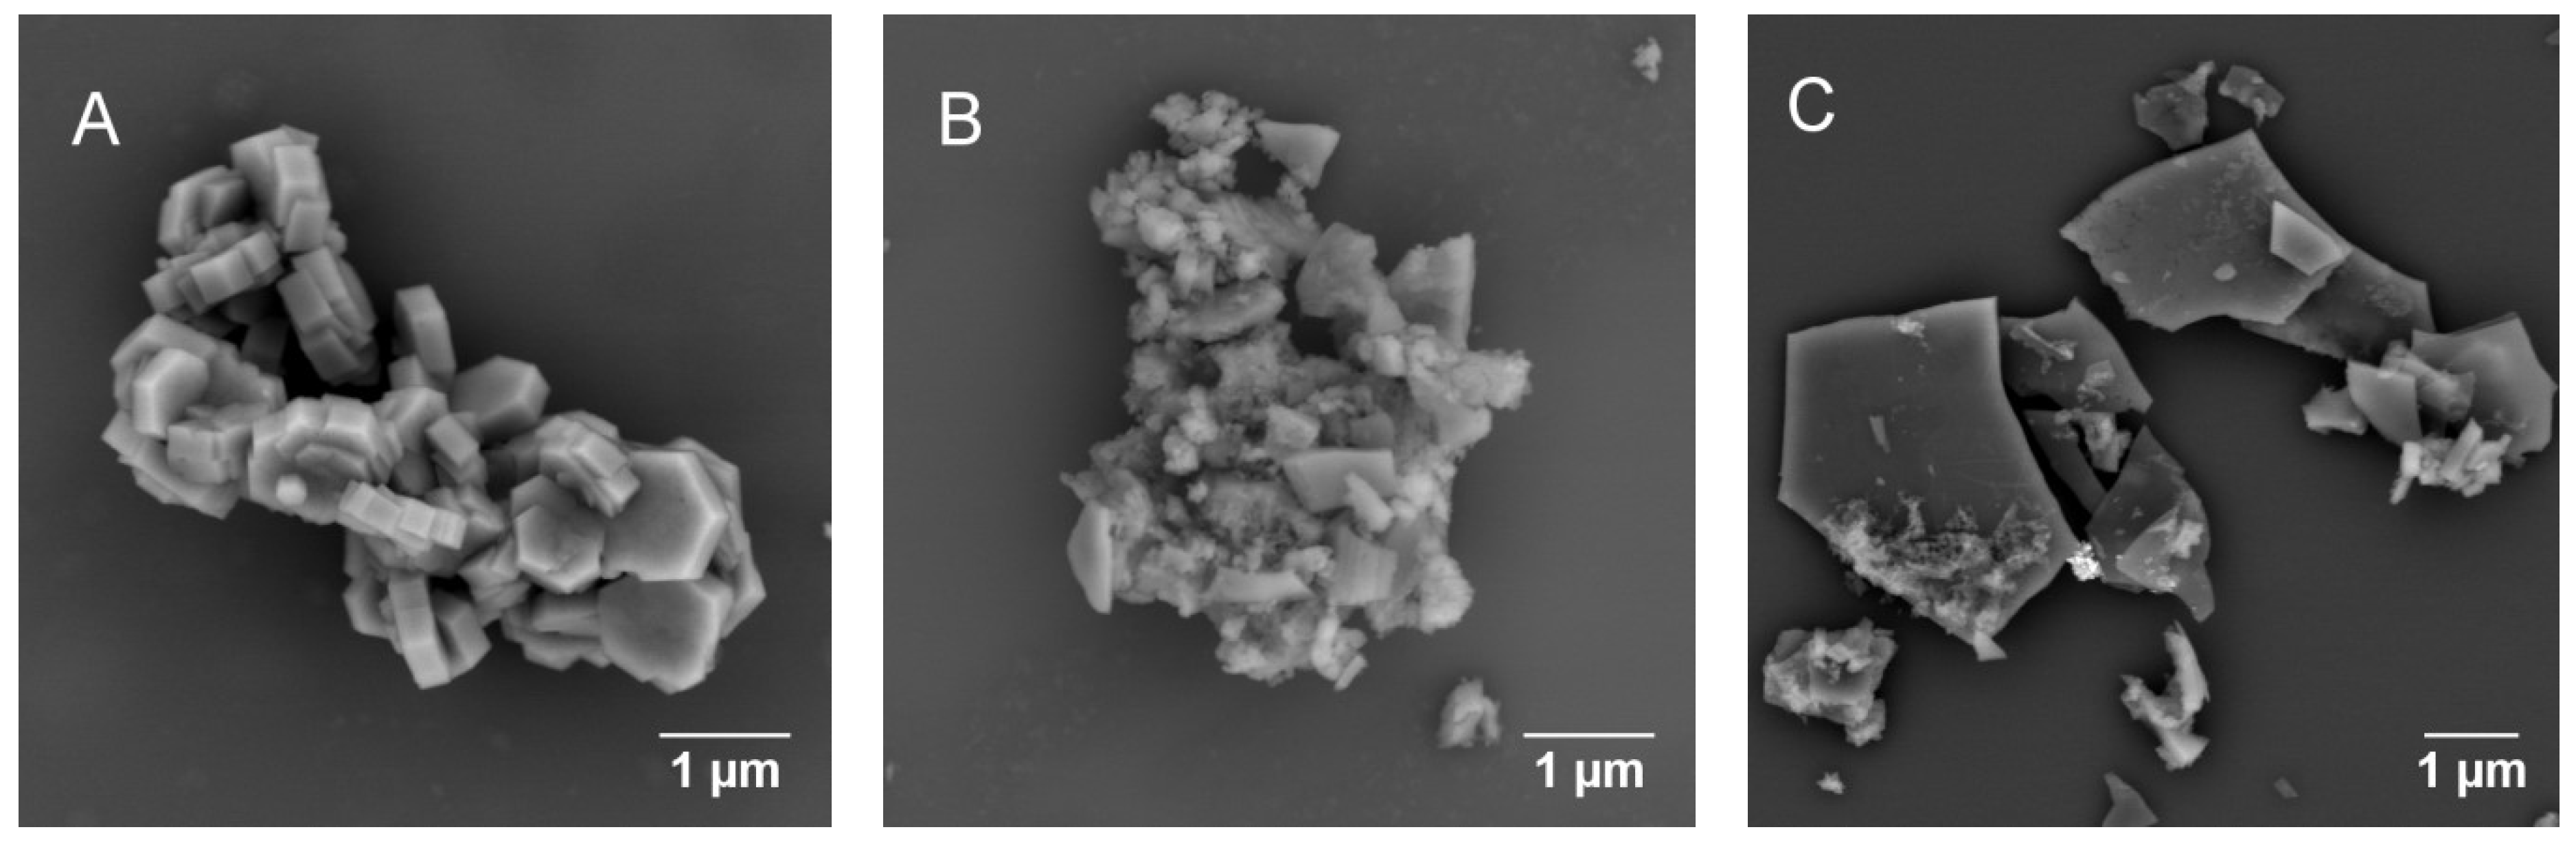
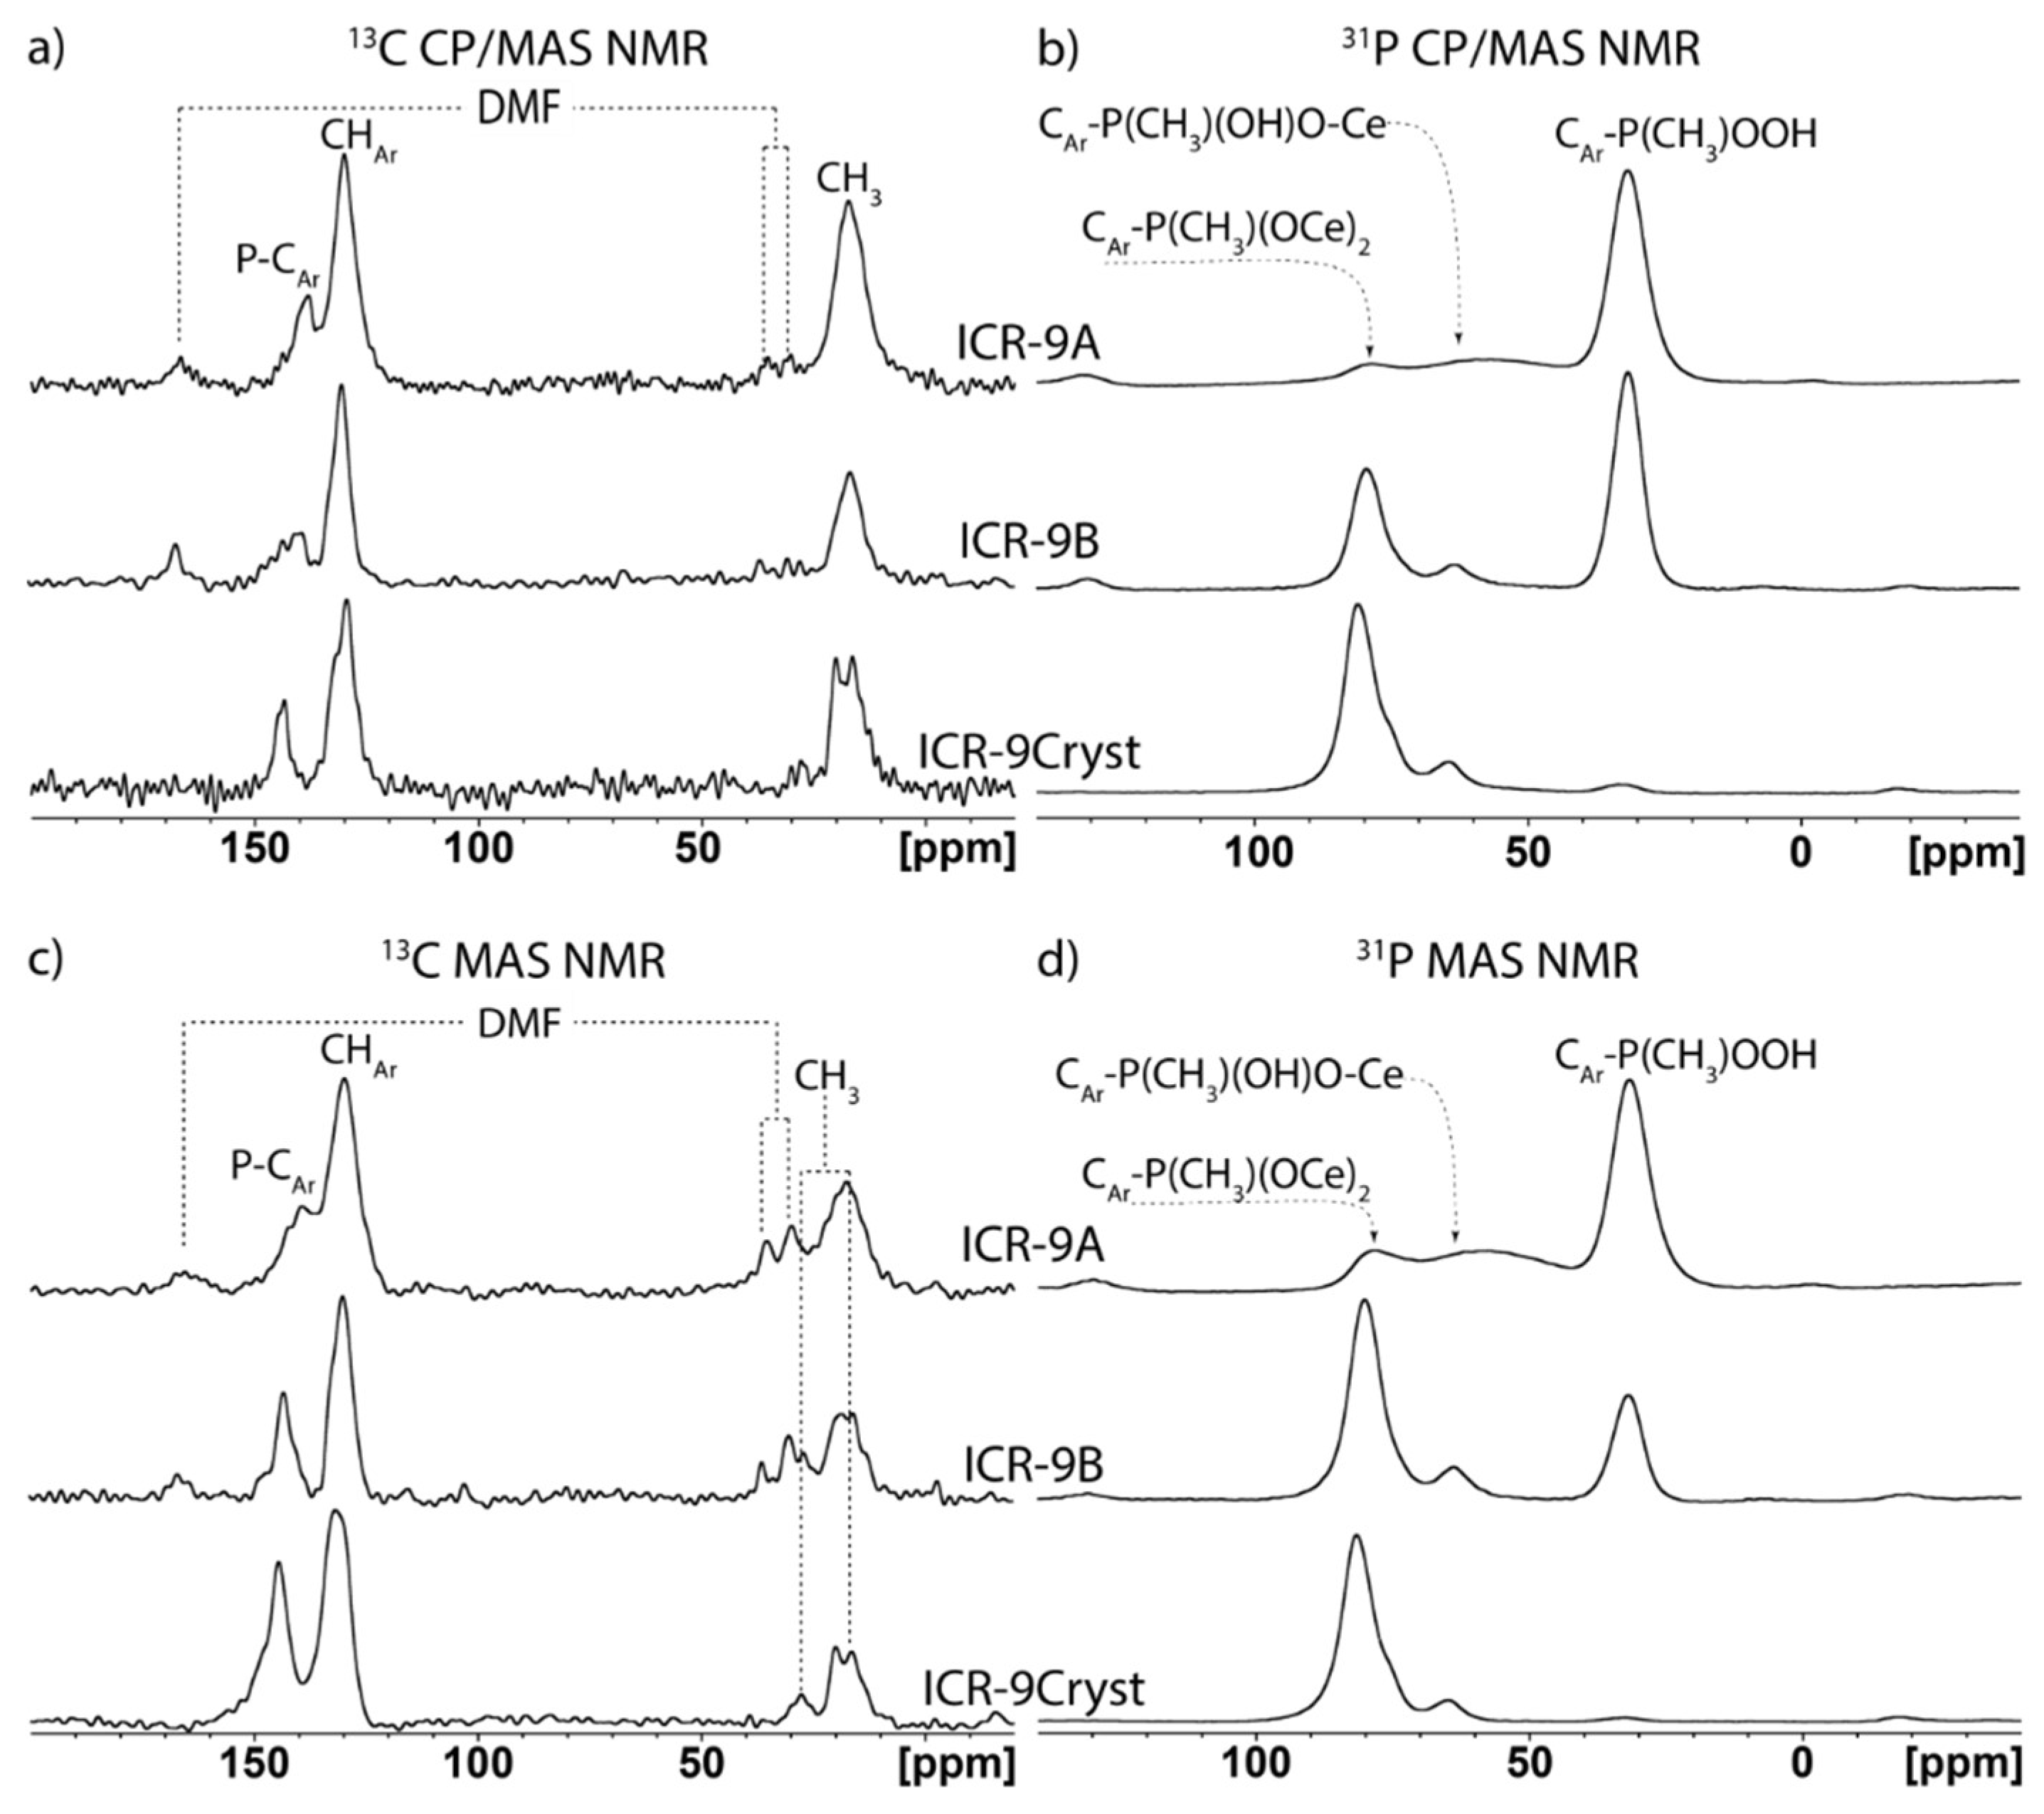
3.3. Characterization

The purity of the bulk ICR-9Cryst sample was confirmed by a simple Rietveld fit using fundamental parameters approach, see Figure S1. Interestingly, the comparison of the full width at half maximum of Bragg reflections of ICR-9Cryst, ICR-9A, and ICR-9B revealed, that the crystalline domain size does not change significantly (approximately 170 nm). The most obvious difference is the presence of a broad peak of amorphous phase between 6 and 12° 2θ in the ICR-9A and ICR-9B patterns. The peak / background ratio indicate various amounts of an amorphous phase, see Figure 3 [35,36]. While ICR-9Cryst does not contain the broad amorphous peak, the largest amount of the amorphous phase is present in the ICR-9A sample, see Table 1.
As mentioned above, the modification of the synthetic conditions led to the microporosity of ICR-9A and ICR-9B. The specific surface area ranged from 13 m2 g−1 for the well crystalline ICR-9Cryst up to 395 m2 g−1 for ICR-9A (Figure 4). The pore size distributions of ICR-9A and ICR-9B are rather wide with a maximum at 7 Å, see Figures S3 and S4.
The SEM image of ICR-9Cryst (Figure 5) shows uniform, well-shaped particles with hexagonal structure. In the case of ICR-9A, the uniformity of the particles is lost, and sheet-like particles are accompanied by a phase of an unresolved shape. Similarly, ICR-9B formed sheet-like particles. However, the presence of the phase of unresolved shape is limited.
To describe the UMOF phase and ascertain the origin of the microporosity, we performed detailed solid state NMR (ssNMR) study. The presented 13C and 31P ssNMR (directly-excited MAS and CP/MAS NMR) spectra indicate the formation of a 3D-coordination polymer with a different level of defects, in other words with distinct crystallinity and porosity. In Figure 6, 13C ssNMR spectra (a) and 31P ssNMR spectra (b) of all prepared ICR-9 samples are depicted. The 13C MAS and CP/MAS NMR spectra (Figure 6a,c) confirm the presence of PBP(Me)2− incorporated into the structure in all cases. The signals at 142 ± 2 ppm and 130 ± 1 ppm in all the 13C ssNMR spectra were attributed to individual non-equivalent aromatic carbons, (>P-CAr≤ and = CHAr-), respectively. Furthermore, in the case of the highly-crystalline system (ICR-9Cryst), three distinct methyl groups are clearly resolved with chemical shifts 28.5 ppm, 20.2 ppm, and 16.4 ppm. The presence of these methyl groups can be expected in all samples, and this is verified based on the shape of the unresolved signal in the relevant region (Figure 6c). Interestingly, when a cross polarization technique (13C CP/MAS NMR) was used the resonance at 28.5 ppm disappeared, which indicates higher mobility of these methyl groups in comparison with the other two. Moreover, in the cases of samples containing the UMOF phase (ICR-9A and ICR-9B), a considerable amount of DMF was also detected in the 13C MAS NMR spectra. The presence of DMF was further confirmed by DTA/TGA (Figures S5–S7) and elemental analyses. The amount of DMF in the ICR systems was determined using Equation 1 and is listed in Table 1.
m o l % ( D M F ) =   ( I ( C H O ) ) D M F ( I ( C H ) A r 4 ) P B P ( M e ) ,
where (I(CHO))DMF corresponds to the integral area of peaks at 167.1 ppm attributed to the DMF aldehyde group. The integral area of the peak at 130 ± 1 ppm is attributed to the four CH groups of the aromatic rings and is marked as (I(CH)Ar/4)PBP(Me).
In the 31P MAS and CP/MAS NMR spectra, three distinct signals in a relatively broad range of chemical shifts were recorded (Figure 6b, d). These signals correspond to phosphinate groups of PBP(Me)2− in three different coordination modes: the signals at 80.6 ± 2 ppm, 61.6 ± 4 ppm, and 31.5 ± 1 ppm in the 31P ssNMR spectra were attributed to phosphinate groups coordinated by two oxygens, one oxygen, and non-coordinated phosphinate groups of PBP(Me)2− to Ce(III) atoms, respectively. This assignment of the individual peaks is based on the 31P NMR spectrum of neat PBP(Me)2− and on a significant enhancement of signal intensities at 61.6 ± 4 ppm and 31.5 ± 1 ppm when a cross polarization technique (31P CP/MAS NMR) was employed (Figure S8). The increased intensity indicates the presence of hydroxyl groups in close proximity to phosphorus atoms. Furthermore, the observable change of 31P NMR chemical shifts between “non-coordinated” PBP(Me)2− and neat PBP(Me)2− as well as the half-width of peaks at 31.5 ± 1 ppm in 31P ssNMR spectra suggests that PBP(Me)2− is coordinated into the framework structure by at least one functional group. Simply put, the presence of totally uncoordinated PBP(Me)2− is excluded in all three investigated systems. On the other hand, the amount of uncoordinated phosphinate groups corresponds to the increasing amount of the UMOF phase as well as to the increasing porosity (Table 1).

4. Conclusions

In the present work, we have prepared the first cerium phosphinate coordination polymer ICR-9. For this purpose, we used phenylene-1,4-bis(methylphosphinic acid) to obtain the polymer with the Ce2[PBP(Me)]3 formula. The structure was determined by electron diffraction tomography to reveal an unusual coordination motive of 2D layers with octahedrally coordinated cerium atoms arranged in the hexagonal honeycomb array. These layers are connected by phenylene bridges to form the 3D polymer. The structure is rather dense with pores smaller than the size of N2 molecules; however, when the unconventional MOF is formed from the same components, the specific surface area can be as high as approximately 400 m2 g−1.

Supplementary Materials

The following are available online at https://0-www-mdpi-com.brum.beds.ac.uk/2073-4352/9/6/303/s1, Figure S1: Rietveld fit of ICR-9Cryst. Figure S2: Powder XRD pattern of the sample prepared by the defective procedure with a reaction time of 3 h. Figure S3: Pore size distribution of ICR-9A. Figure S4: Pore size distribution of ICR-9B. Figure S5: DTA/TGA curves and the evolution of gases for ICR-9Cryst. Figure S6: DTA/TGA curves and the evolution of gases for ICR-9A. Figure S7: DTA/TGA curves and the evolution of gases for ICR-9B. Figure S8: Assignment of 31P peaks in the solid state NMR spectra. Figure S9: FTIR spectra of ICR-9Cryst, ICR-9A, and ICR-9B. Table S1. Crystallographic details of ICR-9.

Author Contributions

Conceptualization, J.D.; investigation, J.R., D.B., L.K., P.B, and J.H.; writing—original draft preparation, J.D. and J.R.; writing—review and editing, K.L. and J.B.; project administration, J.D.

Funding

This research was funded by the Czech Science Foundation, grant number 18-12925S.

Acknowledgments

The authors are grateful to the working group Interactions of Inorganic Clusters, Cages, and Containers with Light within the AV21 Strategy of the Czech Academy of Science, Petr Bezdička for the measurement of powder XRD, and the use of ASTRA laboratory instruments established within the Operation program Prague Competitiveness - project CZ.2.16/3.1.00/24510.

Conflicts of Interest

The authors declare no conflict of interest.

References

  1. Kaskel, S. The Chemistry of Metal–Organic Frameworks: Synthesis, Characterization, and Applications; Wiley-VCH: Weinheim, Germany, 2017; Volume 2. [Google Scholar]
  2. Leus, K.; Bogaerts, T.; De Decker, J.; Depauw, H.; Hendrickx, K.; Vrielinck, H.; Van Speybroeck, V.; Van Der Voort, P. Systematic study of the chemical and hydrothermal stability of selected “stable” Metal Organic Frameworks. Microporous Mesoporous Mater. 2016, 226, 110–116. [Google Scholar] [CrossRef]
  3. Bůžek, D.; Demel, J.; Lang, K. Zirconium Metal-Organic Framework UiO-66: Stability in Aqueous Environment and its Relevance for Organophosphate Degradations. Inorg. Chem. 2018, 57, 14290–14297. [Google Scholar] [CrossRef] [PubMed]
  4. Bůžek, D.; Zelenka, J.; Ulbrich, P.; Ruml, T.; Křížová, I.; Lang, J.; Kubát, P.; Demel, J.; Kirakci, K.; Lang, K. Nanoscaled porphyrinic metal-organic frameworks: Photosensitizer delivery systems for photodynamic therapy, J. Mater. Chem. B 2017, 5, 1815–1821. [Google Scholar] [CrossRef]
  5. Clearfield, A.; Demadis, K. Metal Phosphonate Chemistry: From Synthesis to Applications; Royal Society of Chemistry: Oxford, UK, 2012. [Google Scholar]
  6. Taddei, M.; Costantino, F.; Vivani, R. Robust Metal-Organic Frameworks Based on Tritopic Phosphonoaromatic Ligands. Eur. J. Inorg. Chem. 2016, 2016, 4300–4309. [Google Scholar] [CrossRef]
  7. Shearan, S.J.I.; Stock, S.; Emmerling, F.; Demel, J.; Wright, P.A.; Demadis, K.D.; Vassaki, M.; Costantino, F.; Vivani, R.; Sallard, S.; et al. New Directions in Metal Phosphonate and Phosphinate Chemistry. Crystals 2019, 9, 270. [Google Scholar] [CrossRef]
  8. Gagnon, K.J.; Perry, H.P.; Clearfield, A. Conventional and Unconventional Metal-Organic Frameworks Based on Phosphonate Ligands: MOFs and UMOFs. Chem. Rev. 2012, 112, 1034–1054. [Google Scholar] [CrossRef] [PubMed]
  9. Carson, I.; Healy, M.R.; Doidge, E.D.; Love, J.B.; Morrison, C.A.; Tasker, P.A. Metal-binding motifs of alkyl and aryl phosphinates; versatile mono and polynucleating ligands. Coord. Chem. Rev. 2017, 335, 150–171. [Google Scholar] [CrossRef] [Green Version]
  10. Du, J.-L.; Rettig, S.J.; Thompson, R.C.; Trotter, J. Synthesis, structure, and magnetic properties of diphenylphosphinates of cobalt(II) and manganese(II). The crystal and molecular structures of the γ forms of poly-bis(μ-diphenylphosphinato)cobalt(II) and manganese(II). Can. J. Chem. 1991, 69, 277–285. [Google Scholar] [CrossRef]
  11. Rosca, I.; Nechita, M.-T.; Sutiman, D.; Cailean, A.; Sibiescu, D.; Vizitiu, M. New iron (III) coordination compounds with applications in water treatment. Environ. Eng. Manag. J. 2010, 9, 511–517. [Google Scholar]
  12. Oleshkevich, E.; Viñas, C.; Romero, I.; Choquesillo-Lazarte, D.; Haukka, M.; Teixidor, F. M-Carboranylphosphinate as Versatile Building Blocks to Design all Inorganic Coordination Polymers. Inorg. Chem. 2017, 56, 5502–5505. [Google Scholar] [CrossRef]
  13. Oleshkevich, E.; Teixidor, F.; Rosell, A.; Viñas, C. Merging Icosahedral Boron Clusters and Magnetic Nanoparticles: Aiming toward Multifunctional Nanohybrid Materials. Inorg. Chem. 2018, 57, 462–470. [Google Scholar] [CrossRef] [PubMed]
  14. Du, Z.-Y.; Zhang, L.; Wang, B.-Y.; Liu, S.-J.; Huang, B.; Liu, C.-M.; Zhang, W.-X. Two magnetic Δ-chain-based Mn(II) and Co(II) coordination polymers with mixed carboxylate-phosphinate and μ3-OH bridges. CrystEngComm. 2017, 19, 1052–1057. [Google Scholar] [CrossRef]
  15. Yang, W.; Wang, H.; Tian, W.-G.; Li, J.; Sun, Z.-M. The first family of actinide carboxyphosphinates: Two- and three-dimensional uranyl coordination polymers. Eur. J. Inorg. Chem. 2014, 31, 5378–5384. [Google Scholar] [CrossRef]
  16. Li, J.; Xue, C.-C.; Liu, S.; Wang, Z.-X. Structures and magnetic properties of two noncentrosymmetric coordination polymers based on carboxyphosphinate ligand. Solid State Sci. 2016, 61, 111–115. [Google Scholar] [CrossRef]
  17. Cecconi, F.; Dakternieks, D.; Duthie, A.; Ghilardi, C.A.; Gili, P.; Lorenzo-Luis, P.A.; Midollini, S.; Orlandini, A. Inorganic-organic hybrids of the p,p′-diphenylmethylenediphosphinate ligand with bivalent metals: A new 2D-layered phenylphosphinate zinc(II) complex. J. Solid State Chem. 2004, 177, 786–792. [Google Scholar] [CrossRef]
  18. Shekurov, R.; Miluykov, V.; Kataeva, O.; Krivolapov, D.; Sinyashin, O.; Gerasimova, T.; Katsyuba, S.; Kovalenko, V.; Krupskaya, Y.; Kataev, V.; et al. Inorganic-organic hybrids of the p,p′-diphenylmethylenediphosphinate ligand with bivalent metals: A new 2D-layered phenylphosphinate zinc(II) complex. Cryst. Growth Des. 2016, 16, 5084–5090. [Google Scholar] [CrossRef]
  19. Shekurov, R.; Khrizanforova, V.; Gilmanova, L.; Khrizanforov, M.; Miluykov, V.; Kataeva, O.; Yamaleeva, Z.; Burganov, T.; Gerasimova, T.; Khamatgalimov, A.; et al. Zn and Co redox active coordination polymers as efficient electrocatalysts. Dalton Trans. 2019, 48, 3601–3609. [Google Scholar] [CrossRef] [PubMed]
  20. Hynek, J.; Brázda, P.; Rohlíček, J.; Londesborough, M.G.S.; Demel, J. Phosphinic Acid Based Linkers: Building Blocks in Metal–Organic Framework Chemistry. Angew. Chem. Int. Ed. 2018, 130, 5016–5019. [Google Scholar] [CrossRef]
  21. Costantino, F.; Gentili, P.L.; Audebrand, N. A new dual luminescent pillared cerium(IV)sulfate–diphosphonate. Inorg. Chem. Commun. 2009, 12, 406–408. [Google Scholar] [CrossRef]
  22. Lammert, M.; Wharmby, M.T.; Smolders, S.; Bueken, B.; Lieb, A.; Lomachenko, K.A.; De Vos, D.; Stock, N. Cerium-based metal organic frameworks with UiO-66 architecture: Synthesis, properties and redox catalytic activity. Chem. Commun. 2015, 51, 12578–12581. [Google Scholar] [CrossRef]
  23. Lammert, M.; Reinsch, H.; Murray, C.A.; Wharmby, M.T.; Terraschke, H.; Stock, N. Synthesis and Structure of Zr(IV)- and Ce(IV)-Based CAU-24 with 1,2,4,5-Tetrakis(4-Carboxyphenyl)-Benzene. Dalton Trans. 2016, 45, 18822–18826. [Google Scholar] [CrossRef] [PubMed]
  24. Almáši, M.; Zeleňák, V.; Opanasenko, M.; Císařová, I. Ce(III) and Lu(III) Metal-Organic Frameworks with Lewis Acid Metal Sites: Preparation, Sorption Properties and Catalytic Activity in Knoevenagel Condensation. Catal. Today 2015, 243, 3098–3114. [Google Scholar] [CrossRef]
  25. Atzori, C.; Lomachenko, K.A.; Øien-Ødegaard, S.; Lamberti, C.; Stock, N.; Barolo, C.; Bonino, F. Disclosing the Properties of a New Ce(III)-Based MOF: Ce2(NDC)3(DMF)2 Cryst. Growth Des. 2019, 19, 787–796. [Google Scholar] [CrossRef]
  26. Vincent, R.; Midgley, P.A. Double conical beam-rocking system for measurement of integrated electron diffraction intensities. Ultramicroscopy 1994, 53, 271–282. [Google Scholar] [CrossRef]
  27. Palatinus, L. PETS–Program for Analysis of Electron Diffraction Data; Institute of Physics of the Czech Academy of Sciences: Prague, Czech Republic, 2011. [Google Scholar]
  28. Petříček, V.; Dušek, M.; Palatinus, L. Crystallographic Computing System JANA2006: General features. Z. Kristallogr. 2014, 229, 345–352. [Google Scholar] [CrossRef]
  29. Equbal, C.A.; Bjerring, M.; Madhu, P.K.; Nielsen, N.C. Improving spectral resolution in biological solid-state NMR using phase-alternated rCW heteronuclear decoupling. Chem. Phys. Lett. 2015, 635, 339–344. [Google Scholar] [CrossRef]
  30. Brus, J. Heating of Samples induced by fast magic-angle spinning. Solid State Nucl. Magn. Reson. 2000, 16, 151–160. [Google Scholar] [CrossRef]
  31. Rhauderwiek, T.; Heidenreich, N.; Reinsch, H.; Øien-Ødegaard, S.; Lomachenko, K.A.; Rütt, U.; Soldatov, A.V.; Lillerud, K.P.; Stock, N. Co-Ligand Dependent Formation and Phase Transformation of Four Porphyrin-Based Cerium Metal–Organic Frameworks. Cryst. Growth Des. 2017, 17, 3462–3474. [Google Scholar] [CrossRef]
  32. Burla, M.C.; Caliandro, R.; Carrozzini, B.; Cascarano, G.L.; Cuocci, C.; Giacovazzo, C.; Mallamo, M.; Mazzone, A.; Polidori, G. Crystal structure determination and refinement via SIR2014. J. Appl. Cryst. 2015, 48, 306–309. [Google Scholar] [CrossRef]
  33. CCDC no. 1913129. Available online: http://www.ccdc.cam.ac.uk/conts/retrieving.html (accessed on 30 April 2019).
  34. Amghouz, Z.; García-Granda, S.; García, J.R.; Clearfield, A.; Valiente, R. Organic-Inorganic Hybrids Assembled from Lanthanide and 1,4-Phenylenebis(phosphonate). Cryst. Growth Des. 2011, 11, 5289–5297. [Google Scholar] [CrossRef]
  35. Bennett, T.D.; Cheetham, A.K. Amorphous Metal−Organic Frameworks. Acc. Chem. Res. 2014, 47, 1555–1562. [Google Scholar] [CrossRef] [PubMed]
  36. Shearer, G.C.; Chavan, S.; Bordiga, S.; Svelle, S.; Olsbye, U.; Lillerud, K.P. Defect Engineering: Tuning the Porosity and Composition of the Metal−Organic Framework UiO-66 via Modulated Synthesis. Chem. Mater. 2016, 28, 3749–3761. [Google Scholar] [CrossRef]
Figure 1. Cluster of 2 × 2 × 1 unit cells of the 2D layer of cerium atoms arranged in the hexagonal honeycomb. The cerium atoms are octahedrally coordinated with oxygen atoms (grey polyhedra) and bound together through O-P-O bridges with phosphorus in a tetrahedral environment (magenta polyhedra). Left is the view along the b direction. Two types of PBP(Me)2− bridging rows are clearly visible: (i) phenylene groups are perpendicular to the 2D layers of cerium atoms, (ii) the angles between phenylene groups and the connecting 2D layer are approximately 70°. Right is the view along the c direction, carbon atoms of phenylene groups and hydrogen atoms were removed for better clarity. The schematic representation of the linker is in the top right corner.
Crystals 09 00303 g001
Figure 2. Crystal structure of 1,4-phenylenebis(phosphonate) Ce(III) with the Cambridge Structural Database (CSD) reference code MAXFEY consisting of 2D layers that are connected by the linker [34]. From the side view along the a direction, the crystal structure is similar to ICR-9. However, the coordination of Ce(III) (grey polyhedra) by oxygen atoms as well as its arrangement in the 2D layer are different in comparison with octahedral coordination and honeycomb arrangement of Ce(III) in ICR-9. The tetrahedral environment of phosphorus atoms is depicted by magenta polyhedra. The schematic representation of the linker is in the bottom right corner.
Crystals 09 00303 g002
Figure 3. Comparison of the powder XRD patterns of ICR-9Cryst (black), ICR-9B (blue), and ICR-9A (red). The amount of the amorphous phase can be distinguished from the peak / background ratio and the wide peak between 6 and 12° 2θ. The least amount of the amorphous phase is in the sample of ICR-9Cryst, whereas the largest amount is in the case of ICR-9A.
Crystals 09 00303 g003
Figure 4. Nitrogen adsorption isotherms for ICR-9Cryst (black), ICR-9B (blue), and ICR-9A (red) at 77 K; adsorption is marked with full symbols and desorption with empty symbols.
Crystals 09 00303 g004
Figure 5. SEM images of ICR-9Cryst (A), ICR-9A (B), and ICR-9B (C).
Crystals 09 00303 g005
Figure 6. 13C and 31P solid state NMR (ssNMR) spectra of ICR-9Cryst, ICR-9B, and ICR-9A: (a) 13C cross-polarization magic angle spinning (CP/MAS) NMR; (b) 31P CP/MAS NMR; (c) 13C MAS NMR; (d) 31P MAS NMR experiments.
Crystals 09 00303 g006
Table 1. Physicochemical properties of ICR-9Cryst, ICR-9A, and ICR-9B.
Samplemol% DMFa*mol% of Uncoordinated PBP(Me)2− b*Specific Surface Area / m2 g−1Estimation of the Amorphous Content / wt%c**
ICR-9Cryst<5%1%130%
ICR-9B37%21%21136%
ICR-9A31%61%39577%
a The mol% of DMF were determined from Equation (1). b The mol% of uncoordinated PBP(Me)2- were determined from integral areas of individual peaks of 31P MAS NMR spectra. c Estimation of the amorphous content was calculated as the intensity ratio of the diffraction Bragg peaks (Inet) and of the sum of all measured intensity (Itot) from which the constant background intensity (Ibg) was subtracted [1 - Inet/(Itot-Ibg)] * Determined experimental error of mol% was estimated to ± 5% in both cases. ** Precision of this method strongly depends on the determination of the constant background intensity. The background from the Rietveld fitting of ICR-9Cryst was used for that purpose.

