Article

Ice Crystal Coarsening in Ice Cream during Cooling: A Comparison of Theory and Experiment

1
Department of Mechanical Engineering, University College London, London WC1E 7JE, UK
2
Research Complex at Harwell, RAL, Didcot OX11 0FA, UK
3
Unilever Research & Development, Olivier van Noortlaan, 3133AT Vlaardingen, The Netherlands
4
School of Materials Science and Engineering, Dalian University of Technology, Dalian 116024, China
5
Unilever R&D, Colworth MK44 1LQ, UK
*
Authors to whom correspondence should be addressed.
Submission received: 19 April 2019 / Revised: 20 June 2019 / Accepted: 21 June 2019 / Published: 25 June 2019
(This article belongs to the Special Issue Ice Crystals)

Abstract

:
Ice cream is a complex multi-phase structure and its perceived quality is closely related to the small size of ice crystals in the product. Understanding the quantitative coarsening behaviour of ice crystals will help manufacturers optimise ice cream formulations and processing. Using synchrotron X-ray tomography, we measured the time-dependent coarsening (Ostwald ripening) of ice crystals in ice cream during cooling at 0.05 °C/min. The results show ice crystal coarsening is highly temperature dependent, being rapid from ca. −6 to −12 °C but significantly slower at lower temperatures. We developed a numerical model, based on established coarsening theory, to calculate the relationship between crystal diameter, cooling rate and the weight fraction of sucrose in solution. The ice crystal diameters predicted by the model are found to agree well with the measured values if matrix diffusion is assumed to be slowed by a factor of 1.2 due to the presence of stabilizers or high molecular weight sugars in the ice cream formulation.

1. Introduction

Ice cream is a popular diary product whose microstructure is one of the critical factors that determines its sensorial perception. Structurally, ice cream is a complex colloid system that is composed of ice crystals, air bubbles and partially coalesced fat droplets, all of which are surrounded by an unfrozen matrix containing sucrose, proteins and stabilizer [1,2,3]. However, an assembly of fine crystals is thermodynamically far from equilibrium and crystals coarsen over time [4,5,6]. The control of the crystal size is widely recognized as a critical factor in the development of a smooth and creamy texture desired by consumers; large ice crystals will be perceived as being grainy and coarse [1].
Therefore, it is of great interest for the food scientist to develop a predictive description of physical mechanisms that govern the kinetics of the coarsening in order to inhibit a deterioration in the quality of ice cream. The characteristic sizes of this multi-phase material vary considerably, e.g., air bubbles 20–150 µm, ice crystals 10–75 µm, and fat particles 0.4–4 µm as well as fat particle aggregates ~10 µm [1]. A glass transition is observed around −30 °C at which the microstructure is relatively stable. However, experimental studies on the growth of ice crystals in ice cream have shown that phase coarsening is very significant in the temperature range −15 to −5 °C [7]. The manufacture of ice cream commonly involves two stages: Freezing and hardening. During initial freezing, occurring in a scraped-surface freezer (SSF) at around −5 °C, about half of the water in a homogenised ice cream mixture is frozen rapidly, and air is also incorporated into the product. After exiting the SSF, the bulk of the mixture is filled into containers and placed in an air blast freezer for hardening until the temperature in the core of the mixture reaches ~−18 °C over a period of time, usually around 2 hours with a cooling rate ~0.1 °C/min. The final product is stored at temperatures ranging from −23 to −18 °C before distribution to the consumer. Thus, the factors affecting ice crystal size variation during these stages need to be well understood.
The microstructural coarsening observed in many systems (including ice crystals in sucrose solutions and in ice cream) comprising a dispersion of fine particles in a matrix phase, is an effect which is known as Ostwald ripening [6,8,9,10,11]. This refers to the increase in the size-scale of the dispersed phase with time to minimize the total surface energy coming from curvature effects [12]. The process occurs by diffusion through the matrix. The diffusion is driven by the Gibbs Thomson effect i.e., the solute concentration in the matrix in equilibrium with larger particles is different from that with the smaller particles such that the larger particles grow in size at the expense of the smaller ones, which shrink.
The earliest work of Lifshitz-Slyozov and Wagner (LSW) on Ostwald ripening dates to 1961 and is referred to as the LSW theory [12,13]. It is only strictly valid for a precipitate (particle) volume fraction approaching zero and ignores the effect of volume fraction of the dispersed phase. In real systems e.g., ice crystal—sucrose solution, as is found in ice cream, a finite volume fraction (typically 20 to 30%) of ice crystals is present. Many attempts have been developed to improve upon the LSW theory by extending its applicability to a finite volume fraction. Marsh and Glicksman [14], for example, employed the concept of a statistical “field cell” and “transport field” to describe the diffusional interaction among each particle size class. Other approaches are reviewed in reference [15,16,17,18,19,20,21,22].
In a recent paper, van Westen and Groot [23] demonstrated that for a model system of polycrystalline ice within an aqueous solution of sugars the coarsening rates could be predicted on the basis of Ostwald ripening theory with relative deviations to experimental values not exceeding a factor of 2. However, this required that the theory accounts for a number of effects. First, that the solution is nonideal, nondilute and of different density from the crystals, secondly, the effect of ice-phase volume fraction on the diffusional flux between crystals is accurately described, and thirdly, all relevant material properties are carefully estimated. In a further paper the same authors [24] simulated the effect of thermal cycling on ice crystal coarsening in aqueous sucrose solutions and showed that their model correctly predicted an experimentally observed increase in coarsening rate for a thermally cycled sample compared to one that is coarsened isothermally. They identified that faster diffusivity at elevated temperatures is an important factor for enhanced ripening as observed in temperature cycling, which suggests that slow cooling from a high initial temperature may be important for the growth of large ice crystals.
However, it is a major challenge to validate models of the behaviour of ice crystals in ice cream due to the lack of methods which can visualise its three-dimensional (3D) microstructure. Pinzer et al. [25] used a laboratory X-ray microCT in a cold room to investigate the long term microstructural evolution of ice cream and quantified changes in air cell and ice crystal size during thermal cycles between −16 to −5 °C over a period of 24 hours. However, resolution of the structure was a limitation with this instrument. More recently Guo et al. [7,26] and Mo et al. [27] have reported time-resolved synchrotron computed tomography (sCT) studies of the microstructural evolution of ice cream. In the work of Mo et al. [27] in situ experimental observations clearly reveal the coarsening of ice crystals during continuous cooling experiments on ice cream in the range −5 to −23 °C but only a limited quantification of crystal dimensions was undertaken.
Therefore, the main aim of the present study on ice cream was to compare the predictions of a model for coarsening in a sample undergoing continuous cooling with ice crystal size measurements obtained from in situ sCT studies. In this paper we first extend our original isothermal Ostwald ripening model [23,24] to distinguish the effects of diffusivity and ice fraction from the effect of phase ripening at a fixed cooling rate. Next, we simulate phase coarsening in microstructures reflecting the same volume fraction as used experimentally. Finally, we compare predictions based on simulation with the in situ experimental measurements of ice crystal dimensions.

2. Model Theory

Our previous papers concerning the Ostwald ripening of ice crystals in aqueous sucrose solution [23,24] have provided a detailed analysis of Ostwald ripening and have addressed both isothermal Ostwald ripening in aqueous solutions [23] and also the effect of temperature cycling on the Ostwald ripening of ice crystals in an aqueous solution of sugars [24]. In this section we aim to provide only a brief overview of the background theory which will be sufficient to understand the modelling results reported in the present paper.
The kinetic equation describing the growth or shrinkage rate of an individual particle of radius, a, is given by Equation (1) [20,21]:
d a d t = D a ( Δ 2 d 0 a )
where Δ = 1 − Cs/Cs,eq is the supersaturation far away from the particle surface (Cs is the concentration of solute in the matrix phase at the interface with the particle and Cs,eq is the thermodynamic equilibrium solute concentration at that temperature). D is the Fick diffusion coefficient and d0 is the (chemical) capillary length of the Gibbs Thomson equation [8] and t is time. The definition of d0 is given in detail in Supplementary Materials.
Crystals will grow when they are larger than a critical radius a* = 2d0/Δ and shrink when they are smaller than a*. An alternative formulation can be obtained in terms of mole fractions and Maxwell–Stefan diffusion [23].

2.1. Isothermal Coarsening

When the temperature is constant, the dispersed phase fraction quickly approaches its quasi-equilibrium value. The particle size distribution approaches a scaling function f ( a / a , ϕ) which depends on the relative crystal size z = a / a , and on the particle volume fraction ϕ. Typical examples of a stationary crystal size distribution are shown in Figure 1. The black curve marked LSW shows the distribution from the Lifshitz-Slyozov–Wagner theory. This theory is only valid for vanishing ice volume fraction, however. The red curve is calculated from the Marsh–Glicksman (MG) theory [14] for an ice volume fraction ϕ of 0.6.
At a fixed temperature, the mean particle radius, a , grows at a rate that is proportional to t1/n, where n depends on the growth mechanism. When growth is controlled by diffusion through the matrix, n takes the value 3,
a n = a 0 n + K t
where a 0 is the mean radius at time t = 0, and K is the coarsening rate constant and Equation (2) describes how the mean radius increases over time at constant temperature.
The earliest work of Lifshitz-Slyozov and Wagner (LSW) on Ostwald ripening in which Equation (2) was derived is strictly valid in the limit of zero dispersed phase volume fraction. Many extensions of the LSW approach have been developed but all predict the temporal law given by Equation (2) but with a rate constant K that increases with volume fraction [15].
This coarsening rate constant K has two main contributions and can be written as [23]
K = 8 9 ξ ( T ) g ( ϕ )
The factor 8/9 is the classical LSW result for vanishing volume fraction. The factor ξ(T) depends on surface energy and diffusivity, the driving forces responsible for coarsening and g(ϕ) is a non-dimensional geometric factor that accounts for the diffusion distance. It depends on the mathematical form of the crystal size distribution and on the ice volume fraction, ϕ.
The dimensional factor ξ(T) is given by a complicated expression containing the molar volumes of ice and water, the melting curve of the phase diagram (liquidus line), the surface energy between ice and water (temperature dependent), and the Maxwell–Stefan diffusion coefficient.
For the sucrose-water system a polynomial fit to the temperature-dependent contribution is given in Ref. [23], but this may not allow extrapolation to temperatures far below −14 °C. Based on the raw data, a new Padé fit is made which is more reliable for extrapolations. This is represented by Equation (4):
ln ξ ( T ) = b 0 + b 1 T + b 2 T 2 1 + b 3 T + b 4 T 2
with b0 = 7.874452 μm3/min, b1 = −2.84417 μm3/min/K, b2 = −0.38216 μm3/min/K2, b3 = −0.78445 μm3/min/K and b4 = 0.020165 μm3/min/K2, where ξ(T) is expressed in μm3/min, and temperature in °C. This fit was based on the data between −14 °C < T < −1.5 °C, where the raw data were most reliable, i.e., the equilibrium ice fraction was not based on extrapolation. Both fits are shown in Figure 2.
The geometric factor g( ϕ ) has been the subject of several theories and simulation methods. Following the earlier work by Van Westen and Groot, a convenient fit to simulation data is given by their Equation (37) [23] which is Equation (5) below:
g ( ϕ ) = 1 + 2.04 ϕ 3 / 7 1 ϕ

2.2. Coarsening during Cooling

When a system is cooled the supersaturation in Equation (1) increases hence more crystals start to grow. This changes the size distribution and the rate of Ostwald ripening.
During continuous cooling the total variation of the mean cubed particle radius involves the sum of two terms as follows:
d a 3 = ( a 3 f ) t   d f   + ( a 3 t ) f   d t = a 3 f d f + ( a 3 / t ) f ( d a 3 / t ) f K d t = a 3 f d f + h ( ϕ ) K d t
where f is the ice crystal mass fraction.
This is an approximation, because we assume quasi-equilibrium conditions at each point in time. This is justified in the Supplementary Materials.
The first term describes the change of mean crystal volume under an infinitely fast ice fraction variation, for which the number of ice crystals is fixed. In that case we have a 3 f , hence ( a 3 / f ) t = a 3 / f . The second term describes the change of mean crystal volume due to isothermal Ostwald ripening. It contains a factor h ( ϕ ) = ( a 3 / t ) f / ( a 3 / t ) f = a 3 / a 3 to correct the growth law (Equation (2)) to calculate d a 3 rather than d a 3 . For an equilibrium distribution in isothermal conditions the ratio a 3 / a 3 is constant over time, because the distribution has scaling behaviour. Therefore, the ratio of the above partial time derivatives is equal to the ratio a 3 / a 3 itself.
The geometric function h ( ϕ ) = a 3 / a 3 which appears in Equation (6) is needed to transform radius-averaged Ostwald ripening into volume-averaged ripening. Marsh and Glicksman gave tabulated data for the first three moments of the size distribution as function of the crystal volume fraction [14]. From these data we calculate a fit that is given by:
h ( ϕ ) = 1 + ( 3 5 ) 4 + 0.1167 ϕ 0.32 1 0.38   ϕ 2.5
To find the mean cubed particle diameter, 2 a 3 1 / 3 , (also known as D3,0) as a function of time we employ a numerical integration scheme to solve Equation (6). We decrease the temperature by a small step δT (< 0) and calculate the corresponding time step from a chosen cooling rate B = −dT/dt. The calculation uses critically assessed thermophysical and phase diagram data that have been described previously [23,24].

3. Experimental Procedures and Data Analysis

To validate the model for Ostwald ripening of ice cream, a bespoke cold stage capable of precise thermal cycling combined with the in situ synchrotron tomographic imaging technique described in detail previously was employed to determine the structural changes undergone [7,26,27].

3.1. Sample Preparation and Thermal Cycling

Fresh ice cream (40% ice and 5% fat), prepared by Unilever R&D (Colworth, UK) was scooped out and left at room temperature to melt. Kapton tubes (specification: inner diameter 3 mm and wall thickness 67 μm, American Durafilm Co. Inc, Holliston, MA, USA) were filled with this liquid mixture with a syringe, followed by mounting them onto a cold stage specially designed for operation in the synchrotron beamline which is described in our previous papers [7,26,27].
The in situ experiments were performed in the following manner. The Kapton tube with the ice cream specimen was mounted onto the cold stage at −3 °C (just below the melting point). Then its temperature was rapidly reduced down to −23 °C with a fast ramp rate of −5 °C/min and held at this temperature for 10 min. The specimen was subsequently heated to −6 °C, at the same ramp rate as the cooling ramp rate, and maintained there for 10 min. A long–term slow cooling was then applied to study global parameters for phase coarsening, such as the particle size distribution. The system was subsequently cooled down from −6 °C until a temperature of −23 °C was reached with a slow cooling ramp rate of −0.05 °C/min. The overall thermal history for coarsening experiments is shown in Figure 3. Eight tomographic scans were performed at the temperatures indicated by the diamond symbols on Figure 3 to study the phase coarsening changes during cooling. Care was taken to ensure that the sub-volumes used for the measurements were free from bubbles. Therefore, the model assumption of a continuous unfrozen matrix phase was valid for the measured volumes.

3.2. Characterization by Synchrotron X–ray Computed Tomography (sCT)

A detailed description of the sCT approach has been reported previously [7,26,27] and is briefly summarised here. Combined coarsening experiments with in situ acquisition of tomographic scans were carried out at the high brilliance I13-2 beamline at Diamond Light Source (DLS, Harwell, UK) using a pink beam. The tomographic scans were recorded by a 2560 × 2160 pixel PCO Edge 5.5 CMOS camera combined with a single crystal CdWO4 scintillator. The specimen-to-camera distance was optimized to ~35 mm with a final pixel-resolution of 0.81 µm. During the in situ experiments, each tomographic run includes collecting 720 projections evenly spaced over a 180° rotation with the exposure time of 0.1 s. In this study, a total of eight tomographic scans were recorded at the following temperatures: −6.0, −7.0, −8.2, −9.6, −12.2, −15.5, −18.0 and −23 °C; these are indicated by the diamond symbols on Figure 3. These scans were then pre-processed and the tomographic slices for the respective temperatures were reconstructed.

3.3. Volume Data Reconstruction and Pre-Processing

The collected 2D projections, i.e. radiographs, were virtually stacked to form sinograms. Any apparent continuous lines from sinogram images were removed by interpolation in order to reduce ring artefacts which is a result from imperfections from the detector/camera. The sinograms were then used to mathematically reconstruct the volume slices using a filtered back projection (FBP) based algorithm. Because the ice cream samples were relatively low attenuating to the incident X-ray beam, the reconstructed volumes exhibited a relatively high level of background noise. In order to reduce noise, the 3D volumes were first median (3 × 3 × 3) filtered and then followed by a morphological operation-based method as descried previously [27]. The data were then binarised using global thresholding. All the volumes were carefully checked visually, and any obvious segmentation imperfections were corrected manually using Avizo 9.4 (FEI Visualization Sciences Group, Mérignac, 33700, France).

3.4. 3D Based Quantification of Ice Crystal Dimensions

Owing to the interconnected–network structure of ice crystals, it is not appropriate to segment them into individual components as they appear as interconnected clusters. Thus, a 3D image-based quantification method was developed and employed to analyze the size of ice crystals in the ice cream samples. This method is similar to the techniques for 3D porous structure characterisation and quantification for biomedical and geological materials as described in detail previously [27,28,29]. Briefly, we employed a series of sampling spheres with varying diameter, and the size distribution in the ice crystal phase was obtained by measuring the cumulative volume of ice crystal that can be reached by different sampling spheres [27]. Using this methodology, a modal value of the crystal diameter was obtained for each of the four sub-volumes examined at each of the temperatures for which sCT scans were performed.

4. Results and Discussion

4.1. Model Calculations

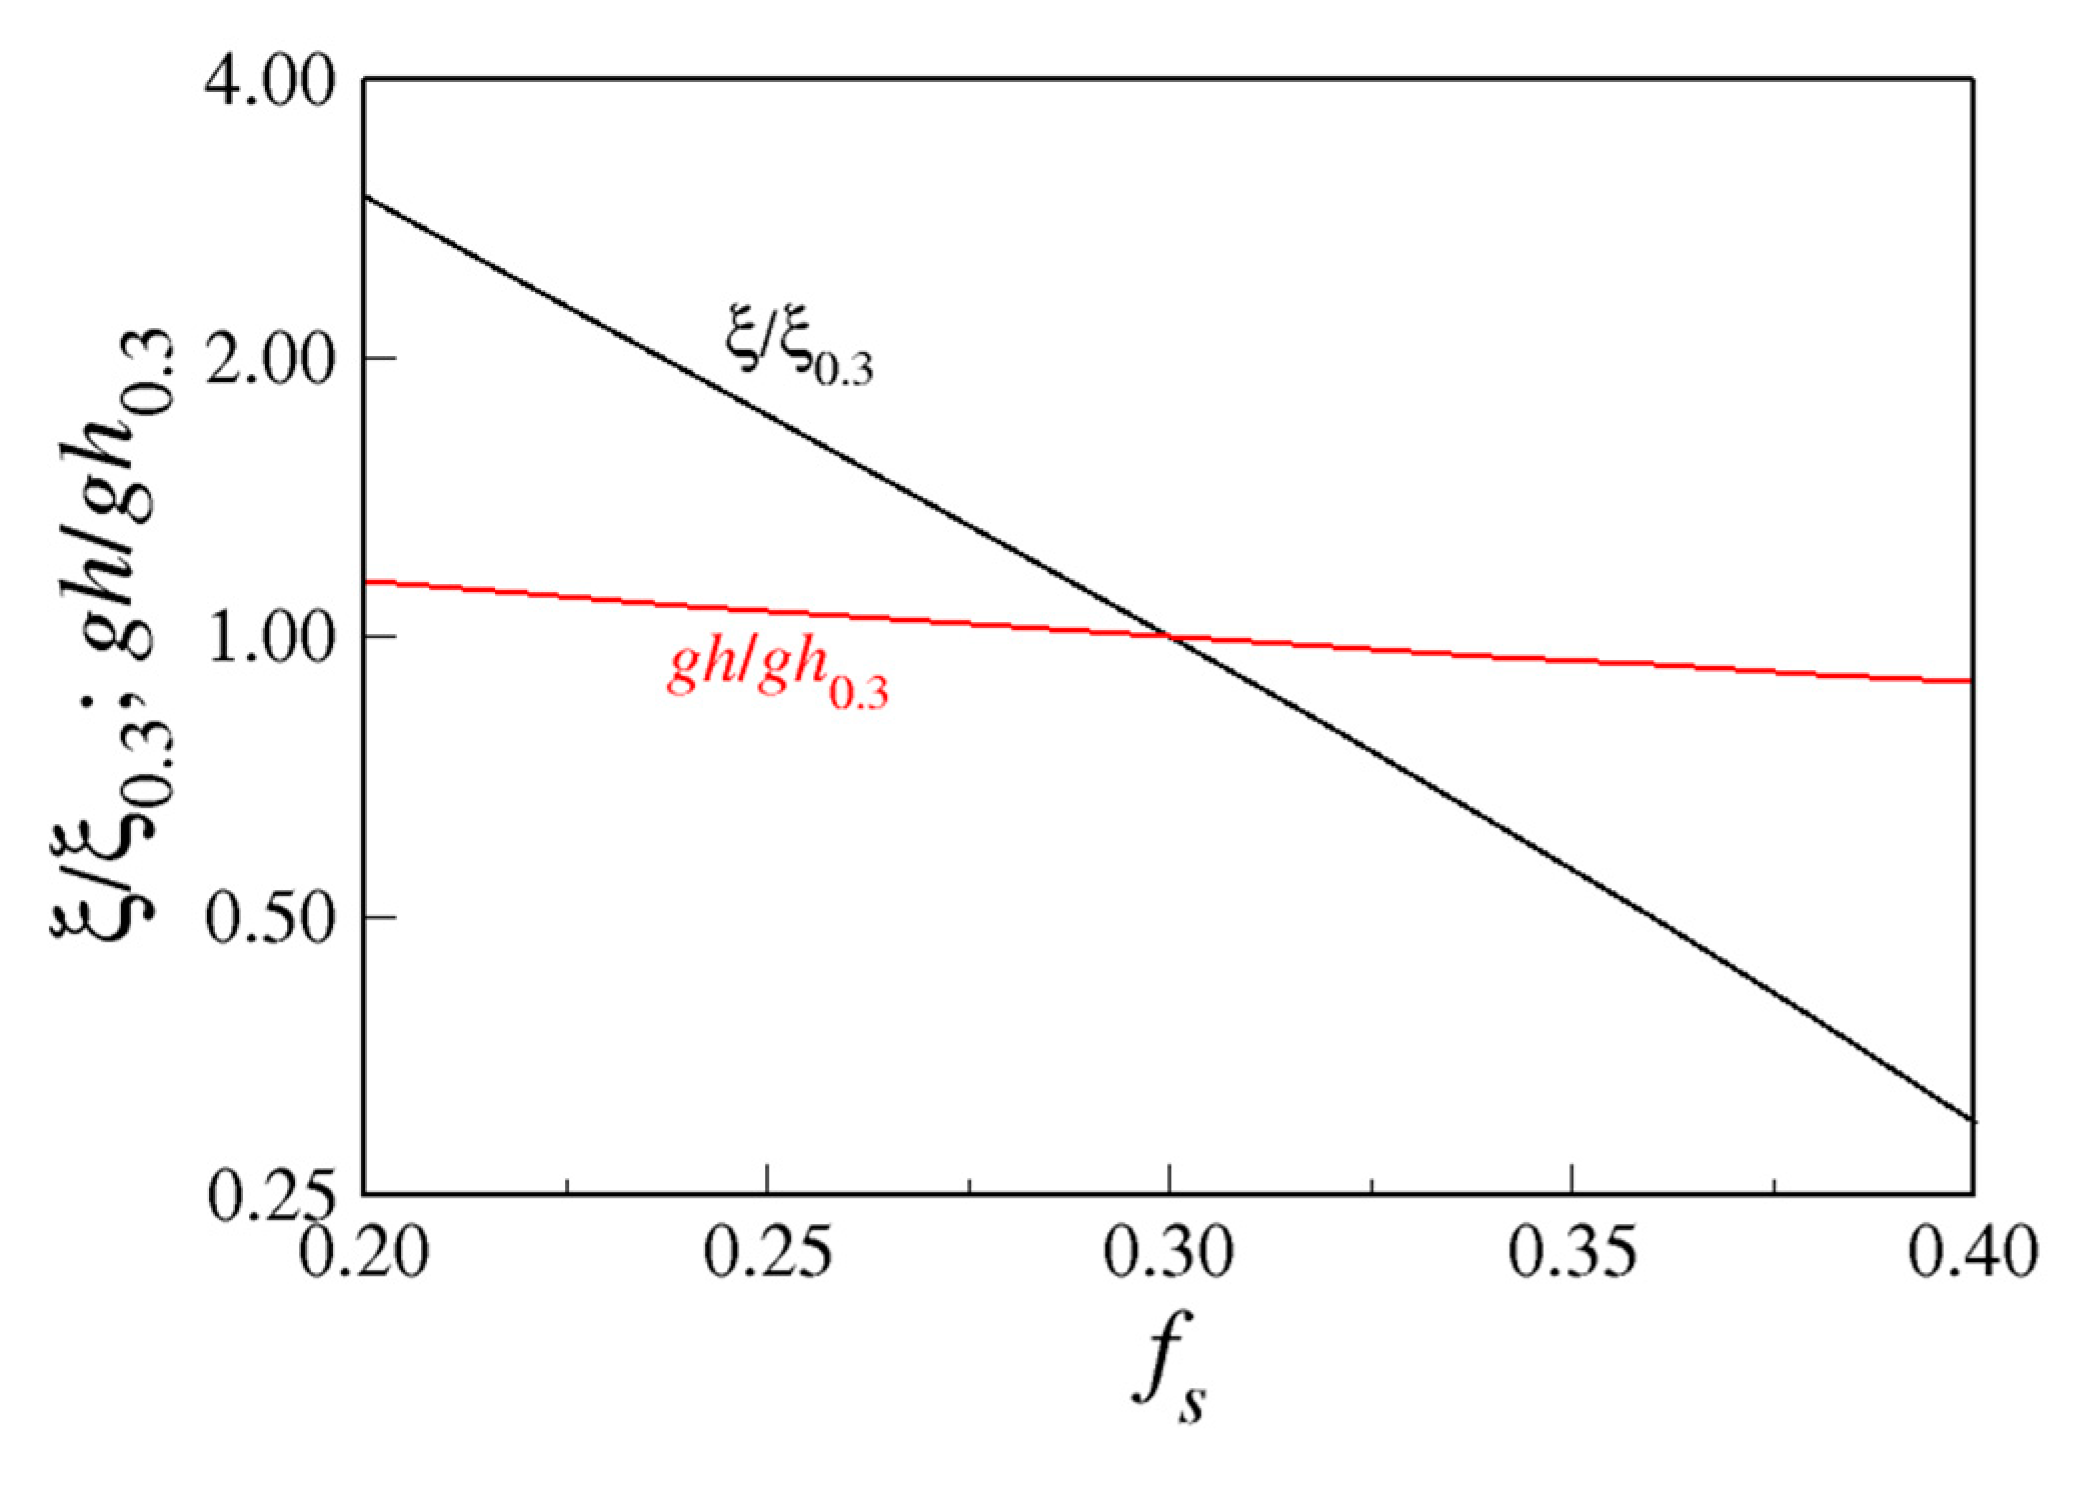
4.1.1. Relative Importance of Diffusivity and Ice Fraction

To gain insight into the relative importance of the factors driving Ostwald ripening during cooling, the rate constant h∙K was calculated for a range of sucrose solution concentrations and the results are shown in Figure 4. The term h∙K is proportional to g(ϕ)∙h(ϕ)ξ(T) where h is given by Equation (7), K is given by Equation (3) and the temperature dependent ice volume fraction, ϕ, is calculated as set out in Supplementary Materials.
The rate constant depends on temperature and on ice volume fraction, but it does not depend on the crystal size. At the melting point, the crystals are far apart because the ice volume fraction tends to zero. As temperature drops, the rate passes through a maximum and then drops again because diffusivity decreases towards lower temperatures. The position of the maximum shifts to lower temperatures and lower coarsening rates when sucrose concentration is increased. In fact, the amount of coarsening is quite sensitive to the sucrose fraction; if the weight fraction of sucrose (denoted as fs) is increased from 26% to 32%, the maximum coarsening rate reduces by a factor 2.
The variation of the two factors namely the geometrical factor g(ϕ)∙h(ϕ), and the dimensional temperature dependent factor ξ(T) were also examined independently. It is found that the geometric factor varies only slightly over a wide sucrose composition range whereas the dimensional temperature dependent factor increases significantly at lower sucrose fractions, shown in Figure 5.
Since the variation in ξ(T) is dominated by the variation of diffusivity, we conclude that fast diffusivity at high temperatures is the most important factor responsible for strong crystal coarsening at slow cooling rates; geometric structure effects are secondary.

4.1.2. Coarsening at a Fixed Cooling Rate in Sucrose Solutions

Consider now a sample containing ice crystals that starts at temperature TH and then drops to a final temperature TF at a fixed rate B = −dT/dt. In that case, the crystal size is calculated by numerically integrating the following equation:
d a 3 = ( a 3 f d f d T h K B ) d T
This follows directly from Equation (6) where the first term represents the increase in mean crystal volume due to cooling alone and the second term represents the contribution of Ostwald ripening during continuous cooling. See Supplementary Materials for details of the numerical procedure.
Whether the first or the second term in Equation (8) dominates the crystal size depends on the initial crystal size and on the cooling rate. Selected model calculations are shown in Figure 6 in which the volumetric mean diameter, D3,0, is plotted versus temperature, T. The volumetric mean diameter is defined as D3,0 = 2〈a31/3. The calculation was performed for ice crystals in a 30 wt% sucrose solution (melting point −2.7 °C), cooled at a rate of 0.01 °C/min (full curves) and at 0.1 °C/min (dashed curves), starting at 5 μm (black) and 10 μm (green) initial radius. The initial temperature, TH, is chosen as −3.0 °C. The calculations show that fast or slow cooling may change the crystal diameter by a factor ~2 for the same composition, hence the number of crystals may change by an order of magnitude.

4.1.3. Influence of Additives in Ice Cream Formulations

In full ice cream formulations, polymers are added that give enhanced storage stability. We suggest that the reason for this enhanced storage stability is that the time scale of Ostwald ripening is governed by the slowest mass transport process, which in the case of a polymer network in a sucrose solution will be the collective motion of the polymer. The sucrose solution is then acting as a viscous background medium through which the polymer moves. The rate by which the polymer network diffuses depends on elasticity modulus of the network, and the viscous flow through the network pores [30,31]. The collective diffusion coefficient of a polymer network is then inversely proportional to its friction factor, which in turn depends on the pore size of the network, and hence on the polymer concentration. Following the theory of Barrière and Leibler [32], it could be suggested that the rate of Ostwald ripening might be related to fp–3/2, where fp is the polymer mass fraction in the formulation. For example, λ-carrageenan (which is a common additive to ice cream) behaves as a loosely entangled polymer network [33], and could possibly reduce the ripening rate.

4.2. Experimental Observations and Comparison with Numerical Model

4.2.1. Morphological Evolution of Ice Crystals and Quantification of Dimensions

Figure 7 shows the 3D rendering of ice crystals from representative regions of the same size and the colour rendering represents the local thickness of each particle. The 3D evolution during the slow cooling cycle imposed in the sCT experiment with a cooling rate of 0.05 °C/min is clearly observable. The ice crystals are very fine initially. During the initial stages of cooling from −6 to −8.2 °C there is significant microstructural evolution with clear coarsening, Figure 7a–c, as well as an increase in ice volume fraction due to the decreasing temperature.
Averaged modal values of ice phase dimensions were calculated by the 3D accessible volume method described in Section 3.4. The averaged modal values were computed from four sub-volumes which were randomly extracted from the global reconstructed volume. As expected from the 3D visualisations, at the beginning of the slow cooling regime, the ice crystals were very fine with a modal size of 7.8 µm. During the slow cooling regime with a ramp rate of 0.05 °C/min, the modal size first increased significantly from 7.8 µm at −6.0 °C and to 21.8 µm at −15.0 °C. Thereafter, the trend of increasing crystal size continued but at a much lower coarsening rate. This is presumably due to the slower diffusivity at lower temperature (as predicted by the model), resulting in a reduced rate of ice crystal coarsening.

4.2.2. Comparison between Measured and Calculated Ice Crystal Dimensions

In Figure 8, which are the plots of ice crystal diameter versus temperature, our measured modal dimensions from the sCT in situ experiment are compared to the mean crystal diameters calculated by the numerical model for a cooling rate of 0.05 °C/min from −6 °C to −23 °C. The detailed data used for this calculation are given in the Supplementary Materials. There is evidently a difference between the calculated and measured crystal dimensions during continuous cooling. In order to achieve a fit of the model to the experimental data shown in Figure 8 (R2 = 0.97) the diffusivity used in the calculations had to be decreased by an overall factor of 1.2 compared to that for a pure sucrose solution containing the same wt% of sucrose (solid yellow line). This offset can be explained by a reduction in ripening rate due to the addition of hydrocolloid viscosifiers in the ice cream mix studied, in line with the behaviour proposed by Barrière and Leibler [32]. This observed reduction in rate lies well within the reduction in rates of crystal ripening for additions of λ-carrageenan to sucrose solutions which have been observed in a separate study which will be the subject of a future paper. This observed reduction in rate lies well within the reduction in rates of crystal ripening for additions of l-carrageenan to sucrose solutions which have been observed in a separate study which will be the subject of a future paper. The diffusivity reduction factor is expected to be larger at higher ice fractions because the polymer network gets more concentrated in the matrix phase as the temperature falls. This effect has been neglected here. Note further, that the model calculates D3,0 whereas in the experimental work the 3D accessible volume method was used to calculate modal values of crystal dimensions. Given the differences in measured and calculated dimensional features, the most notable finding is that the model correctly predicts the trend in ice crystal coarsening as the temperature decreases during continuous cooling. In conclusion, the presence of stabilisers or high molecular weight sugars, which are empirically added to ice cream, possibly improve product quality through their effect on reducing the coarsening of ice crystals especially at higher temperatures.

5. Conclusions

The microstructural evolution of ice crystals in a commercial ice cream during continuous slow cooling was visualised and quantified with synchrotron X-ray tomography. Ice crystals present at a relatively high temperature of −6 °C coarsen by the well-known Ostwald ripening mechanism: Small crystals, or areas of high curvature, dissolve and large crystals grow. This process is strongly temperature-dependent, and to a lesser extent dependent on the geometry of the ice suspension structure. To model this process during continuous cooling, equilibrium theory of Ostwald ripening of dense suspensions of spherical crystals is applied. Our results reveal the following:
(1)
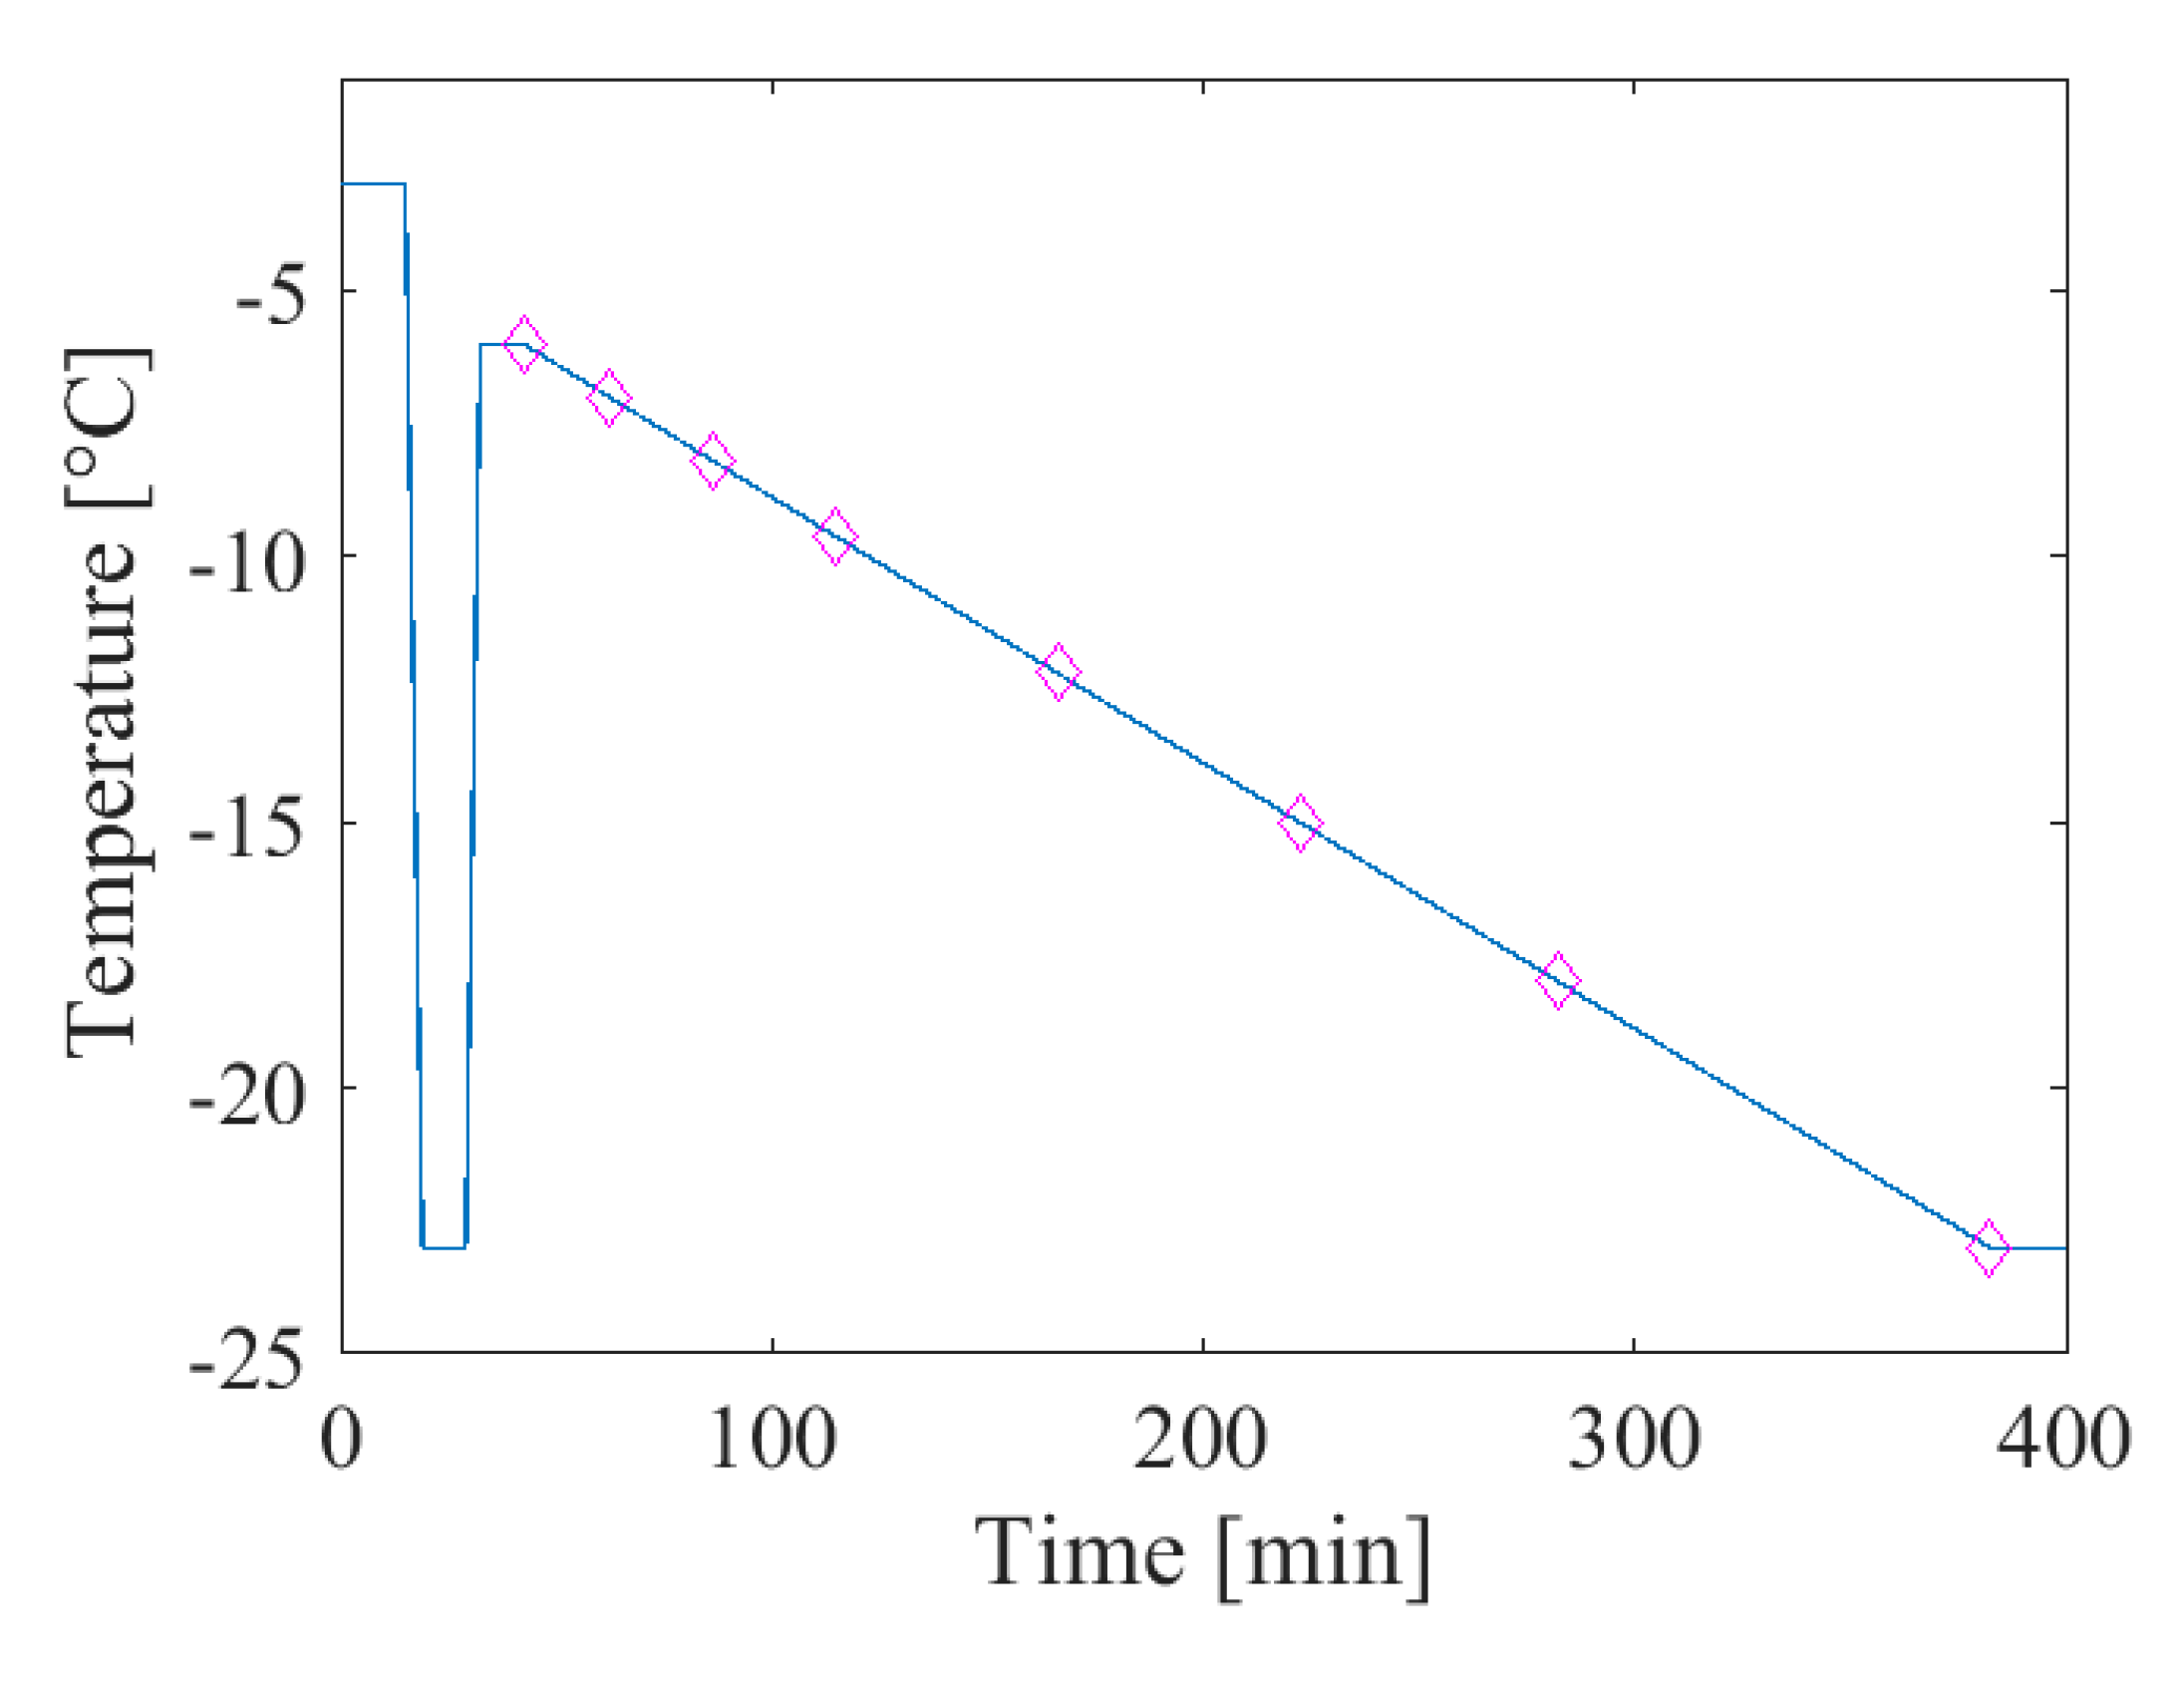
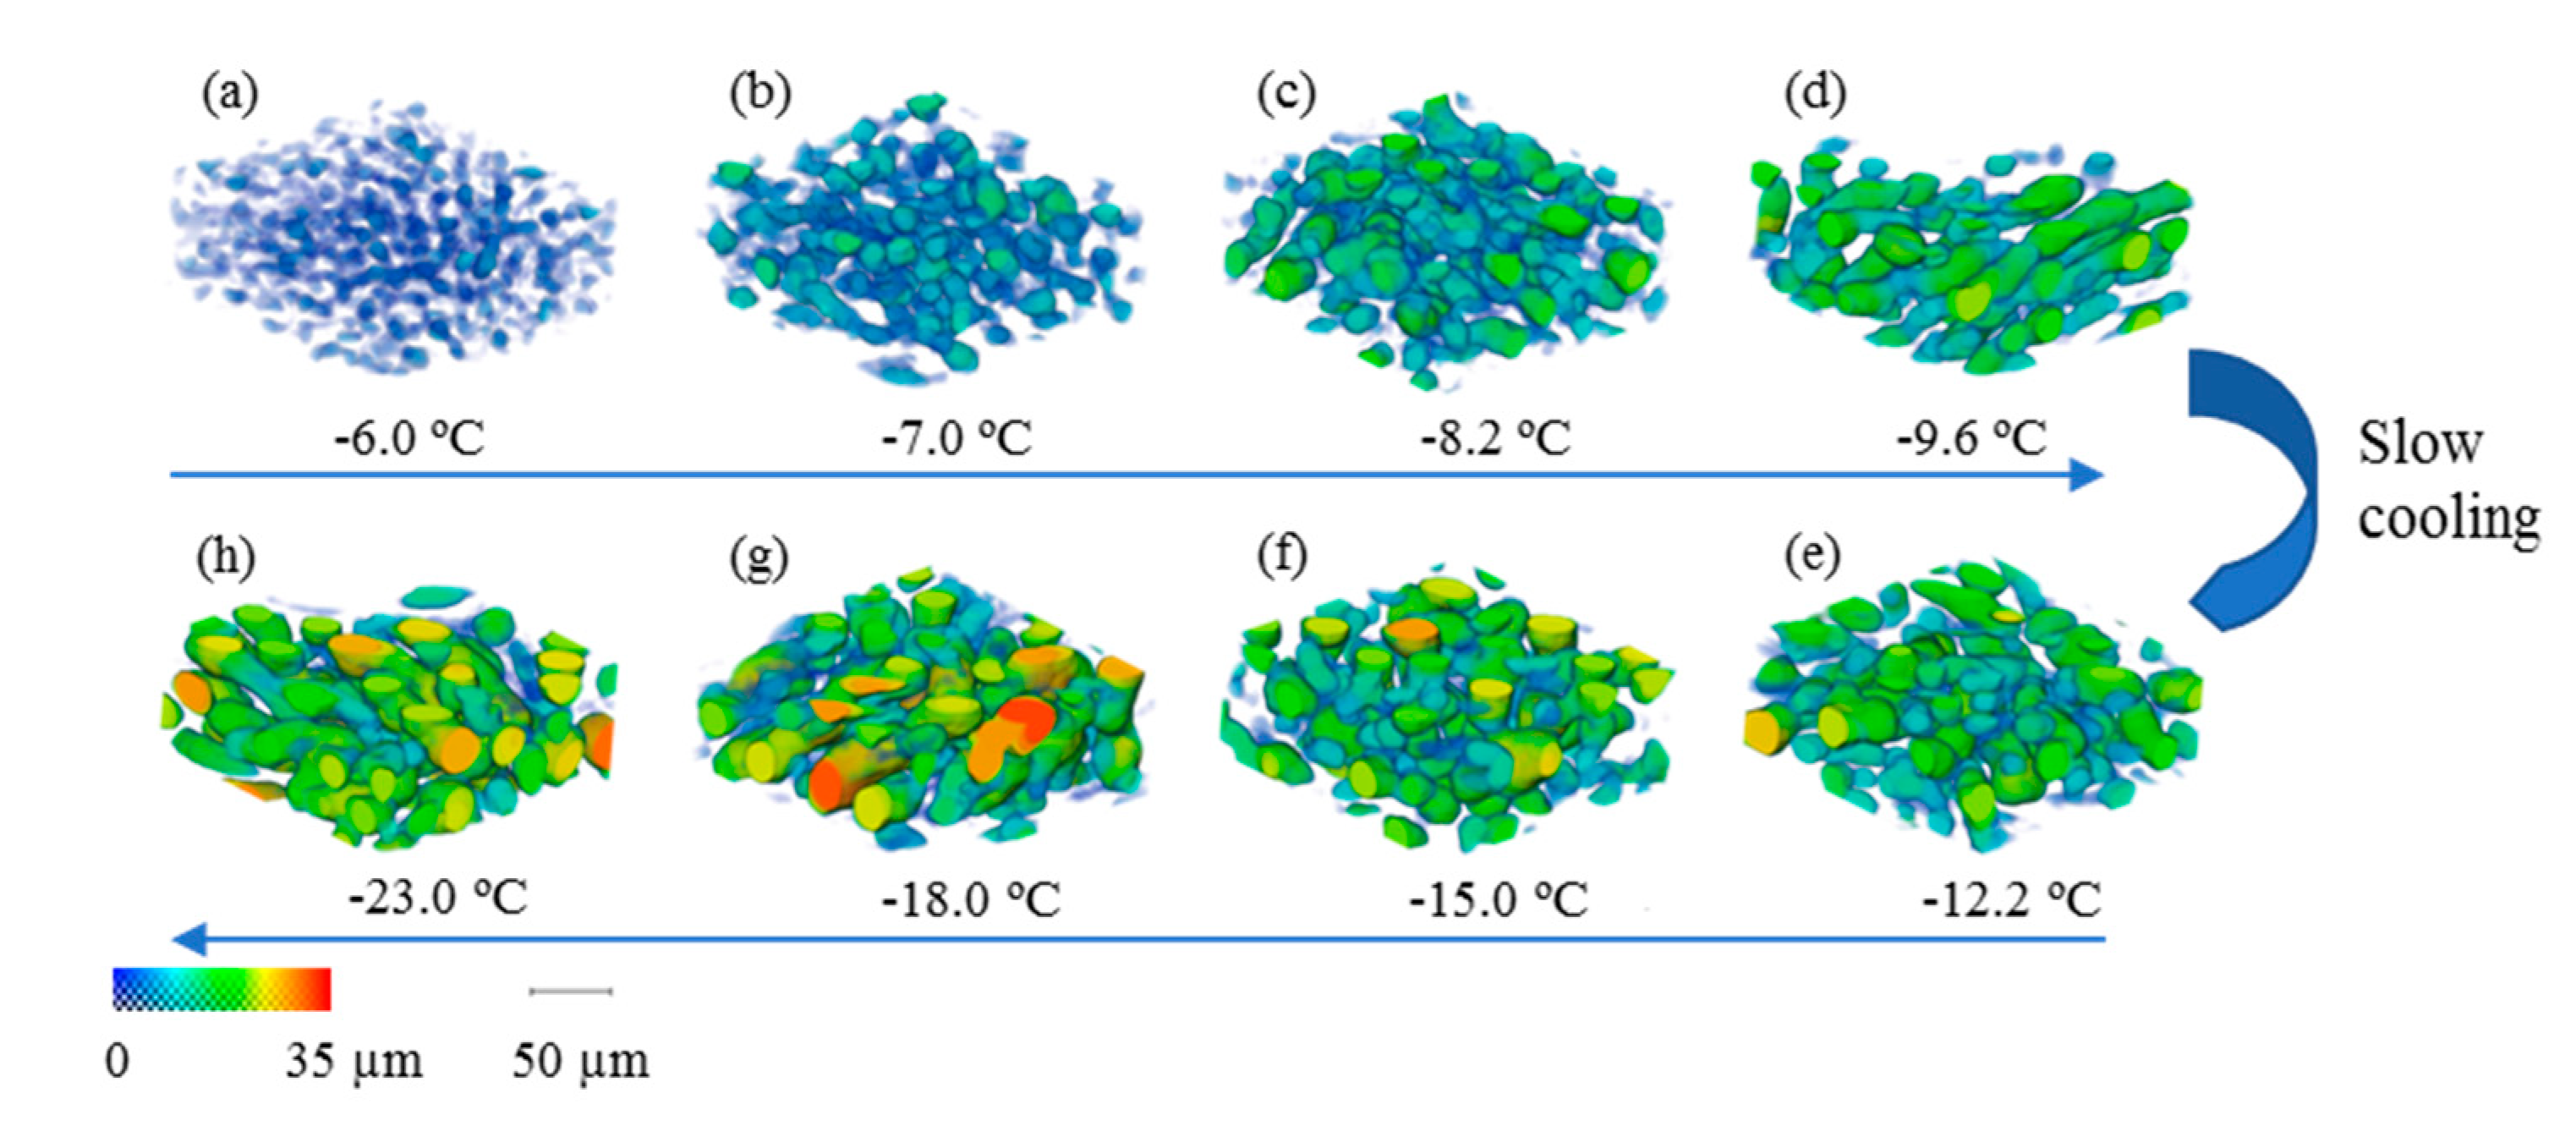
As expected, the 4D measurements (3D plus time) from synchrotron X-ray tomography show that coarsening of ice crystals occurs during cooling at 0.05 °C/min. The coarsening rate is rapid at high temperature (−6 to −15 °C) but slows down significantly as the temperature falls further. Qualitatively, the number density of crystals also decreases during the cooling.
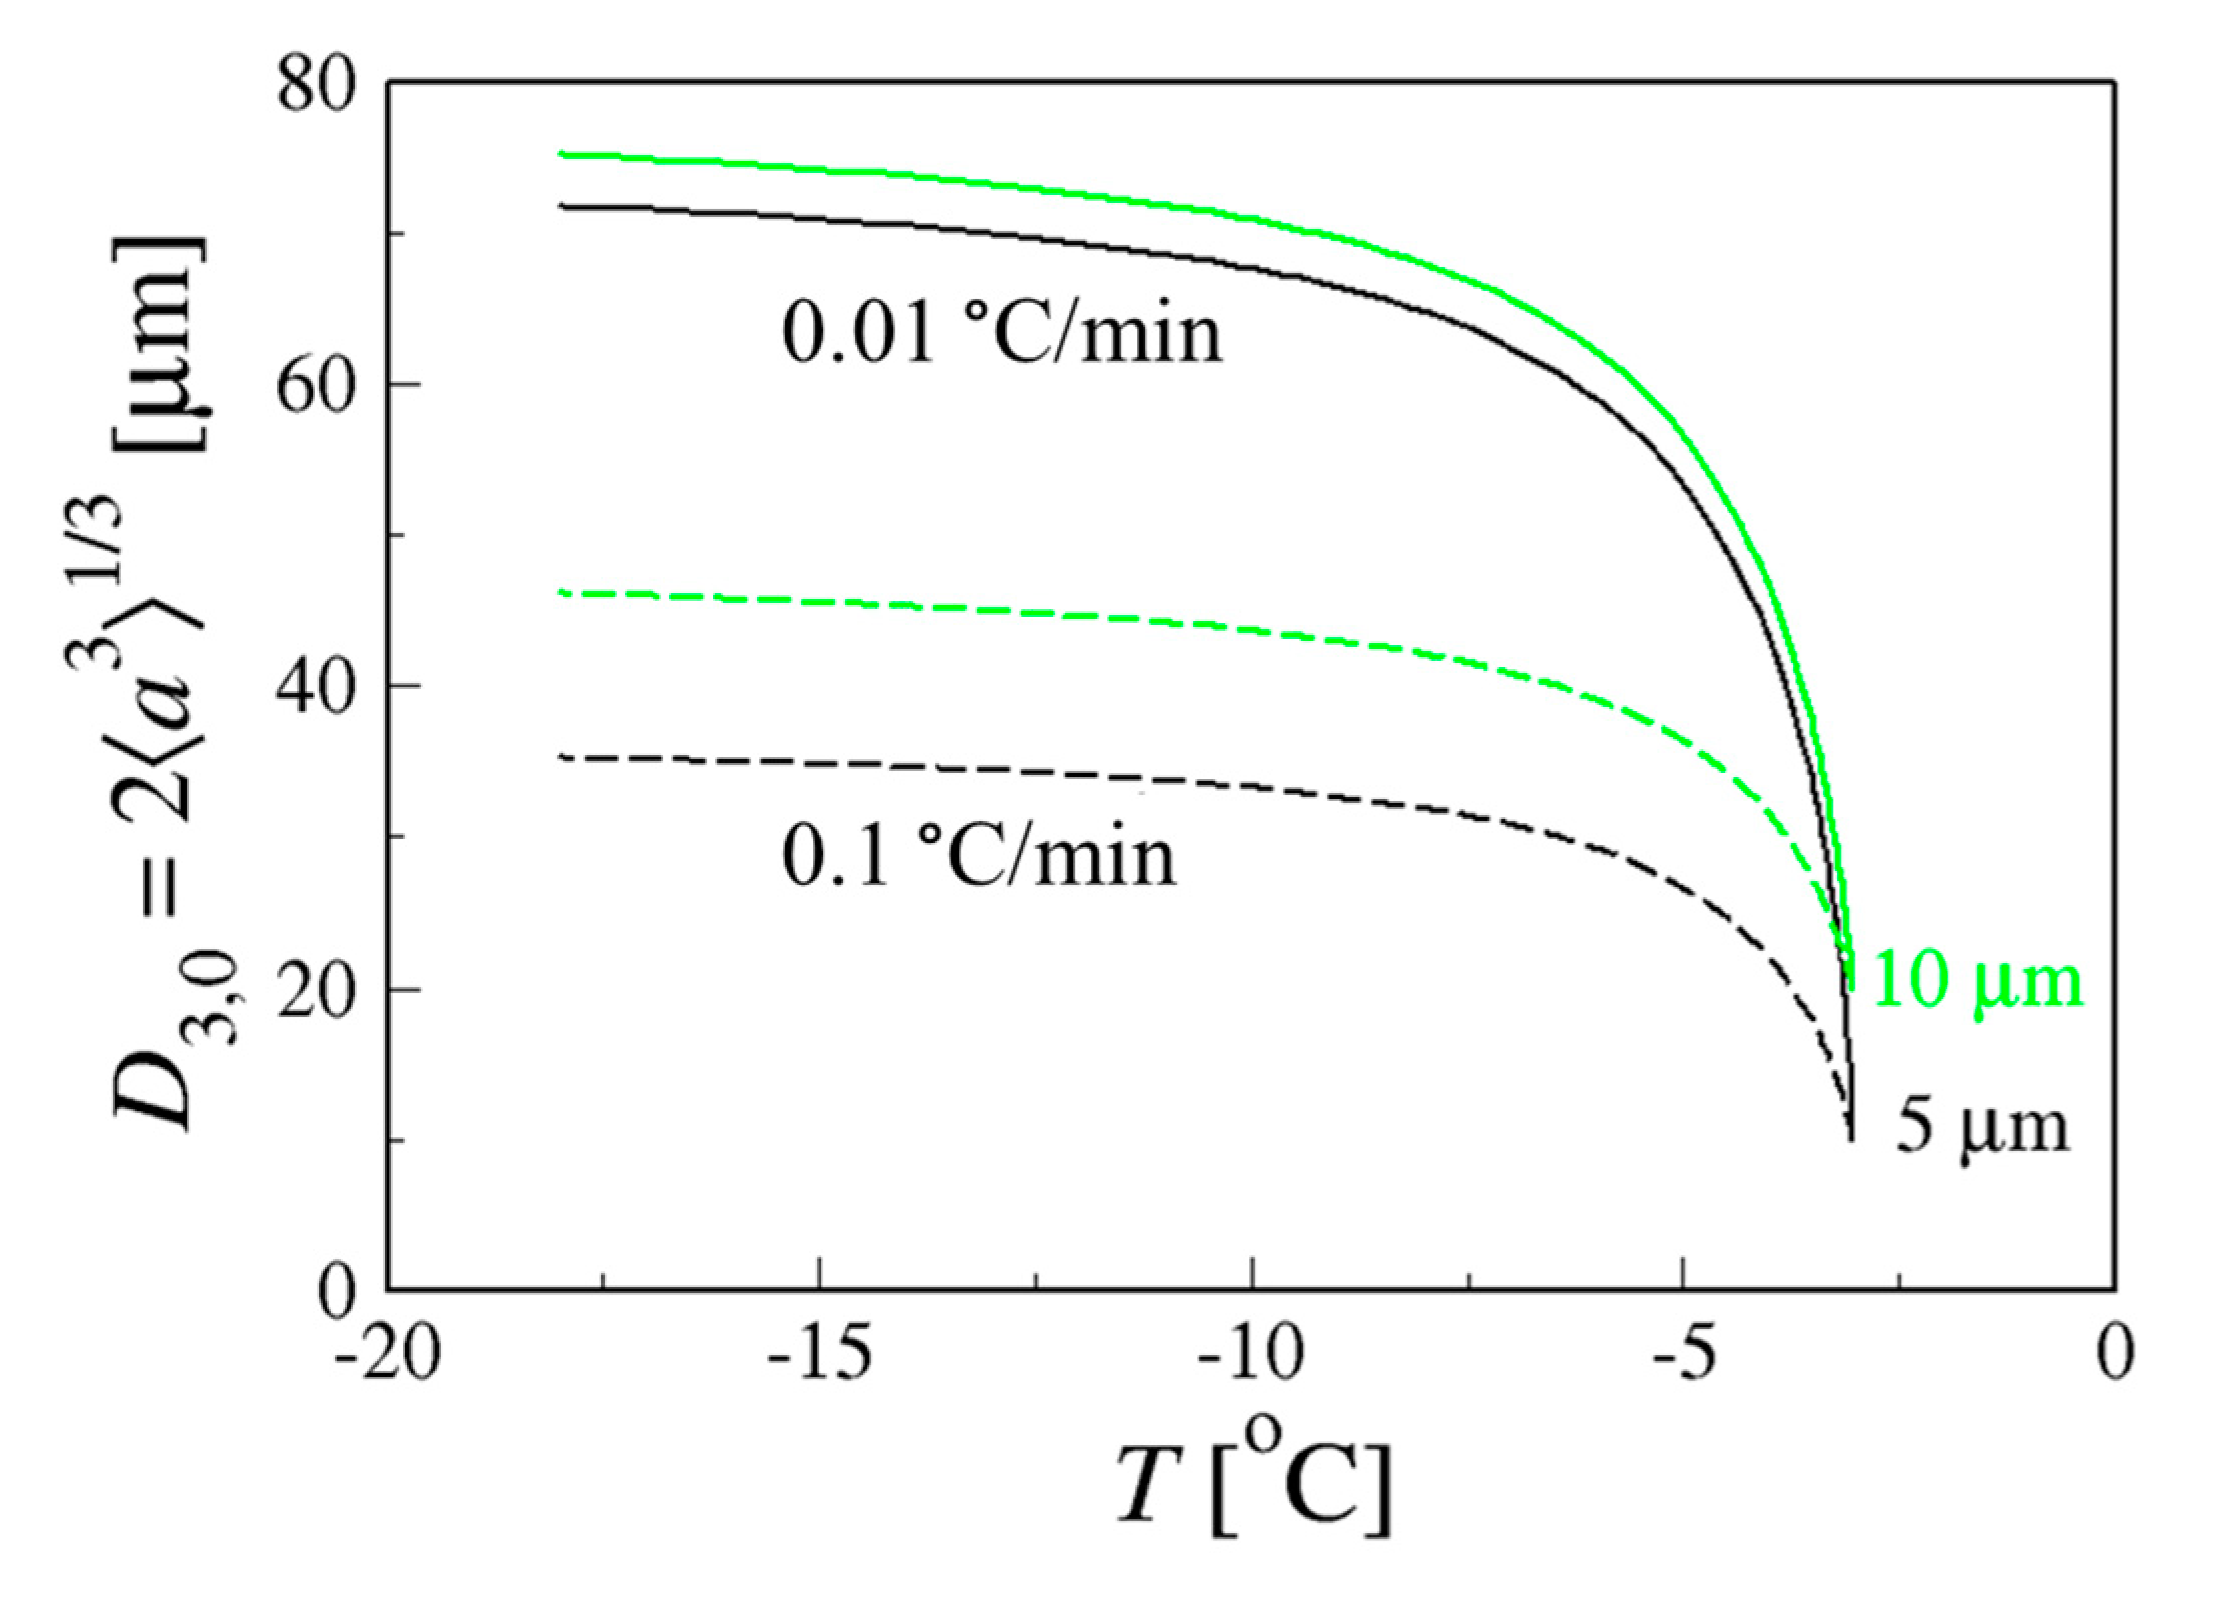
(2)
The numerical model to calculate Ostwald ripening of ice crystals in a sucrose solution (with a finite volume fraction) cooled at a steady rate to −18 °C predicts that fast (0.1 °C/min) or slow cooling (0.01 °C/min) will lead to significantly different crystal sizes. The volumetric mean diameter, D3,0 differs by a factor of ~2 for the same sucrose mass fraction and starting crystal size.
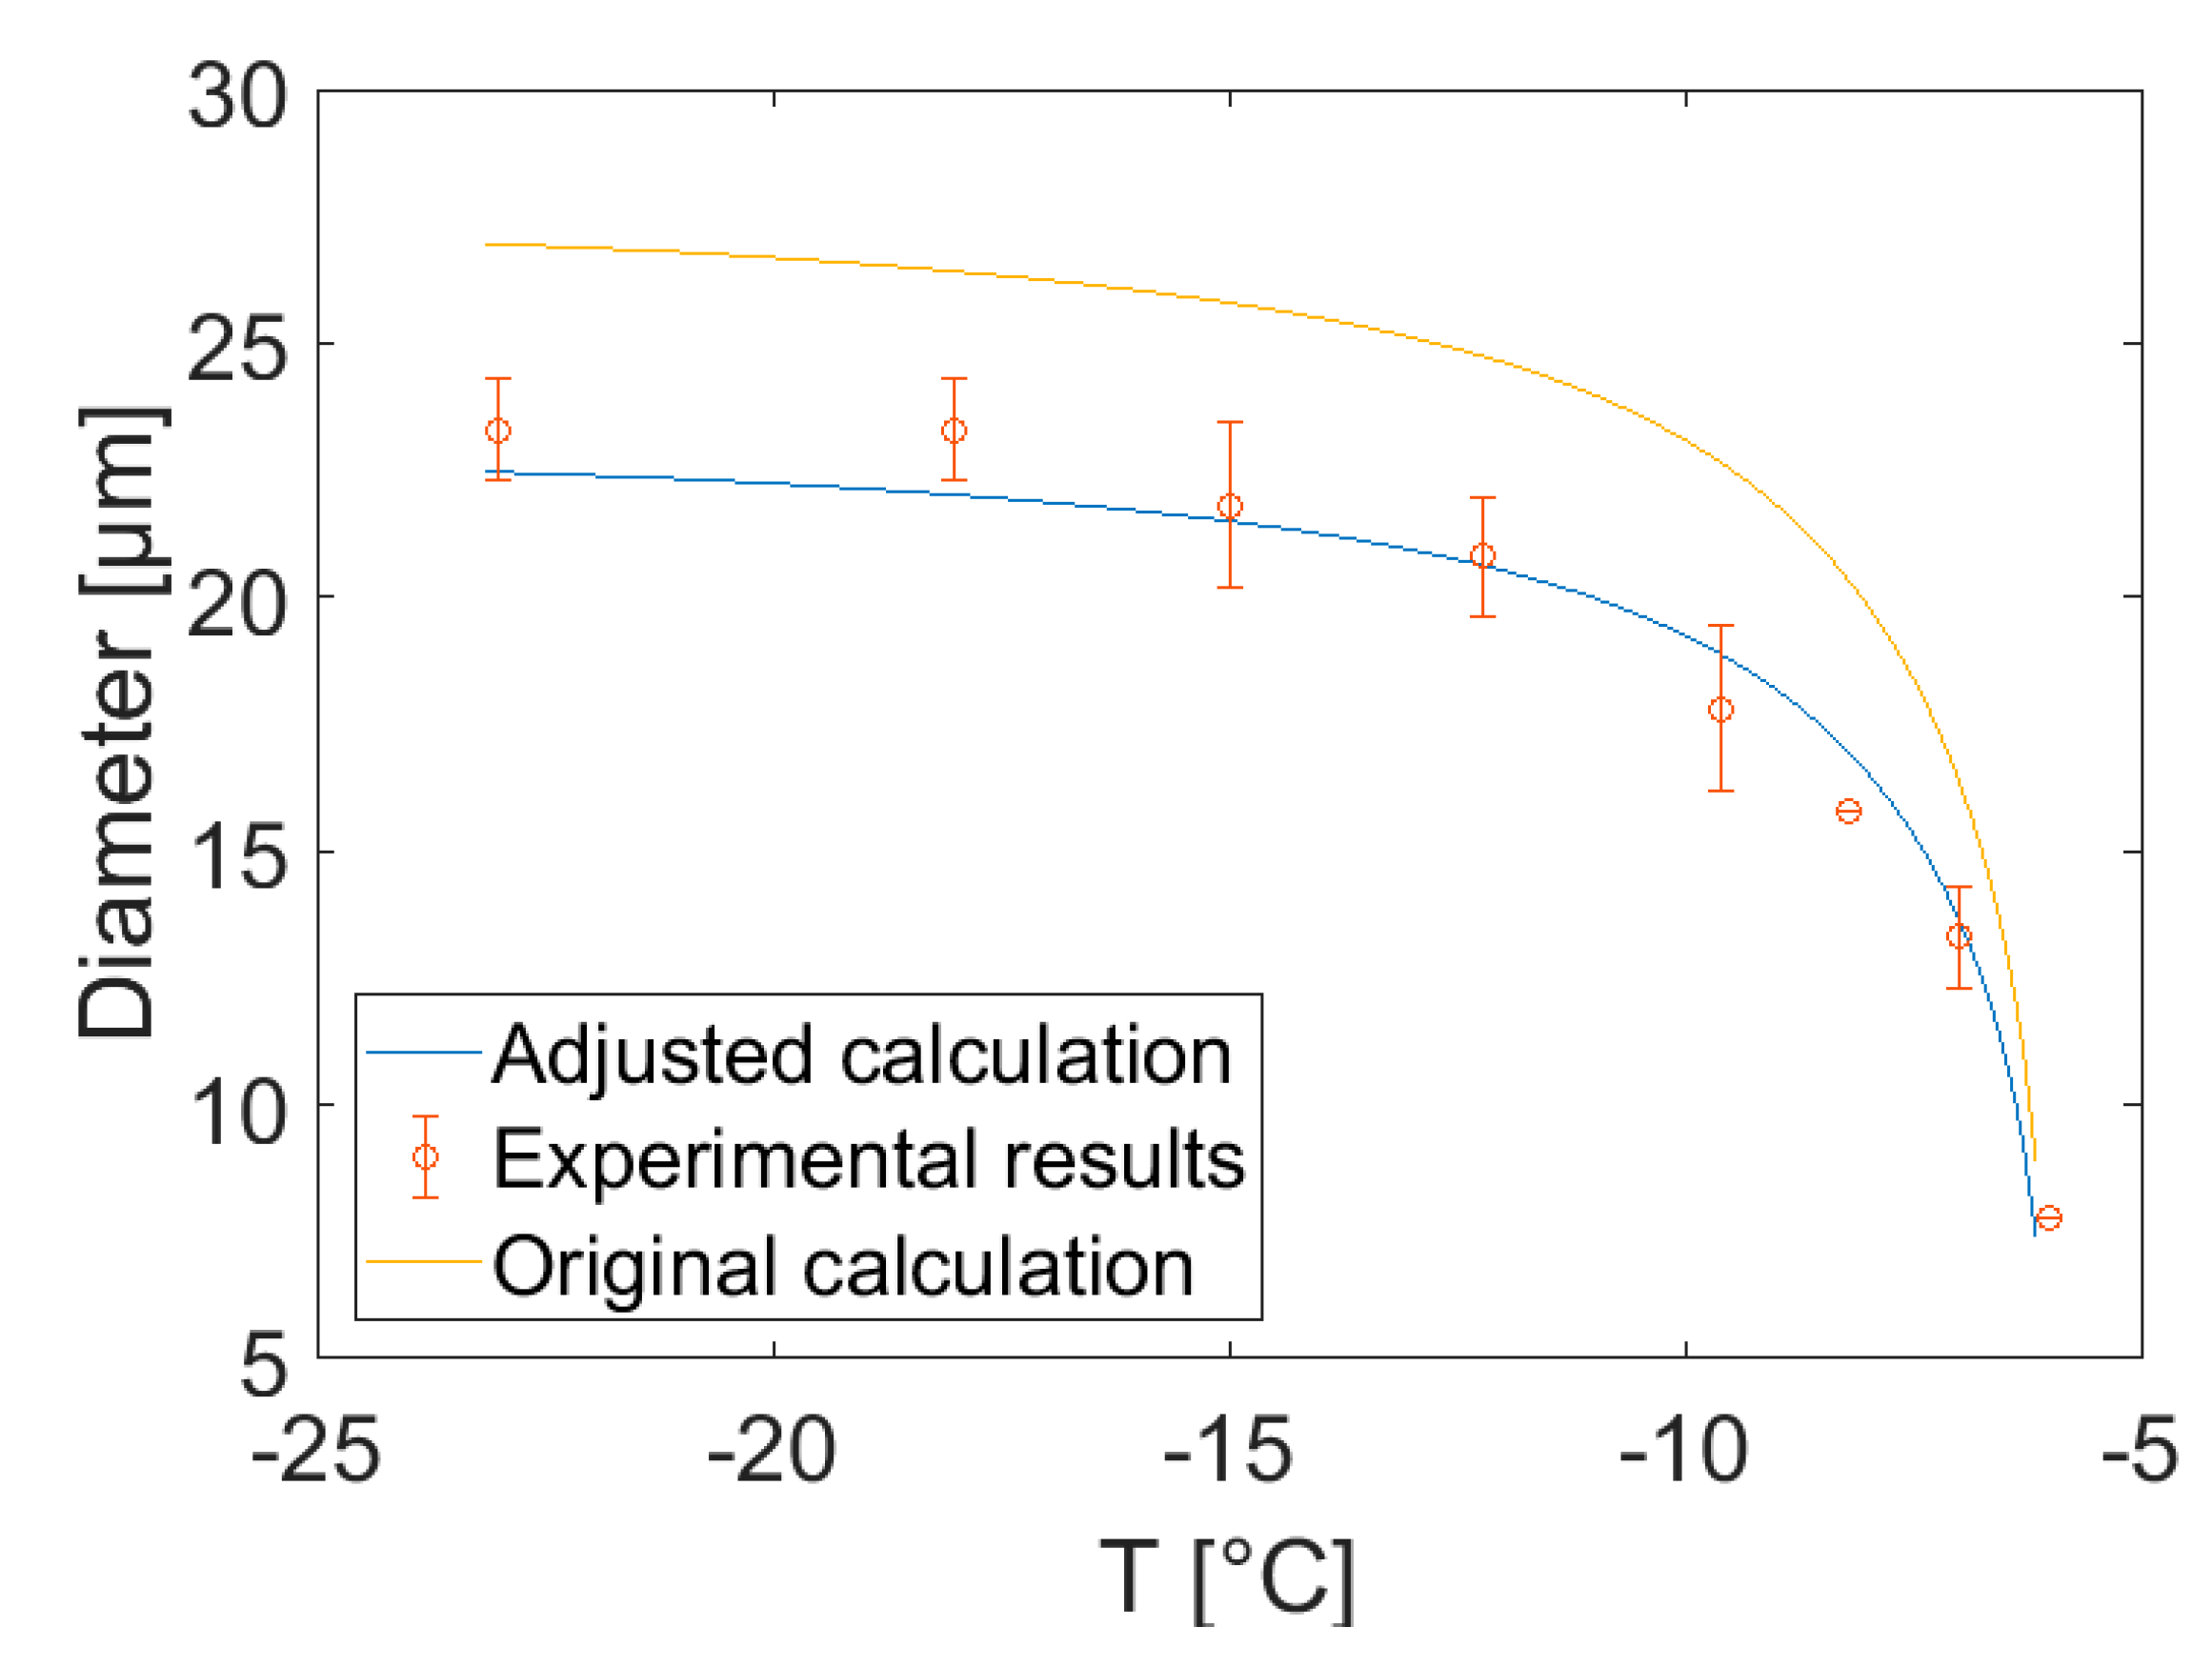
(3)
The diameters of ice crystals in an ice cream formulation, measured by in situ sCT experiments, show good agreement with the model calculations if the diffusivity used in the calculations is reduced by a factor of 1.2 compared to that for a pure sucrose solution. Since the Ostwald ripening theory compares well with the experimental data for sucrose solutions [30,31] we conjecture that stabilisers and high molecular weight sugars in ice cream retard diffusion and hence slow down Ostwald ripening. More experiments are needed to confirm this conjecture.
In summary, the results demonstrate the powerful insights into material behaviour that can be achieved by combining 4D synchrotron X-ray tomography with physically based numerical modelling. They clearly reveal the critical temperature range for controlling the coarsening behaviour of ice particles in ice cream that is crucial to maintaining product quality and good sensory perception.

Supplementary Materials

Supplementary information is available online at https://0-www-mdpi-com.brum.beds.ac.uk/2073-4352/9/6/321/s1.

Author Contributions

Conception and design of the study: P.D.L., J.B., E.G., J.M., G.v.D., P.S. Design of equipment: P.R., E.G., J.M., P.D.L. Acquisition of data: E.G., J.M., G.v.D., P.S. Model development: R.D.G. Interpretation of data, revising the manuscript and final approval, and agreement to be accountable for all aspects of the work: all authors. Drafting the manuscript: J.M., R.D.G., G.M., P.S., P.D.L.

Funding

This research was funded by Unilever R&D (Colworth, U.K.), financially supported in part by the EPSRC (EP/I02249X/1, EP/J010456/1 and EP/M009688/1).

Acknowledgments

The authors acknowledge the use of the facility access in Diamond Light Source (MT12195, MT12616 and MT17609) and Research Complex at Harwell. The authors also thank I13 staff of Diamond Light Source (especially Silvia Cipiccia) and group members for technical support, including David Eastwood, Sam Clark, Yunhui Chen, Sebastian Marussi, and Lorna Sinclair.

Conflicts of Interest

The authors declare no conflict of interest.

List of Symbols

aParticle radius
a*Critical particle radius
a Mean particle radius
a 0 Mean particle radius at time t = 0
a 3 Mean value of the cube of the particle radius
biFitting constant in the equation for ξ ( T )
BCooling rate
CsConcentration of solute in the matrix phase at the interface
Cs,eqThermodynamic equilibrium concentration of solute in the matrix phase
DFick diffusion coefficient
D3,0Mean cubed particle diameter = 2 a 3 1 / 3
d0Capillary length of the Gibbs Thomson equation
fIce phase mass fraction
fpPolymer mass fraction
fsSucrose mass fraction
g(ϕ)Non-dimensional geometric factor accounting for diffusion distance
h(ϕ)Non-dimensional geometric factor relating radius and volume coarsening
KRate constant for isothermal coarsening
TTemperature, °C
THInitial temperature, °C
TFFinal temperature, °C
tTime
ΔSupersaturation far away from the particle surface
ϕParticle or ice phase volume fraction
ξ(T)Dimensional factor

References

  1. Clarke, C. The Science of Ice Cream; Royal Society of Chemistry: London, UK, 2015. [Google Scholar]
  2. Goff, H.D.; Hartel, R.W. Ice Cream; Springer Science & Business Media: Berlin, Germany, 2013. [Google Scholar]
  3. Goff, H.D. Colloidal aspects of ice cream—A review. Int. Dairy J. 1997, 7, 363–373. [Google Scholar] [CrossRef]
  4. Hartel, R.W. Mechanisms and kinetics of recrystallization in ice cream. In The Properties of Water in Foods ISOPOW 6; Springer: Boston, MA, USA, 1998; pp. 287–319. [Google Scholar]
  5. Hagiwara, T.; Hartel, R.W.; Matsukawa, S. Relationship between recrystallization rate of ice crystals in sugar solutions and water mobility in freeze-concentrated matrix. Food Biophys. 2006, 1, 74–82. [Google Scholar] [CrossRef]
  6. Cook, K.L.K.; Hartel, R.W. Mechanisms of ice crystallization in ice cream production. Compr. Rev. Food Sci. F. 2010, 9, 213–222. [Google Scholar] [CrossRef]
  7. Guo, E.; Zeng, G.; Kazantsev, D.; Rocketta, P.; Bentc, J.; Kirklandc, M.; Van Dalenc, G.; Eastwoodab, D.S.; StJohn, D.; Lee, P.D. Synchrotron X-ray tomographic quantification of microstructural evolution in ice cream–a multi-phase soft solid. Rsc Adv. 2017, 7, 15561–15573. [Google Scholar] [CrossRef]
  8. Ratke, L.; Voorhees, P.W. Growth and Coarsening: Ostwald Ripening in Material Processing; Springer Science & Business Media: Berlin, Germany, 2013. [Google Scholar]
  9. Harper, E.K.; Shoemaker, C.F. Effect of locust bean gum and selected sweetening agents on ice recrystallization rates. J. Food Sci. 1983, 48, 1801–1803. [Google Scholar] [CrossRef]
  10. Donhowe, D.P.; Hartel, R.W. Recrystallization of ice in ice cream during controlled accelerated storage. Int. Dairy J. 1996, 6, 1191–1208. [Google Scholar] [CrossRef]
  11. Donhowe, D.P.; Hartel, R.W. Recrystallization of ice during bulk storage of ice cream. Int. Dairy J. 1996, 6, 1209–1221. [Google Scholar] [CrossRef]
  12. Lifshitz, I.M.; Slyozov, V.V. The kinetics of precipitation from supersaturated solid solutions. J. Phys. Chem. Solids 1961, 19, 35–50. [Google Scholar] [CrossRef]
  13. Wagner, C. Theorie der alterung von niederschlägen durch umlösen (Ostwald-reifung). Zeitschrift für Elektrochemie, Berichte der Bunsengesellschaft für physikalische Chemie 1961, 65, 581–591. [Google Scholar]
  14. Marsh, S.P.; Glicksman, M.E. Kinetics of phase coarsening in dense systems. Acta Mater. 1996, 44, 3761–3771. [Google Scholar] [CrossRef]
  15. Baldan, A. Review progress in Ostwald ripening theories and their applications to nickel-base superalloys Part I: Ostwald ripening theories. J. Mater. Sci. 2002, 37, 2171–2202. [Google Scholar] [CrossRef]
  16. Ardell, A. The effect of volume fraction on particle coarsening: Theoretical considerations. Acta Metall. 1972, 20, 61–71. [Google Scholar] [CrossRef]
  17. Brailsford, A.; Wynblatt, P. The dependence of Ostwald ripening kinetics on particle volume fraction. Acta Metall. 1979, 27, 489–497. [Google Scholar] [CrossRef]
  18. Davies, C.; Nash, P.; Stevens, R.N. The effect of volume fraction of precipitate on Ostwald ripening. Acta Metall. 1980, 28, 179–189. [Google Scholar] [CrossRef]
  19. Marqusee, J.; Ross, J. Theory of Ostwald ripening: Competitive growth and its dependence on volume fraction. J. Chem. Phys. 1984, 80, 536–543. [Google Scholar] [CrossRef]
  20. Tsumuraya, K.; Miyata, Y. Coarsening models incorporating both diffusion geometry and volume fraction of particles. Acta Metall. 1983, 31, 437–452. [Google Scholar] [CrossRef]
  21. Wang, K.; Wang, G.Q. Phase coarsening in multicomponent systems. Phys. Rev. E 2017, 95, 022609. [Google Scholar] [CrossRef]
  22. Yan, H.; Wang, K.; Jones, J.E. Large-scale three-dimensional phase-field simulations for phase coarsening at ultrahigh volume fraction on high-performance architectures. Model. Simul. Mater. Sci. Eng. 2016, 24, 055016. [Google Scholar] [CrossRef]
  23. Van Westen, T.; Groot, R.D. Predicting the Kinetics of Ice Recrystallization in Aqueous Sugar Solutions. Cryst. Growth Des. 2018, 18, 2405–2416. [Google Scholar] [CrossRef]
  24. Van Westen, T.; Groot, R.D. Effect of Temperature Cycling on Ostwald Ripening. Cryst. Growth Des. 2018, 18, 4952–4962. [Google Scholar] [CrossRef] [Green Version]
  25. Pinzer, B.R.; Medebach, A.; Limbach, H.J.; Dubois, C.; Stampanoni, M.; Schneebeli, M. 3D-characterization of three-phase systems using X-ray tomography: Tracking the microstructural evolution in ice cream. Soft Matter 2012, 8, 4584–4594. [Google Scholar] [CrossRef]
  26. Guo, E.; Kazantsev, D.; Mo, J.; Bent, J.; Van Dalen, G.; Schuetz, P.; Rockett, P.; StJohn, D.; Lee, P.D. Revealing the microstructural stability of a three-phase soft solid (ice cream) by 4D synchrotron X-ray tomography. J. Food Eng. 2018, 237, 204–214. [Google Scholar] [CrossRef] [Green Version]
  27. Mo, J.; Guo, E.; McCartney, D.G.; Eastwood, D.S.; Bent, J.; Van Dalen, G.; Schuetz, P.; Rockett, P.; Lee, P.D. Time-Resolved Tomographic Quantification of the Microstructural Evolution of Ice Cream. Materials 2018, 11, 2031. [Google Scholar] [CrossRef]
  28. Wu, Z.Y.; Hill, R.G.; Yue, S.; Nightingale, D.; Lee, P.D.; Jones, J.R. Melt-derived bioactive glass scaffolds produced by a gel-cast foaming technique. Acta Biomater. 2011, 7, 1807–1816. [Google Scholar] [CrossRef]
  29. Yue, S. Non-Destructive quantification of tissue scaffolds and augmentation implants using X-ray microtomography. Ph.D. Theses, Imperial College London, London, UK, 2011. [Google Scholar]
  30. Peters, A.; Candau, S. Kinetics of swelling of spherical and cylindrical gels. Macromolecules 1988, 21, 2278–2282. [Google Scholar] [CrossRef]
  31. Li, Y.; Tanaka, T. Kinetics of swelling and shrinking of gels. J. Chem. Phys. 1990, 92, 1365–1371. [Google Scholar]
  32. Barrière, B.; Leibler, L. Kinetics of solvent absorption and permeation through a highly swellable elastomeric network. J. Polym. Sci. Pol. Phys. 2003, 41, 166–182. [Google Scholar] [CrossRef]
  33. Del Rio, A.R.; Ramírez-Gilly, M.; Tecante, A. Flow Properties of Lambda Carrageenan in Aqueous Systems. In Biological Activities and Application of Marine Polysaccharides; IntechOpen: London, UK, 2017. [Google Scholar] [Green Version]
Figure 1. Stationary crystal size distribution for volume fraction ϕ = 0 (LSW) and for ϕ = 0.6 (MG).
Crystals 09 00321 g001
Figure 2. Dimensional factor ξ(T) appearing in the coarsening rate (black curve). The green dash-dot curve is the polynomial fit by Van Westen and Groot [23] and the red dashed curve is the present Padé fit.
Crystals 09 00321 g002
Figure 3. The thermal history of the ice cream mixture specimen during the in situ coarsening experiments. The temperature points where the tomographic scans were reconstructed are indicated as pink diamond markers.
Crystals 09 00321 g003
Figure 4. Coarsening rate constant for sucrose weight fractions of 26%, 28%, 30% and 32%. The curves end at the respective melting points.
Crystals 09 00321 g004
Figure 5. Contributions to the volumetric Ostwald ripening rate (at the temperature where hK(T) has its maximum) plotted against sucrose mass fraction, fs. Values are normalised relative to their value at fs = 0.3.
Crystals 09 00321 g005
Figure 6. Volumetric mean diameter D3,0 calculated for ice crystals in 30 wt% sucrose solution, cooled at a rate of 0.01 °C/min (full curves) and for 0.1 °C/min (dashed curves), starting at 5 (black) and 10 (green) μm radius.
Crystals 09 00321 g006
Figure 7. 3D visualisation of ice crystal morphological evolution during the slow cooling experiment: (a) −6 °C, (b) −7.0 °C, (c) −8.2 °C, (d) −9.6 °C, (e) −12.2 °C, (f) 15 °C, (g) −18.0 °C and (h) −23.0 °C. Ice crystals are colour–rendered using local thickness. Scale bar is 50 µm.
Crystals 09 00321 g007
Figure 8. The diameter of ice crystals (modal values obtained from the 3D accessible volume method) measured from in situ sCT data (orange circles), compared with the diameter predicted by the present numerical model (solid blue line, the adjusted calculation; solid yellow line, the original calculation). Model diameter is calculated as D3,0 For the calculations, we used the water and sucrose fractions fw0 = 0.55 and fs = 0.29 respectively. Error bars correspond to the range of the modal values.
Crystals 09 00321 g008

