An Accurate Method for Crystallographic Reconstruction of Parent Austenite from Inherited Martensite in a Low-Alloy Steel

1
State Key Laboratory of Materials Processing and Die & Mould Technology, Huazhong University of Science and Technology, 1037 Luoyu Road, Wuhan 430074, China
2
School of Mechanical Engineering and Automation, Wuhan Textile University, 1 Yangguang Avenue, Wuhan 430073, China
*
Author to whom correspondence should be addressed.
Crystals 2019, 9(7), 358; https://0-doi-org.brum.beds.ac.uk/10.3390/cryst9070358
Submission received: 22 June 2019
/
Revised: 10 July 2019
/
Accepted: 13 July 2019
/
Published: 15 July 2019
(This article belongs to the Special Issue Crystallographic Understanding of Deformation, Phase Transformation, and Recrystallization in Materials Engineering)
Abstract
:The microstructure of austenite at high temperatures, which cannot be reserved at room temperatures, determines the properties of its transformed phase in low-alloy steels. Consequently, an accurate method is herein developed to reconstruct local orientations of the parent austenite () phase from electron backscatter diffraction maps of the martensite () microstructure. The orientation map of is cropped into a grid of data squares as the reconstruction unit. The cropped square is then divided into the square inherited from only one grain and the square inherited from more than one grain. The local orientations around parent grain boundaries are more accurately determined using a newly proposed reconstruction criterion. Furthermore, the solution spaces for the orientation relationship and the parent orientation are refined, which simultaneously improves the calculation accuracy and efficiency of reconstruction procedure. The validated reconstruction method is applied to obtain local orientations of the deformed microstructure accurately.
1. Introduction
In low-alloy steels, the grain size, morphology, and crystallographic orientations of the austenite phase at high temperature are known to determine the microstructures and properties of the product phase. Therefore, knowledge of the evolution of microstructure during hot deformation contributes to clarifying the mechanism of microstructural evolution and optimizing the processing parameters. However, due to unavoidable transformation during cooling, the phase at high temperatures cannot be reserved and characterized at room temperature [1]. Various methods have been attempted to overcome the issue but have evident drawbacks. For example, although metallographic etching can be used to reveal prior grain boundaries from quenched martensitic microstructures, it often fails owing to low concentration of impurities along prior grain boundaries. Moreover, it is impossible to recover the crystallography of the parent phase through this method [2]. Another method is the use of model steels that retain their austenitic structure down to room temperature. As the model steels must be high in alloying elements, the metallurgical phenomenon observed in these steels is not applicable to the studied low-alloy steels [3]. Consequently, there is a need for a more direct and explicit method to observe the microstructure.
Recently, reconstruction of the parent microstructure from inherited martensite () orientation maps measured by electron backscatter diffraction (EBSD) has been proposed for a direct characterization of microstructure. There are two main approaches to reconstruct the orientation of parent from its inherited variants [4]. First, a reconstruction procedure based on the two-step “nuclei identification” and “nuclei spreading” strategy was proposed by German et al. [5,6]. The method has been used and validated by some reacher in the literature [2,7]. In this method, the domains with preset misorientation tolerance are sorted into different parent grains with robust algorithms and only an average orientation of grain is recovered. Thus, the orientation gradient within grains cannot be obtained in detail using this method. Second, Miyamoto et al. proposed another method to reconstruct the parent orientation: minimizing the angular deviation between the experimental orientations and the predicted ones [8,9]. This method includes subdivision of the EBSD map using a grid of squares and calculating the local orientation for each square. Therefore, it is more appropriate to deformed microstructures with orientation gradients in parent grains. A fundamental aspect of this method is to seek the orientation, which transforms into orientations in accordance with the orientation relationship (OR). However, when the cropped region around the grain boundaries of the parent phase contains variants transformed from distinctly different grains, a mis-indexing orientation will be figured out. In addition, this method is time-consuming, because it intends to use all the scanned data for the calculation of orientation. This restricts the calculation efficiency and accuracy [10].
To obtain local orientations of parent microstructure, the reconstruction method of the present work focuses on overcoming the limitations above. The local orientations around the grain boundaries of the parent phase are correctly determined using the new reconstruction criterion proposed in this study. Moreover, considering the calculation accuracy and efficiency of the method, a reduced solution space of Euler angles for OR is also proposed. Then, the potential orientations for each cropped square can be refined by the thought of reverse phase transformation. Based on the validated reconstruction method, an automatic reconstruction program is developed and applied to the reconstruction of deformed microstructure from the orientation maps of inherited .
2. Experiment
Fe-0.15C-1.11Cr-1.05Mn-0.27Si-0.06Ti (mass %) alloy is used for the study. Cylindrical specimens of the steel with 8 mm in diameter and 12 mm in length are prepared via machining and then applied in isothermal compression tests on a Gleeble-3500 thermal simulator (Dynamic Systems Inc., Austin, TX, USA). The specimens are heated to 1100 °C with 5 °C/s and austenitized for 300 s. Then, in order to obtain different orientation gradients inside grains, the specimens are compressed with a height reduction of 50% at a strain rate of 0.01 and 1 s−1, and quenched to reserve the microstructure. For EBSD observation, specimens are sectioned along the axial direction and then polished in an electrolyte comprising 8% perchloric acid and 92% ethanol at a voltage of 20 V for 15s. Orientation data are acquired with a step size of 0.2–0.4 μm, using a TSL system attached to an FEI Siron200 scanning electron microscopes (SEM, FEI Co., Hillsboro, OR, USA). TSL OIM Analysis software is used to perform data processing of orientations, as well as reconstructed orientations.
3. Reconstruction Method
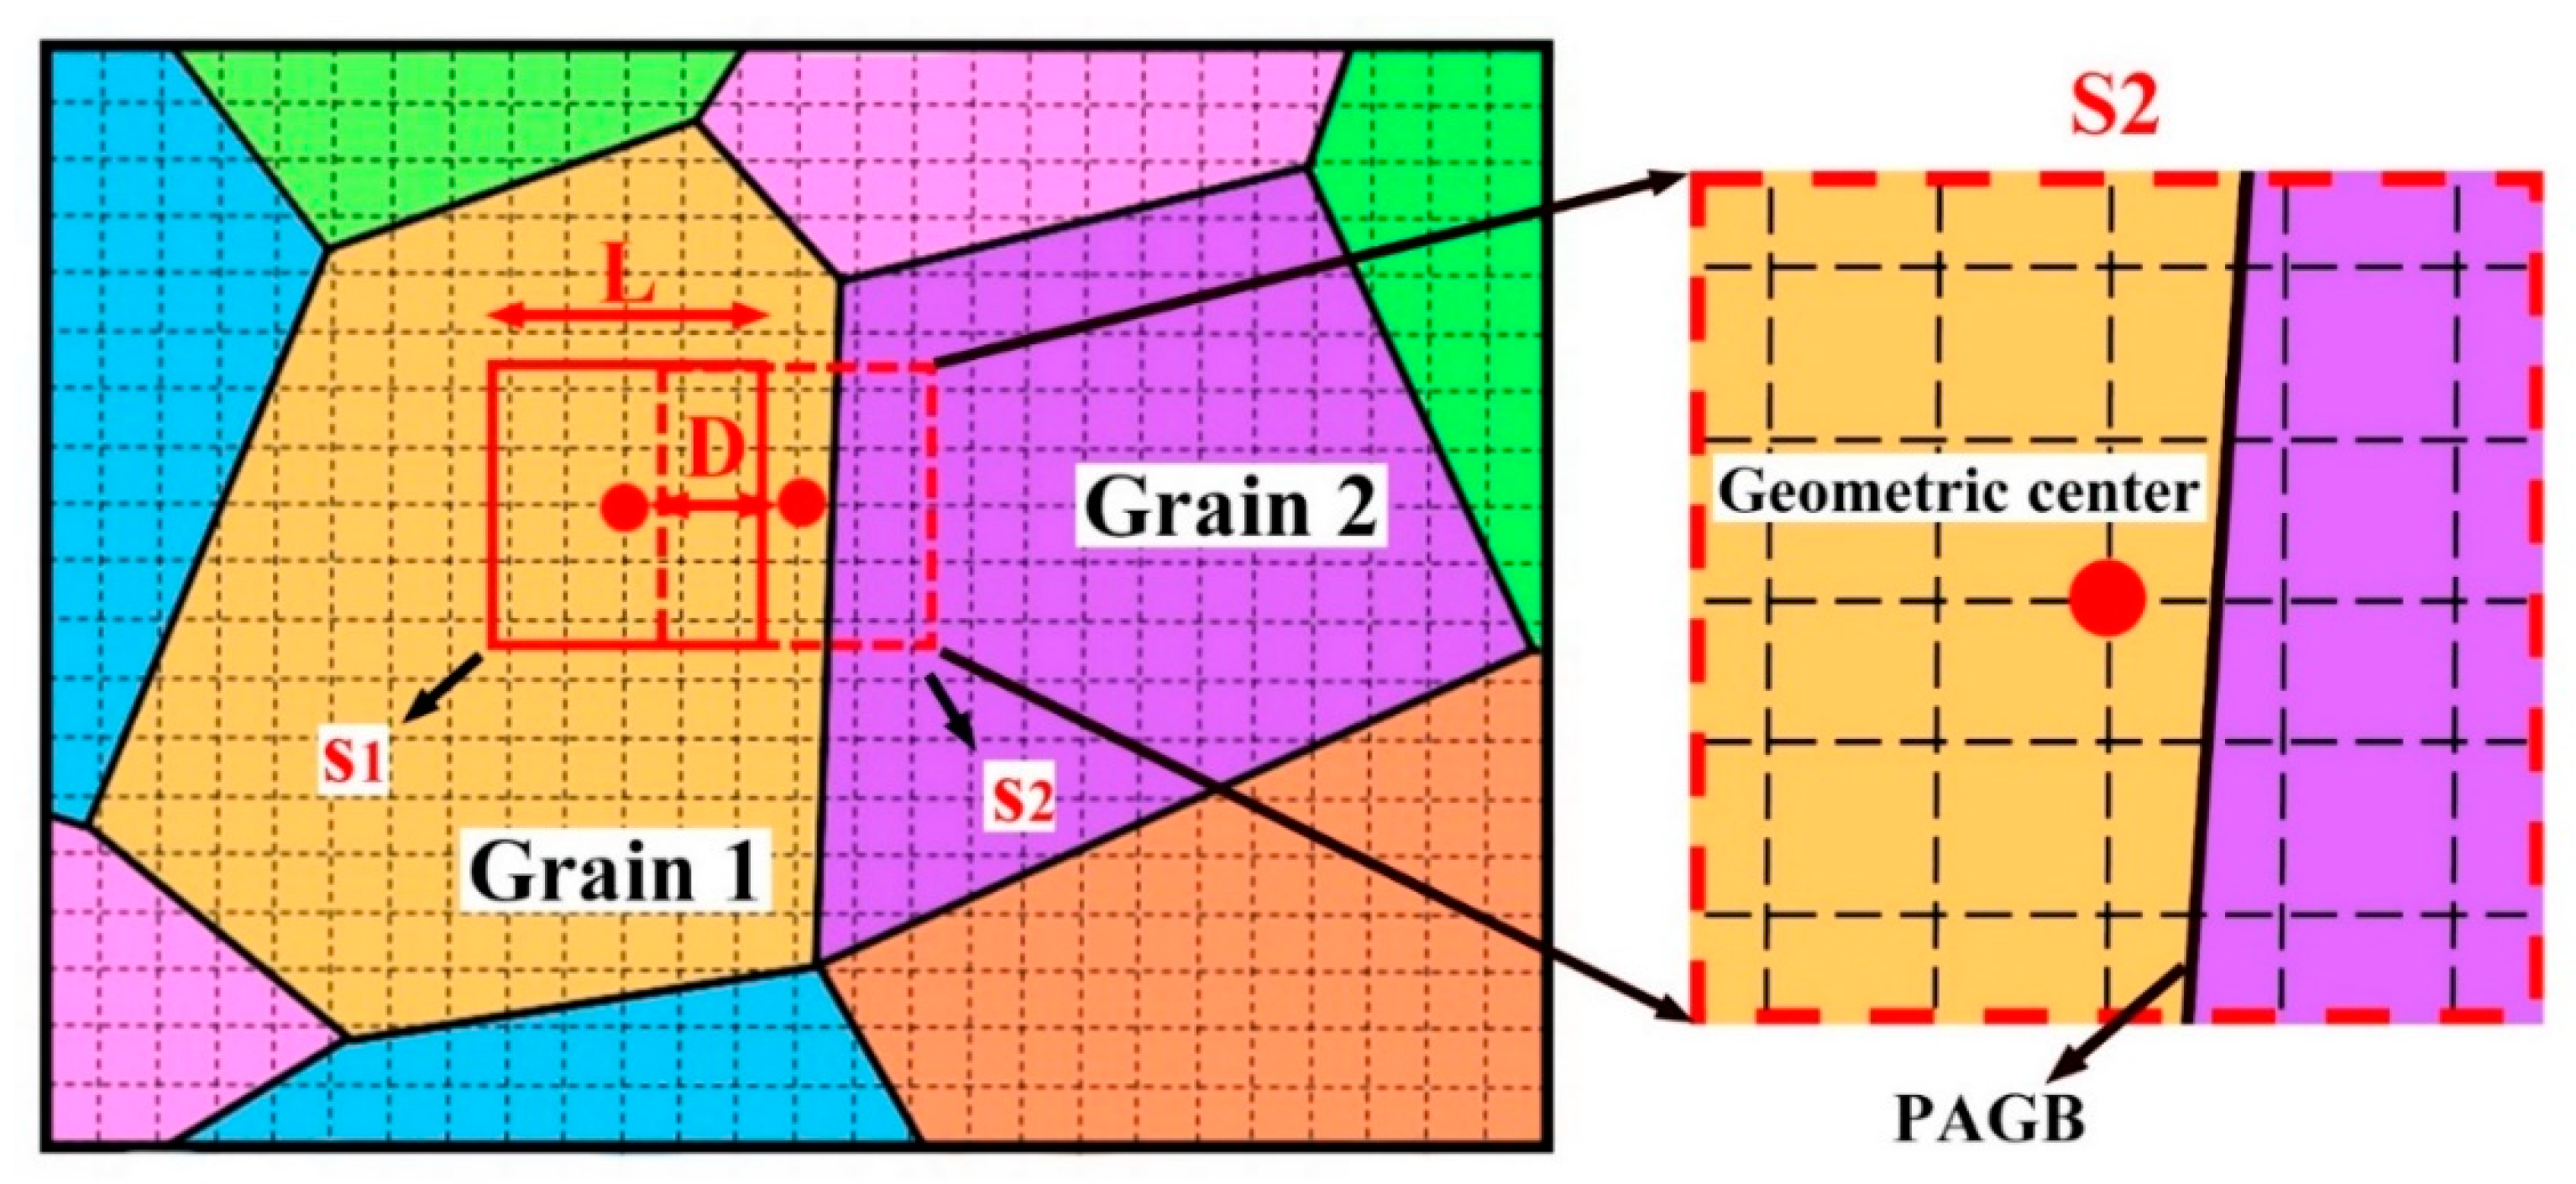
A schematic diagram for reconstruction procedure is given in Figure 1. The intersections of thin dashed lines are the points with orientations, which can be obtained using EBSD. Different colors represent different parent grains. Thick lines between them are parent grain boundaries (PAGB). In order to analyze the local orientation of parent , the orientation map is cropped into small data squares (indicated by red boxes in Figure 1). The squares can be divided into two types: one is the square inside the parent grain (indicated by S1), where the orientations in this type of square possess a same parent orientation. The other is the square covering PAGB (indicated by S2). The procedure of cropping is automatically carried out according to the parameters of L and D. L is the length of one side of the cropped square and D is the distance between neighboring squares. The setting of L needs to ensure that there are at least two different variants in each square [11]. The ratio of L to D is usually between two and four and it should be adjusted by trial and error for every EBSD mapping.
For the square type of S1, the parent orientation can be obtained according to the method proposed in [9] (the calculated orientation satisfies the OR with all the orientations in the square). Then, the determined orientation is assigned to the geometric center. However, this method is not appropriate for the square type of S2. This is because S2 contains orientations transformed from both Grain 1 and Grain 2. It is unable to calculate a single orientation that satisfies the OR with all of these orientations. However, it is noted that the parent orientation of the geometric center is consistent with the parent orientation of the partial orientations in this square type. Consequently, the orientations inherited from the grain covering the geometric center, are selected to reconstruct the orientation of this square. As shown in the enlarged chart on the right side of Figure 1, the parent orientation should be determined only using the orientations from Grain 1. Through this reconstruction method, it is guaranteed that the determined orientation for every cropped square is consistent with the grain where the geometric center is located, which improves the reconstruction accuracy.
3.1. Precise Solution of the OR
OR defines the possible orientations from a parent orientation. The results of the reconstruction are highly sensitive to the selection of an appropriate OR [7]. It has been proven that the average OR of steels is influenced by their chemical composition and cooling condition during phase transformation [12]. Consequently, the OR should be first determined for the material.
If a region contains at least two variants transformed from a single grain, the parent orientation () and the OR () can be simultaneously obtained through numerical fitting [9]. Firstly, the possible orientations of variants can be calculated as [13]:
where is the nth conversion matrix of 24 symmetry operations for the cubic system. corresponds to 24 variants of OR. The region contains N data points of orientations; the ith data point in the region is referred to as . Then, the deviation matrix between calculated and experimental orientations for each is estimated by [9]:
and are chosen as deviation angle of () being minimal for each . At last, for N data points of orientations, the average deviation angle is given by:
As individual variables, and can be determined by minimizing , which is considered as the reconstruction criterion of the selected region.
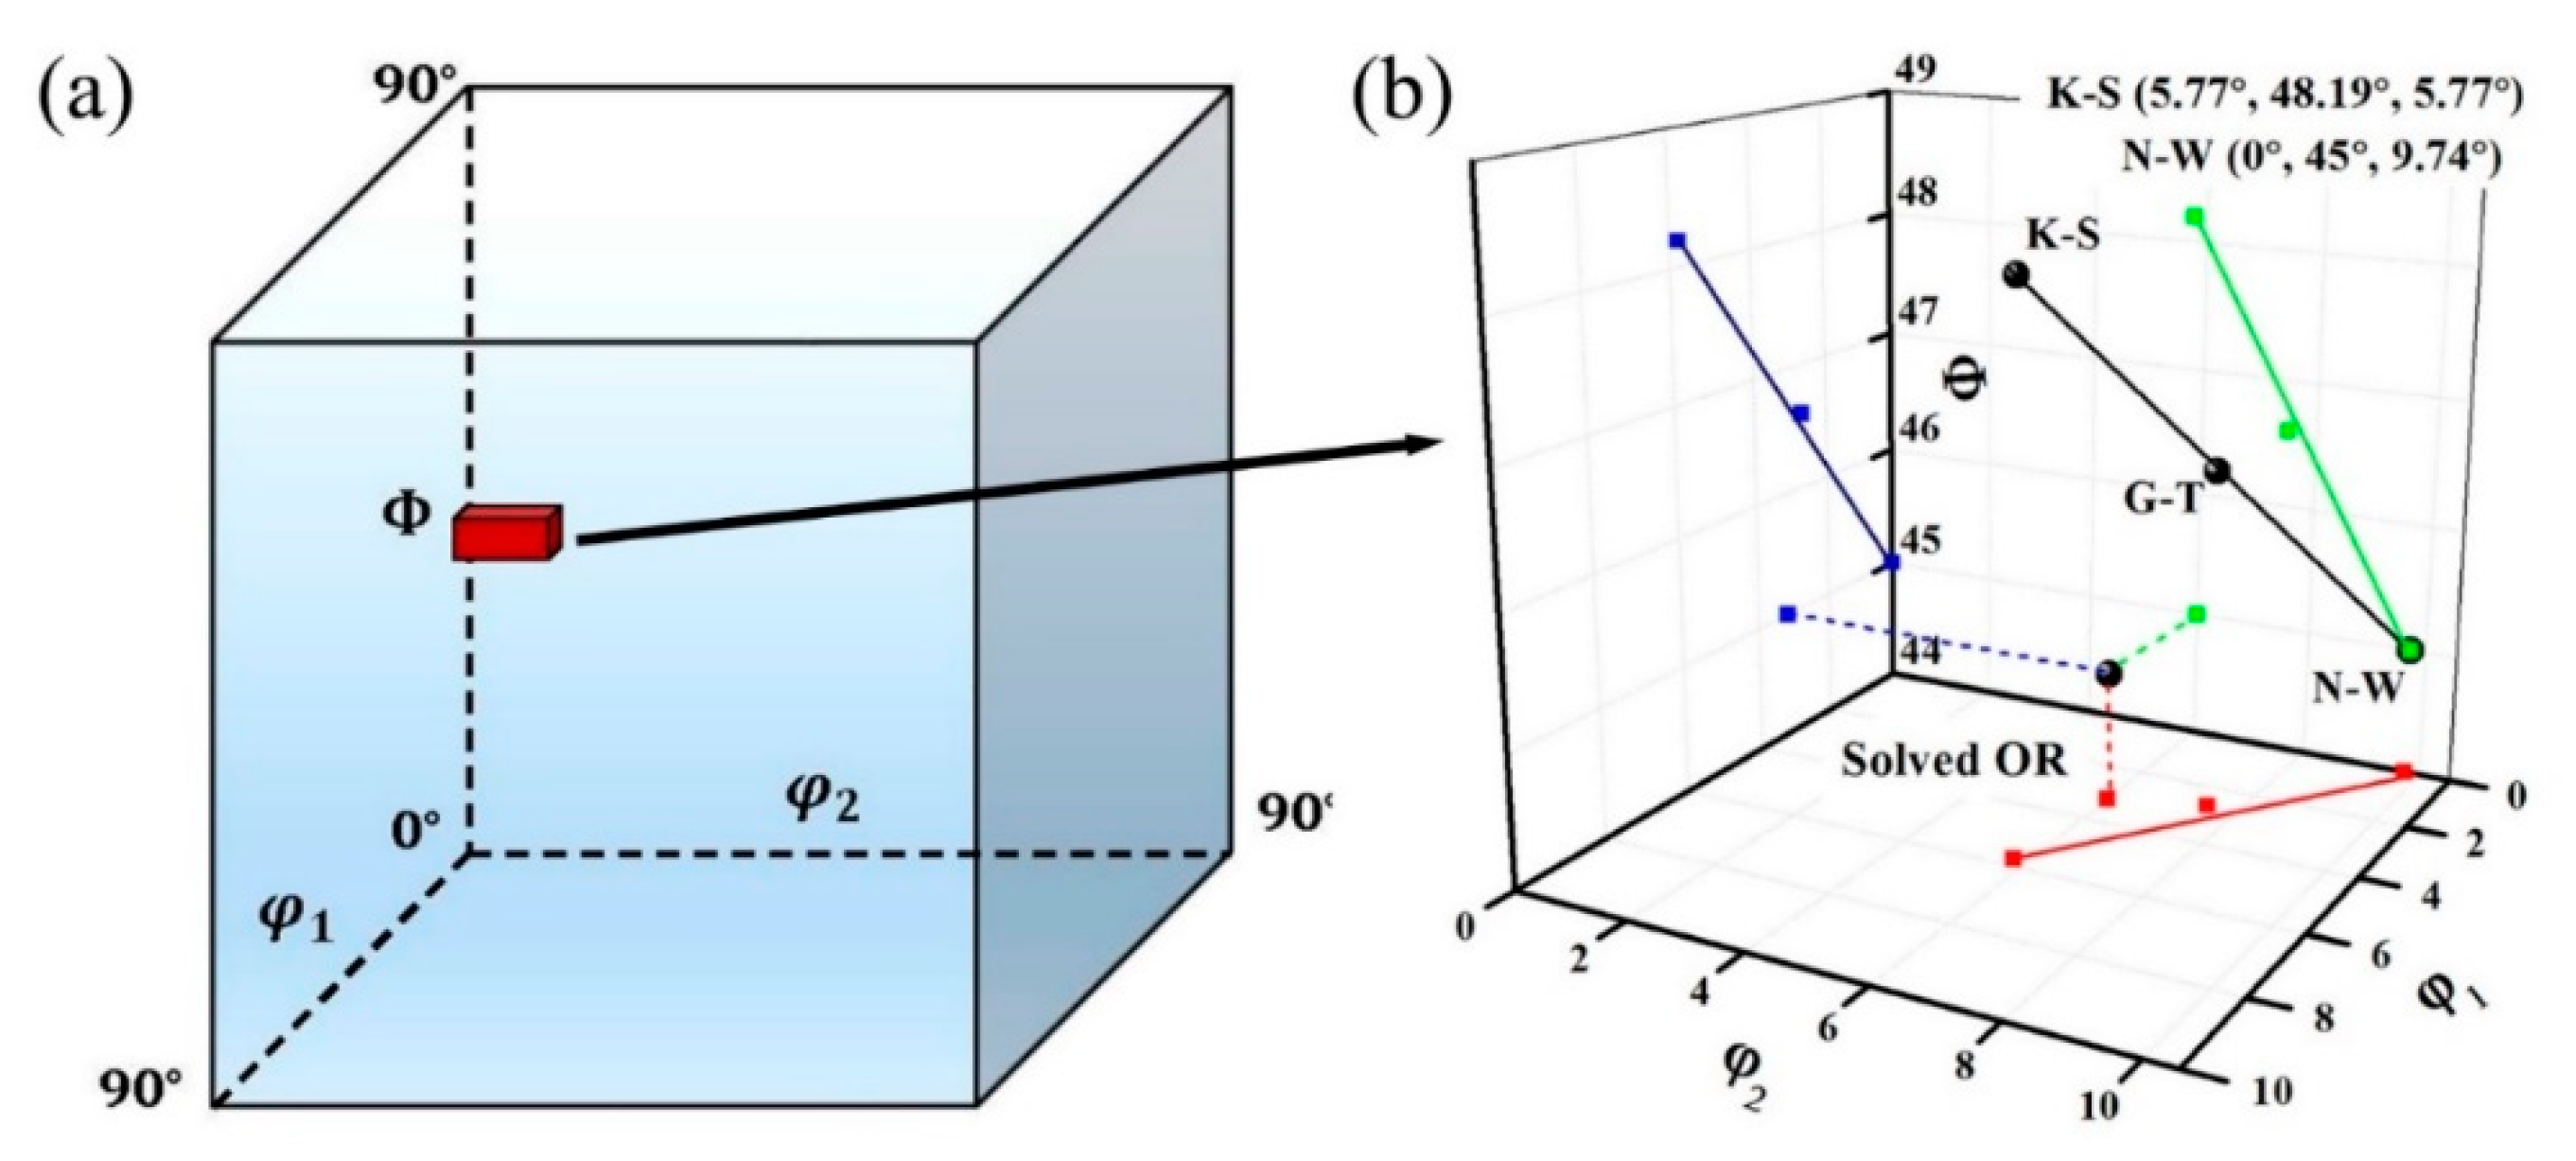
In a cubic crystal system, all the orientations can be found in a space of Euler angles (, , ), which is seen as the entire solution space for (Figure 2a). The entire space is too large to solve the accurately and efficiently. Consequently, the solution space should be reduced. It is noted that needs to represent any of the 24 variants and the rest of the variants can be calculated by . Thus, the solution space can be reduced according to the classical ORs (Kurdjumov-Sachs (KS), Nishiyama-Wasserman (NW), and Greninger-Troiano (GT)) in low-alloy steels [14]. For the three ORs, a selected variant is described by a combination of two close-packed planes (CPs) and two close-directions (CDs), as well as Euler angles [15]. As shown in Table 1, only KS OR satisfies parallel CPs and parallel CDs, but NW and GT ORs are closed to the parallel relation. Accordingly, the Euler angles of the three ORs are similar. and are within the range of to and is within the range of to . It has been proved that the real OR for martensitic transformation always has several degrees of deviations from KS or NW OR [16]. Moreover, ORs measured in steels from EBSD and TEM experimental studies are usually intermediate between KS OR and NW OR [17,18]. As shown in Figure 2b, GT OR is such an OR. Consequently, the solution space for can be restricted as for numerical fitting (Figure 2b).
3.2. Determination of the Local Orientation
In previous studies, the parent orientation was determined from the entire solution space, which can be refined in this step. First, the 24 potential parent orientations of every data point in the cropped square are calculated using the OR solved in Section 3.1. Subsequently, these orientations can be assembled as potential orientations for the cropped square. The calculation is derived as follows:
The minimum is calculated for every cropped square from . If the minimum is lower than a predefined distinguishing angle (, the variants in the cropped square are transformed from only one grain. Then, the is correctly determined through minimization. If not, the cropped square contains variants inherited from more than one grain. The determination of is operated in a different way. Notably, the geometric center of the cropped square is always located at the parent grain, which provides the majority of orientations. Based on this idea, a new reconstruction criterion is proposed as follows.
After substituting the candidate value of from into Equation (2), the value for the ith measured point can be obtained. The data point for which is considered as the qualified point satisfying the OR. The number of qualified points is expressed as . The percentage of qualified points among N measured points for every candidate is given as:
Finally, is determined from by maximizing P for the cropped square with variants from different parent grains.
The reconstruction criterion for both types of squares can be summarized and expressed as follows:
where F is defined as the discriminant factor for cropped squares, and is expressed as:
When is less than (F = −1), the cropped square is from a parent grain. When is greater than (F = 1), the cropped square contains orientations from more than one parent grain. The local orientation can be determined for all cropped squares only when C is at a maximum.
4. Experimental Verification and Application
4.1. Verification
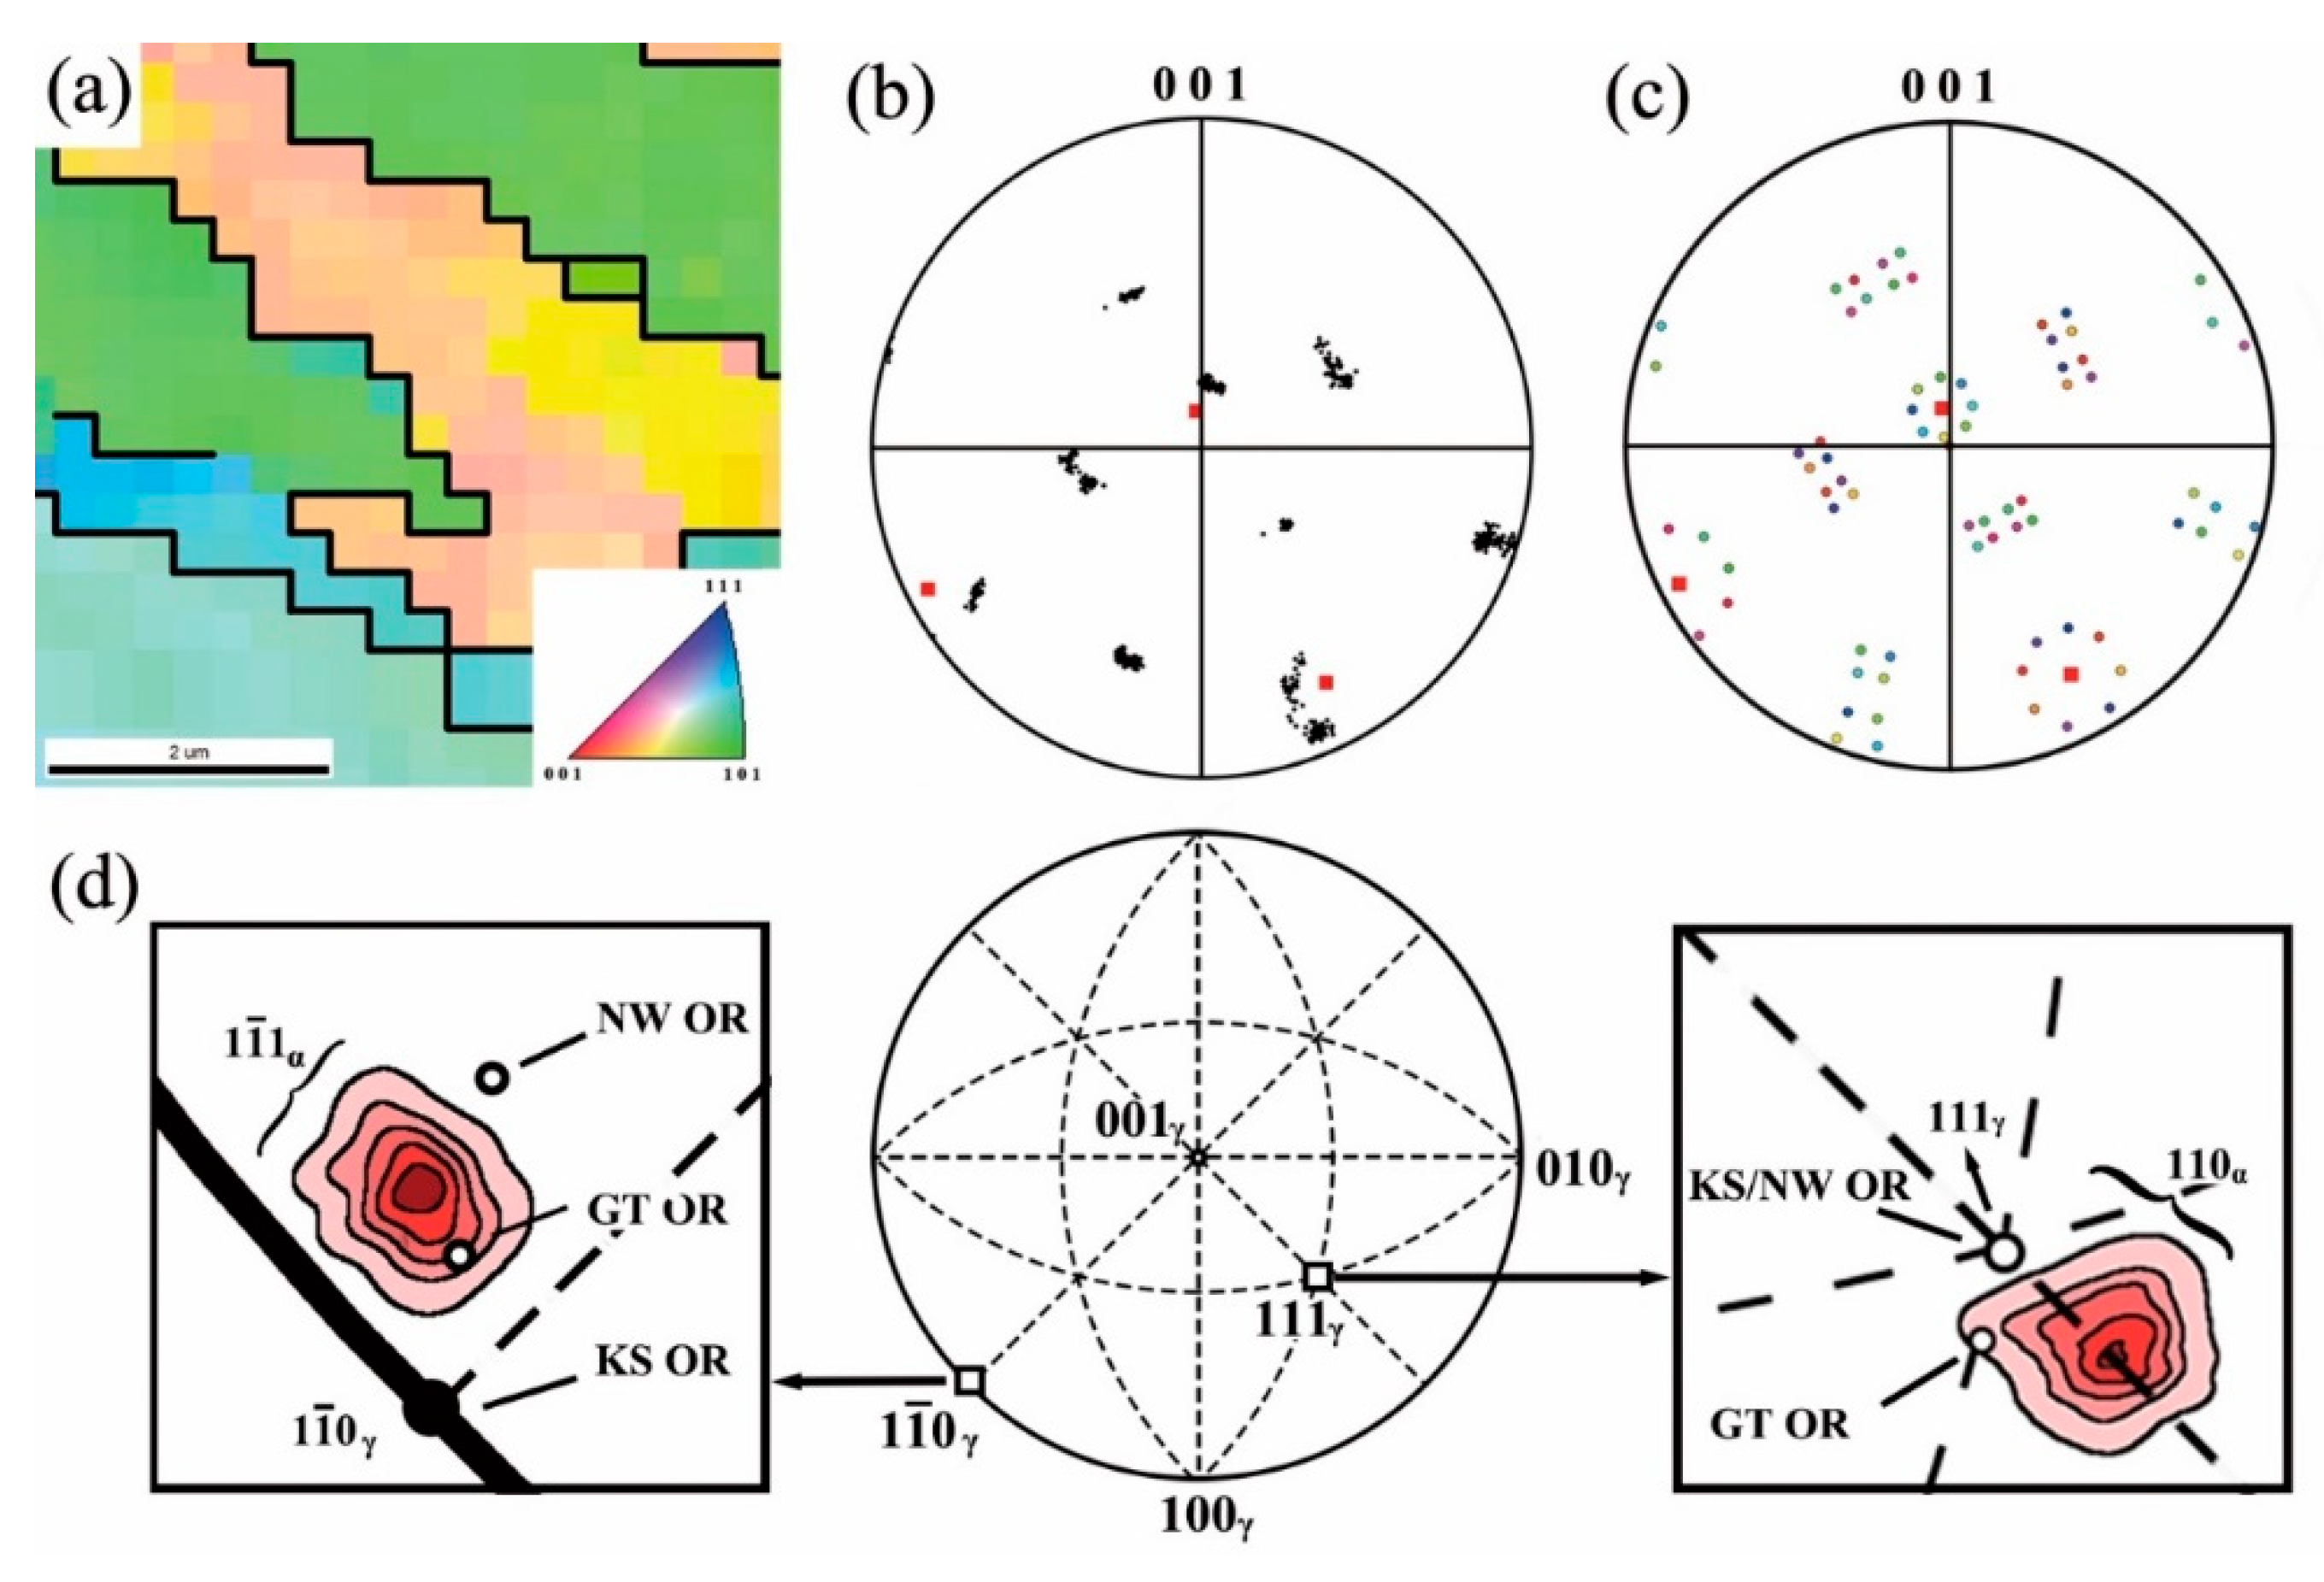
Figure 3a shows the inverse pole figure (IPF) map of a manually cropped region with several variants transformed from one grain. Using the reduced solution space of Euler angles proposed in Section 3.1, the OR and the parent orientation were determined by numerical fitting for this region. The 001 pole figure of the measured orientations in Figure 3a, as well as the reconstructed orientation, are presented in Figure 3b. In addition, the 001 pole figure of all orientations predicted by the solved OR and the reconstructed orientation are shown in Figure 3c. The measured orientations (black dots in Figure 3c) and predicted orientations (colored dots in Figure 3d) indicate good agreement between the experimental and calculated data. It was proven that the reduced solution space of Euler angles could be effectively used to solve the OR. The quantity of data in Figure 3a is not sufficient to determine the average OR appropriate for all the grains [11]. Therefore, data regions inside different grains were selected. Figure 1d shows a 001γ standard stereographic projections, indicating a deviation from the parallel relations of CP ( and ) and CD ( and ), which was satisfied in KS OR. The density contours were calculated using ORs solved from different regions. Furthermore, the peak position was considered as the average OR. Thus, the average OR of this low-alloy steel was solved as . For this average OR, the angle between the CPs was , while the angle between the CDs was .
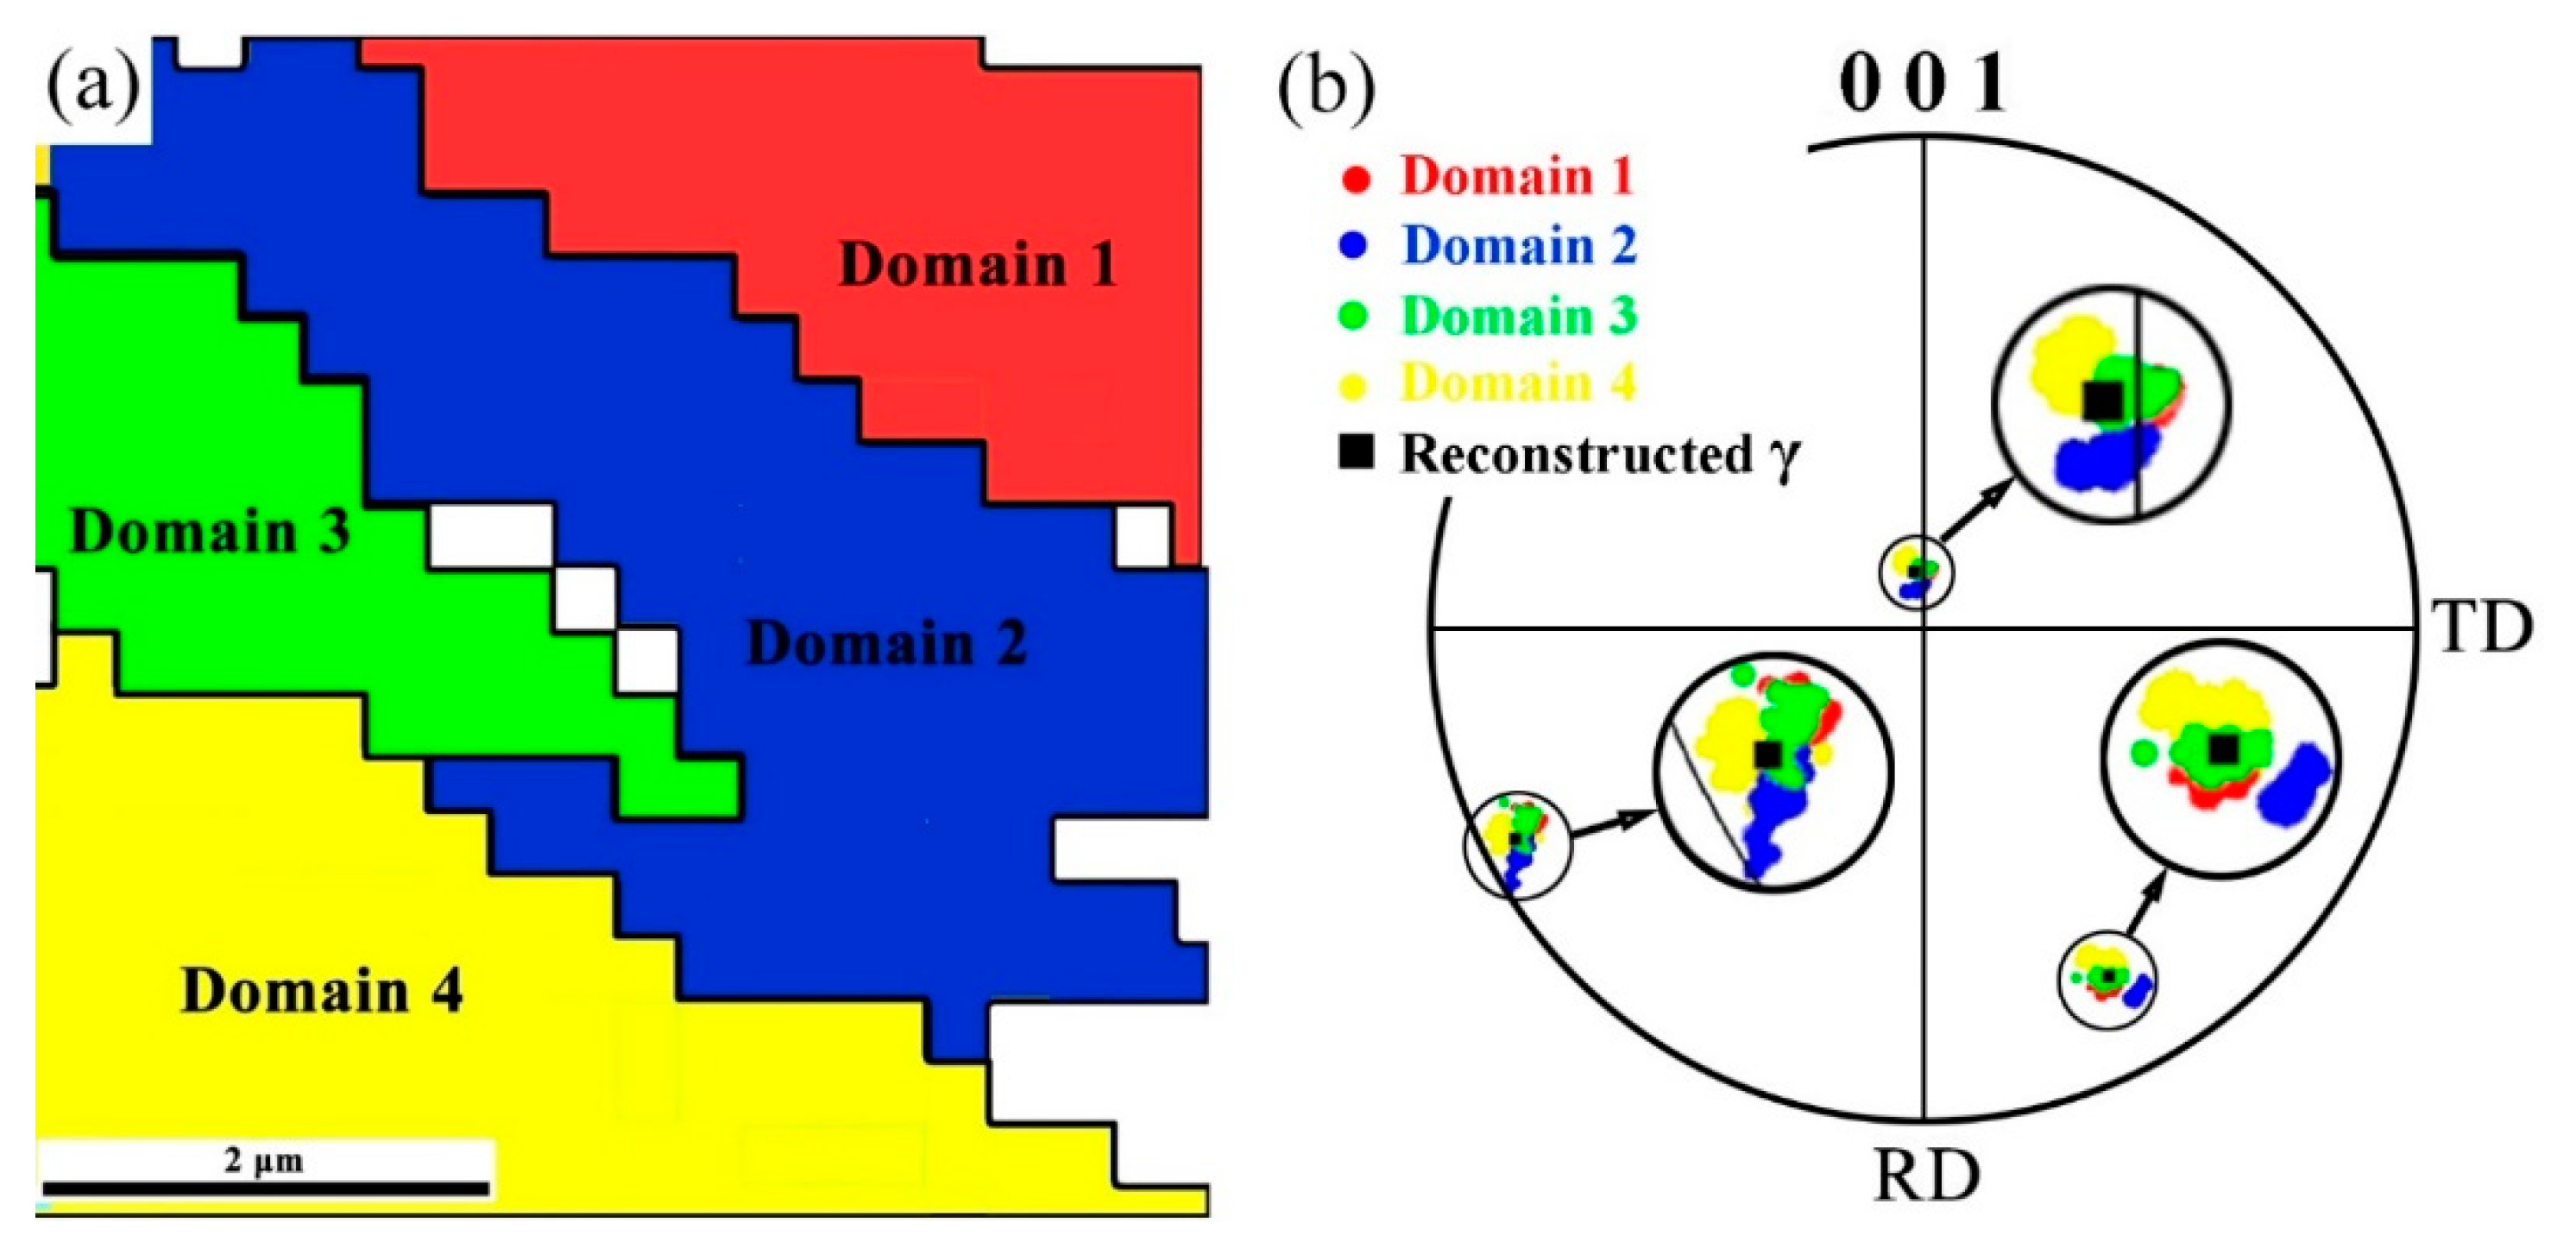
After identifying the average OR of the steel, the solution space for the parent orientation of every cropped square was refined using Equation (4). It should be further discussed whether the potential orientations in the refined space can cover the real parent orientation. The parent orientation of the orientation map in Figure 3a was determined from the entire solution space. Then, every orientation in the map was sorted into one of 24 variants. As shown in Figure 4a, the orientation map was mainly divided into four different domains. In each domain, orientations were considered bearing the same variant of the OR. Then, the potential orientations around the target orientation (black dots) were calculated by Equation (4) and shown in the 001 pole figure (Figure 4b). The orientations inside each domain were not consistent owing to orientation scatterings during martensitic transformation [19]. Therefore, the reversely calculated orientations for each domain were also scattered. As shown in Figure 4b, these orientations not only cover the orientation to be determined but were densely dispersed around the real parent orientation. Consequently, the refined solution space also guaranteed the reconstruction accuracy.
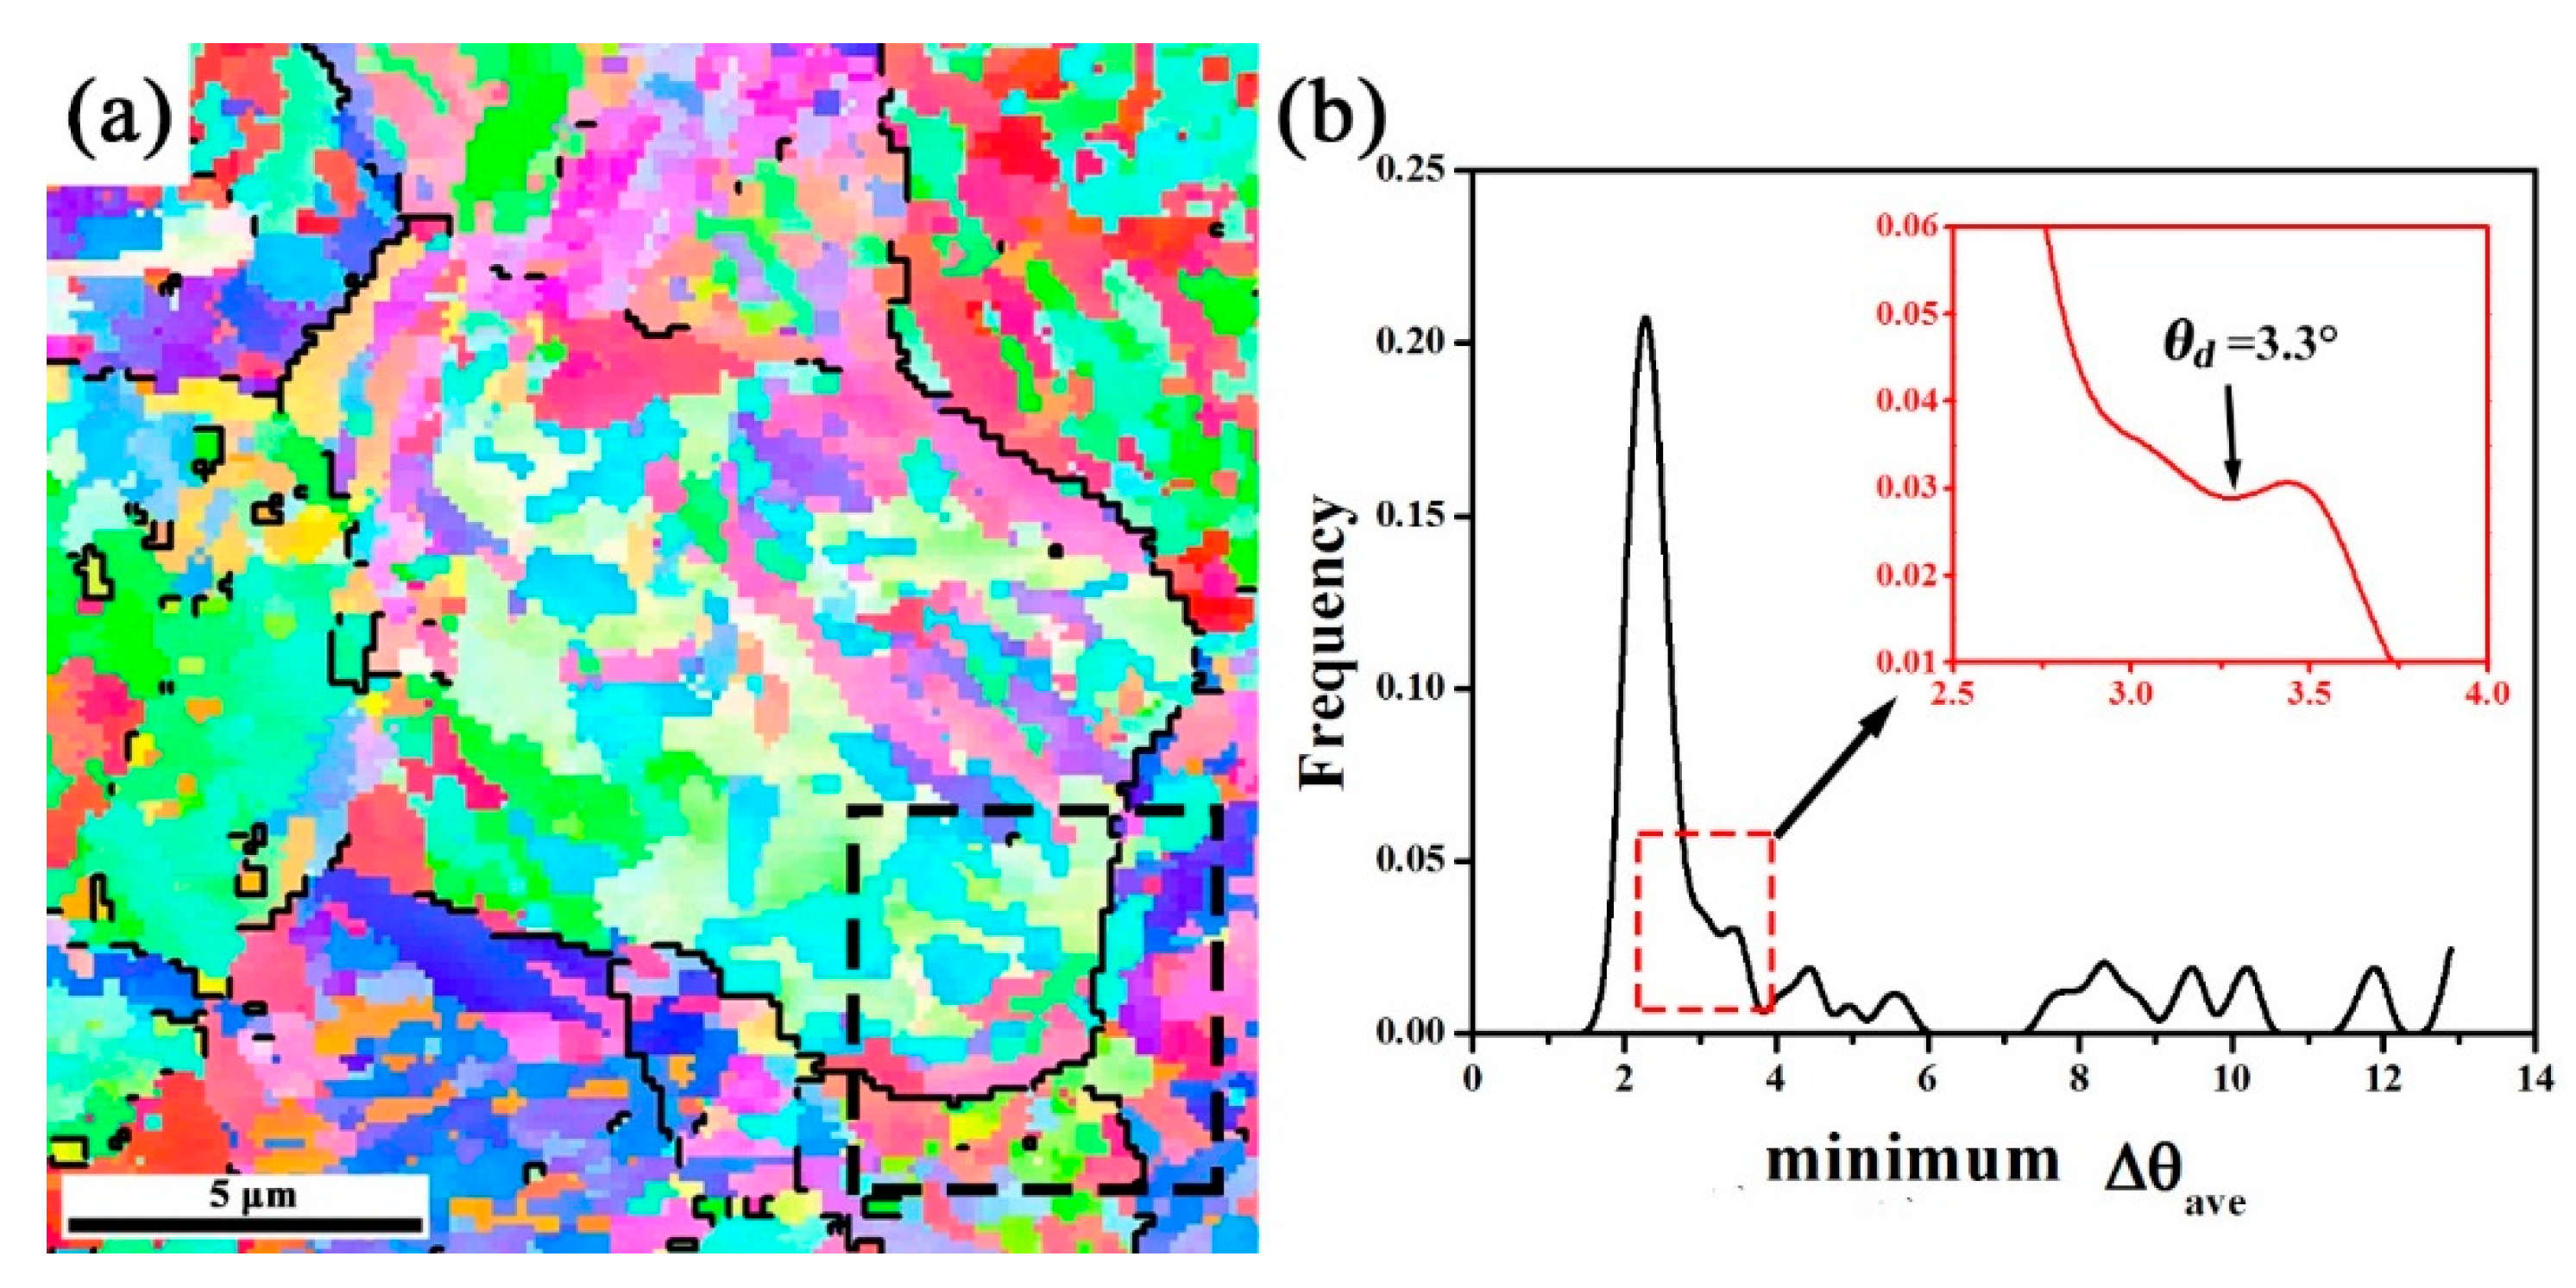
The orientation map in Figure 5a was cropped into 225 squares for reconstruction of the microstructure. The black lines in the map represent boundaries with misorientation angles between and , which partially reveal PAGB [20]. Therefore, the cropped squares could not avoid covering the grain boundaries. The minimum was calculated for every cropped square. The frequency of minimum is shown in Figure 5a. The values of minimum for cropped squares inside the parent grains concentrate in the low-value zone follow a normal distribution. In this case, the deviation angle was mainly due to the true variation of OR between the product and parent phases, as previously indicated by Kelly et al. [16], as well as by errors in the EBSD measurements. However, for the cropped square containing orientations from different parent grains, the minimum presented a large value. As shown in the partial enlargement of Figure 4a, the descent stage of normal distribution tended to increase owing to the latter cropped squares. The value of the first inflection point was considered as the distinguishing value () for two types of cropped squares. The value of is for the map in Figure 5a. Through the analysis of various EBSD data of this steel, the values of were in the range of .
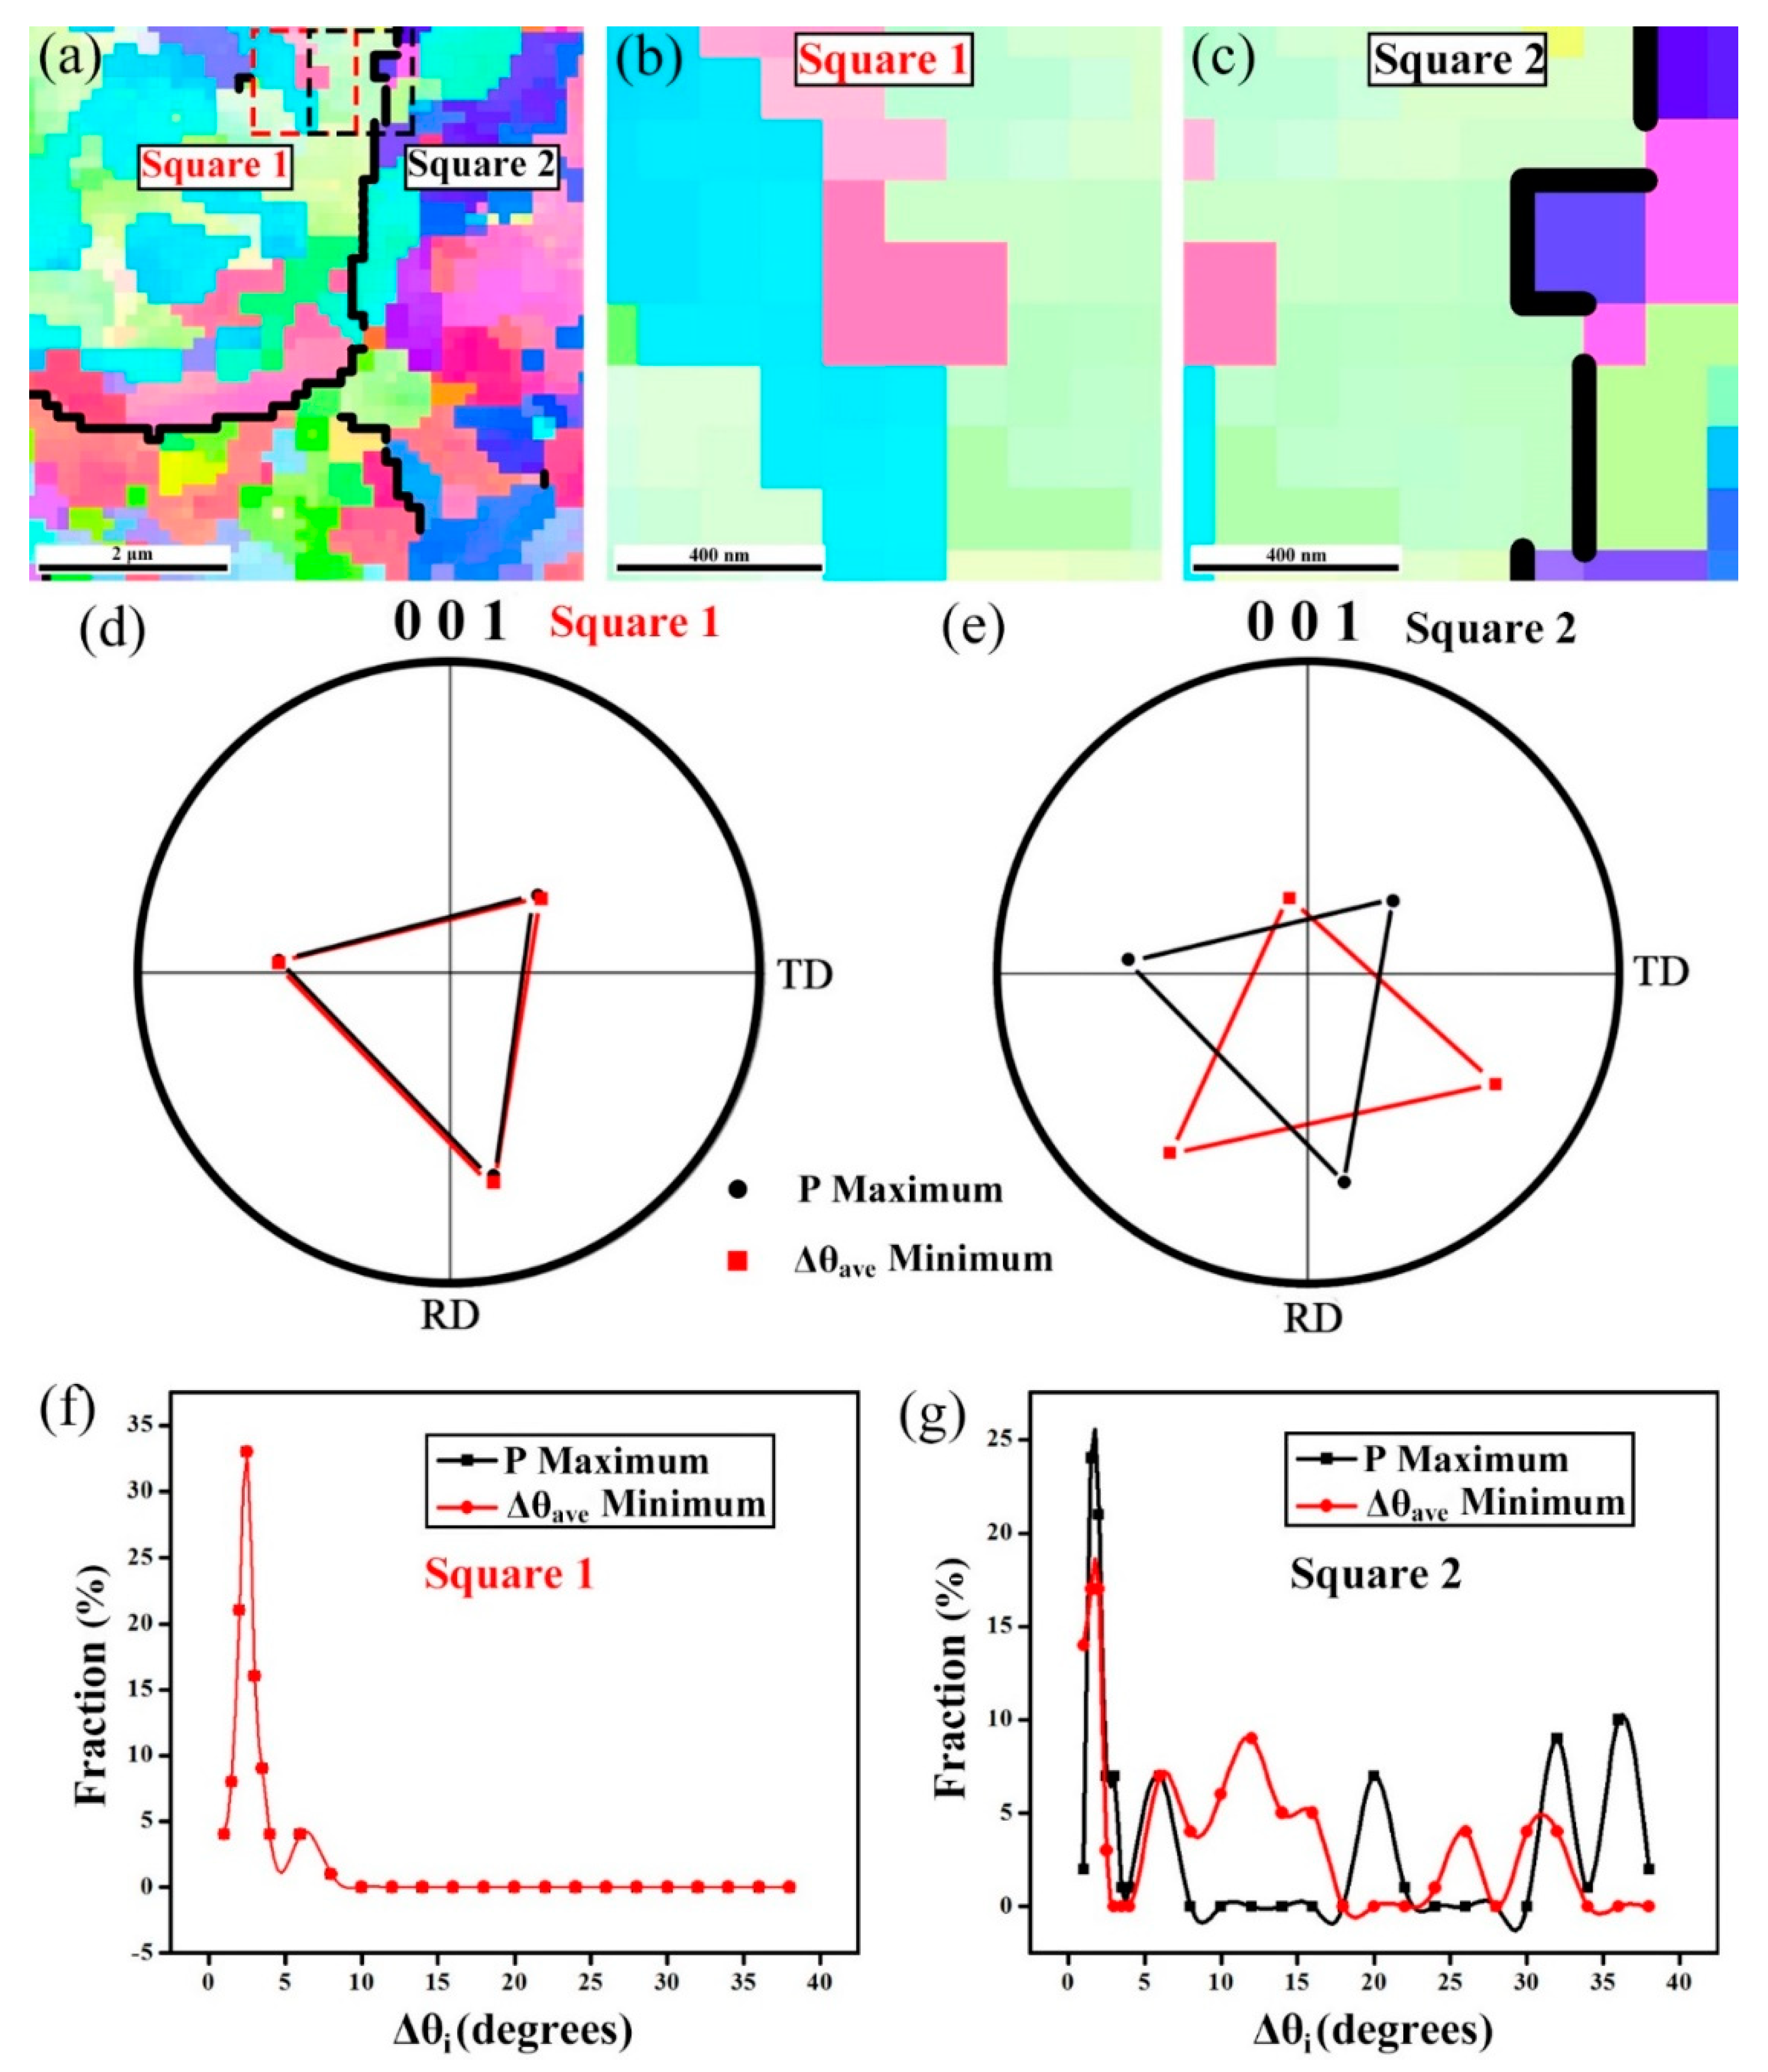
To validate the proposed criterion of P maximization, an IPF map of with evident PAGB was selected from the dashed box in Figure 5a. There were two adjacent cropped squares called Squares 1 and 2 (Figure 6a). Both squares consisted of 100 data points. Square 1 was in the interior of parent grain, whereas Square 2 covered two grains (Figure 6c). With the criteria of minimization and P maximization for Square 1, the reconstructed orientations were obtained and shown in the 001 pole figure (Figure 6d). The parent orientations determined by the two criteria and the distributions of were almost the same (Figure 6f). More than 90% of was less than . However, using the criteria of minimization and P maximization in Square 2, two different orientations were determined and shown in the 001 pole figure (Figure 6e). Most orientations in Square 2 were inherited from the grain on the left side, where all orientations in Square 1 belong. Thus, the solved parent orientation of Square 2 should be the same as that of Square 1. As shown in Figure 6e, the criterion of P maximization satisfied the requirement, whereas the criterion of minimization yielded a mis-indexing orientation. The distributions of for the reconstructed orientations obtained by the two criteria were shown in Figure 6g. The orientation obtained by the criterion of P maximization had more measured points whose was less than .
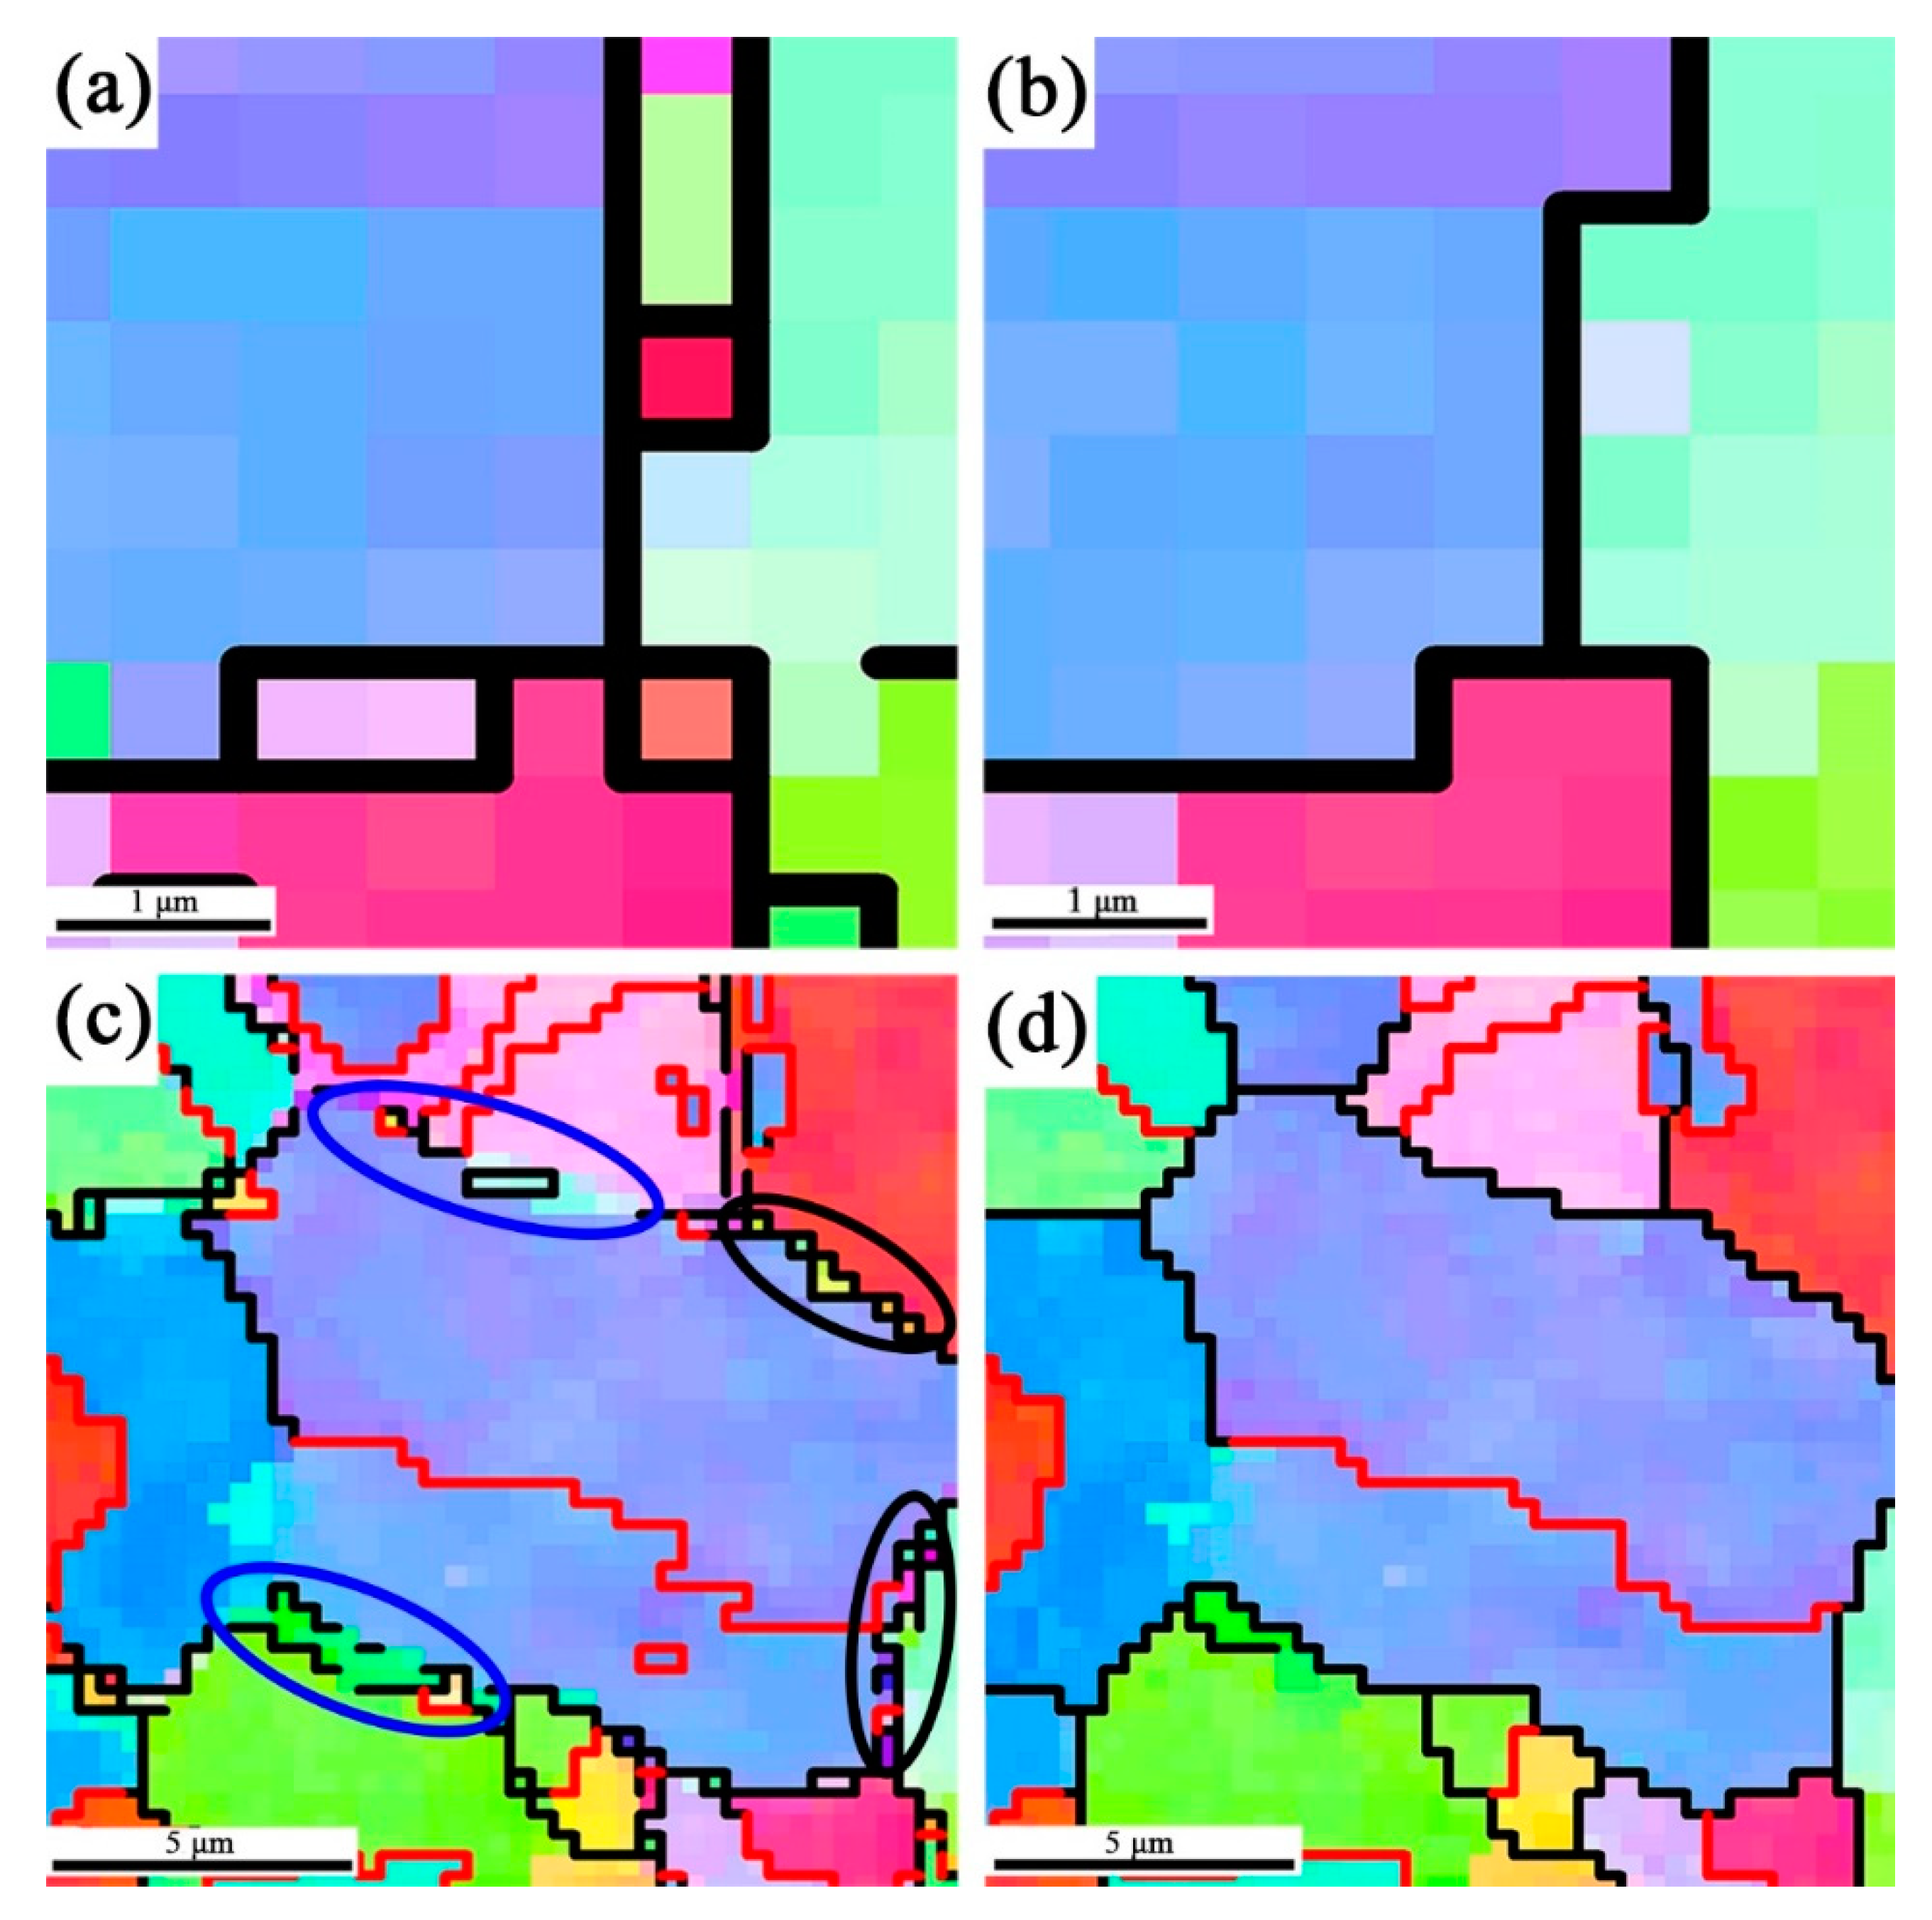
The map in Figure 6a was reconstructed using only the conventional criterion of minimization. There were mis-indexing orientations along the PAGB, as shown in Figure 7a. When the newly proposed criterion of C maximization was applied, the reconstruction quality along PAGB was evidently improved (Figure 7b). The entire map in Figure 5a was also reconstructed using the conventional and newly proposed criteria (Figure 7c,d). As shown in Figure 7c, the reconstructed map exhibited failures around the PAGB. Two-layer grain boundaries were generated in the black oval. In addition, prior boundaries were not presented clearly in the blue oval. Both of these features were unfavorable for grain size statistics. The reconstructed map in Figure 7d showed a more unambiguous morphology of the grains than that in Figure 7c. During hot deformation of austenitic materials, dynamic recrystallization (DRX) always generated small grains around the initial grain boundaries. Therefore, the newly proposed reconstruction criterion enhanced the capacity of characterization of the microstructure around the PAGB. Furthermore, many twins were generated in austenitic materials, which also required high quality of reconstructed boundaries [21].
4.2. Application
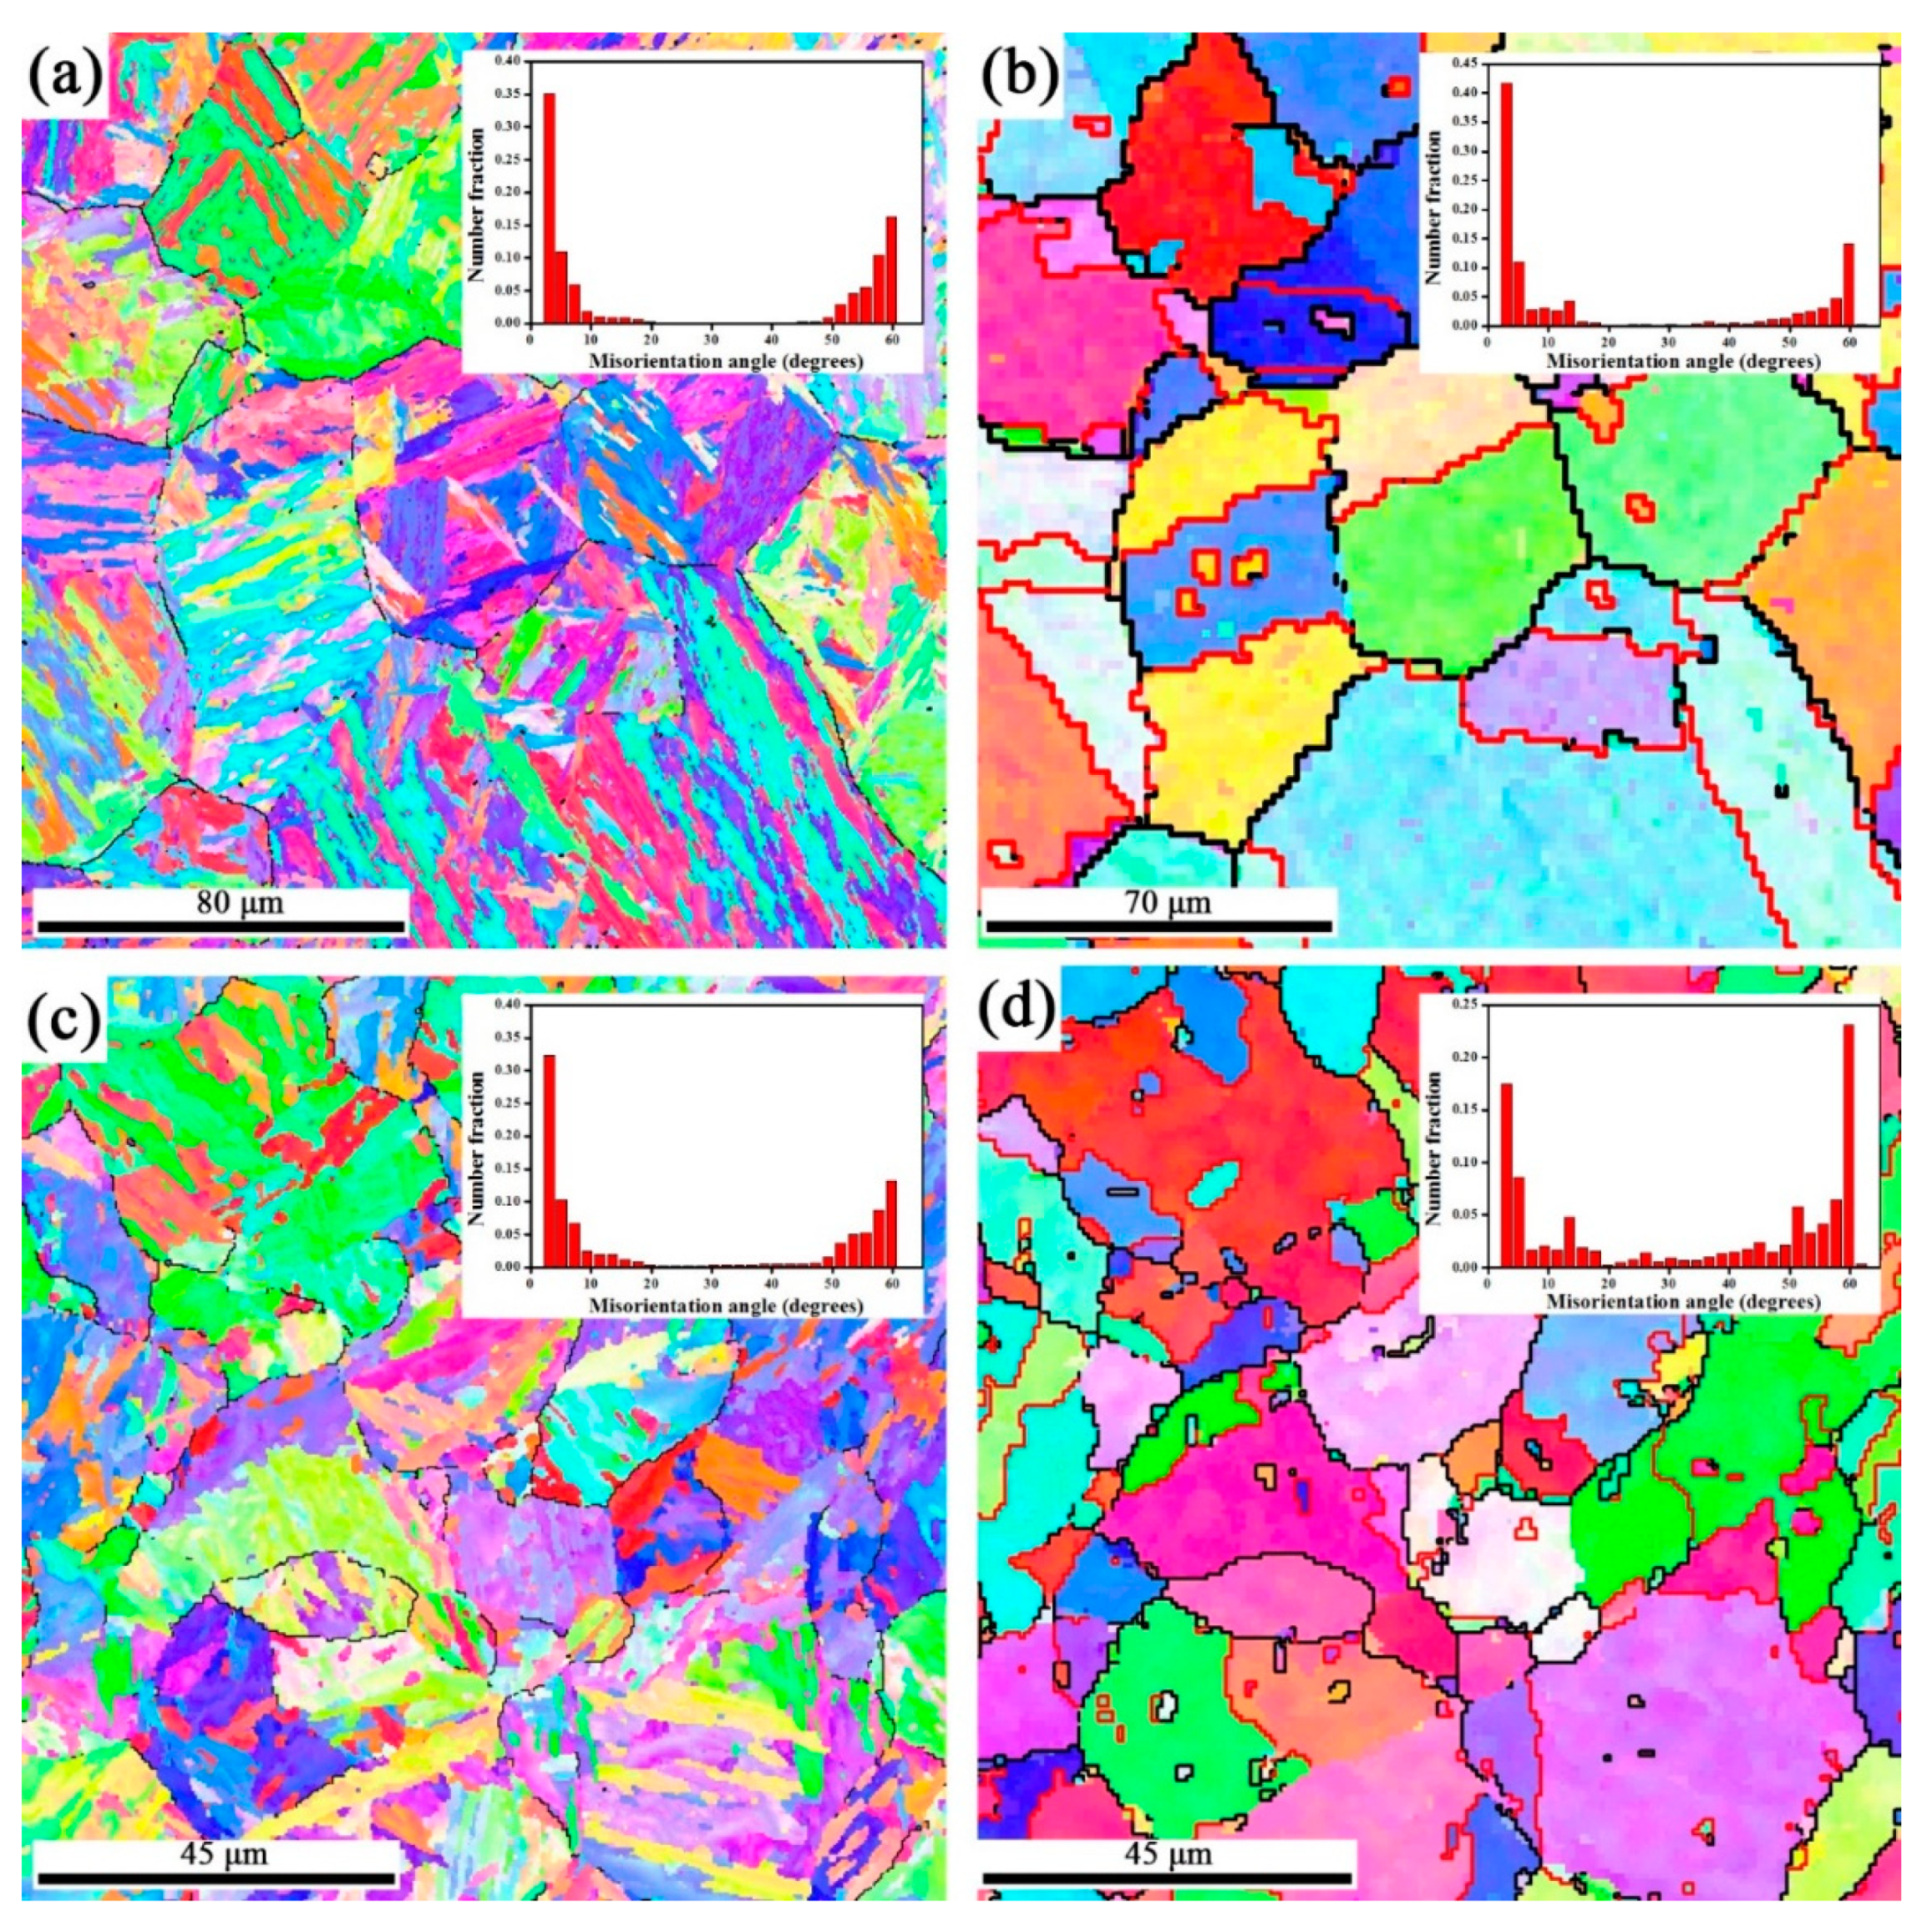
According to the improved reconstruction method, an automatic program was written in C language. The IPF maps with the misorientation angle distribution (MAD) charts of the microstructure at strain rates of 0.01 and 1 s−1 are shown in Figure 8a,c. The boundaries of black lines with misorientation angles between were also shown in the maps. The IPF map showed a morphology of fully lath martensite. The MAD of transformed from deformed at different strain rates were similar. Furthermore, 95% misorientation angels were concentrated in the range of and . This is related to the crystallographic relationship of the adjacent variants obtained from the KS-based OR [22]. Moreover, the MAD of the map was not evidently influenced by different strain rates. The IPF maps of the reconstructed microstructure were obtained using the improved reconstruction procedure, shown in Figure 8b,d. Overall, the reconstructed grain boundaries (>) appear to be consistent with the black lines in Figure 8a,c. The MAD of the reconstructed at low and high strain rates showed different tendencies. There were fewer low angle boundaries () existing at 1 s−1 than that at 0.01 s−1. This indicates the fraction of DRX is more obvious at 1 s-1. Furthermore, more twin boundaries were generated at a high strain rate. This is because the formation of twin boundaries was promoted by DRX [23,24].
When analyzing the behavior of DRX using EBSD, it is necessary to obtain the distribution of low angle boundaries and high angle boundaries. The reconstruction procedure proposed in this study precisely reconstructed orientation gradients and low angle boundaries. It was difficult for the reconstruction approach of the nuclei identification and spreading strategy to satisfy this requirement. The proposed reconstruction criterion enhanced the manipulation of reconstruction around PAGB as well as some special boundaries. It was proven that the characterization of twin boundaries by the procedure was consistent with the existing studies. Thus, the proposed reconstruction method had a strong capacity for indexing local orientations of parent microstructure.
5. Conclusions
An accurate method to reconstruct the local orientation has been presented and applied to the martensitic structure of a low-alloy steel. The following results were obtained:
- A reduced solution space of Euler angles for the OR to be determined was proposed, based on the classical ORs. Thus, an average OR for this steel can be accurately determined with high calculation efficiency. The angular deviations between CPs and CDs were found to be and , respectively.
- Further, the solution range of the parent orientation for every square was refined. The 24 potential parent orientations of every measured point in the cropped square were reversely calculated using the solved OR and assembled as the candidate orientations for numerical fitting.
- Cropped squares containing variants inherited from different parent grains were separated from those inherited from one parent grain, i.e., a discriminant factor (F). A unified criterion of C maximization was proposed, appropriate to both types of squares.
- The present method was applied to the EBSD maps of martensitic phase in the studied steel. It verified that the method accurately reconstructs morphology and crystallography of deformed parent grains.
Author Contributions
D.W., J.J., and Q.L. carried out the methodology, formal analysis, and validation of the results; D.W. carried out the original draft preparation; X.W. focused on review, editing, and supervision.
Funding
This research was funded by the National Natural Science Fund for Distinguished Young Scholars of China (Grant No. 51725504) and the National Natural Science Foundation of China (Grant No. 51675201).
Acknowledgments
The authors are also grateful for the technical assistance from the Analytical Platform of the State Key Laboratory of Materials Processing and Die and Mould Technology.
Conflicts of Interest
The authors declare no conflict of interest.
References
- Taylor, A.S.; Cizek, P.; Hodgson, P.D. Comparison of 304 stainless steel and Ni–30wt.% Fe as potential model alloys to study the behaviour of austenite during thermomechanical processing. Acta Mater. 2011, 59, 5832–5844. [Google Scholar] [CrossRef]
- Sanz, L.; Pereda, B.; López, B. Validation and Analysis of the Parameters for Reconstructing the Austenite Phase from Martensite Electron Backscatter Diffraction Data. Metall. Mater. Trans. A 2017, 48, 5258–5272. [Google Scholar] [CrossRef]
- Beladi, H.; Cizek, P.; Hodgson, P.D. Dynamic Recrystallization of Austenite in Ni-30 Pct Fe Model Alloy: Microstructure and Texture Evolution. Metall. Mater. Trans. A 2009, 40, 1175–1189. [Google Scholar] [CrossRef]
- Germain, L.; Blaineau, P.; Gey, N.; Humbert, M. Current Approaches for Reconstructing the Parent Microtexture from that Inherited by Phase Transformation. Mater. Sci. Forum 2011, 702–703, 846–849. [Google Scholar] [CrossRef]
- Germain, L.; Gey, N.; Mercier, R.; Blaineau, P.; Humbert, M. An advanced approach to reconstructing parent orientation maps in the case of approximate orientation relations: Application to steels. Acta Mater. 2012, 60, 4551–4562. [Google Scholar] [CrossRef]
- Gey, N.; Blaineau, P.; Germain, L.; Humbert, M.; Barbier, D.; Perlade, A. Restitution of the Shapes and Orientations of the Prior Austenitic Grains from Inherited Alpha’ Orientation Maps in Steels. Solid State Phenomena 2011, 172–174, 911–915. [Google Scholar] [CrossRef]
- Sanz, L.; López, B.; Pereda, B. Characterization of Austenite Microstructure from Quenched Martensite Using Conventional Metallographic Techniques and a Crystallographic Reconstruction Procedure. Metals 2018, 8, 294. [Google Scholar] [CrossRef]
- Miyamoto, G.; Iwata, N.; Takayama, N.; Furuhara, T. Mapping the parent austenite orientation reconstructed from the orientation of martensite by EBSD and its application to ausformed martensite. Acta Mater. 2010, 58, 6393–6403. [Google Scholar] [CrossRef]
- Miyamoto, G.; Takayama, N.; Furuhara, T. Accurate measurement of the orientation relationship of lath martensite and bainite by electron backscatter diffraction analysis. Scr. Mater. 2009, 60, 1113–1116. [Google Scholar] [CrossRef]
- Anh, T.O.; Pham, H. Shigekazu Morito and Taisuke Hayashi, An Advanced Fitting Method for Crystallographic and Morphological Analyses of EBSD Data Applied for Low-Carbon Steel Martensite. Mater. Trans. 2013, 54, 7. [Google Scholar] [CrossRef]
- Miyamoto, G.; Iwata, N.; Takayama, N.; Furuhara, T. Reconstruction of Parent Austenite Grain Structure Based on Crystal Orientation Map of Bainite with and without Ausforming. ISIJ Int. 2011, 51. [Google Scholar] [CrossRef]
- Zolotorevsky, N.Y.; Panpurin, S.N.; Zisman, A.A.; Petrov, S.N. Effect of ausforming and cooling condition on the orientation relationship in martensite and bainite of low carbon steels. Mater. Charact. 2015, 107, 278–282. [Google Scholar] [CrossRef]
- Schicchi, D.S.; Hunkel, M. Influence of the parent phase on the bainitic transformation under large stress of manganese-boron steel 22MnB5. Mater. Charact. 2019, 151, 457–469. [Google Scholar] [CrossRef]
- Kitahara, H.; Ueji, R.; Ueda, M.; Tsuji, N.; Minamino, Y. Crystallographic analysis of plate martensite in Fe–28.5 at.% Ni by FE-SEM/EBSD. Mater. Charact. 2005, 54, 378–386. [Google Scholar] [CrossRef]
- Nolze, G. Characterizationof the fcc/bcc orientation relationship by EBSD using pole figures and variants. Z. Metall. 2004, 95, 744–755. [Google Scholar] [CrossRef]
- Zhang, M.-X.; Kelly, P.M. Accurate orientation relationship between ferrite and austenite in low carbon martensite and granular bainite. Scr. Mater. 2002, 47, 749–755. [Google Scholar] [CrossRef]
- Cabus, C.; Réglé, H.; Bacroix, B. Orientation relationship between austenite and bainite in a multiphased steel. Mater. Charact. 2007, 58, 332–338. [Google Scholar] [CrossRef]
- Guo, Z.; Lee, C.; Morris, J.W., Jr. On coherent transformations in steel. Acta Mater. 2004, 52, 5511–5518. [Google Scholar] [CrossRef]
- Kitahara, H.; Ueji, R.; Tsuji, N.; Minamino, Y. Crystallographic features of lath martensite in low-carbon steel. Acta Mater. 2006, 54, 1279–1288. [Google Scholar] [CrossRef]
- Bernier, N.; Bracke, L.; Malet, L.; Godet, S. An alternative to the crystallographic reconstruction of austenite in steels. Mater. Charact. 2014, 89, 23–32. [Google Scholar] [CrossRef]
- Wang, S.; Zhang, M.; Wu, H.; Yang, B. Study on the dynamic recrystallization model and mechanism of nuclear grade 316LN austenitic stainless steel. Mater. Charact. 2016, 118, 92–101. [Google Scholar] [CrossRef]
- Morito, S.; Huang, X.; Furuhara, T.; Maki, T.; Hansen, N. The morphology and crystallography of lath martensite in alloy steels. Acta Mater. 2006, 54, 5323–5331. [Google Scholar] [CrossRef]
- Mandal, S.; Bhaduri, A.K.; Sarma, V.S. A Study on Microstructural Evolution and Dynamic Recrystallization During Isothermal Deformation of a Ti-Modified Austenitic Stainless Steel. Metall. Mater. Trans. A 2010, 42, 1062–1072. [Google Scholar] [CrossRef]
- Chen, R.; Zheng, Z.; Li, J.; Feng, F. Constitutive Modelling and Hot Workability Analysis by Microstructure Examination of GH4169 Alloy. Crystals 2018, 8, 282. [Google Scholar] [CrossRef]
Figure 1.
Schematic representation of a scanned orientation map and cropped data squares.

Figure 2.
(a) Position of reduced solution space in the entire space of Euler angles. (b) Range of the reduced solution space.
Figure 2.
(a) Position of reduced solution space in the entire space of Euler angles. (b) Range of the reduced solution space.

Figure 3.
(a) The inverse pole figure (IPF) map of orientations transformed from one grain. (b) 001 pole figure of orientations (black dots) and the reconstructed orientation (red square dots) in (a). (c) 001 pole figure of the orientations (colored dots) predicted by the solved orientation relationship (OR) and the reconstructed orientation (red square dots). (d) 001γ standard stereographic projections on which the directions of and are represented by iso-density contours.

Figure 4.
(a) Domains bearing the same variant of the OR in Figure 3a. (b) 001 pole figure of the potential orientations around the reconstructed orientation for Domains 1–4.
Figure 4.
(a) Domains bearing the same variant of the OR in Figure 3a. (b) 001 pole figure of the potential orientations around the reconstructed orientation for Domains 1–4.

Figure 5.
(a) IPF map of with parent grain boundaries (PAGB). (b) Frequency of the minimum of 225 cropped squares from Figure 5a.
Figure 5.
(a) IPF map of with parent grain boundaries (PAGB). (b) Frequency of the minimum of 225 cropped squares from Figure 5a.

Figure 6.
(a) Enlarged IPF map of the dashed box in 5(a). IPF maps of cropped Squares 1 (b) and 2 (c). (d) 001 pole figure of the orientations determined by two different criteria for Square 1 (d) and Square 2 (e). Distribution of of the determined orientations by two different criteria for Square 1 (f) and Square 2 (g).

Figure 7.
Reconstructed IPF map for measured data in Figure 6a by the criterion of minimization (a) and the newly proposed criterion (b). Reconstructed IPF map for measured data in Figure 5a by the criterion of minimization (c) and the newly proposed criterion (d). (Black lines: misorientation angles >; Red lines: boundaries).

Figure 8.
IPF maps with misorientation angle distribution (MAD) charts of and reconstructed deformed at strain rate of 0.01 (a,b) and 1 (c,d). (Black lines: misorientation angles >; Red lines: boundaries in (b,d)).
Figure 8.
IPF maps with misorientation angle distribution (MAD) charts of and reconstructed deformed at strain rate of 0.01 (a,b) and 1 (c,d). (Black lines: misorientation angles >; Red lines: boundaries in (b,d)).


Table 1.
Miller notations and the corresponding Euler angles for different classical orientation relationships (ORs) [15].
Table 1.
Miller notations and the corresponding Euler angles for different classical orientation relationships (ORs) [15].
| OR | Miller Notation | Euler Angles | |
|---|---|---|---|
| Plane | Direction | ||
| KS | |||
| NW | |||
| GT | |||
© 2019 by the authors. Licensee MDPI, Basel, Switzerland. This article is an open access article distributed under the terms and conditions of the Creative Commons Attribution (CC BY) license (http://creativecommons.org/licenses/by/4.0/).
Share and Cite
MDPI and ACS Style
Wang, D.; Jin, J.; Li, Q.; Wang, X. An Accurate Method for Crystallographic Reconstruction of Parent Austenite from Inherited Martensite in a Low-Alloy Steel. Crystals 2019, 9, 358. https://0-doi-org.brum.beds.ac.uk/10.3390/cryst9070358
AMA Style
Wang D, Jin J, Li Q, Wang X. An Accurate Method for Crystallographic Reconstruction of Parent Austenite from Inherited Martensite in a Low-Alloy Steel. Crystals. 2019; 9(7):358. https://0-doi-org.brum.beds.ac.uk/10.3390/cryst9070358
Chicago/Turabian StyleWang, Daokuan, Junsong Jin, Qiaomin Li, and Xinyun Wang. 2019. "An Accurate Method for Crystallographic Reconstruction of Parent Austenite from Inherited Martensite in a Low-Alloy Steel" Crystals 9, no. 7: 358. https://0-doi-org.brum.beds.ac.uk/10.3390/cryst9070358
Note that from the first issue of 2016, this journal uses article numbers instead of page numbers. See further details here.