Article

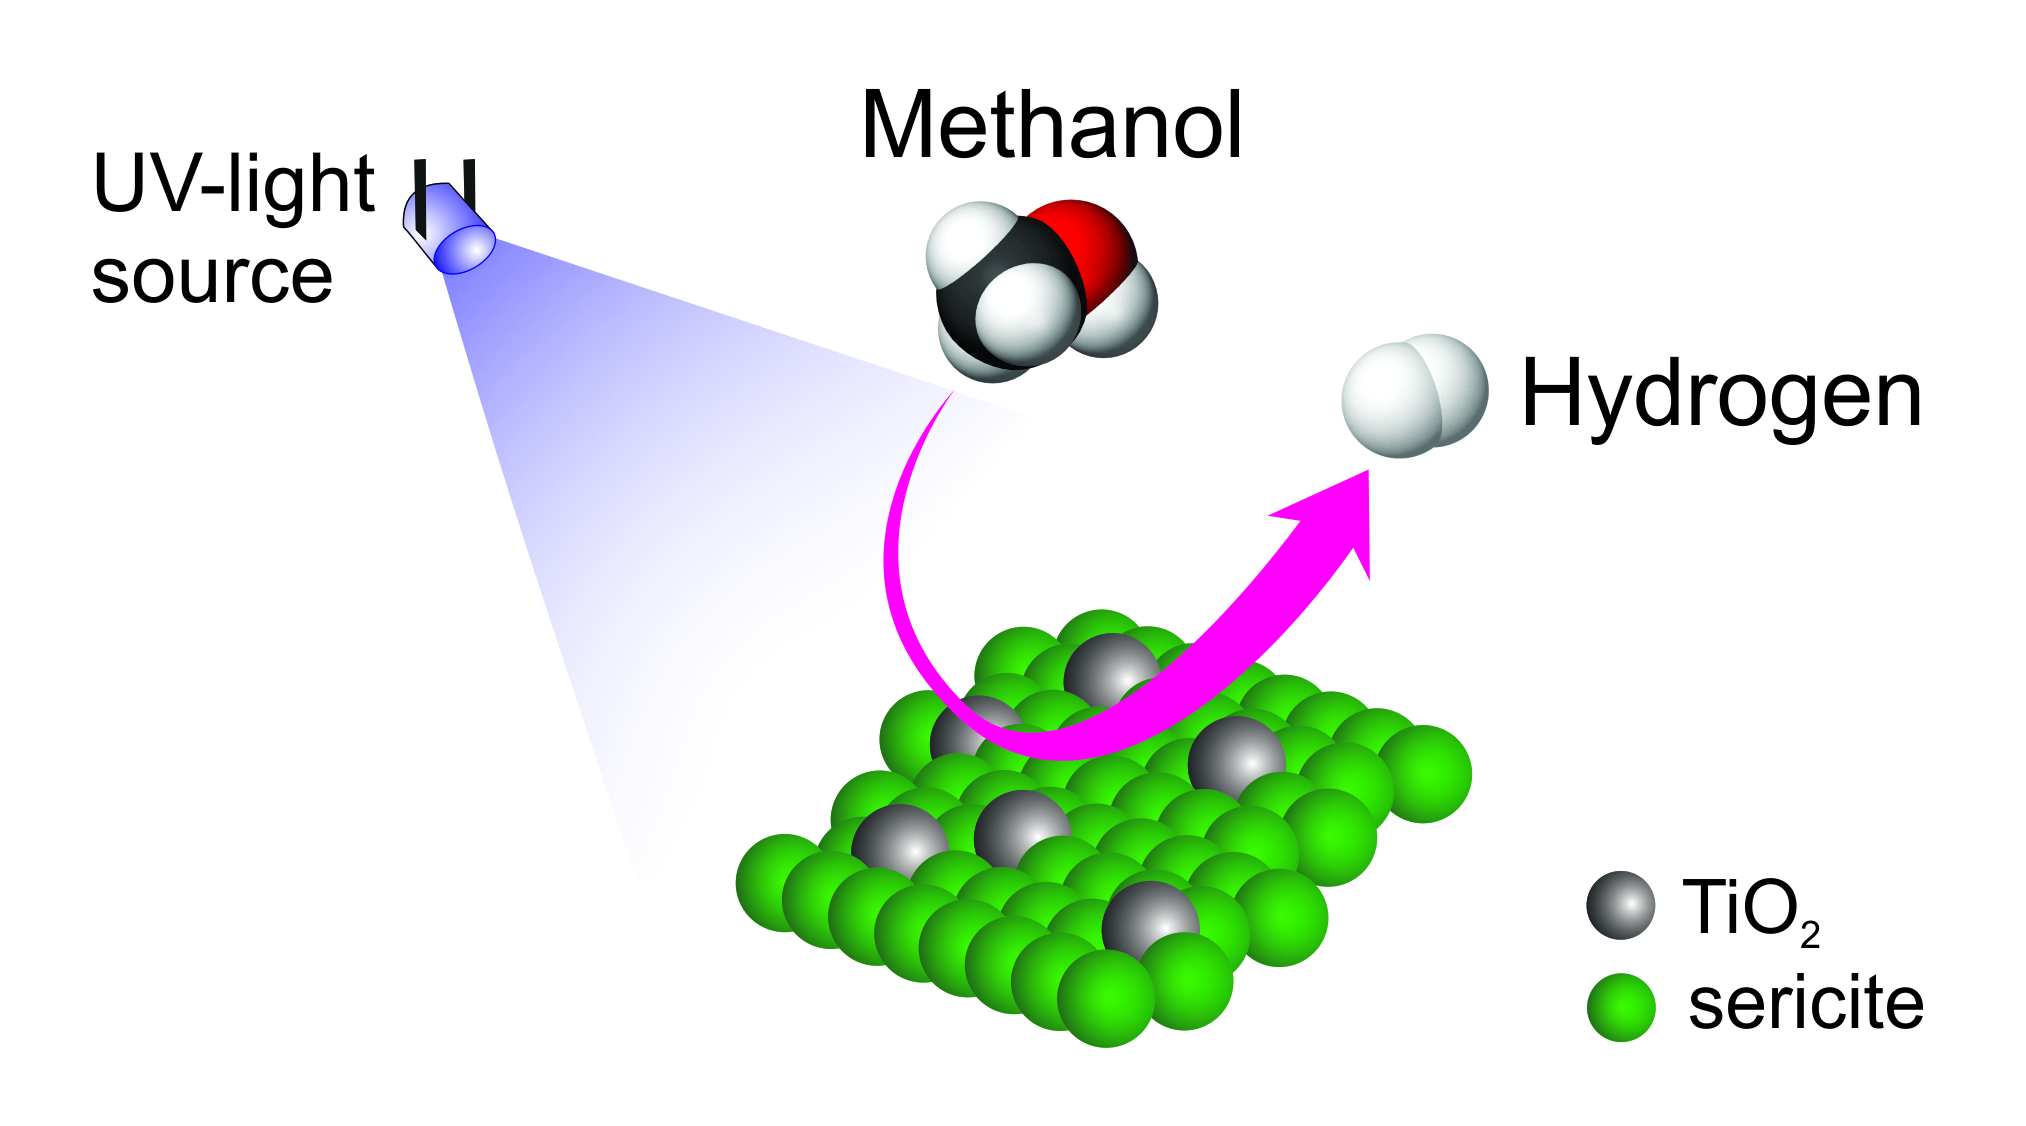
Preparation and Characterization of Nanocrystalline TiO2 on Microsericite for High-Efficiency Photo-Energy Conversion of Methanol to Hydrogen

1
Department of Chemical and Materials Engineering, National Kaohsiung University of Science and Technology, Kaohsiung 80778, Taiwan
2
Photo-SMART (Photo-Sensitive Material Advanced Research and Technology) Center, National Kaohsiung University of Science and Technology, Kaohsiung 80778, Taiwan
3
Institute of Research and Development, Duy Tan University, Da Nang 550000, Vietnam
4
Research Center for Applied Sciences, Lac Hong University, Bien Hoa 810000, Vietnam
*
Authors to whom correspondence should be addressed.
Submission received: 26 May 2019 / Revised: 16 July 2019 / Accepted: 22 July 2019 / Published: 24 July 2019

Abstract

:
TiO2 and TiO2/sericite photocatalysts were successfully synthesized via the sol-gel method by adding a varying amount of acetic acid. The effect of acetic acid on TiO2 and TiO2/sericite photocatalysts was studied. The crystallite size, surface morphology, chemical composition, specific surface area, surficial functional groups, and light absorbance of the prepared photocatalysts were revealed by the analysis of X-ray diffraction (XRD), scanning electron microscope-energy dispersive spectrometry (SEM-EDS), nitrogen adsorption-desorption isotherms by using BET theory (Brunauer–Emmett–Teller), Fourier-transform infrared spectroscopy (FTIR), and UV-Vis absorption spectrometry. Photo-energy conversion of methanol to hydrogen was also conducted over the prepared photocatalysts. The best hydrogen production was achieved by using the TiO2/sericite photocatalyst to give a hydrogen production rate of 1424 μmol/g·h in 6 h of UV-light irradiation.

Graphical Abstract

1. Introduction

Current energy consumption primarily relies on fossil fuels. Most fossil fuels are limited and generate significant pollution during use, leading to a severe impact on the environment and natural ecology [1,2]. In order to mitigate the impact, hydrogen is regarded as a potential alternative energy because it is environmentally friendly and recyclable. There are many methods to produce hydrogen, including steam reforming [3,4], thermochemical process [5], and water electrolysis [6]. However, they all require a large amount of energy, which is usually generated from fossil fuels [7], which contradicts the original intent to use hydrogen as a carrier of clean energy. Therefore, to make hydrogen genuinely clean, the driving force to produce hydrogen should be a renewable energy source, such as photo-energy.
Photocatalytic hydrogen production is a promising method which can convert photo-energy into hydrogen energy [8]. For example, photocatalytic water splitting [9] and photocatalytic reforming [10] of organic substances can both produce hydrogen via photocatalysts under light irradiation. In general, the photocatalysis reaction includes three steps [11]. Firstly, the light is absorbed, resulting in generating excited charge carriers, such as electrons and holes. Secondly, the charge carrier is separated and migrates to the surface of photocatalysts. Finally, surface redox reactions occur, which are caused by electrons and holes, respectively. For a photocatalytic water splitting reaction, electrons can reduce protons (H+) into hydrogen and holes can oxidize water into oxygen. Generally, these excited electrons and holes can also react with some molecules which exist on the photocatalyst surface, to form reactive oxygen species (ROS) [12]. These ROS can further react with some organic substances or pollutants; therefore, photocatalysis is also comprehensively used in the field of pollutant degradation.
Among the various kinds of photocatalysts, titanium dioxide (TiO2) has received considerable interest due to its abundance, nontoxicity, and stability. However, the bandgap of TiO2 is between 3.0 eV to 3.2 eV, meaning it cannot absorb visible light. There have been many works of literature attempting to improve the visible light absorption of photocatalysts, which can improve the first step of photocatalysis by absorbing a greater wavelength range of solar light [13,14,15]. In contrast, some studies focus on the improvement of the second step of photocatalysis to enhance the efficiency of the separation and migration of the charge carriers [16]. Diminishing the particle size of TiO2 can provide an effective method to enhance the photocatalytic effect [17]. First, as the particle size decreases, the specific surface area increases, leading to an improvement of the catalytic conversion of the surface chemical reaction. Second, the smaller the particle size is, the shorter the pathway of excited electrons and holes to the surface, resulting in a decrease in the recombination probability. Third, particle size also affects the crystalline structure and crystallinity. Fewer defects are associated with high crystalline quality within a small particle [18]. These defects play the role of a trapper and a recombination center to catch the electrons and holes, leading to lower photocatalytic efficiency. Additionally, when the particle size of a crystal is tuned down to the nanoscale, it will induce the quantum effect. Nanocrystalline TiO2 of less than 10 nm has excellent photocatalytic activity. This range of particle size will also influence the mobility of the charge carrier, resulting in better photocatalytic efficiency than that of micron-size TiO2 [19].
Although nanophotocatalysts have higher performance due to the above reasons, they have some disadvantages. The disadvantages include the issue of particle aggregation, higher cost of production, and potential to penetrate the skin and enter the bloodstream. With a micron-size material employed as a substrate [20,21], it is expected that nano-size photocatalysts can not only exhibit high performance, but also prevent the aggregation of nanoparticles and the danger of direct penetration through the skin. On the other hand, Li et al. found that TiO2 grain size is reduced by introducing the kaolinite, which could be ascribed to the carrier effect. In other words, natural minerals contribute to retardation of size growth, particle dispersion, and surface modification [20]. Therefore, the methods of preparing nano-TiO2 loaded on micron-size materials are worth developing.
Nano-size TiO2 can be produced by several synthesis technologies, such as the sol-gel method [22], the hydrothermal method [23], and the self-assembly method [24]. Since thermal treatment is a simple process to improve the crystallization of TiO2, the crystallinity of nano-sized TiO2 can be obtained by conducting a calcination process of amorphous TiO2 to improve the photocatalytic performance [25]. Therefore, this study attempts to synthesize nano-sized TiO2 on micro-size sericite via a simple sol-gel method, followed by a calcination process. Consequently, the prepared TiO2/sericite photocatalyst will be used to conduct photocatalytic hydrogen production from methanol to verify its photocatalytic performance.

2. Materials and Methods

The precursor of TiO2 was titanium isopropoxide (C12H28O4Ti, ≥97%), which was purchased from Sigma Aldrich Inc (Taiwan). Isopropanol (C3H7OH, ≥99.5%, tested grade) was bought from JT Baker Chemicals (USA) to be employed as a solvent in the sol-gel process. Purified natural sericite (ST-3000) was provided by Feng Yang Production Co., Ltd (Taitung, Taiwan), and served as the micron-size support of nano-sized TiO2. It is not easy to identify the molecular weight of natural minerals, so we will use muscovite (KAl2(AlSi3O10)(OH)2) in the place of natural sericite due to their similar structure. Acetic acid (CH3COOH, ≥99.8%, tested grade) was obtained from Honeywell Research Chemicals (Seelze, Germany) to adjust the properties of the sol-gel during hydrolysis [26]. Degussa P25 (70% anatase and 30% rutile, purity ≥99.5%), which was purchased from Degussa Company (Germany), was used as a reference photocatalyst. Methanol (CH3OH, ≥99.99%) was purchased from Fisher Chemical (Fair Lawn, NJ, USA) for the evaluation of photo-energy conversion of methanol to hydrogen.
The synthesis of the photocatalyst was carried out by employing the sol-gel method. The procedures were as follows. First, 3.2 g ST-3000 sericite was dispersed in 200 mL C3H7OH under continuous magnetic stirring in a 250 mL beaker, followed by addition of a specific amount (0, 1, 5, 10 mL) of CH3COOH. Then, 5 mL C12H28O4Ti was added dropwise into the suspensions. The mixtures were continuously stirred at 700 rpm, and the relative humidity was controlled at 70–80%. After 12 h stirring, the gel product was formed due to the hydrolysis reaction of C12H28O4Ti. Subsequently, the gel was dried at 80 °C in an oven for 2 h. The resulting samples were ground and further calcined by using a furnace with the heating ramp rate of 5 °C/min, and the calcination temperature was set at 500 °C for 2 h. Finally, the powder forms of photocatalysts were obtained. The molecular ratio of TiO2/sericite was controlled at 2 for each TiO2/sericite photocatalyst. In order to verify the effect of the ST-3000 sericite addition, the TiO2 photocatalysts without loading onto the ST-3000 were also prepared for comparison. All samples are designated and shown in Table 1.
The crystal phases of TiO2 photocatalysts were analyzed by Bruker D8 advance X-ray diffractometer (XRD, Bruker, Billerica, MA, USA). The detected angular range (2θ) was 10°~70° at a scan rate of 4°/min. The wavelength of CuKα radiation is 0.15406 nm. The working voltage and current were set at 40 kV and 40 mA, respectively. The crystallite sizes were calculated by Scherrer’s equation. The Fourier transform infrared spectroscopy (FTIR, Thermo Fisher Scientific, Waltham, MA, USA) of the prepared photocatalysts was characterized by NICOLET 380 to observe an infrared spectrum of absorption of the solid samples. In order to observe the morphologies and chemical compositions of TiO2 photocatalysts, scanning electron microscopy equipped with energy dispersive spectroscopes (SEM-EDS, Thermo Fisher Scientific, Waltham, MA, USA) was performed on a Phenom ProX. In addition, BET analysis (ASAP 2020 PLUS, (Micromeritics, Norcross (Atlanta), GA, USA) was conducted for measuring the specific surface area of the photocatalysts. UV-Vis diffuse reflectance spectra (UV-Vis, Chiyoda, Tokyo, Japan) of prepared samples were measured by a HITACHI U-2910 equipped with an integrating sphere assembly.
The performances of photo-energy conversion of methanol to hydrogen using various TiO2 photocatalysts as well as commercial P25 were evaluated. The photoreactor was made of quartz, allowing UV light to pass through. Deionized pure water (DI-water) was used in this study. In the beginning, 90 mL DI water and 10 mL CH3OH were mixed in the photoreactor, followed by the addition of 0.1 g photocatalyst powder. The mixtures were homogeneous suspensions under continuous magnetic stirring. Before conducting photocatalysis, ultrapure helium gas (He, >99.995%) was introduced to purge the suspensions to ensure that no air remained inside the photoreactor. During the reaction, the suspensions were irradiated by a 200 W UV lamp with light flux of 3.2 mW/cm2 at a wavelength of 365 nm to provide the photo-energy. The produced hydrogen was sampled every hour by using a 30 μL syringe. The sampling gas was injected into a GC analyzer (China GC-2000, Taipei, Taiwan) equipped with a thermal conductive detector (TCD). The 3.5 m long molecular sieve 5A packed column was selected, and the carrier gas for GC was ultrapure helium.

3. Results

The crystalline phases of the prepared TiO2 and TiO2/sericite series photocatalysts are presented in Figure 1a,b, respectively. For TiO2 series photocatalysts, the specific diffraction peaks in Figure 1a indicated the crystalline nature of anatase TiO2, referring to the database of the PDF card 78-2486. On the other hand, the bare sericite revealed its diffraction spectra with characteristic peaks, as shown in Figure 1b. With the TiO2 loaded onto the sericite, diffraction peaks of anatase TiO2 and sericite appeared together. Apparently, the signals of sericite were decreased for the cases of TiO2/sericite photocatalysts due to the TiO2 coverage on sericite, and the TiO2 still exhibited the crystalline phase of anatase, even though they were loaded on sericite. It is interesting to note that the anatase (~25.4°) intensity of TS, 1A-TS, 5A-TS, and 10A-TS were similar.
In addition, the crystallite sizes were calculated by Scherrer’s equation:
D = K λ CuK α β c o s θ
where D is the crystallite size (nm), λCuKα is the wavelength (nm) of the X-ray radiation, K is taken as 0.89 usually, and β is the full width at half maximum height (FWHM). From the XRD peaks of anatase (~25.4°) and Scherrer’s equation, the TiO2 crystallite sizes of all photocatalysts could be attained, as shown in Figure 2. For the case of TiO2 photocatalysts, the crystallite sizes decreased as the amount of acetic acid increased. The stereoscopic obstacle effect caused by acetic acid led to a slower hydrolysis reaction rate of C12H28O4Ti to Ti(OH)3. The lower concentration of Ti(OH)3 tended towards the condensation reaction of nuclei formation, instead of size-growing. Consequently, numerous small crystals of TiO2 were formed in the gel solution, leading to the fact that as the addition of acetic acid increased, smaller crystalline TiO2 was formed. On the contrary, the TiO2 crystalline sizes of the TiO2/sericite photocatalysts were generally smaller than that of the TiO2 series photocatalysts, as shown in Figure 2. This may result from the fact that the condensation reaction that occurred on sericite was much slower than that of the systems without sericite. On the other hand, while applying the sericite, the crystallite sizes of TiO2 remained similar regardless of the additional amount of acetic acid. It is possible that Ti(OH)3 was preferentially adsorbed onto sericite due to the attracting force between the hydroxyl groups of the sericite and Ti(OH)3, instead of condensing directly in solution. Accordingly, condensation occurred slowly on the sericite, meaning the crystallite sizes remained almost constant.
Figure 3 shows the FTIR spectra of the prepared photocatalysts. Si–O [20] and Si–O–Si [27,28] bonding was attributed to the peaks at 1043 cm−1 and 987 cm−1, respectively, derived from sericite. The surface of sericite has hydroxyl groups, as proved by the absorption peak at 943 cm−1 of Al–OH [20], indicating that the sericite has high hydrophilicity. An absorption peak at 3668 cm−1 was observed for the pure sericite and TiO2/sericite photocatalysts, representing OH groups on the surface. The OH signal of pure sericite was more intense than that of TiO2/sericite photocatalysts, indicating that OH groups were partially replaced by TiO2, whose hydrophilicity was lower than sericite. The peaks around 987 cm−1 and 943 cm−1 were decreased due to the coverage of TiO2 on sericite. As for the cases without sericite, there were no other apparent peaks; however, anatase was observed, indicating that pure TiO2 samples were obtained for the cases of TiO2 photocatalysts. The peaks at 2901 cm−1 and 2982 cm−1 both possibly belong to the C–H bonding [29,30] of isopropanol. These two peaks only appeared for the TiO2/sericite photocatalysts, indicating that isopropanol has a strong interaction with sericite, possibly via OH groups. In contrast, without the sericite as a support, no signals of organic residues were apparent.
The SEM images of TiO2 photocatalysts (T, 1A-T, 5A-T, and 10A-T) and TiO2/sericite photocatalysts (TS, 1A-TS, 5A-TS, and 10A-TS) are shown in Figure 4. In the images of sample T, the TiO2 particles are sphere-like, despite some aggregation to each other. The size of each sphere-like particle was around 1–2 μm. After adding acetic acid, larger TiO2 particles with bulk and solid blocks were formed, as shown in Figure 4 1A-T, 5A-T, and 10A-T. Despite the different amounts of acetic acid addition, a similar structure of solid blocks was produced. For the cases of TiO2/sericite photocatalysts, sheet sericites and a discontinuous TiO2 film coated on the sericite could be observed (Figure 4_TS). A discontinuous TiO2 film was formed due to non-uniform coating and cracking after calcination. When the acetic acid was added, the surface of sericite became smooth. Meanwhile, there was some TiO2 fragmentation observed, as shown in Figure 4 1A-TS. As the additional amount of acetic acid increased, the surface of catalysts became smoother and less TiO2 fragmentation occurred on the surface. This indicated that the TiO2 coated onto the sericite more uniformly, as shown in Figure 4_5A-TS and 10A-TS. Briefly speaking, it proved that the addition of acetic acid could cause the uniform coating of TiO2 onto sericite, resulting in a smooth surface.
The results of the EDS and BET analysis are shown in Table 2. The samples T, 1A-T, 5A-T, and 10A-T, had similar chemical compositions, with similar signals of Ti (%) and O (%) resulting from the existing of TiO2. The samples with sericite exhibited signals of O, Al, Si, and K since sericite is made of muscovite, illite, or paragonite, which are hydrated phyllosilicate minerals of aluminum and potassium. Comparing TS and 1A-TS, the Ti (%) of 1A-TS was much higher than that of TS. This revealed that the addition of acetic acid could enhance the coating of TiO2 onto sericite. It is interesting to note that the Ti (%) of 5A-TS and 10-TS was a little lower than that of 1A-TS. While we attempted to normalize the background signal by dividing the Si (%) of sericite, it was observed that the Ti/Si ratio of 10A-TS was higher than that of 1A-TS and TS. This indicated that the addition of acetic acid could assist TiO2 deposition onto the sericite, especially for the case of 10A-TS. Following the above characterizations, we analyzed the samples of T, TS, 10A-T, and 10A-TS further, in order to compare and highlight the effect of acetic acid addition and the role of the sericite as a support. As for the BET analysis, the specific surface area of 10A-T was 58.2 m2/g, which was more significant than that of T (31.9 m2/g), meaning that the block-like particles of 10A-T exhibited a porous structure within, instead of a compact, solid one. The specific surface areas of 10A-TS and TS were similar, 38.8 m2/g and 39.9 m2/g, respectively. This showed that the addition of acetic acid did not affect the surface area of TiO2 when coated on sericite. The condensation of Ti(OH)3 mainly occurred on the surface, thus the effect of the addition of acetic acid on the specific surface area was ignored.
We attempt to explain the mechanism clearly in Figure 5 and Figure 6 for the cases of TiO2 formation without and with sericite, respectively. For the TiO2 photocatalysts, the grains or crystals agglomerate together to form large particles, and the particles further aggregate as shown in the SEM images. On the other hand, when acetic acid was added into the system, the hydrolysis rate decreased due to the steric effect of molecular acetic acid [31], leading to the formation of smaller TiO2 grains. Small TiO2 grains agglomerate easily to form bulk and solid TiO2, the mechanism of which is shown in Figure 5. Li et al. also demonstrated that acetic acid may decrease the surface free energy and form Ti–acetate coordination with a Ti precursor, facilitating the crystallization and transformation [32]. For the TiO2/sericite photocatalysts, the hydrolysis reaction occurred mainly on the surface of sericite, as shown in Figure 6. Therefore, the crystallite sizes did not change apparently because the sericite effect dominated. The acetic acid was involved in the preparing process, and helped the Ti(OH)x distribute on the sericite and generate a smooth and continuous surface. The mechanisms described herein are proposed on the basis of the crystallite sizes obtained via XRD, the morphologies and Ti(%) observed by SEM-EDS, and the OH group information provided by the FTIR spectra.
Figure 7 shows the UV-Vis absorption spectra and the Tauc plot of the TiO2 photocatalysts (T and 10A-T) and TiO2/sericite photocatalysts (TS and 10A-TS). The observing wavelength range of the spectra was between 200 nm to 800 nm. Barium sulfate (BaSO4) was employed as the baseline. There was no apparent absorbance of light above 350 nm for pure sericite. The UV-Vis absorption spectra of the prepared photocatalysts had a blue shift relative to the addition of acetic acid and sericite. The approximate band gaps of photocatalysts were calculated from UV-Vis spectra by using the following equation:
E b g = 1240 λ
where Ebg (eV) is the band gap of the photocatalyst and λ is the wavelength (nm) of light. Accordingly, the band gaps of the T, 10A-T, TS, and 10A-TS photocatalysts were 2.96 eV, 2.97 eV, 3.03 eV, and 3.10 eV, respectively. Nano-sized crystal cause the band gap to become more extensive due to the quantum effect [33] or scattering effect [34]. As the crystalline sizes decreased, the band gaps became larger. Notably, when the TiO2 was loaded onto sericite, a blue shift occurred due to the quantum effect. The crystalline sizes of TiO2/sericite ranged from 10.6–11.2 nm.
The efficiency of the photo-energy conversion of methanol to hydrogen by using different catalysts were evaluated. Blank experiments were also conducted, including a photoreaction without adding photocatalysts and a dark reaction using the 10-TS photocatalyst. Both blank experiments did not generate hydrogen in 6 h. The average hydrogen production rates with 10 vol.% CH3OH in 6 h photocatalysis reaction are shown in Figure 8. For the TiO2 photocatalysts (T and 10A-T), similar performance of hydrogen production was achieved, although the specific surface area of 10A-T was much higher than that of T. This might result from the fact that the crystalline size of 10A-T was smaller than that of T, leading to higher possibility of the boundary recombination of electrons and holes within the TiO2 blocks [35,36]. The benefit of a larger specific surface area of 10A-T was compensated by its higher chance of boundary recombination. On the contrary, 10A-TS had the highest performance because the excellent dispersion of TiO2 on sericite made the distance of charge carrier transfer shorter. However, the performance of sample TS was lower than that of T, 10A-T, and 10A-TS, resulting from two facts: (1) the TiO2 amount of TS was lower than that of T or 10A-T because TS included sericite which is not photoreactive; (2) TiO2 was nonuniformly dispersed on the surface of sericite, leading to increased possibility of recombination of electrons and holes. In this study, the photo-energy reaction from methanol to hydrogen of commercial P25 was also conducted. All of the as-prepared photocatalysts had much higher performance than P25, indicating their potential as photocatalysts to replace P25. The best hydrogen production rate was achieved by the TiO2/sericite photocatalyst with a hydrogen production rate of 1424 μmol/g·h in 6 h of UV-light irradiation.
Although the conditions for conducting experiments (including power intensity and wavelength of UV-light, ethanol concentration, and the design of photocatalysts) are different, it is worth comparing the hydrogen production in terms of the hydrogen rate in the literature. Table 3 summarizes the recent photo-activity performance in the presence of CH3OH. So far, although many efforts have been to promote the photo-energy conversion of methanol to hydrogen, this approach still faces several challenges. Therefore, we focus on the following goals: (1) to develop more efficient photocatalysts (a visible optical absorption band, a lower recombination rate of e/h+ pairs); (2) to elucidate the relationship between the structural architecture and the photocatalytic performance [37].

4. Conclusions

In this study, TiO2-loaded sericite photocatalysts were successfully synthesized. The addition of acetic acid can decrease the reaction rate of hydrolysis, leading to different mechanisms for the cases with and without sericite as support. Without sericite, the crystalline size of TiO2 decreases with increasing addition of acetic acid due to stereoscopic hindrance. Although the 10A-T photocatalyst had a higher specific surface area, its numerous boundary crystals increased the possibility of charge carrier recombination, leading to a similar photocatalytic performance to sample T. On the other hand, the condensation reaction mainly occurred on the surface of sericite, resulting in similar crystalline sizes between the TS and 10A-TS photocatalysts. The presence of acetic acid assisted the uniform deposition of TiO2 on the sericite. Although the crystalline size of the 10A-TS photocatalyst was smaller than that of the 10A-T photocatalyst, the well-dispersed TiO2 thin film caused the easy transfer of charge carriers to the surface to undergo chemical reaction.
To sum up, the as-prepared TiO2 and TiO2/sericite photocatalysts showed better performances than the commercial P25 catalyst. The best hydrogen production in the photo-energy conversion of methanol to hydrogen was achieved by using the 10A-TS photocatalyst (TiO2 coated on sericite), yielding a hydrogen production rate of 1424 μmol/g·h in 6 h of UV irradiation. It is vital to note that although many efforts have been made for promoting the photo-energy conversion of methanol to hydrogen, their efficiencies were still too low for practical application. Therefore, efforts shall be made for the continuous improvement of the photocatalytic activity.

Author Contributions

C.-W.H., and M.-C.W. conceived and designed the research concept; C.-W.H., and M.-C.W. prepared the setup and performed the experiments; C.-W.H., M.-C.W., and V.-H.N. analyzed the data; C.-W.H., M.-C.W., and V.-H.N. prepared the manuscript; C.-W.H. and B.-S.N. funding acquisition, C.-W.H., V.-H.N., and B.-S.N. finished the manuscript.

Funding

This research was funded by the Ministry of Science and Technology (MOST), Taiwan, grant number MOST 106-2218-E-992-304-MY2 and Lac Hong University, grant number LHU-RF-TE-18-01-09.

Acknowledgments

The authors gratefully acknowledge the Ministry of Science and Technology (MOST), Taiwan and Lac Hong University, Vietnam for the financial and equipment supports. Authors also thanks to I-Chun Lin from Feng Yang Production Co., Ltd, Taiwan, for the technical support and providing the purified natural sericite (ST-3000).

Conflicts of Interest

The authors declare no conflict of interest.

References

  1. García-Borboroglu, P.; Boersma, P.D.; Ruoppolo, V.; Reyes, L.; Rebstock, G.A.; Griot, K.; Heredia, S.R.; Adornes, A.C.; Da Silva, R.P. Chronic oil pollution harms Magellanic penguins in the Southwest Atlantic. Mar. Pollut. Bull. 2006, 52, 193–198. [Google Scholar] [CrossRef] [PubMed]
  2. Bosco, M.; Varrica, D.; Dongarra, G. Case study: Inorganic pollutants associated with particulate matter from an area near a petrochemical plant. Environ. Res. 2005, 99, 18–30. [Google Scholar] [CrossRef] [PubMed]
  3. Haryanto, A.; Fernando, S.; Murali, N.; Adhikari, S. Current status of hydrogen production techniques by steam reforming of ethanol: A review. Energy Fuels 2005, 19, 2098–2106. [Google Scholar] [CrossRef]
  4. Palo, D.R.; Dagle, R.A.; Holladay, J.D. Methanol steam reforming for hydrogen production. Chem. Rev. 2007, 107, 3992–4021. [Google Scholar] [CrossRef] [PubMed]
  5. Funk, J.E. Thermochemical hydrogen production: Past and present. Int. J. Hydrogen. Energ 2001, 26, 185–190. [Google Scholar] [CrossRef]
  6. Zeng, K.; Zhang, D. Recent progress in alkaline water electrolysis for hydrogen production and applications. Prog. Energy Combust. Sci. 2010, 36, 307–326. [Google Scholar] [CrossRef]
  7. Holladay, J.D.; Hu, J.; King, D.L.; Wang, Y. An overview of hydrogen production technologies. Catal. Today 2009, 139, 244–260. [Google Scholar] [CrossRef]
  8. Liao, C.-H.; Huang, C.-W.; Wu, J. Hydrogen production from semiconductor-based photocatalysis via water splitting. Catalysts 2012, 2, 490–516. [Google Scholar] [CrossRef]
  9. Huang, C.-W.; Liao, C.-H.; Wu, J.C. Photocatalytic separate evolution of hydrogen and oxygen over highly ordered nanorods and bulk TiO2 thin films. J. Clean Energy Technol. 2013, 1, 1–5. [Google Scholar] [CrossRef]
  10. Al-Mazroai, L.S.; Bowker, M.; Davies, P.; Dickinson, A.; Greaves, J.; James, D.; Millard, L. The photocatalytic reforming of methanol. Catal. Today 2007, 122, 46–50. [Google Scholar] [CrossRef]
  11. Ni, M.; Leung, M.K.; Leung, D.Y.; Sumathy, K. A review and recent developments in photocatalytic water-splitting using TiO2 for hydrogen production. Renew. Sustain. Energ Rev. 2007, 11, 401–425. [Google Scholar] [CrossRef]
  12. Nosaka, Y.; Nosaka, A.Y. Generation and detection of reactive oxygen species in photocatalysis. Chem. Rev. 2017, 117, 11302–11336. [Google Scholar] [CrossRef] [PubMed]
  13. Park, J.H.; Kim, S.; Bard, A.J. Novel Carbon-Doped TiO2 Nanotube Arrays with High Aspect Ratios for Efficient Solar Water Splitting. Nano Lett. 2006, 6, 24–28. [Google Scholar] [CrossRef] [PubMed]
  14. Wu, M.-C.; Hsiao, K.-C.; Chang, Y.-H.; Chan, S.-H. Photocatalytic hydrogen evolution of palladium nanoparticles decorated black TiO2 calcined in argon atmosphere. Appl. Surf. Sci. 2018, 430, 407–414. [Google Scholar] [CrossRef]
  15. Lei, P.; Wang, F.; Zhang, S.; Ding, Y.; Zhao, J.; Yang, M. Conjugation-grafted-TiO2 nanohybrid for high photocatalytic efficiency under visible light. ACS Appl. Mater. Interface 2014, 6, 2370–2376. [Google Scholar] [CrossRef] [PubMed]
  16. Gao, C.; Wei, T.; Zhang, Y.; Song, X.; Huan, Y.; Liu, H.; Zhao, M.; Yu, J.; Chen, X. A Photoresponsive Rutile TiO2 Heterojunction with Enhanced Electron–Hole Separation for High-Performance Hydrogen Evolution. Adv. Mater. 2019, 31, 1806596. [Google Scholar] [CrossRef] [PubMed]
  17. Su, C.; Hong, B.-Y.; Tseng, C.-M. Sol–gel preparation and photocatalysis of titanium dioxide. Catal. Today 2004, 96, 119–126. [Google Scholar] [CrossRef]
  18. Kudo, A.; Miseki, Y. Heterogeneous photocatalyst materials for water splitting. Chem. Soc. Rev. 2009, 38, 253–278. [Google Scholar] [CrossRef]
  19. Anpo, M.; Takeuchi, M. The design and development of highly reactive titanium oxide photocatalysts operating under visible light irradiation. J. Catal. 2003, 216, 505–516. [Google Scholar] [CrossRef]
  20. Li, C.; Sun, Z.; Dong, X.; Zheng, S.; Dionysiou, D.D. Acetic acid functionalized TiO2/kaolinite composite photocatalysts with enhanced photocatalytic performance through regulating interfacial charge transfer. J. Catal. 2018, 367, 126–138. [Google Scholar] [CrossRef]
  21. Gao, B.; Yap, P.S.; Lim, T.M.; Lim, T.-T. Adsorption-photocatalytic degradation of Acid Red 88 by supported TiO2: Effect of activated carbon support and aqueous anions. Chem. Eng. J. 2011, 171, 1098–1107. [Google Scholar] [CrossRef]
  22. Lu, J.; Li, L.; Wang, Z.; Wen, B.; Cao, J. Synthesis of visible-light-active TiO2-based photo-catalysts by a modified sol–gel method. Mater. Lett. 2013, 94, 147–149. [Google Scholar] [CrossRef]
  23. Alkaim, A.F.; Kandiel, T.A.; Hussein, F.H.; Dillert, R.; Bahnemann, D.W. Solvent-free hydrothermal synthesis of anatase TiO2 nanoparticles with enhanced photocatalytic hydrogen production activity. Appl. Catal. A 2013, 466, 32–37. [Google Scholar] [CrossRef]
  24. Liu, S.-H.; Syu, H.-R. One-step fabrication of N-doped mesoporous TiO2 nanoparticles by self-assembly for photocatalytic water splitting under visible light. Appl. Energ 2012, 100, 148–154. [Google Scholar] [CrossRef]
  25. Liu, N.; Albu, S.P.; Lee, K.; So, S.; Schmuki, P. Water annealing and other low temperature treatments of anodic TiO2 nanotubes: A comparison of properties and efficiencies in dye sensitized solar cells and for water splitting. Electrochim. Acta 2012, 82, 98–102. [Google Scholar] [CrossRef]
  26. Llano, B.; Hidalgo, M.; Rios, L.; Navio, J. Effect of the type of acid used in the synthesis of titania–silica mixed oxides on their photocatalytic properties. Appl. Catal. B 2014, 150, 389–395. [Google Scholar] [CrossRef]
  27. Abukhadra, M.R.; Mostafa, M. Effective decontamination of phosphate and ammonium utilizing novel muscovite/phillipsite composite; equilibrium investigation and realistic application. Sci. Total Environ. 2019, 667, 101–111. [Google Scholar] [CrossRef] [PubMed]
  28. Selim, A.Q.; Mohamed, E.A.; Seliem, M.K.; Zayed, A.M. Synthesis of sole cancrinite phase from raw muscovite: Characterization and optimization. J. Alloy Compd. 2018, 762, 653–667. [Google Scholar] [CrossRef]
  29. Shahravan, A.; Desai, T.; Matsoukas, T. Controlled manipulation of wetting characteristics of nanoparticles with dry-based plasma polymerization method. Appl. Phys. Lett. 2012, 101, 251603. [Google Scholar] [CrossRef]
  30. Socrates, G. Infrared and Raman Characteristic Group Frequencies: Tables and Charts; John Wiley & Sons: Baffins Lane, UK, 2004. [Google Scholar]
  31. Fujimoto, M.; Ohno, T.; Suzuki, H.; Koyama, H.; Tanaka, J. Nanostructure of TiO2 Nano-Coated SiO2 Particles. J. Am. Ceram. Soc. 2005, 88, 3264–3266. [Google Scholar] [CrossRef]
  32. Li, Y.; Wang, S.; Lei, D.; He, Y.-B.; Li, B.; Kang, F. Acetic acid-induced preparation of anatase TiO2 mesocrystals at low temperature for enhanced Li-ion storage. J. Mater. Chem. A 2017, 5, 12236–12242. [Google Scholar] [CrossRef]
  33. Ren, Y.; Zhao, L.; Zou, Y.; Song, L.; Dong, N.; Wang, J. Effects of Different TiO2 Particle Sizes on the Microstructure and Optical Limiting Properties of TiO2/Reduced Graphene Oxide Nanocomposites. Nanomaterial 2019, 9, 730. [Google Scholar] [CrossRef] [PubMed]
  34. Sahu, D.R.; Hong, L.; Wang, S.-C.; Huang, J.-L. Synthesis, analysis and characterization of ordered mesoporous TiO2/SBA-15 matrix: Effect of calcination temperature. Microporous Mesoporous Mater. 2009, 117, 640–649. [Google Scholar] [CrossRef]
  35. Shiyanovskaya, I.; Hepel, M. Decrease of Recombination Losses in Bicomponent WO3/TiO2 Films Photosensitized with Cresyl Violet and Thionine. J. Electrochem. Soc. 1998, 145, 3981–3985. [Google Scholar] [CrossRef]
  36. Nakade, S.; Saito, Y.; Kubo, W.; Kitamura, T.; Wada, Y.; Yanagida, S. Influence of TiO2 nanoparticle size on electron diffusion and recombination in dye-sensitized TiO2 solar cells. J. Phys. Chem. B 2003, 107, 8607–8611. [Google Scholar] [CrossRef]
  37. Li, D.; Yu, J.C.-C.; Nguyen, V.-H.; Wu, J.C.S.; Wang, X. A dual-function photocatalytic system for simultaneous separating hydrogen from water splitting and photocatalytic degradation of phenol in a twin-reactor. Appl. Catal. B 2018, 239, 268–279. [Google Scholar] [CrossRef]
  38. Fontelles-Carceller, O.; Muñoz-Batista, M.J.; Conesa, J.C.; Kubacka, A.; Fernández-García, M. H2 photo-production from methanol, ethanol and 2-propanol: Pt-(Nb)TiO2 performance under UV and visible light. Mol. Catal. 2018, 446, 88–97. [Google Scholar] [CrossRef]
  39. Yang, X.; Salzmann, C.; Shi, H.; Wang, H.; Green, M.L.H.; Xiao, T. The Role of Photoinduced Defects in TiO2 and Its Effects on Hydrogen Evolution from Aqueous Methanol solution. J. Phys. Chem. A 2008, 112, 10784–10789. [Google Scholar] [CrossRef] [PubMed]
  40. Chiarello, G.L.; Aguirre, M.H.; Selli, E. Hydrogen production by photocatalytic steam reforming of methanol on noble metal-modified TiO2. J. Catal. 2010, 273, 182–190. [Google Scholar] [CrossRef]
  41. Majrik, K.; Turcsányi, Á.; Pászti, Z.; Szabó, T.; Domján, A.; Mihály, J.; Tompos, A.; Dékány, I.; Tálas, E. Graphite Oxide-TiO2 Nanocomposite Type Photocatalyst for Methanol Photocatalytic Reforming Reaction. Top. Catal. 2018, 61, 1323–1334. [Google Scholar] [CrossRef]
  42. Mills, A.; Bingham, M.; O’Rourke, C.; Bowker, M. Modelled kinetics of the rate of hydrogen evolution as a function of metal catalyst loading in the photocatalysed reforming of methanol by Pt (or Pd)/TiO2. J. Photochem. Photobiol. A 2019, 373, 122–130. [Google Scholar] [CrossRef]
  43. Jones, W.; Martin, D.J.; Caravaca, A.; Beale, A.M.; Bowker, M.; Maschmeyer, T.; Hartley, G.; Masters, A. A comparison of photocatalytic reforming reactions of methanol and triethanolamine with Pd supported on titania and graphitic carbon nitride. Appl. Catal. B 2019, 240, 373–379. [Google Scholar] [CrossRef]
  44. Han, B.; Hu, Y.H. Highly Efficient Temperature-Induced Visible Light Photocatalytic Hydrogen Production from Water. J. Phys. Chem. C 2015, 119, 18927–18934. [Google Scholar] [CrossRef]
  45. Gu, Q.; Long, J.; Zhuang, H.; Zhang, C.; Zhou, Y.; Wang, X. Ternary Pt/SnOx/TiO2 photocatalysts for hydrogen production: Consequence of Pt sites for synergy of dual co-catalysts. Phys. Chem. Chem. Phys. 2014, 16, 12521–12534. [Google Scholar] [CrossRef] [PubMed]
  46. Tálas, E.; Pászti, Z.; Korecz, L.; Domján, A.; Németh, P.; Szíjjártó, G.P.; Mihály, J.; Tompos, A. PtOx-SnOx-TiO2 catalyst system for methanol photocatalytic reforming: Influence of cocatalysts on the hydrogen production. Catal. Today 2018, 306, 71–80. [Google Scholar] [CrossRef]
  47. Zhang, Y.-H.; Li, Y.-L.; Jiu, B.-B.; Gong, F.-L.; Chen, J.-L.; Fang, S.-M.; Zhang, H.-L. Highly enhanced photocatalytic H2 evolution of Cu2O microcube by coupling with TiO2 nanoparticles. Nanotechnology 2019, 30, 145401. [Google Scholar] [CrossRef] [PubMed]
  48. Xu, F.; Zhang, L.; Cheng, B.; Yu, J. Direct Z-Scheme TiO2/NiS Core–Shell Hybrid Nanofibers with Enhanced Photocatalytic H2-Production Activity. ACS Sustain. Chem. Eng. 2018, 6, 12291–12298. [Google Scholar] [CrossRef]
  49. Xin, Y.; Lu, Y.; Han, C.; Ge, L.; Qiu, P.; Li, Y.; Fang, S. Novel NiS cocatalyst decorating ultrathin 2D TiO2 nanosheets with enhanced photocatalytic hydrogen evolution activity. Mater. Res. Bull. 2017, 87, 123–129. [Google Scholar] [CrossRef]
Figure 1. X-ray diffraction spectra of (a) TiO2 series photocatalysts and (b) TiO2/sericite series photocatalysts with different amounts of acetic acid added during preparation.
Crystals 09 00380 g001
Figure 2. Crystallite sizes of the prepared TiO2 and TiO2/sericite photocatalysts.
Crystals 09 00380 g002
Figure 3. FTIR spectra of the prepared TiO2 and TiO2/sericite photocatalysts.
Crystals 09 00380 g003
Figure 4. SEM images of the TiO2 photocatalysts and TiO2/sericite photocatalysts.
Crystals 09 00380 g004
Figure 5. The proposed schematic concept of TiO2 formation with and without acetic acid.
Crystals 09 00380 g005
Figure 6. The proposed schematic concept of TiO2/sericite formation with and without acetic acid.
Crystals 09 00380 g006
Figure 7. UV–Vis absorption spectra of the TiO2 photocatalysts (T and 10A-T) and TiO2/sericite photocatalysts (TS and 10A-TS).
Crystals 09 00380 g007
Figure 8. The average hydrogen production rate with 10 vol.% CH3OH in the 6 h photocatalysis reaction.
Crystals 09 00380 g008
Table 1. The denotations of various TiO2 photocatalysts.
Addition of Acetic Acid (mL)TiO2 Photocatalysts
w/o SupportLoaded on ST-3000
0TTS
11A-T1A-TS
55A-T5A-TS
1010A-T10A-TS
Table 2. EDS and BET analysis of various photocatalysts.
Atomic (%)Ti (%)O (%)Al (%)Si (%)K (%)Ti/SiSBET (m2/g)
T31.3268.68<L.D.<L.D.<L.D.-31.9
1A-T3268<L.D.<L.D.<L.D.--
5A-T30.4269.58<L.D.<L.D.<L.D.--
10A-T29.6970.31<L.D.<L.D.<L.D.-58.2
TS5.7170.429.1613.231.480.4339.9
1A-TS13.259.6810.5213.732.860.96-
5A-TS9.5363.3611.0413.542.540.7-
10A-TS9.8668.199.1410.82.010.9138.8
Sericite<L.D.71.6511.1515.541.6607.8
P25N.A.52
N.A.: not analyzed; <L.D.: lower than the limit of detection.
Table 3. The photo-activity performance of various photocatalysts.
No.PhotocatalystsLight SourceReactant MediumH2 Evolution/ μmol/g·hRef. (Year)
1TiO2 (P25)UV lamp (200 W), λ = 320–500 nmCH3OH/H2O (l, 1:9)202This study
2TiO2 (10A-T)1150
3TiO2/sericite (10A-TS)1424
4Pt/TiO2Hg-Xe lamp (500 W) integrated dichroic filters (LOT Quantum Design, λ = 280–400 nm)CH3OH/H2O (l, 3:7)1602[38] (2018)
5Pt/TiO2Hg-Xe lamp (500 W) integrated dichroic filters (LOT Quantum Design, λ = 420–680 nm)386
6TiO2Xe lamp (PLS-SXE300, 300 W)CH3OH/H2O (l, 1:9)85[39] (2008)
7TiO2Iron halogenide Hg arc lamp (Jelosil, 250 W): λ = 350–450 nm; 37 mW/cm2CH3OH/H2O/N2 (g, 2:3:95, 40 mL/min)360[40] (2010)
8FP-TiO2720
91%Ag/TiO21170
101%Au/TiO213,300
11TiO2Osram HQL deluxe lamps (125 W)CH3OH (aq, 6v.%)120[41] (2018)
120.5%Pt/TiO29290
131%Ag/TiO2300
141%GO/TiO2391
152%GO/TiO2502
1610%GO/TiO2439
170.001%Pt/TiO2UV LED (2.8 W): λ = 365 nm; 20 mW/cm2CH3OH/H2O (l, 1:1)270[42] (2019)
180.01%Pt/TiO21970
190.05%Pt/TiO23330
200.2%Pt/TiO26475
211%Pt/TiO25725
2210%Pt/TiO21145
230.5%Pd/TiO2Xe arc lamp (LOT-Oriel, 150W)CH3OH (aq, 0.125 M)580[43] (2019)
241%Pt/TiO2Xe lamp (Newport, an AM 1.5G filter, 150 W): 100 mW/cm2CH3OH/H2O (l, 3:7)200[44] (2015)
25Pt3.0/TiO2High-pressure Hg lamp (125 W): λ = 365 nm, 1.5 W/cm2CH3OH/H2O (l, 1:33)1560[45] (2014)
26PtOx-SnOx/TiO2Osram HQL deluxe lamps (125 W)CH3OH (aq, 6v.%)2000[46] (2018)
27Cu2O/TiO2Xe lamp (300 W)CH3OH/H2O (l, 1:4)500.4[47] (2019)
28NiS/TiO2 nanofibersXe arc lamp (XD350, 350 W)CH3OH/H2O (l, 1:4)655[48] (2018)
295%NiS/TiO2 nanosheetsUV Xe lamp (300 W): λ > 300 nmCH3OH/H2O (l, 1:3)313.6[49] (2016)

