Continuous Generation of Millimeter-Sized Glycine Crystals in Non-Seeded Millifluidic Slug Flow

1
Department of Chemical and Life Science Engineering, Virginia Commonwealth University, Richmond, VA 23219, USA
2
Boehringer Ingelheim Pharmaceuticals, Inc. 900 Ridgebury Road, Ridgefield, CT 06877, USA
*
Author to whom correspondence should be addressed.
Crystals 2019, 9(8), 412; https://doi.org/10.3390/cryst9080412
Submission received: 4 July 2019
/
Revised: 29 July 2019
/
Accepted: 2 August 2019
/
Published: 9 August 2019
(This article belongs to the Special Issue Anti-Solvent Crystallization)
Abstract
:Millimeter-sized α-glycine crystals were generated from continuous non-seeded cooling crystallization in slug flow. The crystallization process is composed of three steps in sequence: slug formation, crash-cooling nucleation, and growth. Stable uniform slugs of three different aspect ratios (slug length/tubing inner diameter) were formed, by adjusting the flow rates of both the solution and air streams. Besides supersaturation, the slug aspect ratio can also affect primary nucleation outcome. Stable slug flow can accommodate a relative supersaturation (C/C*) of up to 1.5 without secondary nucleation. Large glycine crystals can grow to millimeter size within 10 min, inside millimeter-sized slugs without reducing the slug quality.
1. Introduction
Continuous crystallization has received increasing research interests in both academia and industry for controlling crystal qualities, including polymorphic form, size, and morphology [1,2,3,4,5,6,7,8,9,10,11,12,13]. Many types of continuous crystallizers have been designed to meet different product quality requirements, with representative examples: (a) multi-stage mixed-suspension mixed-product removal (MSMPR) crystallizers [14,15,16,17]; (b) fluidized bed crystallizers [18,19,20,21,22]; (c) oscillatory baffled crystallizers [23,24,25]; (d) unbaffled crystallizers with an interior tubing mixing enhancer [8] (such as static mixers [11,26,27]); and (e) segmented/slug-flow crystallizers [3,26,27,28,29]. Stirred-tank based crystallizers (a) allow relatively longer residence time and spacious crystallization area. Thus, those crystallizers can function well under lower supersaturation and end up with higher purity. Besides, compared to tube/pipe-based crystallizers (b–e), transferring the concept from a batch/semi-batch experiment into a stirred-tank crystallizer is easier in general. Correspondingly, tubular crystallizers have a short residence time, a narrow crystal size distribution (CSD), low shear force, and rapid heat transfer [10].
Batch crystallizers provide many important pieces of information for guiding the design of continuous crystallizers [30,31,32,33,34]. For example, the solubility curve and crystallization properties (e.g., kinetics) for the specific solute/solvent system are usually derived in batch experiments. Non-optimum cooling (e.g., crash cooling) was shown in batch crystallizers to generate tiny crystals from secondary nucleation, especially for non-seeded situations [35,36]. In addition, batch experience indicates that organic crystals probably cannot hold their morphology under the shear in the crystallizer, if their longer dimension reaches 20% or larger of the shorter dimension of the crystallizer [6,33,34,37].
A slug flow crystallizer was recently developed for organic crystals that shares some advantages of both batch and plug flow. Each liquid segment/slug is a functional crystallizer itself, with mixing from recirculation (intrinsic properties of slug flow) without requiring mixing blades [3,4,38,39,40]. Various types of crystallization have been demonstrated in slug flow [10], including reactive precipitation [27,41,42,43,44,45,46], cooling crystallization [3,39,40,47,48], and anti-solvent crystallization [49,50]. Several compounds (e.g., L asparagine monohydrate [3], acetylsalicylic acid [39], and succinic acid [27]) were crystallized into uniform crystals of up to a few hundred microns in millifluidic slugs. Experimental results also showed that the aspect ratio of the slugs may affect the distribution of the crystals inside. For example, the small volume allows a uniform spatial distribution of temperature and concentration within each slug, and a slug with an aspect ratio close to one also favors a uniform distribution of the crystals inside [3]. Multiple in-line nucleation methods were also successfully implemented for continuous flow (before slug formation) to enhance the uniformity of nuclei, such as temperature cycling [6,51], ultrasonication [40,51], and micromixers [11,26,27].
As with any other continuous crystallizer, it is interesting to explore more aspects of the slug flow crystallizer, including how slug flow properties affect the crystallization process and crystals inside and how to tune the flow to enhance crystallization in the desired direction. More specifically: (1) Is it possible to directly nucleate inside slugs (instead of upstream of slugs, as commonly done) using a simple method. Compared to batch crystallizers, how does slug flow handle crash cooling, which tends to induce secondary nucleation and sometimes agglomeration as well, especially for non-seeded situations? Is it possible to use slug flow to suppress secondary nucleation; and if so, what is the proper condition? Does the process scale up easily? (2) Is it possible to generate millimeter-sized crystals inside slugs and keep their size? How will those large crystals behave in millimeter-sized slugs, especially for non-square-shaped crystals, e.g., how will they behave with respect to slug geometry? (3) How can one form stable slugs with various aspect ratios (all close to one) that are different by a small amount, and will the slug aspect ratio affect the nucleation and growth processes inside slugs?
This article provides additional aspects and understanding of the slug flow crystallizer, including using glycine cooling crystallization from water solvent as an example for the questions above. Even though it is impossible to cover all aspects of all compounds, the examples may provide useful information, such as generating large crystals from suppressing secondary nucleation.
2. Materials and Experimental Methods
2.1. Chemicals
The solute was glycine (purity ≥ 99.5%, from J.T Baker, NJ, U.S.), and the solvent was DI water. The solubility of the α form glycine in water follows an empirical mathematical expression (Csat = 0.563 Tsat exp + 9.836, where Csat is the equilibrium saturation concentration, g/100 g of water, and Tsat exp is the experimental saturation temperature, °C) [52], within the temperature range of 0–60 °C. Specifically, for the experimental conditions, the glycine solubility at 40 °C (starting concentration, Table 1) was 32.4 g/100 g water, and the final temperature at room temperature (20 °C) was 21.1 g/100 g water and at 4 °C (ice bags) was 12.1 g/100 g water. As the solubility of glycine in water highly depends on temperature, crystallization via cooling the solution from above its solubility temperature was performed. The fast growth rate (high supersaturation) and large size of glycine crystals make any secondary nucleation obvious [53,54,55].
2.2. Slug Flow Procedure
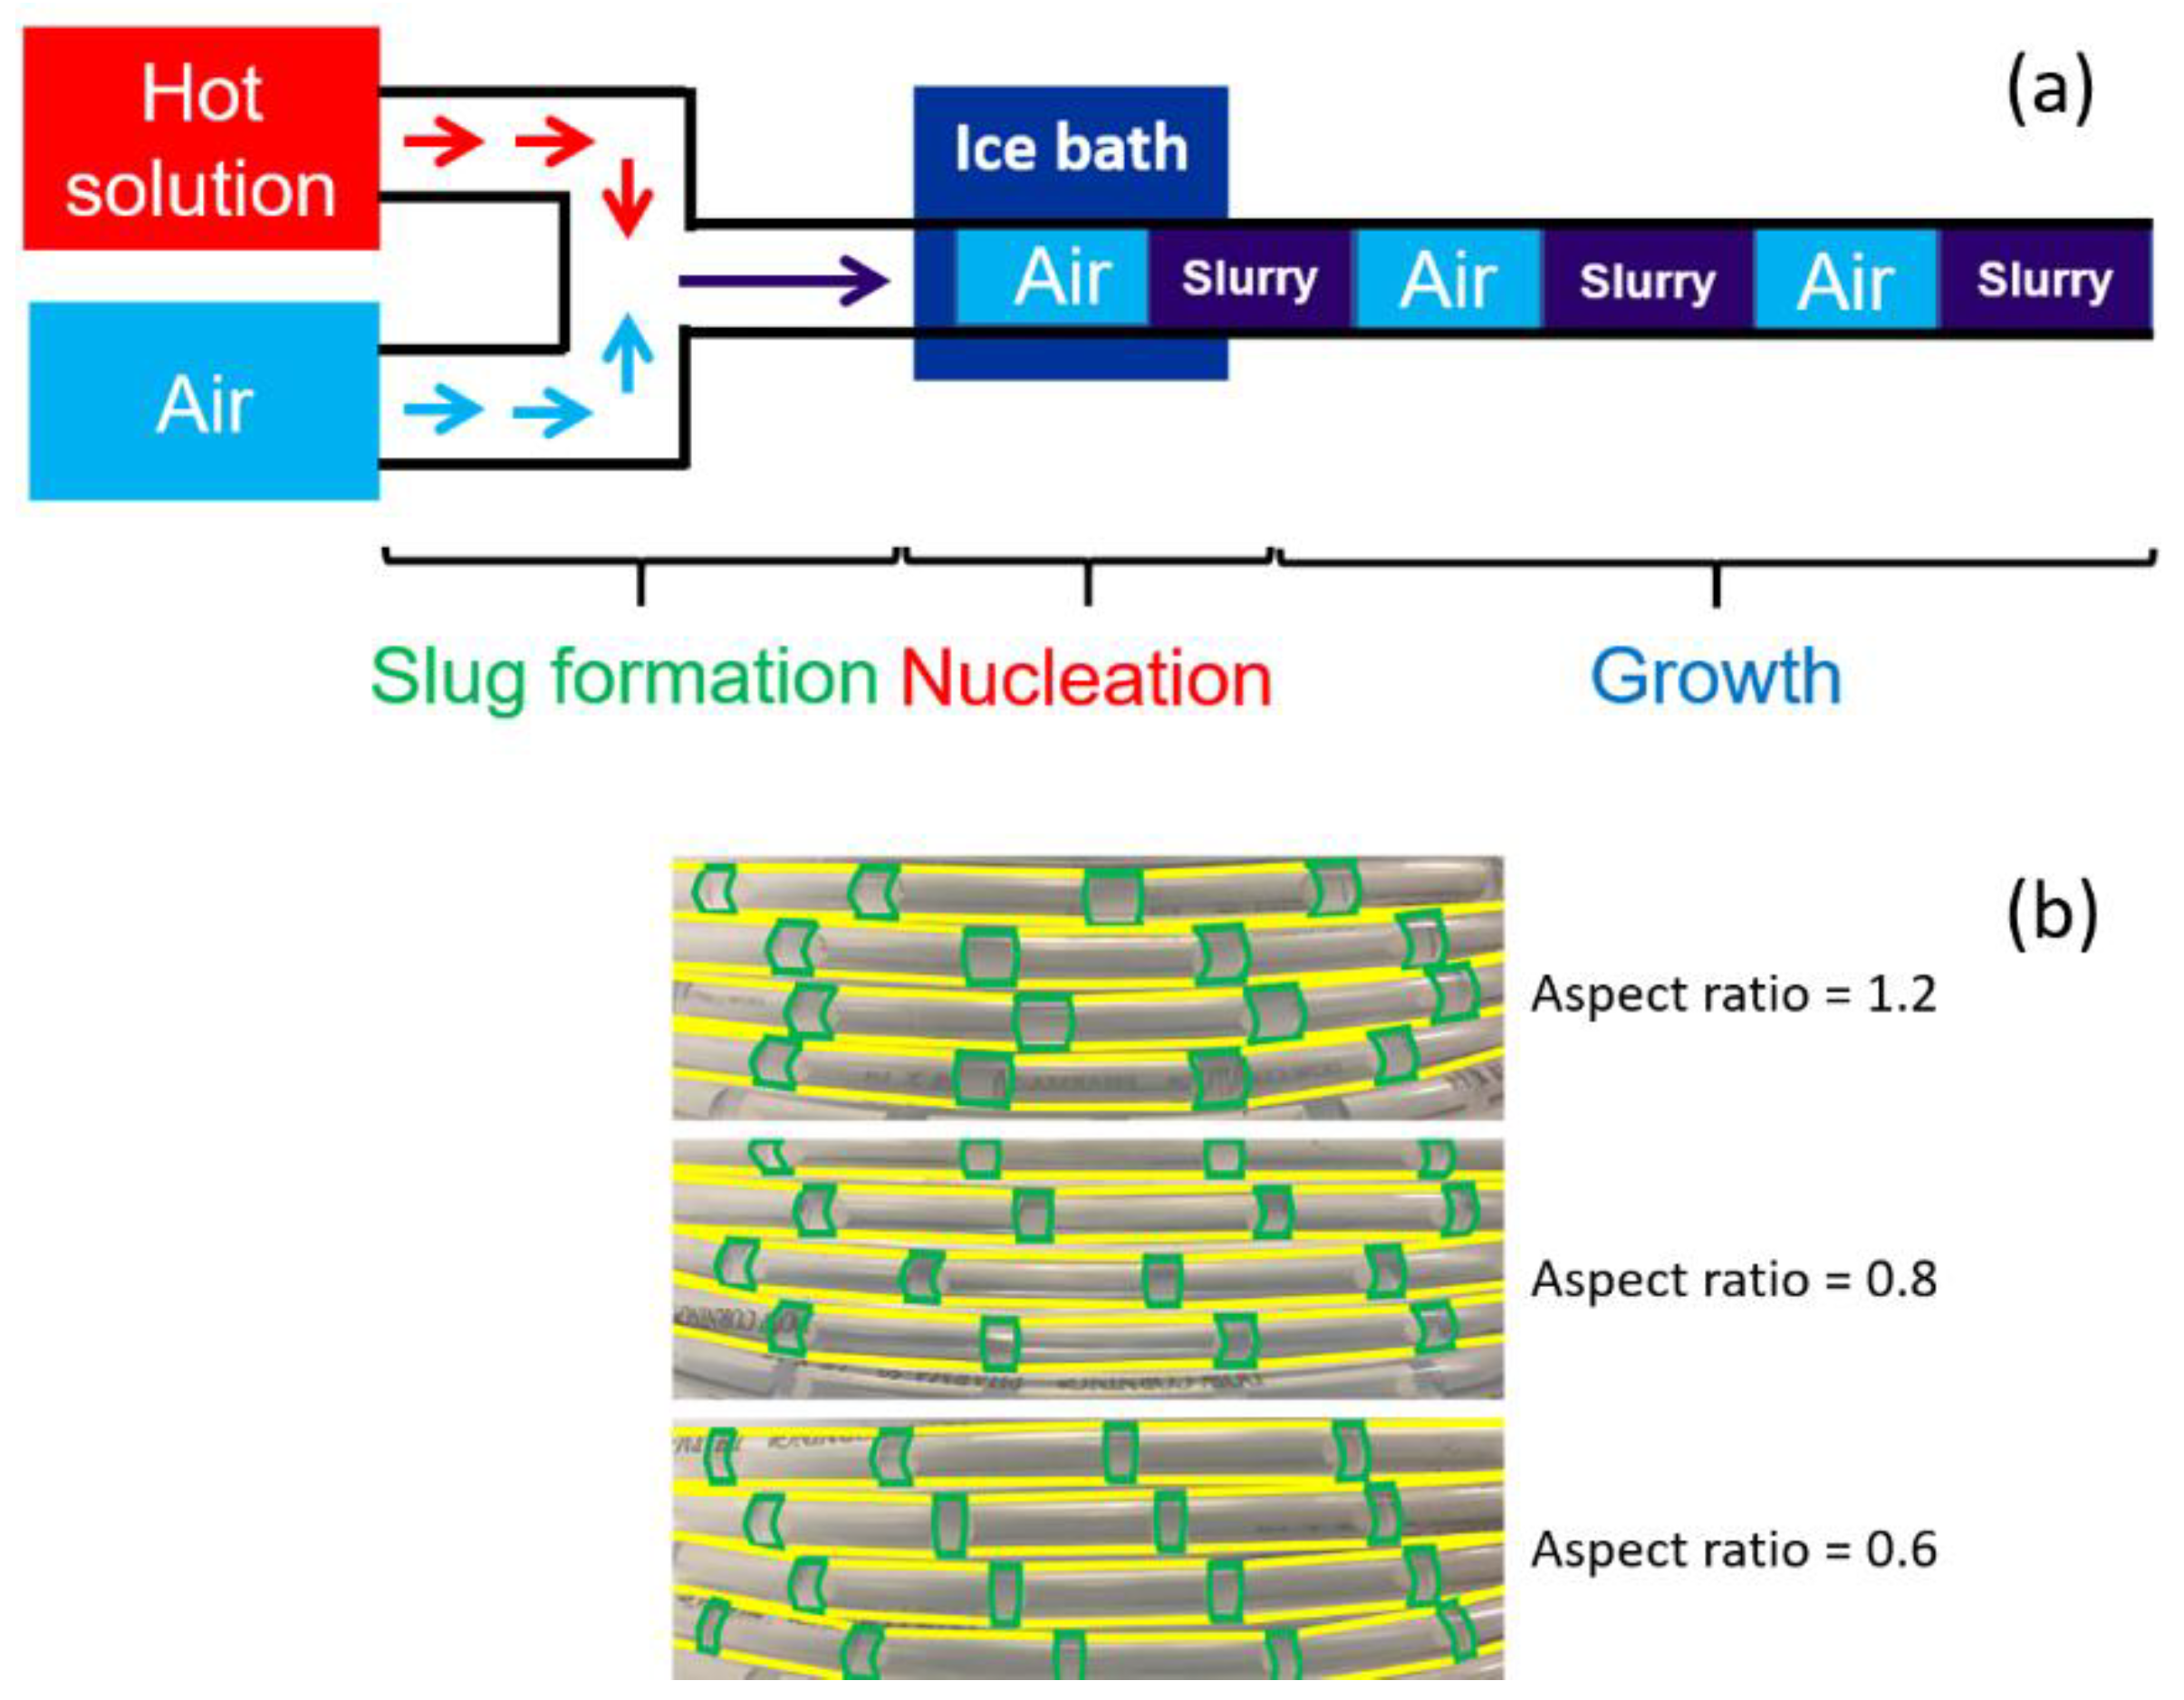
Figure 1a is a schematic diagram of a continuous slug-flow crystallization process simplified from the previous work [3,6,40] while keeping the key aspects. The crystallizer was mainly a 15 m-long silicone tubing (Masterflex, Platinum-Cured Silicon, L/S 16, ID = 3.125 mm, IL, U.S.). Stable slugs were formed by combining hot glycine solution and room-temperature air streams at proper flow rates, through a simple T-mixer (Polypropylene, ID = 3.125 mm, IL, U.S.). A 10 mL glycine solution (0.32 g glycine/g DI H2O) at 40 °C was pumped through a heat-preserved syringe (New Era syringe pump, Model # NE-4000, NY, U.S.). Filtered air was pumped through a peristaltic pump (Masterflex L/S Precision Pump, Easy load II pump head, IL, U.S.). Then, the slugs went through the tubular crystallizer for nucleation and growth, through a temperature profile shown in Figure S1. The nucleation zone was made by immersing the first 0.4 m part of the tubing into an ice bags (4 °C). The growth zone was composed of the rest of the tubing at room temperature. The linear flow rate of liquid slugs was 26 mm/s, and the residence time in the nucleation zone and the growth zone was about 15 s and 9.5 min, respectively. The slurry slugs were collected in a 96-well plate for 2 slugs per well. To minimize solvent evaporation inside collection wells, two droplets of mineral oil were added to each well immediately after collecting the slurry product. The scaling up test was carried out with 50 mL of the same solution and operation as the 5 mL experiment. Among all slug-flow experiments, the setup and residence time were the same, while the slug aspect ratios and solution volume and concentrations could be different, as specified in Table 1.
2.3. Batch Crystallization
For comparison with slug flow crystallization results, a batch experiment with the same initial and final crystallization conditions (e.g., concentration, temperature) was conducted. Five milliliters 0.32 g glycine/g DI water at an initial temperature of 40 °C in an Eppendorf tube was left in air for naturally cooling down to 35 °C (same as the temperature of slugs right before the ice bags). The hot solution was then quickly poured into an Eppendorf tube wrapped by a bag containing an ice-water mixture (4 °C) for 15 s, during which time the solution was shaken gently by hand, without mixing blades to reduce possible secondary nucleation. The solution was then poured back to the original tube and was shaken for 10 min before taking off-line microscope images of the slurry. The scaling up test was carried out with 50 mL of the same solution and operation as the 5 mL experiment.
2.4. Crystal Characterization
For viewing slurry slugs and crystals inside, in-line imaging was carried out with a USB digital microscope (Amscope, model UTP200 × 020MP, CA, U.S.). For off-line imaging towards crystal size statistics (e.g., Table 2), an Amscope ME520TA microscope equipped with an MU-900 camera was used. All slugs were recorded and analyzed, for both in-line and off-line imaging. Crystals from batches were sampled (batches were blending well, and two droplets were dispensed on a glass slide immediately) and imaged off-line. ImageJ was used to analyze CSD based on off-line microscope images. An X-ray diffractometer (XRD, from Rigaku, MiniFlex ΙΙ, NC, U.S.) was used for confirming the polymorphic form of product crystals.
To quantify the yield for each condition, product crystals from all slugs under the same condition were combined. The slurry was centrifuged, then the supernatant was discarded, and solids were dried in air. The dried crystals were weighed for qualification. The crystallization process yield was calculated based on the definition, the mass ratio between product crystals and the total solute. All yield calculation was based on crystals 10 min after crash cooling.
3. Results and Discussion
3.1. Inducing Primary Nucleation in Slug Flow from Crash Cooling
In the past, nucleation for slug flow crystallization was usually achieved upstream of slug formation in regular tubular flow (e.g., direct cooling or sonication through the tubing wall [3,40]). In this study, nucleation occurred directly in slugs, which had a much smaller individual volume than a continuous stream. As primary nucleation is a stochastic process that depends on both the supersaturation and solution volume [56], such a process is intrinsically more difficult. Figure 2 shows that primary nucleation can be induced, with a few crystals formed in each slug, at a relative supersaturation (C/C*, where C is the solution concentration and C* is the equilibrium saturation concentration) of about three. Here, primary nucleation is indicated by the existence of crystals in the slugs collected at the crystallizer exit. In comparison, a slug-flow experiment of all the same conditions, except for not using the ice bags, did not produce any crystals, indicating the usefulness of the crash cooling. Based on the temperature profile in Figure S1, the slug can have a fast cooling rate of 1.2 °C/s, likely due to the large surface-to-volume ratio. In addition, due to the residence time limit in the nucleation zone (15 s), it is also possible that some slugs nucleated not in the nucleation zone with the highest supersaturation, but instead in the growth zone, with still positive supersaturation. For example, eye observation of crystals in slugs during experiments indicated that primary nucleation occurred within 1.2 min of residence time.
Even with crash cooling, not all slugs could induce primary nucleation at the same condition, which also confirms that the nucleation process is stochastic. Further, the primary nucleation possibility (a portion of slugs that nucleated) was affected by the slug aspect ratio (and volume), even though the ratio did not change very much. For example, there was a sudden drop of such a portion (from 80% to 30%) when the slug aspect ratio changed from 0.8 to 0.6, as shown in Table 2. The portion did not change much (from 90% to 80%) when the aspect ratio changed from 1.2 to 0.8. As a side comparison, the batch crystallizers of 1, 5, and 50 mL in volume (for the same crash cooling time of 15 s) all had primary nucleation. These trends all indicate a possible “nucleation critical volume” for the residence time [55], which is beyond the scope of this paper.
3.2. Suppressing Secondary Nucleation for Crystal Growth in Slug Flow
Suppressing secondary nucleation means that most of the solute crystallizing will grow onto the existing small number of nuclei and generate large crystals (based on mass balance). The crystal size for Condition 3 was larger than that of Condition 1 and 2 (Figure 5), which directly came from the different numbers of crystals (with secondary nucleation shut off for all three conditions). For a similar condition in batch cooling crystallization (with initial temperature of 35 °C and final temperature of 20 °C) [59], crystals with an average size of circa 600 μm were generated after 20 min to 6 h [60,61], and here, only 10 min were needed. Although glycine was the compound used here, a similar strategy (e.g., suppressing secondary nucleation) may potentially help generate large crystals of other compounds [62,63,64,65,66,67,68,69,70,71,72].
Secondary nucleation is usually indicated by the co-existence of small crystals with large crystals, or a broad or bimodal size distribution, based on the assumption that all crystals nucleated at the same time growth at similar rates. One key factor is supersaturation, as with any crystallization process. For slug flow, the increase of supersaturation (through starting solution concentration) can increase the number of crystals and change the size distribution of product crystals from unimodal to bimodal, as shown in Table 2 and Figure 3, Figure 4, Figure 5, Figure 6 and Figure 7. Both trends were as expected based on existing knowledge [73,74]. Under the same supersaturation (Condition 1), which did not induce secondary nucleation in slug flow, a broad and bimodal particle size distribution resulted from a batch crystallizer (Figure 7, Table 2). The mean crystal size was also smaller in the batch, due to a larger number of crystals. As shown in Table 2, the average growth rate of crystals in the slug flow at a relative supersaturation can reach 60–80 μm/min for 10 min, compared to the 3–8 μm/min batches from the same starting condition. The average growth rate was estimated based on the main crystal length, as crystals reached 600 μm or larger (nuclei size was negligible compared to final crystal size). In addition, in slug flow with slightly higher maximum supersaturation (usually a faster growth rate) such as Condition 4, the average crystal growth rate was actually 6+-times smaller than other conditions. The result indicates that secondary nucleation suppression played an important role in growing larger crystals and increasing the average crystal growth rate. As a side comparison, the typical reported growth rate of α-glycine ranged from 3–80 μm/min in the relative average supersaturation range from 1.15–1.65 in the batch. Under relative supersaturation of 1.45 (similar to the conditions in Table 1), the reported growth rate in the batch (volume was not specified) was circa 42 μm/min [75].
Note that the CSD difference may also be complicated by the volume difference, which is another factor. When the CSD of slug flow crystallization was quantified, data of all slugs from the same experiment were combined. The total solution volume for slug flow experiments (5 mL) was the same as Batch 2’s total volume (5 mL), but the volume of each slug (e.g., 14–28 μL) was much smaller than the batch experiment. A smaller solution volume not only reduced the secondary nucleation probability as found by other studies [52,53,54,56], but also had a more evident effect on the total CSD. The reason is that for a small total number of crystals, a small change in primary nuclei number still means a large change in portion, thus a large change in CSD per slug and total, as in this case.
While the small volumes of slugs helped suppress secondary nucleation and grow larger crystals faster, the short-term yield can be reduced (Table 2) due to the slower rate of nucleation and growth within the measurement time frame. Many slugs can stay at the supersaturated states without nucleation. Under Condition 1, final product crystals after growth in slugs with an aspect ratio of 0.8 were uniform and non-agglomerated, with a yield of 24.1% (Figure 3). Under Condition 2, the amount of crystals in each slug was slightly more than Condition 1, which is reasonable due to the increased volume of the slug. The total yield from Condition 2 was 26.3%, closer to theoretical yield from the batch (30.2%) cooling experiment from the same solution concentration. Under Condition 3, only 1/3 of total slugs showed crystals with a relatively low yield of about 19.7%. The final yield (given more time for equilibrium) was expected to approach the theoretical value (larger than short-term yield). For example, after letting the batch with nuclei (Figure 7C) sit for one day without disturbing, the yield reached 30.2%. Condition 4 presented a larger yield than Conditions 1–3 due to the higher starting concentration and supersaturation. The XRD data verified that all the crystals were in the α form [76] (Figure S2).
3.3. Scale-Up Performance of Non-Seeded Cooling Crystallizer
The scale-up of batch crystallization from 1 mL to 50 mL (Table 1) was achieved by using a larger-volume container for the solution. In comparison, the scale-up of slug flow crystallization was achieved from running the experiments for a longer time (more slugs) using the same equipment and the same conditions (e.g., residence time, starting concentration, temperature profile). The reason is that each slug was an individual small self-circulated crystallizer, and the scale-up of total volume did not change the microenvironment for each slug. Other scale-up methods can be useful, but are not in the scope of this article, such as using different nucleation methods in batches or installing multiple sets of the same flow crystallizers.
The 5 mL batch (Table 2, Figure 7B) generated a larger crystal number density (primary nucleation outcome) than the 50 mL batch (Figure 7C), likely due to the reduced surface-to-volume ratio for larger volume crystallizer using crash cooling nucleation. There was a similar trend for the average growth rate and short-term yield (Table 2). The crystal size distributions were very different (Figure 7A–C) among the different scales. These scale-up difficulties for batches have all been well-recognized [77,78,79,80]. In contrast, the crystal number density and size distribution for slug flow experiments of different scales were much closer to each other, as indicated from representative slug images (Figure 2 and Figure S3) and crystal statistics (Figure 3, Table 2). The scale-up simplicity can be attribute to the fast heat and mass transfer inside millimeter-sized uniform slugs with a high surface-to-volume ratio, as discussed earlier.
3.4. Large Crystal Behavior inside Slugs
Stable uniform slugs with different aspect ratios (Figure 1b) were generated by varying the flow rate of both the liquid and air incoming streams. Small glycine crystals (about 0.11 mm) generated under Condition 4 (the dark particles in Figure 8d) were circulated in the whole slug geometry. This behavior was consistent with the past observation that particles of a few hundred microns were able to circulate evenly inside the slurry slug of an aspect ratio of ~1 [9,58]. However, millimeter-sized glycine crystals performed differently in the slugs whose dimension was on the same length scale (e.g., the tubing ID was less than four-times larger than the average crystal size). As shown in Figure 8a–c, these large crystals were not bouncing around in the whole slug under Conditions 1–3. Instead, for different experiments (e.g., slugs of different aspect ratios), these hexagonal-shaped crystals always stayed in the tail end region of each slug and self-rotated. Even with such large crystals at ~1.5-times the density of the solution [81], each slug still retained its shape and flow velocity. Further, no fouling (resting of crystals on the tubing wall), nor breakage of the crystals were observed (e.g., Figure 3, Figure 4 and Figure 5) throughout the crystallization and transporting process.
3.5. Additional Comments
In the slug-flow crystallization of this work, the system was divided into three zones for different purposes: (a) slug generation by solution stream and air stream; (b) primary nucleation induced by crash cooling; (c) growth of particles with little secondary nucleation. With such a design, the final particle size distribution was controlled by the rate of primary nucleation, i.e., the number and morphology of the particles created during crash cooling.
The primary nucleation kinetics in the crash cooling zone was found to be related to the aspect ratios of the slugs and their supersaturation levels. Primary nucleation is a stochastic process. The possibility of its occurrence is proportional to the supersaturation ratio [82] and the volume of the supersaturated solution [83]. Both factors were key controls for slug flow crystallization as demonstrated by the results. The supersaturation level was determined by the initial concentration of the feed solution and the temperature of the crash cooling zone. A high supersaturation level was achieved by using a more concentrated feed (Condition 4), in which case fine particles were seen in the exit of the slug flow crystallizer, due to secondary nucleation in the growth zone. The low supersaturation level case was studied by using room temperature for the crash cooling zone, where none of the slug nucleated out any crystals although they were all supersaturated. A few large particles in each slug were successfully generated with the temperature and concentration of Conditions 1–3, but the chance of nucleation depended on the volume. In this condition, the fact that only a few crystals nucleated out indicated that the nucleation rate was relatively slow. Therefore, the stochastic nature of primary nucleation is significant, and a sufficient solution volume should be used to maximize the chance of primary nucleation. Such experience is valuable for future applications of slug flow crystallizers.
4. Conclusions
A simple continuous slug-flow cooling crystallization process has been designed to generate large and non-agglomerated α-glycine crystals rapidly. The specific process and physical setup were composed of slug formation, cooling nucleation, and growth zones in sequence. Primary and secondary nucleation was affected by both the initial solution concentrations (supersaturation levels) and slug aspect ratios in the nucleation zone. Conditions were selected such that a few glycine crystals nucleated in each slug. In the growth zone, secondary nucleation could be suppressed in slug flow for up to a certain supersaturation level, so that existing nuclei could grow to millimeter size in 10 min. These large crystals did not disturb the slug flow quality. The scale-up slug flow crystallization process demonstrated its capabilities of scaling up without any difficulties. No clogging nor fouling were observed throughout the slug flow process, showing potential for process scale-up.
Supplementary Materials
The following are available online at https://0-www-mdpi-com.brum.beds.ac.uk/2073-4352/9/8/412/s1. Figure S1. Spatial profiles of the temperature in slugs and corresponding solute solubility along the length of the tubular crystallizer. The solubility is a function of temperature, Csat = 0.563 Tsat exp + 9.836, as in Section 2.1. The solution concentration is 0.32 g glycine/g DI H2O, until after nucleation. The temperature was monitored with an IR laser thermometer to verify every slug has the same temperature trajectory. Figure S2. XRD spectra of product crystals under batch, condition 1, condition 2 and condition 3, respectively. Figure S3. In-line microscope image of crystals in the slurry slug (in the center) for condition 5. Figure S4. Representative off-line microscope images (with polarizer) of produced crystals in slugs of total volume of 50 mL after 1 day. Experimental details are in Table 1, condition 5. Scale bar: 0.2 mm.
Author Contributions
Conceptualization, M.J. and H.L.; methodology, M.J. and M.M.; software, M.M.; formal analysis, M.M. and H.L.; investigation, M.J. and M.M.; writing, original draft preparation, M.M.; writing, review and editing, M.J. and H.L.; supervision, M.J. and B.Y.; funding acquisition, M.J.
Funding
This research was funded by Boehringer Ingelheim Pharmaceuticals, Inc., and Virginia Commonwealth University.
Acknowledgments
Boehringer Ingelheim Pharmaceuticals, Inc., and Virginia Commonwealth University are acknowledged for financial support.
Conflicts of Interest
The authors declare no conflict of interest.
References
- Méndez del Río, J.R.; Rousseau, R.W. Batch and Tubular-Batch Crystallization of Paracetamol: Crystal Size Distribution and Polymorph Formation. Cryst. Growth Des. 2006, 6, 1407–1414. [Google Scholar] [CrossRef]
- Jiang, M.; Li, Y.-E.; Tung, H.-H.; Braatz, R.D. Effect of jet velocity on crystal size distribution from antisolvent and cooling crystallizations in a dual impinging jet mixer. Chem. Eng. Process. Process Intensif. 2015, 97, 242–247. [Google Scholar] [CrossRef]
- Jiang, M.; Zhu, Z.; Jimenez, E.; Papageorgiou, C.D.; Waetzig, J.; Hardy, A.; Langston, M.; Braatz, R.D. Continuous-Flow Tubular Crystallization in Slugs Spontaneously Induced by Hydrodynamics. Cryst. Growth Des. 2014, 14, 851–860. [Google Scholar] [CrossRef]
- Eder, R.J.P.; Radl, S.; Schmitt, E.; Innerhofer, S.; Maier, M.; Gruber-Woelfler, H.; Khinast, J.G. Continuously Seeded, Continuously Operated Tubular Crystallizer for the Production of Active Pharmaceutical Ingredients. Cryst. Growth Des. 2010, 10, 2247–2257. [Google Scholar] [CrossRef]
- Ferguson, S.; Morris, G.; Hao, H.; Barrett, M.; Glennon, B. In-situ monitoring and characterization of plug flow crystallizers. Chem. Eng. Sci. 2012, 77, 105–111. [Google Scholar] [CrossRef]
- Jiang, M.; Zhu, X.; Molaro, M.C.; Rasche, M.L.; Zhang, H.; Chadwick, K.; Raimondo, D.M.; Kim, K.K.; Zhou, L.; Zhu, Z.; et al. Modification of Crystal Shape through Deep Temperature Cycling. Ind. Eng. Chem. Res. 2014, 53, 5325–5336. [Google Scholar] [CrossRef]
- Neugebauer, P.; Khinast, J.G. Continuous Crystallization of Proteins in a Tubular Plug-Flow Crystallizer. Cryst. Growth Des. 2015, 15, 1089–1095. [Google Scholar] [CrossRef] [PubMed]
- Alvarez, A.J.; Myerson, A.S. Continuous Plug Flow Crystallization of Pharmaceutical Compounds. Cryst. Growth Des. 2010, 10, 2219–2228. [Google Scholar] [CrossRef]
- Besenhard, M.O.; Neugebauer, P.; Scheibelhofer, O.; Khinast, J.G. Crystal Engineering in Continuous Plug-Flow Crystallizers. Cryst. Growth Des. 2017, 17, 6432–6444. [Google Scholar] [CrossRef]
- Jiang, M.; Braatz, R.D. Designs of continuous-flow pharmaceutical crystallizers: Developments and practice. Cryst. Eng. Commun. 2019, 21, 3534–3551. [Google Scholar] [CrossRef]
- Lindenberg, C.; Schöll, J.; Vicum, L.; Mazzotti, M.; Brozio, J. Experimental characterization and multi-scale modeling of mixing in static mixers. Chem. Eng. Sci. 2008, 63, 4135–4149. [Google Scholar] [CrossRef]
- Liu, Y.; Cheng, C.; Liu, Y.; Prud’homme, R.K.; Fox, R.O. Mixing in a multi-inlet vortex mixer MIVM for flash nano-precipitation. Chem. Eng. Sci. 2008, 63, 2829–2842. [Google Scholar] [CrossRef]
- Zhang, D.; Xu, S.; Du, S.; Wang, J.; Gong, J. Progress of Pharmaceutical Continuous Crystallization. Engineering 2017, 3, 354–364. [Google Scholar] [CrossRef]
- Alvarez, A.J.; Singh, A.; Myerson, A.S. Crystallization of Cyclosporine in a Multistage Continuous MSMPR Crystallizer. Cryst. Growth Des. 2011, 11, 4392–4400. [Google Scholar] [CrossRef]
- Su, Q.; Rielly, C.D.; Powell, K.A.; Nagy, Z.K. Mathematical modelling and experimental validation of a novel periodic flow crystallization using MSMPR crystallizers. AIChE J. 2017, 63, 1313–1327. [Google Scholar] [CrossRef]
- Li, J.; Trout, B.L.; Myerson, A.S. Multistage continuous mixed-suspension, mixed-product removal MSMPR crystallization with solids recycle. Org. Process Res. Dev. 2016, 20, 510–516. [Google Scholar] [CrossRef]
- Yang, Y.; Song, L.; Gao, T.; Nagy, Z.K. Integrated upstream and downstream application of wet milling with continuous mixed suspension mixed product removal crystallization. Cryst. Growth Des. 2015, 15, 5879–5885. [Google Scholar] [CrossRef]
- Mullin, J.W.; Gaska, C. The growth and dissolution of potassium sulphate crystals in a fluidized bed crystallizer. Can. J. Chem. Eng. 1969, 47, 483–489. [Google Scholar] [CrossRef]
- Midler, M. Process for Production of Crystals in Fluidized Bed Crystallizers. U.S. Patent 3892539A, 1 July 1975. [Google Scholar]
- Shih, Y.-J.; Abarca, R.R.M.; de Luna, M.D.G.; Huang, Y.-H.; Lu, M.-C. Recovery of phosphorus from synthetic wastewaters by struvite crystallization in a fluidized-bed reactor: Effects of pH, phosphate concentration and coexisting ions. Chemosphere 2017, 173, 466–473. [Google Scholar] [CrossRef]
- Binev, D.; Seidel-Morgenstern, A.; Lorenz, H. Continuous separation of isomers in fluidized bed crystallizers. Cryst. Growth Des. 2016, 16, 1409–1419. [Google Scholar] [CrossRef]
- Binev, D.; Seidel-Morgenstern, A.; Lorenz, H. Study of crystal size distributions in a fluidized bed crystallizer. Chem. Eng. Sci. 2015, 133, 116–124. [Google Scholar] [CrossRef]
- Lawton, S.; Steele, G.; Shering, P.; Zhao, L.; Laird, I.; Ni, X.-W. Continuous Crystallization of Pharmaceuticals Using a Continuous Oscillatory Baffled Crystallizer. Org. Process Res. Dev. 2009, 13, 1357–1363. [Google Scholar] [CrossRef]
- Siddique, H.; Brown, C.J.; Houson, I.; Florence, A.J. Establishment of a continuous sonocrystallization process for lactose in an oscillatory baffled crystallizer. Org. Process Res. Dev. 2015, 19, 1871–1881. [Google Scholar] [CrossRef]
- Briggs, N.E.B.; Schacht, U.; Raval, V.; McGlone, T.; Sefcik, J.; Florence, A.J. Seeded crystallization of β-L-glutamic acid in a continuous oscillatory baffled crystallizer. Org. Process Res. Dev. 2015, 19, 1903–1911. [Google Scholar] [CrossRef]
- Chen, D.L.; Li, L.; Reyes, S.; Adamson, D.N.; Ismagilov, R.F. Using Three-Phase Flow of Immiscible Liquids to Prevent Coalescence of Droplets in Microfluidic Channels: Criteria to Identify the Third Liquid and Validation with Protein Crystallization. Langmuir ACS J. Surf. Colloids 2007, 23, 2255–2260. [Google Scholar] [CrossRef] [PubMed]
- Robertson, K.; Flandrin, P.-B.; Klapwijk, A.R.; Wilson, C.C. Design and Evaluation of a Mesoscale Segmented Flow Reactor KRAIC. Cryst. Growth Des. 2016, 16, 4759–4764. [Google Scholar] [CrossRef]
- Hohmann, L.; Gorny, R.; Klaas, O.; Ahlert, J.; Wohlgemuth, K.; Kockmann, N. Design of a Continuous Tubular Cooling Crystallizer for Process Development on Lab-Scale. Chem. Eng. Technol. 2016, 39, 1268–1280. [Google Scholar] [CrossRef]
- Kim, K.-J.; Oleksak, R.P.; Hostetler, E.B.; Peterson, D.A.; Chandran, P.; Schut, D.M.; Paul, B.K.; Herman, G.S.; Chang, C.-H. Continuous Microwave-Assisted Gas–Liquid Segmented Flow Reactor for Controlled Nucleation and Growth of Nanocrystals. Cryst. Growth Des. 2014, 14, 5349–5355. [Google Scholar] [CrossRef]
- Nagy, Z.K. Model based robust control approach for batch crystallization product design. Comput. Chem. Eng. 2009, 33, 1685–1691. [Google Scholar] [CrossRef] [Green Version]
- Rawlings, J.B.; Miller, S.M.; Witkowski, W.R. Model identification and control of solution crystallization processes: A review. Ind. Eng. Chem. Res. 1993, 32, 1275–1296. [Google Scholar] [CrossRef]
- Braatz, R.D. Advanced control of crystallization processes. Annu. Rev. Control 2002, 26, 87–99. [Google Scholar] [CrossRef]
- Bennett, R.C. 5-Crystallizer selection and design. In Handbook of Industrial Crystallization, 2nd ed.; Myerson, A.S., Ed.; Butterworth-Heinemann: Woburn, UK, 2002; pp. 115–140. [Google Scholar]
- Wey, J.S.; Karpinski, P.H. 10-Batch crystallization. In Handbook of Industrial Crystallization, 2nd ed.; Myerson, A.S., Ed.; Butterworth-Heinemann: Woburn, UK, 2002; pp. 231–248. [Google Scholar]
- Chung, S.H.; Ma, D.L.; Braatz, R.D. Optimal model-based experimental design in batch crystallization. Chemom. Intell. Lab. Syst. 2000, 50, 83–90. [Google Scholar] [CrossRef]
- Ma, D.L.; Chung, S.H.; Braatz, R.D. Worst-case performance analysis of optimal batch control trajectories. AIChE J. 1999, 45, 1469–1476. [Google Scholar] [CrossRef]
- Wang, S.; Jiang, M.; Ibrahim, S.; Wu, J.; Feng, X.; Duan, X.; Yang, Z.; Yang, C.; Ohmura, N. Optimized Stirred Reactor for Enhanced Particle Dispersion. Chem. Eng. Technol. 2016, 39, 680–688. [Google Scholar] [CrossRef]
- Su, M.; Gao, Y. Air-liquid segmented continuous crystallization process optimization of the flow field, growth rate, and size distribution of crystals. Ind. Eng. Chem. Res. 2018, 57, 3781–3791. [Google Scholar] [CrossRef]
- Eder, R.J.P.; Schrank, S.; Besenhard, M.O.; Roblegg, E.; Gruber-Woelfler, H.; Khinast, J.G. Continuous sonocrystallization of acetylsalicylic acid ASA: Control of crystal size. Cryst. Growth Des. 2012, 12, 4733–4738. [Google Scholar] [CrossRef]
- Jiang, M.; Papageorgiou, C.D.; Waetzig, J.; Hardy, A.; Langston, M.; Braatz, R.D. Indirect Ultrasonication in Continuous Slug-Flow Crystallization. Cryst. Growth Des. 2015, 15, 2486–2492. [Google Scholar] [CrossRef]
- Vacassy, R.; Lemaître, J.; Hofmann, H.; Gerlings, J.H. Calcium carbonate precipitation using new segmented flow tubular reactor. AIChE J. 2000, 46, 1241–1252. [Google Scholar] [CrossRef]
- Nightingale, A.M.; Demello, J.C. Segmented flow reactors for nanocrystal synthesis. Adv. Mater. 2013, 25, 1813–1821. [Google Scholar] [CrossRef]
- Jongen, N.; Donnet, M.; Bowen, P.; Lemaître, J.; Hofmann, H.; Schenk, R.; Hofmann, C.; Aoun-Habbache, M.; Guillemet-Fritsch, S.; Sarrias, J.; et al. Development of a Continuous Segmented Flow Tubular Reactor and the “Scale-out” Concept – In Search of Perfect Powders. Chem. Eng. Technol. 2003, 26, 303–305. [Google Scholar] [CrossRef]
- Guillemet-Fritsch, S.; Aoun-Habbache, M.; Sarrias, J.; Rousset, A.; Jongen, N.; Donnet, M.; Bowen, P.; Lemaître, J. High-quality nickel manganese oxalate powders synthesized in a new segmented flow tubular reactor. Solid State Ion. 2004, 171, 135–140. [Google Scholar] [CrossRef]
- Yonemoto, T.; Kubo, M.; Doi, T.; Tadaki, T. Continuous synthesis of titanium dioxide fine particles using a slug flow ageing tube reactor. Chem. Eng. Res. Des. 1997, 75, 413–419. [Google Scholar] [CrossRef]
- Testino, A.; Pilger, F.; Lucchini, M.A.; Quinsaat, J.E.Q.; Stähli, C.; Bowen, P. Continuous polyol synthesis of metal and metal oxide nanoparticles using a segmented flow tubular reactor SFTR. Molecules 2015, 20, 10566–10581. [Google Scholar] [CrossRef] [PubMed]
- Daniel Scott, C.; Labes, R.; Depardieu, M.; Battilocchio, C.; Davidson, M.G.; Ley, S.V.; Wilson, C.C.; Robertson, K. Integrated plug flow synthesis and crystallisation of pyrazinamide. React. Chem. Eng. 2018, 3, 631–634. [Google Scholar] [CrossRef] [Green Version]
- Lu, J.; Litster, J.D.; Nagy, Z.K. Nucleation studies of active pharmaceutical ingredients in an air-segmented microfluidic drop-based crystallizer. Cryst. Growth Des. 2015, 15, 3645–3651. [Google Scholar] [CrossRef]
- Kudo, S.; Takiyama, H. Production of Fine Organic Crystalline Particles by Using Milli Segmented Flow Crystallizer. J. Chem. Eng. Jpn. 2011, 1111100294. [Google Scholar] [CrossRef]
- Bhamidi, V.; Lee, S.H.; He, G.; Chow, P.S.; Tan, R.B.H.; Zukoski, C.F.; Kenis, P.J.A. Antisolvent Crystallization and Polymorph Screening of Glycine in Microfluidic Channels Using Hydrodynamic Focusing. Cryst. Growth Des. 2015, 15, 3299–3306. [Google Scholar] [CrossRef]
- Kim, S.; Wei, C.; Kiang, S. Crystallization process development of an active pharmaceutical ingredient and particle engineering via the use of ultrasonics and temperature cycling. Org. Process Res. Dev. 2003, 7, 997–1001. [Google Scholar] [CrossRef]
- Bonnin-Paris, J.; Bostyn, S.; Havet, J.-L.; Fauduet, H. Determination of the Metastable Zone Width of Glycine Aqueous Solutions for Batch Crystallizations. Chem. Eng. Commun. 2011, 198, 1004–1017. [Google Scholar] [CrossRef]
- Lacmann, R.; Herden, A.; Mayer, C. Kinetics of nucleation and crystal growth. Chem. Eng. Technol. 1999, 22, 279–289. [Google Scholar] [CrossRef]
- Mersmann, A.; Sangl, R.; Kind, M.; Pohlisch, J. Attrition and secondary nucleation in crystallizers. Chem. Eng. Technol. 1988, 11, 80–88. [Google Scholar] [CrossRef]
- Kadam, S.S.; Kulkarni, S.A.; Coloma Ribera, R.; Stankiewicz, A.I.; ter Horst, J.H.; Kramer, H.J.M. A new view on the metastable zone width during cooling crystallization. Chem. Eng. Sci. 2012, 72, 10–19. [Google Scholar] [CrossRef]
- Maggioni, G.M.; Mazzotti, M. Modelling the stochastic behaviour of primary nucleation. Faraday Discuss. 2015, 179, 359–382. [Google Scholar] [CrossRef] [PubMed]
- Kubo, M.; Yonemoto, T. Continuous Synthesis of TiO2 fine Particles and Increase of Particle Size Using a Two-Stage Slug Flow Tubular Reactor. Chem. Eng. Res. Des. 1999, 77, 335–341. [Google Scholar] [CrossRef]
- Jiang, M.; Braatz, R.D. Low-cost noninvasive real-time imaging for tubular continuous-flow crystallization. Chem. Eng. Technol. 2018, 41, 143–148. [Google Scholar] [CrossRef]
- Louhi-Kultanen, M.; Karjalainen, M.; Rantanen, J.; Huhtanen, M.; Kallas, J. Crystallization of glycine with ultrasound. Int. J. Pharm. 2006, 320, 23–29. [Google Scholar] [CrossRef] [PubMed]
- Tari, T.; Fekete, Z.; Szabó-Révész, P.; Aigner, Z. Reduction of glycine particle size by impinging jet crystallization. Int. J. Pharm. 2015, 478, 96–102. [Google Scholar] [CrossRef] [Green Version]
- He, G.; Bhamidi, V.; Wilson, S.R.; Tan, R.B.H.; Kenis, P.J.A.; Zukoski, C.F. Direct Growth of γ-Glycine from Neutral Aqueous Solutions by Slow, Evaporation-Driven Crystallization. Cryst. Growth Des. 2006, 6, 1746–1749. [Google Scholar] [CrossRef]
- Fu, D.-W.; Cai, H.-L.; Liu, Y.; Ye, Q.; Zhang, W.; Zhang, Y.; Chen, X.-Y.; Giovannetti, G.; Capone, M.; Li, J.; et al. Diisopropylammonium Bromide Is a High-Temperature Molecular Ferroelectric Crystal. Science 2013, 339, 425. [Google Scholar] [CrossRef]
- Hartel, R.W. Ice crystallization during the manufacture of ice cream. Trends Food Sci. Technol. 1996, 7, 315–321. [Google Scholar] [CrossRef]
- Liu, X.; Yang, Z.; Wang, D.; Cao, H. Molecular Structures and Second-Order Nonlinear Optical Properties of Ionic Organic Crystal Materials. Crystals 2016, 6, 158. [Google Scholar] [CrossRef]
- Wen, L.; Zhou, L.; Zhang, B.; Meng, X.; Qu, H.; Li, D. Multifunctional amino-decorated metal–organic frameworks: Nonlinear-optic, ferroelectric, fluorescence sensing and photocatalytic properties. J. Mater. Chem. 2012, 22, 22603–22609. [Google Scholar] [CrossRef]
- Ilangovan, R.; Ravi, G.; Subramanian, C.; Ramasamy, P.; Sakai, S. Growth and characterization of potassium tantalate niobate single crystals by the step-cooling technique. J. Cryst. Growth 2002, 237, 694–699. [Google Scholar] [CrossRef]
- Bordui, P.F.; Jacco, J.C.; Loiacono, G.M.; Stolzenberger, R.A.; Zola, J.J. Growth of large single crystals of KTiOPO4 KTP from high-temperature solution using heat pipe based furnace system. J. Cryst. Growth 1987, 84, 403–408. [Google Scholar] [CrossRef]
- Dong, Q.; Fang, Y.; Shao, Y.; Mulligan, P.; Qiu, J.; Cao, L.; Huang, J. Electron-hole diffusion lengths > 175 μm in solution-grown CH3NH3PbI3 single crystals. Science 2015, 347, 967–970. [Google Scholar] [CrossRef] [PubMed]
- Razzetti, C.; Ardoino, M.; Zanotti, L.; Zha, M.; Paorici, C. Solution Growth and Characterisation of L-Alanine Single Crystals. Cryst. Res. Technol. 2002, 37, 456–465. [Google Scholar] [CrossRef]
- Sato, K.; Okada, M. Growth of large single crystals of stearic acid from solution. J. Cryst. Growth 1977, 42, 259–263. [Google Scholar] [CrossRef]
- Su, J.; Chen, D.P.; Lin, C.T. Growth of large CH3NH3PbX3 X=I, Br single crystals in solution. J. Cryst. Growth 2015, 422, 75–79. [Google Scholar] [CrossRef]
- Lian, Z.; Yan, Q.; Gao, T.; Ding, J.; Lv, Q.; Ning, C.; Li, Q.; Sun, J.–l. Perovskite CH3NH3PbI3Cl Single Crystals: Rapid Solution Growth, Unparalleled Crystalline Quality, and Low Trap Density toward 108 cm−3. J. Am. Chem. Soc. 2016, 138, 9409–9412. [Google Scholar] [CrossRef]
- Myerson, A.S. Handbook of Industrial Crystallization, 2nd ed.; Butterworth-Heinemann: Woburn, UK, 2002. [Google Scholar]
- Tung, H.-H. Industrial Perspectives of Pharmaceutical Crystallization. Org. Process Res. Dev. 2013, 17, 445–454. [Google Scholar] [CrossRef]
- Dowling, R.; Davey, R.J.; Curtis, R.A.; Han, G.; Poornachary, S.K.; Chow, P.S.; Tan, R.B. Acceleration of crystal growth rates: An unexpected effect of tailor-made additives. Chem. Commun. 2010, 46, 5924–5926. [Google Scholar] [CrossRef] [PubMed]
- Srinivasan, K.; Renuka Devi, K.; Anbuchudar Azhagan, S. Characterization of α and γ polymorphs of glycine crystallized from water-ammonia solution. Cryst. Res. Technol. 2011, 46, 159–165. [Google Scholar] [CrossRef]
- Marchisio, D.L.; Rivautella, L.; Barresi, A.A. Design and scale-up of chemical reactors for nanoparticle precipitation. AIChE J. 2006, 52, 1877–1887. [Google Scholar] [CrossRef]
- Kamahara, T.; Takasuga, M.; Tung, H.H.; Hanaki, K.; Fukunaka, T.; Izzo, B.; Nakada, J.; Yabuki, Y.; Kato, Y. Generation of Fine Pharmaceutical Particles via Controlled Secondary Nucleation under High Shear Environment during Crystallization−Process Development and Scale-up. Org. Process Res. Dev. 2007, 11, 699–703. [Google Scholar] [CrossRef]
- Al-Rashed, M.; Wójcik, J.; Plewik, R.; Synowiec, P.; Kuś, A. Multiphase CFD modeling: Fluid dynamics aspects in scale-up of a fluidized-bed crystallizer. Chem. Eng. Process. Process Intensif. 2013, 63, 7–15. [Google Scholar] [CrossRef]
- Garside, J.; Davey, R.J. Invited review secondary contact nucleation: Kinetics, growth and scale-up. Chem. Eng. Commun. 1980, 4, 393–424. [Google Scholar] [CrossRef]
- Destro, R.; Roversi, P.; Barzaghi, M.; Marsh, R.E. Experimental Charge Density of α-Glycine at 23 K. J. Phys. Chem. A 2000, 104, 1047–1054. [Google Scholar] [CrossRef]
- De Faveri, D.; Torre, P.; Perego, P.; Converti, A. Optimization of xylitol recovery by crystallization from synthetic solutions using response surface methodology. J. Food Eng. 2004, 61, 407–412. [Google Scholar] [CrossRef]
- Tavare, N.S. Industrial Crystallization: Process Simulation Analysis and Design; Springer Science & Business Media: New York, NY, USA, 2013. [Google Scholar]
Figure 1.
(a) Schematic of the slug-flow cooling crystallization process. Slugs form by combining glycine solution and air streams at proper flow rates. Nucleation is induced by crash cooling of glycine solution slugs through tubing wall (from ice bags). The nucleation region is not necessarily only in the ice bags. (b) Photos of packed crystallizers, with different aspect ratios of liquid slugs (slug boundary highlighted in green).

Figure 2.
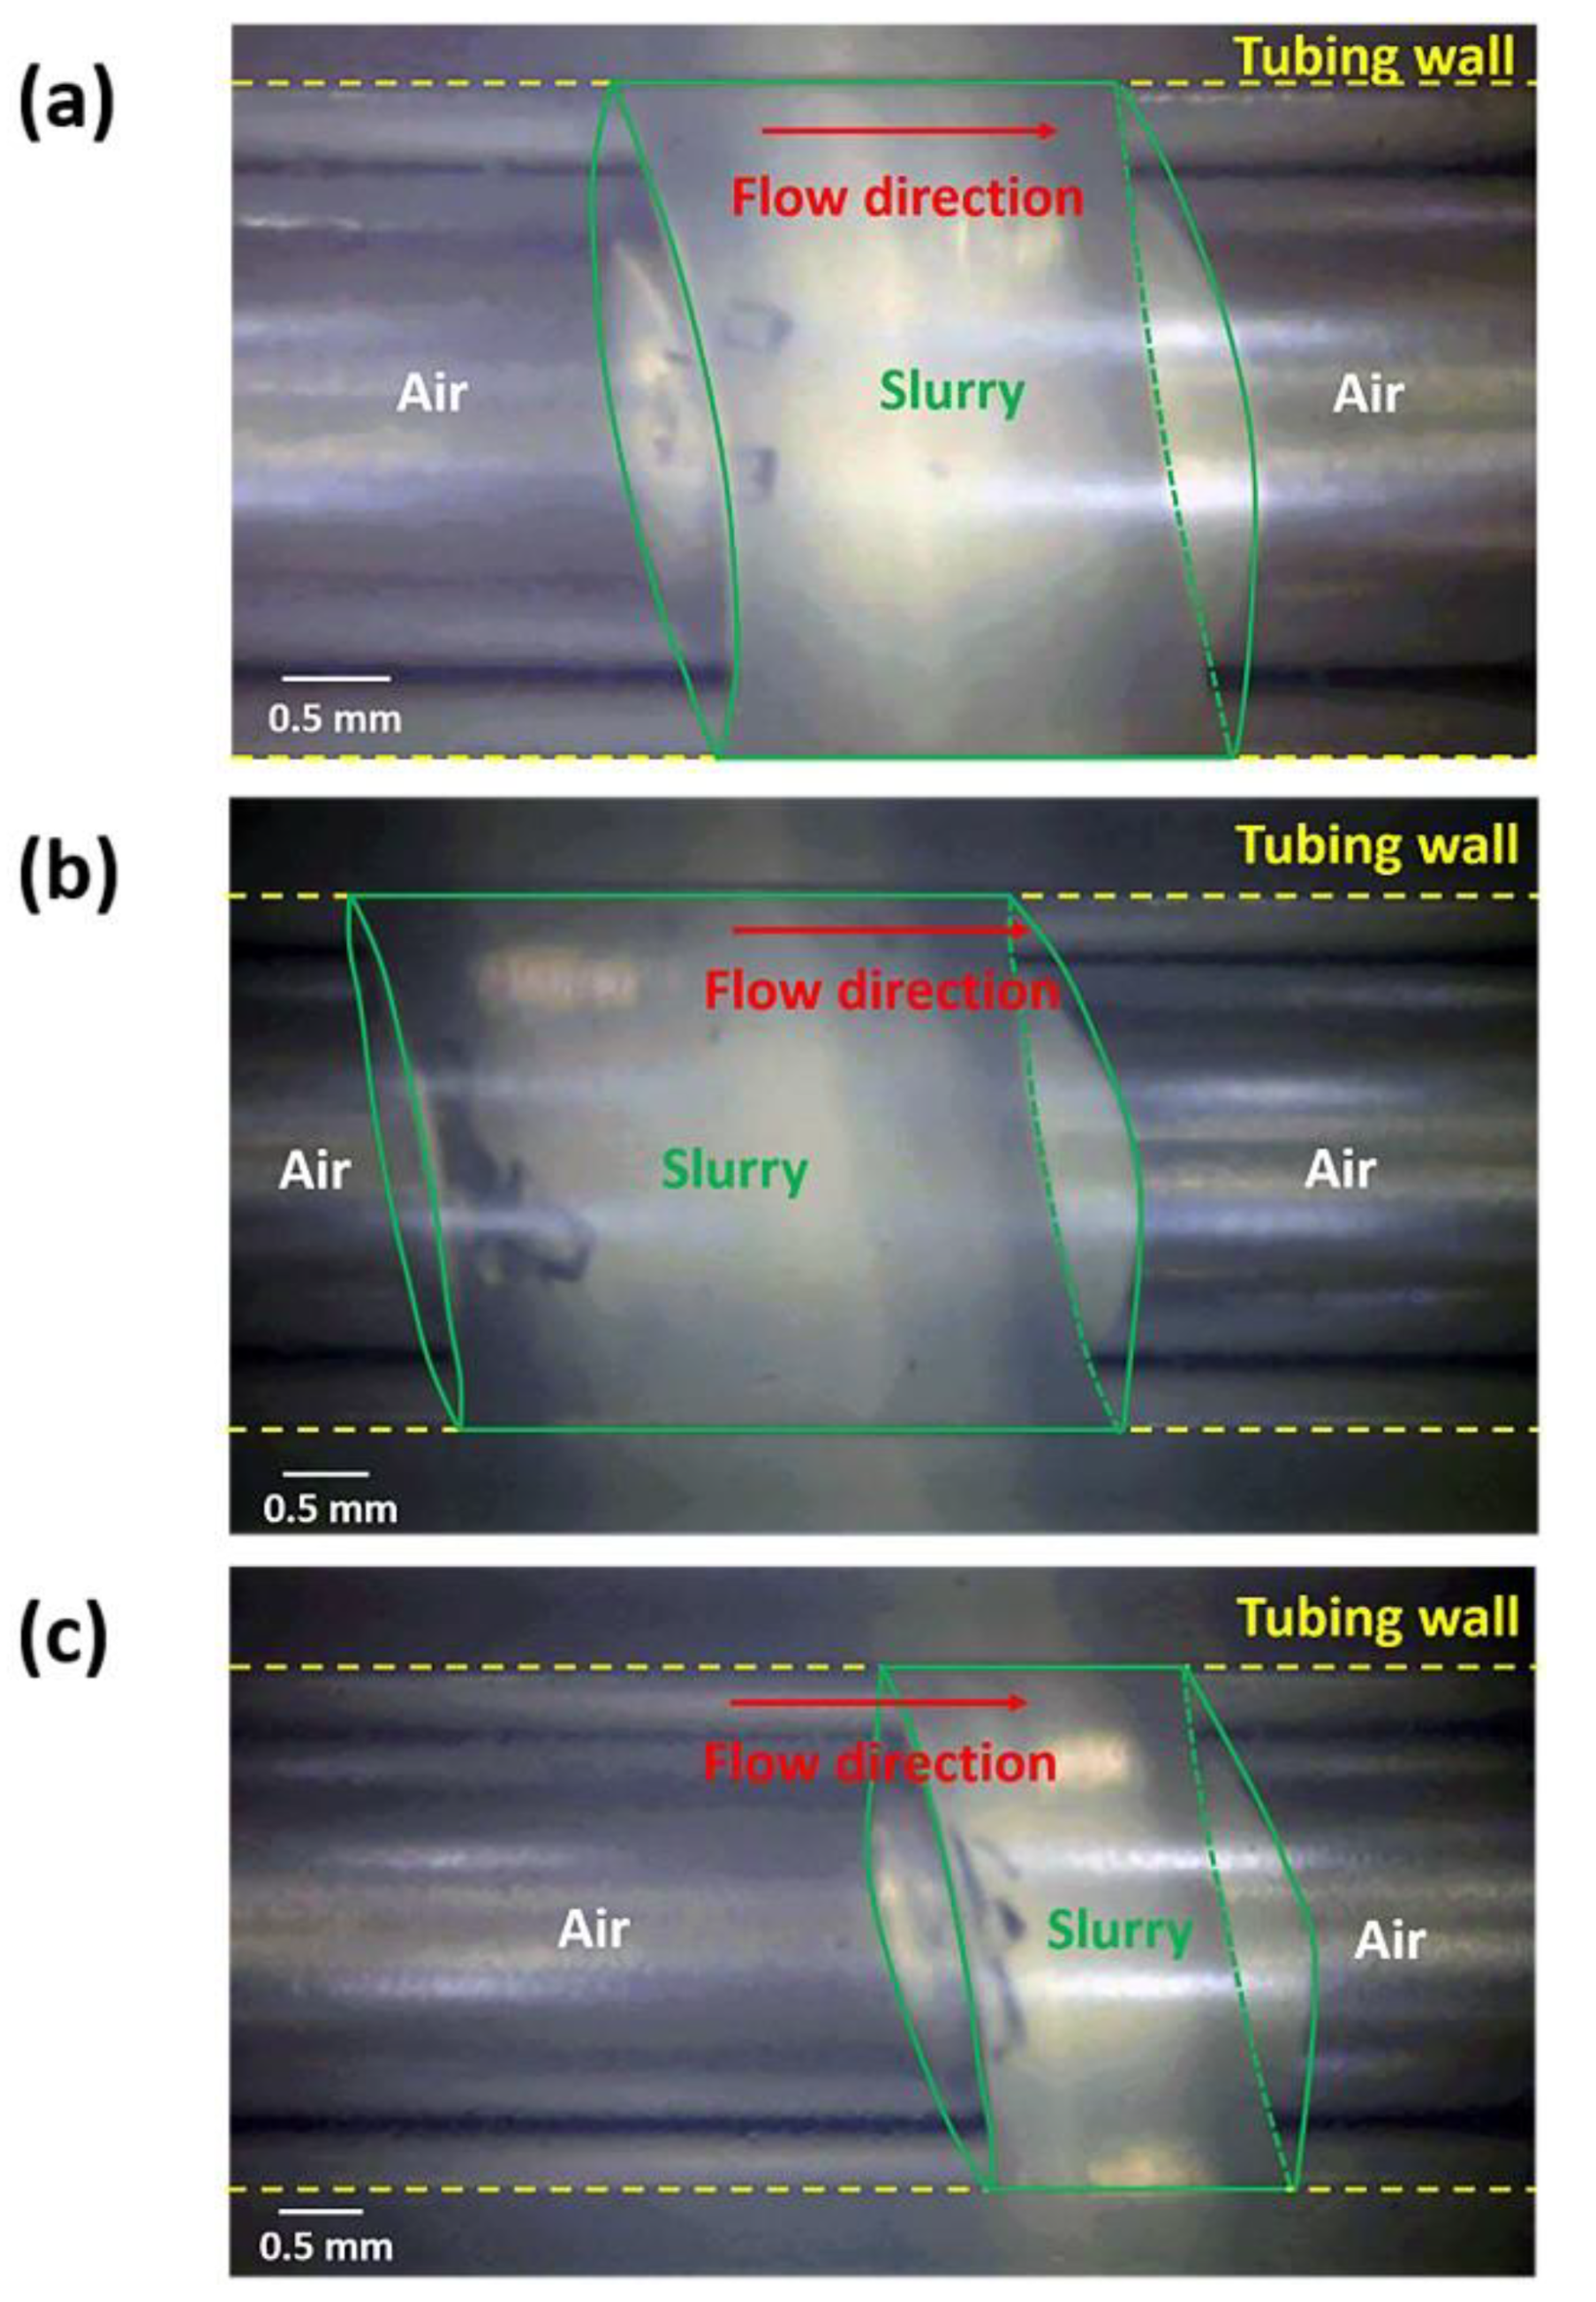
In-line microscope images of crystals in the slurry slug (in the center) with a slug aspect ratio of about (a) 0.8, (b) 1.2, and (c) 0.6. The experimental details are in Table 1, Conditions 1, 2, and 3, respectively. The flow direction is from left to right. The green line delineates the outline of the slurry slug. The front of the slurry slug resembles a projecting semicircle indicating the surface hydrophobicity of the inside tubing wall. The front is protruding more than the tail end [57]. Larger liquid flow rate and smaller air flow rate would reduce the length of the slurry slug [58]. Scale bar: 0.5 mm. The images of representative product crystals are in Figure 3, Figure 4 and Figure 5, with size statistics in Table 2.
Figure 2.
In-line microscope images of crystals in the slurry slug (in the center) with a slug aspect ratio of about (a) 0.8, (b) 1.2, and (c) 0.6. The experimental details are in Table 1, Conditions 1, 2, and 3, respectively. The flow direction is from left to right. The green line delineates the outline of the slurry slug. The front of the slurry slug resembles a projecting semicircle indicating the surface hydrophobicity of the inside tubing wall. The front is protruding more than the tail end [57]. Larger liquid flow rate and smaller air flow rate would reduce the length of the slurry slug [58]. Scale bar: 0.5 mm. The images of representative product crystals are in Figure 3, Figure 4 and Figure 5, with size statistics in Table 2.

Figure 3.
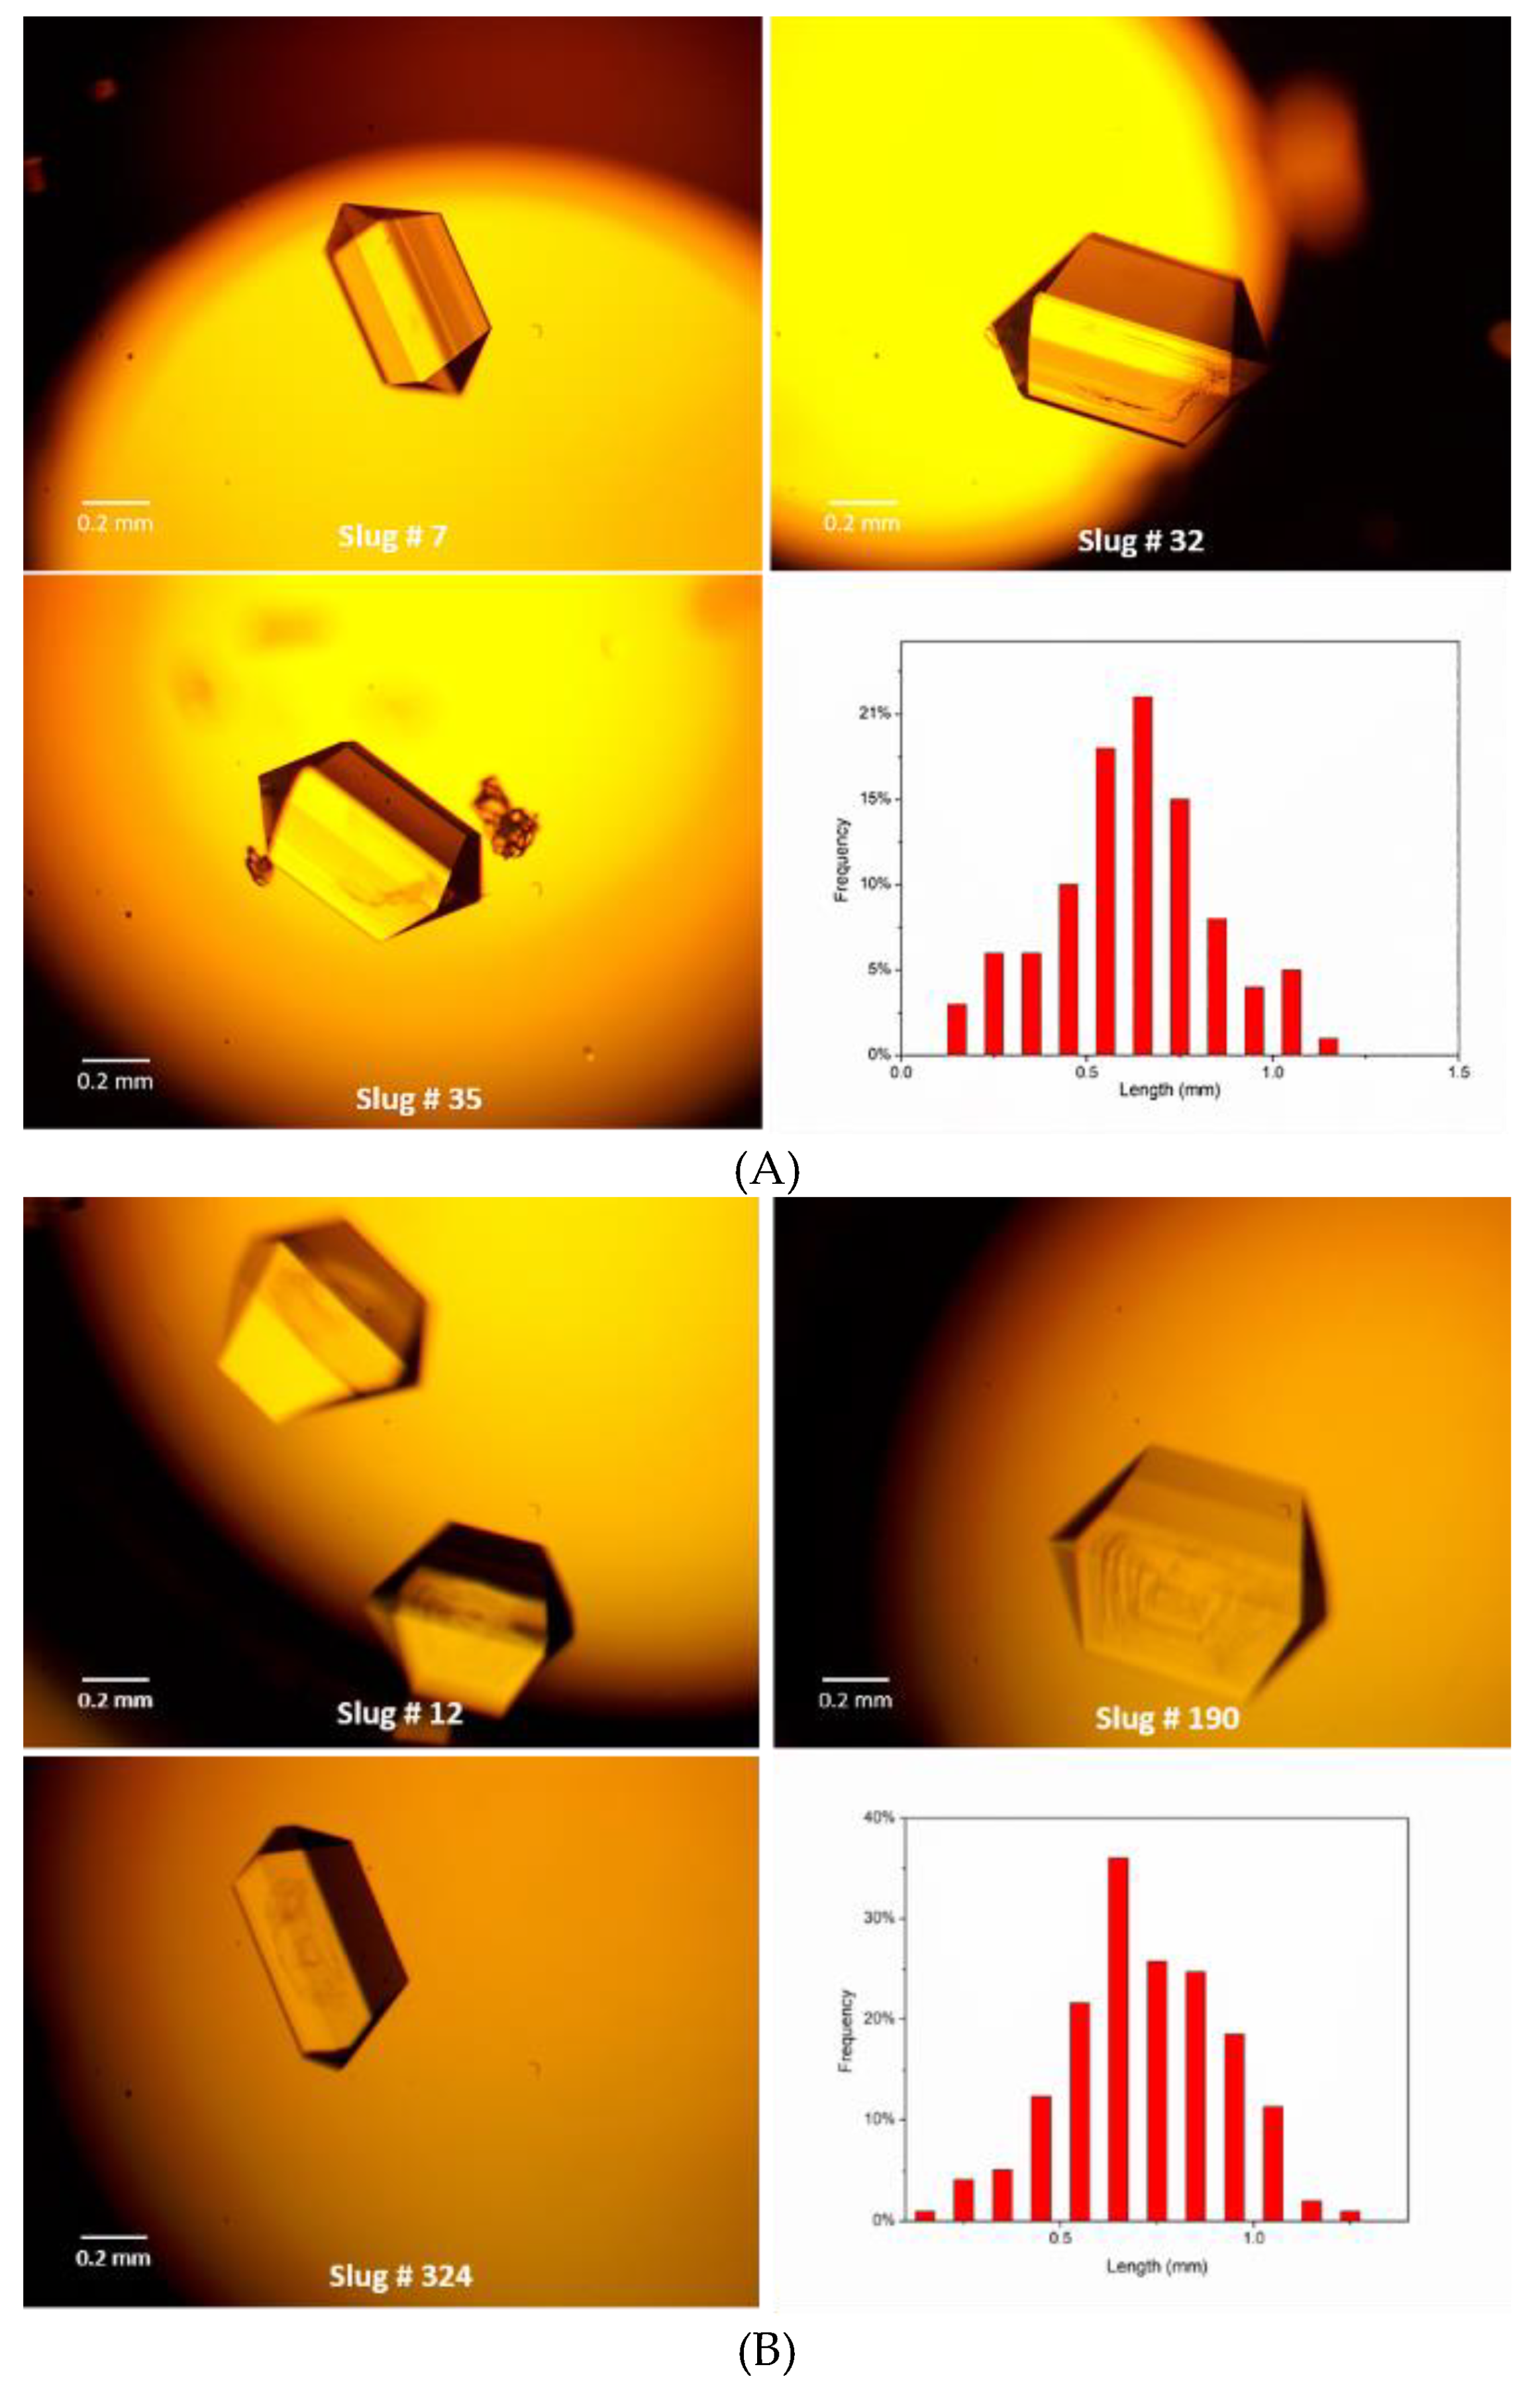
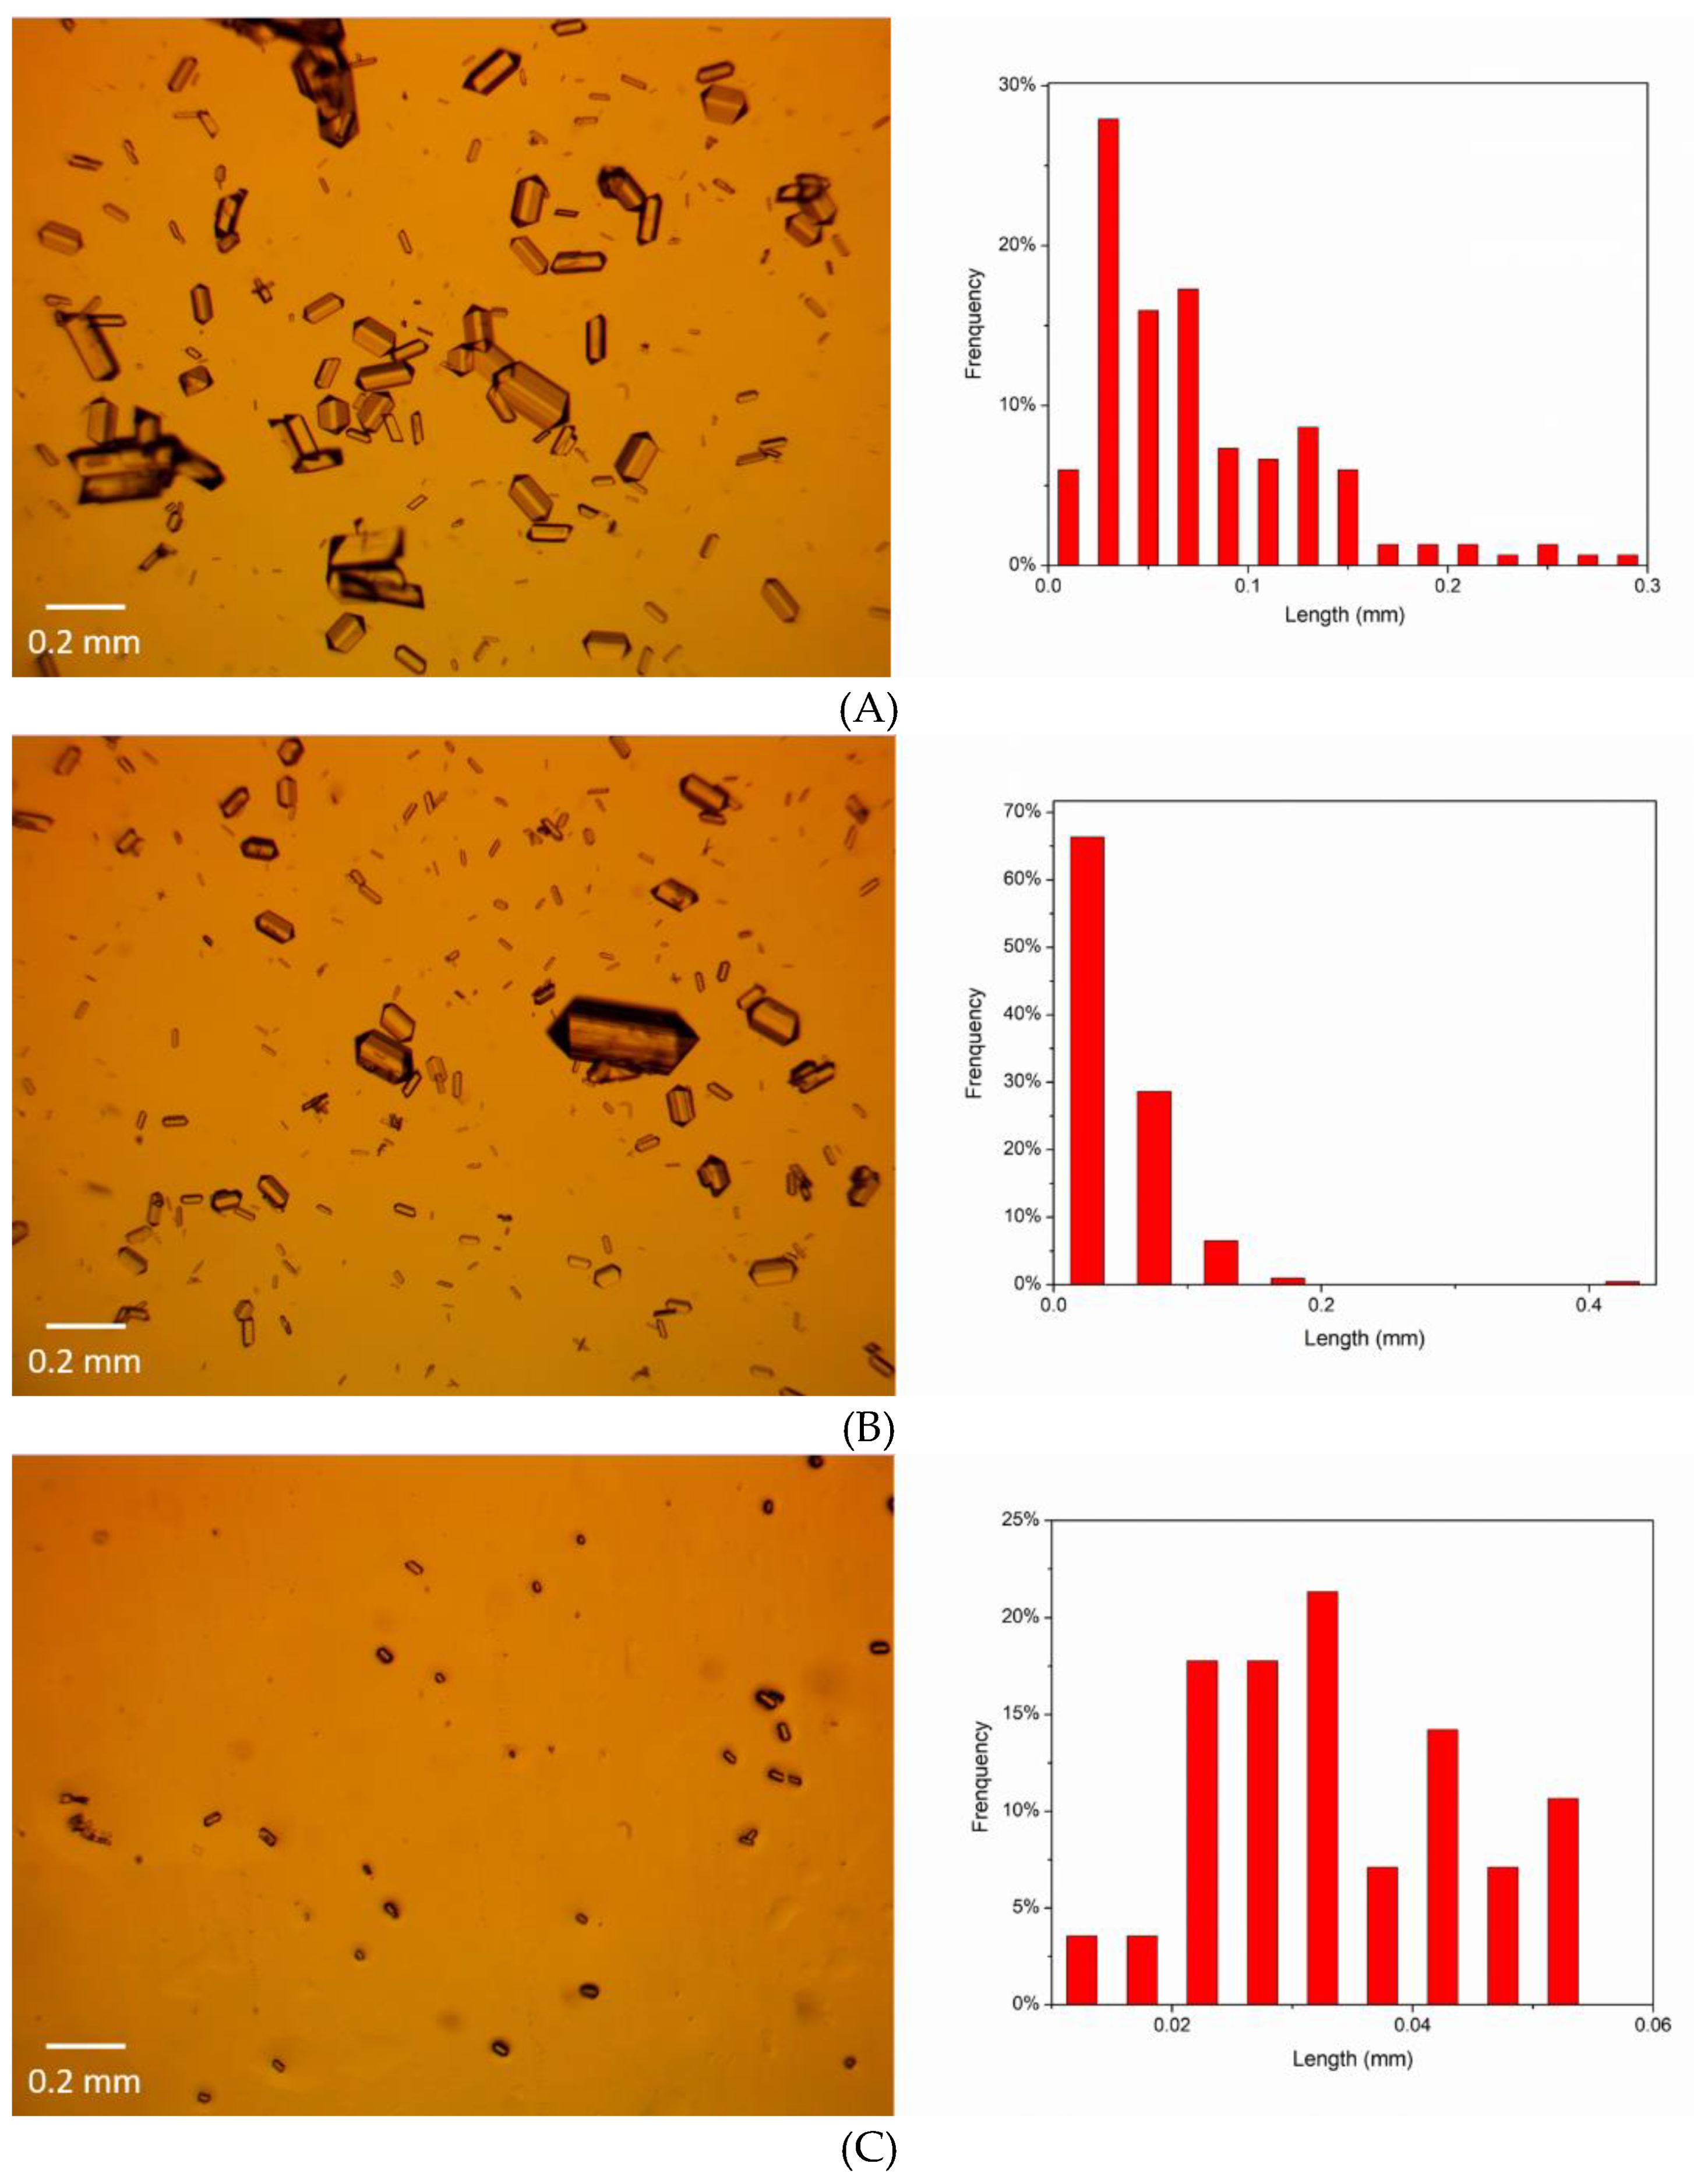
(A) Representative off-line microscope images (with polarizer) of produced crystals in slugs with an aspect ratio of about 0.8 and a total volume of 5 mL and the crystal size distribution from all off-line images. Experimental details are in Table 1, Condition 1. Scale bar: 0.2 mm. (B) Representative off-line microscope images (with polarizer) of produced crystals in slugs of a total volume of 50 mL and the crystal size distribution from all off-line images. Experimental details are in Table 1, Condition 5. Scale bar: 0.2 mm.
Figure 3.
(A) Representative off-line microscope images (with polarizer) of produced crystals in slugs with an aspect ratio of about 0.8 and a total volume of 5 mL and the crystal size distribution from all off-line images. Experimental details are in Table 1, Condition 1. Scale bar: 0.2 mm. (B) Representative off-line microscope images (with polarizer) of produced crystals in slugs of a total volume of 50 mL and the crystal size distribution from all off-line images. Experimental details are in Table 1, Condition 5. Scale bar: 0.2 mm.

Figure 4.
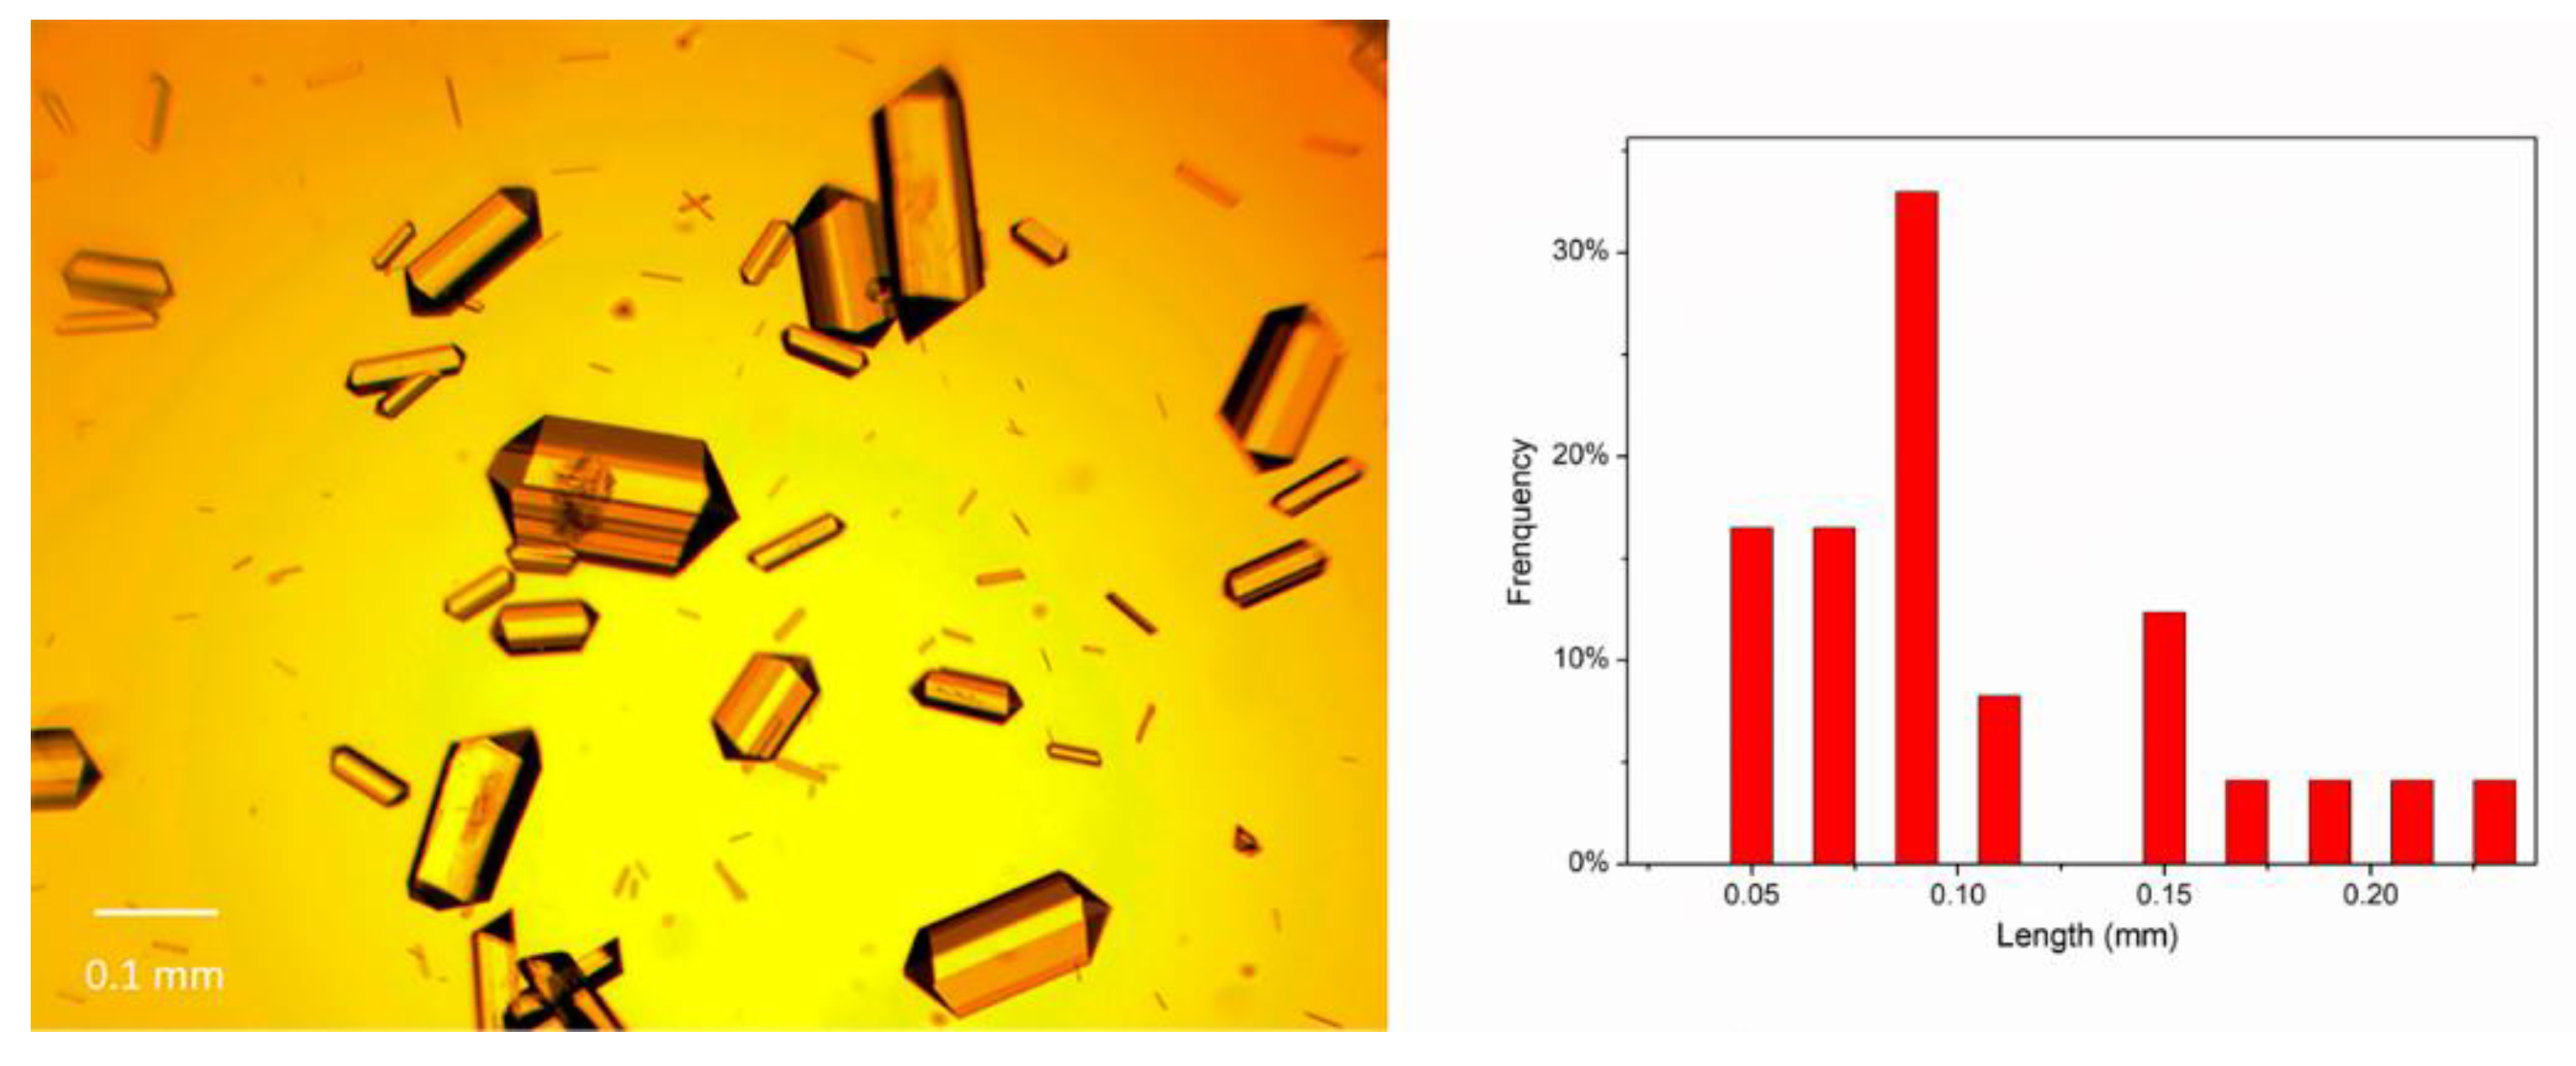
Representative off-line microscope images (with polarizer) of produced crystals in slugs with an aspect ratio of about 1.2 and the crystal size distribution from all off-line images. Experimental details are in Table 1, Condition 2. Scale bar: 0.2 mm.
Figure 4.
Representative off-line microscope images (with polarizer) of produced crystals in slugs with an aspect ratio of about 1.2 and the crystal size distribution from all off-line images. Experimental details are in Table 1, Condition 2. Scale bar: 0.2 mm.

Figure 5.
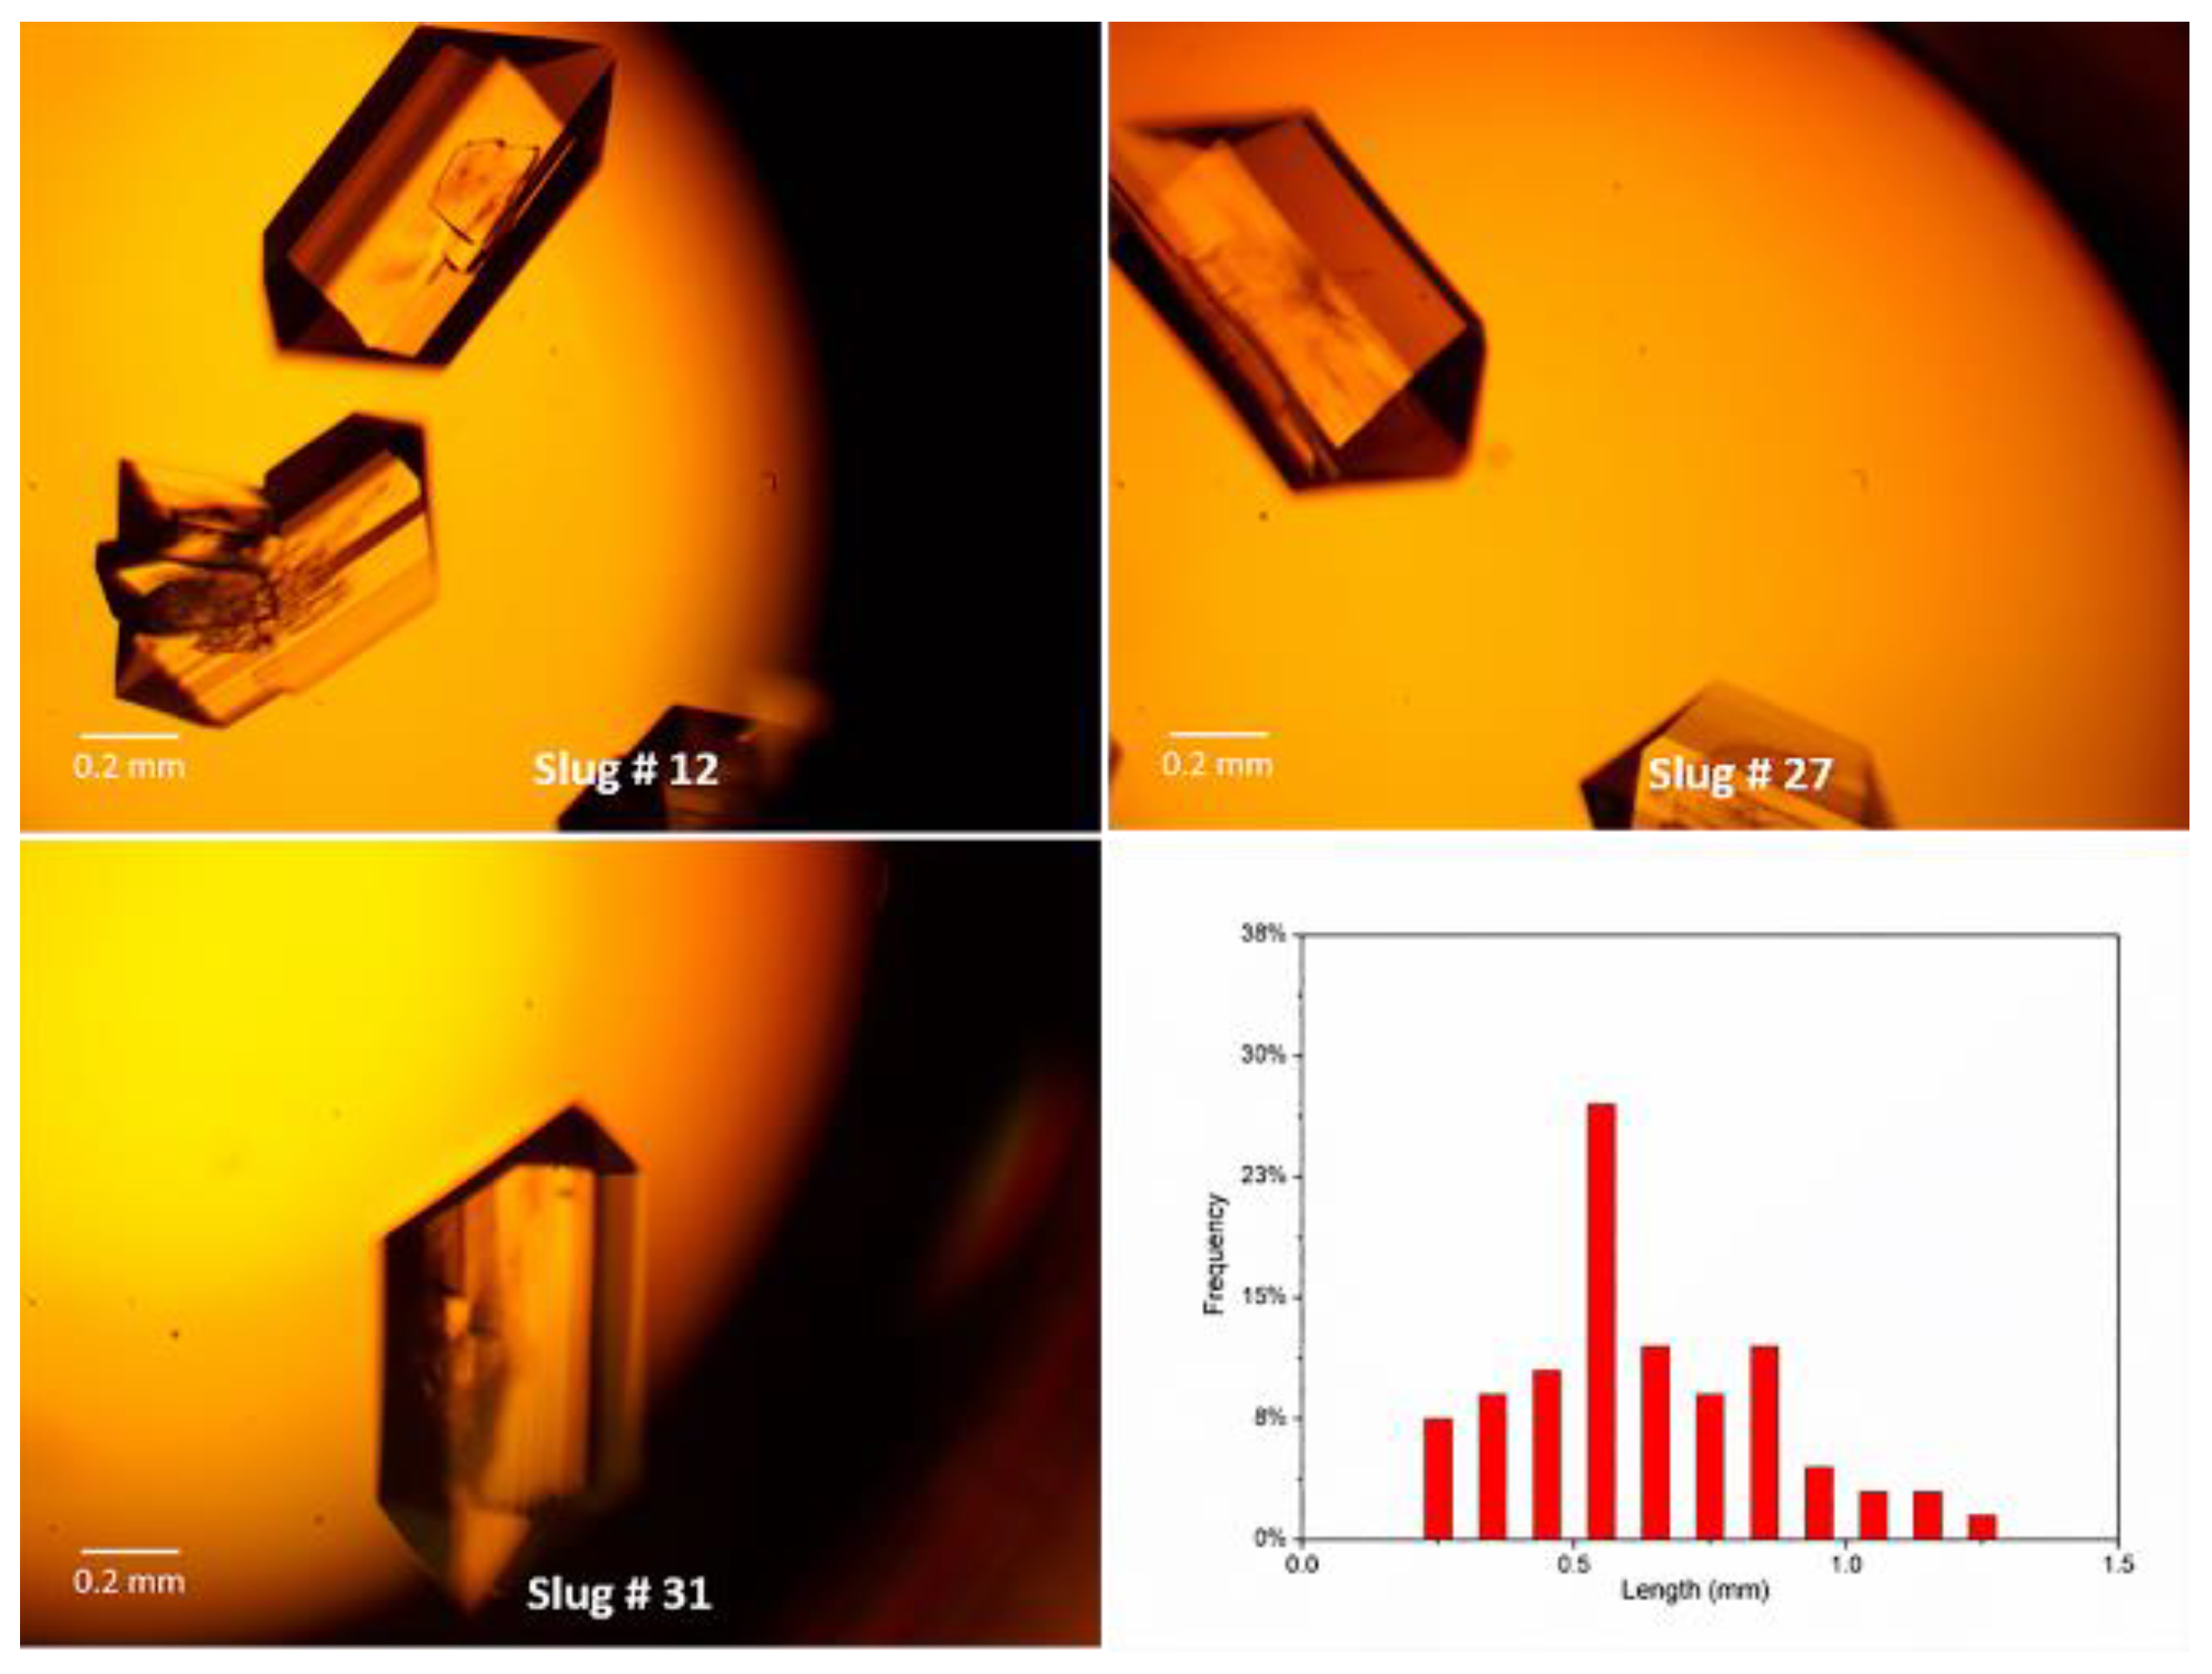
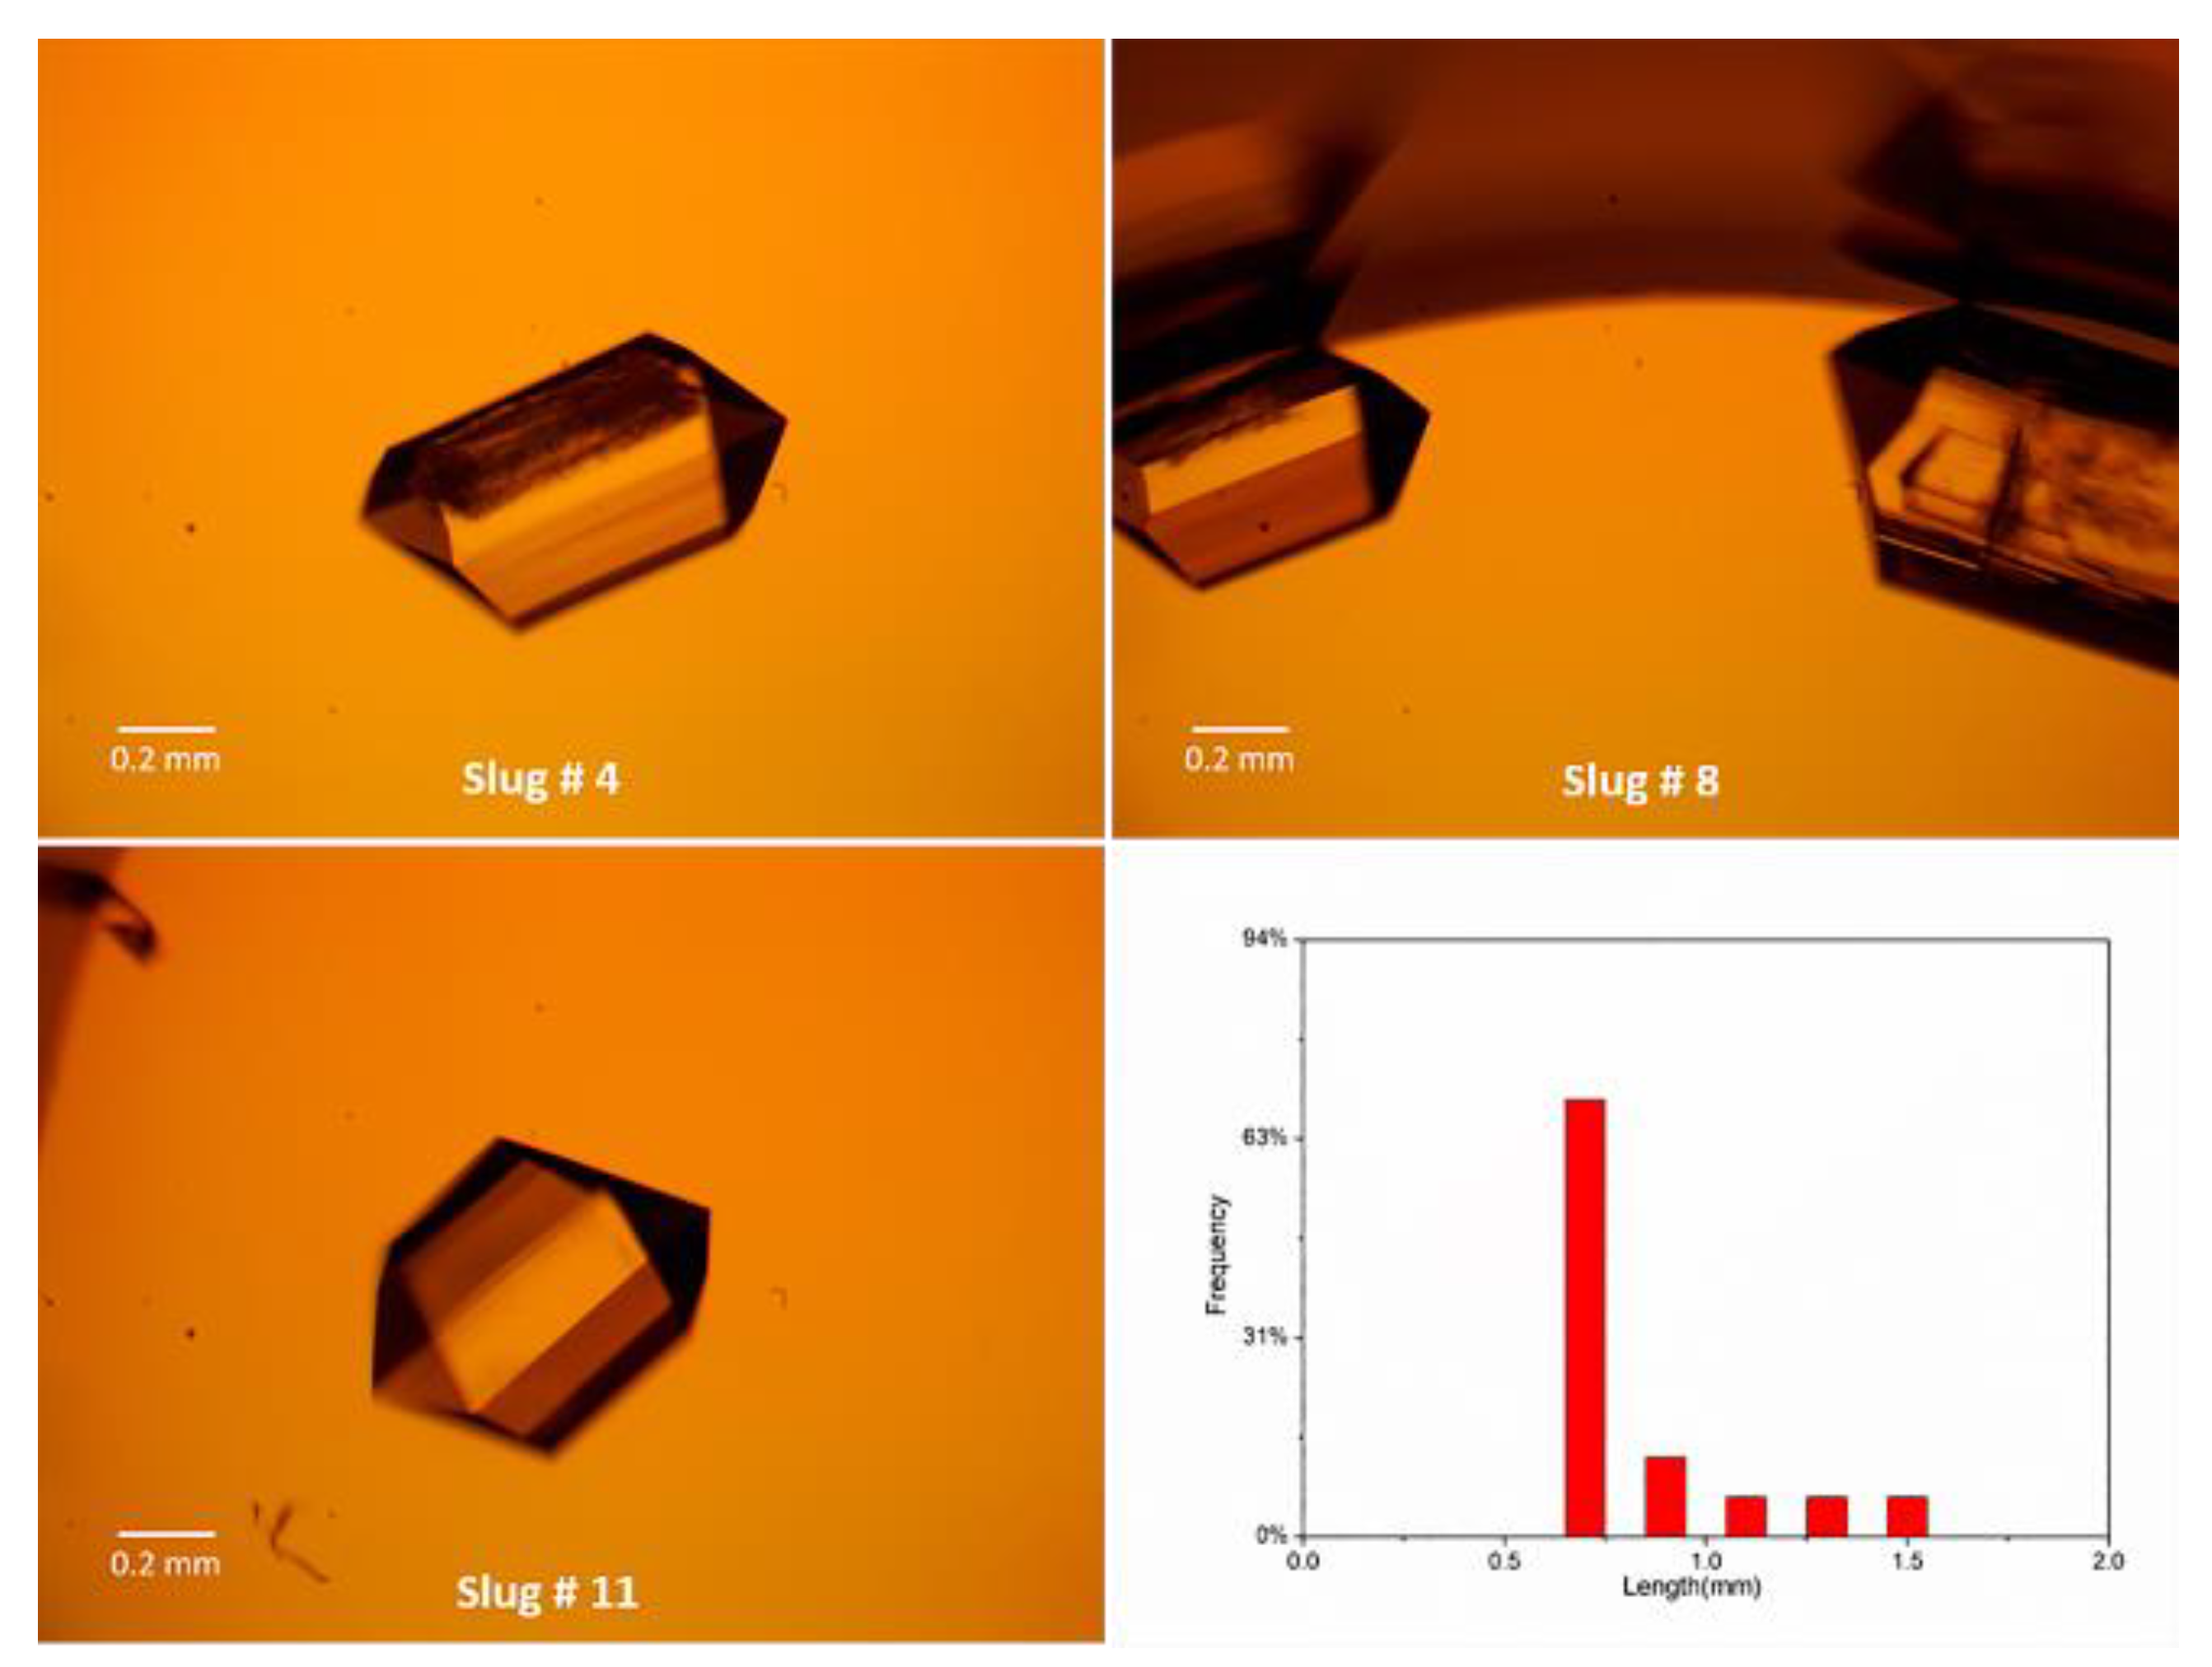
Representative off-line microscope images (with polarizer) of produced crystals in slugs with an aspect ratio of about 0.6 and the crystal size distribution from all off-line images. Experimental details are in Table 1, Conditions 3. Scale bar: 0.2 mm.
Figure 5.
Representative off-line microscope images (with polarizer) of produced crystals in slugs with an aspect ratio of about 0.6 and the crystal size distribution from all off-line images. Experimental details are in Table 1, Conditions 3. Scale bar: 0.2 mm.

Figure 6.
(Left) Representative microscopy images (with polarizer) of crystals in slugs from Conditions 4 in Table 1. The slug aspect ratio is also 0.8. (Right) Crystal size distribution (CSD) of the microscope image on the left.
Figure 6.
(Left) Representative microscopy images (with polarizer) of crystals in slugs from Conditions 4 in Table 1. The slug aspect ratio is also 0.8. (Right) Crystal size distribution (CSD) of the microscope image on the left.

Figure 7.
(A) (Left) Off-line microscope images (with polarizer) of crystals in a 1-mL batch after 10 min (residence time). The batch experimental details are in Table 1, Batch 1, under the same experimental conditions as in slug flow experiments (Table 1, Condition 1). (Right) CSD of the microscope image on the left. (B) (Left) Off-line microscope images (with polarizer) of crystals in a 5 mL batch after 10 min (residence time). The batch experimental details are in Table 1, Batch 2, under the same experimental conditions as in the slug flow experiments (Table 1, Condition 1). (Right) CSD of the microscope image on the left. (C) (Left) Off-line microscope images (with polarizer) of crystals in a 50 mL batch after 10 min (residence time). The batch experimental details are in Table 1, Batch 3, under the same experimental conditions as in slug flow experiments (Table 1, Condition 1). (Right) CSD of the microscope image on the left. The crystal data for after one day are shown in Figure S4.

Figure 8.
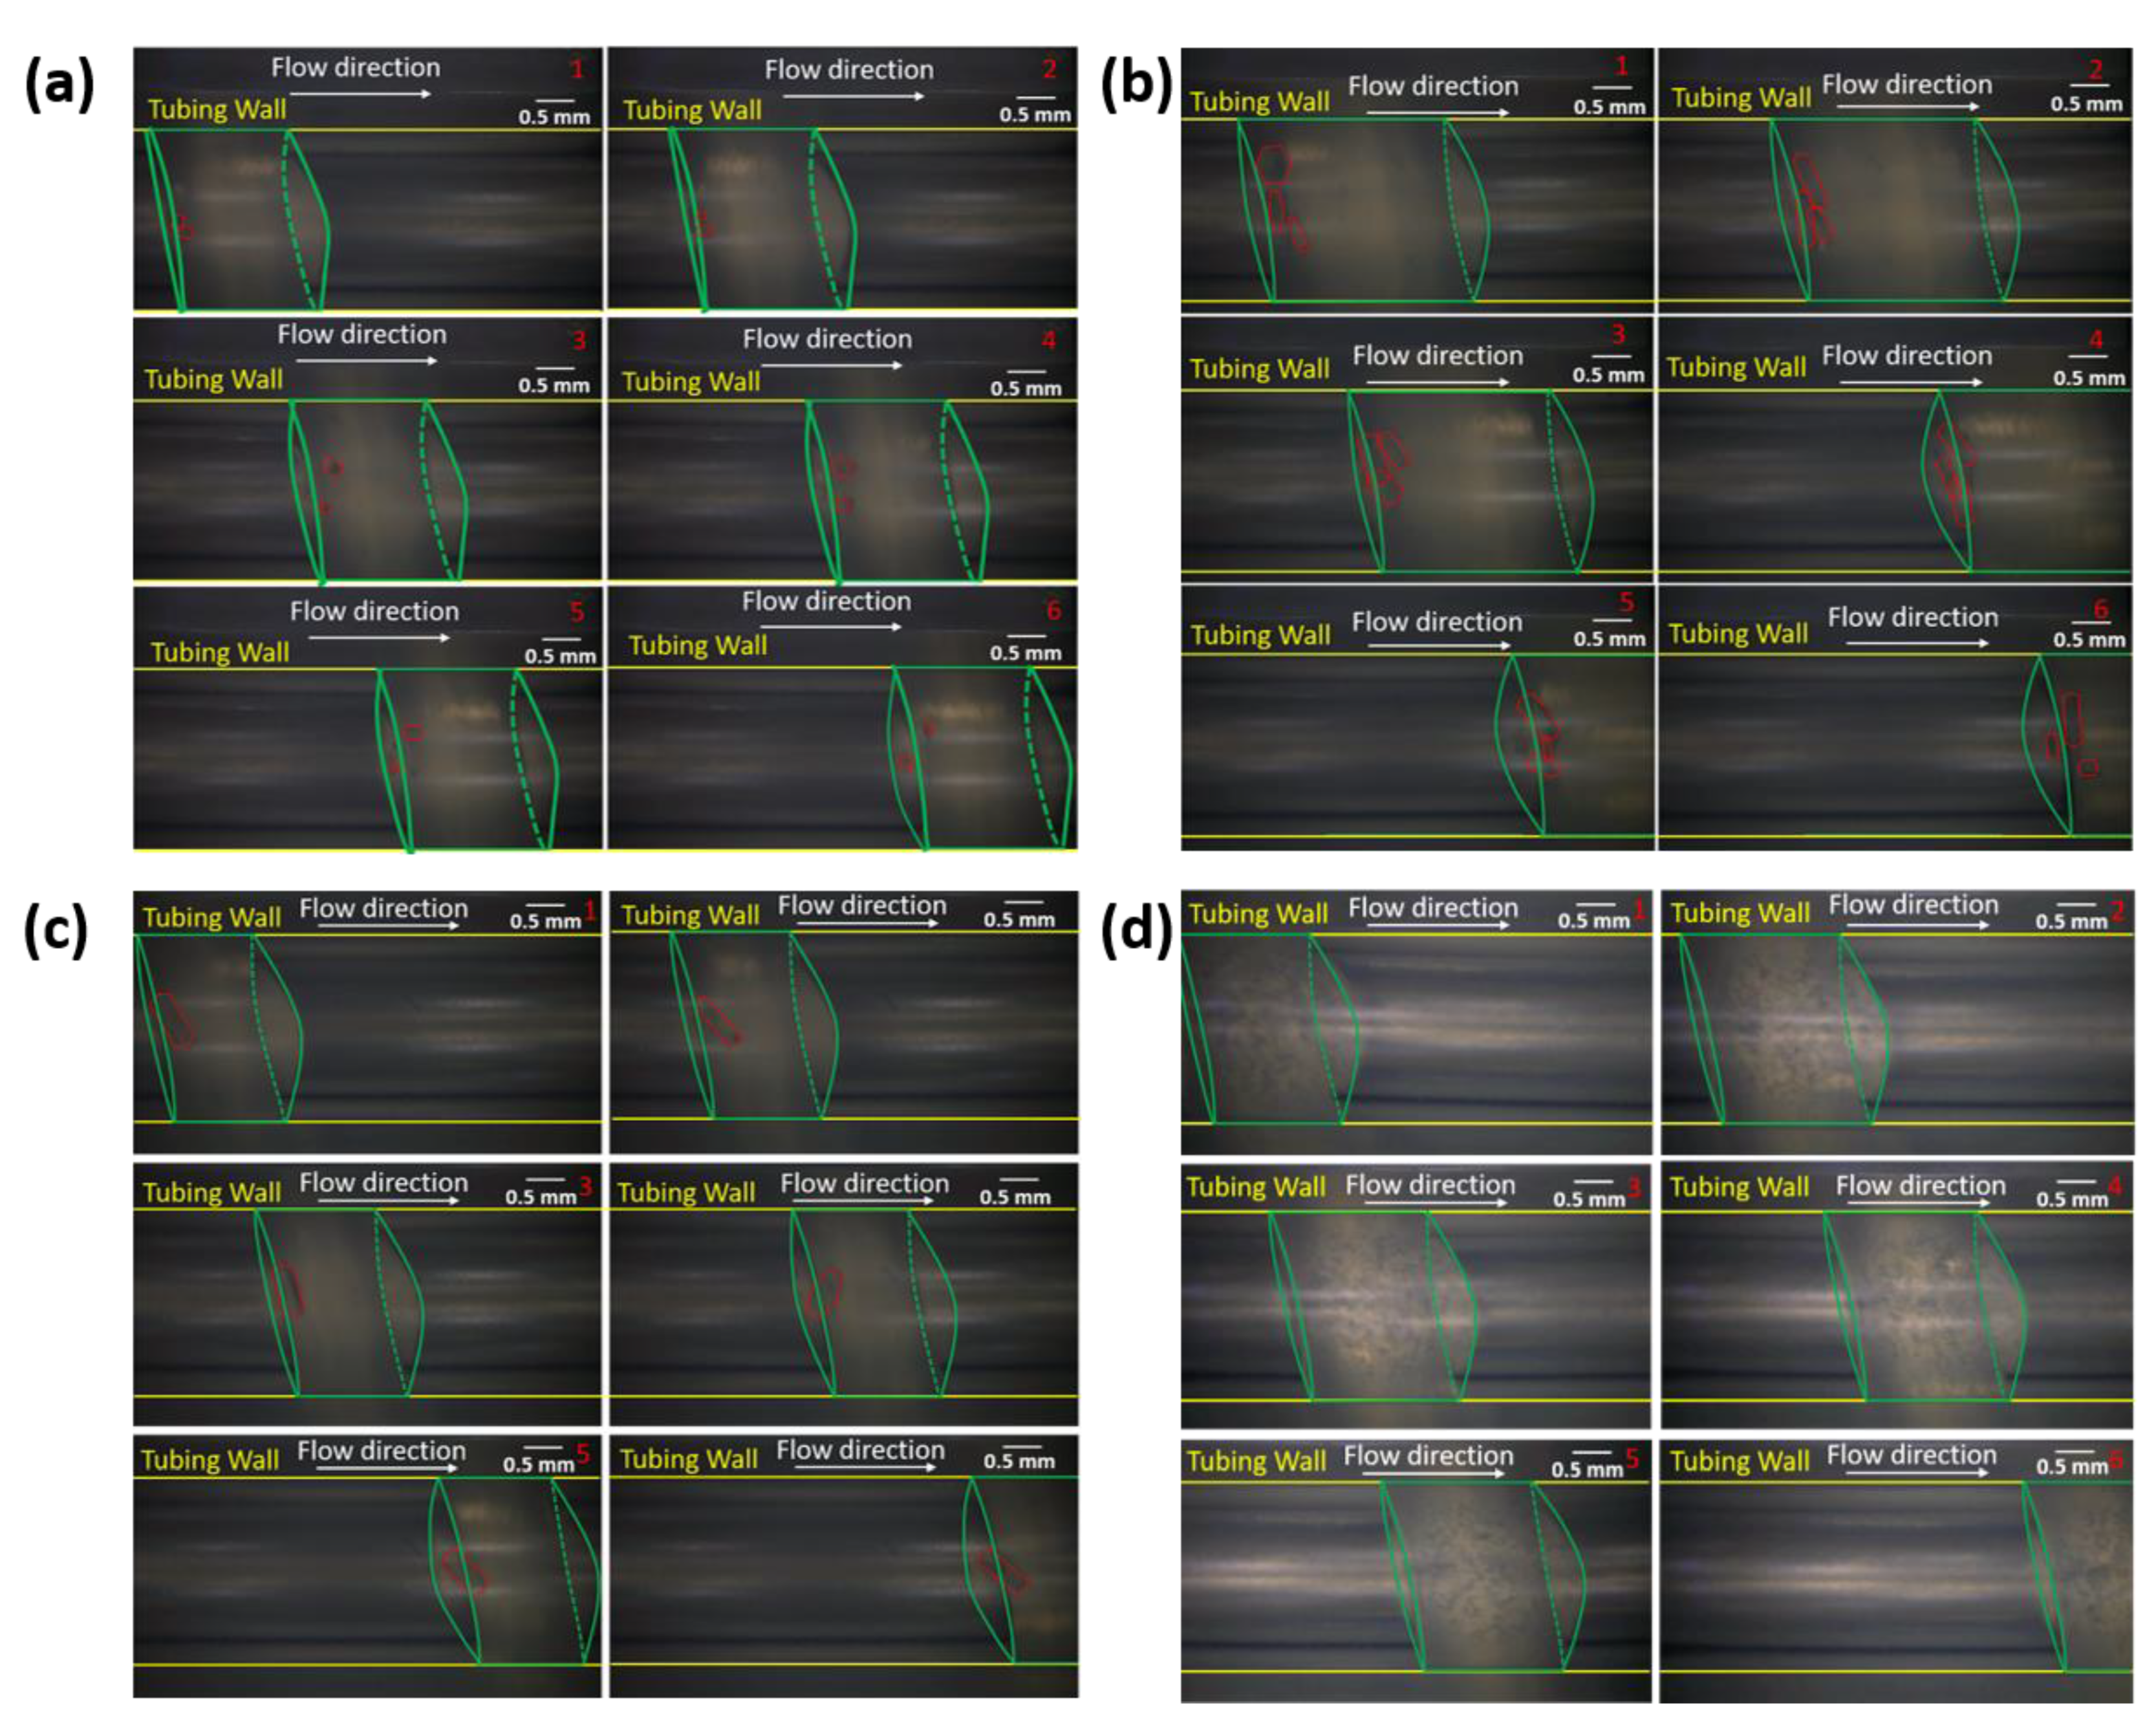
Frame to frame image of slug flow under Conditions (a) 1, (b) 2, (c) 3, and (d) 4. The interval between adjacent images is 1/30 s. The flow direction is from left to right. Slurry slug and crystals are delineated approximately. Except for Condition 4, the small dark particles inside the slug are glycine crystals. The crystals size and location variation from frame to frame indicate that the crystals were circulating in the tail end region of each slug. Some delineated particles seem out of the slurry periphery because of the relative position variation between the microscope and slug. Scale bar is 0.5 mm.
Figure 8.
Frame to frame image of slug flow under Conditions (a) 1, (b) 2, (c) 3, and (d) 4. The interval between adjacent images is 1/30 s. The flow direction is from left to right. Slurry slug and crystals are delineated approximately. Except for Condition 4, the small dark particles inside the slug are glycine crystals. The crystals size and location variation from frame to frame indicate that the crystals were circulating in the tail end region of each slug. Some delineated particles seem out of the slurry periphery because of the relative position variation between the microscope and slug. Scale bar is 0.5 mm.


Table 1.
Experimental conditions for cooling crystallization in slug flow and batches. Conditions 1–5 (denoted as Con 1–5) are in slug flow. Conditions 1–3 are at 3 different slug aspect ratios, with all other conditions the same, and no secondary nucleation. Conditions 1 and 4 are at different starting concentration and temperatures, with all other conditions the same (including the slug aspect ratio of 0.8). Condition 5 is a scale-up experiment of Condition 1. Batches 1–3 are the batch crystallization of different total volume. The maximum supersaturation is based on the starting concentration in Table 1 and the solubility profile in Figure S1. The slug aspect ratio is defined as the ratio between slug length along with the tubing to tubing inner diameter.
| Condition Number | Con 1 | Con 2 | Con 3 | Con 4 | Con 5 | Batch 1 | Batch 2 | Batch 3 |
|---|---|---|---|---|---|---|---|---|
| Total solution volume (mL) | 5 | 5 | 5 | 5 | 50 | 1 | 5 | 50 |
| Concentration of hot solution (g/g water) | 0.32 | 0.32 | 0.32 | 0.39 | 0.32 | 0.32 | 0.32 | 0.32 |
| Initial temperature (°C) | 40 | 40 | 40 | 50 | 40 | 40 | 40 | 40 |
| Maximum relative supersaturation (unit: 1) | 2.68 | 2.68 | 2.68 | 3.23 | 2.68 | 2.68 | 2.68 | 2.68 |
| Volumetric flow rate of hot solution (mL/min) | 3.0 | 4.0 | 2.6 | 3.0 | 3.0 | NA | NA | NA |
| Rotation speed of peristaltic pump (RPM) | 22 | 22 | 24 | 22 | 22 | NA | NA | NA |
| Slug aspect ratio | 0.8 | 1.2 | 0.6 | 0.8 | 0.8 | NA | NA | NA |
Table 2.
Crystal size statistics for cooling crystallization in slug flow and batches. The total number of crystals (N) for statistical analysis is included. Definition of length and width is the same as in the book [34]., and width is perpendicular to the length on the image. For all these crystals, their standard deviation (SD) and the coefficient of variation (COV) of both the length and width are also included here. The average crystal growth rate is estimated by dividing the mean crystal length (for that specific condition) by the growth time of 10 min.
| Condition Number | Con 1 | Con 2 | Con 3 | Con 4 | Con 5 | Batch 1 | Batch 2 | Batch 3 |
|---|---|---|---|---|---|---|---|---|
| Portion of slugs/batches with primary nucleation | ~80% | ~90% | ~30% | ~100% | ~90% | 100% | 100% | 100% |
| Short-term yield ii of nucleated slugs/batches | 24.1 | 26.3 | 19.7 | 36.7 | 26.8 | 6.40 | 4.95 | 1.43 |
| Total number of crystals, N i | 97 | 67 | 17 | 48 | 159 | 155 | 205 | 29 |
| Mean length (mm) | 0.62 | 0.63 | 0.86 | 0.11 | 0.71 | 0.08 | 0.05 | 0.03 |
| SD, length (mm) | 0.21 | 0.23 | 0.26 | 0.05 | 0.21 | 0.06 | 0.04 | 0.01 |
| Mean width (mm) | 0.34 | 0.33 | 0.46 | 0.04 | 0.41 | 0.03 | 0.02 | 0.02 |
| SD, width (mm) | 0.13 | 0.12 | 0.09 | 0.03 | 0.16 | 0.03 | 0.02 | 0.00 |
| COV in length | 0.34 | 0.37 | 0.30 | 0.48 | 0.29 | 0.73 | 0.77 | 0.32 |
| COV in width | 0.37 | 0.36 | 0.20 | 0.69 | 0.39 | 0.86 | 1.02 | 0.27 |
| Average growth rate (μm/min) | 62 | 63 | 86 | 11 | 71 | 8 | 5 | 3 |
i N for Condition 1–3, 5 represents the total crystal number from off-line images of all slugs. N for Condition 4 and all batches counts the total crystals from one representative image. ii The short-term yield calculation is the same as yield except for using crystals after 10 min (residence time), instead of waiting longer for equilibrium (theoretical yield). Here, the theoretical yield is 30.2% except for Condition 4.
© 2019 by the authors. Licensee MDPI, Basel, Switzerland. This article is an open access article distributed under the terms and conditions of the Creative Commons Attribution (CC BY) license (http://creativecommons.org/licenses/by/4.0/).
Share and Cite
MDPI and ACS Style
Mou, M.; Li, H.; Yang, B.-S.; Jiang, M. Continuous Generation of Millimeter-Sized Glycine Crystals in Non-Seeded Millifluidic Slug Flow. Crystals 2019, 9, 412. https://0-doi-org.brum.beds.ac.uk/10.3390/cryst9080412
AMA Style
Mou M, Li H, Yang B-S, Jiang M. Continuous Generation of Millimeter-Sized Glycine Crystals in Non-Seeded Millifluidic Slug Flow. Crystals. 2019; 9(8):412. https://0-doi-org.brum.beds.ac.uk/10.3390/cryst9080412
Chicago/Turabian StyleMou, Mingyao, Huayu Li, Bing-Shiou Yang, and Mo Jiang. 2019. "Continuous Generation of Millimeter-Sized Glycine Crystals in Non-Seeded Millifluidic Slug Flow" Crystals 9, no. 8: 412. https://0-doi-org.brum.beds.ac.uk/10.3390/cryst9080412
Note that from the first issue of 2016, this journal uses article numbers instead of page numbers. See further details here.