Our purpose was to elaborate a one pot synthesis for the preparation of PCLD and sucrose containing polyurethane networks with regular structures and to improve their physical and chemical properties, such as swelling and flexibility for biological applications.
During the synthesis there was no weight loss, indicating that all reactants were built in the SPUR networks formed. This finding agrees well with the results from the swelling experiments (see later).
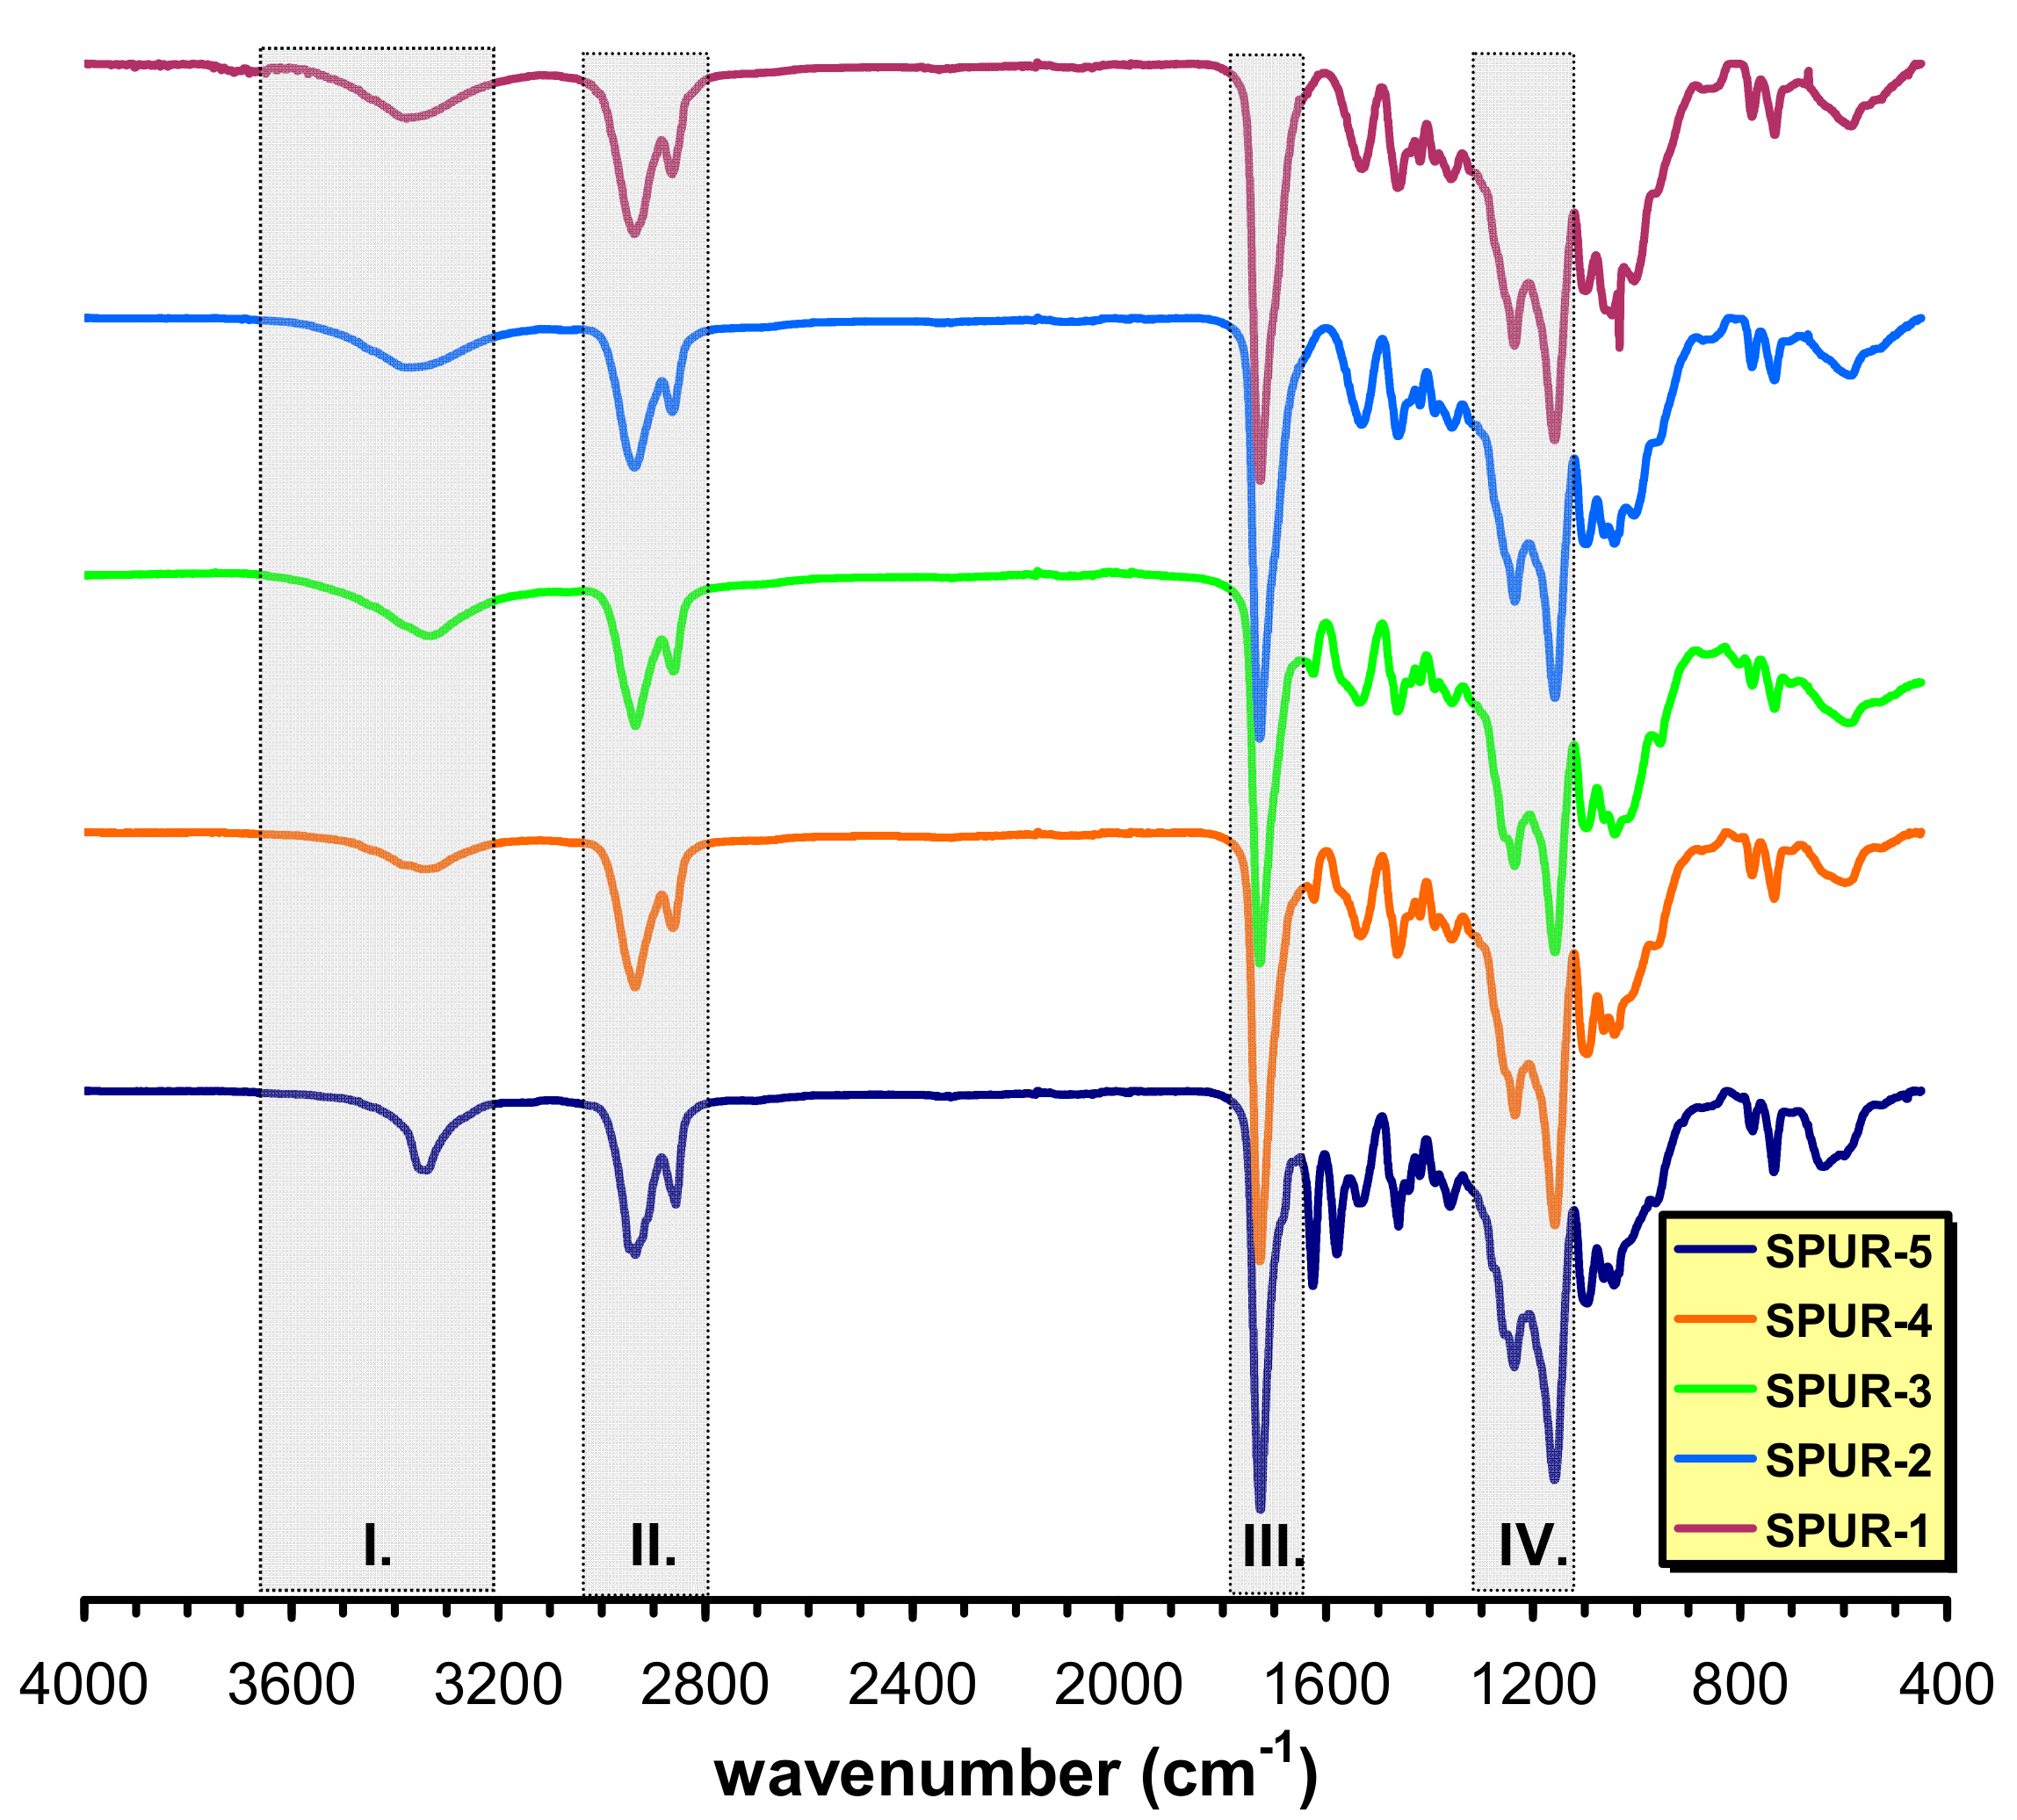
3.1. Infrared Spectroscopy of the SPUR Samples
In order to get information on the molecular structures of the SPUR networks formed Attenuated Total Reflectance Fourier-Transform Infrared (ATR-FTIR) spectra were recorded (
Figure 1).
As seen in
Figure 1, the intermolecularly bonded OH stretching, which might overlap with the NH stretching vibrations, especially at lower prepolymer/sucrose molar ratios, occur in the range of 3358–3334 cm
−1 (shaded area I). A double band at 2937 and 2863 cm
−1 (shaded area II) and at 1361 cm
−1 belonging to CH
2 stretching and bending vibrations, respectively can also be observed and a strong absorption band of C=O stretching is visible at 1727 cm
−1 (shaded area III). An absorption band at 1537 cm
−1 is attributed to the C-N stretching. The presence of this band in the ATR-FTIR spectrum confirms the formation of polyurethane linkages. The =C-O/-C-O-C- vibrations are assigned to appear in the range of 1150–1230 cm
−1 (shaded area IV). In addition, no absorption can be seen at around 2275–2230 cm
−1 (i.e., no absorption in the 2750–1850 cm
−1 region), indicating no residual isocyanate groups present after 24 h of curing at 60 °C.
3.2. MALDI-TOF MS Investigations
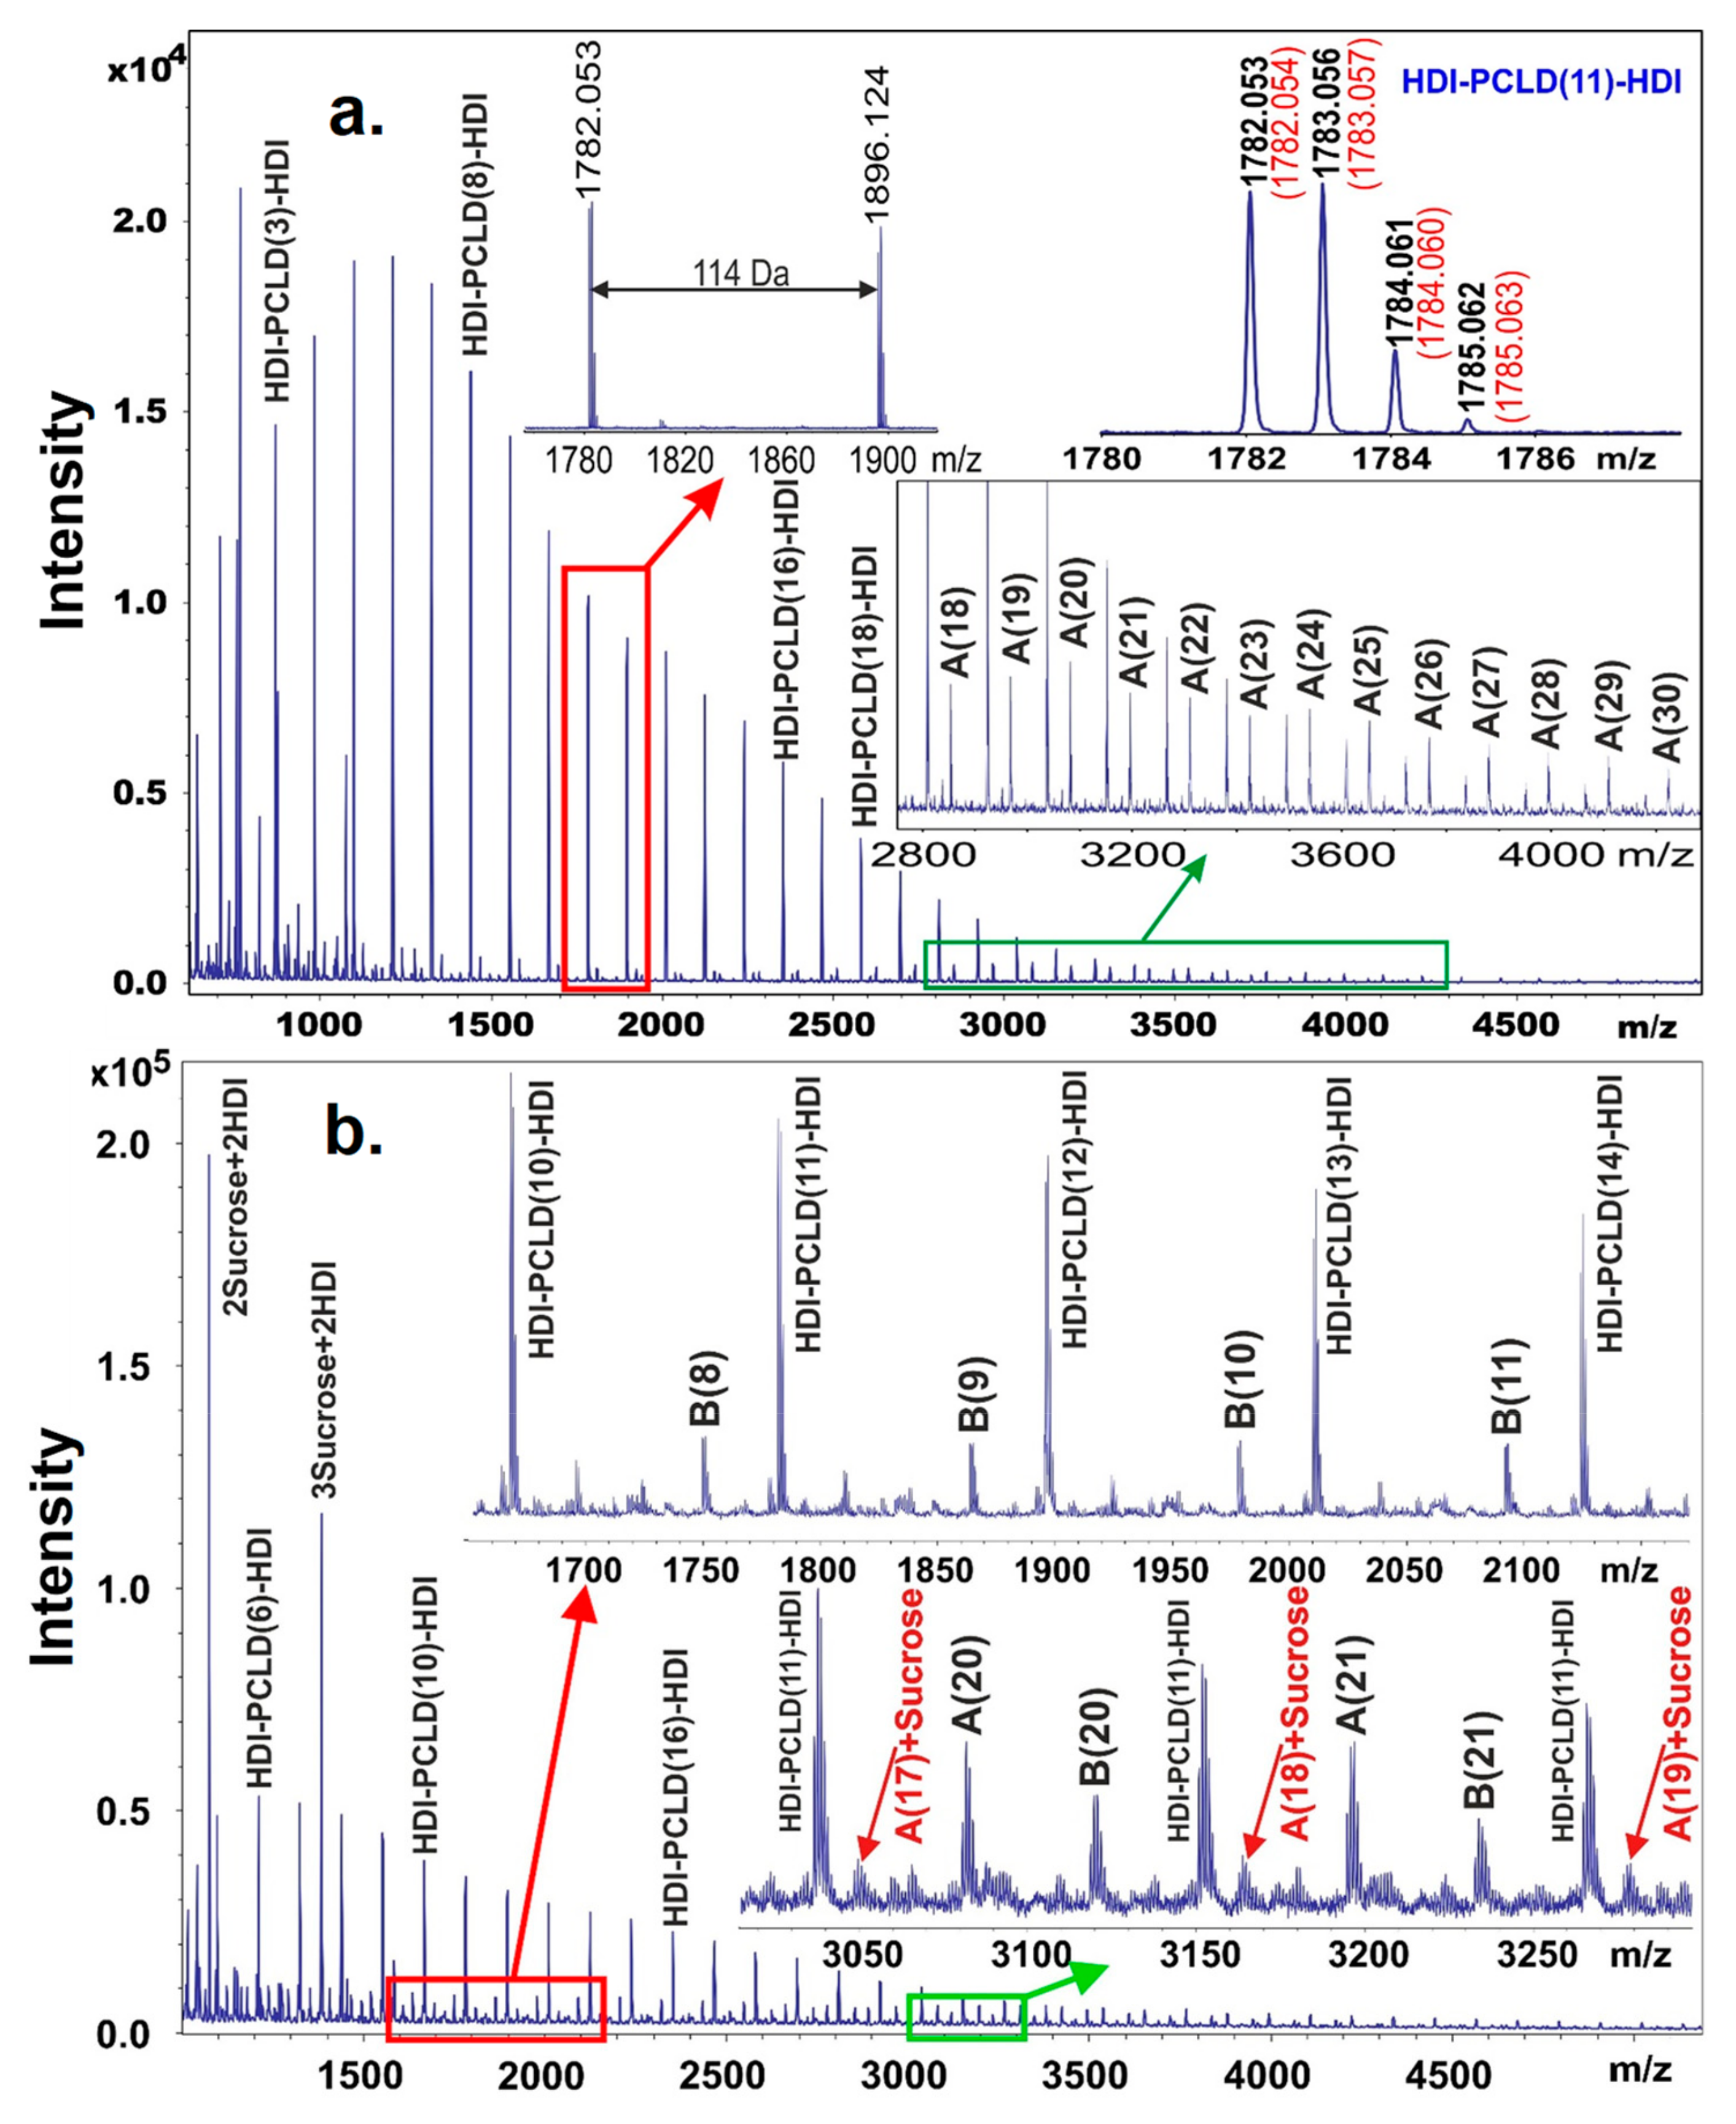
The MALDI-TOF MS spectrum obtained on the prepolymer poly(ε-caprolactone)-diol (PCLD) with two HDI end-groups is shown in
Figure 2. Prior to recording the MALDI-TOF mass spectrum the free isocyanate groups in the prepolymer were reacted with methanol in order to prevent further reaction of the free isocyanate groups with the matrix molecules. Furthermore, to enhance the cationization and to obtain mainly sodiated oligomers, sodium trifluoroacetate was added to the reaction mixture. As seen in
Figure 2, the mass difference between the neighboring peaks is 114 Da that corresponds to the mass of a caprolactone repeat unit.
Furthermore, the measured masses match those of the PCLD with two HDI and two methanol units as expected for a prepolymer HDI-PCLD-HDI. For example, as illustrated in the top right corner of
Figure 2a. inset, the measured monoisotopic mass at
m/
z 1782.053 is in line with that found for the composition [C
89H
154N
4O
30+Na]
+ (
m/
z 1782.054). On the other hand, as seen in the zoomed MALDI-TOF MS spectrum (
Figure 2a., in the range of
m/
z 2800–4000) in addition to the main series, series A corresponding to a HDI-PCLD-HDI-PCLD-HDI oligomer series also appeared.
In the next synthetic step the resulting prepolymer was further reacted with sucrose in DMSO. After a short reaction time, in order to avoid considerable cross-linking, a sample was withdrawn from the reaction mixture and analyzed by MALDI-TOF MS to prove that successful coupling reactions have been taken place between the prepolymer and sucrose. Indeed, as it turns out from
Figure 2b, series B appeared in the MALDI-TOF MS spectrum, which was identified as HDI-PCLD-HDI-Sucrose oligomers. Furthermore, at higher masses, series A reacted with sucrose was also detected as demonstrated in the lower inset of
Figure 2b. In the low mass region of the MALDI-TOF MS spectrum products resulting from the reaction of sucrose with HDI, i.e., sucrose + HDI containing no PCLD oligomer were also detected. This latter finding is very intriguing, since two sucrose + 2HDI and three sucrose + 2 HDI were also formed as seen in
Figure 2b. Thus, the presence of these compounds in the reaction mixture indicates that albeit sucrose has eight OH groups to be reacted with the isocyanate, they are not equally reactive. Furthermore, it seems unambiguous from these findings that two of these OH groups are more reactive than the others thus yielding linear versions of sucrose + HDI oligomers at the early stage of the reaction. This finding has also consequence on the cross-linking process with sucrose that will be discussed later.
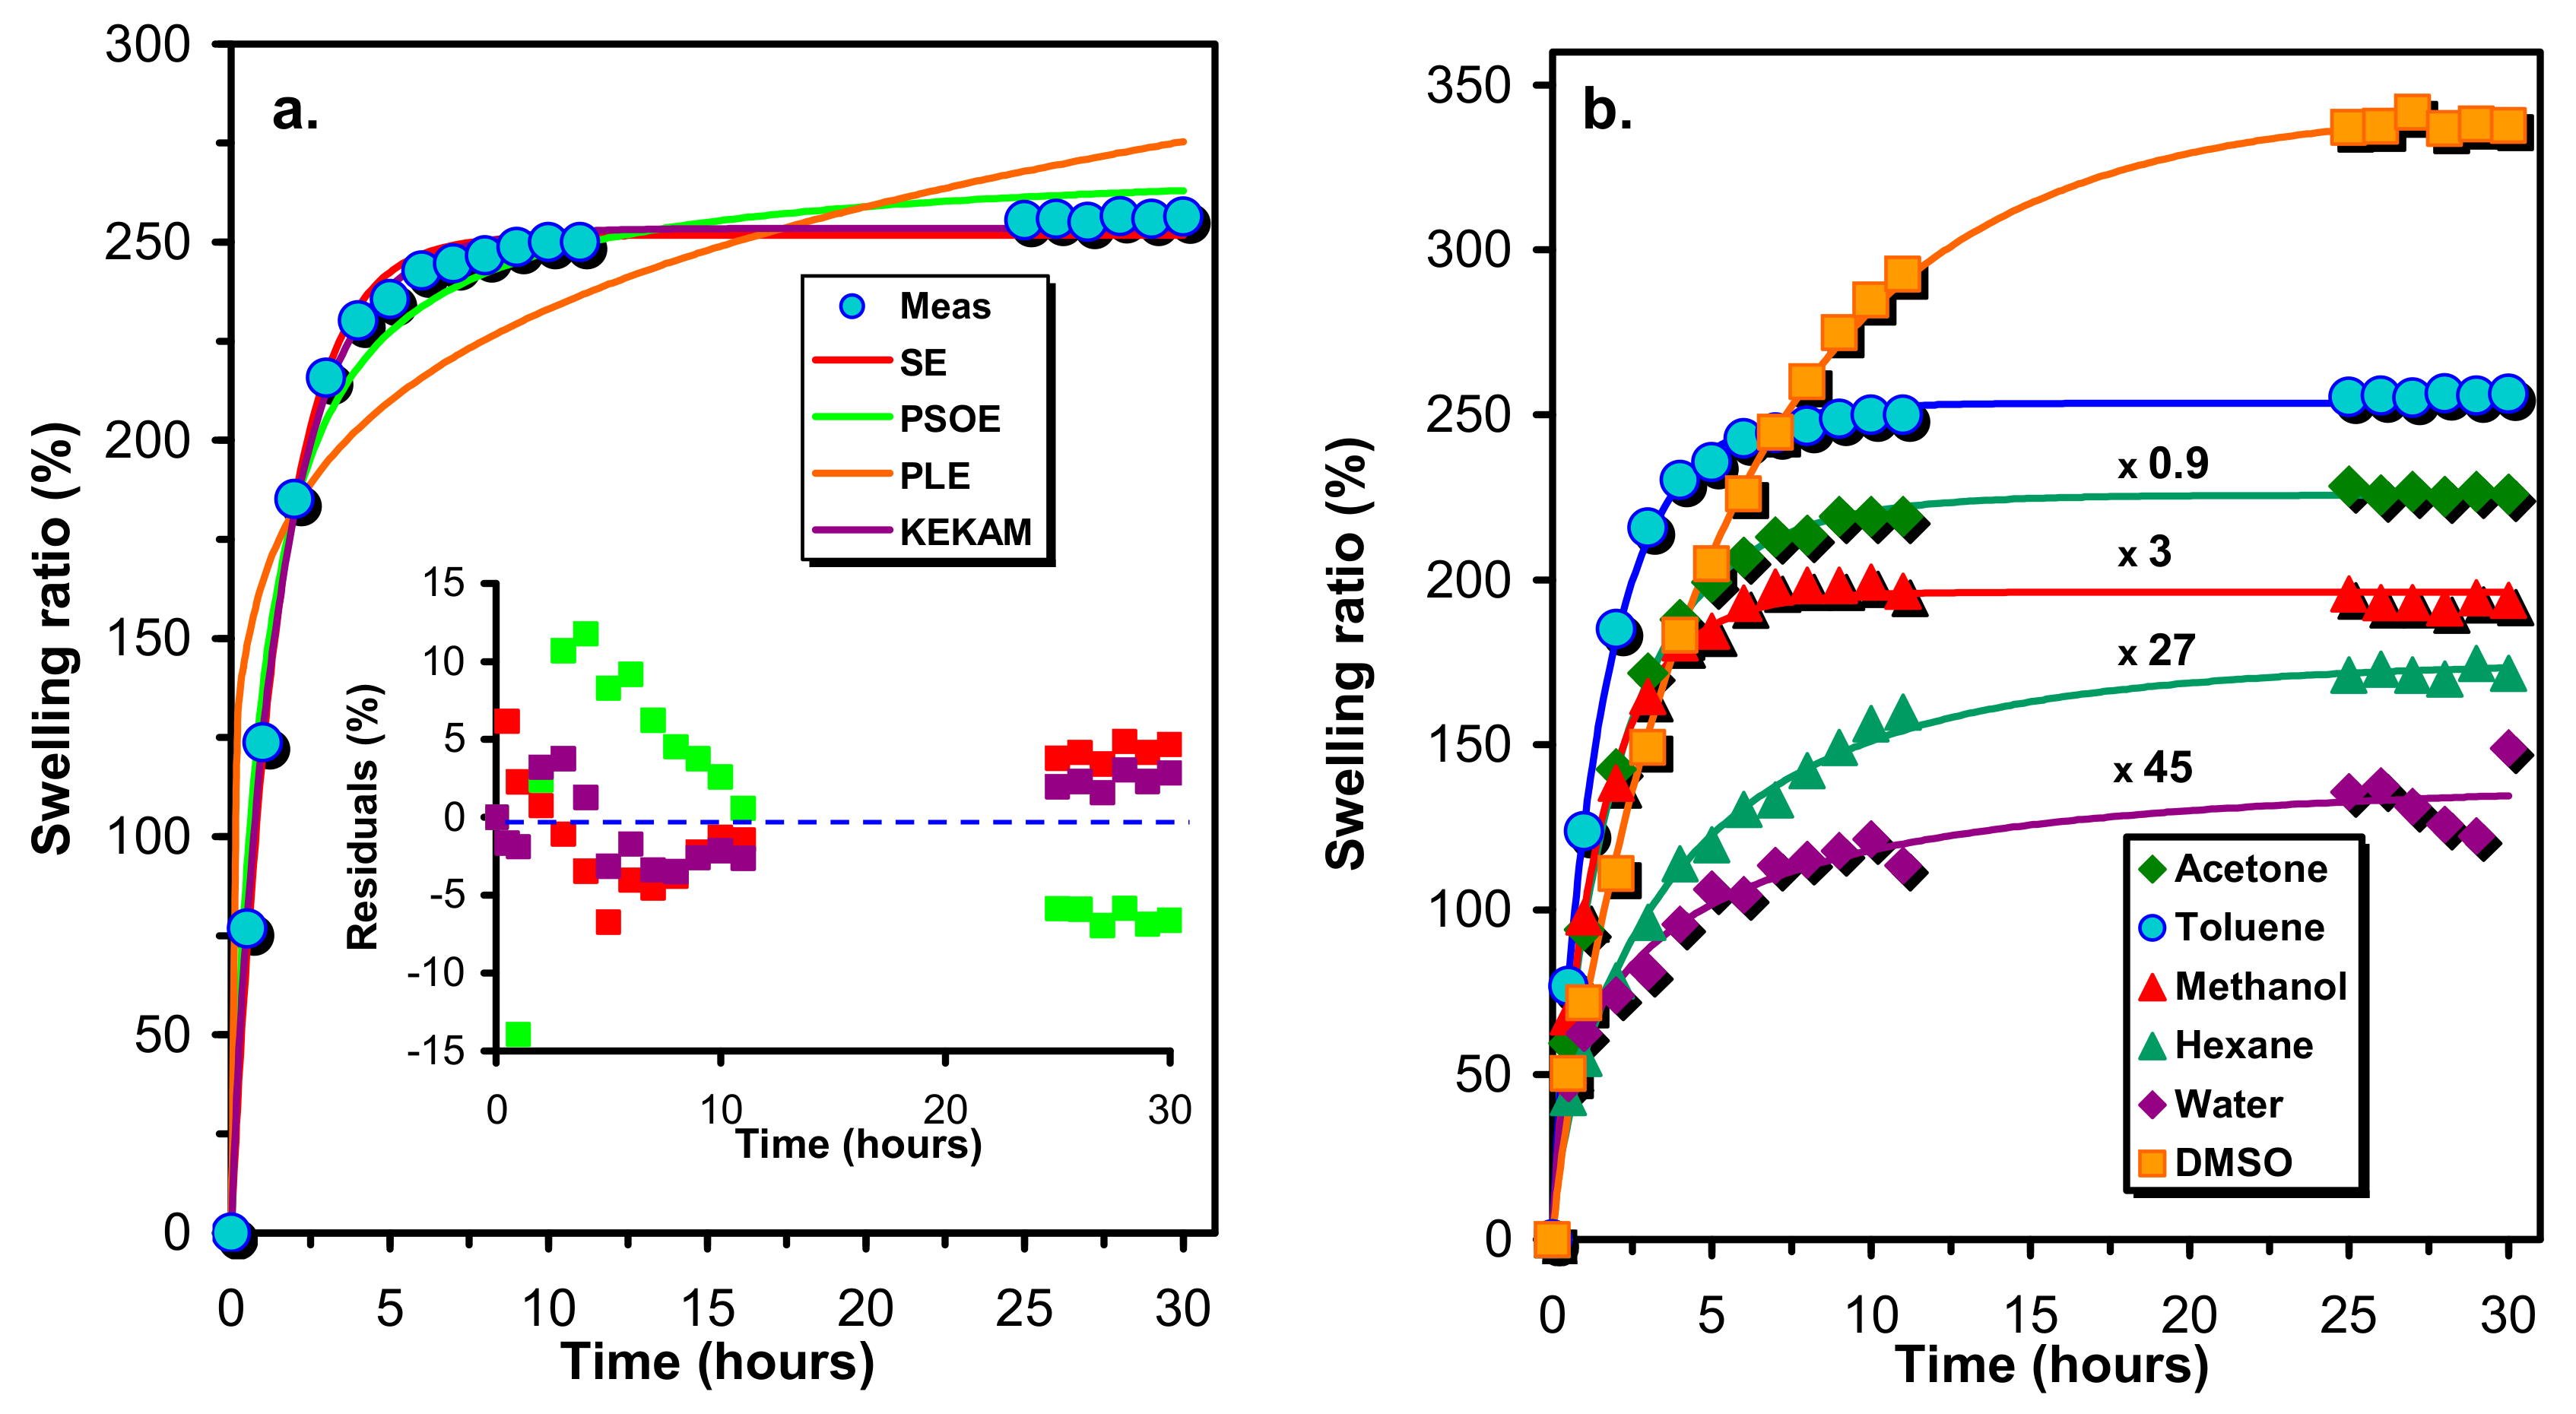
3.3. Swelling Experiments
In order to gain insight into the crosslink densities and the nature of the network formed by the reaction of the prepolymer HDI-PCLD-HDI with sucrose, the resulting crosslinked polymers were swollen with solvents (such as n-hexane, toluene, acetone, methanol, DMSO and water) of different polarities and solubility parameters. The swelling of the SPUR samples was followed in time by measuring the weight of the swollen samples with respect to those of the dry ones and the swelling ratios (%) as a function of the time were plotted (
Figure 3). To describe the swelling ratio (%) (Q) versus time curves various models were tried to fit to the experimental data. The investigated models included the single exponential (SE, Equation (4)), the integrated form of the pseudo second order rate equation (PSOE, Equation (5)) [
15], the power law equation (PLE, Equation (6)) [
16] and the stretched exponential function of Kolmogorov, Erofeev, Kozeeva, Avrami, Mampel (KEKAM, Equation (7)) [
17].
where
k and
A are the rate coefficients and the equilibrium value of
Q respectively, while
A and γ stand for the constant of the stretched exponential function.
Figure 3a illustrates the results of fitting of Equations (4)–(7) to the experimental swelling ratios (%) versus time data obtained for the sample SPUR-4 and
Figure 3a demonstrates the differences (residuals) between the fitted and the experimental data.
As seen in
Figure 3a, the PLE model (Equation (6)) is unable to render the main characteristics of the experimental swelling ratio (%)-time dependences, whereas the other three models may give acceptable fitting. However, as it turns out from
Figure 3a, KEKAM model (Equation (7)) provides the best fitting and this finding is also true for the rest of the SPUR samples investigated. Thus, the KEKAM model was applied for the description of the swelling properties of these polymer samples. As seen in
Figure 3b, Equation (7) is indeed capable of the description of the variation of the swelling ratio with the time for various solvents. The parameters of the KEKAM model obtained by fitting it to the experimental data are compiled in
Supplementary Table S1. According to the data of
Table S1, the value of the parameter
γ is around 0.8 independently of the solvent, while values of
k are spannig from 0.16 to 1.65, however, no rigorous relationships can be established between these values and the degrees of crosslinks.
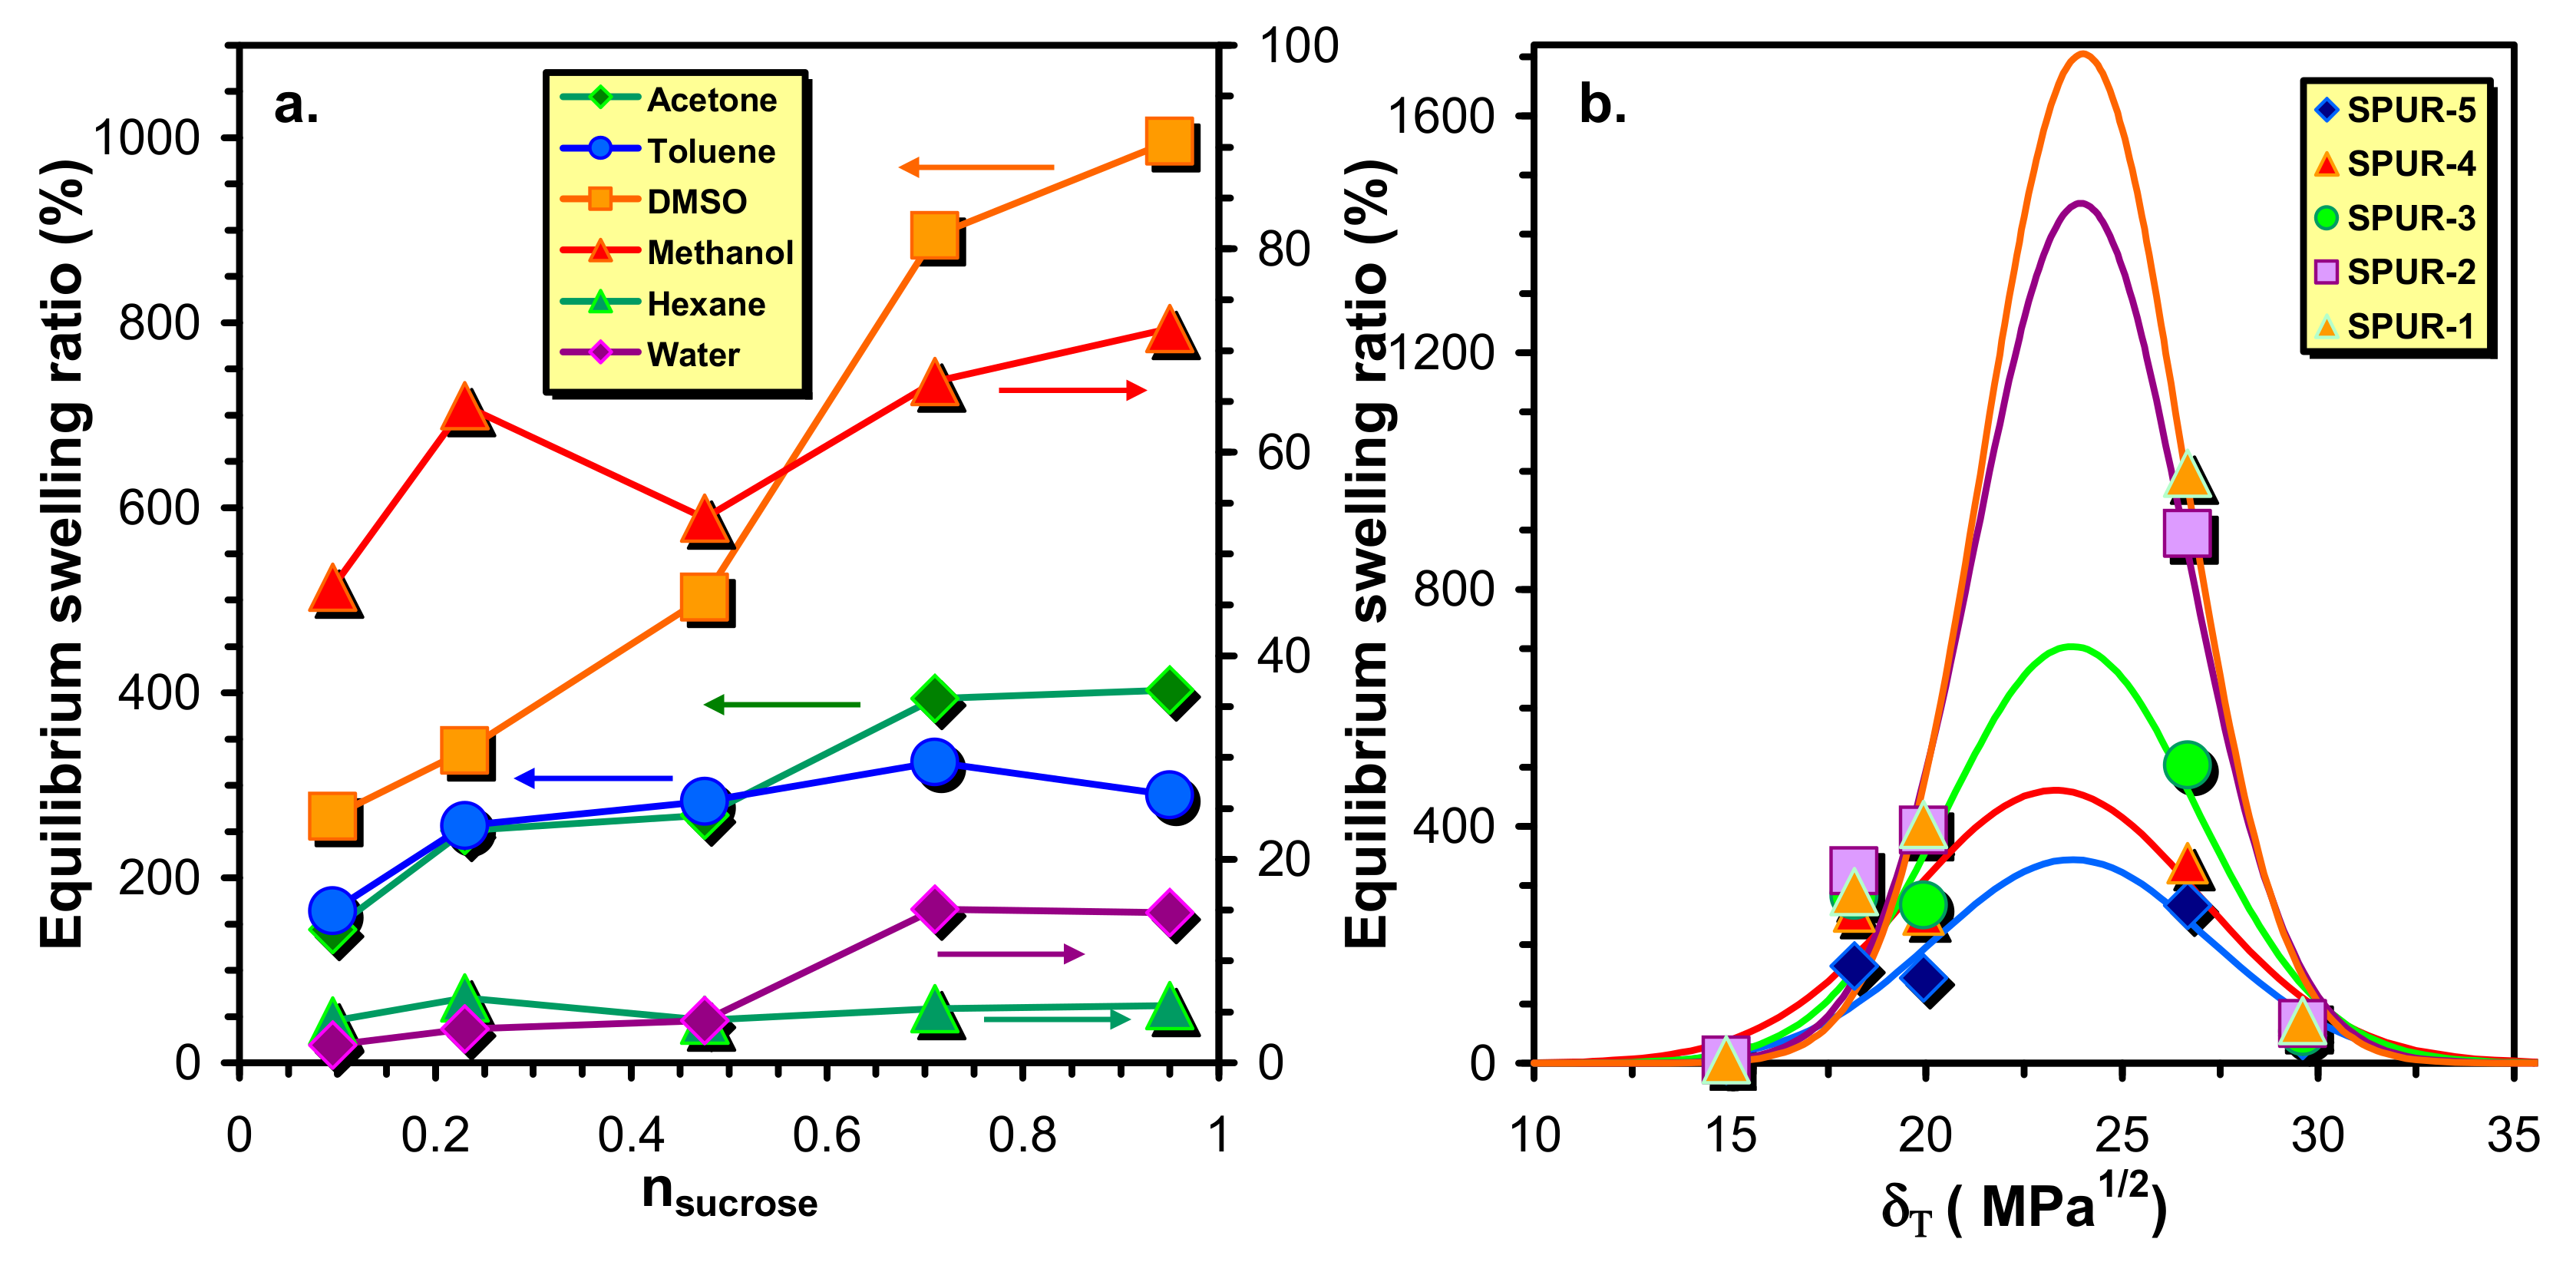
In
Figure 4a the variations of the equilibrium swelling ratios (
Qe) with the molar ratios of sucrose to that of prepolymer HDI-PCLD-HDI are plotted. As a general trend, it was found that the values of
Qe decrease with the sucrose molar ratio from which it can be surmised that the crosslink densities also decrease with the increasing sucrose content. An explanation for this unusual finding will be given later. Furthermore, it is also evident from
Figure 4a that the
Qe –s at higher sugar content decrease in the order of DMSO > acetone > toluene > methanol > water > n-hexane, whereas at low sucrose content no considerable differences can be found in the
Qe values of acetone and toluene.
To evaluate the dependence of the equilibrium swelling ratio on the solvent, the experimental equilibrium swelling ratios were plotted as a function of the solvent solubility parameters (
δT ) and Equation (8) [
18] were fitted to these data to determine the solubility parameters of the crosslinked polymer networks (
δN).
where
Qe is the equilibrium swelling ratio, and
, in which
κ,
,
R and
T are the empirical parameter, the molar volume of the solvent, the gas-constant and the temperature, respectively.
In Equation (8), parameters
Qe at
δ = δT, δN and
ω were determined and the fitted curves by Equation (5) together with the corresponding experimental data are shown in
Figure 4b and the fitted values of the parameters are compiled in
Table 2.
It was found that the values of
δN fall into a narrow range with values of
δN = 23.3–24.0 (MPa)
1/2, i.e., crosslinking in the applied extent does not alter significantly the solubility of the polymer network formed. In addition, we have also investigated the effect of the components of the Hansen solubility parameters [
19], i.e., the dispersion
δD, the dipole
δP and hydrogen-bonded
δH solubility parameters on the swelling ratios. However, no significant correlation between the swelling ratios and the separated Hansen solubility parameters were found indicating that all of these three solubility parameters have an important role in determining the swelling properties of these polymer networks. It is to be noted that
δN values in
Table 3. were used for the determination of crosslink densities. The crosslink densities were calculated using the Flory-Rehner equation (as indicated in the Materials and Methods). The results are compiled in
Table 3.
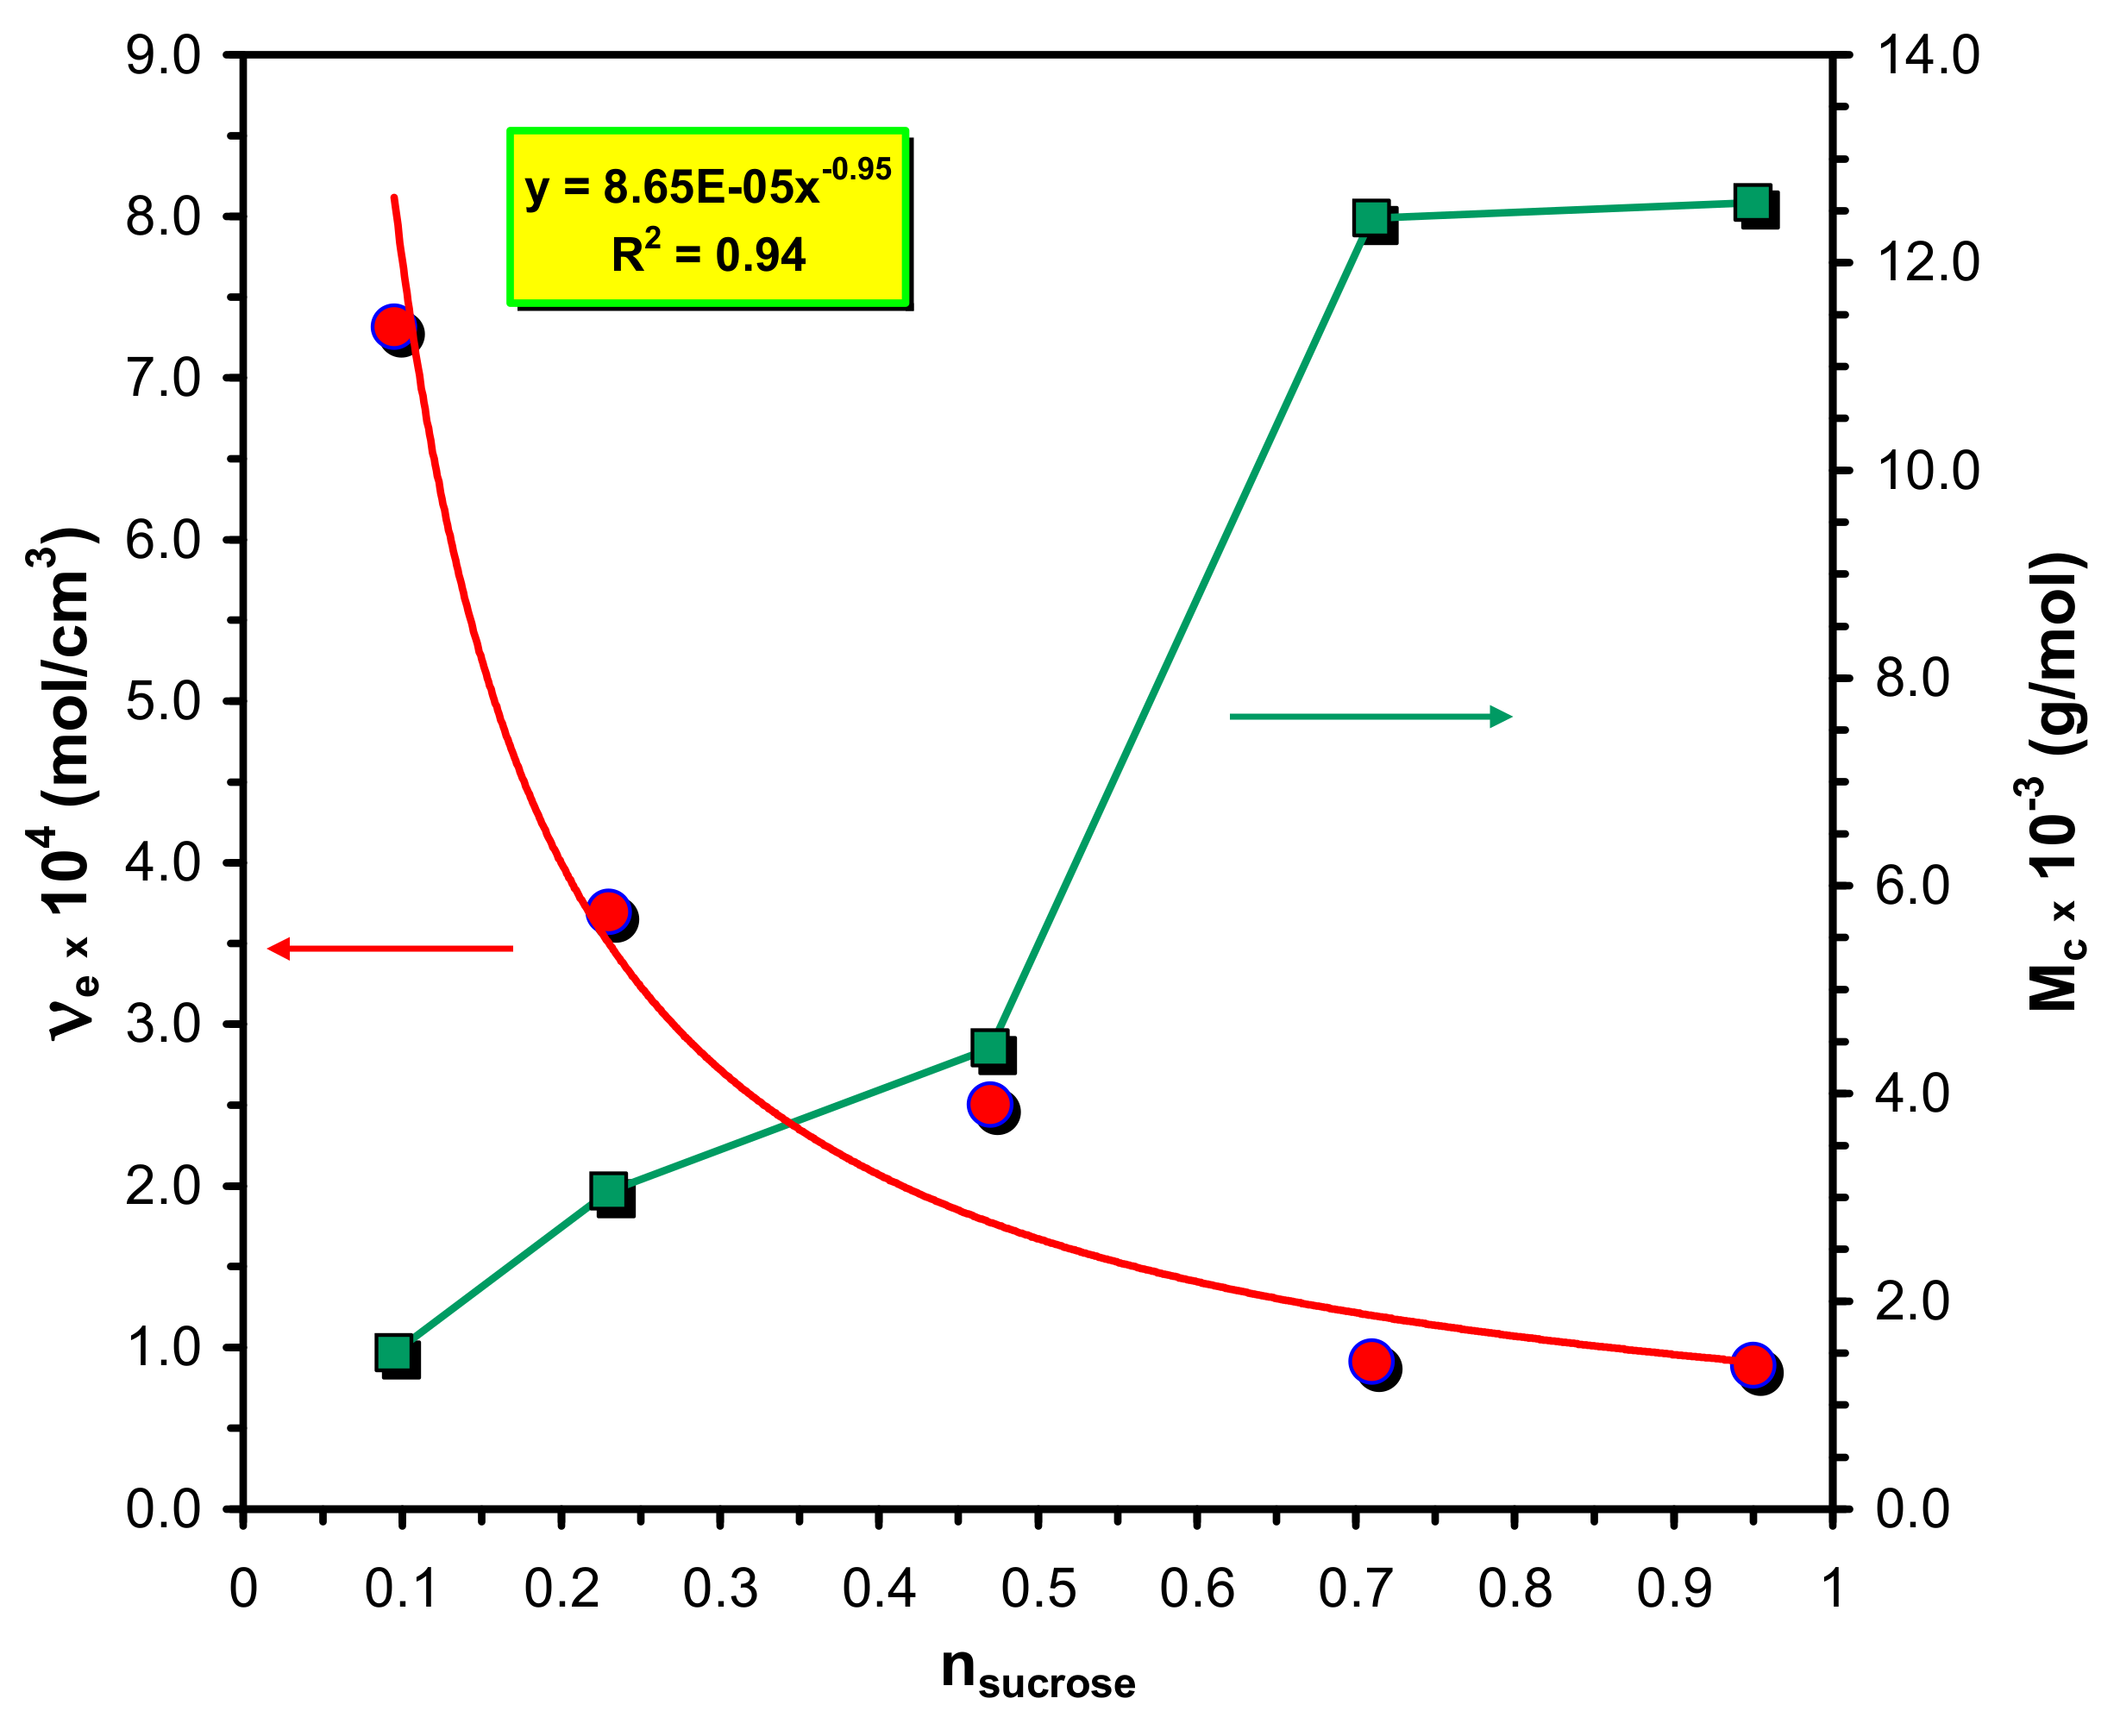
According to the data of
Table 3 the crosslink densities unexpectedly increase from 8.5 × 10
−5 mol/cm
3 to 7.3 × 10
−4 mol/cm
3 with the decreasing sucrose content and the dependence of
νe on the sucrose content can be described as
(see
Figure 5), i.e.,
νe is approximately inversely proportional to n
sucrose. Furthermore, it also turns out from the M
c data in
Table 3 that at the highest crosslink density M
c closely reflects to the M
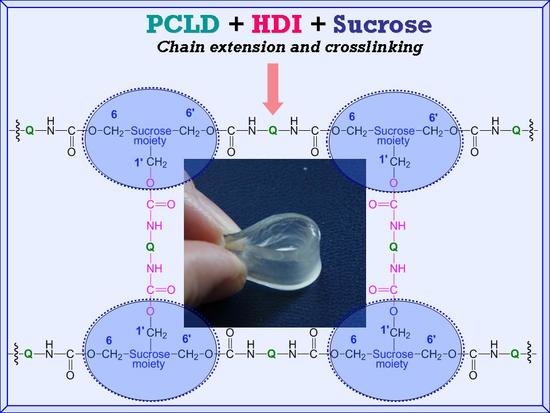
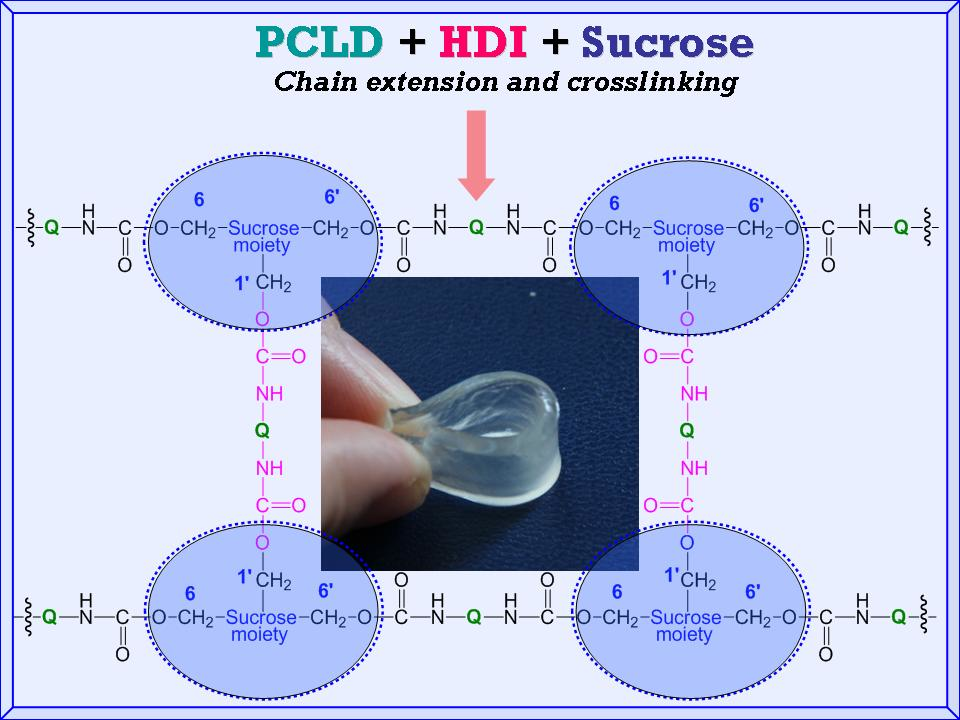
n of the PCLD segment. To interpret this unique finding one should consider that there is a competitive reaction between the isocyanate groups of the prepolymer and the OH groups of sucrose. The sucrose bears eight free OH-groups, from which three are primary OH groups (one of them is sterically hindered) and five of them are secondary OH groups. The main polymer chains of the SPUR
s are formed by the reaction of the prepolymer and the primary OH groups at the 6 and 6′ positions of sucrose. The crosslinking reaction between the main polymer chains may take place by the reaction of the free isocyanate groups of the prepolymer with the less reactive primary OH group at the 1′ position of sucrose to form the major skeleton of the SPUR networks (see
Scheme 1). Moreover, upon depleting the primary OH groups, i.e., if the prepolymer concentration is significantly higher than that of the sucrose, which is the case for the samples SPUR-3, SPUR-4 and SPUR-5, the excess of prepolymer can react with the secondary OH groups of sucrose resulting in increasing crosslink densities.
3.5. Mechanical Properties of SPURs
The data in
Table 4 shows the results of the uniaxial tensile measurements. All the polymers were very flexible and transparent before the tests.
As seen in
Table 4, all the SPUR samples show low elastic modulus and high ultimate elongation values. Elastic (Young) moduli vary in the range of 2.1–5.3 MPa according to a minimum curve depending on the composition, i.e., the crosslink density.
However, the ultimate elongation data reveals an increasing trend with the decreasing amount of sucrose (i.e., with increasing crosslink density, see
Table 3). On the other hand, more crosslink gives higher stress at break (sample SPUR-1 is an exception to that) and increasing ultimate elongation at the same time.
An attempt was made to describe the resulting stress-strain (
σ−ε) curves at low and high strains. The description of the
σ−ε relationship was based on the standard linear solid (SLS) viscoelastic model. As it was shown earlier in uniaxial tensile mode and at constant strain rate (d
ε/dt) “the equation of motion” can be given by Equation (9) [
20,
21].
where
a1,
a2 and
a3 are the parameters that contain the moduli of springs and the viscosity of the dashpot in the constitutive SLS model.
Equation can be solved analytically to obtain Equation (10).
where
,
and
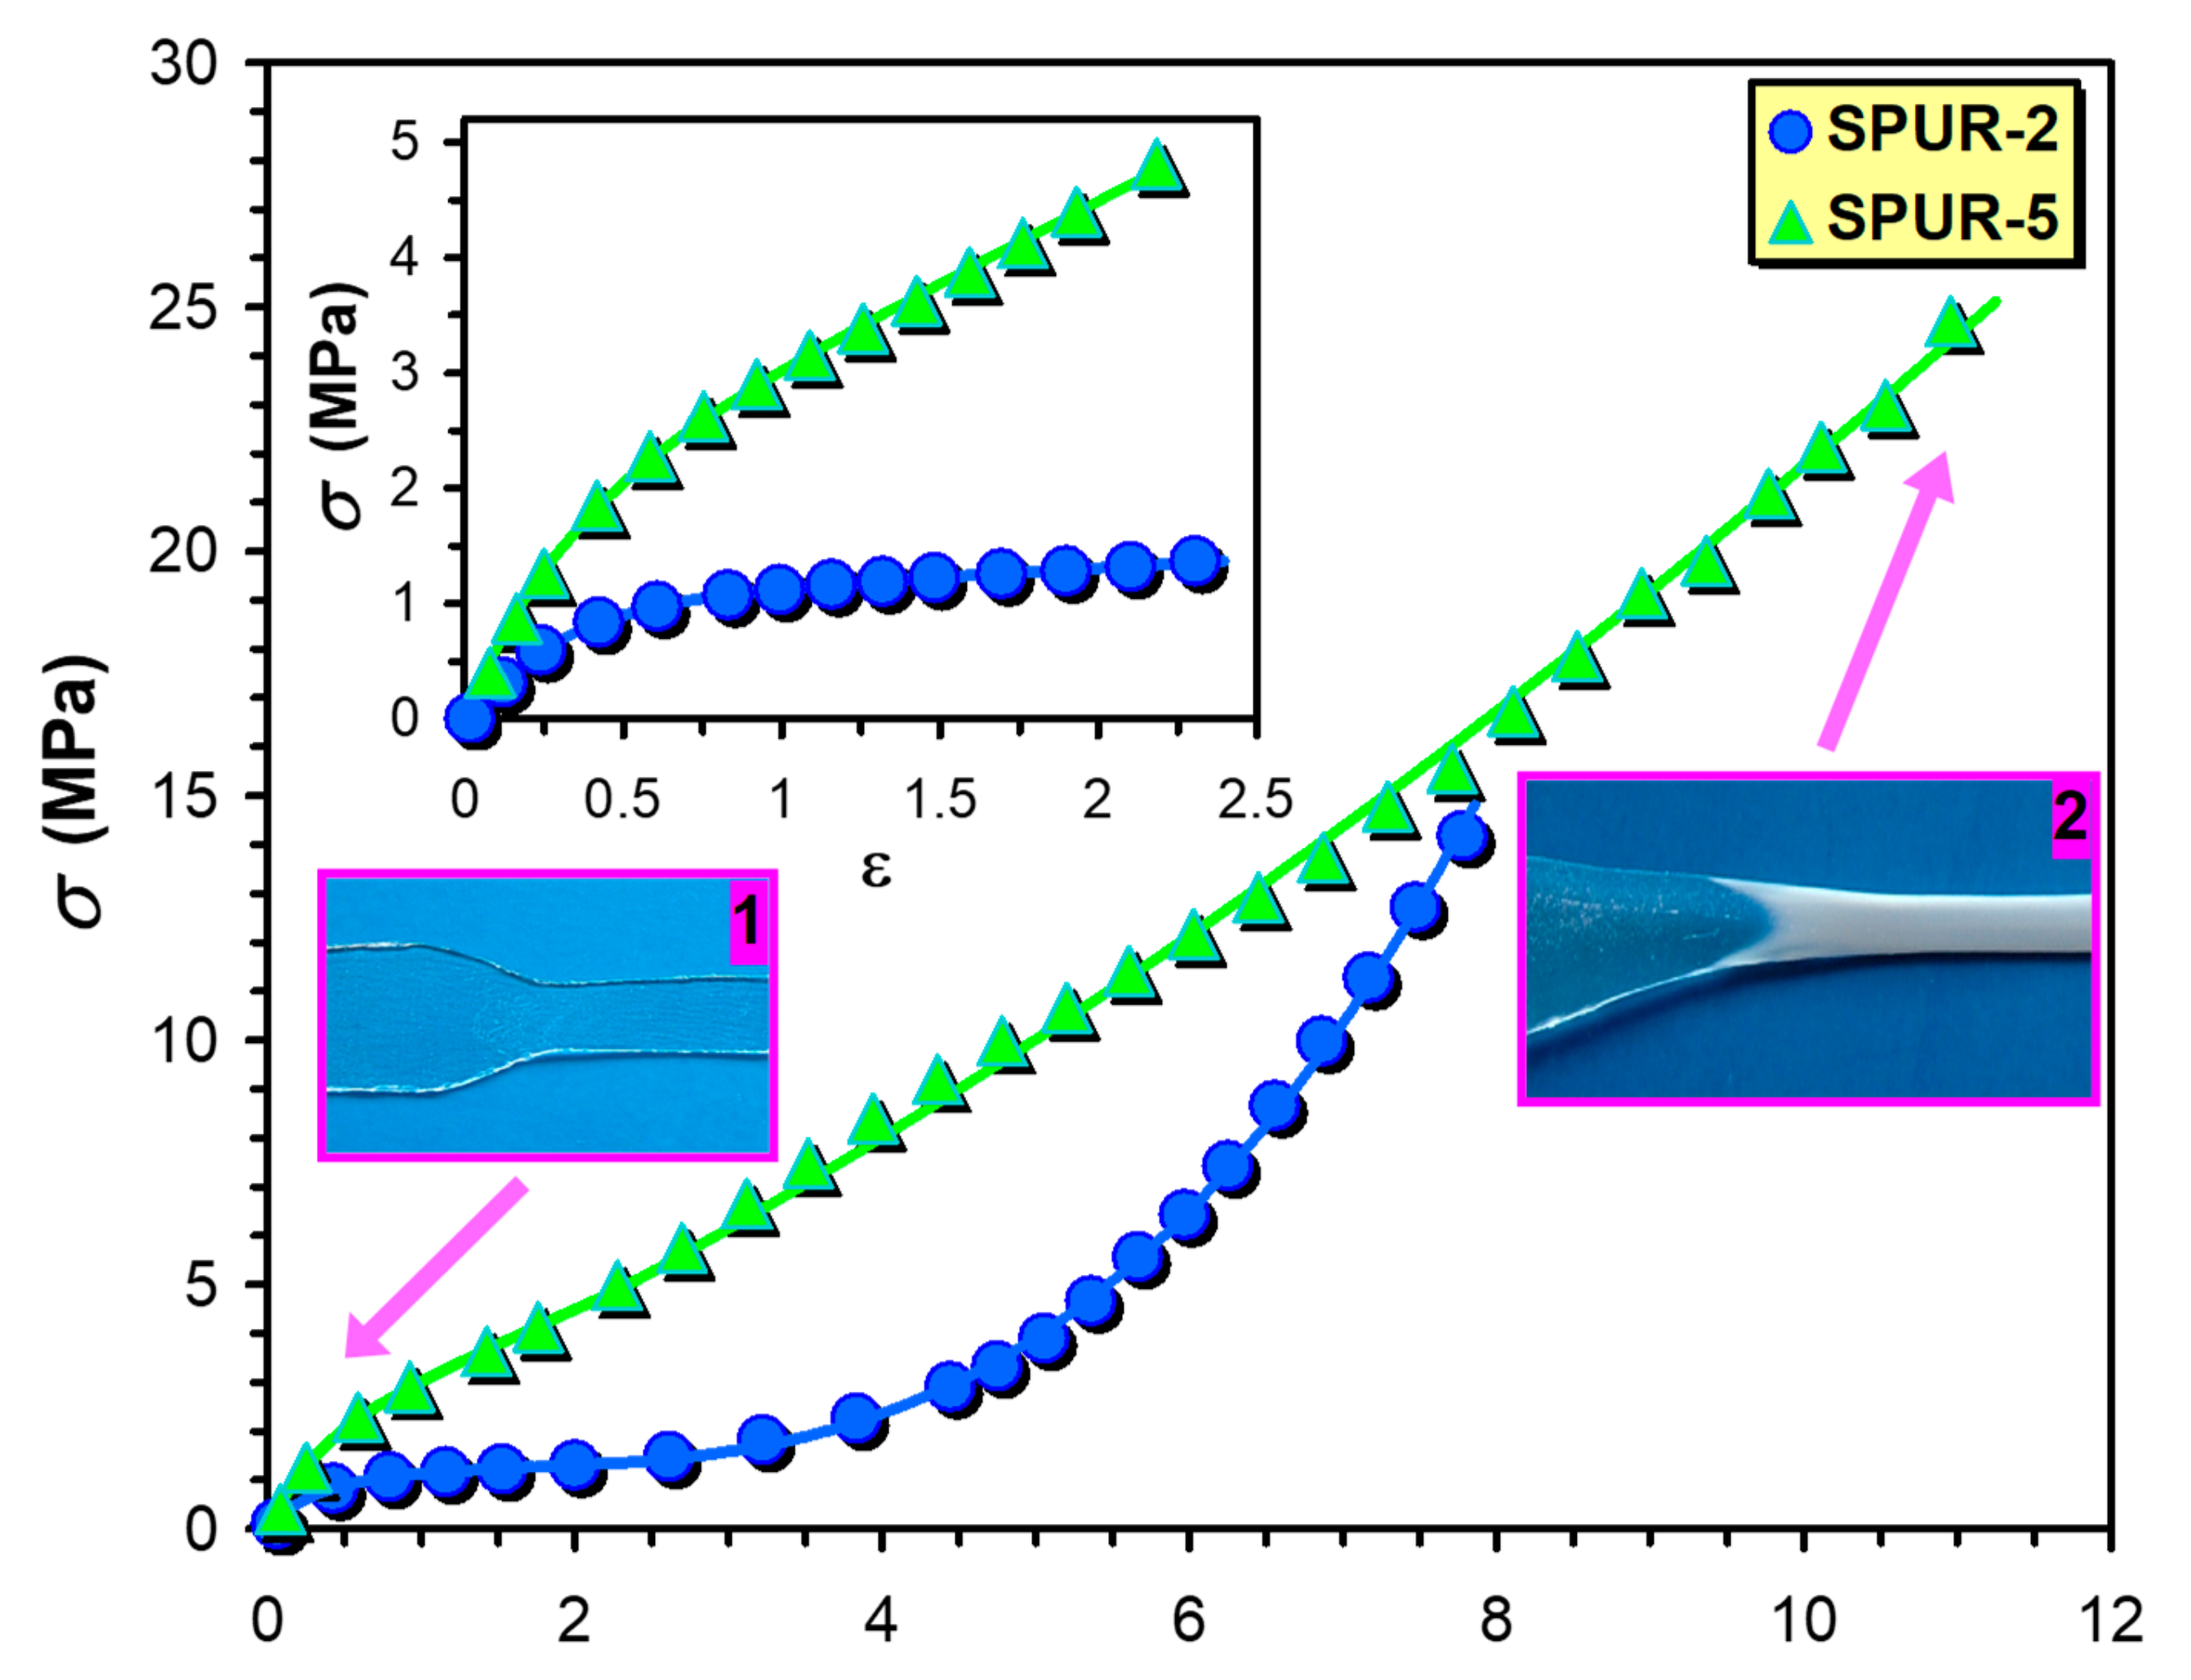
The stress-strain (
σ −
ε) curves for the samples SPUR-5 and SPUR-2 are shown in
Figure 7. and in the inset of
Figure 7. As it turns out from the inset of
Figure 7, Equation (9) is capable of rendering the experimental
σ-ε curves up to moderate strains (
ε < 2.2). However, it fails to describe the whole (
σ-ε) curves especially at higher strains where marked deviations from the calculated ones have been observed. These deviations can be attributed to the upward curvature of the
σ-ε plot, i.e.,
σ increases more rapidly with the increasing
ε above ca. 2.2. These upward curvatures were supposed to be the effect of strain hardening, i.e., crystallization of the polymer segments can take place upon increasing strain, yielding an increase in the apparent modulus [
20]. It is to be noted that a similar effect was observed and described for the epoxy-polyurethane (EPU) shape memory polymers [
21]. The model that takes into account the strain hardening above a critical value of
ε (
ε >
εL) is similar to that reported for the EPUs, with an extension that the present model provides a more general description of strain-hardening by introducing a new variable (
β) as seen in Equation (11).
Integrating Equation (12) numerically (after the substitution of Equation (11) into Equation (12) and the fitted values obtained by Equation (10)) and then fitting it to the experimental data over the whole
ε range, the values of
α and
β can now be determined. One can also realize that the fitted (solid lines) and the experimental (symbols) values are in good agreement (see
Figure 7).
It is interesting to note that
σ increases more rapidly with
ε in the case of sample SPUR-2 than it does for the sample SPUR-5 and this finding is also reflected in the values of
β which are 0.75 and 1.75 for the sample SPUR-5 and SPUR-2, respectively. Furthermore, as seen in
Figure 7, the stress at break for the sample SPUR-2 is lower than for the sample SPUR-5. These findings are in line with the crosslink densities that are 9.1 × 10
−5 and 7.3 × 10
−4 mol/cm
3 for sample SPUR-2 and SPUR-5, respectively. At lower crosslink densities there are larger free spaces available for the polymer chains to crystallize giving rise to a steeper increase in
σ with
ε, and providing lower stress at break at the same time.
In addition, as illustrated by
Figure 7, at low strains the sample is transparent (1), whereas at high strain it becomes opaque (white) due to the crystallization of the polymer segments upon the effect of strain (2), which also supports the validity of our approach.
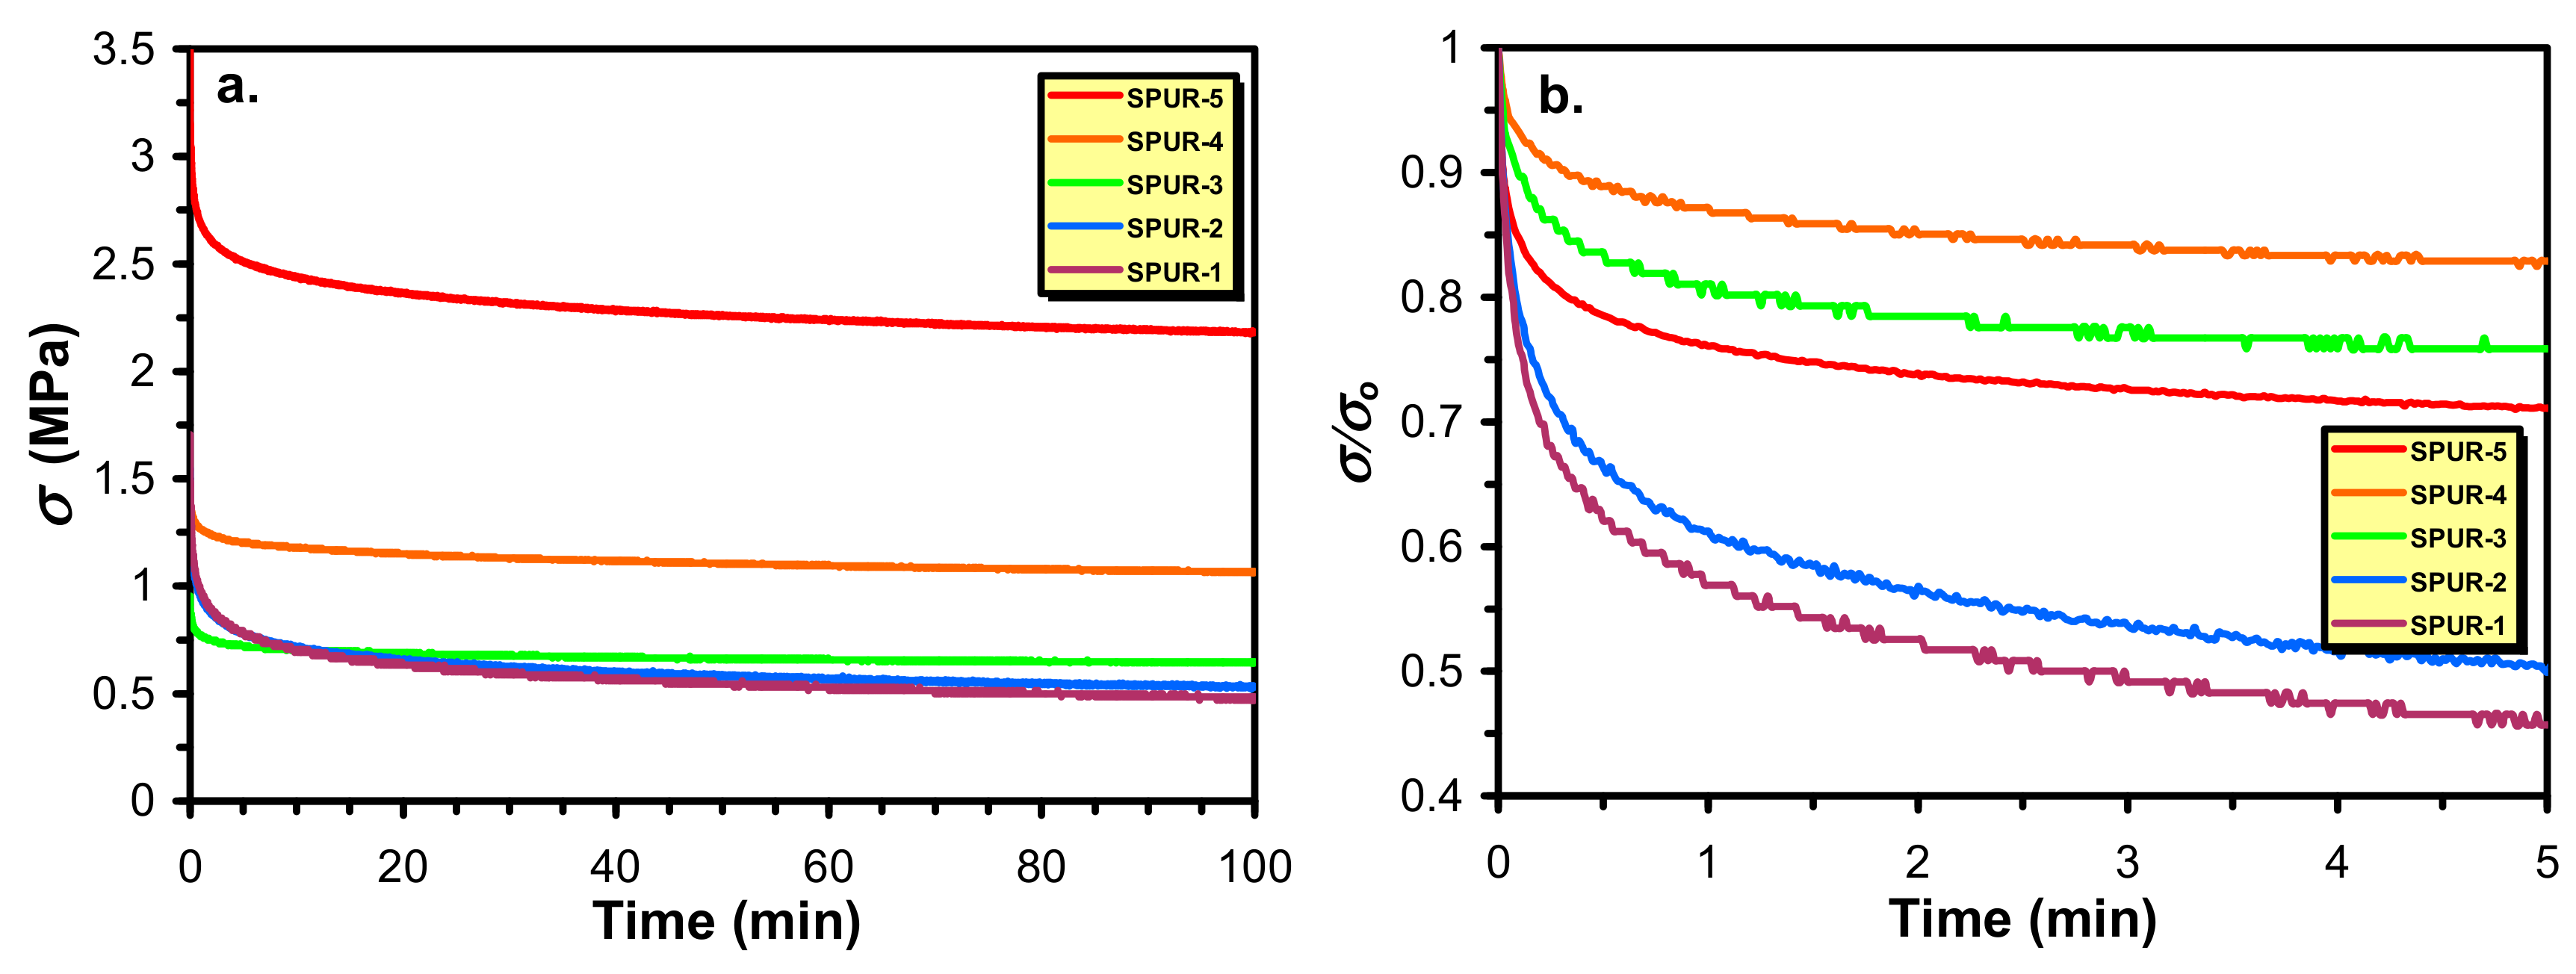
In addition to these mechanical investigations, stress relaxation experiments were also performed to get deeper insight into the relaxation processes of these SPUR samples and in parallel, to determine the crosslink densities. The stress and the relative stress relaxation curves are demonstrated in
Figure 8.
As it turns out from
Figure 8a there is a relative fast relaxation process at the beginning of the relaxation curves that is followed by a slower relaxation period and eventually reaching a plateau value of
σ that corresponds to the equilibrium relaxation modulus. Furthermore, as it is also seen from
Figure 8b, the extent of decrease in the values of
σ/σo with time and to the equilibrium value follows an order of SPUR-4 > SPUR-3 > SPUR-5 > SPUR-2 > SPUR-1. This trend is almost in line with the decreasing crosslink densities for these SPURs except sample SPUR-5. This exception may highlight the fact that although the relative “viscous” part (relaxation to the equilibrium state) is mainly determined by the crosslink densities other factors can also affect the relaxation process. Moreover, the equilibrium stress value called as equilibrium modulus (
σeq) is directly related to the crosslink density of elastomers (
νr) according to theory of rubbers [
22] as shown by Equation (13).
where
λ,
R and
T are the extension ratio (i.e. the ratio of the extended and the initial length of the sample), the universal gas-constant and the temperature in Kelvin, respectively.
The corresponding crosslink densities calculated by Equation (13) are compiled in
Table 5.
Comparing the data of
Table 5 with that of
Table 3, one can realize that the crosslink densities determined by the two methods (swelling and stress relaxation) agree relatively well. Hence, the decreasing crosslink densities with the increasing sucrose content is again supported by an independent method.
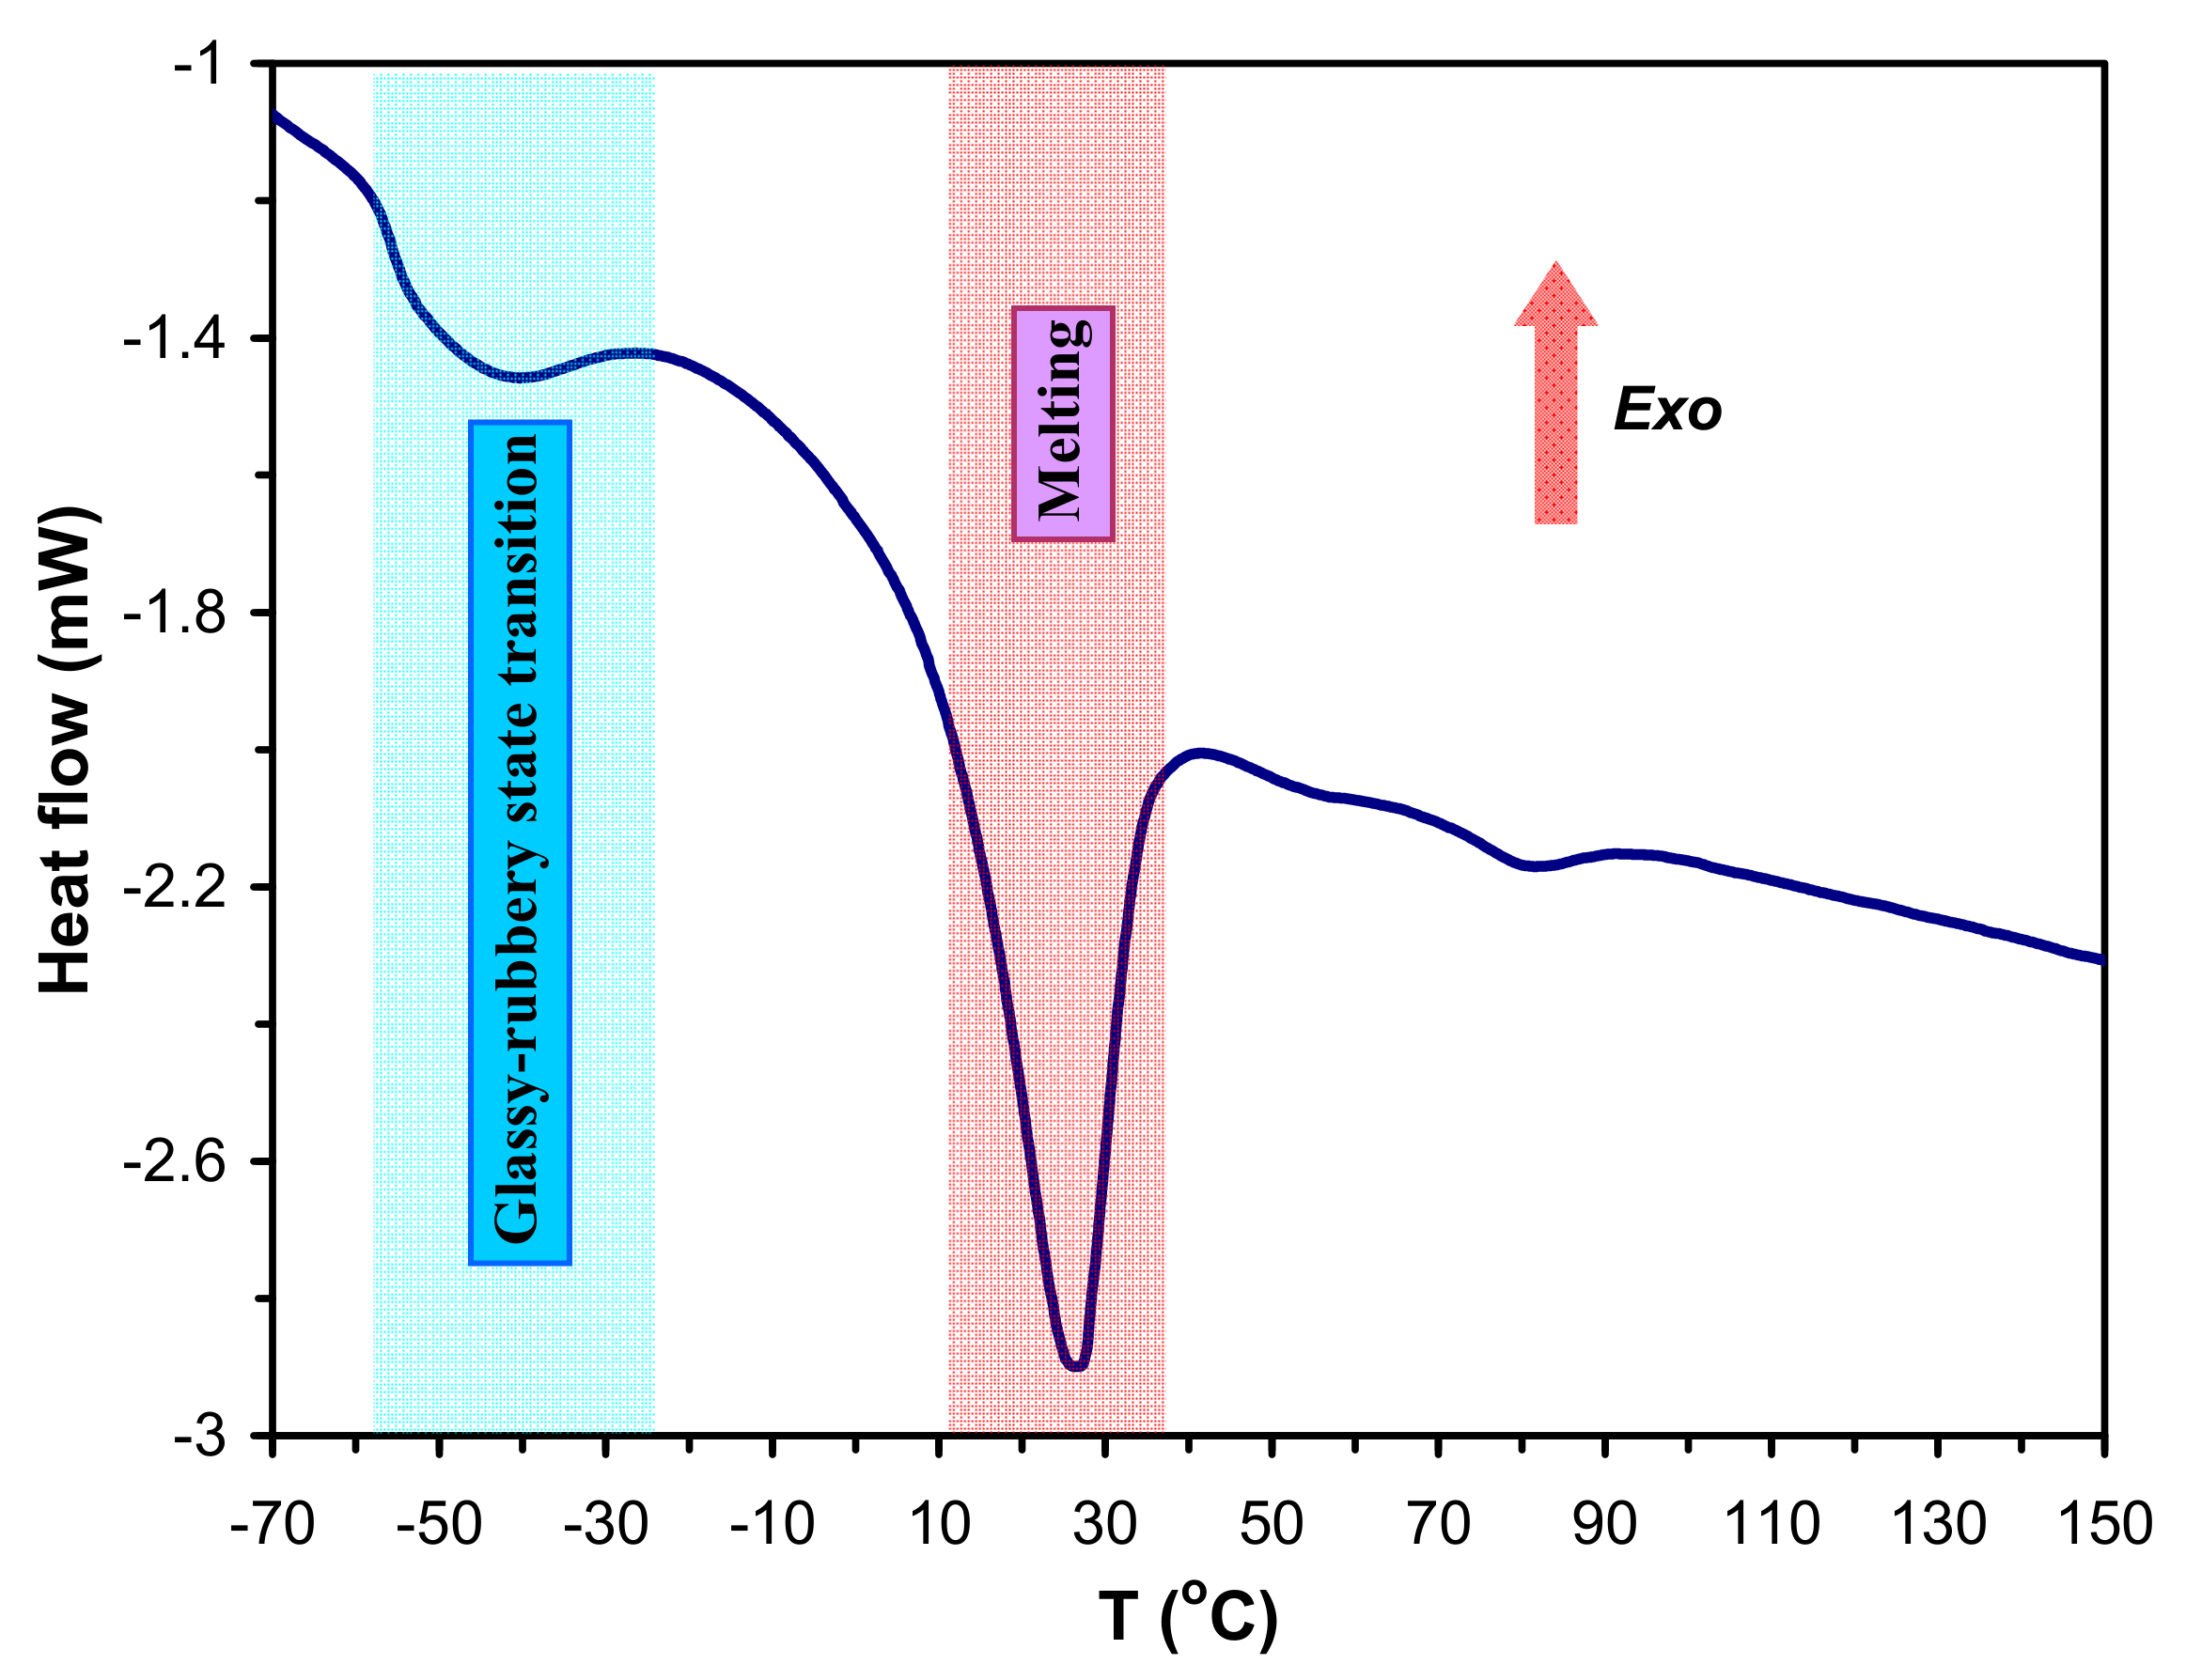
3.6. Thermal and Thermomechanical Properties of PURs
The thermal properties of the SPUR samples were investigated by differential scanning calorimetry (DSC) to determine their thermal transitions such as the glass transition temperature (T
g) and the melting temperature (T
m). A typical DSC trace for the sample SPUR-3 along with the characteristic thermal transitions are shown in
Figure 9.
As seen in
Figure 9 the T
g occurs between −50°C and −60 °C, while T
m are present at 20–30 °C. The values of T
g and T
m of SPUR samples determined from DSC measurements are presented in
Table 6.As it turns out from
Table 6, the T
g-s of the SPUR samples vary from −58 °C to −51 °C with the decreasing sucrose content, i.e., T
g increase with the increasing crosslink density. This finding is in line with the fact that chain mobility is gradually reduced with the increasing crosslink densities resulting in an increasing trend for T
g values. Furthermore, it can also be expected that at higher crosslink densities the crystallization is more hindered giving rise to lower T
m values. On the other hand, the T
m values for the PCLD segments in the SPUR samples are close to the room temperature, and thus are much lower than that of the high molecular weight poly(ε-caprolactone) (PCL), which melts at ca. 60 °C. That means the PCLD segments in the SPUR networks are in amorphous rubbery physical state. This fact is highly favorable for improving the chemical and/or biodegradation process in biological environments.
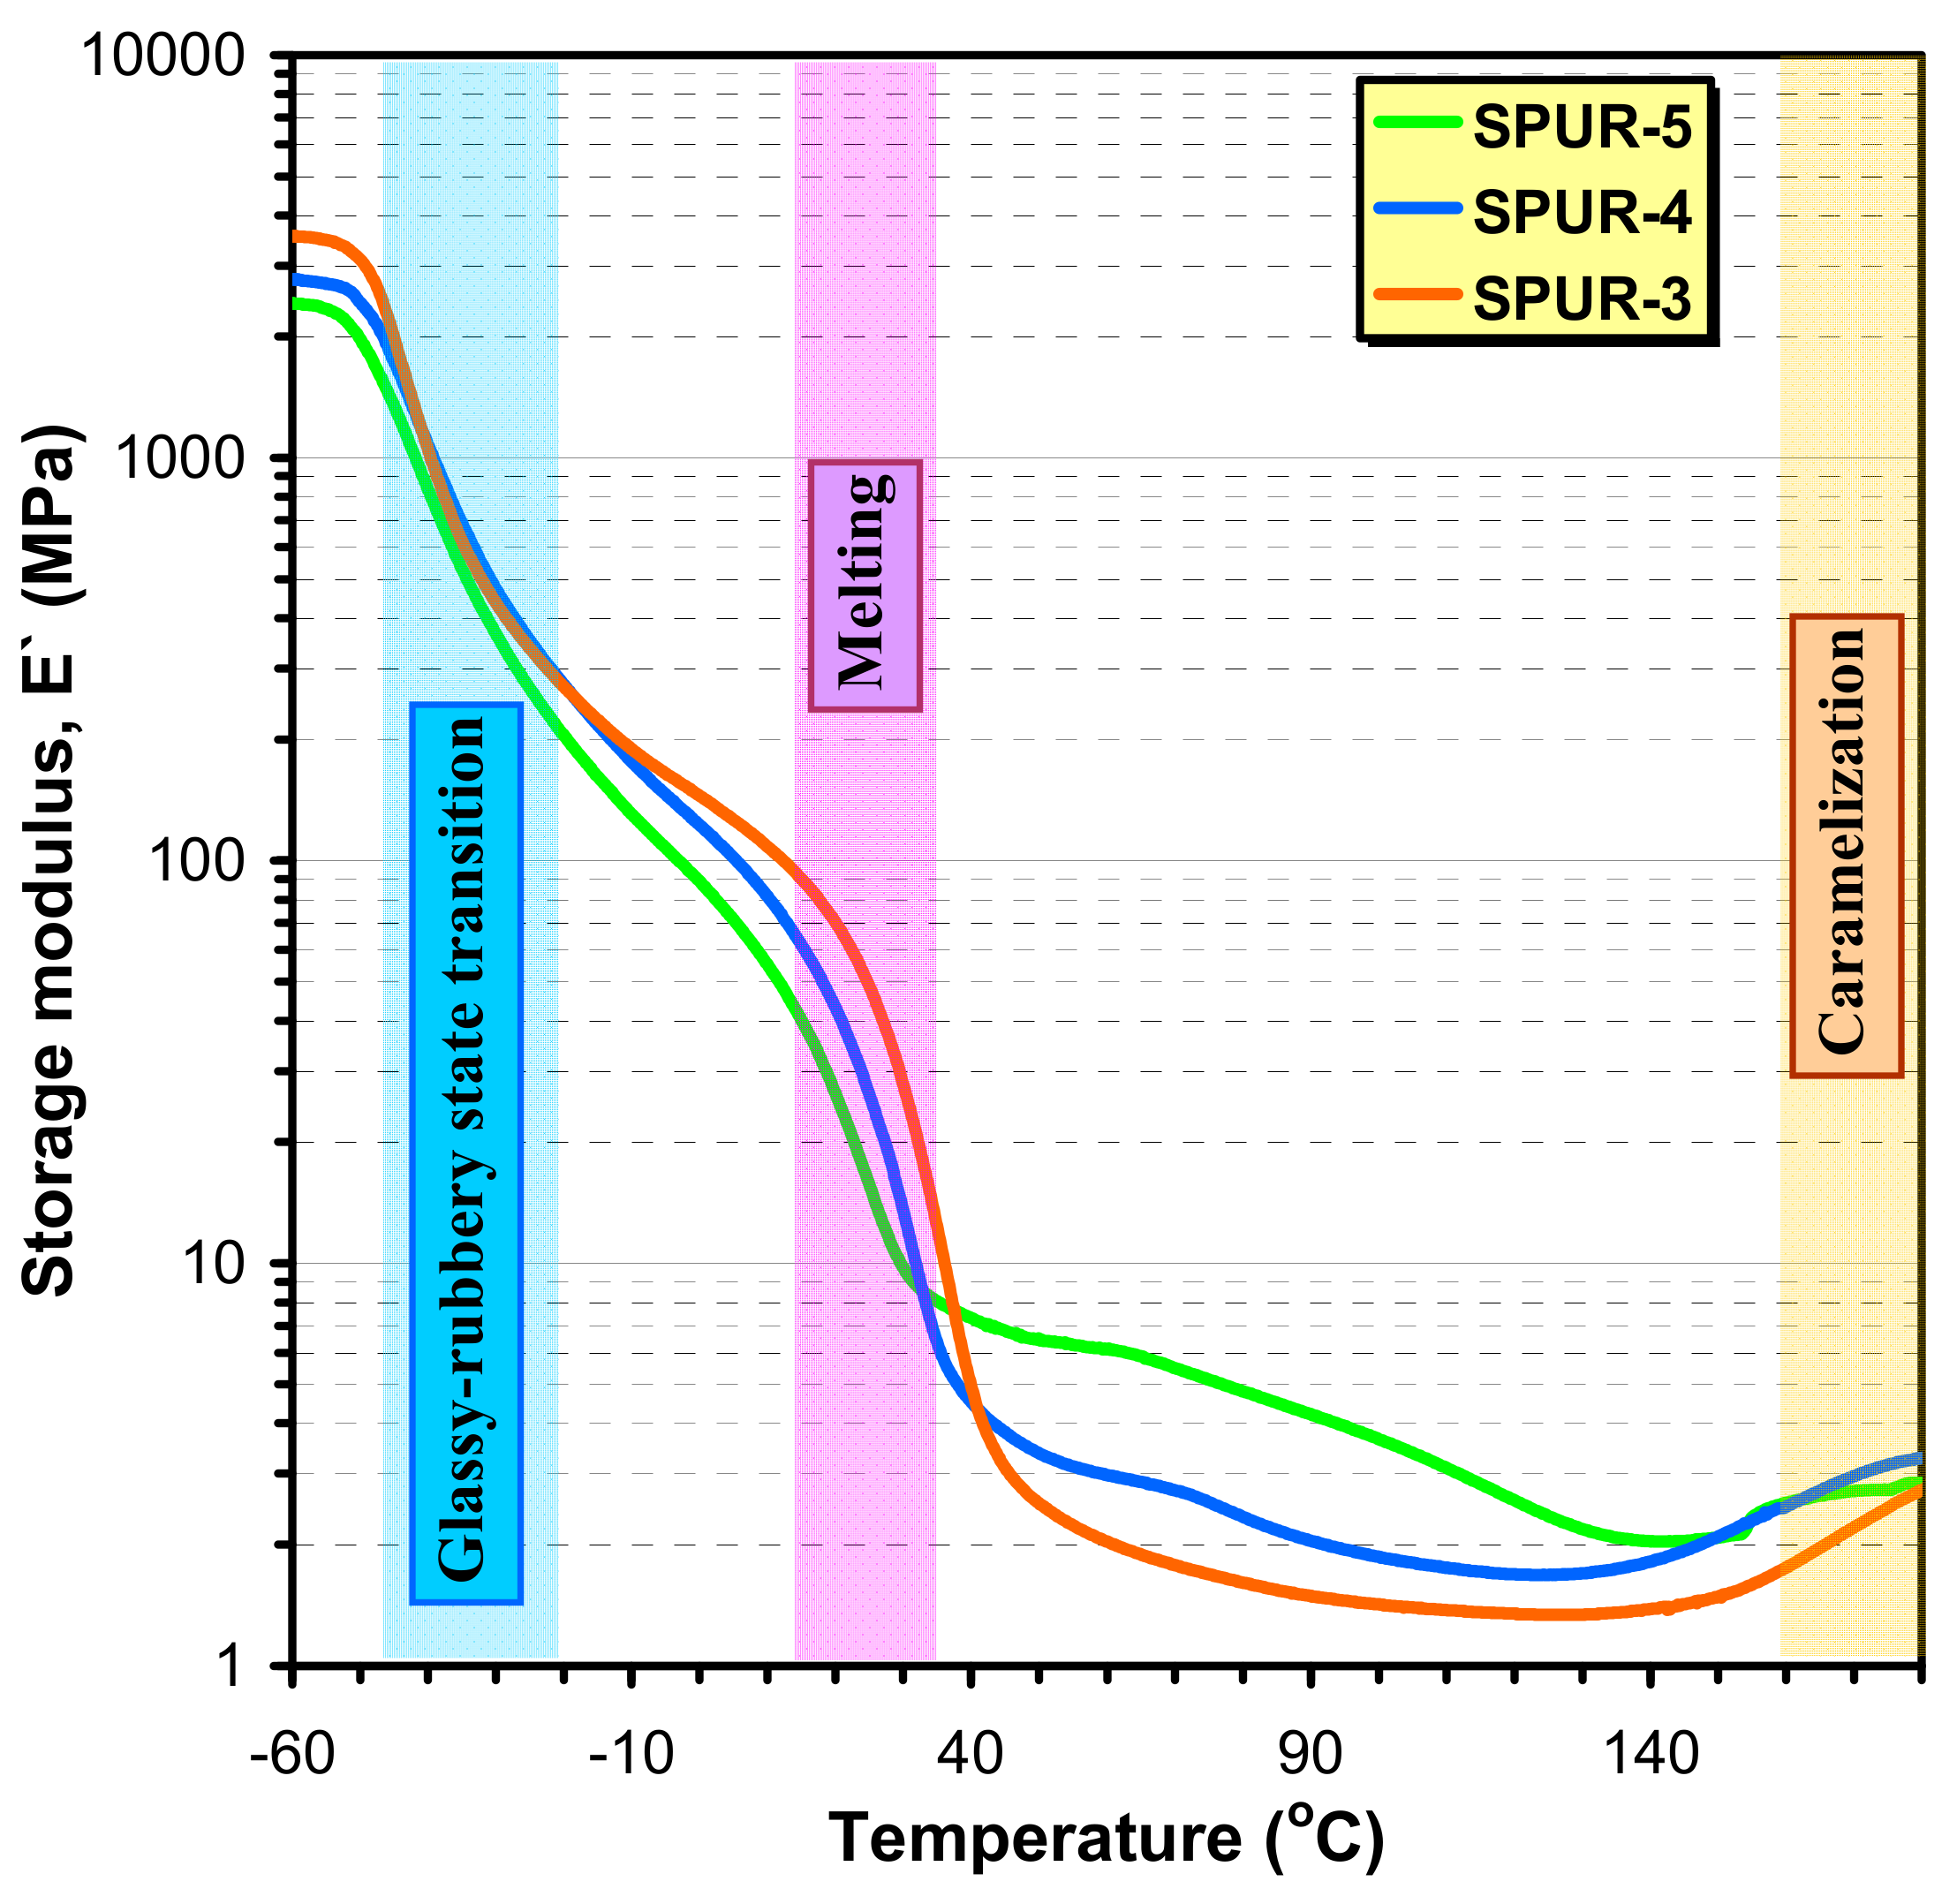
The dynamical mechanical properties of SPUR samples were also characterized by DMA. The dependences of the storage moduli (E′) on the temperature for the samples SPUR-5, SPUR-4 and SPUR-3 are shown in
Figure 10.
As seen in
Figure 10 different regions can be distinguished on the DMA curves: at low temperature (at about −50 °C) the considerable decrease in E′ can be attributed to the transition from the glassy to the rubbery state and a further, marked decrease at around 20–30 °C is due to the melting of the crystalline segments. The temperatures at which these processes occur are in good agreement with the values of T
g and T
m obtained from DSC measurements (see
Table 6). At higher temperatures, however, the melting is followed by a gradual loosening of the physical network, but owing to the chemical crosslinks, DMA curves exhibit rubbery like plateaus in the temperature range of 100–150 °C. Typically, above 140 °C, an increase in the storage modulus with the temperature can be observed. This finding is most probably due to the caramelization of the sucrose and thus this process leads to the formation of tighter crosslinks between these sucrose moieties. Furthermore, it can also be surmised that higher crosslink densities yield lower T
m-s owing to the reasons outlined above. Indeed, as seen in
Figure 10. the melting of the crystalline phase occurs in the order of T
m: SPUR-5 < SPUR-4 < SPUR-3 and this order is in line with the crosslink densities determined from swelling and the stress relaxation experiments (see
Table 3 and
Table 5) as well as with the data of
Table 6. In addition, the rubbery-like plateau provides another way to estimate the crosslink density (
νd) from DMA results according to Equation (14).
where
E′ is the value of the storage modulus at the plateau value of
T and
R is the universal gas-constant, and
T is the temperature in Kelvin.
The crosslink densities from DMA data for samples SPUR-5, SPUR-4, SPUR-3, SPUR-2 and SPUR-1 were determined to be 2.1 × 10⁻⁴ mol/cm3, 1.7 × 10⁻⁴ mol/cm3, 1.3 × 10⁻⁴ mol/cm3, 8.8 × 10⁻⁵ mol/cm3 and 8.6 × 10⁻⁵ mol/cm3, respectively. Although these values are lower than those determined by swelling and stress relaxation experiments the order of νd agrees well.

 ,
, 


