Article

Influence of Oil–Pressboard Mass Ratio on the Equilibrium Characteristics of Furfural under Oil Replacement Conditions

School of Electrical Engineering, Guangxi University, Nanning 530004, China
*
Author to whom correspondence should be addressed.
Submission received: 30 October 2020 / Revised: 13 November 2020 / Accepted: 13 November 2020 / Published: 23 November 2020

Abstract

:
The distribution behavior of furfural in insulation systems is influenced by the oil–pressboard mass ratio. In addition, the equilibrium distribution of furfural between oil and pressboard will be disturbed after oil replacement. Therefore, it is of great significance to study the distribution ratio of furfural in oil with various oil–pressboard mass ratios after oil replacement. In this research, an accelerated thermal aging experiment and oil replacement experiment were conducted in the lab. Furthermore, the equilibrium characteristics of furfural dissolved in oil with various oil–pressboard mass ratios were studied. Multiple regression analysis was used to analyze the relationship between the oil–pressboard mass ratios and the distribution ratio of furfural in oil. The equilibrium distribution model of furfural was thus obtained. Afterwards, the modified furfural distribution model under oil replacement conditions was established. A novel scheme is provided for analyzing the equilibrium characteristics of furfural under various oil–pressboard mass ratios after oil replacement. The work of this paper is expected to improve the accuracy of furfural analysis.

Graphical Abstract

1. Introduction

Transformers are the core equipment of power transmission in a power grid. The stability and safety of transformers in operation are directly related to the economic benefits of electric utilities [1,2,3,4]. Generally, the main insulation of a power transformer is composed of mineral-insulating oil and insulating cellulose. However, the main insulation of the transformer is irreversibly deteriorated due to the combined effects of electrical, thermal, vibration, and other aging factors during long-term operation [5,6,7,8,9]. Based on the current studies, the aging of cellulose insulation will result in serious failure problems for transformers [10], which may bring security risks to the power system and cause huge socioeconomic losses. Therefore, cellulose insulation determines the service life of the transformer [11,12]. To avoid the occurrence of transformer failure, the aging state of cellulose insulation must be evaluated timely and accurately [13,14,15].
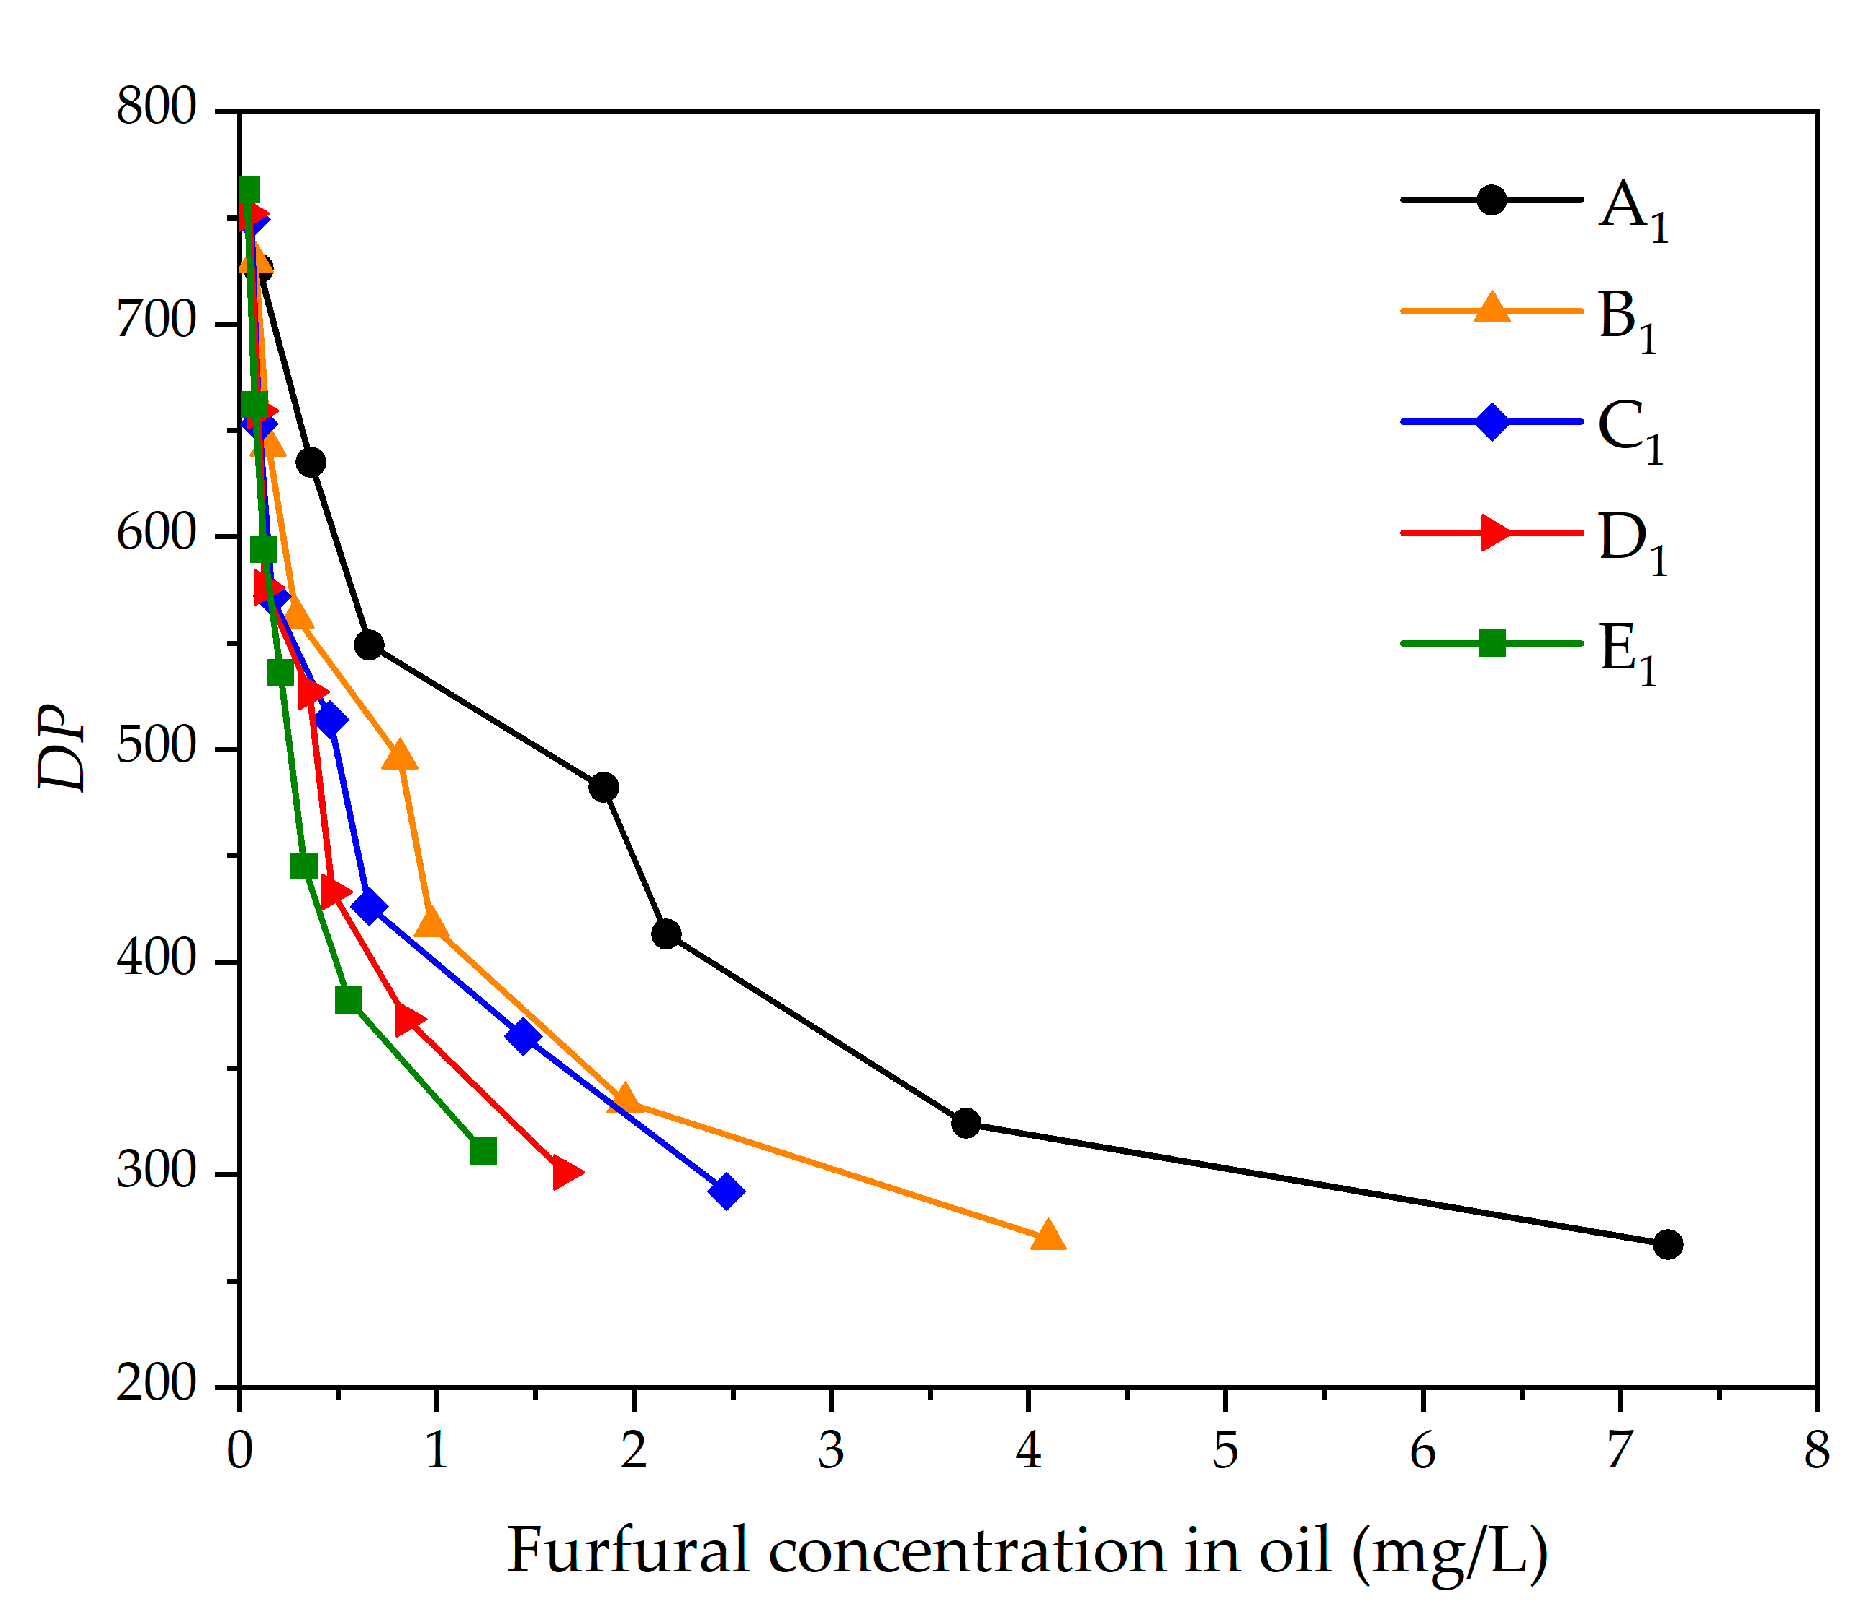
In general, the aging state of the insulating cellulose can be reflected by its tensile strength (TS) and degree of polymerization (DP) [16,17]. Nevertheless, both methods require destructive sampling of the transformer insulation. As a result, the measurement of dissolved chemicals in the insulating oil is used as an indirect and effective method to evaluate the aging state of cellulose insulation of transformer. Among all the chemical parameters, furan compounds are produced only by the degradation of cellulose insulation [18,19,20,21]. Compared with other furan compounds, furfural is more stable, has a higher content in oil, and is more convenient to detect [22,23]. Therefore, furfural has been widely used as an ideal chemical indicator for characterizing the aging state of cellulose insulation, which has been incorporated into the IEC (International Electrotechnical Commission) 61198.
During the operation of the transformer, part of the furfural molecules diffuses into the insulating oil through the oil–pressboard boundary, which finally achieves equilibrium distribution state in the oil–pressboard system. Consequently, the study of furfural distribution ratio in oil is the premise for evaluating the aging state of cellulose insulation. Reviewing the existing studies, Jalbert et al. studied the effect of temperature on the distribution of furfural between oil and paper, and the results showed that the distribution ratio of furfural in oil increases with rising temperatures [24,25]. Feng et al. studied the influence of moisture on the distribution behavior of furfural, and the results showed that the distribution ratio of furfural in oil is positively correlated with the water content in oil [26]. Moreover, the aging state of insulating paper and oil is another factor that influences the distribution of furfural between oil and paper. Yang et al. found that the distribution ratio of furfural in oil increases with the deterioration of insulating oil [27]. However, the effect of the oil–pressboard mass ratio on furfural distribution behavior has not been well studied. The mass ratio of the oil–pressboard insulation system is different due to the different voltage levels, capacity, and manufacturing design of transformers, which have an effect on the distribution of furfural in oil.
Moreover, the service period of oil-immersed transformers is generally around 40 years. Currently, a large number of field transformers have been in operation for more than 30 years, approaching the end of their service life [28,
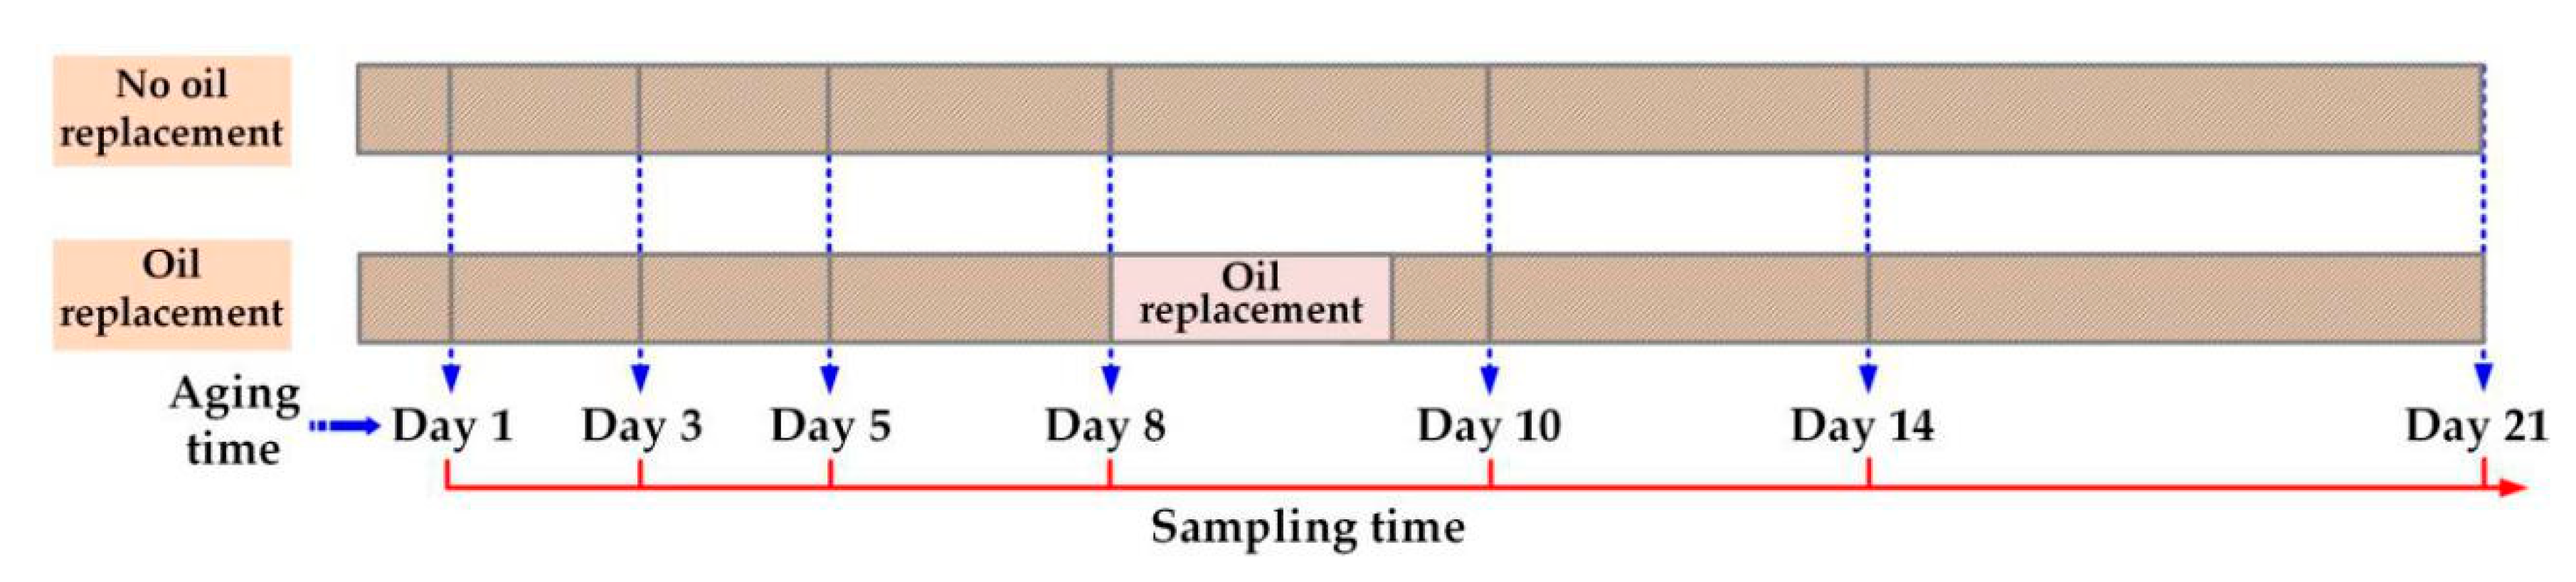
29]. To slow down the aging rate of the oil–pressboard insulation system, and improve the insulation performance of insulating oil, the transformer oil will be completely replaced by power utilities, which affects the distribution of furfural in oil as well [30].
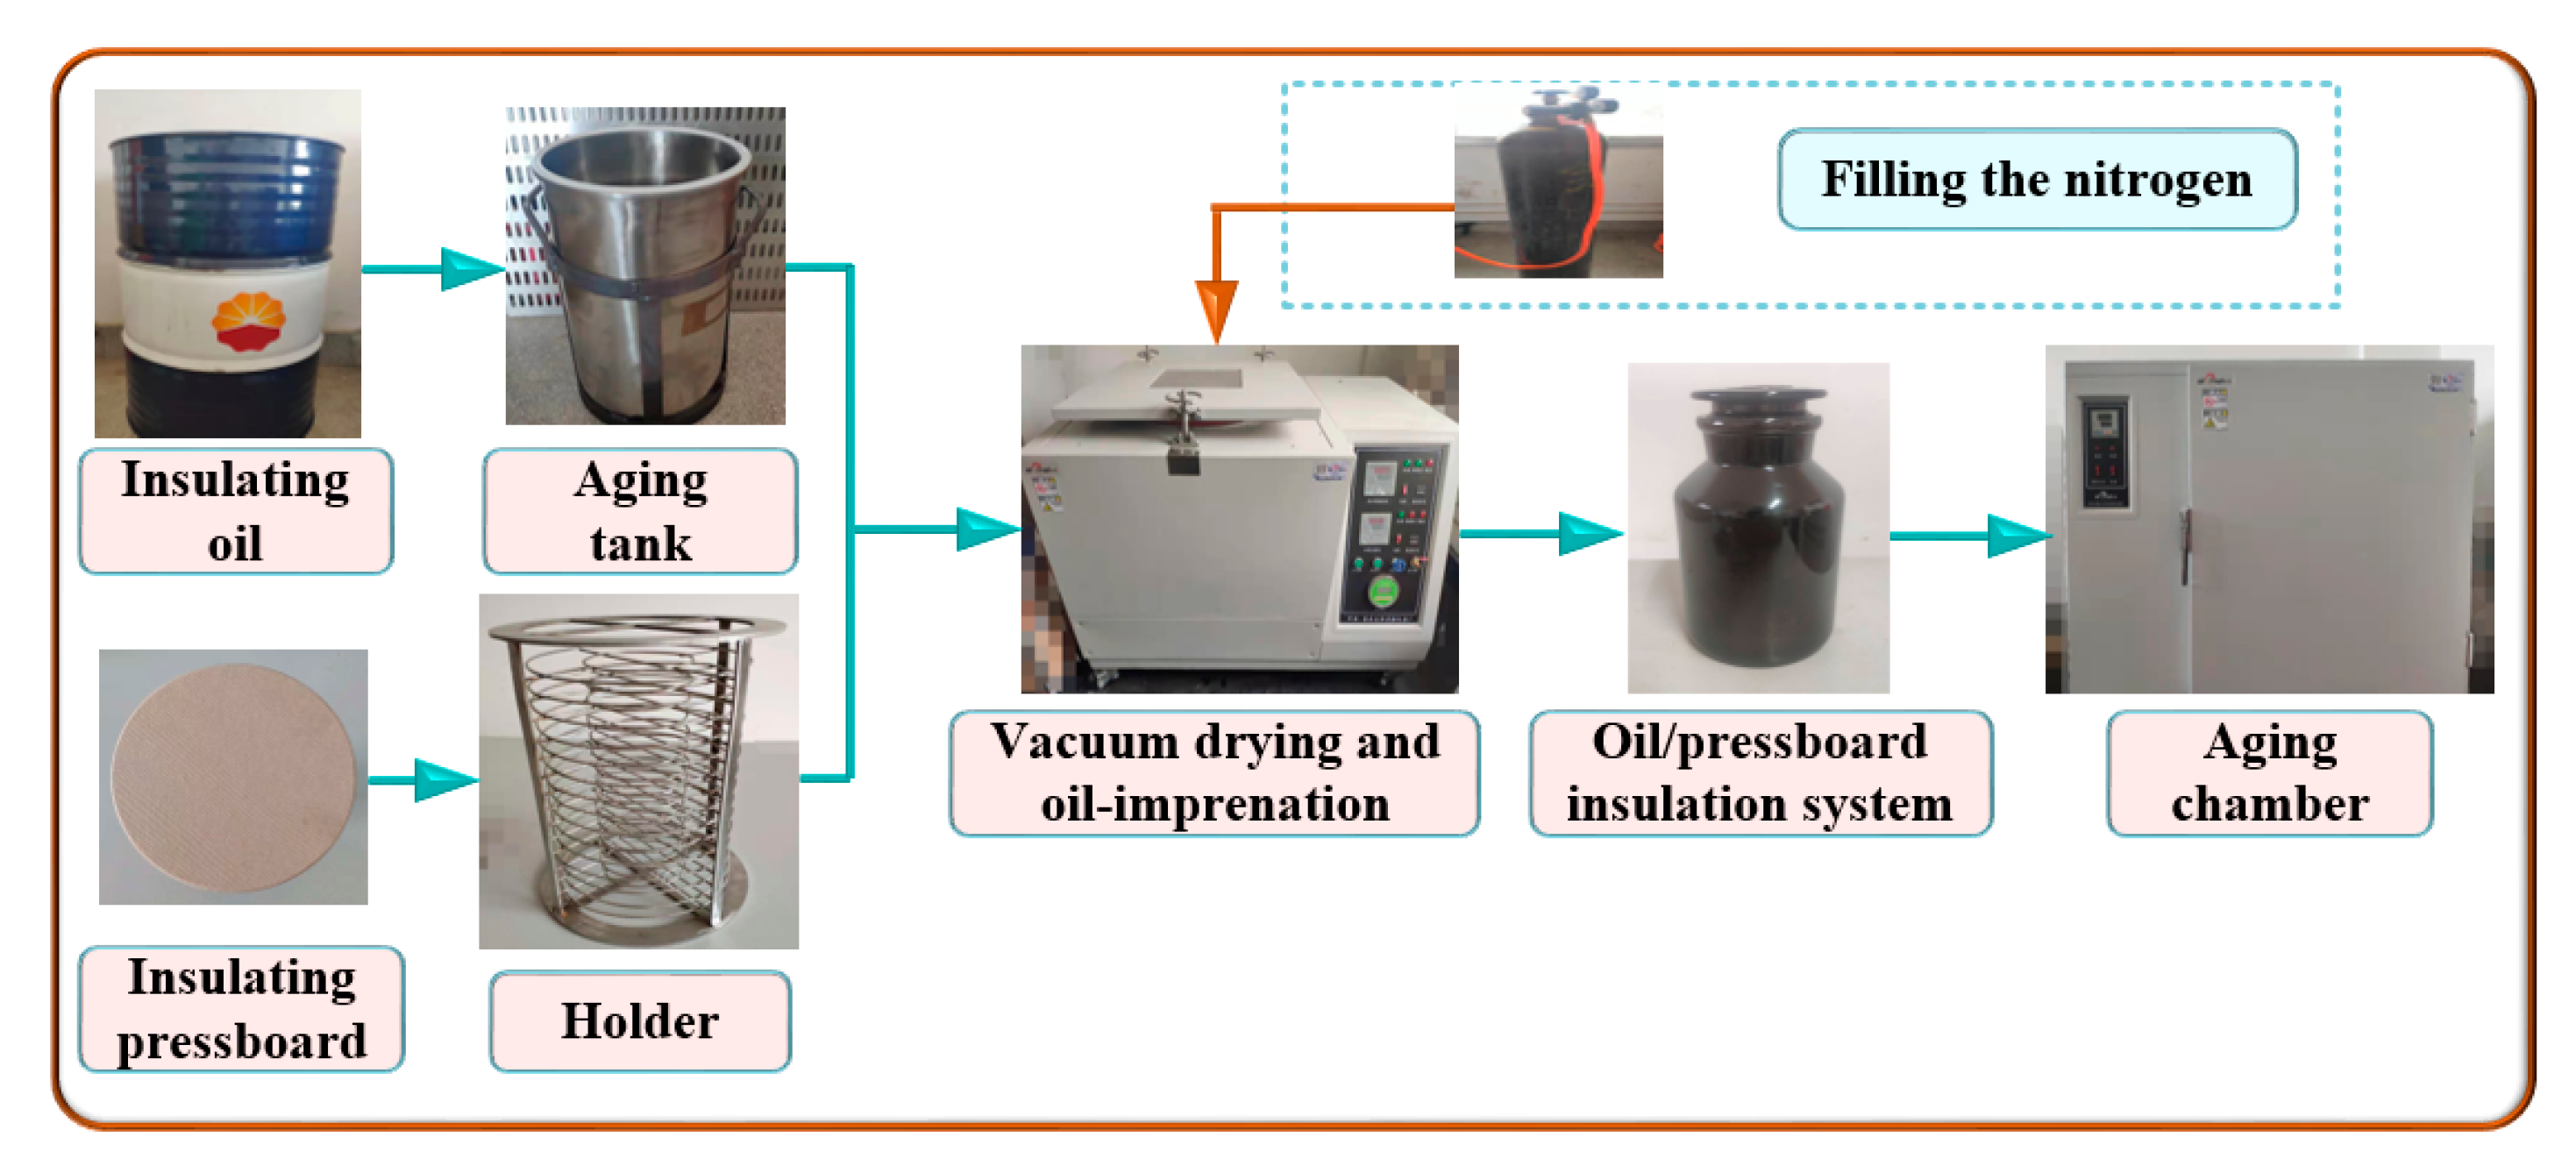
In this study, the influence of the oil–pressboard mass ratio on the equilibrium distribution characteristics of furfural in oil–pressboard insulation systems was studied. First, ten sample groups were prepared, which included control groups, sample groups, and verification groups with various oil–pressboard mass ratios. Then, the accelerated thermal aging experiment and oil replacement experiment were conducted in the lab. Finally, the distribution model of furfural dissolved in oil was established, and the correction factor of furfural distribution ratio in oil after oil replacement was proposed. A novel scheme is provided for analyzing the equilibrium characteristics of furfural under various oil–pressboard mass ratios after oil replacement.

2. Sample Preparation and Experiments

2.1. Sample Pretreatment and Accelerated Thermal Aging Experiment

The oil–pressboard insulation samples used in the experiment were made from no. 25 mineral oil from Karamay Co., Ltd. (Beijing, China), and 1 mm thick cellulose insulation pressboard. The specific experimental material parameters are shown in Table 1. The steps were as follows:
  • First, the insulating pressboard was cut into rectangular pieces (6.0 cm × 3.6 cm) and put on a bracket. Then, the bracket with insulation pressboard and the steel tank containing insulating oil were dried for at least 48 h in the vacuum immersion device at 105 °C for 48 h;
  • Second, the insulation pressboard was immersed in a steel tank containing dry oil in vacuum at 60 °C for 48 h. This ensured that the initial moisture content of the insulating pressboard was less than 0.8%, and that of insulating oil was less than 35 mg/kg;
  • Thirdly, insulating pressboard and oil were placed into ten ground glass bottles, according to different oil–pressboard mass ratios. An appropriate number of copper sheets was put into each bottle to make the thermal aging experiment condition close to the actual operation state of the transformer. Furthermore, each bottle was filled with high-purity nitrogen and strictly sealed. This process was repeated after the oil replacement operation and sampling operation to eliminate the effect of oxygen;
  • Finally, the oil–pressboard insulation samples were put into an aging chamber at 130 °C for an accelerated thermal aging experiment [31,32]. The experimental process is shown in Figure 1.

2.2. Oil Replacement Experiment

Ten groups of oil–pressboard insulation samples were set at various oil–pressboard mass ratios. The specific experimental scheme is shown in Table 2. The oil samples of Group A1, B1, C1, D1, and E1 were regarded as control groups without oil replacement. Group A2, B2, C2, D2, and E2 were regarded as experimental groups, and the oil replacement experiment was carried out under various oil–pressboard mass ratios.
The accelerated thermal aging experiment lasted for 21 days. On the eighth day, the oil of group A2, B2, C2, D2, and E2 was completely replaced with fresh oil. Then the five groups of samples were transferred and placed in a thermostat at 60 °C for two weeks until the distribution of furfural between oil and pressboard reached equilibrium state [28].

2.3. Sampling and Parameter Measurement

Samples were taken on days 1, 3, 5, 8, 10, 14, and 21 during the accelerated thermal aging experiment. The specific sampling time points are shown in Figure 2. Before each sampling, each bottle was placed in a thermostat at 60 °C for 72 h to achieve a balanced distribution of furfural between oil and pressboard. In addition, the oil–pressboard mass ratio of each group was maintained constantly throughout the experimental process.
According to IEC 61198, the concentration of furfural dissolved in oil was measured by high-performance liquid chromatography (HPLC). De Pablo extracted furfural from the pressboard with methanol, and the furfural concentration in methanol solvent was measured to obtain the furfural concentration in pressboard [33,34]. As shown in Figure 3, first 1 g of insulating pressboard was taken, cut into small pieces, and put into the colorimetric tube. Secondly, 50 mL methanol was added to the colorimetric tube, and the extraction time lasted for at least 12 h. Thirdly, the concentration of furfural in methanol was measured by HPLC, and the furfural concentration in insulating pressboard was calculated by Equation (1). According to IEC 60450, insulating pressboard was dissolved in copper ethylenediamine solution, and the degree of polymerization of the insulating pressboard was measured by viscosity method [17].
C p r e s s b o a r d = C m e o h × V m e o h m p r e s s b o a r d
where Cpressboard (mg/g) is the concentration of furfural in insulating pressboard, Cmeoh (mg/L) is the concentration of furfural in methanol, Vmeoh (L) is the volume of methanol, and mpressboard (mg) is the mass of insulating pressboard.

3. Experimental Results

3.1. Relationship Between Aging Time and Furfural Concentration

The furfural concentration in the oil and pressboard increased with the aging of the sample in the control groups (A1, B1, C1, D1, and E1). The oil in experimental groups A2, B2, C2, D2, and E2 was totally replaced under various oil–pressboard mass ratios on the eighth day of the accelerated thermal aging experiment (DP is about 530). Those oil–pressboard mass ratios were maintained at 5:1, 10:1, 15:1, 20:1, and 25:1, respectively. The concentrations of furfural in oil and pressboard were measured on days 1, 3, 5, 8, 10, 14, and 21 of the accelerated thermal aging experiment. The results are shown in Figure 4 and Figure 5.
As shown in Figure 4 and Figure 5, the furfural concentration in the oil and pressboard decreased with the increase of the oil–pressboard ratio. Although the furfural content in the oil decreased significantly after the oil replacement, the furfural content did not decrease to 0. It is indicated that the insulating oil could not be completely removed by oil replacement, and a small part of the insulating oil remained on the surface of the insulating pressboard and the inner wall of the bottle. The furfural residual ratio in oil increased with the increase of the oil–pressboard mass ratio, as illustrated in the Table 3, while the furfural recovery ratio in oil decreased with the increase of the oil–pressboard mass ratio.
As shown in Figure 4, the higher the oil–pressure mass ratio, the greater the furfural loss. After oil replacement, the accelerated thermal aging experiment was carried out. The furfural concentration in the group with a lower oil–pressboard mass ratio increased faster than that of the group with the higher oil–pressboard mass ratio. In group E2, after 21 days of accelerated thermal aging (DP was about 300), the concentration of furfural dissolved in oil was only 58.1% of that in the group without oil replacement (Group E1). Also, the furfural concentration in the oil at the end stage of aging decreased when the oil–pressboard mass rate increased.
The polar molecules, such as water and acid molecules, in the oil were greatly decreased after oil replacement, and the polarity of the insulating oil was also greatly decreased. Consequently, the absorption capacity of insulating oil to furfural molecules was decreased. As a result, polar molecules were hardly diffused into the oil through the oil–pressboard boundary [35].

3.2. Furfural Concentration in the Oil and Pressboard

As shown in Figure 6, the furfural concentration in the oil increases with the increase of the furfural concentration in the pressboard. The lower the oil–pressboard mass ratio is, the higher the furfural concentration in the oil and pressboard, and the faster the furfural concentration increases.

3.3. The DP of Pressboard and Furfural Concentration in Oil

As shown in Figure 7, the furfural concentration in oil increases with the decrease of DP. At the same aging degree, the furfural concentration in oil and pressboard increases as the mass ratio of oil to pressboard decreases. At the same time, the growth rate of furfural concentration is inversely proportional to the decrease of the oil–pressboard mass ratio.

4. Data Analysis and Model Building

4.1. Equilibrium Distribution Ratio of Furfural

Data from groups A1, B1, C1, D1, and E1 were used to analyze the influence of aging degree and oil–pressboard mass ratio on furfural distribution ratio. The furfural mass fraction was used to characterize the equilibrium distribution ratio of furfural in oil–pressboard insulation systems, as shown in Equations (2) and (3). The experimental results are shown in Figure 8 and Figure 9.
w o i l   =   C o i l × V o i l C o i l × V o i l + C p r e s s b o a r d × M p r e s s b o a r d
w p r e s s b o a r d   =   C p r e s s b o a r d × M p r e s s b o a r d C o i l × V o i l + C p r e s s b o a r d × M p r e s s b o a r d
where Coil is the concentration of furfural in insulating oil, Voil is the volume of insulating oil woil is the mass fraction of furfural in the oil and wpressboard is the mass fraction of furfural in the pressboard.
It can be concluded from Figure 8 that the mass fraction of furfural in oil increased with aging time, while the mass fraction of furfural in the pressboard decreased. It can be easily found that the degree of aging has a significant influence on the distribution ratio of furfural in the oil–pressboard system.
After oil replacement, it can be concluded from Figure 9 that, the distribution ratio of furfural in oil decreased with the increase of oil–pressboard mass ratio. Most of the small molecule polar substances in insulating oil were lost due to oil replacement. Furthermore, the low concentration of small molecular polar substances in the new oil had weak adsorption capacity to furfural. After oil replacement, the proportion of furfural in oil increased with the deterioration of insulating oil. With the further deepening of the aging degree, the number of polar substances in insulating oil increased significantly, which enhanced the adsorption capacity of oil to furfural. However, after 21 days of accelerated thermal aging (DP was about 300), the distribution ratio of furfural in oil after oil replacement was lower than that without oil replacement. The results showed that oil replacement had a significant effect on the distribution ratio of furfural in the oil–pressboard system.
The effects of aging degree of oil and pressboard on furfural distribution behavior in oil were studied. A total of eight sample groups (Rs) were used. R1 to R4, which were used to investigate the effect of different aging degrees of insulating pressboard on the distribution of furfural between oil and pressboard under new oil environments. R3 and R5–R8 were used to explore the effect of different aging degrees of insulating oil on the distribution of furfural between oil and pressboard with the same aging degree of pressboard, as shown in Table 4. The experimental data are shown in Figure 10 and Figure 11.
The experimental results indicated in Figure 10 show that, under the premise of the same aging degree of the insulating oil, the deeper the aging degree of pressboard, the greater the mass fraction of furfural in the oil. Therefore, the aging degree of the insulating pressboard determines the distribution of furfural in the oil–pressboard insulation system. Figure 11 shows that, under the premise of the same aging degree of the insulating pressboard, the aging degree of the insulating oil has little effect on the mass fraction of furfural in the oil–pressboard system. Therefore, the aging degree of the insulating oil does not affect the equilibrium distribution of furfural in the oil–pressboard insulation system. Combined with the results of Figure 10 and Figure 11, it can be concluded that the aging degree of pressboard is the main factor affecting the equilibrium distribution of furfural between the oil and pressboard. The aging of the insulating pressboard will promote the diffusion of furfural from the insulating pressboard to the insulating oil.

4.2. The Establishment of the Equilibrium Distribution Model

The model of furfural equilibrium distribution between oil and pressboard was established and validated in 35 data sets of oil–pressboard insulating samples, with seven types of oil–pressboard aging degrees and five types of oil–pressboard mass ratios. Thirty groups of data were selected from 35 groups to establish the equilibrium distribution model. The distribution ratio of furfural dissolved in oil was taken as the dependent variable, while oil–pressboard mass ratio and degree of polymerization of the insulating pressboard were taken as independent variables. The equilibrium distribution model of furfural established is shown in Equation (4).
w o i l   =   a + b × M R + c × D P
In Equation (4), woil represents the furfural distribution ratio in oil (%), MR represents the oil–pressboard mass ratio, and DP represents the degree of polymerization of insulating pressboard. In addition, a = 0.450, b = 0.0073, and c = −0.00052. The fitting results of 30 groups of samples are shown in Figure 12. The goodness of fit R2 = 0.928 indicates that the model is in good agreement with the actual value. As shown in Table 5, t-values were used to determine significance, and when the significance level is less than 0.05, it indicates that the regression equation is effective.
As shown in Figure 13, the residual error is fitted. The results show that the residual is in good agreement with the normal distribution, and the mean value was zero. Therefore, the equilibrium distribution model of furfural between oil and pressboard is effective.
The distribution model of furfural in oil–pressboard was verified by five groups of data from 35 groups of samples. Table 6 shows the oil–pressboard mass ratio (MR), degree of polymerization (DP), the actual distribution ratio of furfural in oil obtained in the experiment (woil), and the predicted value calculated by five verification samples, according to Equation (4). The accuracy (%) is the ratio of the calculated value to the actual value.
It can be seen from Table 6 that the furfural distribution model between oil and pressboard can accurately predict the distribution ratio of furfural dissolved in oil with various oil–pressboard mass ratios and aging degrees, so the equilibrium distribution model is effective. Figure 14 shows the comparison between the predicted value and measured value of furfural distribution ratio in oil.

4.3. The Influence of Oil Replacement on the Equilibrium Distribution Ratio of Furfural and Correction

Data from groups A2, B2, C2, D2, and E2 were used to analyze the influence of oil replacement on the furfural distribution ratio. The furfural concentration in oil was greatly lost after oil replacement, and the proportion of furfural in oil decreased dramatically.
The expression of the correction factor for the equilibrium distribution ratio of furfural in oil is shown in Equation (5), where t is the aging time, tre is the time point of oil replacement, w0(t) represents the distribution ratio of furfural in oil at time t without oil replacement, and w1(t) is the distribution ratio of furfural in oil at time t after oil replacement.
f ( t )   =   { 1 t < t r e w 1 ( t ) w 0 ( t ) t t r e
In both Equations (4) and (5), the modified furfural distribution model under oil replacement conditions is established, as shown in Equation (6), where the parameter wc represents the distribution ratio of furfural in oil after the correction of the oil replacement sample.
w c = w 1 ( t ) f ( t ) =   0.450 + 0.0073 × M R 0.00052 × D P
According to the experimental results, the relationship between the oil replacement correction factor for the furfural distribution ratio in oil and aging time was obtained by Equation (6), as shown in Figure 15. After the oil replacement, the correction factor suddenly dropped to around 0.2. At the initial stage after the oil replacement, the furfural distribution ratio correction factor in oil increased rapidly, and then the rate of increase slowed down over time. Equation (7), in which t is the aging time and tre is the time point of oil replacement, was used to fit the oil replacement correction factor. The fitting results of each constant are shown in Table 7.
f ( t )   =   { 1 t < t r e m + n × e k ( t t r e ) t t r e
The parameter m represents the correction factor for the equilibrium distribution ratio of furfural in oil as time goes to infinity (t = ∞) after the oil replacement. The parameter n is preexponential factor, parameters m + n represents the correction factor for the equilibrium distribution ratio of furfural in the oil at the moment of oil replacement. The parameter k represents the increasing speed of the furfural distribution ratio correction factor, which increases with the increase of oil–pressboard mass ratio. R2 stands for the goodness of fit of the parameters.
Based on the results of groups A2, B2, C2, and D2 from Table 7, the functional relationship between m, n, k, and the oil replacement ratio were established respectively, as shown in Equation (8) and Figure 16.
The parameter MR represents the oil–pressboard mass ratio.
{ m   =   0.0153 × M R + 1.077 n   =   0.03 × M R 0.972 k   =   1 1.418 0.0383 × M R + 0.00289 × M R 2
The oil–pressboard mass ratio of group E2 (ε = 25) is taken into Equation (8) to calculate the corresponding m, n, and k values, and then m, n, and k are brought into Equation (7) to obtain the furfural distribution ratio correction factor of group E2. After introducing the correction factor of the furfural distribution ratio in oil into Equation (6), the distribution ratio deviation caused by oil replacement was well-corrected, and the corrected results were close to the real value, as shown in Figure 17, which proved the feasibility of the proposed model.

5. Conclusions

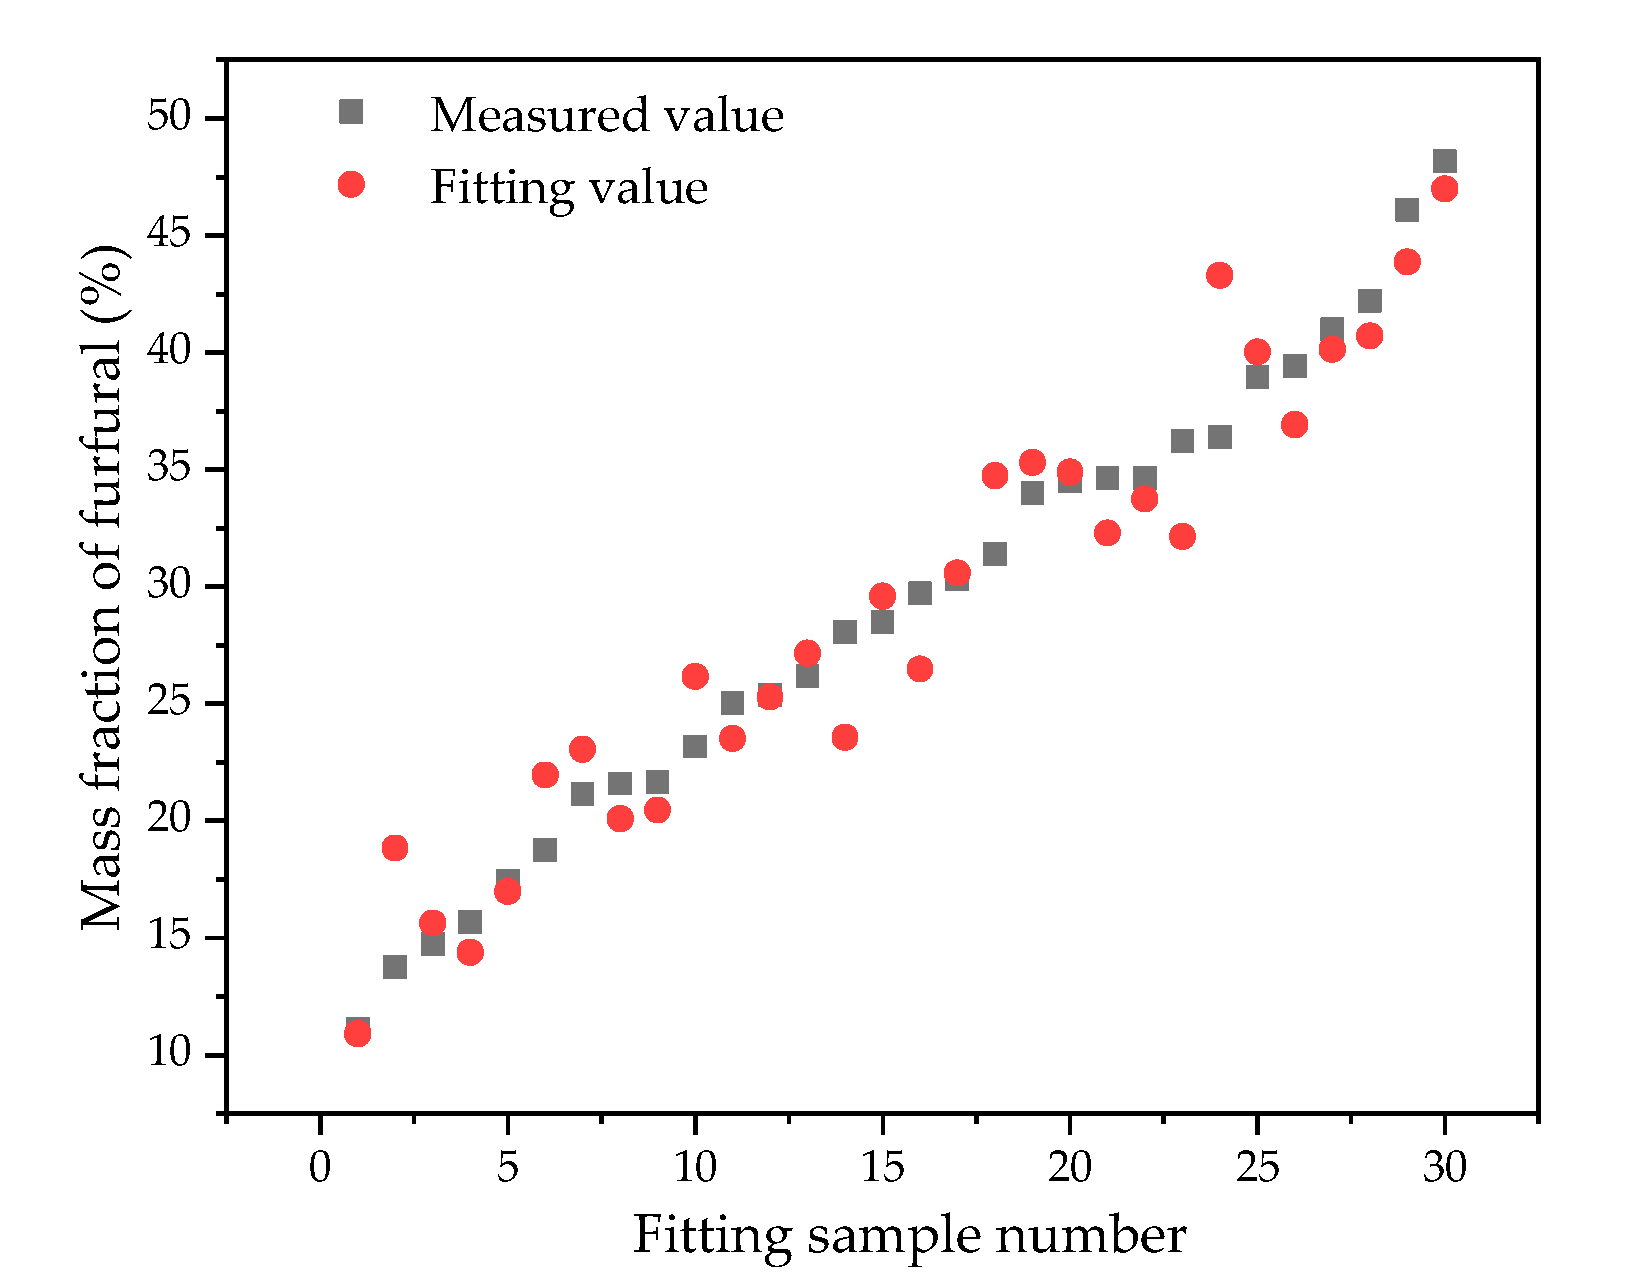
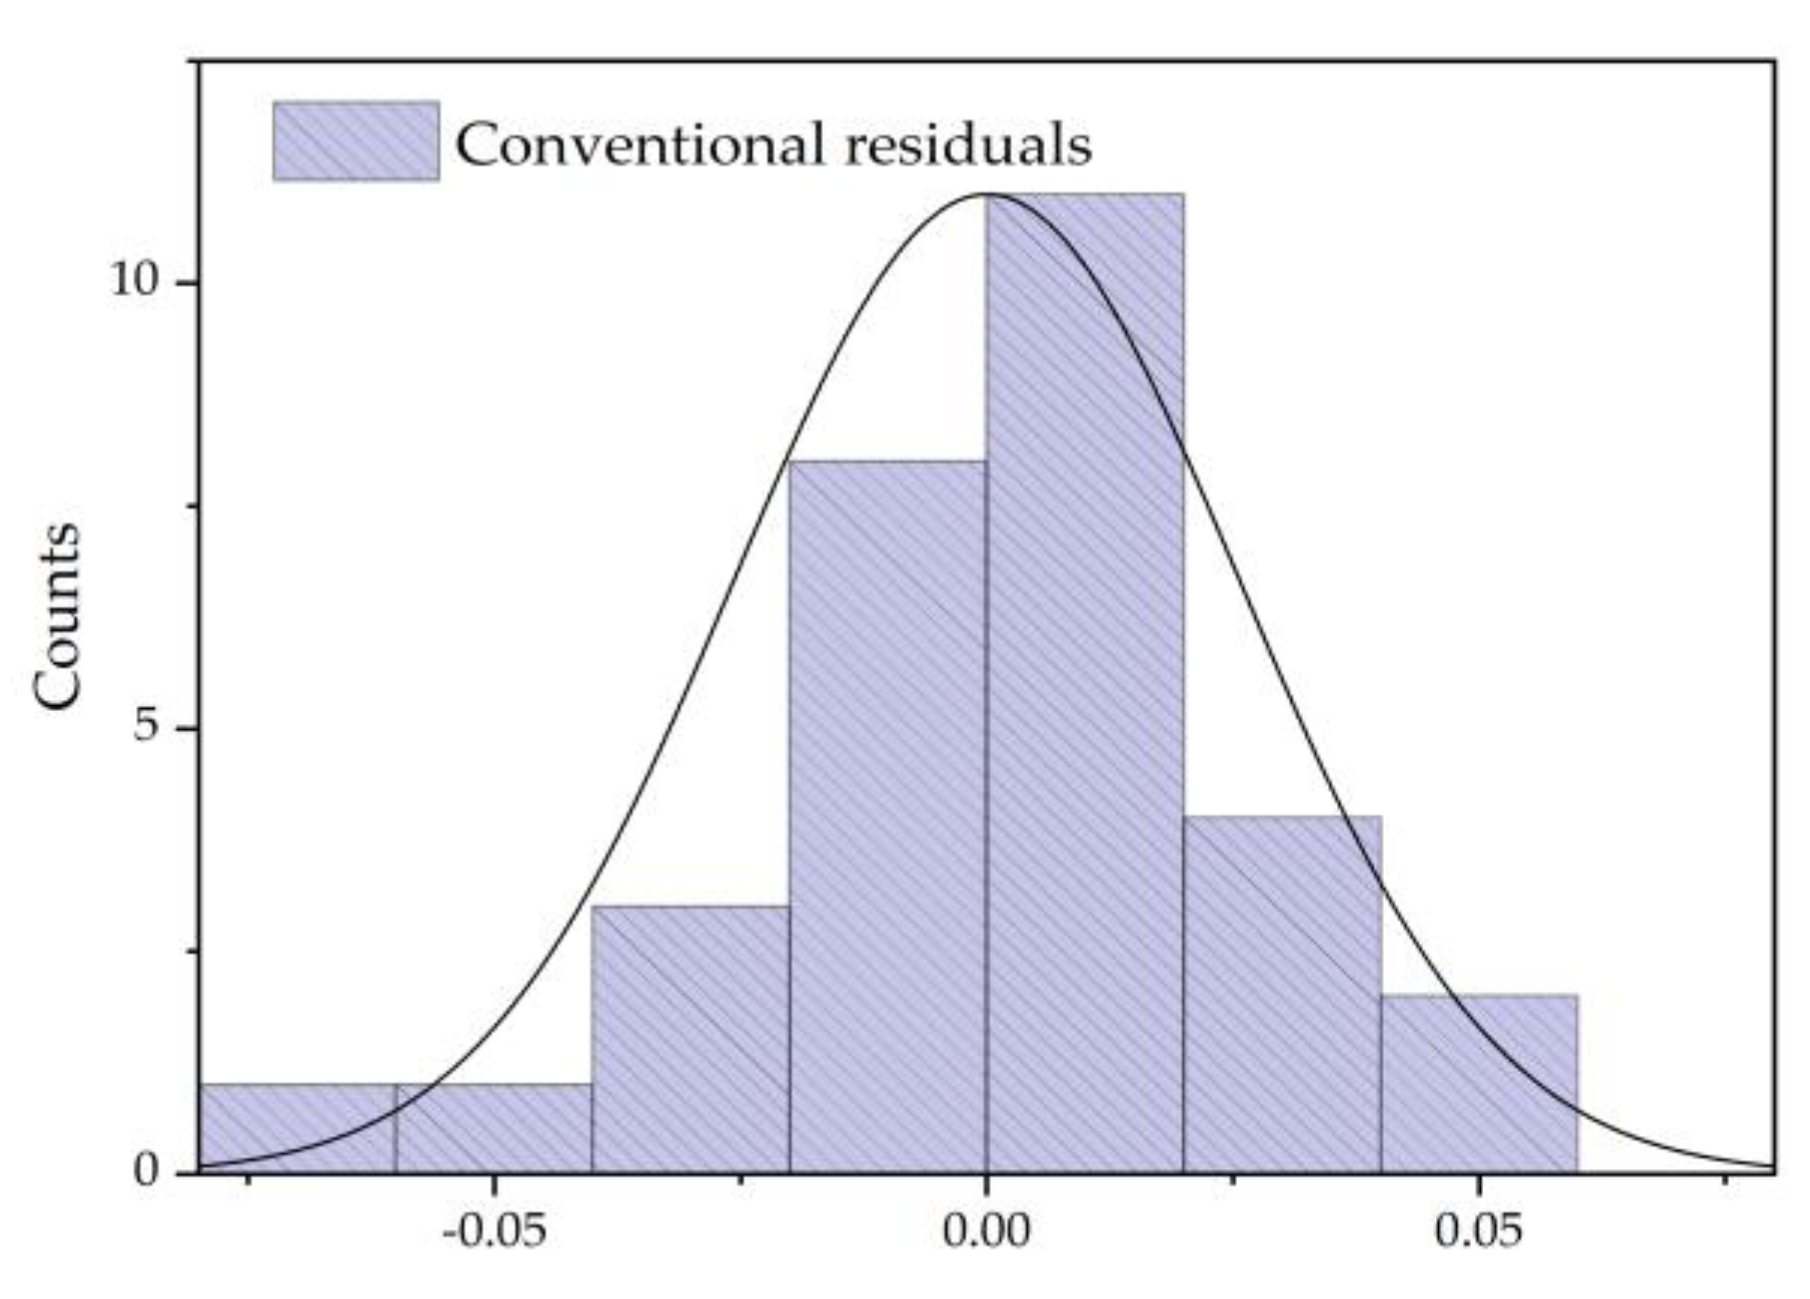
In this paper, the effect of oil replacement on the distribution behavior of furfural in oil under different oil–pressboard mass ratio systems was investigated. After accelerated thermal aging experiments and furfural equilibrium experiments, the results show that the oil–pressboard mass ratio will obviously affect the content and distribution of furfural in oil. The equilibrium distribution model of furfural under different oil–pressboard mass ratios was established, and the fitting data were verified by multiple linear regression. The correction model of the equilibrium distribution of furfural after oil replacement was obtained and verified by the validation group data. The main conclusions are as follows:
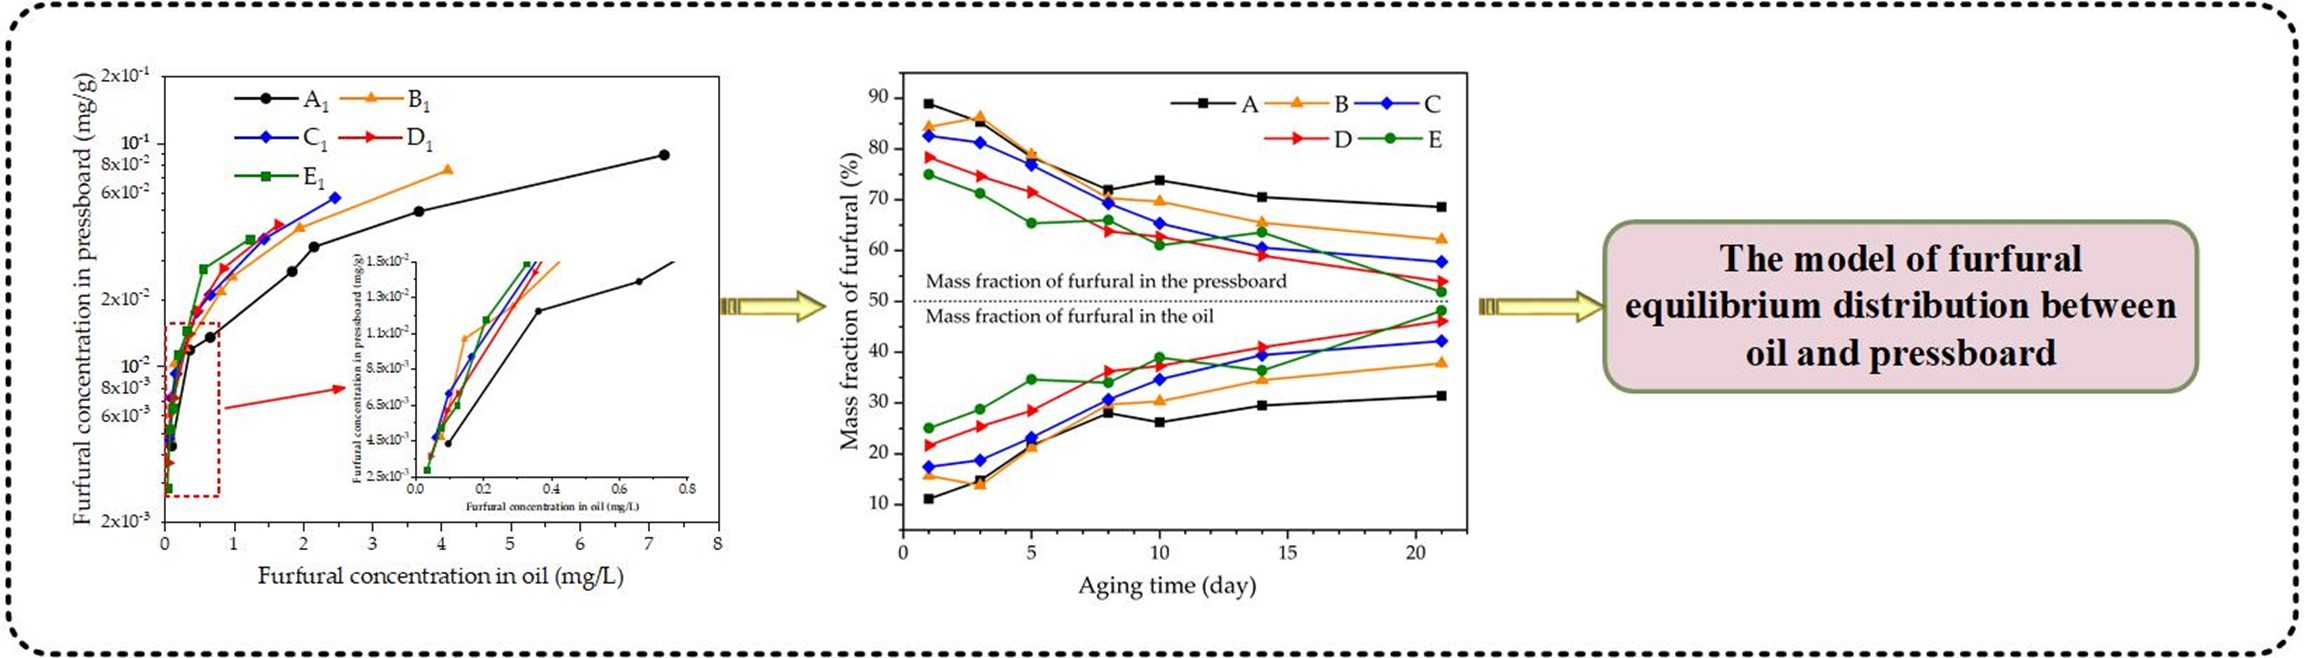
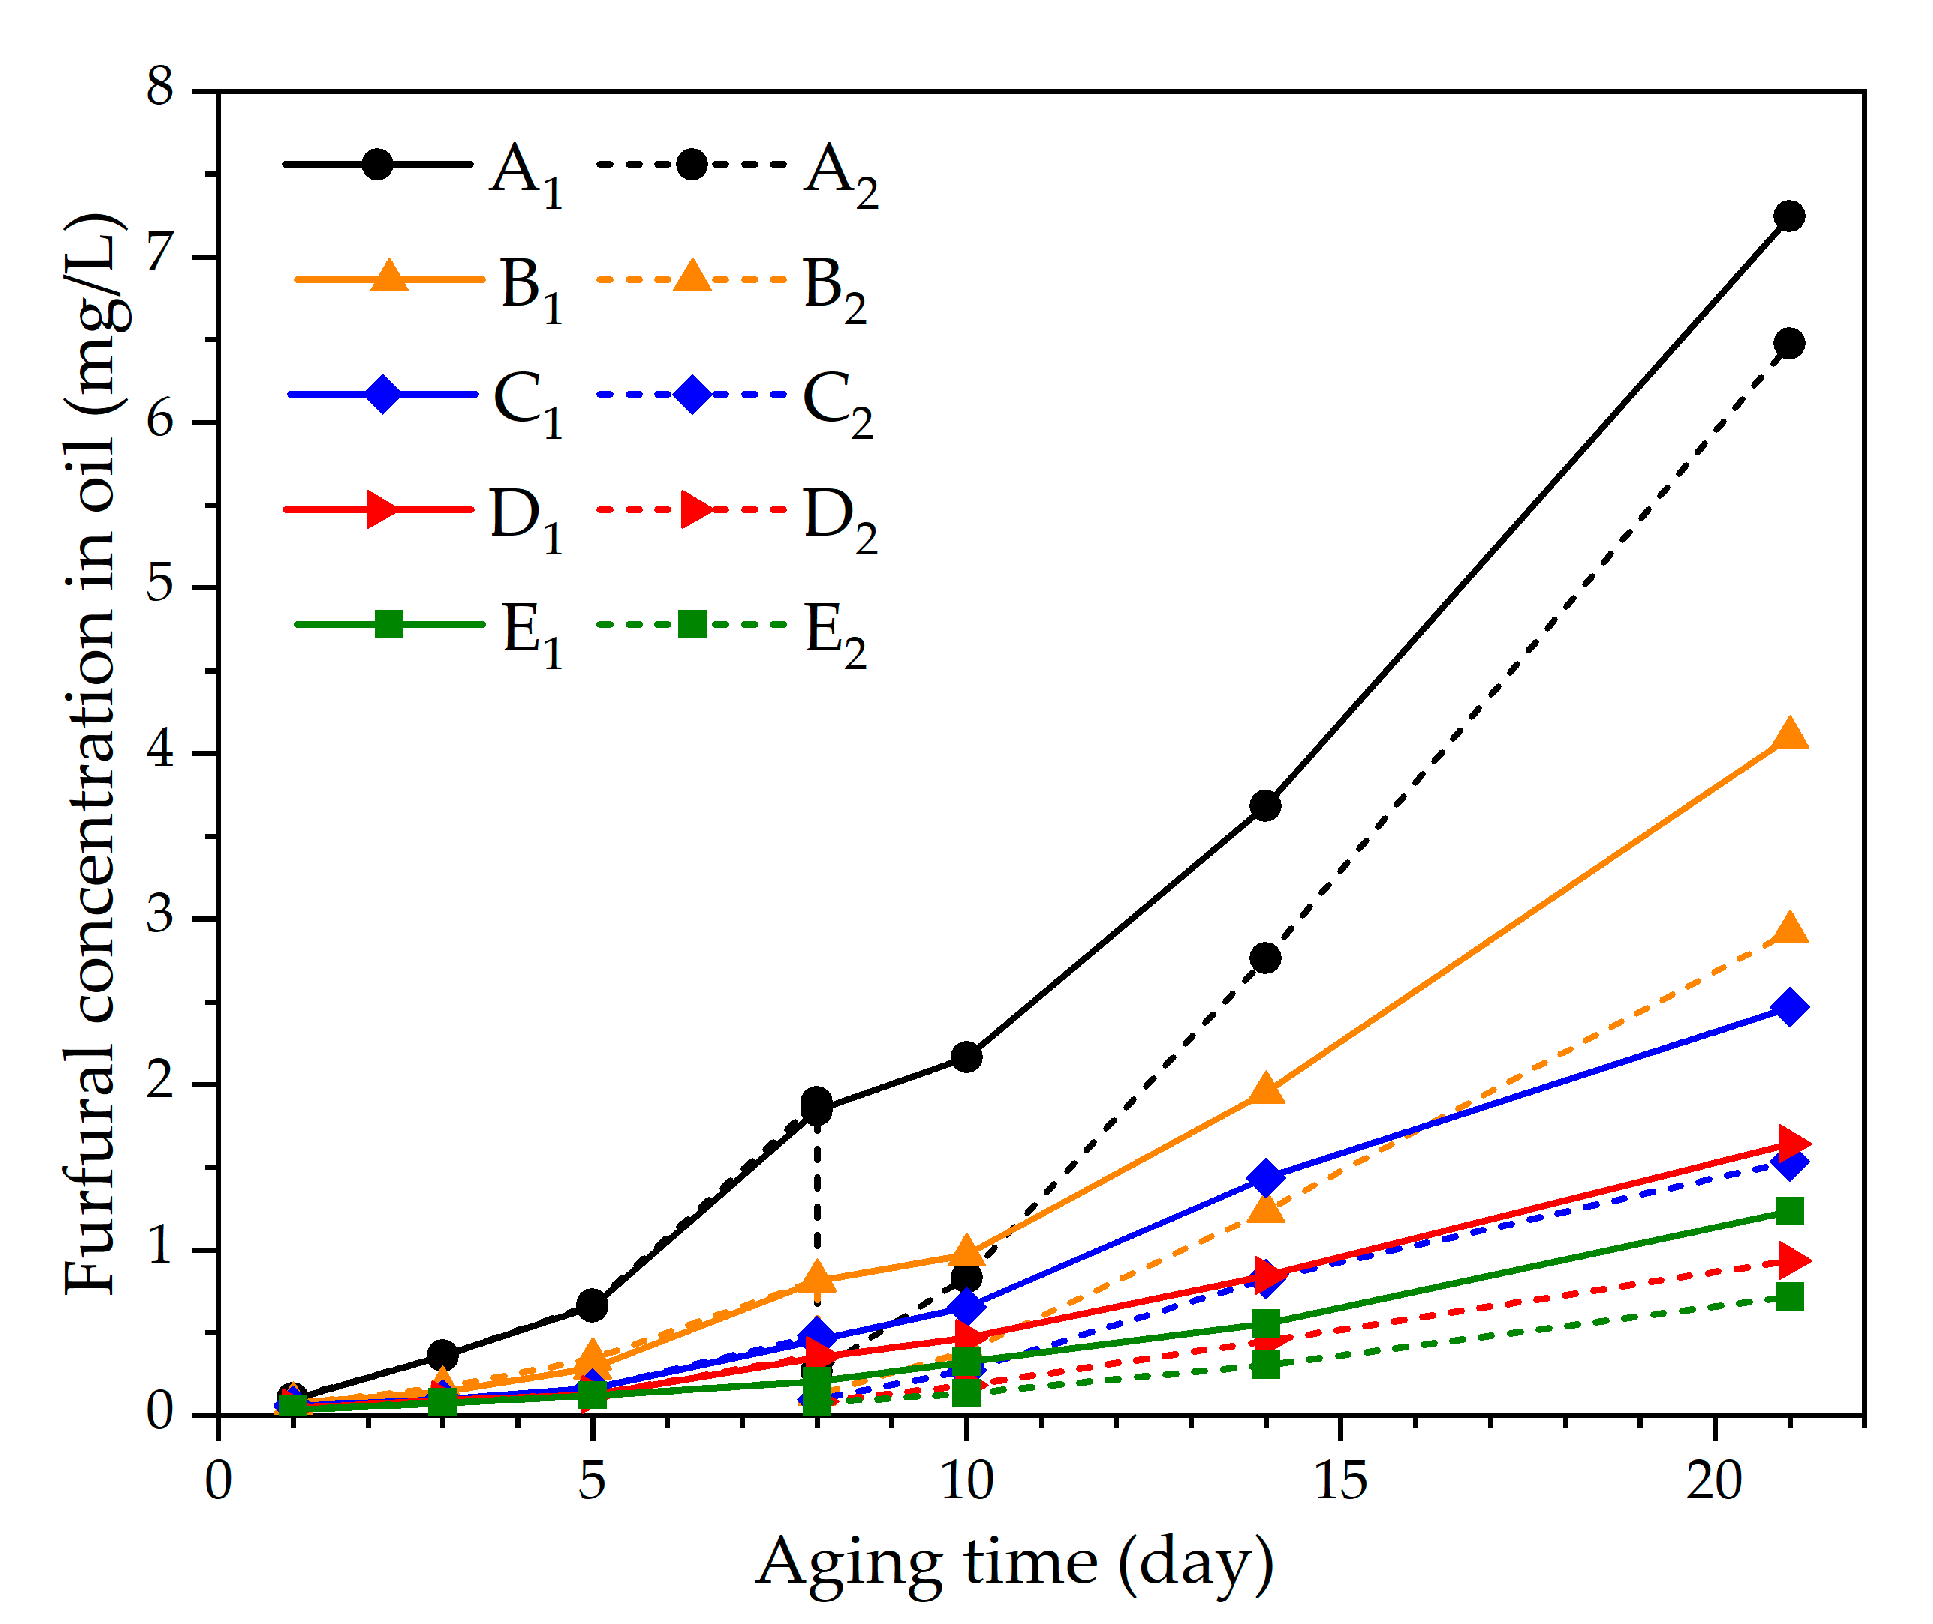
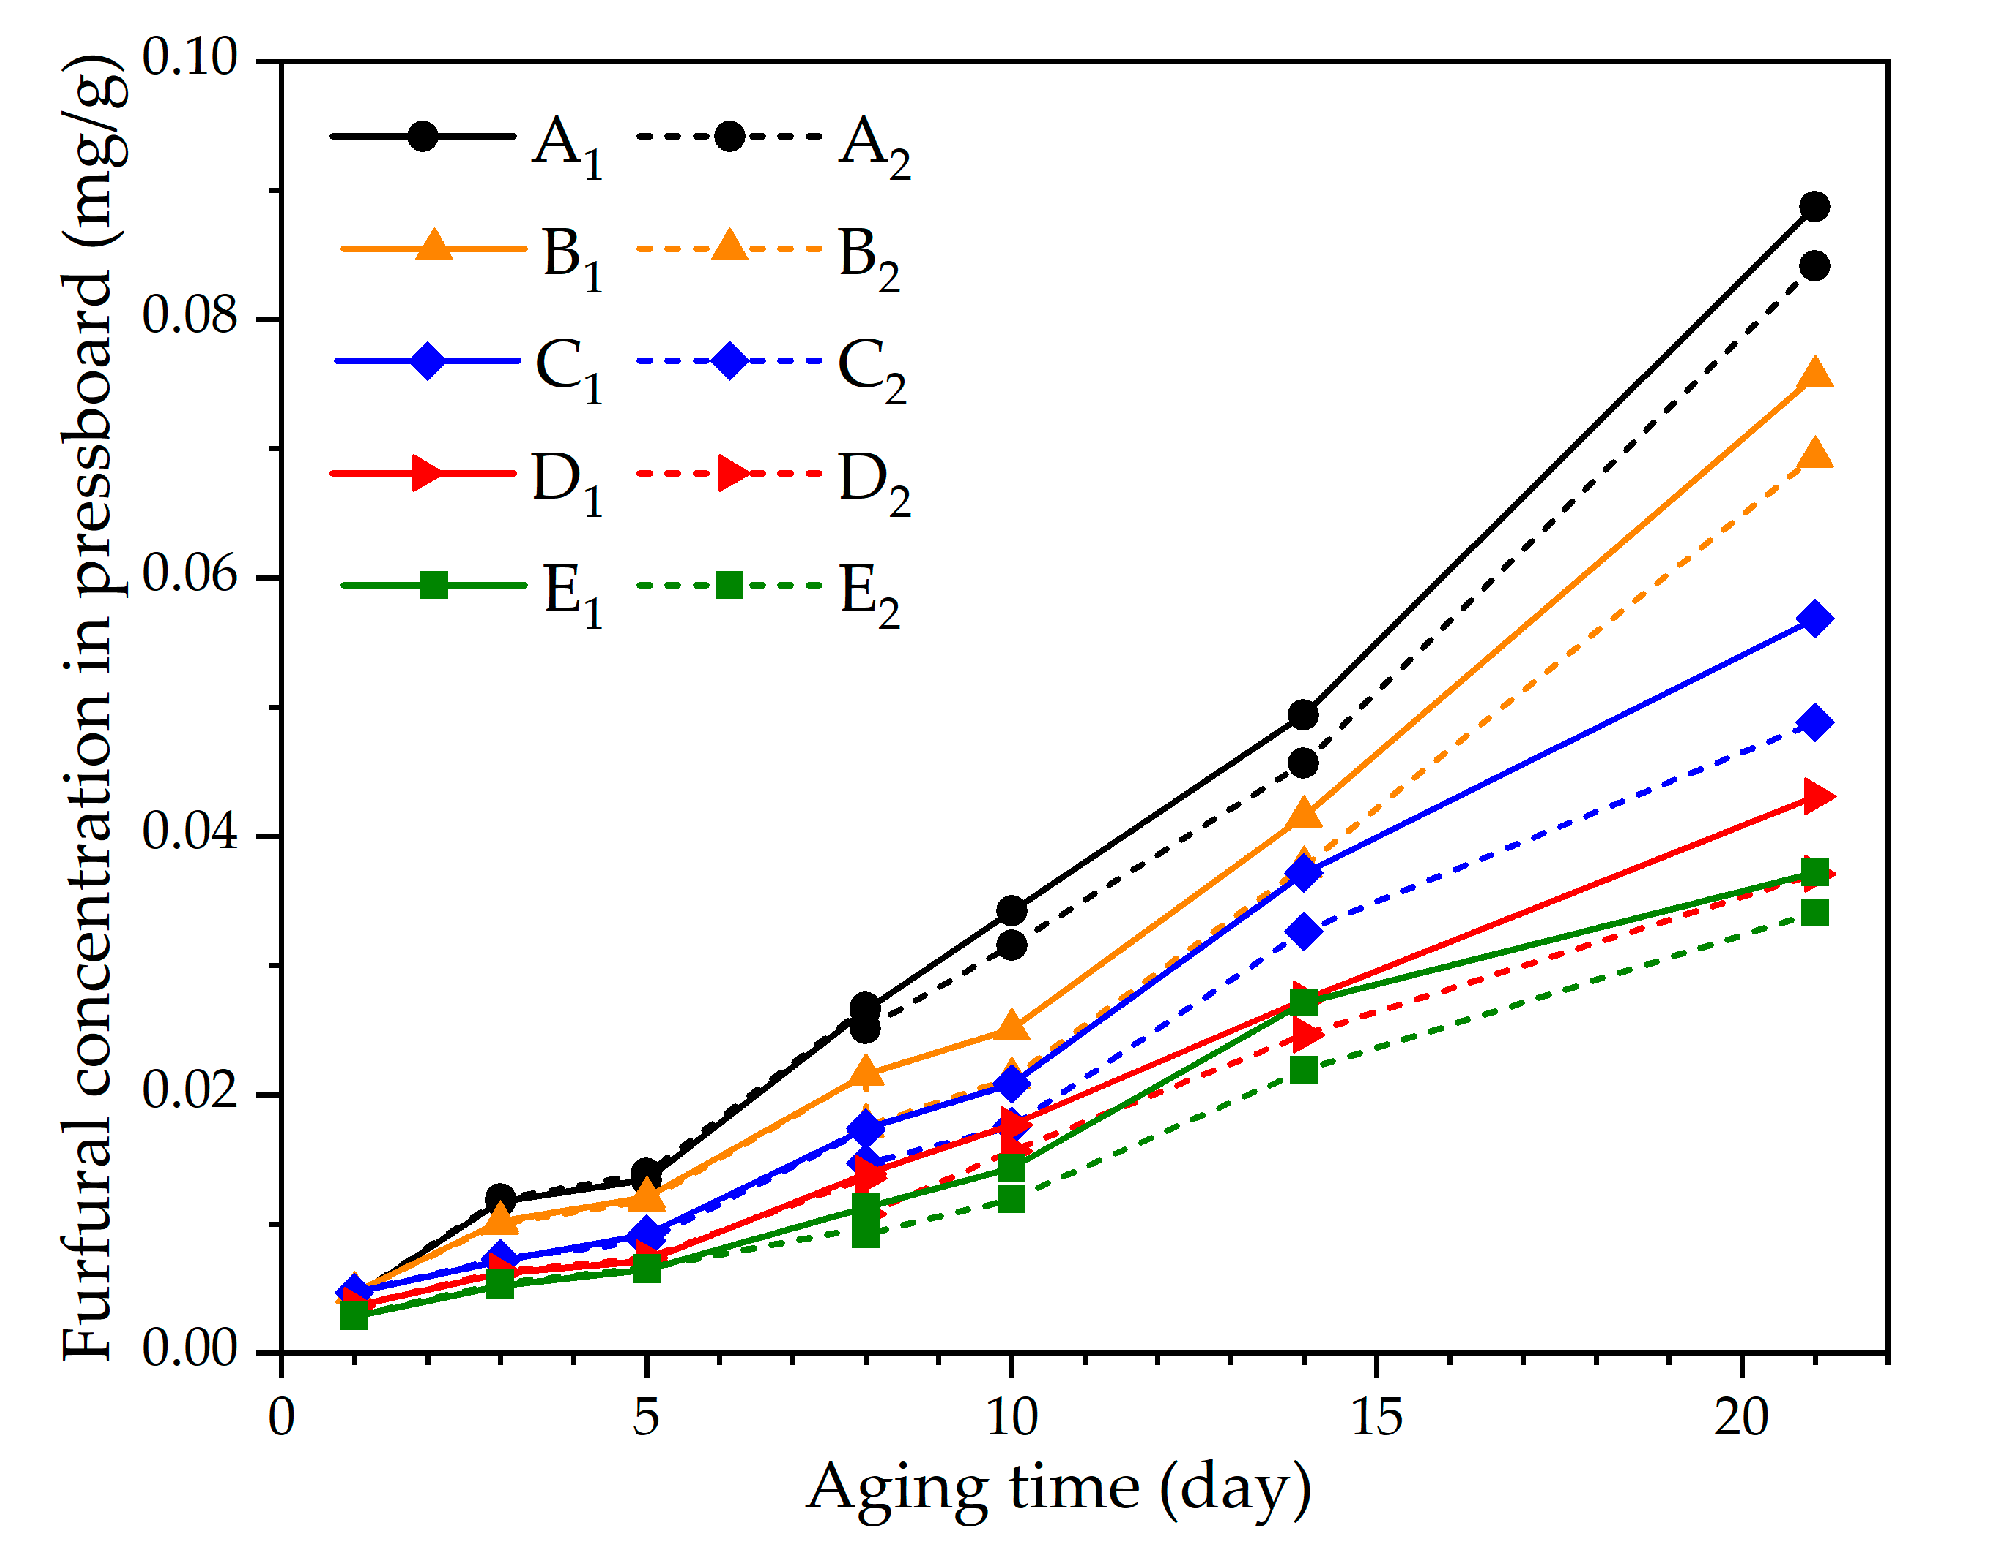
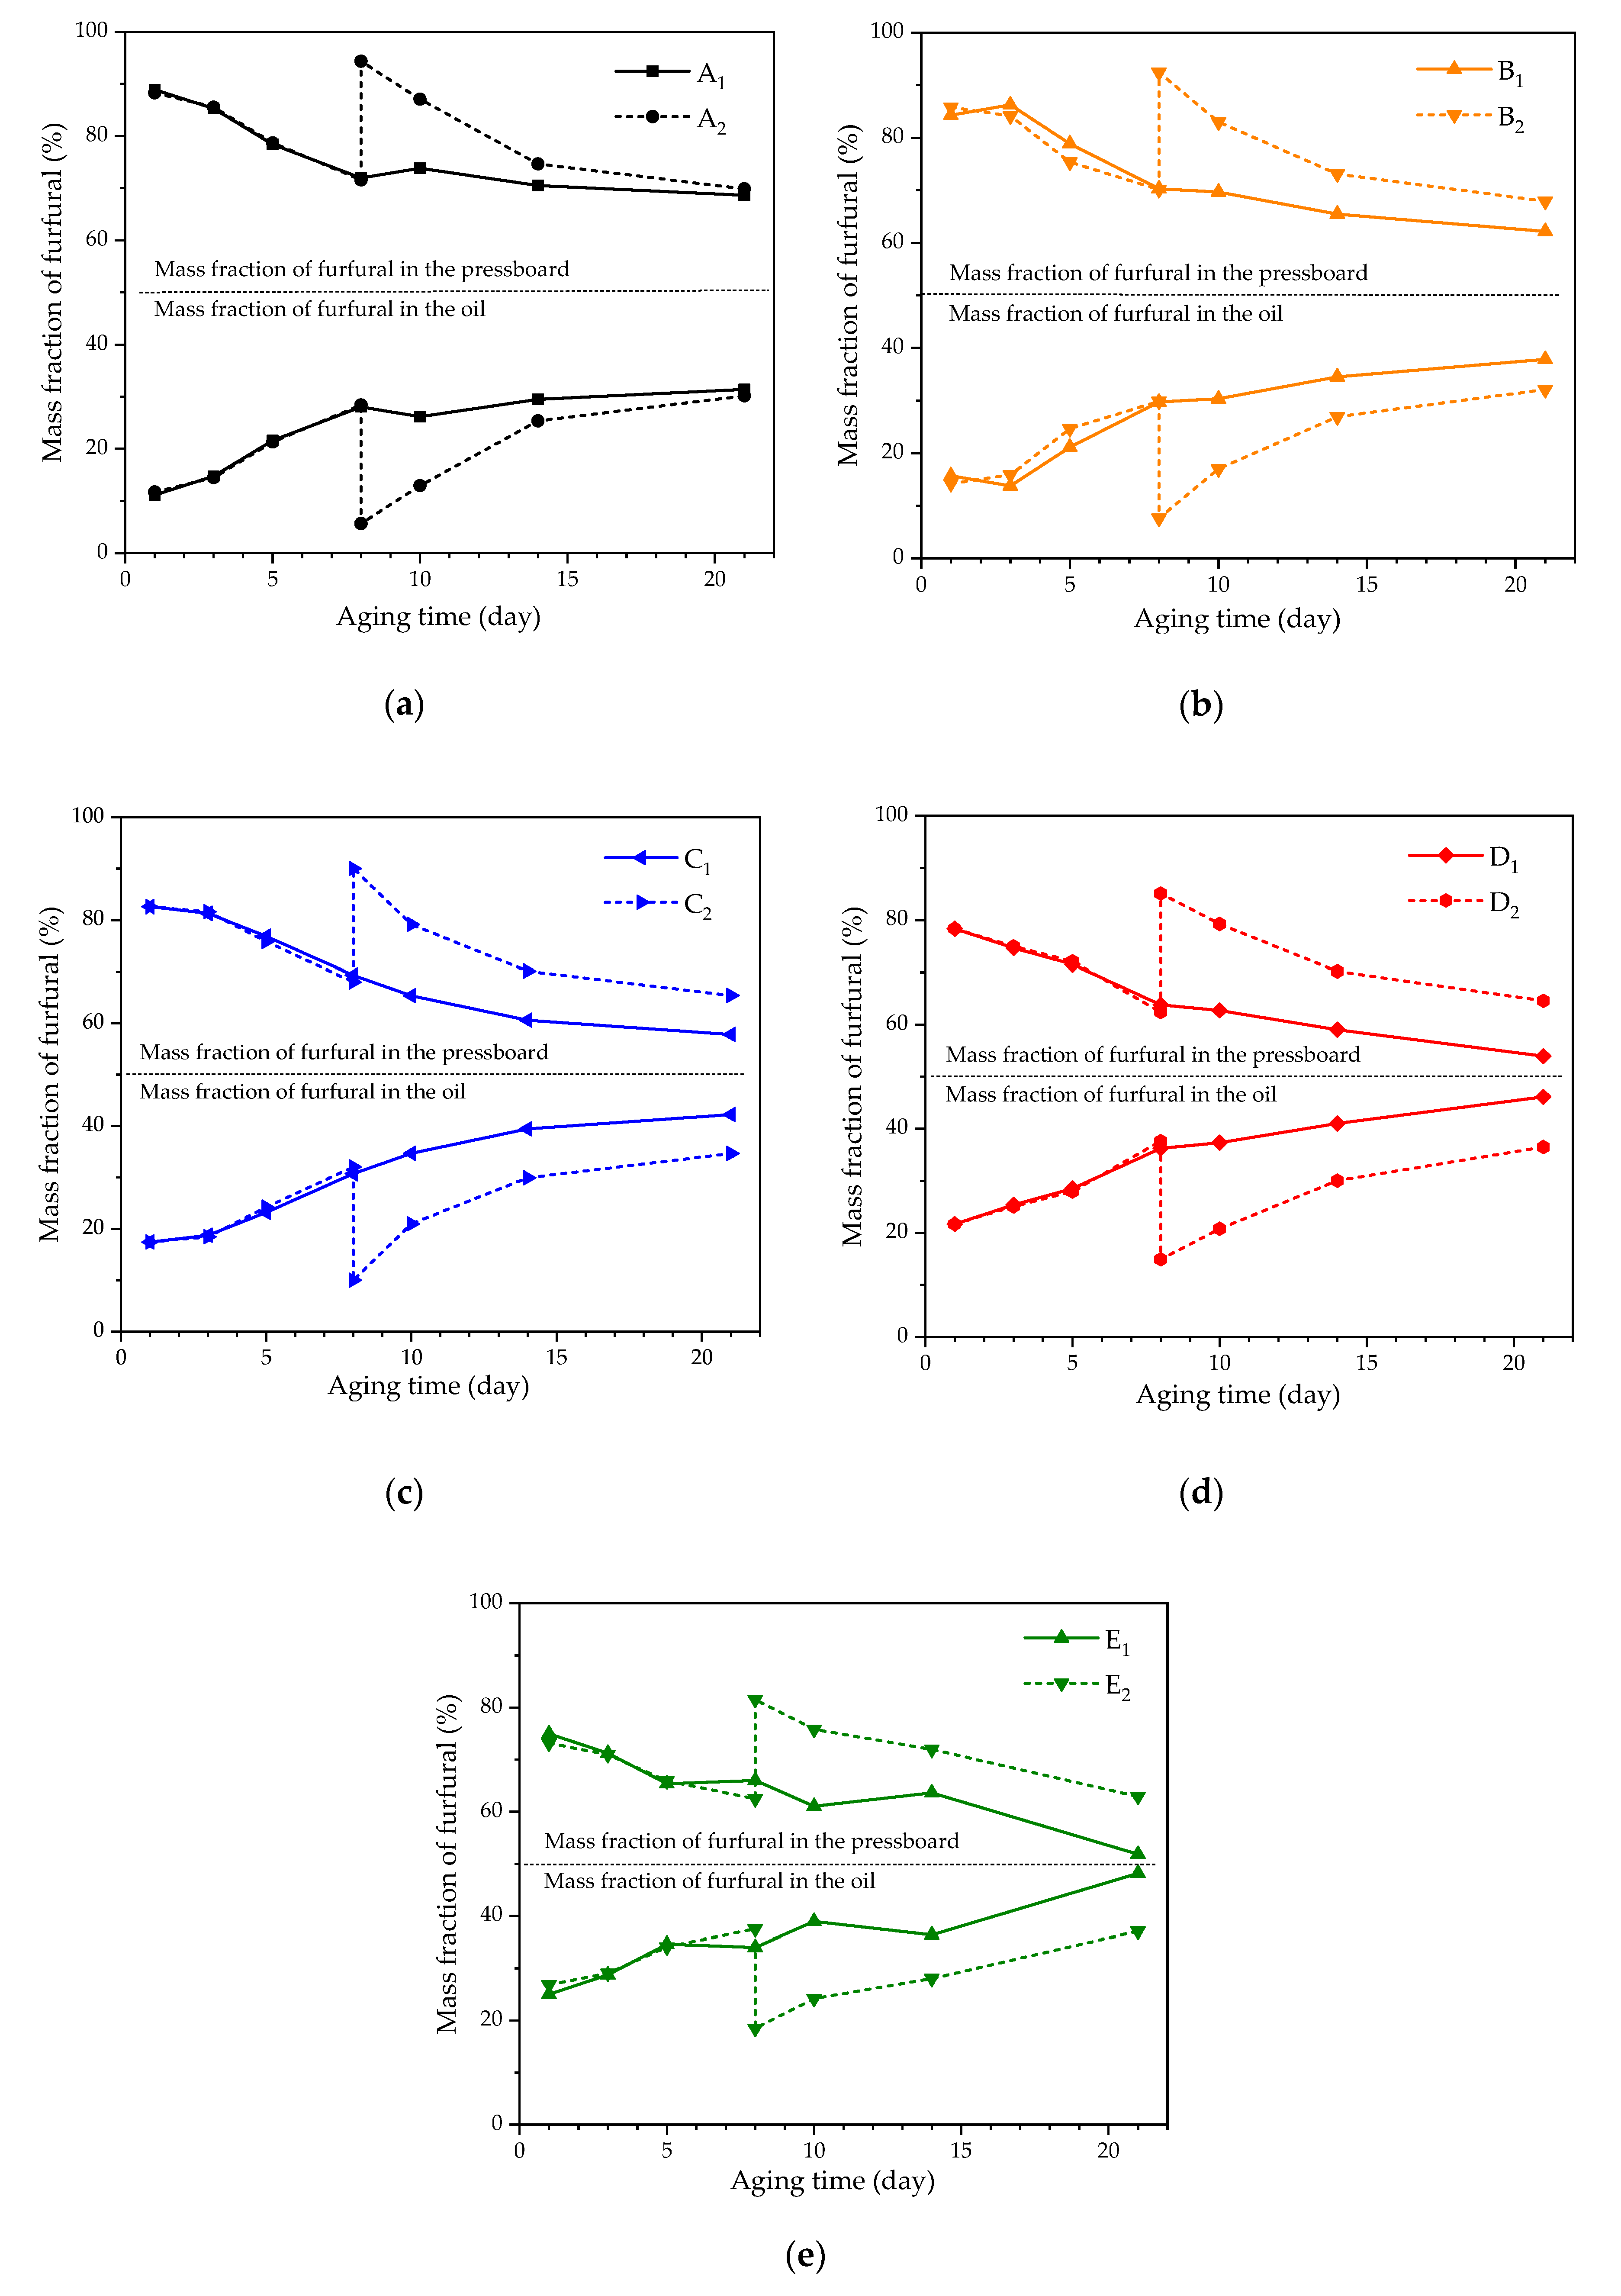
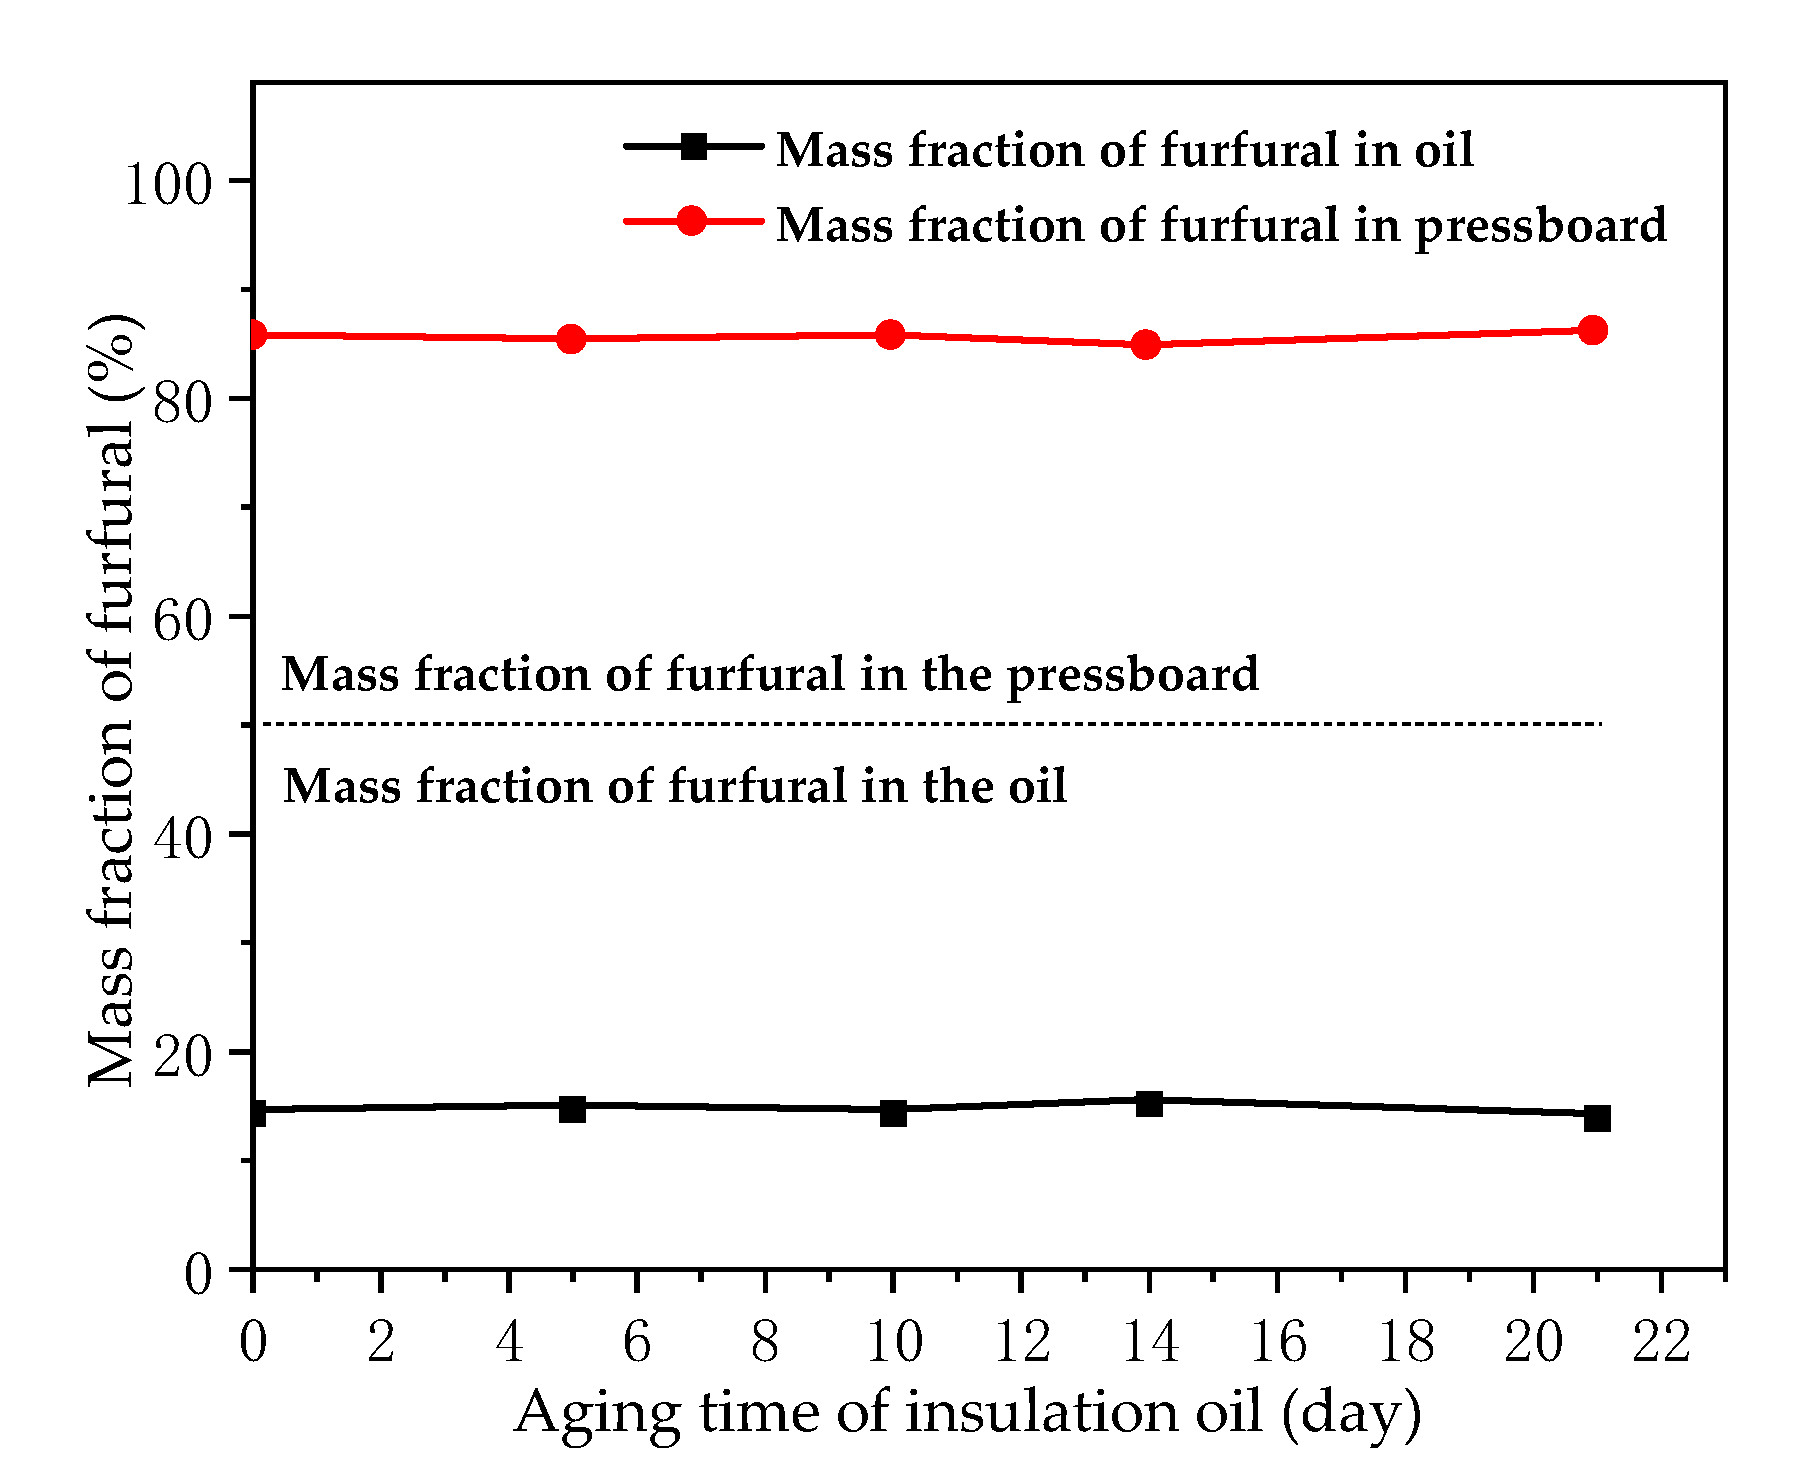
  • Furfural partitioning between oil and pressboard was influenced by the oil–pressboard mass ratio. The mass fraction of the furfural in oil increased with the decrease of the oil–pressboard mass ratio. In addition, the experiment shows that the aging degree of pressboard is an important factor that determines the distribution behavior of furfural between oil and pressboard, while the aging degree of oil has little effect on the distribution behavior of furfural;
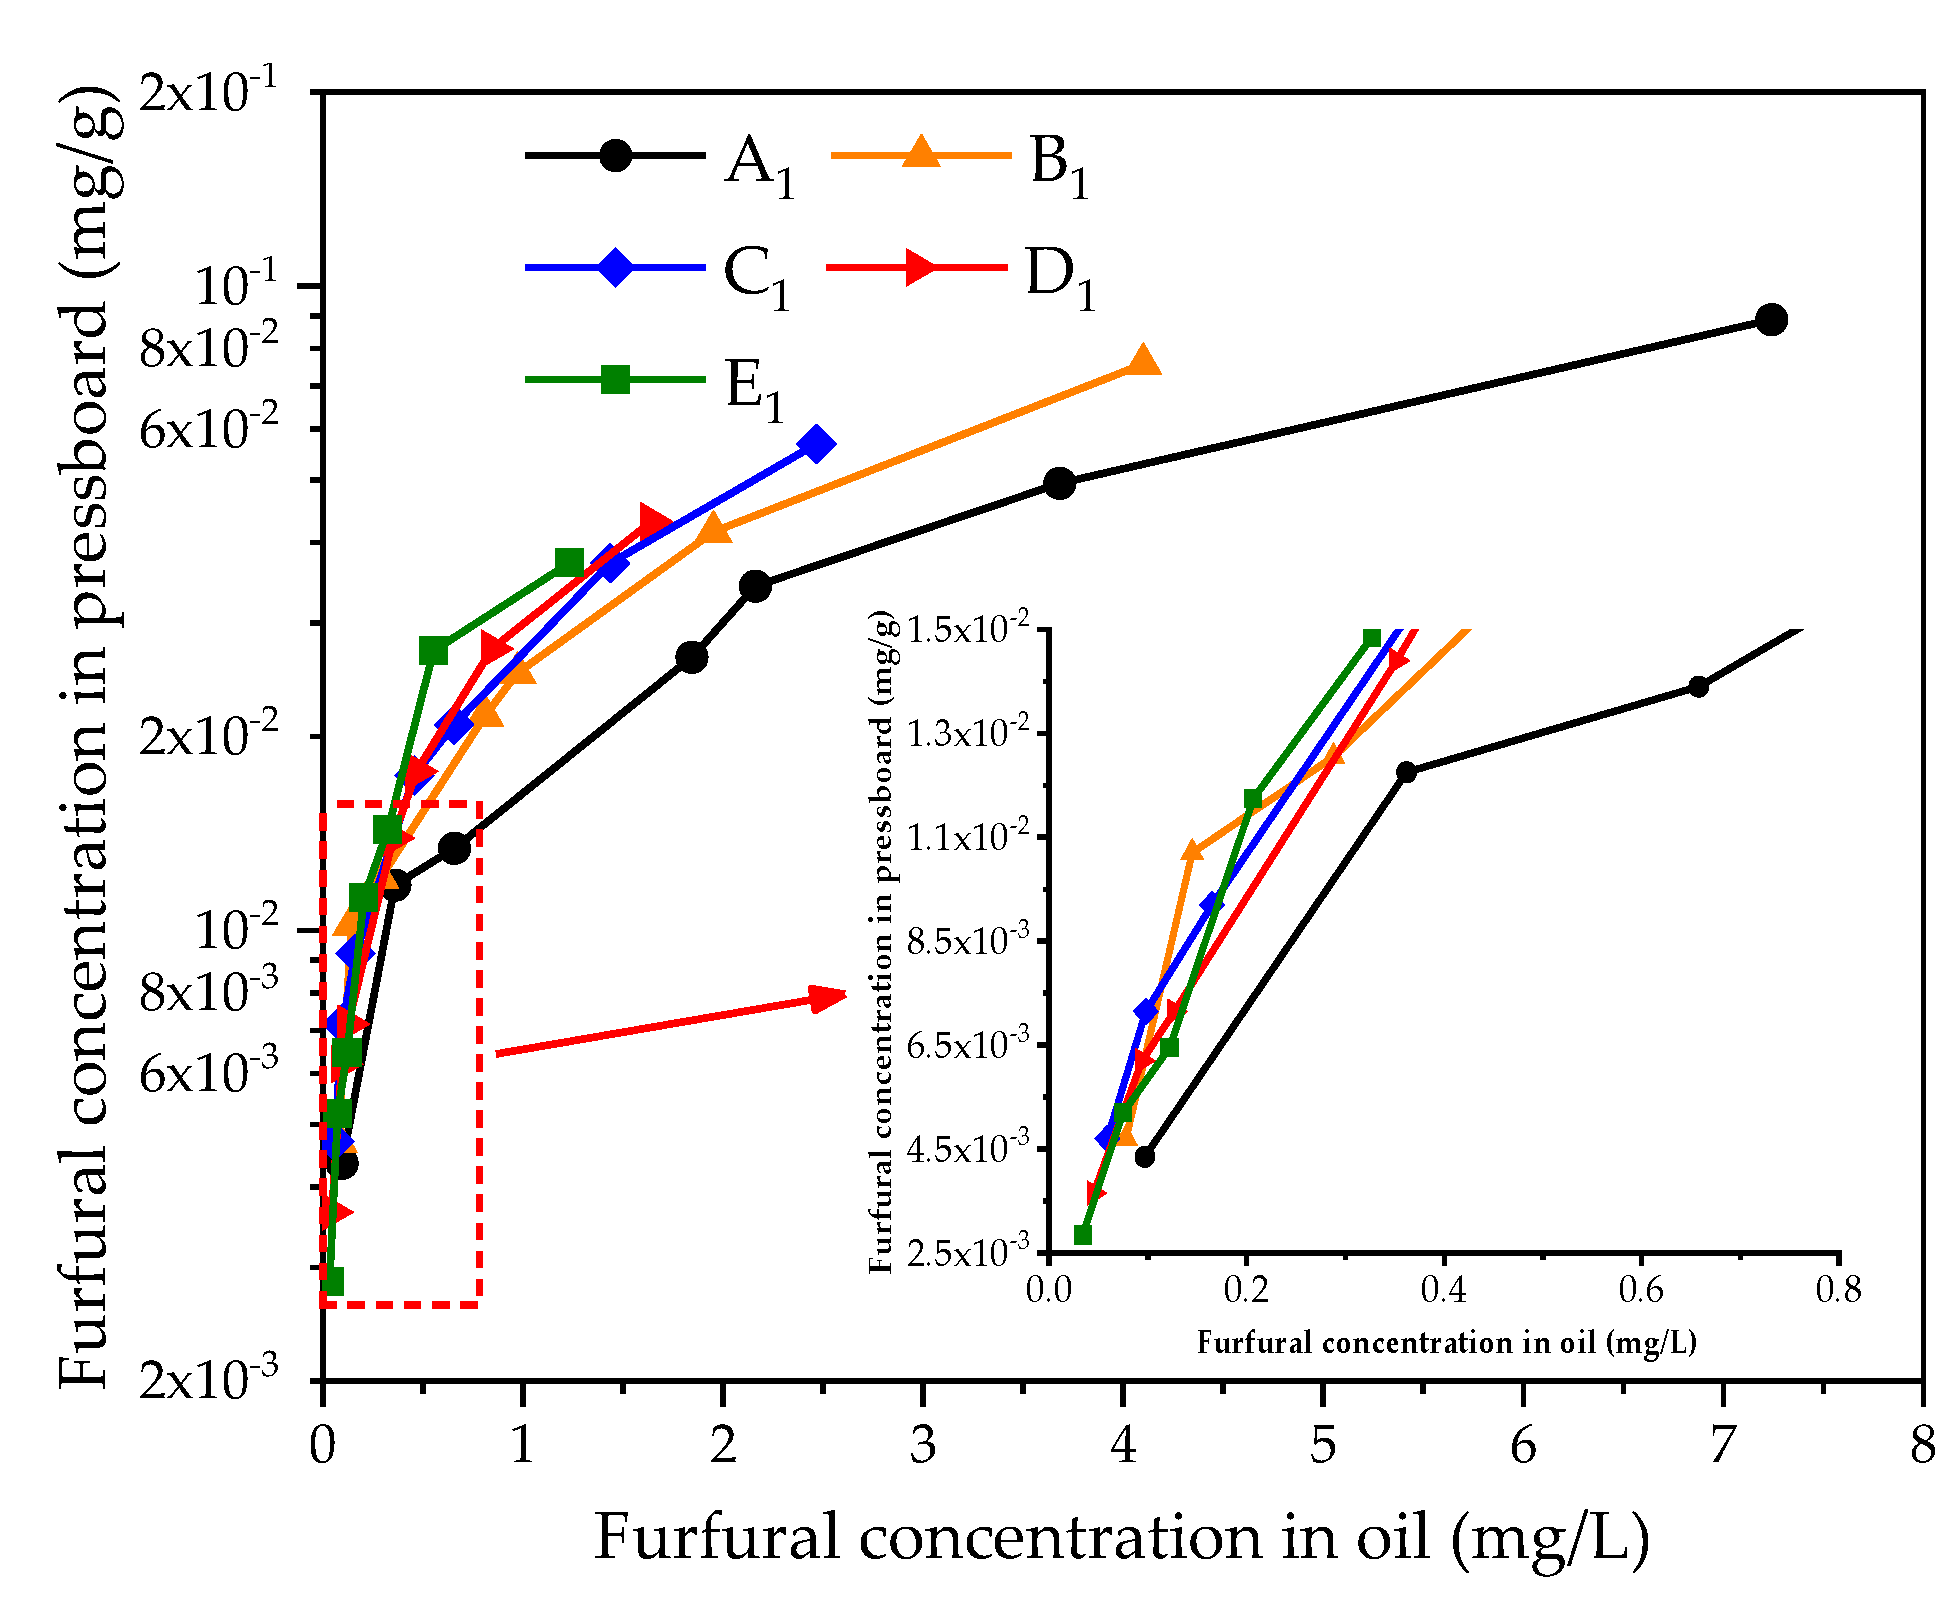
  • The equilibrium distribution model of furfural was then established. The results show that the proportion of furfural in oil is also affected by the aging degree of insulating pressboard: the deeper the age of the insulating pressboard, the greater the distribution ratio of furfural in the oil;
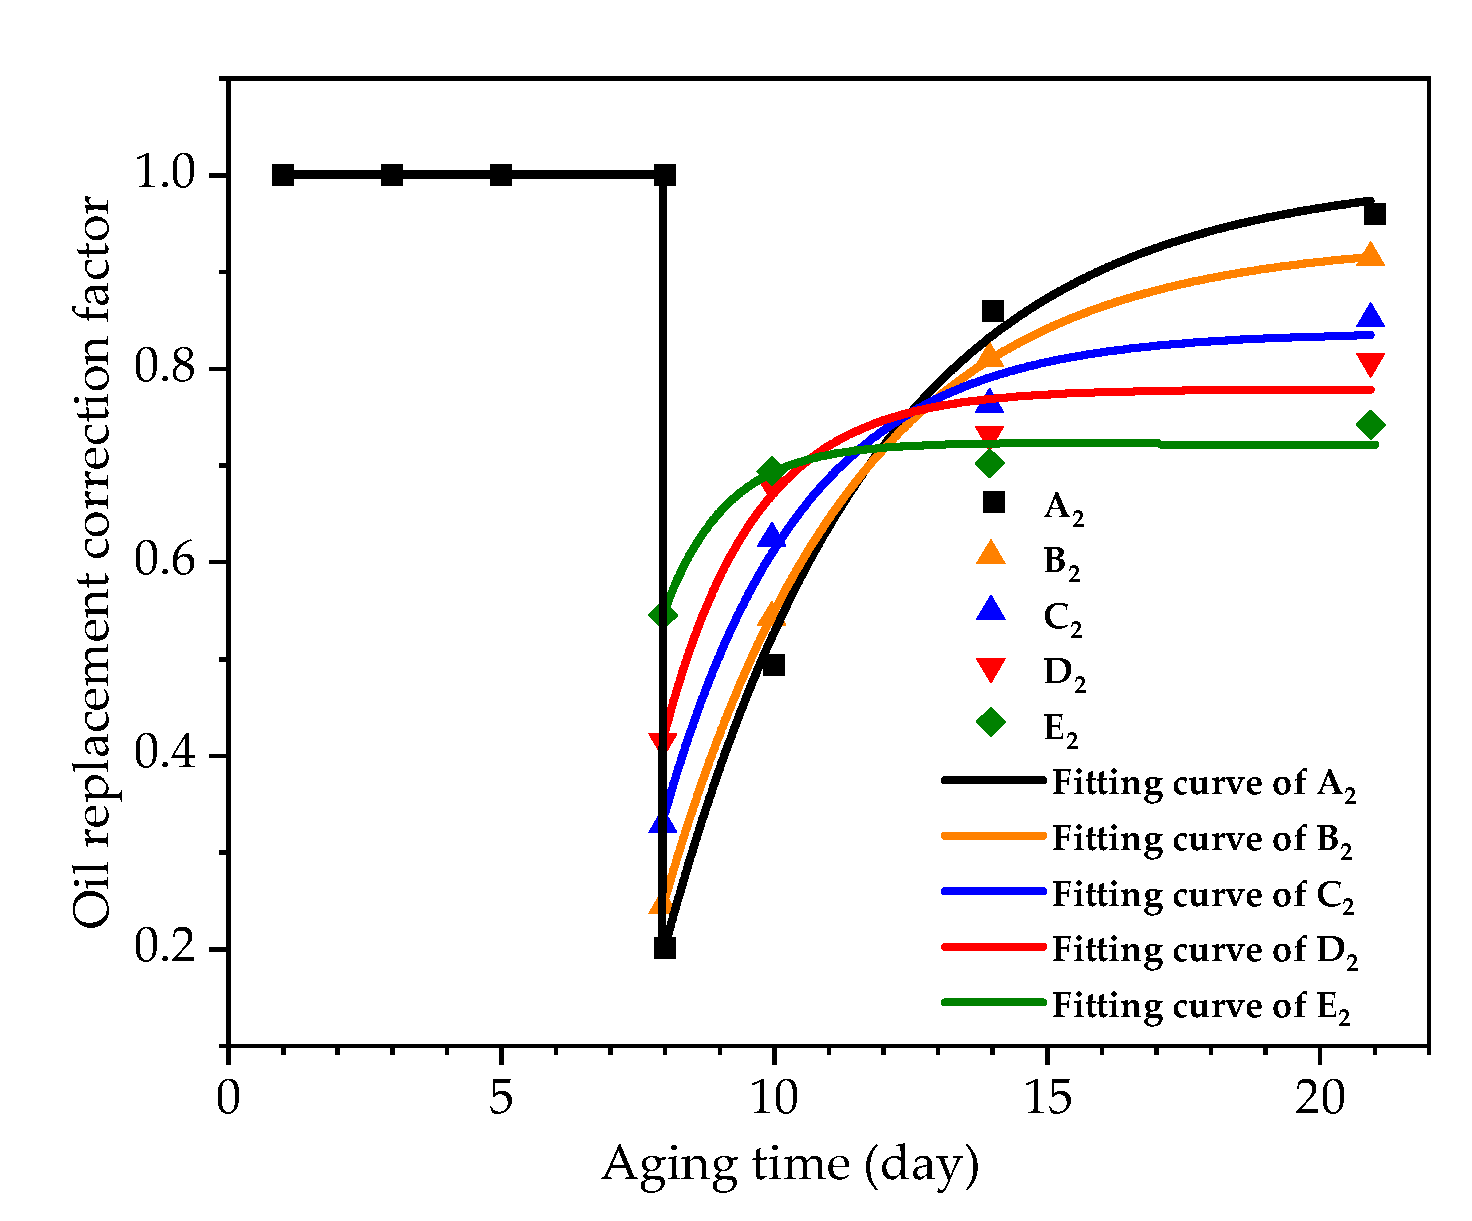
  • The modified model of furfural distribution ratios in oil after oil replacement was established. The lower the oil–pressboard mass ratio is, the less oil replacement operations influence the furfural distribution in oil. This paper provides a new reference for the equilibrium distribution of furfural in insulation systems, which is expected to improve the accuracy of transformer aging state assessment based on furfural analysis in oil.
This paper investigates the validation of the equilibrium distribution model of furfural based on laboratory data, thus providing a theoretical basis for furfural distribution in field transformers. However, there is difficulty in sampling field transformer paper, which can cause damage to the insulation; in the absence of data on furfural in insulating paper, the equilibrium distribution model of furfural cannot be validated by the field data. Therefore, we will collect data from some field transformers to verify the furfural equilibrium distribution model in further research.

Author Contributions

In this research activity, J.L. and Z.C. designed the experiments and performed the writing; all authors have analyzed the data and helped the writing. All authors have read and agreed to the published version of the manuscript.

Funding

This work was supported in part by the National Natural Science Foundation of China (52007036; 51867003), the Natural Science Foundation of Guangxi (2018JJB160064; 2018JJA160176), the Guangxi thousand backbone teachers training program, the Boshike award scheme for young innovative talents, the Basic Ability Promotion Project for Young Teachers in Universities of Guangxi (2019KY0046; 2019KY0022) and the Guangxi Bagui young scholars special funding in support of this work.

Conflicts of Interest

All the authors declare no conflict of interest.

References

  1. Kachler, A.J.; Hohlein, I. Aging of cellulose at transformer service temperatures. Part 1: Influence of type of oil and air on the degree of polymerization of pressboard, dissolved gases, and furanic compounds in oil. IEEE Electr. Insul. Mag. 2005, 21, 15–21. [Google Scholar] [CrossRef]
  2. Wang, M.; Vandermaar, A.J.; Srivastava, K.D. Review of condition assessment of power transformers in service. IEEE Electr. Insul. Mag. 2003, 18, 12–25. [Google Scholar] [CrossRef]
  3. Liu, J.; Fan, X.; Zhang, Y.; Li, S. Frequency domain spectroscopy prediction of transformer oil-Immersed cellulose insulation under diverse temperature and moisture. IEEE Trans. Dielectr. Electr. Insul. 2020. [Google Scholar] [CrossRef]
  4. Rodríguez-Serna, J.M.; Albarracín-Sánchez, R.; Dong, M.; Ren, M. Computer simulation of partial discharges in voids inside epoxy resins using three-capacitance and analytical models. Polymers 2020, 12, 77. [Google Scholar] [CrossRef] [Green Version]
  5. Du, Y.; Zahn, M.; Lesieutre, B.C.; Mamishev, A.V.; Lindgren, S.R. Moisture equilibrium in transformer paper-oil systems. IEEE Electr. Insul. Mag. 2002, 15, 11–20. [Google Scholar] [CrossRef]
  6. Lundgaard, L.E.; Hansen, W.; Linhjell, D.; Painter, T.J. Aging of oil-impregnated paper in power transformers. IEEE Trans. Power Deliv. 2004, 19, 230–239. [Google Scholar] [CrossRef]
  7. Liu, J.; Yang, S.; Zhang, Y.; Zheng, H.; Shi, Z.; Zhang, C. A modified X-model of the oil-impregnated bushing including non-uniform thermal aging of cellulose insulation. Cellulose 2020, 27, 4525–4538. [Google Scholar] [CrossRef]
  8. Pradhan, M.K. Assessment of the status of insulation during thermal stress accelerated experiments on transformer prototypes. IEEE Trans. Dielectr. Electr. Insul. 2006, 13, 227–237. [Google Scholar] [CrossRef]
  9. Leibfried, T.; Jaya, M.; Majer, N.; Schafer, M.; Stach, M.; Voss, S. Postmortem investigation of power transformers-profile of degree of polymerization and correlation with furan concentration in the oil. IEEE Trans. Power Deliv. 2013, 28, 886–893. [Google Scholar] [CrossRef]
  10. Liu, C.; Hao, J.; Li, Y.; Liao, R. Fabrication of ZnO-Al2O3-PTFE multilayer nano-structured functional film on cellulose insulation polymer surface and its effect on moisture inhibition and dielectric properties. Polymers 2019, 11, 1367. [Google Scholar] [CrossRef] [PubMed] [Green Version]
  11. Liu, J.; Fan, X.; Zhang, Y.; Zhang, C.; Wang, Z. Aging evaluation and moisture prediction of oil-immersed cellulose insulation in field transformer using frequency domain spectroscopy and aging kinetics model. Cellulose 2020, 27, 7175–7189. [Google Scholar] [CrossRef]
  12. Feng, D.; Hao, J.; Liao, R.; Chen, X.; Cheng, L.; Liu, M. Comparative study on the thermal-aging characteristics of cellulose insulation polymer immersed in new three-element mixed oil and mineral oil. Polymers 2019, 11, 1292. [Google Scholar] [CrossRef] [PubMed] [Green Version]
  13. Saha, T. Review of modern diagnostic techniques for assessing insulation condition in aged transformers. IEEE Trans. Dielectr. Electr. Insul. 2003, 10, 903–917. [Google Scholar] [CrossRef] [Green Version]
  14. Oommen, T.V.; Prevost, T.A. Cellulose insulation in oil-filled power transformers: Part II maintaining insulation integrity and life. IEEE Electr. Insul. Mag. 2006, 22, 5–14. [Google Scholar] [CrossRef]
  15. Liu, J.; Fan, X.; Zhang, Y.; Zheng, H.; Jiao, J. Temperature correction to dielectric modulus and activation energy prediction of oil-immersed cellulose insulation. IEEE Trans. Dielectr. Electr. Insul. 2020, 27, 956–963. [Google Scholar] [CrossRef]
  16. Liu, J.; Fan, X.; Zhang, Y.; Zheng, H.; Zhang, C. Condition prediction for oil-immersed cellulose insulation in field transformer using fitting fingerprint database. IEEE Trans. Dielectr. Electr. Insul. 2020, 27, 279–287. [Google Scholar] [CrossRef]
  17. Ali, M.; Eley, C.; Emsley, A.M.; Heywood, R. Measuring and understanding the ageing of kraft insulating paper in power transformers. IEEE Electr. Insul. Mag. 1996, 12, 28–34. [Google Scholar] [CrossRef]
  18. Kelly, J.J. Transformer fault diagnosis by dissolved-gas analysis. IEEE Trans. Ind. Appl. 1980, 16, 777–782. [Google Scholar] [CrossRef]
  19. Feng, D.; Wang, Z.; Jarman, P. Transmission power transformer assessment using furan measurement with the aid of thermal model. In Proceedings of the IEEE International Conference on Condition Monitoring and Diagnosis, Bali, Indonesia, 23–27 September 2012; pp. 521–524. [Google Scholar]
  20. Abu-Siada, A.; Lai, S.P.; Islam, S.M. A novel fuzzy-logic approach for furan estimation in transformer oil. IEEE Trans. Power. Deliv. 2012, 27, 469–474. [Google Scholar] [CrossRef]
  21. Scheirs, J.; Camino, G.; Avidano, M.; Tumiatti, W. Origin of furanic compounds in thermal degradation of cellulosic insulating paper. J. Appl. Polym. Sci. 1998, 69, 2541–2547. [Google Scholar] [CrossRef]
  22. Emsley, A.M.; Xiao, X.; Heywood, R.J.; Ali, M. Degradation of cellulosic insulation in power transformers. Part 2: Formation of furan products in insulating oil. IEE P-sci. Meas. Technol. 2000, 147, 110–114. [Google Scholar] [CrossRef]
  23. Unsworth, J.; Mitchell, F. Degradation of electrical insulating paper monitored with high performance liquid chromatography. IEEE Trans. Electr. Insul. 1990, 25, 737–746. [Google Scholar] [CrossRef]
  24. Jalbert, J.; Lessard, M.C.; Ryadi, M. Cellulose chemical markers in transformer oil insulation part 1: Temperature correction factors. IEEE Trans. Dielectr. Electr. Insul. 2013, 20, 2287–2291. [Google Scholar] [CrossRef]
  25. Kan, H.; Miyamoto, T.; Makino, Y.; Namba, S.; Hara, T. Absorption of CO2 and CO gases and furfural in insulating oil into paper insulation in oil-immersed transformers. In Proceedings of the 1994 IEEE International Symposium on Electrical Insulation, Pittsburgh, PA, USA, 5–8 June 1994; pp. 41–44. [Google Scholar]
  26. Feng, D.; Yang, L.; Liao, R.; Zhou, L. Effect of moisture content on the production and partitioning of furfural in oil–paper insulation. IEEE Trans. Dielectr. Electr. Insul. 2018, 25, 2389–2397. [Google Scholar] [CrossRef]
  27. Yang, L.; Lin, Y.; Liao, R.; Zhao, X.; Sun, W.; Zhang, Y. Effects of temperature and aging on furfural partitioning in the oil-paper system of power transformers. IEEE Trans. Dielectr. Electr. Insul. 2016, 23, 1393–1401. [Google Scholar] [CrossRef]
  28. Lin, Y.; Yang, L.; Liao, R.; Sun, W.; Zhang, Y. Effect of oil replacement on furfural analysis and aging assessment of power transformers. IEEE Trans. Dielectr. Electr. Insul. 2015, 22, 2611–2619. [Google Scholar] [CrossRef]
  29. Shang, Y.; Yang, L.; Guo, Z.J.; Yan, Z. Assessing aging of large transformers by furfural investigation. In Proceedings of the IEEE International Conference on Solid Dielectrics, Eindhoven, The Netherlands, 25–29 June 2001. [Google Scholar]
  30. Lelekakis, N.; Guo, W.; Martin, D.; Wijaya, J.; Susa, D. A field study of aging in paper-oil insulation systems. IEEE Electr. Insul. Mag. 2012, 28, 12–19. [Google Scholar] [CrossRef]
  31. Abdi, S.; Boubakeur, A.; Haddad, A.; Harid, N. Influence of artificial thermal aging on transformer oil properties. Electr. Power Compon. Syst. 2011, 39, 1701–1711. [Google Scholar] [CrossRef]
  32. Tang, C.; Li, X.; Li, Z.; Tian, W.; Zhou, Q. Molecular simulation on the thermal stability of meta-aramid insulation paper fiber at transformer operating temperature. Polymers 2018, 10, 1348. [Google Scholar] [CrossRef] [Green Version]
  33. Pablo, A.; Pahlavanpour, B. Furanic compounds analysis: A tool for predictive maintenance of oil filled electrical equipment. Electra 1997, 175, 9–18. [Google Scholar]
  34. Pablo, D. Furfural and ageing: How are they related. In Proceedings of the IEE Colloquium Insulating Liquidss, Leatherhead, UK, 27 May 1999; p. 5. [Google Scholar]
  35. Lundgaard, L.E.; Hansen, W.; Ingebrigtsen, S. Ageing of mineral oil impregnated cellulose by acid catalysis. IEEE Trans. Dielectr. Electr. Insul. 2008, 15, 540–546. [Google Scholar] [CrossRef]
Figure 1. Flow chart of sample pretreatment and accelerated thermal aging experiment.
Polymers 12 02760 g001
Figure 2. The specific sampling time points.
Polymers 12 02760 g002
Figure 3. Measurement of furfural concentration in pressboard.
Polymers 12 02760 g003
Figure 4. The relationship between furfural concentration in oil and aging time.
Polymers 12 02760 g004
Figure 5. The relationship between furfural concentration in pressboard and aging time.
Polymers 12 02760 g005
Figure 6. The relationship between furfural concentration in oil and that in pressboard.
Polymers 12 02760 g006
Figure 7. The relationship between furfural concentration oil and degree of polymerization (DP).
Polymers 12 02760 g007
Figure 8. The relationship between furfural mass fraction and aging time.
Polymers 12 02760 g008
Figure 9. The relationship between furfural mass fraction and aging time after oil replacement. (a) Effects of oil replacement on the partitioning of furfural in group A. (b) Effects of oil replacement on the partitioning of furfural in group B. (c) Effects of oil replacement on the partitioning of furfural in group C. (d) Effects of oil replacement on the partitioning of furfural in group D. (e) Effects of oil replacement on the partitioning of furfural in group E.
Polymers 12 02760 g009
Figure 10. Mass fraction of furfural in groups composed of new oil and pressboard with different aging degrees.
Polymers 12 02760 g010
Figure 11. Mass fraction of furfural in groups composed of aged pressboard and oil with different aging degrees.
Polymers 12 02760 g011
Figure 12. The fitting results of the model of furfural equilibrium distribution.
Polymers 12 02760 g012
Figure 13. Conventional residual analysis.
Polymers 12 02760 g013
Figure 14. Comparison between the predicted value and measured value of furfural distribution ratio in oil.
Polymers 12 02760 g014
Figure 15. The relationship between oil replacement correction factor and aging time after oil replacement.
Polymers 12 02760 g015
Figure 16. The relationship between oil–pressboard mass ratio (MR) and parameters m, n, and k. (a) The relationship between m and MR. (b) The relationship between n and MR. (c) The relationship between k and MR.
Polymers 12 02760 g016
Figure 17. The relationship between furfural mass fraction and aging time after oil replacement.
Polymers 12 02760 g017
Table 1. Parameters of the materials.
Cellulose PressboardInsulation OilMethanol
BrandWeidmann T4 pressboardBrandKaramay no. 25 naphthenic mineral oilBrandFisher
ProviderTaizhou Weidmann high voltage insulation Co. LTD, Taizhou, ChinaProviderChina National Petroleum Corporation. Beijing, ChinaProviderThermo Fisher Scientific. Ottawa, Canada
Diameter160 mmPourpoint−45 °CPurity99.9%
Thickness1 mmFlashpoint135 °C
Tensile strengthMD a 105 MPa
CMD b 80 MPa
Dielectric loss4 × 10−4Density0.791 g/ml
a MD: Machine Direction. b CMD: Cross-Machine Direction.
Table 2. Experimental scheme.
GroupOil Replacement RatioOil–Pressboard Mass Ratio
A10%5:1
A2100%5:1
B10%10:1
B2100%10:1
C10%15:1
C2100%15:1
D10%20:1
D2100%20:1
E10%25:1
E2100%25:1
Table 3. Furfural residual and recovery ratio.
GroupOil–Pressboard Mass RatioOil Replacement RatioFurfural Residual RatioFurfural Recovery Ratio
A25:1100%14.2%89.4%
B210:1100%14.8%71.3%
C215:1100%20.1%62.2%
D220:1100%23.1%65.6%
E225:1100%35.7%51.7%
Table 4. Formation of the eight special sample groups.
Sample GroupSample DetailOil–Pressboard Mass Ratio
R1Pressboard aged for 5 days + new oil10:1
R2Pressboard aged for 10 days + new oil10:1
R3Pressboard aged for 14 days + new oil10:1
R4Pressboard aged for 21 days + new oil10:1
R5Pressboard aged for 14 days + oil aged for 5 days10:1
R6Pressboard aged for 14 days + oil aged for 10 days10:1
R7Pressboard aged for 14 days + oil aged for 14 days10:1
R8Pressboard aged for 14 days + oil aged for 21 days10:1
Table 5. The goodness of fit of furfural equilibrium distribution model.
ParametersStandard Errort-ValueSignificance Level
MR6.86 × 10−410.59<0.05
DP3.23 × 10−5−16.06<0.05
Table 6. Calculation results of the validation groups.
GroupMRDPWoil (%)Predicted Value (%)Accuracy (%)
S31532429.531.892.23
S321027037.838.298.94
S331551430.729.295.08
S342043337.337.099.26
S352566228.828.899.99
Table 7. The fitting results of each constant.
GroupmnkR2
A21.000−0.8090.260.985
B20.931−0.6900.2870.999
C20.836−0.5060.3960.975
D20.777−0.3640.5980.922
E20.722−0.1790.8680.899
Publisher’s Note: MDPI stays neutral with regard to jurisdictional claims in published maps and institutional affiliations.

