Bio-Nanocomposite Hydrogel Based on Zinc Alginate/Graphene Oxide: Morphology, Structural Conformation, Thermal Behavior/Degradation, and Dielectric Properties

 , , and
Abstract
:
1. Introduction
2. Materials and Methods
2.1. Materials
2.2. Synthesis
2.3. Characterization Techniques
2.3.1. Alginate Characterization
2.3.2. Electron Microscopy
2.3.3. Fourier-Transformed Infrared Spectroscopy (FTIR)
2.3.4. Swelling Assay
2.3.5. Differential Scanning Calorimetry
2.3.6. Thermogravimetric Analysis (TGA)
2.3.7. Dielectric Relaxation Spectroscopy (DRS)
3. Results and Discussion
3.1. Alginate Characterization
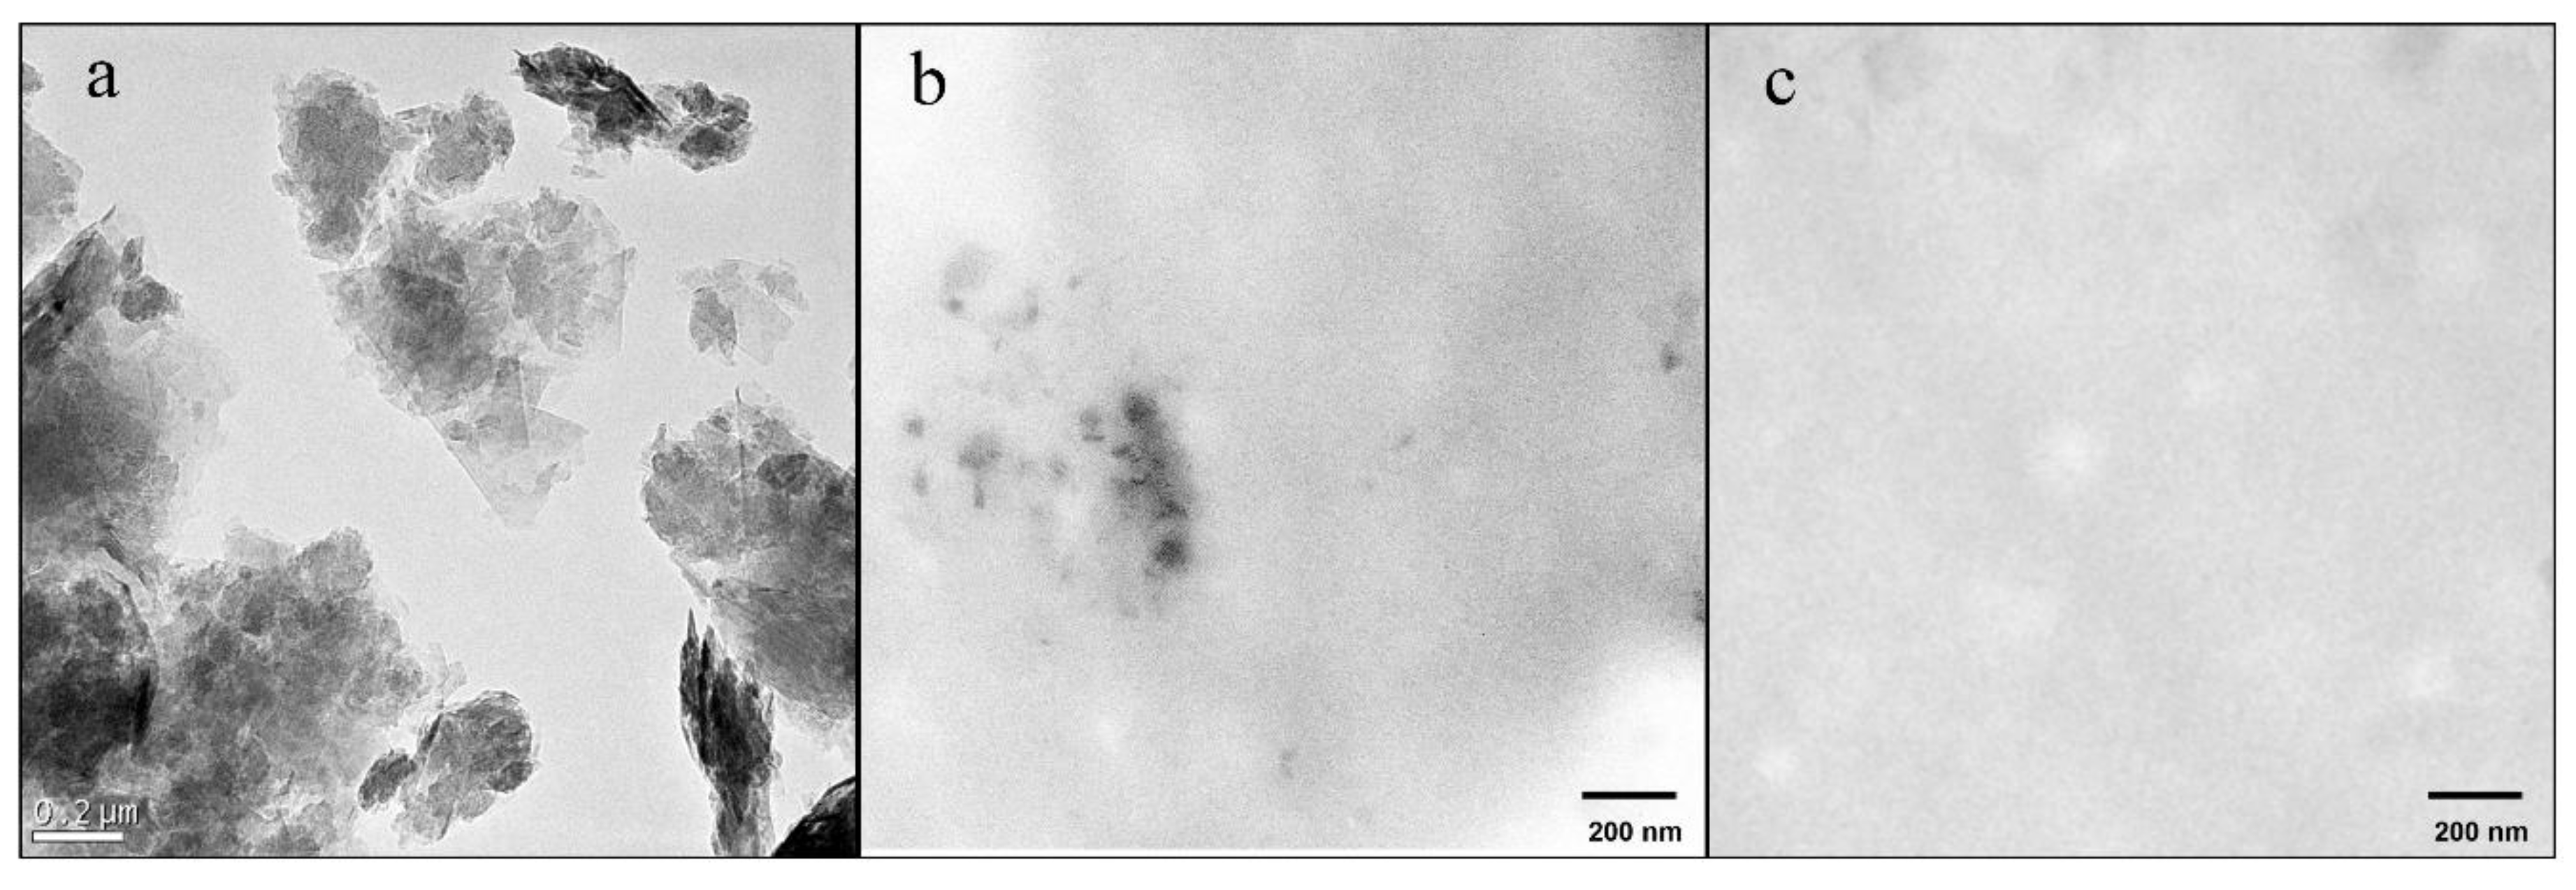
3.2. Electron Microscopy
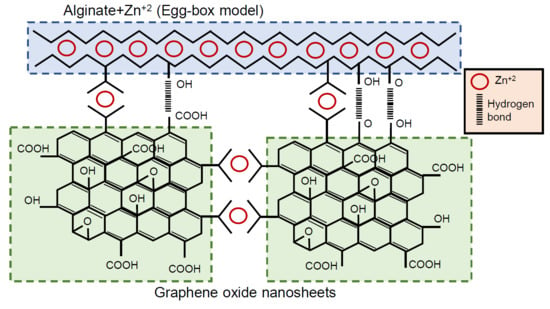
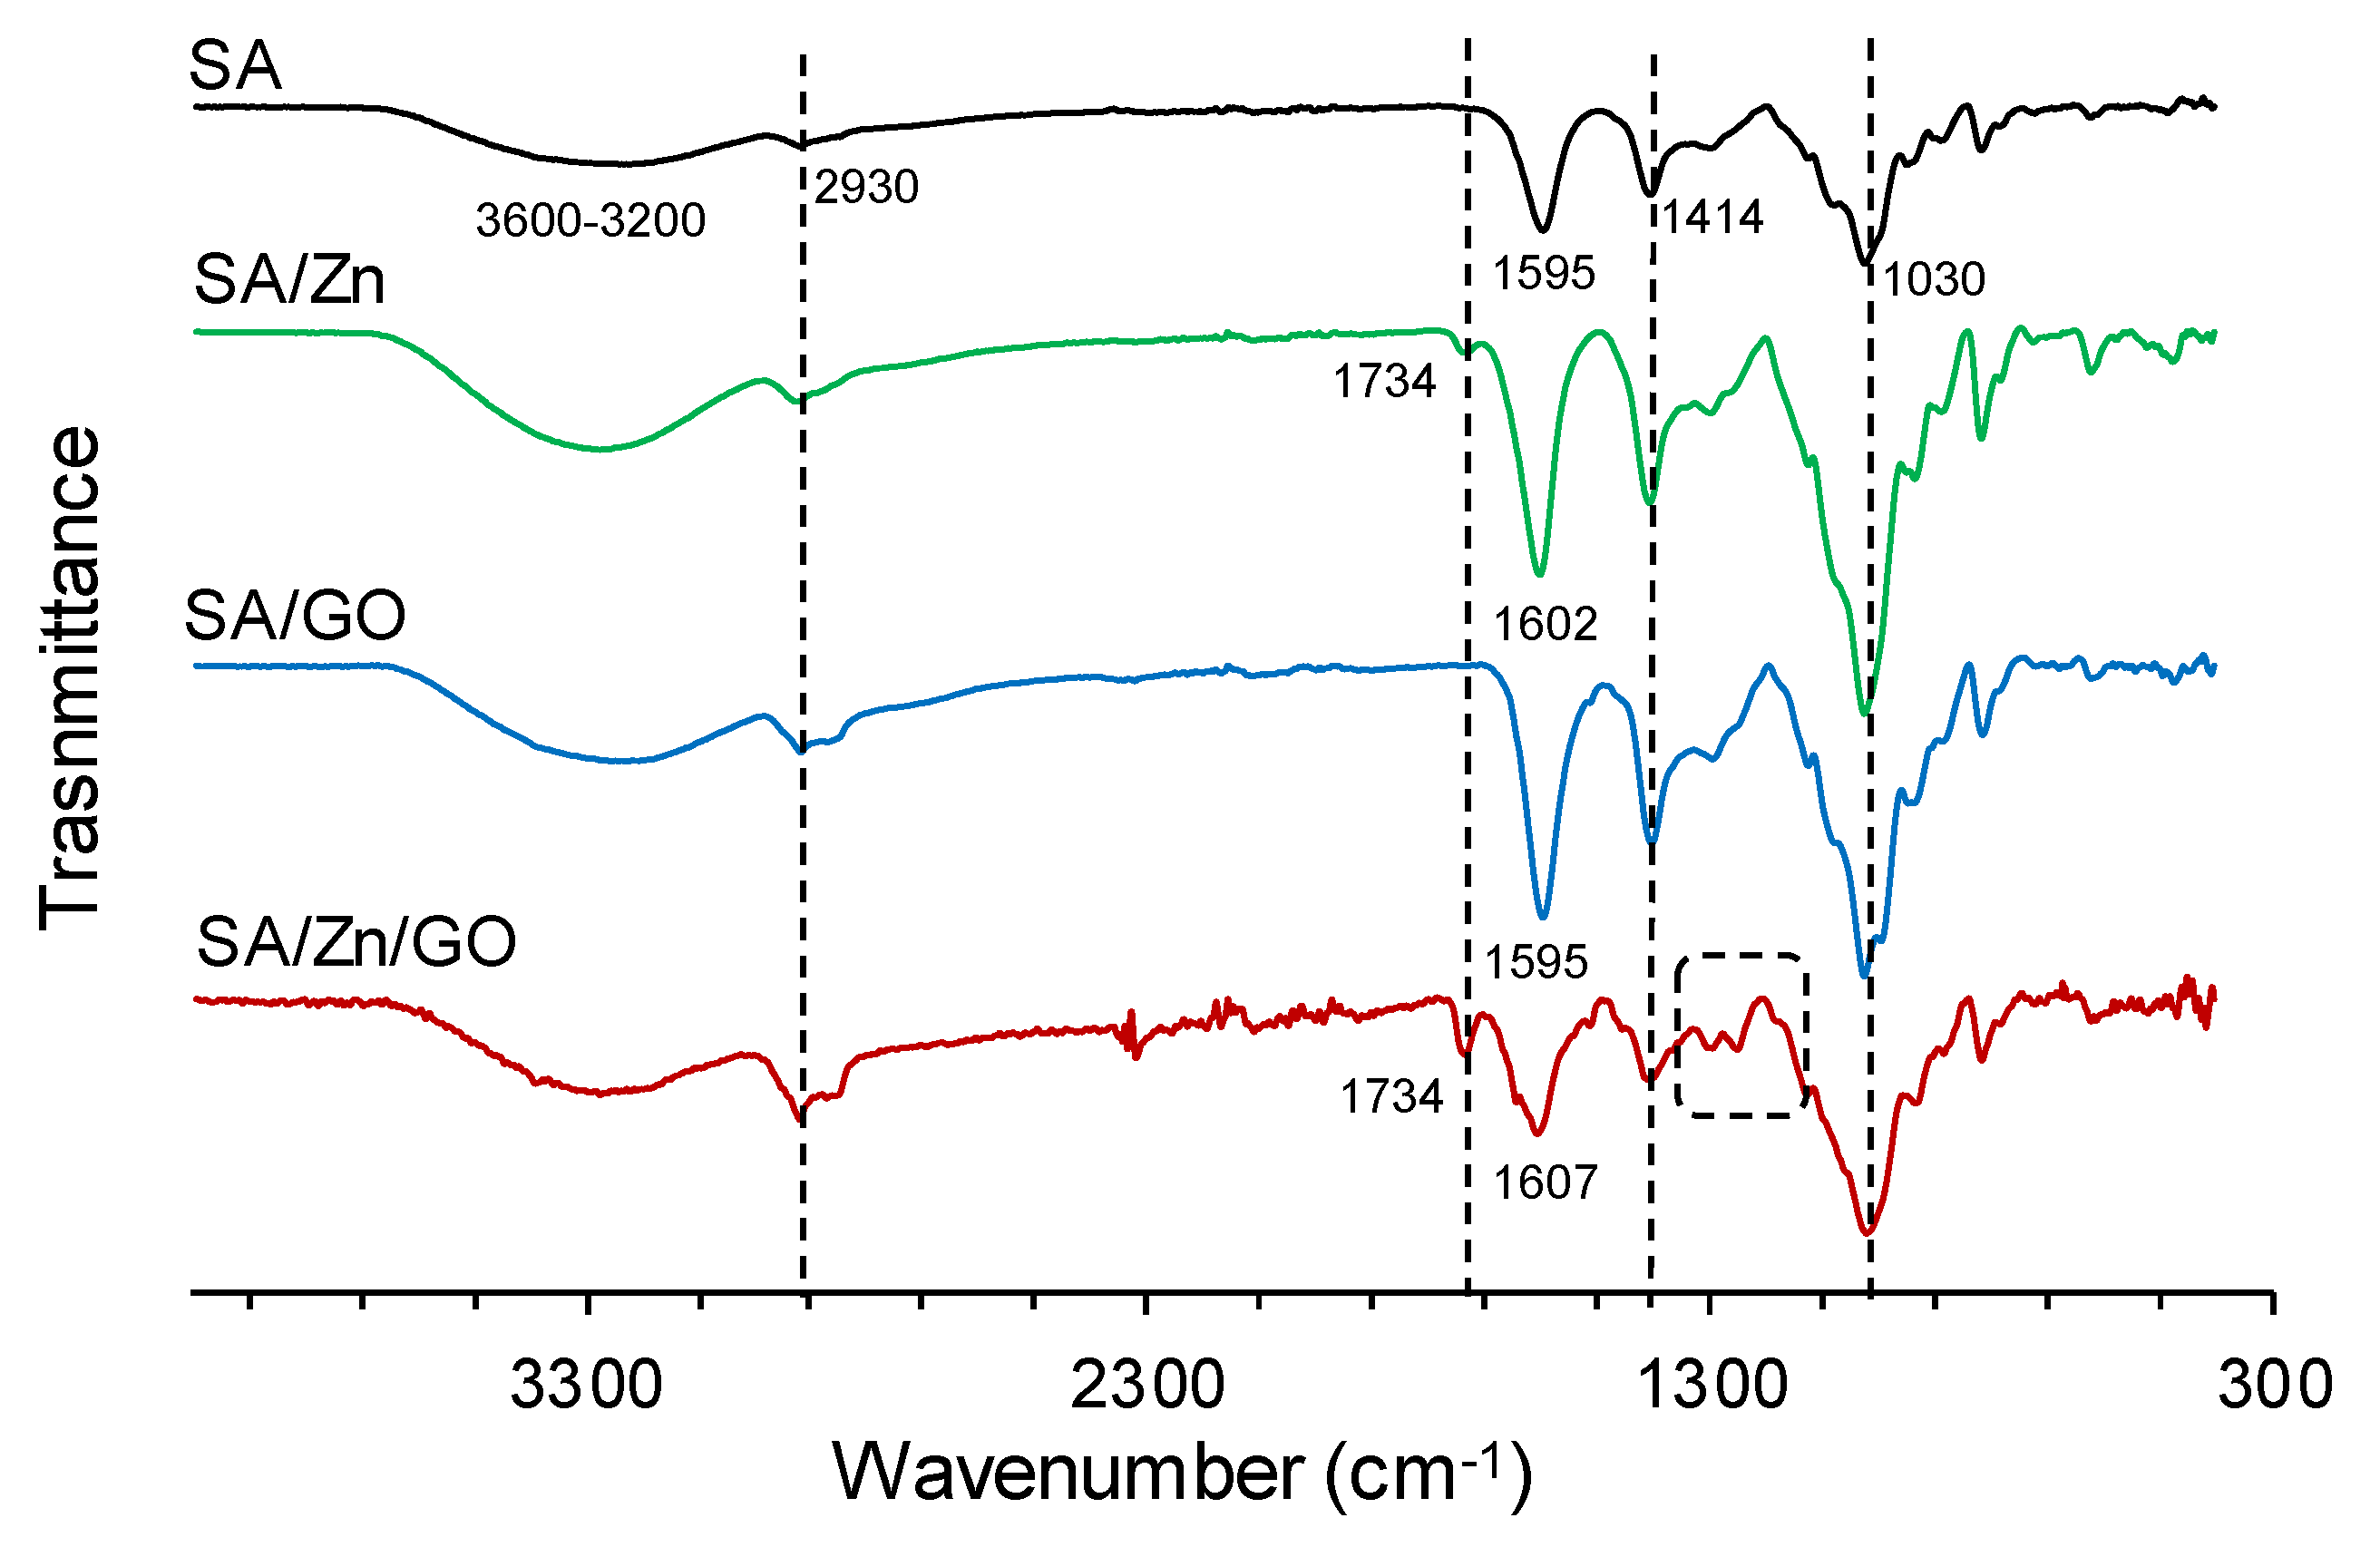
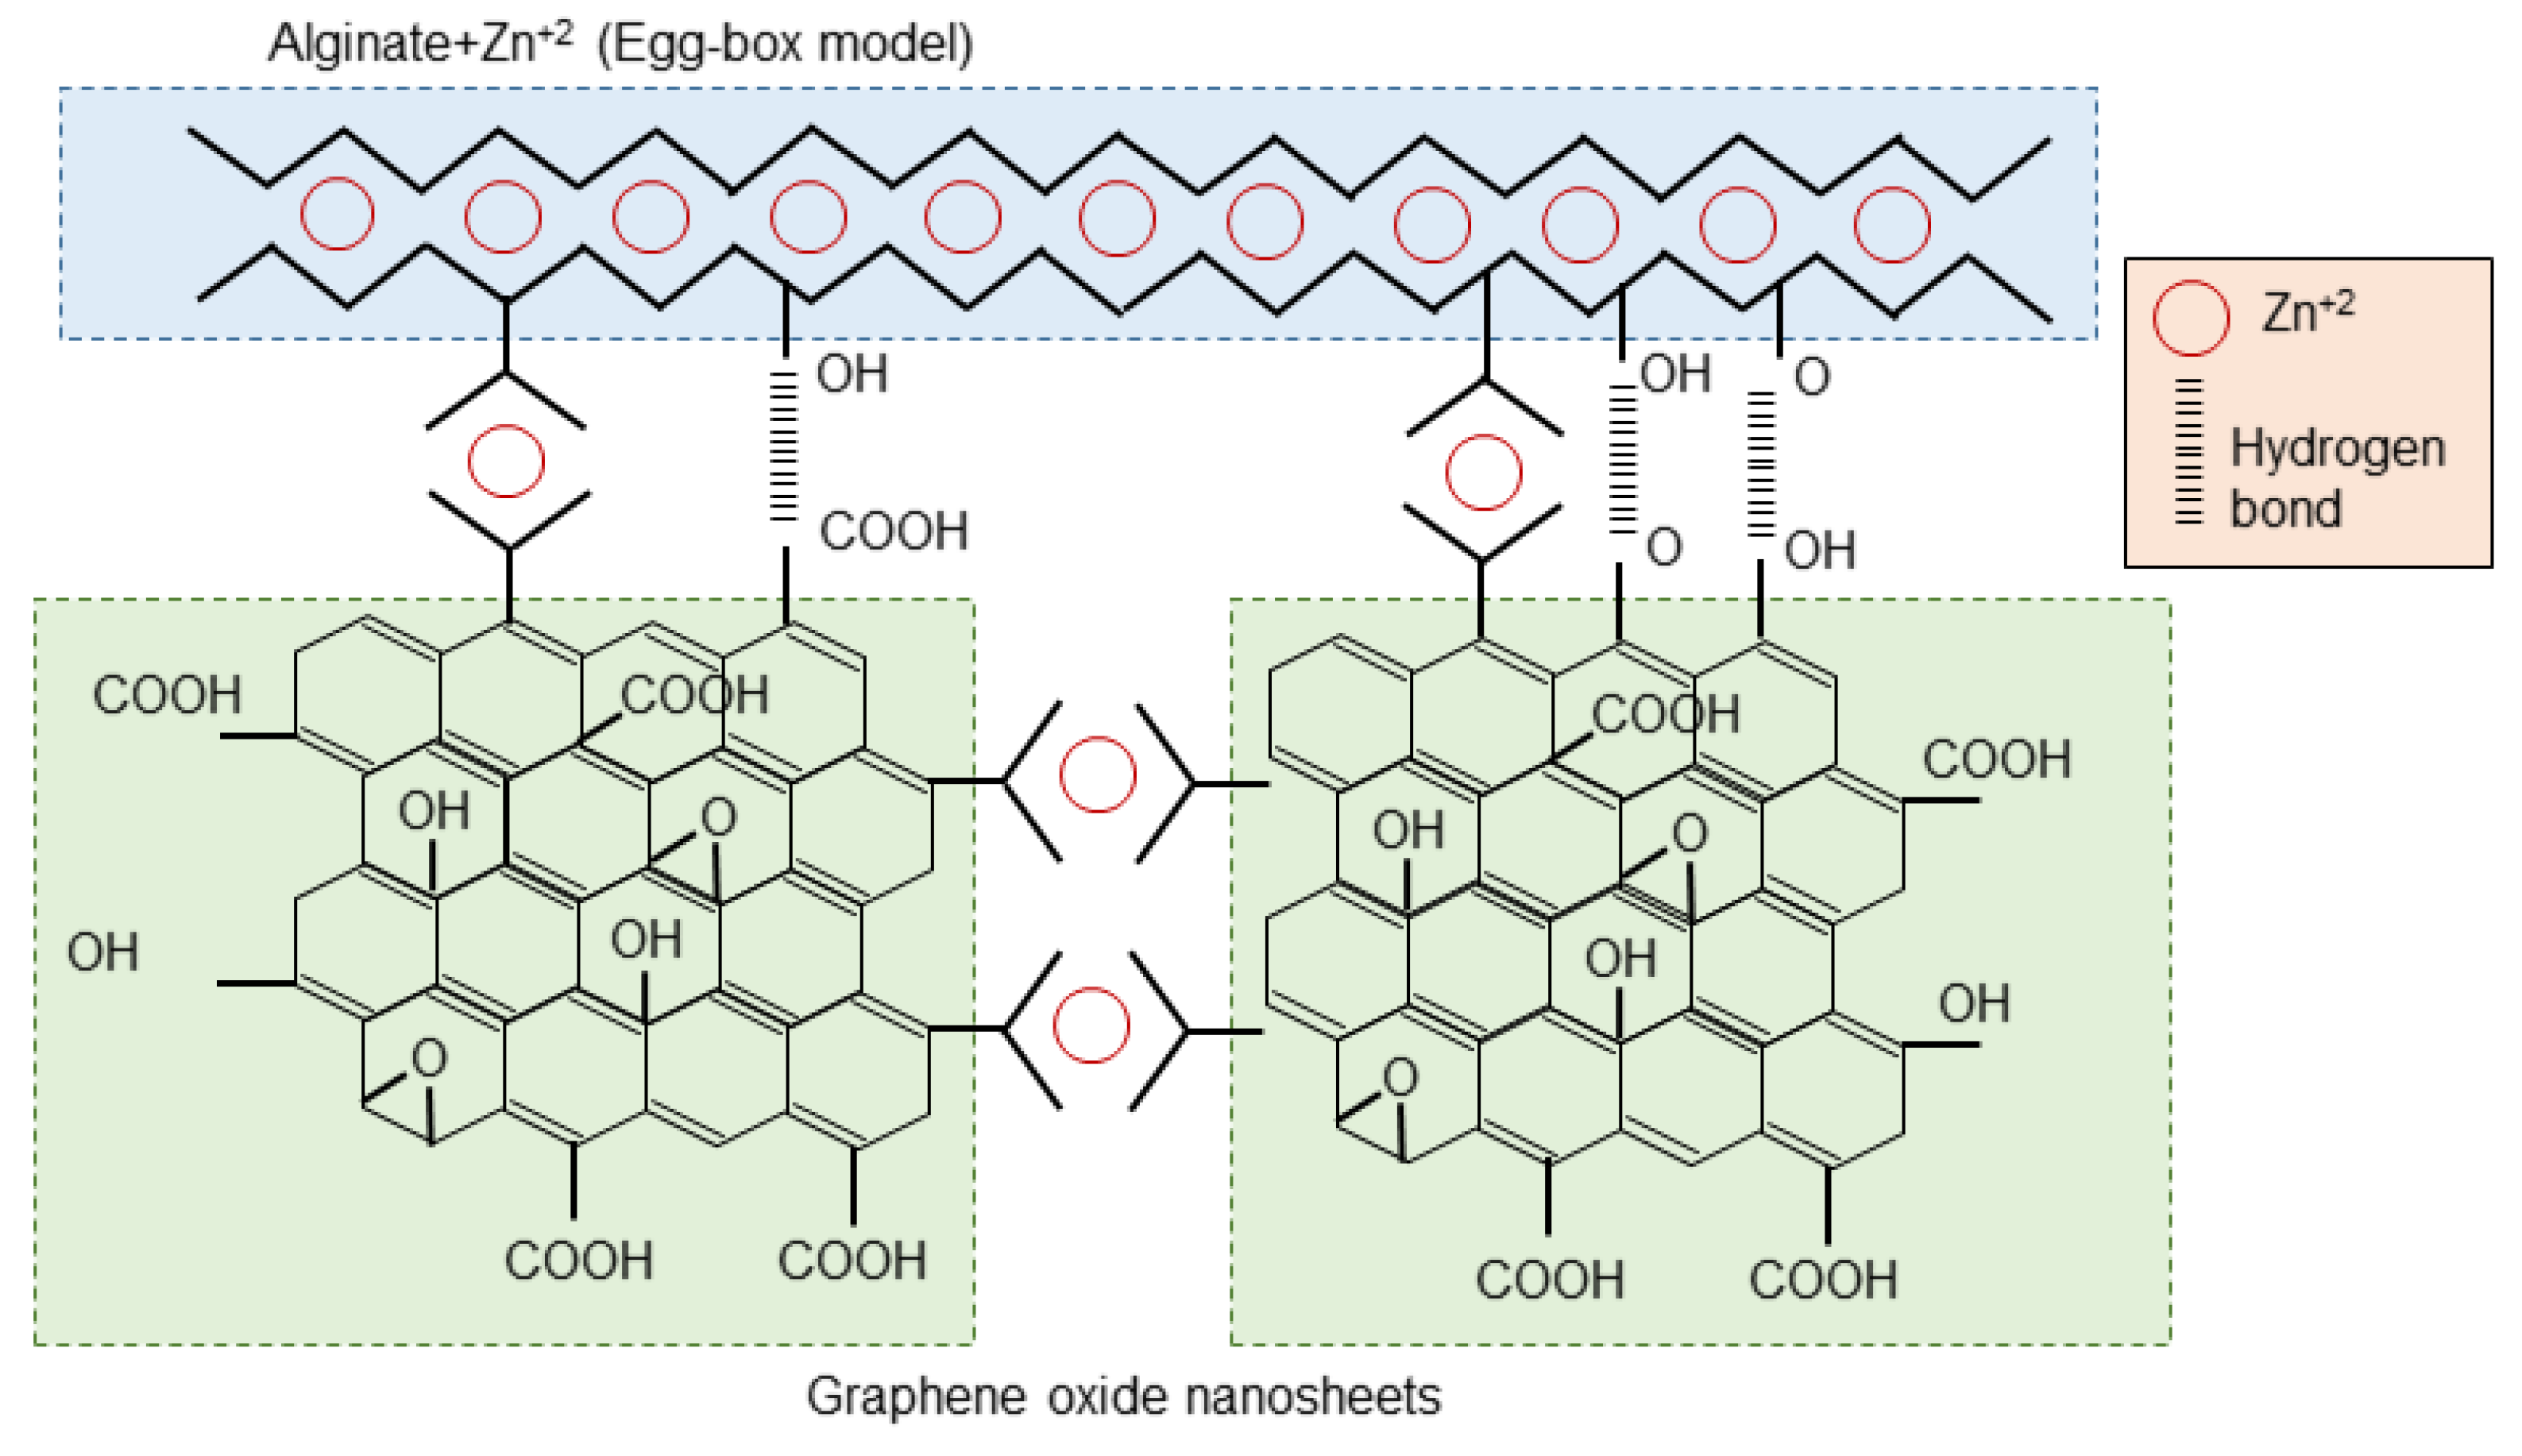
3.3. Fourier-Transform Infrared Spectroscopy (FTIR)
3.4. Swelling Behavior
3.5. Thermal Properties
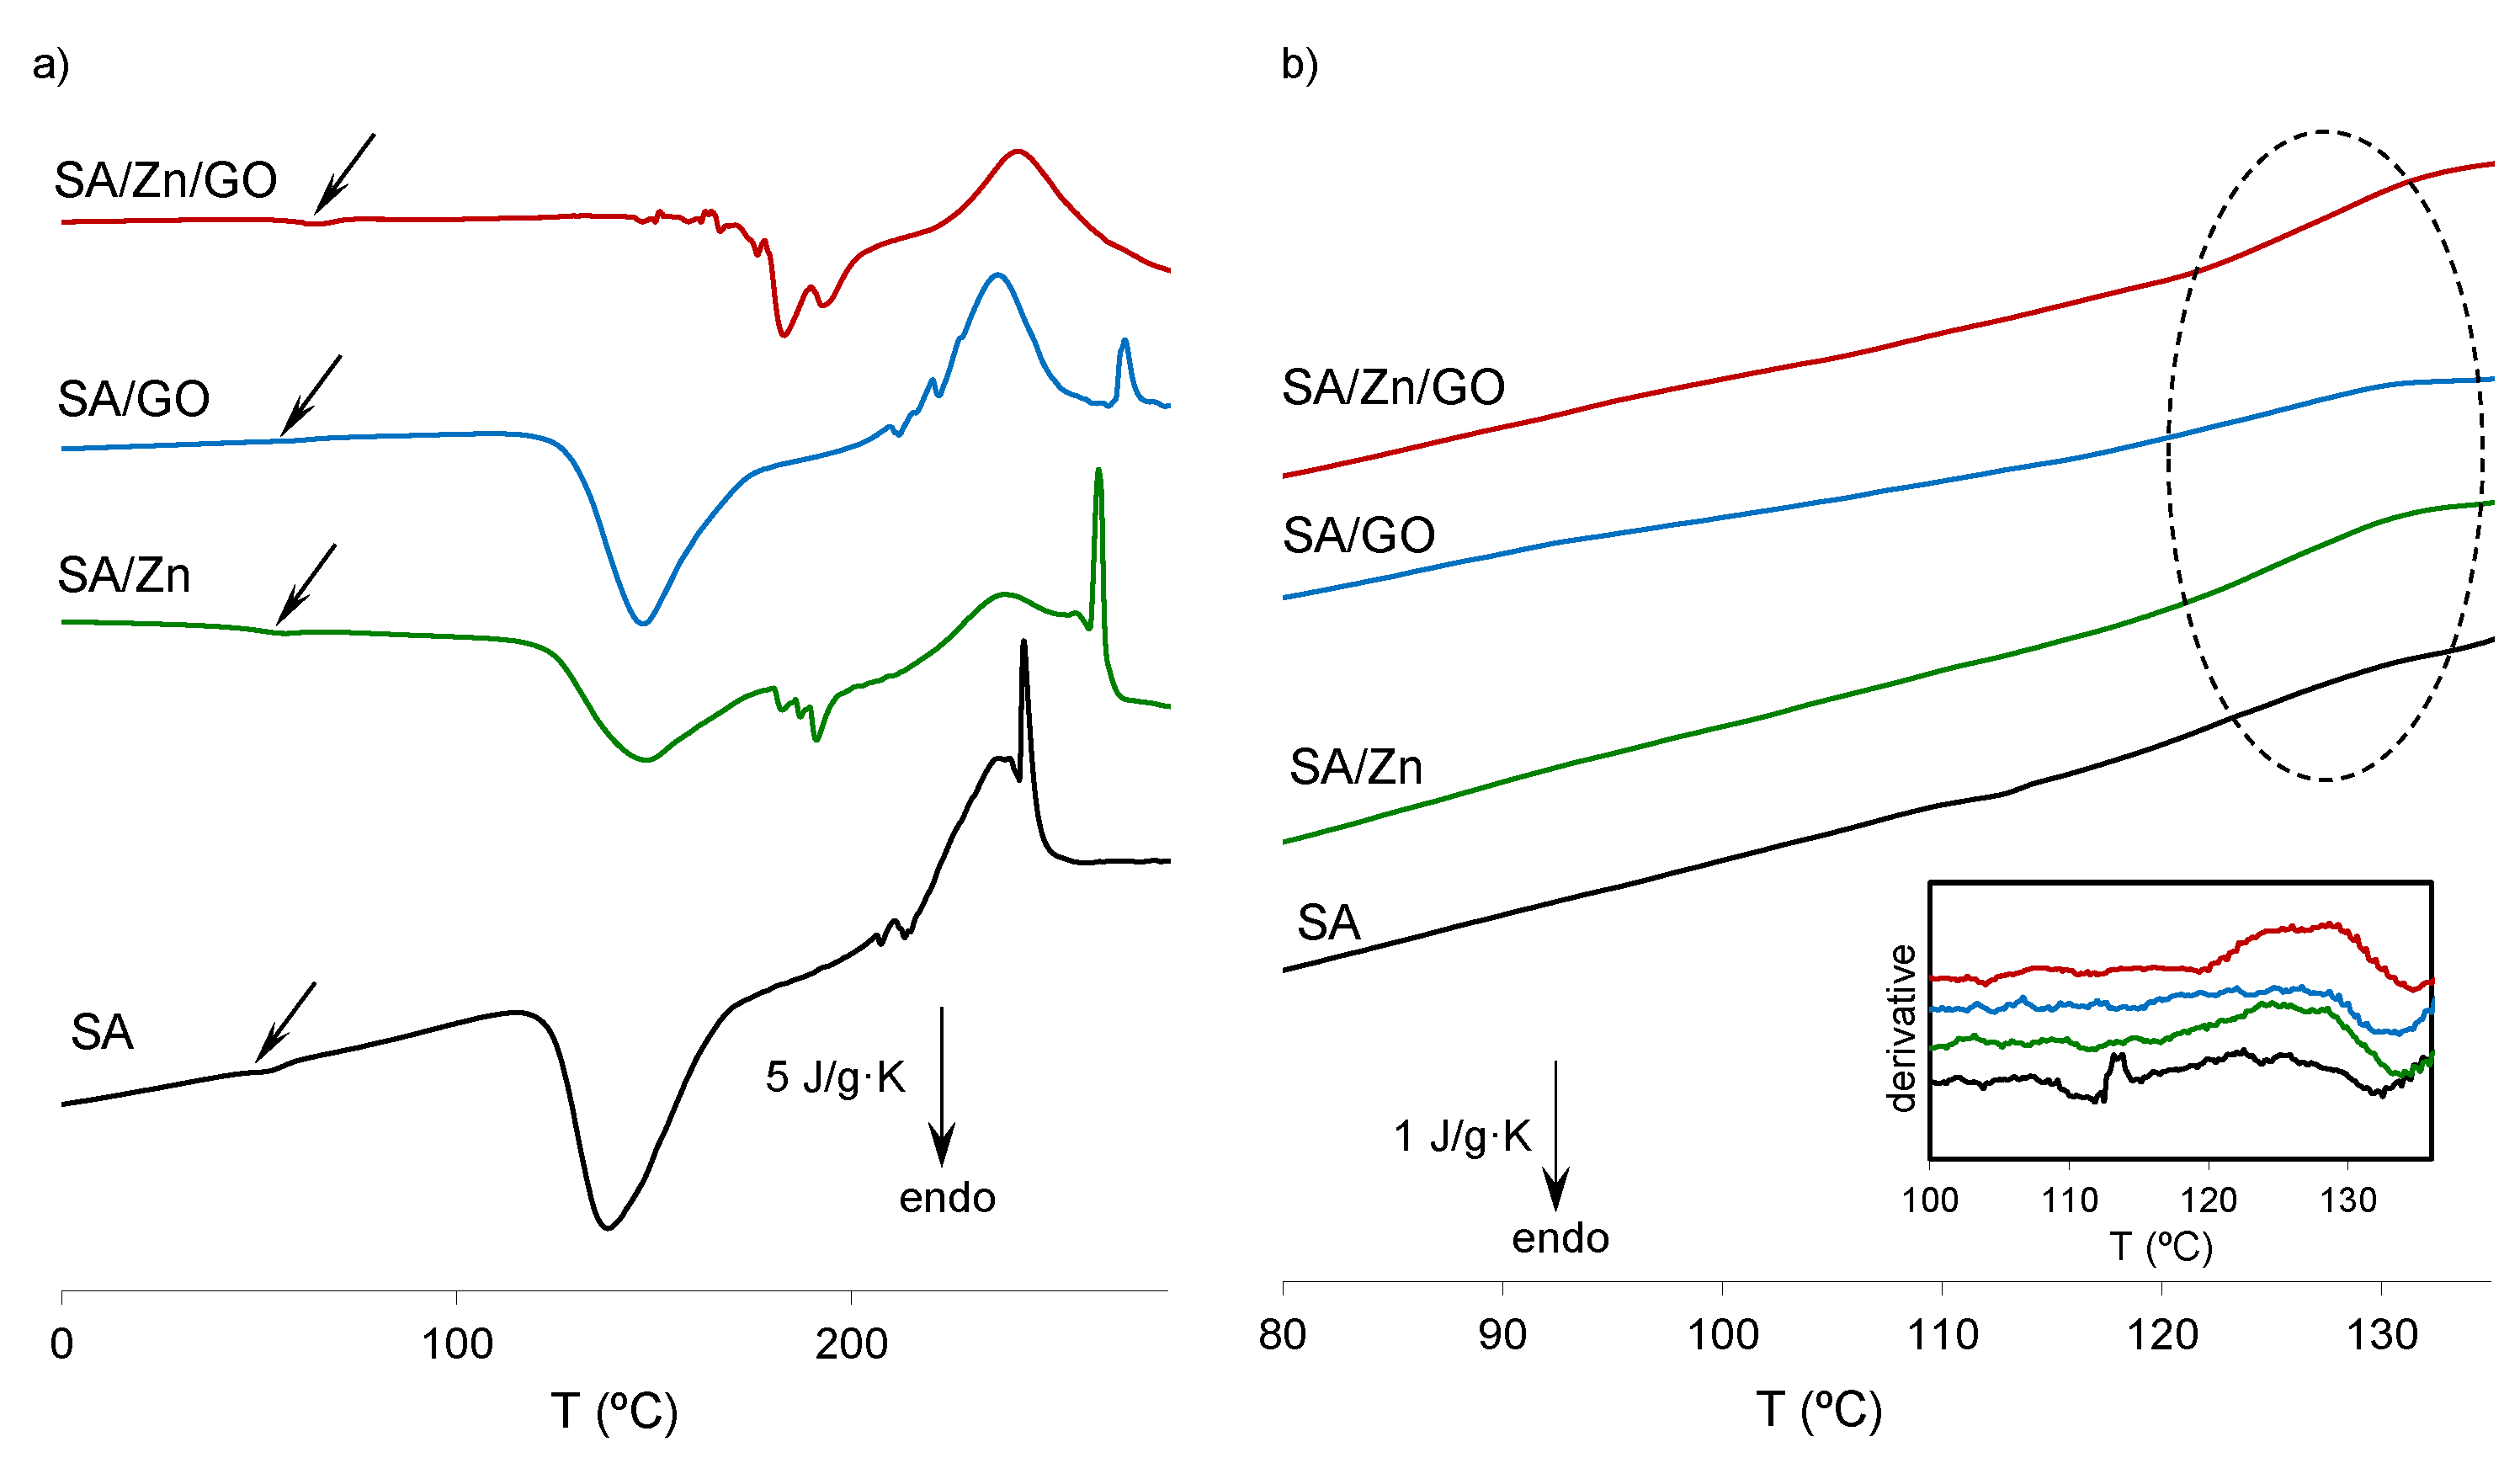
3.5.1. Differential Scanning Calorimetry
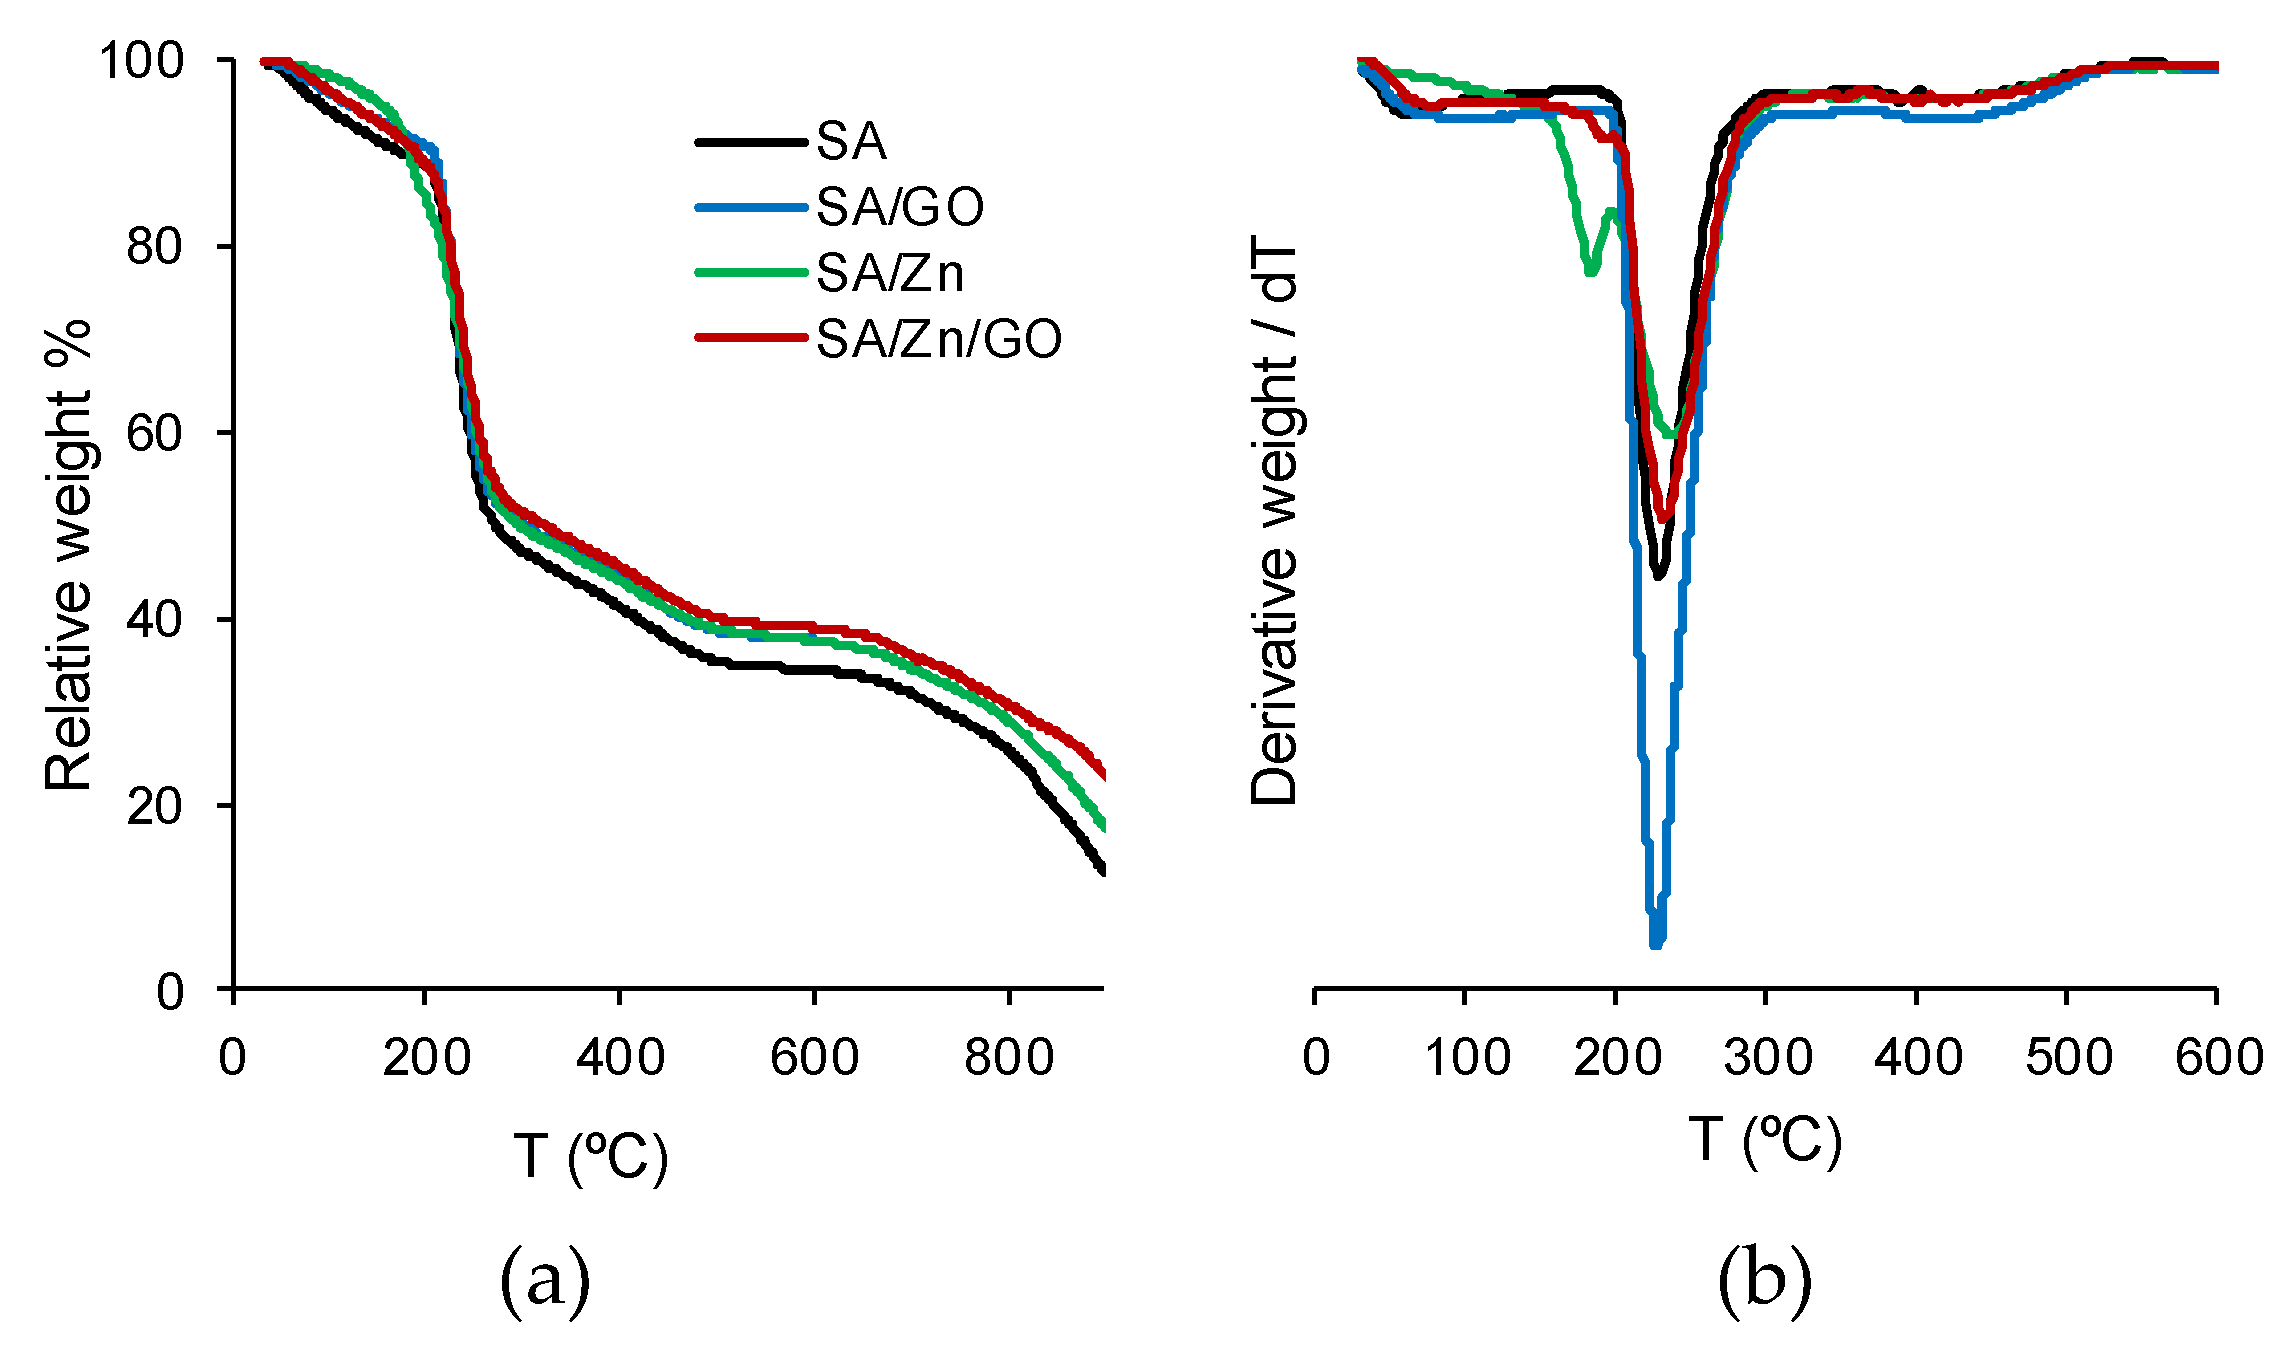
3.5.2. Thermogravimetry Analysis
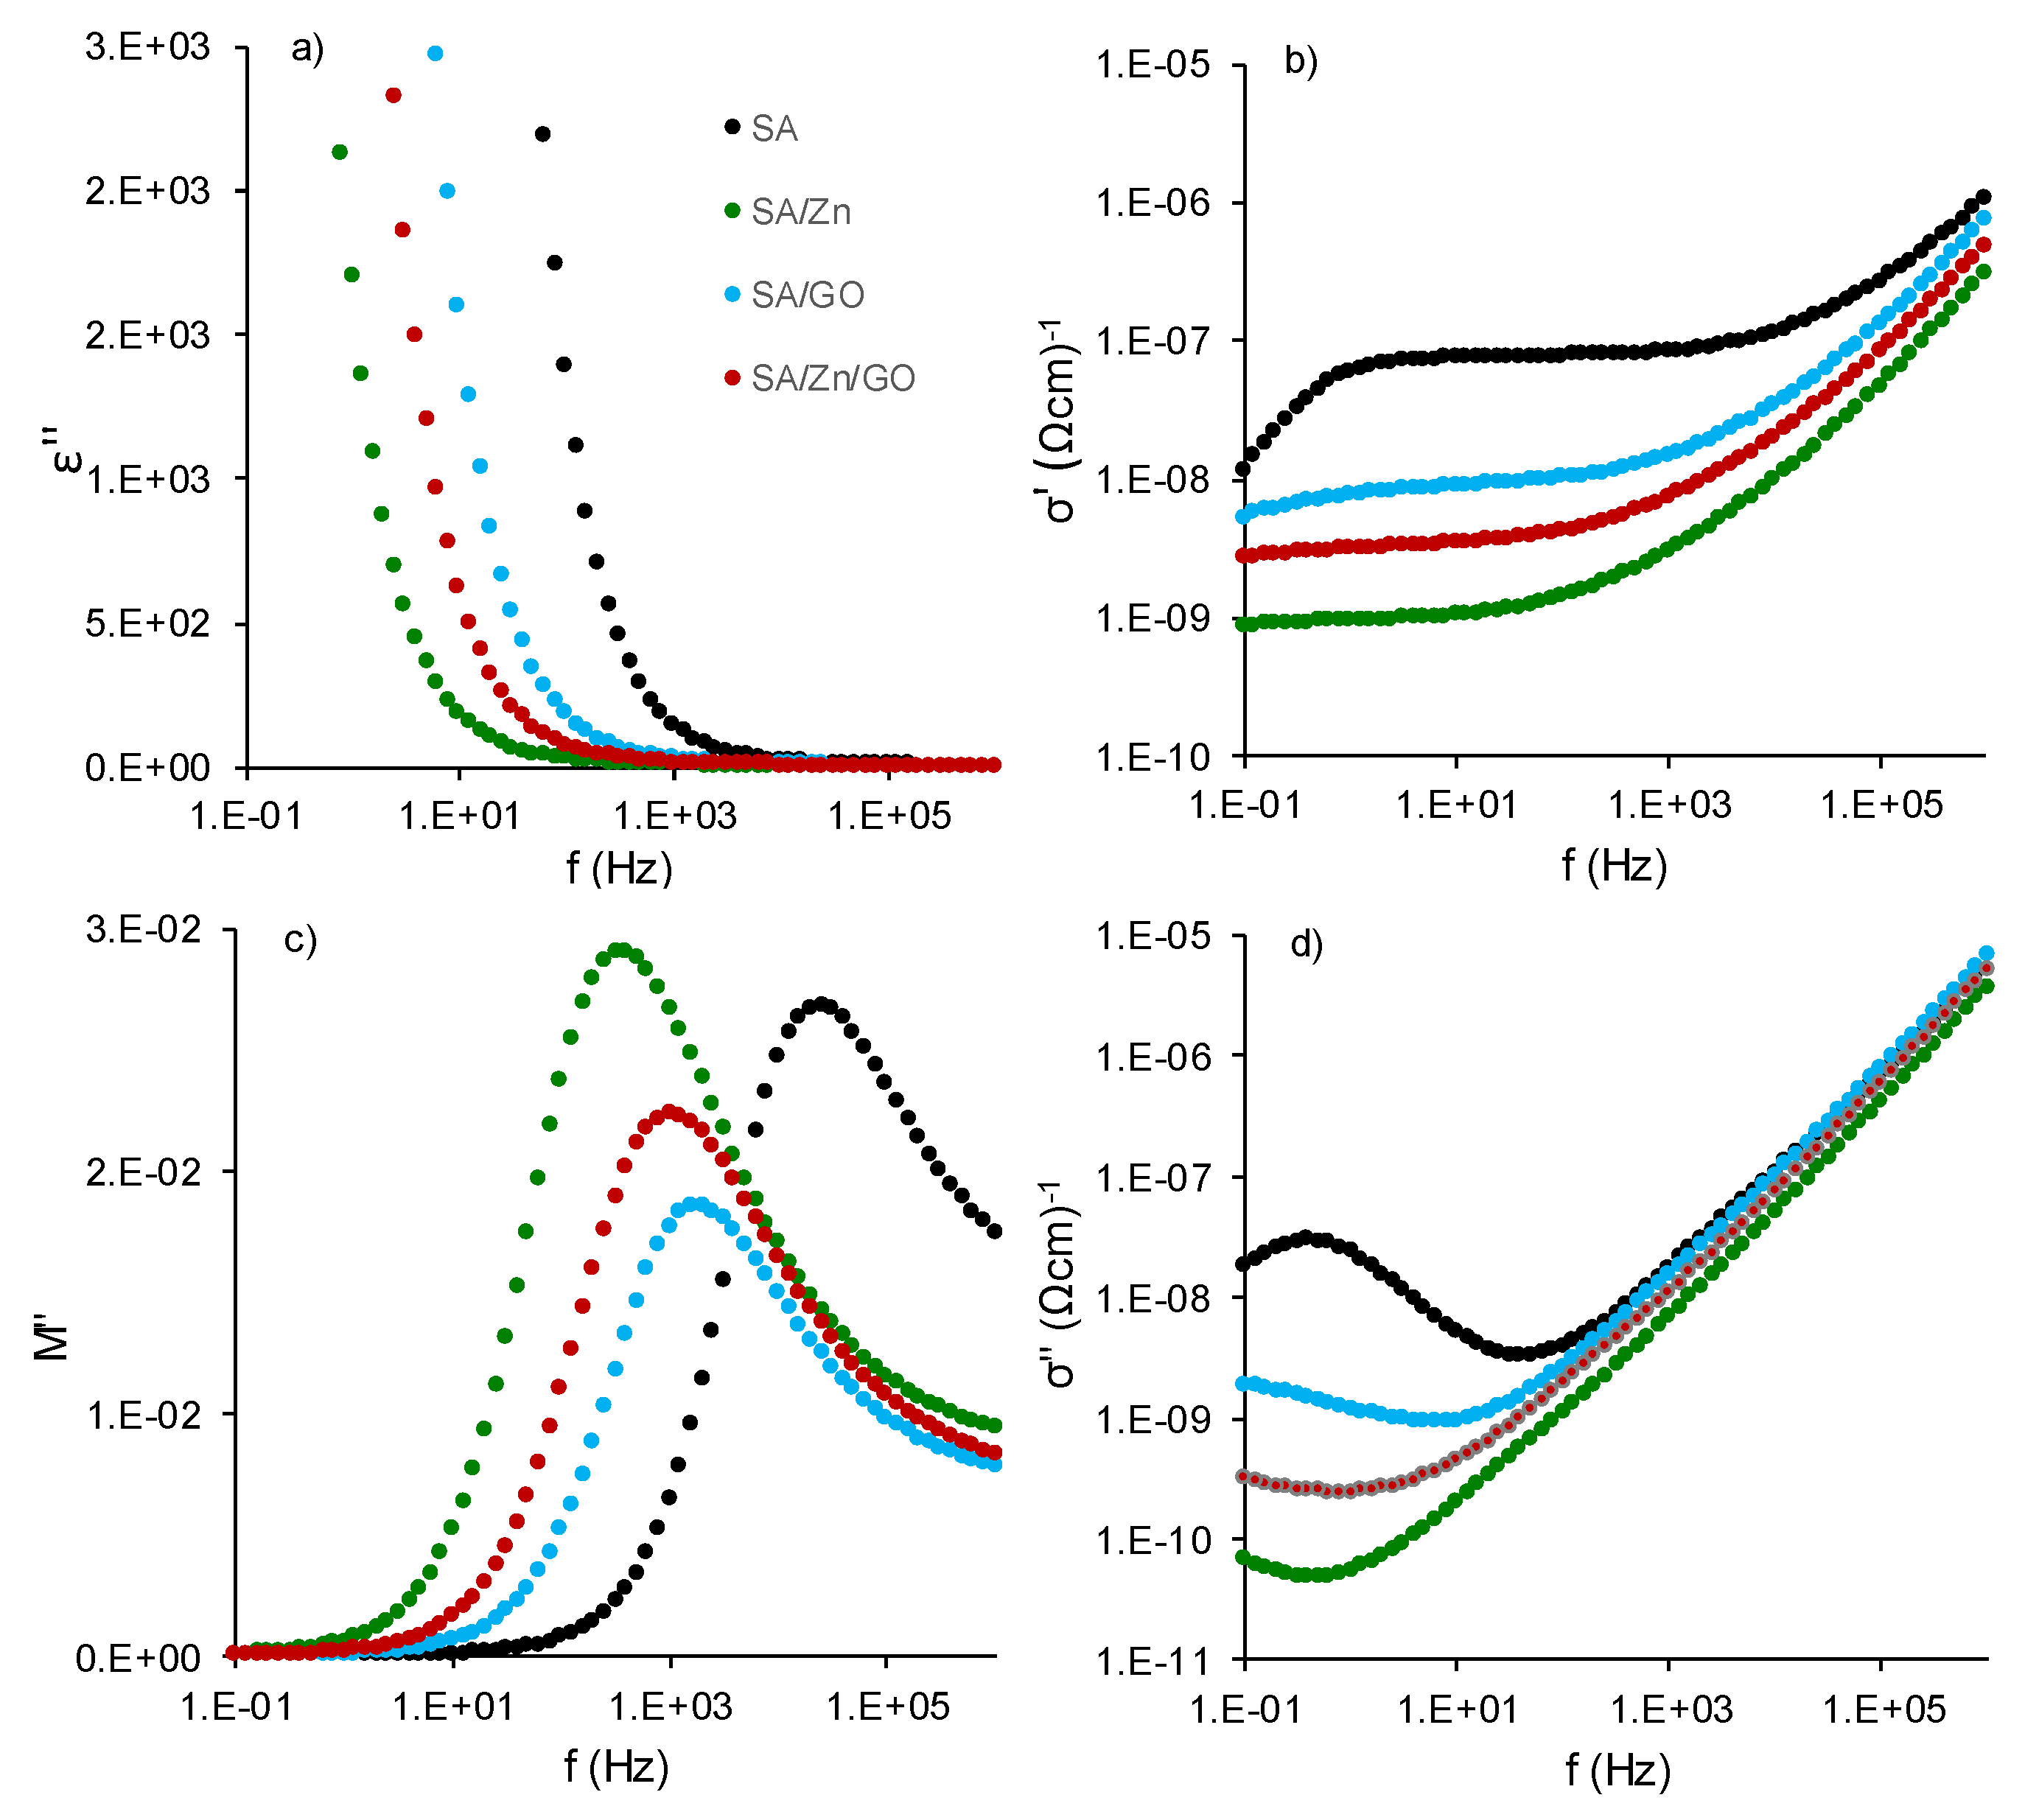
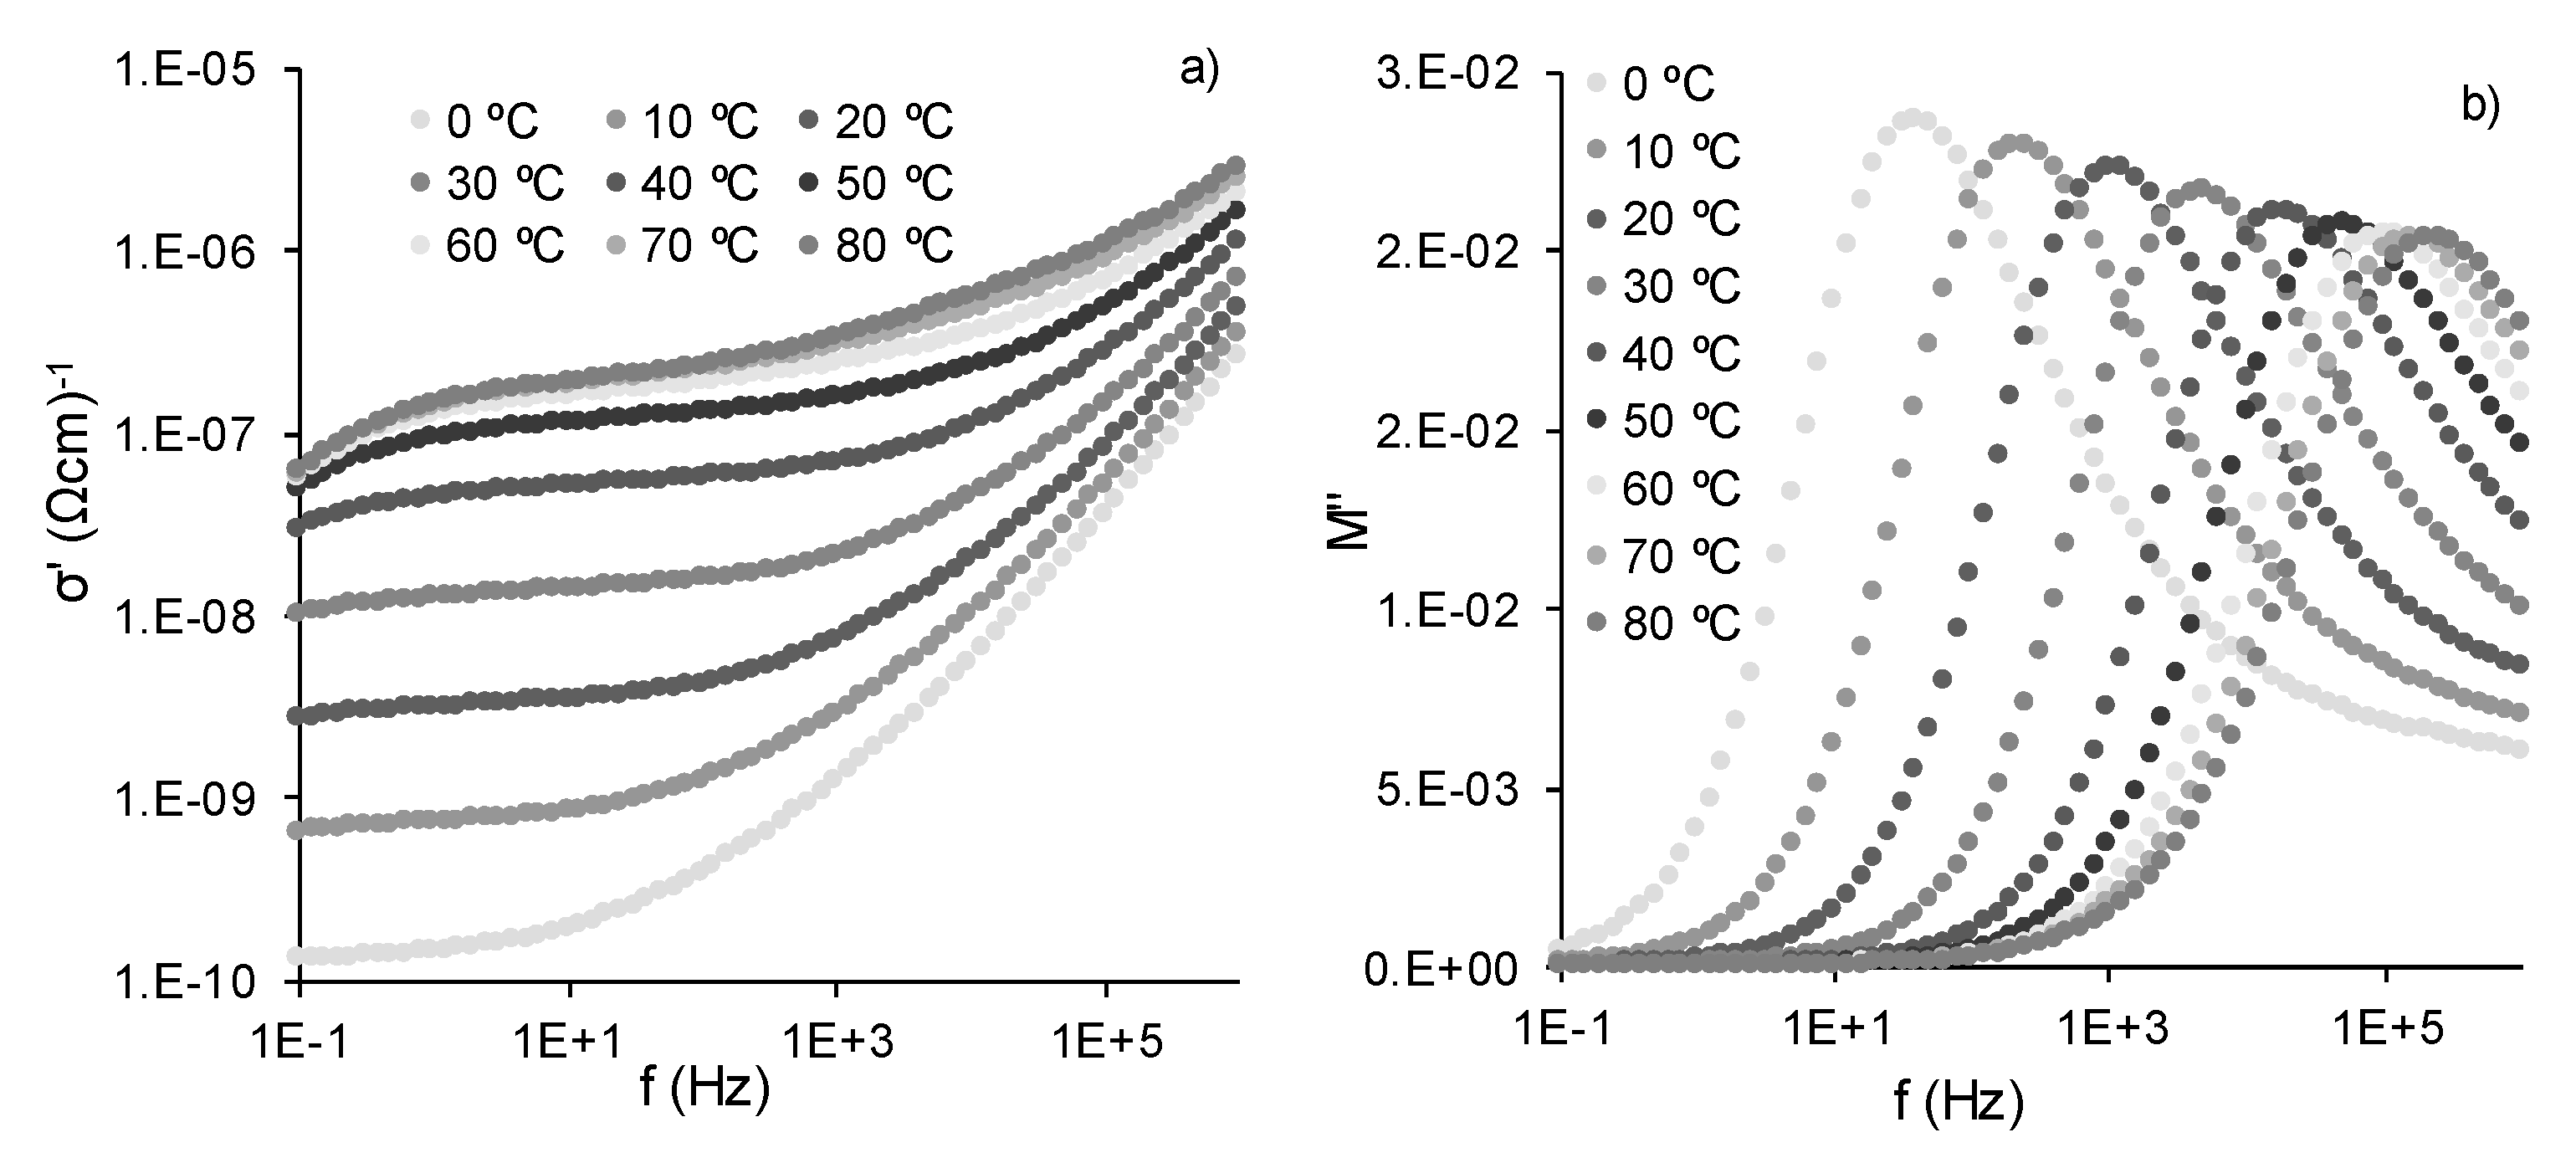
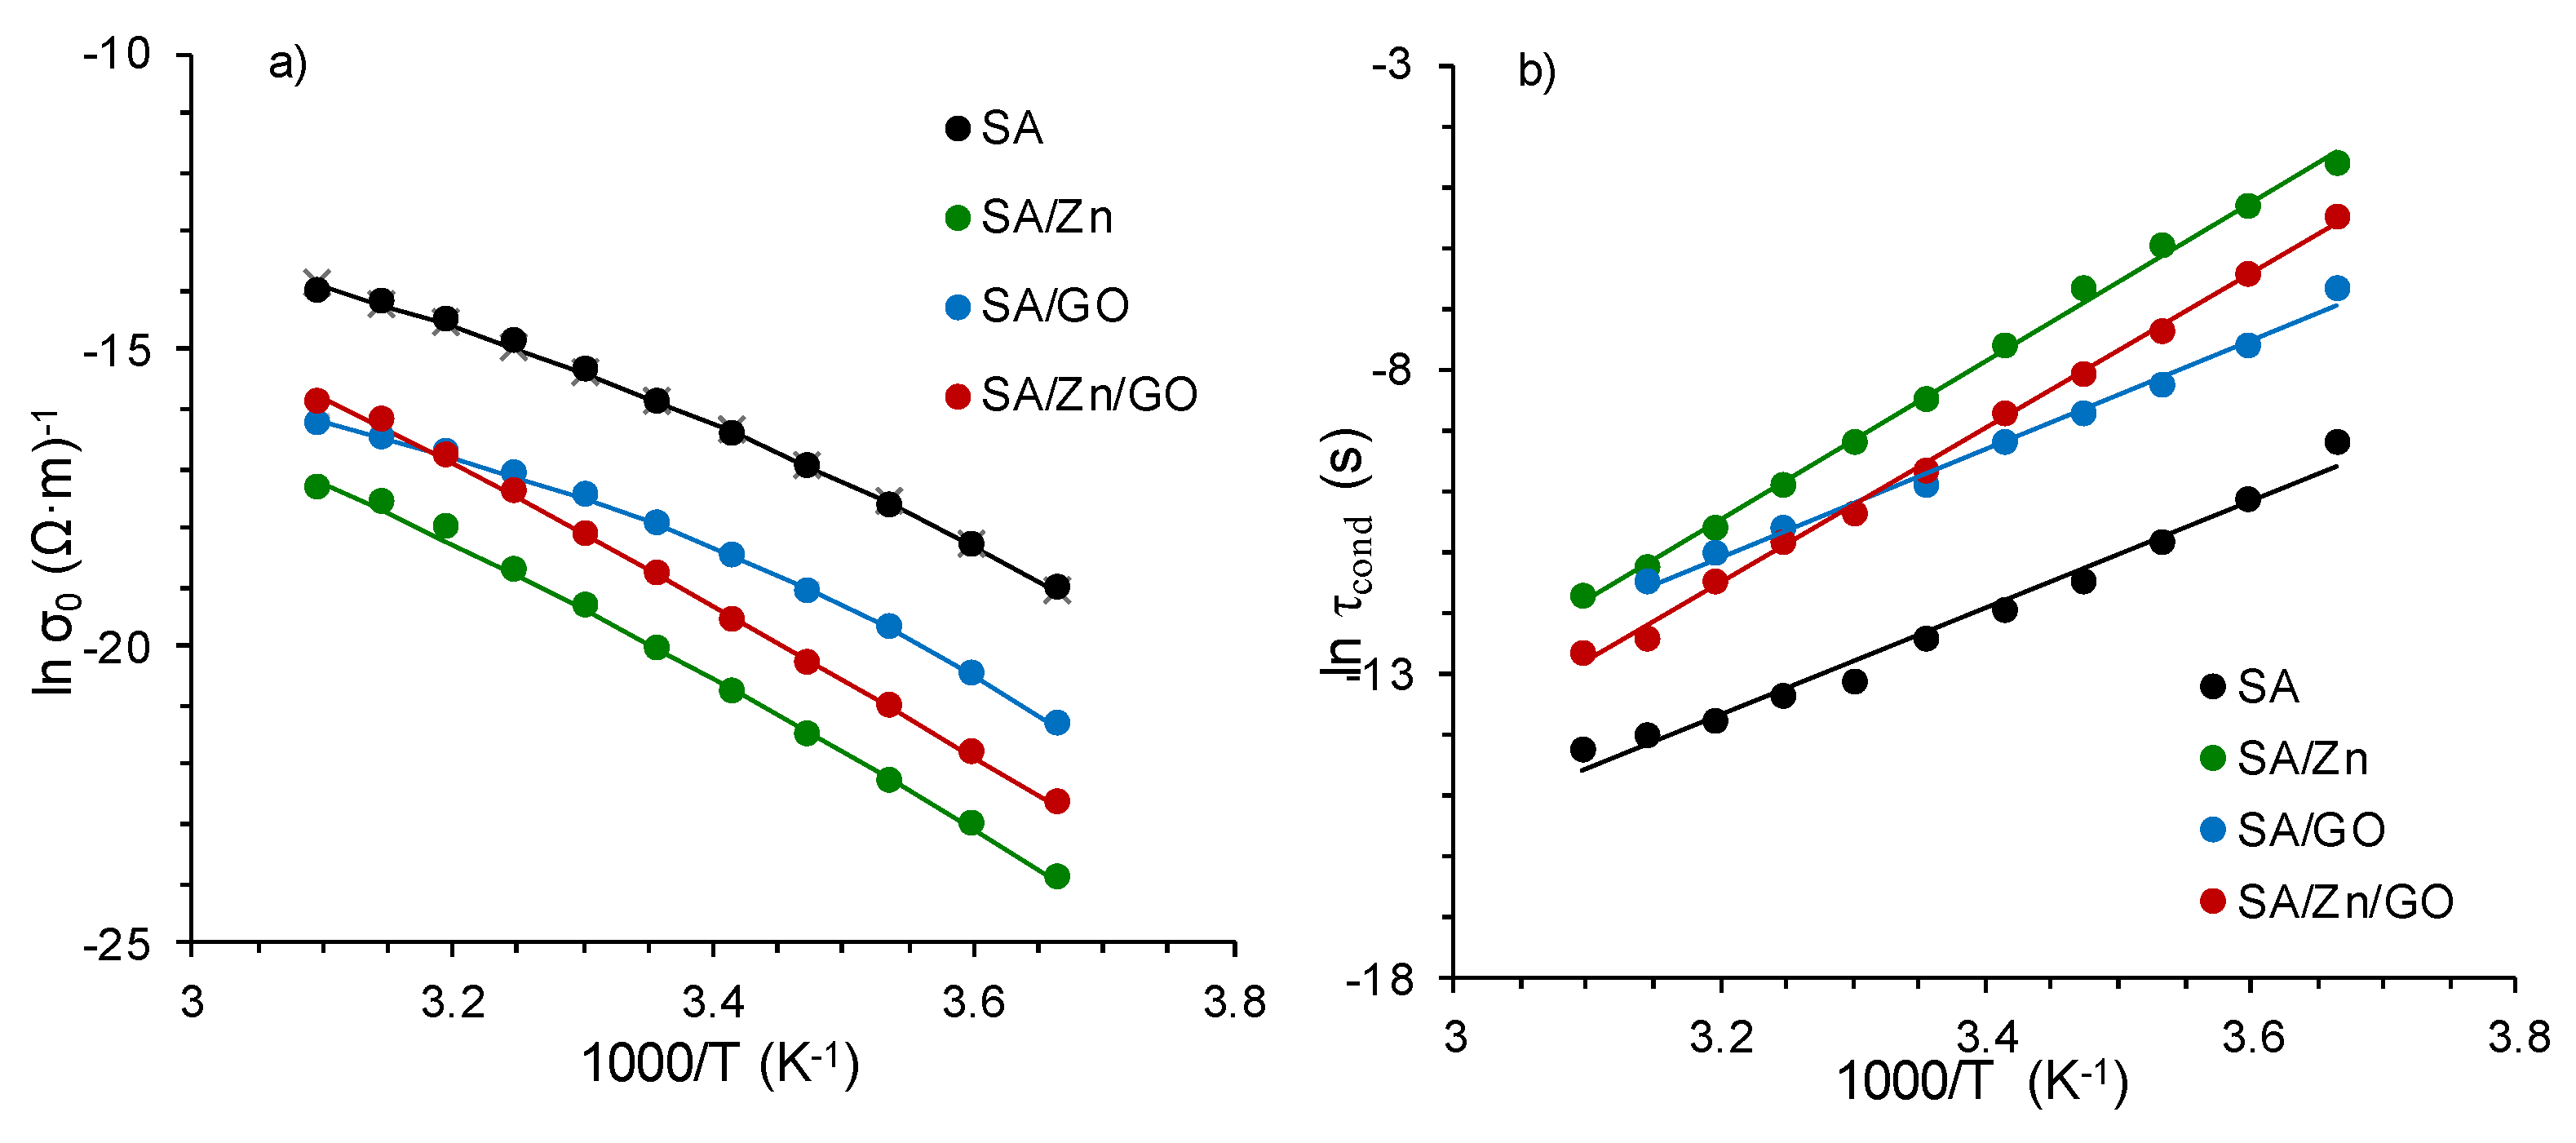
3.6. Dielectric Properties
4. Conclusions
Author Contributions
Funding
Acknowledgments
Conflicts of Interest
References
- Karak, N. Fundamentals of Nanomaterials and Polymer Nanocomposites; Elsevier Inc.: Amsterdam, The Netherlands, 2019. [Google Scholar]
- Vilcinskas, K.; Jansen, K.M.B.; Mulder, F.M.; Picken, S.J.; Koper, G.J.M. Composition dependent properties of graphene (oxide)-alginate biopolymer nanocomposites. Polym. Compos. 2018, 39, E236–E249. [Google Scholar] [CrossRef] [Green Version]
- Reina, G.; González-Domínguez, J.M.; Criado, A.; Vázquez, E.; Bianco, A.; Prato, M. Promises, facts and challenges for graphene in biomedical applications. Chem. Soc. Rev. 2017, 46, 4400–4416. [Google Scholar] [CrossRef] [PubMed] [Green Version]
- Zhao, J.; Liu, L.; Li, F. Graphene Oxide: Physics and Applications; Springer: Berlin/Heidelberg, Germany, 2014. [Google Scholar]
- Kumar, S.; Chatterjee, K. Comprehensive review on the use of graphene-based substrates for regenerative medicine and biomedical devices. ACS Appl. Mater. Interfaces 2016, 8, 26431–26457. [Google Scholar] [CrossRef] [PubMed]
- Lee, W.C.; Lim, C.H.Y.X.; Shi, H.; Tang, L.A.L.; Wang, Y.; Lim, C.T.; Loh, K.P. Origin of enhanced stem cell growth and differentiation on graphene and graphene oxide. ACS Nano 2011, 5, 7334–7341. [Google Scholar] [CrossRef]
- Ku, S.H.; Park, C.B. Myoblast differentiation on graphene oxide. Biomaterials 2013, 34, 2017–2023. [Google Scholar] [CrossRef]
- Chieng, B.W.; Ibrahim, N.A.; Yunus, W.M.Z.W.; Hussein, M.Z.; Then, Y.Y.; Loo, Y.Y. Effects of graphene nanoplatelets and reduced graphene oxide on poly (lactic acid) and plasticized poly (lactic acid): A comparative study. Polymers 2014, 6, 2232–2246. [Google Scholar] [CrossRef] [Green Version]
- Esrafilzadeh, D.; Jalili, R.; Stewart, E.M.; Aboutalebi, S.H.; Razal, J.M.; Moulton, S.E.; Wallace, G.G. High-performance multifunctional graphene-PLGA fibers: Toward biomimetic and conducting 3D scaffolds. Adv. Funct. Mater. 2016, 26, 3105–3117. [Google Scholar] [CrossRef] [Green Version]
- Zhao, Y.; Wang, Y.; Niu, C.; Zhang, L.; Li, G.; Yang, Y. Construction of polyacrylamide/graphene oxide/gelatin/sodium alginate composite hydrogel with bioactivity for promoting Schwann cells growth. J. Biomed. Mater. Res. Part A 2018, 106, 1951–1964. [Google Scholar] [CrossRef]
- Rivera-Briso, A.L.; Aachmann, F.L.; Moreno-Manzano, V.; Serrano-Aroca, Á. Graphene oxide nanosheets versus carbon nanofibers: Enhancement of physical and biological properties of poly (3-hydroxybutyrate-co-3-hydroxyvalerate) films for biomedical applications. Int. J. Biol. Macromol. 2019, 143, 1000–1008. [Google Scholar] [CrossRef]
- Bykkam, S.; Rao, K. Synthesis and characterization of graphene oxide and its antimicrobial activity against Klebsiella and Staphylococus. Int. J. Adv. Biotechnol. Res. 2013, 4, 142–146. [Google Scholar]
- Chen, J.; Peng, H.; Wang, X.; Shao, F.; Yuan, Z.; Han, H. Graphene oxide exhibits broad-spectrum antimicrobial activity against bacterial phytopathogens and fungal conidia by intertwining and membrane perturbation. Nanoscale 2014, 6, 1879–1889. [Google Scholar] [CrossRef] [PubMed]
- Serrano-Aroca, Á.; Ruiz-Pividal, J.F.; Llorens-Gámez, M. Enhancement of water diffusion and compression performance of crosslinked alginate with a minuscule amount of graphene oxide. Sci. Rep. 2017, 7, 11684. [Google Scholar] [CrossRef] [PubMed]
- Serrano-Aroca, Á.; Deb, S. Synthesis of irregular graphene oxide tubes using green chemistry and their potential use as reinforcement materials for biomedical applications. PLoS ONE 2017, 12, e0185235. [Google Scholar] [CrossRef] [PubMed] [Green Version]
- Sánchez-Correa, F.; Vidaurre-Agut, C.; Serrano-Aroca, A.; Campillo-Fernández, A.J. Poly (2-hydroxyethyl acrylate) hydrogels reinforced with graphene oxide: Remarkable improvement of water diffusion and mechanical properties. J. Appl. Polym. Sci. 2018, 135, 46158. [Google Scholar] [CrossRef]
- Serrano-Aroca, Á.; Iskandar, L.; Deb, S. Green synthetic routes to alginate-graphene oxide composite hydrogels with enhanced physical properties for bioengineering applications. Eur. Polym. J. 2018, 103, 198–206. [Google Scholar] [CrossRef] [Green Version]
- Martí, M.; Frígols, B.; Salesa, B.; Serrano-Aroca, Á. Calcium alginate/graphene oxide films: Reinforced composites able to prevent Staphylococcus aureus and methicillin-resistant Staphylococcus epidermidis infections with no cytotoxicity for human keratinocyte HaCaT cells. Eur. Polym. J. 2019, 110, 14–21. [Google Scholar] [CrossRef]
- Ratner, B.D.; Hoffman, A.S.; Schoen, F.J.; Lemons, J.E. Biomaterials Science: An Introduction to Materials in Medicine; Academic Press: Toronto, ON, Canada, 2012. [Google Scholar]
- Bouhadir, K.H.; Alsberg, E.; Mooney, D.J. Hydrogels for combination delivery of antineoplastic agents. Biomaterials 2001, 22, 2625–2633. [Google Scholar] [CrossRef]
- Volodkin, D.V.; Larionova, N.I.; Sukhorukov, G.B. Protein encapsulation via porous CaCO3 microparticles templating. Biomacromolecules 2004, 5, 1962–1972. [Google Scholar] [CrossRef]
- Gutowska, A.; Jeong, B.; Jasionowski, M. Injectable gels for tissue engineering. Anat. Rec. 2001, 263, 342–349. [Google Scholar] [CrossRef]
- Kaplan, D.L. Biopolymers from Renewable Resources; Springer: Berlin/Heidelberg, Germany, 1998. [Google Scholar]
- Vauchel, P.; Kaas, R.; Arhaliass, A.; Baron, R.; Legrand, J. A New process for extracting alginates from Laminaria digitata: Reactive extrusion. Food Bioprocess Technol. 2008, 1, 297–300. [Google Scholar] [CrossRef]
- Grant, G.T.; Morris, E.R.; Rees, D.A.; Smith, P.J.C.; Thom, D. Biological interactions between polysaccharides and divalent cations: The egg-box model. FEBS Lett. 1973, 32, 195–198. [Google Scholar] [CrossRef] [Green Version]
- Tapiero, H.; Tew, K.D. Trace elements in human physiology and pathology: Zinc and metallothioneins. Biomed. Pharm. 2003, 57, 399–411. [Google Scholar] [CrossRef]
- Scrimshaw, N.S.; Young, V.R. The requirements of human nutrition. Sci. Am. 1976, 235, 50–64. [Google Scholar] [CrossRef] [PubMed]
- Beyersmann, D.; Haase, H. Functions of zinc in signaling, proliferation and differentiation of mammalian cells. BioMetals 2001, 14, 331–341. [Google Scholar] [CrossRef]
- Levy, G.K.; Goldman, J.; Aghion, E. The prospects of zinc as a structural material for biodegradable implants—A review paper. Metals 2017, 7, 402. [Google Scholar] [CrossRef] [Green Version]
- Mourin, V.; Cattalini, J.P. Metallic ions as therapeutic agents in tissue engineering scaffolds: An overview of their biological applications and strategies for new developments. J. R. Soc. Interface 2012, 401–419. [Google Scholar] [CrossRef] [Green Version]
- Lansdown, A.B.G.; Mirastschijski, U.; Stubbs, N.; Scanlon, E.; Ågren, M.S. Zinc in wound healing: Theoretical, experimental, and clinical aspects. Wound Repair Regen. 2007, 15, 2–16. [Google Scholar] [CrossRef]
- Bowen, P.K.; Drelich, J.; Goldman, J. Zinc exhibits ideal physiological corrosion behavior for bioabsorbable stents. Adv. Mater. 2013, 25, 2577–2582. [Google Scholar] [CrossRef]
- Mnatsakanyan, H.; Sabater i Serra, R.; Rico, P.; Salmerón-Sánchez, M. Zinc uptake promotes myoblast differentiation via Zip7 transporter and activation of Akt signalling transduction pathway. Sci. Rep. 2018, 8, 13642. [Google Scholar] [CrossRef]
- Fathi, E.; Farahzadi, R. Enhancement of osteogenic differentiation of rat adipose tissue-derived mesenchymal stem cells by zinc sulphate under electromagnetic field via the PKA, ERK1/2 and Wnt/β-catenin signaling pathways. PLoS ONE 2017, 12. [Google Scholar] [CrossRef]
- Zhu, D.; Su, Y.; Young, M.L.; Ma, J.; Zheng, Y.; Tang, L. Biological responses and mechanisms of human bone marrow mesenchymal stem cells to Zn and Mg biomaterials. ACS Appl. Mater. Interfaces 2017, 9, 27453–27461. [Google Scholar] [CrossRef] [PubMed]
- Hara, T.; Takeda, T.; Takagishi, T.; Fukue, K.; Kambe, T.; Fukada, T. Physiological roles of zinc transporters: Molecular and genetic importance in zinc homeostasis. J. Physiol. Sci. 2017, 67, 283–301. [Google Scholar] [CrossRef] [PubMed]
- Qiao, Y.; Zhang, W.; Tian, P.; Meng, F.; Zhu, H.; Jiang, X.; Liu, X.; Chu, P.K. Stimulation of bone growth following zinc incorporation into biomaterials. Biomaterials 2014, 35, 6882–6897. [Google Scholar] [CrossRef] [PubMed]
- Dorst, K.; Rammelkamp, D.; Hadjiargyrou, M.; Meng, Y. The effect of exogenous zinc concentration on the Responsiveness of MC3T3-E1 pre-osteoblasts to surface microtopography: Part II (differentiation). Materials 2014, 2, 1097–1112. [Google Scholar] [CrossRef] [PubMed]
- Bouchard, J.; Khan, R.A.; Riedl, B.; Huq, T.; Khan, A.; Kamal, M.R.; Fraschini, C.; Lacroix, M.; Le Tien, C.; Salmieri, S.; et al. Nanocrystalline cellulose (NCC) reinforced alginate based biodegradable nanocomposite film. Carbohydr. Polym. 2012, 90, 1757–1763. [Google Scholar]
- Lacroix, M.; Han, J.; Guenier, A.S.; Salmieri, S. Alginate and chitosan functionalization for micronutrient encapsulation. J. Agric. Food Chem. 2008, 56, 2528–2535. [Google Scholar]
- Malesu, V.K.; Sahoo, D.; Nayak, P.L. Chitosan–sodium alginate nanocom–posites blended with cloisite 30B as a novel drug delivery system for anticancer drug curcumin. Int. J. Appl. Biol. Pharm. Tech. Nol. 2011, 2, 402–411. [Google Scholar]
- Ionita, M.; Pandele, M.A.; Iovu, H. Sodium alginate/graphene oxide composite films with enhanced thermal and mechanical properties. Carbohydr. Polym. 2013, 94, 339–344. [Google Scholar] [CrossRef]
- Hemalatha, K.; Somashekarappa, H.; Somashekar, R. Preparation and characterization of MMT doped PVA/SA polymer composites. Adv. Mater. Phys. Chem. 2014, 4, 172–178. [Google Scholar] [CrossRef] [Green Version]
- Zheng, H.; Yang, J.; Han, S. The synthesis and characteristics of sodium alginate/graphene oxide composite films crosslinked with multivalent cations. J. Appl. Polym. Sci. 2016, 133, 43616. [Google Scholar] [CrossRef]
- Nakamoto, K. Infrared and Raman Spectra of Inorganic and Coordination Compounds, Theory and Applications in Inorganic Chemistry; John Wiley & Sons Inc.: Hoboken, NJ, USA, 2008. [Google Scholar]
- Sungjin Lee, K.; Bozoklu, G.; Cai, W.; Nguyen, K.S.T.; Ruoff, R.S. Graphene oxide papers modified by ions, divalent mechanical, enhancing cross-linking. Prop. Chem. Park 2014, 2, 572–578. [Google Scholar]
- El-Houssiny, A.S.; Ward, A.A.; Mostafa, D.M.; Abd-El-Messieh, S.L.; Abdel-Nour, K.N.; Darwish, M.M.; Khalil, W.A. Drug-p olymer interaction between glucosamine sulfate and alginate nanoparticles: FTIR, DSC and dielectric spectroscopy studies. Adv. Nat. Sci. Nanosci. Nanotechnol. 2016, 7, 025014. [Google Scholar] [CrossRef]
- Laurienzo, P.; Malinconico, M.; Motta, A.; Vicinanza, A. Synthesis and characterization of a novel alginate-poly (ethylene glycol) graft copolymer. Carbohydr. Polym. 2005, 62, 274–282. [Google Scholar] [CrossRef]
- Burdick, J.; Stevens, M. Biomedical hydrogels. In Biomaterials, Artificial Organs and Tissue Engineering; Woodhead Publishing: Cambridge, UK, 2005; pp. 107–115. [Google Scholar]
- Taha, M.O.; Nasser, W.; Ardakani, A.; AlKhatib, H.S. Sodium lauryl sulfate impedes drug release from zinc-crosslinked alginate beads: Switching from enteric coating release into biphasic profiles. Int. J. Pharm. 2008, 350, 291–300. [Google Scholar] [CrossRef]
- Smith, M.B.; March, J. March’s Advanced Organic Chemistry; John Wiley & Sons: Hoboken, NJ, USA, 2007. [Google Scholar]
- Song, M.; Hourston, D.J.; Pollock, H.M.; Hammiche, A. Modulated differential scanning calorimetry: 14. effect of molecular interactions on glass transition behaviour and increment of heat capacity in miscible polymer blends. Polymer 1999, 40, 4763–4767. [Google Scholar]
- Sasaki, T.; Uchida, T.; Sakurai, K. Effect of crosslink on the characteristic length of glass transtion of network polymers. J. Polym. Sci. Part B Polym. Phys. 2006, 44, 1958–1966. [Google Scholar] [CrossRef]
- Pathak, T.S.; Yun, J.H.; Lee, J.; Paeng, K.J. Effect of calcium ion (cross-linker) concentration on porosity, surface morphology and thermal behavior of calcium alginates prepared from algae (Undaria pinnatifida). Carbohydr. Polym. 2010, 81, 633–639. [Google Scholar] [CrossRef]
- Xu, P.; Zhang, X. Investigation of MWS polarization and dc conductivity in polyamide 610 using dielectric relaxation spectroscopy. Eur. Polym. J. 2011, 47, 1031–1038. [Google Scholar] [CrossRef]
- Tsangaris, G.M.; Psarras, G.C.; Kouloumbi, N. Electric modulus and interfacial polarization in composite polymeric systems. J. Mater. Sci. 1998, 33, 2027–2037. [Google Scholar] [CrossRef]
- Psarras, G.C. Conductivity and dielectric characterization of polymer nanocomposites. In Physical Properties and Applications of Polymer Nanocomposites; Elsevier: Amsterdam, The Netherlands, 2010; pp. 31–69. [Google Scholar]
- Sabater i Serra, R.; Escobar Ivirico, J.L.; Romero Colomer, F.; Andrio Balado, A.; Gómez Ribelles, J.L. Molecular dynamics in polymer networks containing caprolactone and ethylene glycol moieties studied by dielectric relaxation spectroscopy. J. Non. Cryst. Solids 2014, 404, 109–115. [Google Scholar] [CrossRef] [Green Version]


| Sample | weq mwater/mdry sample | Tg (°C) | ΔTg (°C) | Δcp (J/gK) | Td-50% (°C) |
|---|---|---|---|---|---|
| SA | - | 122 ± 1 | 5.7 ± 0.5 | 8.4 ± 0.002 | 270 |
| SA/Zn | 115 ± 2 | 124 ± 1 | 9.1 ± 0.5 | 7.8 ± 0.002 | 295 |
| SA/GO | - | 122 ± 1 | 9.4 ± 0.5 | 6.1 ± 0.002 | 300 |
| SA/Zn/GO | 87 ± 13 | 128 ± 1 | 8.4 ± 0.5 | 5.7 ± 0.002 | 321 |
| Sample | σ∞ (Ωcm−1) | B (K) | T0 (K) | τ0 (K) | Ea (KJmol−1) |
|---|---|---|---|---|---|
| SA | 3.47 × 10⁻³ | −1062 | 1.94 × 10² | 5.43 × 10⁻¹⁹ | 74 |
| SA/Zn | 2.23 | −3288 | 1.40 × 10² | 1.85 × 10⁻²³ | 105 |
| SA/GO | 2.33 × 10⁻⁵ | −573 | 2.19 × 10² | 1.15 × 10⁻¹⁷ | 75 |
| SA/ZN/GO | 4.31 × 10³ | −5381 | 9.98 × 10 | 1.99 × 10⁻²³ | 106 |
© 2020 by the authors. Licensee MDPI, Basel, Switzerland. This article is an open access article distributed under the terms and conditions of the Creative Commons Attribution (CC BY) license (http://creativecommons.org/licenses/by/4.0/).
Share and Cite
Sabater i Serra, R.; Molina-Mateo, J.; Torregrosa-Cabanilles, C.; Andrio-Balado, A.; Meseguer Dueñas, J.M.; Serrano-Aroca, Á. Bio-Nanocomposite Hydrogel Based on Zinc Alginate/Graphene Oxide: Morphology, Structural Conformation, Thermal Behavior/Degradation, and Dielectric Properties. Polymers 2020, 12, 702. https://0-doi-org.brum.beds.ac.uk/10.3390/polym12030702
Sabater i Serra R, Molina-Mateo J, Torregrosa-Cabanilles C, Andrio-Balado A, Meseguer Dueñas JM, Serrano-Aroca Á. Bio-Nanocomposite Hydrogel Based on Zinc Alginate/Graphene Oxide: Morphology, Structural Conformation, Thermal Behavior/Degradation, and Dielectric Properties. Polymers. 2020; 12(3):702. https://0-doi-org.brum.beds.ac.uk/10.3390/polym12030702
Chicago/Turabian StyleSabater i Serra, Roser, José Molina-Mateo, Constantino Torregrosa-Cabanilles, Andreu Andrio-Balado, José María Meseguer Dueñas, and Ángel Serrano-Aroca. 2020. "Bio-Nanocomposite Hydrogel Based on Zinc Alginate/Graphene Oxide: Morphology, Structural Conformation, Thermal Behavior/Degradation, and Dielectric Properties" Polymers 12, no. 3: 702. https://0-doi-org.brum.beds.ac.uk/10.3390/polym12030702