
Structural Behavior of High-Strength Concrete Slabs Reinforced with GFRP Bars


Department of Structural Engineering, Reinforced Concrete Structures, Shoubra Faculty of Engineering, Benha University, 108 Shoubra St., Shoubra, Cairo 11629, Egypt
*
Author to whom correspondence should be addressed.
Polymers 2021, 13(17), 2997; https://0-doi-org.brum.beds.ac.uk/10.3390/polym13172997
Submission received: 18 August 2021
/
Revised: 31 August 2021
/
Accepted: 2 September 2021
/
Published: 3 September 2021
(This article belongs to the Special Issue Durability and Degradation of Polymeric Materials)
Abstract
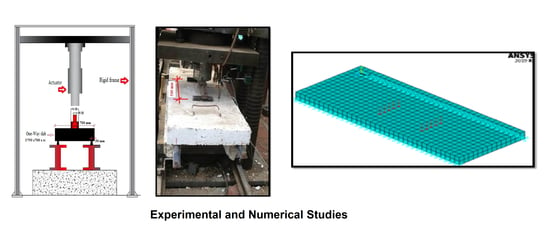
:In this manuscript, structural testing was conducted on high-strength concrete slab specimens to investigate the behavior of such specimens when reinforced with a locally produced GFRP reinforcement. Subsequently, a finite element model (FEM) was constructed and validated against the experimental results. In the experimental phase, a total of eleven specimens (nine were reinforced with GFRP, while two were reinforced with conventional steel) were constructed and tested. The slabs dimensions are 700 mm × 1750 mm with variable thickness from 100 mm to 150 mm and different reinforcement ratios using different diameters. The structural behavior of the tested slabs was investigated in terms of ultimate load, ultimate deflection, load–deflection relationship, and crack pattern. Additionally, a nonlinear finite element model using the software ANSYS 2019-R1 was constructed to simulate the structural behavior of slabs reinforced with GFRP bars. The results obtained from the finite element analysis are compared with experimental results. The outcomes showed that the contribution of GFRP rebars in concrete slabs improved slab ductility and exhibited higher deflection when compared with traditional steel rebars. Good agreement between experimental and nonlinear analysis was obtained.
1. Introduction
Corrosion of steel reinforcing bars is one of the major problems that shorten the lifetime serviceability of reinforced concrete (RC) structures [1,2,3,4]. This has led to the development of new concrete-reinforcing materials. With their high strength and good corrosion resistance, fiber-reinforced polymers (FRPs) represent a good alternative. In comparison to steel, the distinctive properties of FRP materials are high strength, relatively low elastic modulus, and elastic response to failure. Given these different properties, the behavior of concrete elements reinforced with FRP is likely to differ markedly from those that employ conventional steel reinforcement. This difference is characterized not only by a different load–deflection response but also by a change in the mode of failure. The failure mechanism of FRP-reinforced concrete elements is due to them being relatively brittle, even in flexure. This gives rise to major concerns by structural engineers who are more familiar with the under-reinforced design philosophy developed for steel RC structures, which ensures a ductile failure to give plenty of warning. However, Ospina and Nanni [5] concluded that different deflections can be predicted for members reinforced with FRP bars that have similar stiffness but different ultimate tensile strength. Because deflection is a problem associated with the serviceability limit state, the procedure should not be linked to ultimate limit state parameters [6,7,8]. Lately, the flexural performance of FRP-RC elements has been widely studied. Benmokrane et al. [9] conducted an experimental and theoretical evaluation of the flexural performance of RC beams reinforced with glass FRP and steel. Masmoudi et al. [10] investigated the effects of reinforcement ratio on cracking patterns, deformation, flexural capabilities, and failure mechanisms of GFRP and steel-reinforced concrete beams. They evaluated the impact of compression reinforcement when calculating the final flexural capacity of the beams. Nonetheless, the impact was dismissed as insignificant. FRP and steel-reinforced concrete parts react differently in terms of serviceability. Alsayed et al. [11] found that GFRP beams could precisely anticipate flexural capabilities using the ultimate theory of designs. Toutanji and Saafi [12] changed the factor of the power in the equation of Branson to account for its experimental results with the elasticity of the bar and the ratio of reinforcement. Toutanji and Deng [13] demonstrated that ACI 440.1R-01 can successfully estimate deflections and crack width in one-layer FRP-bar beams with crack width. However, ACI 440.1R-01 may be employed once some parameters have been changed when FRP bars are arranged in two layers. Thiagarajan [14] reported the findings of an experimental and analytical investigation comparing the flexural performance of RC beams reinforced with sandblasted carbon basalt fiber rods composite rods. He studied 12 beams comprising three control steel beams that were evaluated for features of deformation and strength. Experimental results from pullout testing revealed that bonding of sandblasted rods is not a serious problem. The effective inertia prediction moment of the FRP-RC beam was investigated by Moussavi and Esfahani [15]. This article presents new equations based on evolutionary algorithms and experimental data to estimate the effective time of FRP-RC beams in inertia. The testing results were highly associated with the expected values using the suggested equations, particularly with high strengthening ratios and high load-levels. Rashid et al. [16] reported the flexural behavior of 10 HSC beams reinforced with aramid-fiber-reinforced polymers (AFRPs). The study recommended that ductility measurement for FRP beams is useful. The necessity to reduce the maximum distances between the stirrups as defined in the existing code has also been recognized, and recommendations have been given for sections with high shear forces coupled with considerable bending moments. Ashour [17] presented the flexural and shear capacity of 12 GFRP beams. Comparisons between the flexural capacity derived from theoretical analysis and those determined experimentally indicate satisfactory consent. Nayal and Rasheed [18] proposed a model investigating the tension stiffening of RC beams reinforced with steel and FRP bars. The study’s findings give useful model parameters for steel and FRP-RC beams. According to Kara and Ashour [19,20,21], the low elastic modulus of FRP bar results in significant crack width and deflections when compared with steel bars. Kassem et al. [22] investigated the serviceability of FRP beams reinforced with various types and reinforcement ratios. To assess the accuracy of such prediction models according to ACI Committee 440-H., the experimental results were compared with CSA 2002 and ACI Committee 440 2006 accessible models. Al-Sunna et al. [23] showed high ultimate capacities of moment compared obtained from nearly all codes. Barris et al. [24] evaluated the deflections and cracking in 14 GFRP RC beams for typical predicted models. The impact of the important factors was examined, and the appropriateness of various predicted models and the empirical coefficient modification were explored. Mahroug et al. [25,26] examined continuous concrete slabs strengthened with basalt and carbon FRP bars. The combined flexure–shear collapse mechanism was seen in all slabs. Furthermore, they demonstrated that increasing the bottom reinforcement of slabs is more successful than increasing the top reinforcement in enhancing load-carrying capacity and reducing midspan deflections. Dundar et al. [27] reported the load–displacement conduct of FRP and steel multispan RC beams. The deflection of FRP or steel RC beams was determined using a numerical technique. This study can offer a helpful method for calculating deflection for any type of reinforcement. Wang et al. [28] assessed the polymer tendons under sea conditions in both the prestressed basalt and hybrid fiber-reinforced tendons. The interior corrosive steel wires caused basalt and steel wire to degrade considerably more quickly. Chenggao et al. [29] investigated the distribution in a pultruded glass or carbon hybrid bar and absorption of water under temperatures and hydraulic pressures. The increased temperatures and hydraulic pressure accelerated the water diffusion in the hybrid bar. Demakos et al. [30] provided a numerical and experimental study for a structured curved frame. The thin-arched ultimate load achieved values similar to those seen for the mortar compressive strength employed. There was good agreement between experimental and numerical results. In an optimal design of a steel building, Papavasileiou and Pnevmatikos [31] submitted an investigation against an earthquake and the gradual cord collapse. This study indicates that the gradual collapse can bring the whole structure to failure locally by a structural component. The findings of this research show the promising cable potential as a way of increasing the building’s progressive resistance to collapse.
This paper presents the flexural behavior of one-way concrete slabs reinforced with locally manufactured GFRP bars. Currently, experimental data conducted for HSC slabs reinforced with GFRP bars are scarce. So, an experimental study was done to study the behavior of HSC slabs reinforced with GFRP bars with different reinforcement ratios varying from 0.8 µb to 1.2 µb (balanced reinforcement ratio) using different bars diameters. Eleven slabs 1750 mm in length, 700 mm in width, and 100 mm to 150 mm in depth were loaded and tested until failure. Nonlinear finite element analysis was conducted using ANSYS 2019-R1 to verify the obtained experimental results in terms of load–deflection curves, deflection, and crack pattern for all tested slabs.
2. Experimental Program
The experimental study was investigated in the Housing and Building National Research Center (HBNRC), Giza, Egypt. This study was performed to study the structural performance of HSC slabs reinforced with GFRP bars under flexural load. The ultimate load, ultimate deflection, concrete and GFRP bar strains, and crack pattern was obtained.
2.1. Experimental Study
2.1.1. Concrete Mix
2.1.2. Compressive Strength Test
2.1.3. GFRP Bars
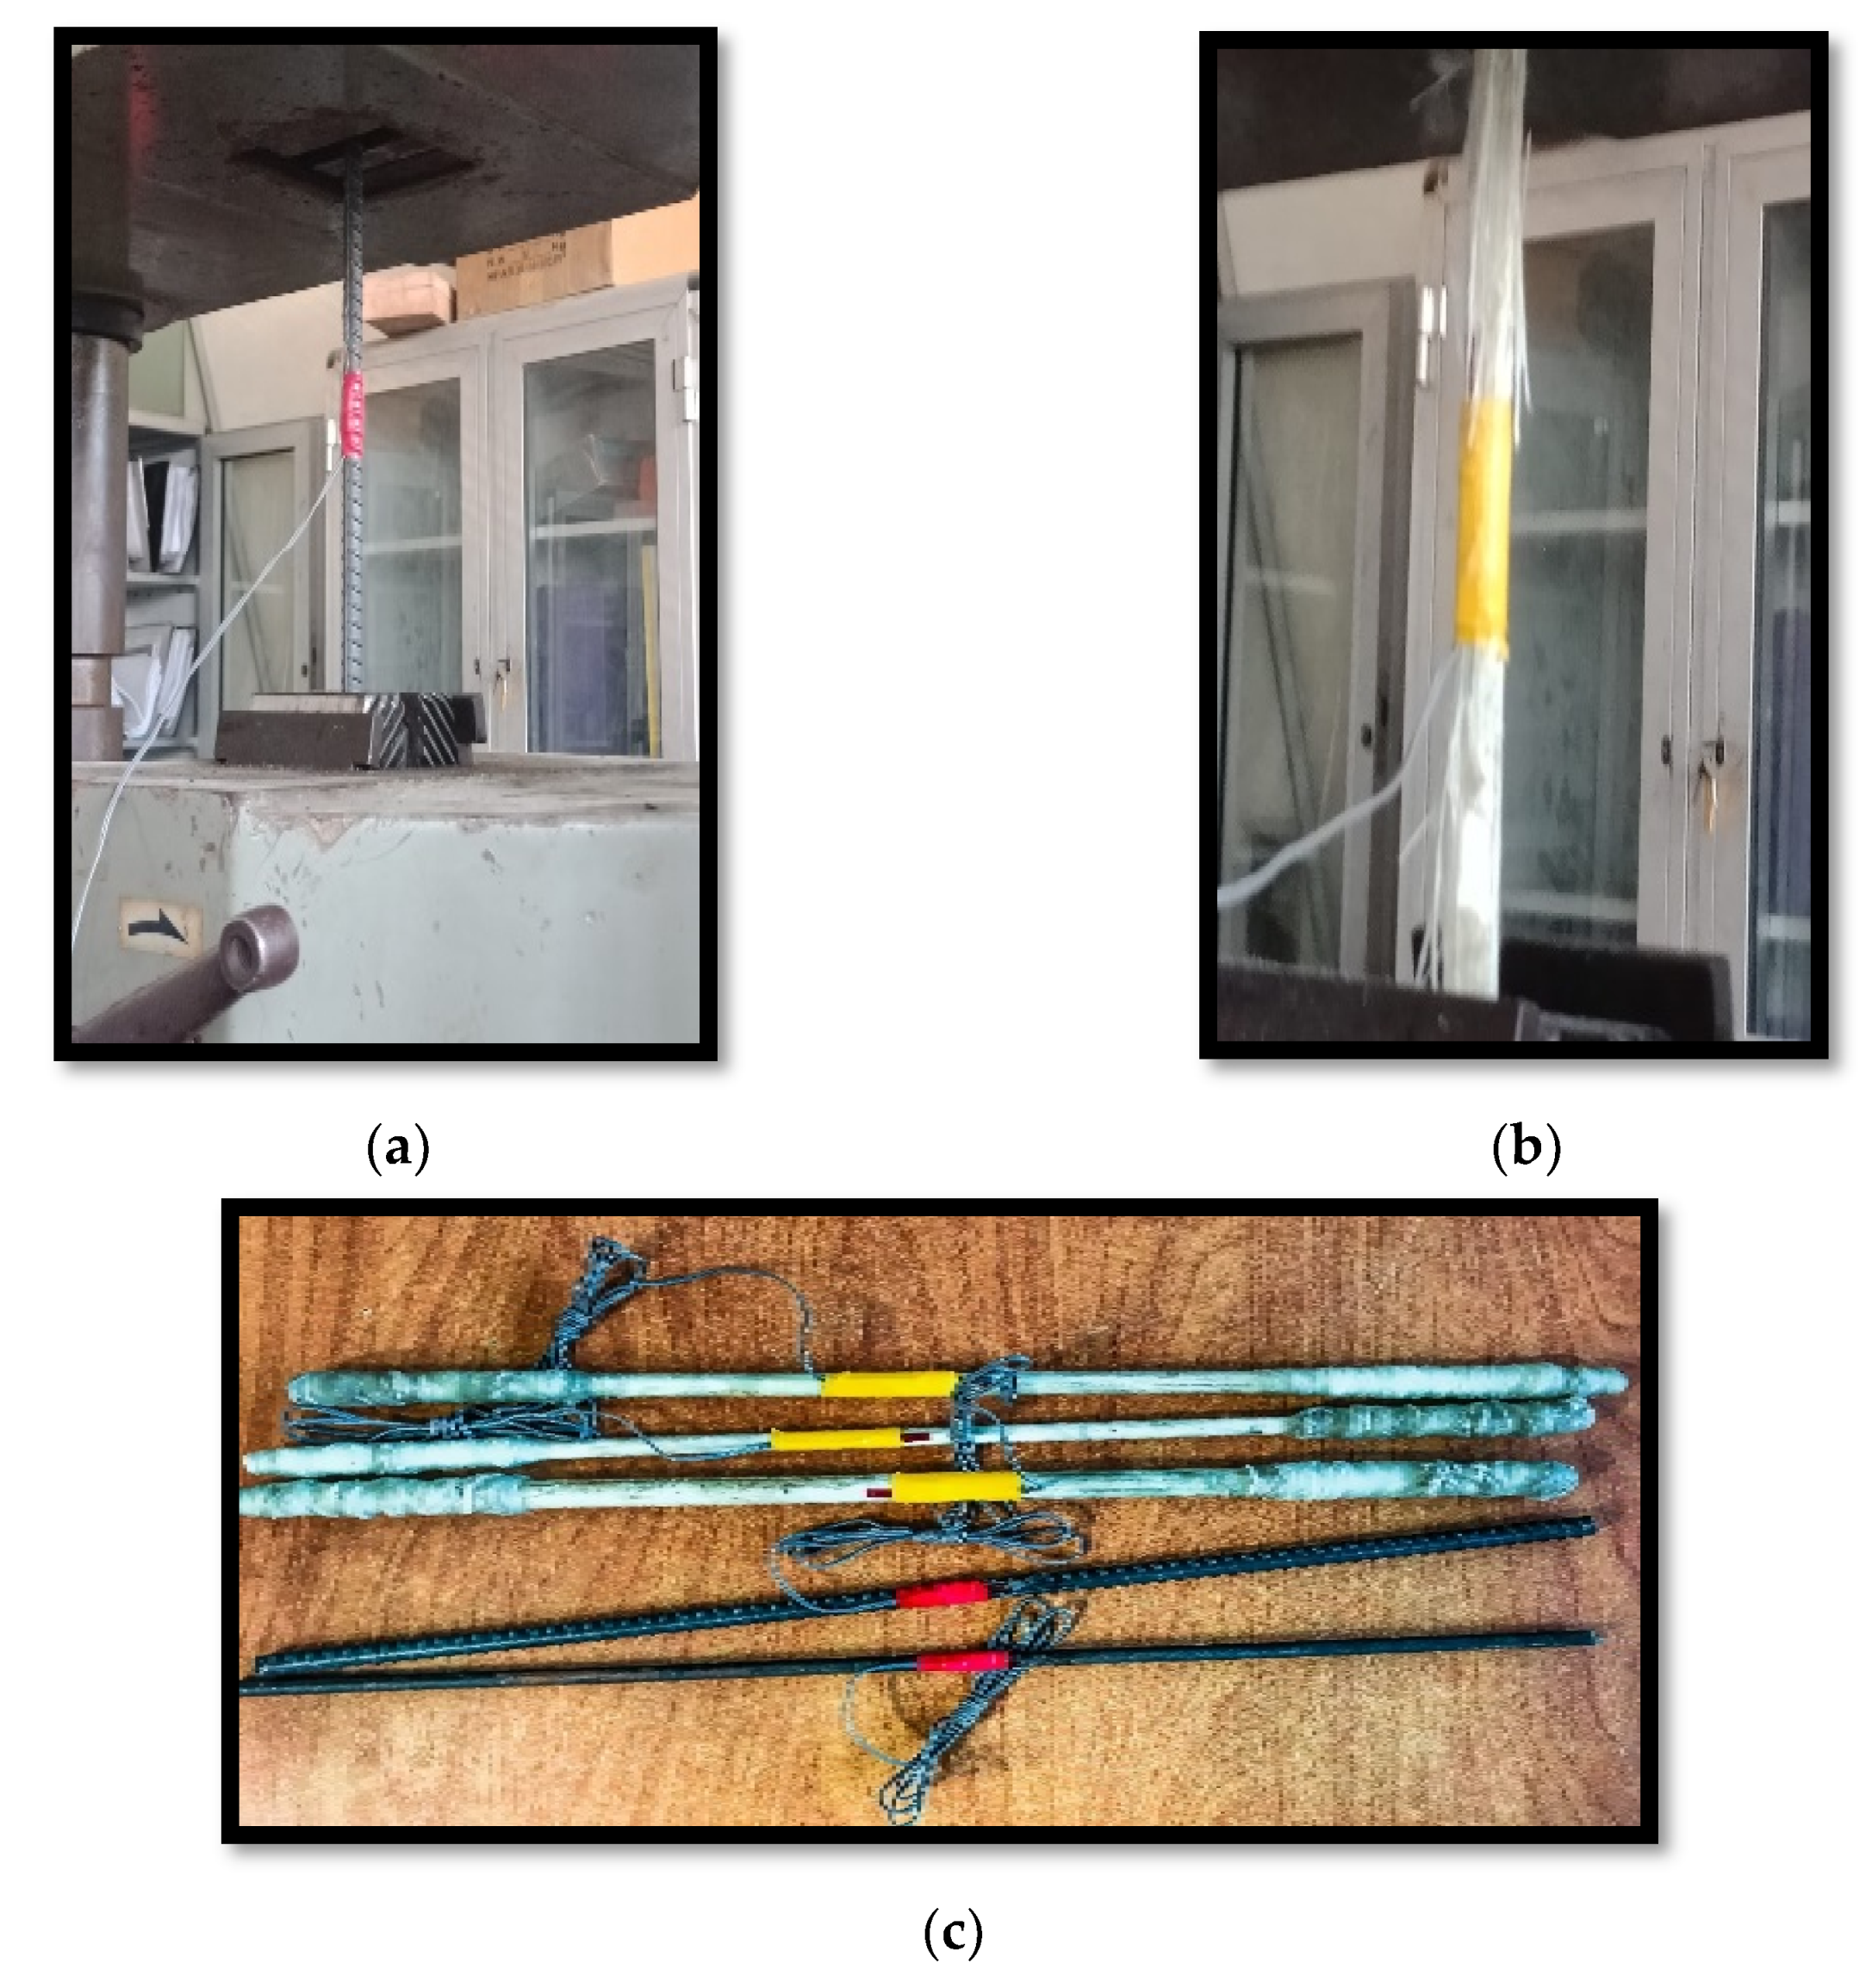
The tensile strength of used GFRP bars varied between 490, 650, and 750 MPa for diameters of 8 mm, 10 mm and 12 mm, respectively, as shown in Table 3. This tensile strength for nominal diameters of 8 mm, 10 mm, and 12 mm was tested in the Housing and Building National Research Center (HBNRC), as shown in Figure 3, according to ECP’2018 [32].
2.1.4. Description of Tested Slabs
The experimental program consists of four groups of concrete slabs with dimensions of 1750 mm in length and 700 mm in width and different heights from 100 mm to 150 mm. All tested slabs have the same 60 MPa compressive strength. The first group (SP1 and SP2) represents control slabs with balanced steel reinforcement ratios of 0.16 and 0.24, respectively, and concrete height of 100 mm. The second group is “Group I” (SP3, SP4, and SP5), with balanced fiber reinforcement ratios of 0.80, 1.00, and 1.20, respectively, and concrete height of 100 mm. The third group is “Group II” (SP6, SP7, and SP8), with balanced fiber reinforcement ratios of 1.20 and concrete height of 120 mm. The final group is “Group III” (SP9, SP10, and SP11), with balanced fiber reinforcement ratios of 1.20 and concrete height of 150 mm. Table 4 and Figure 4 showed the details for the tested slabs.
2.2. Test Setup
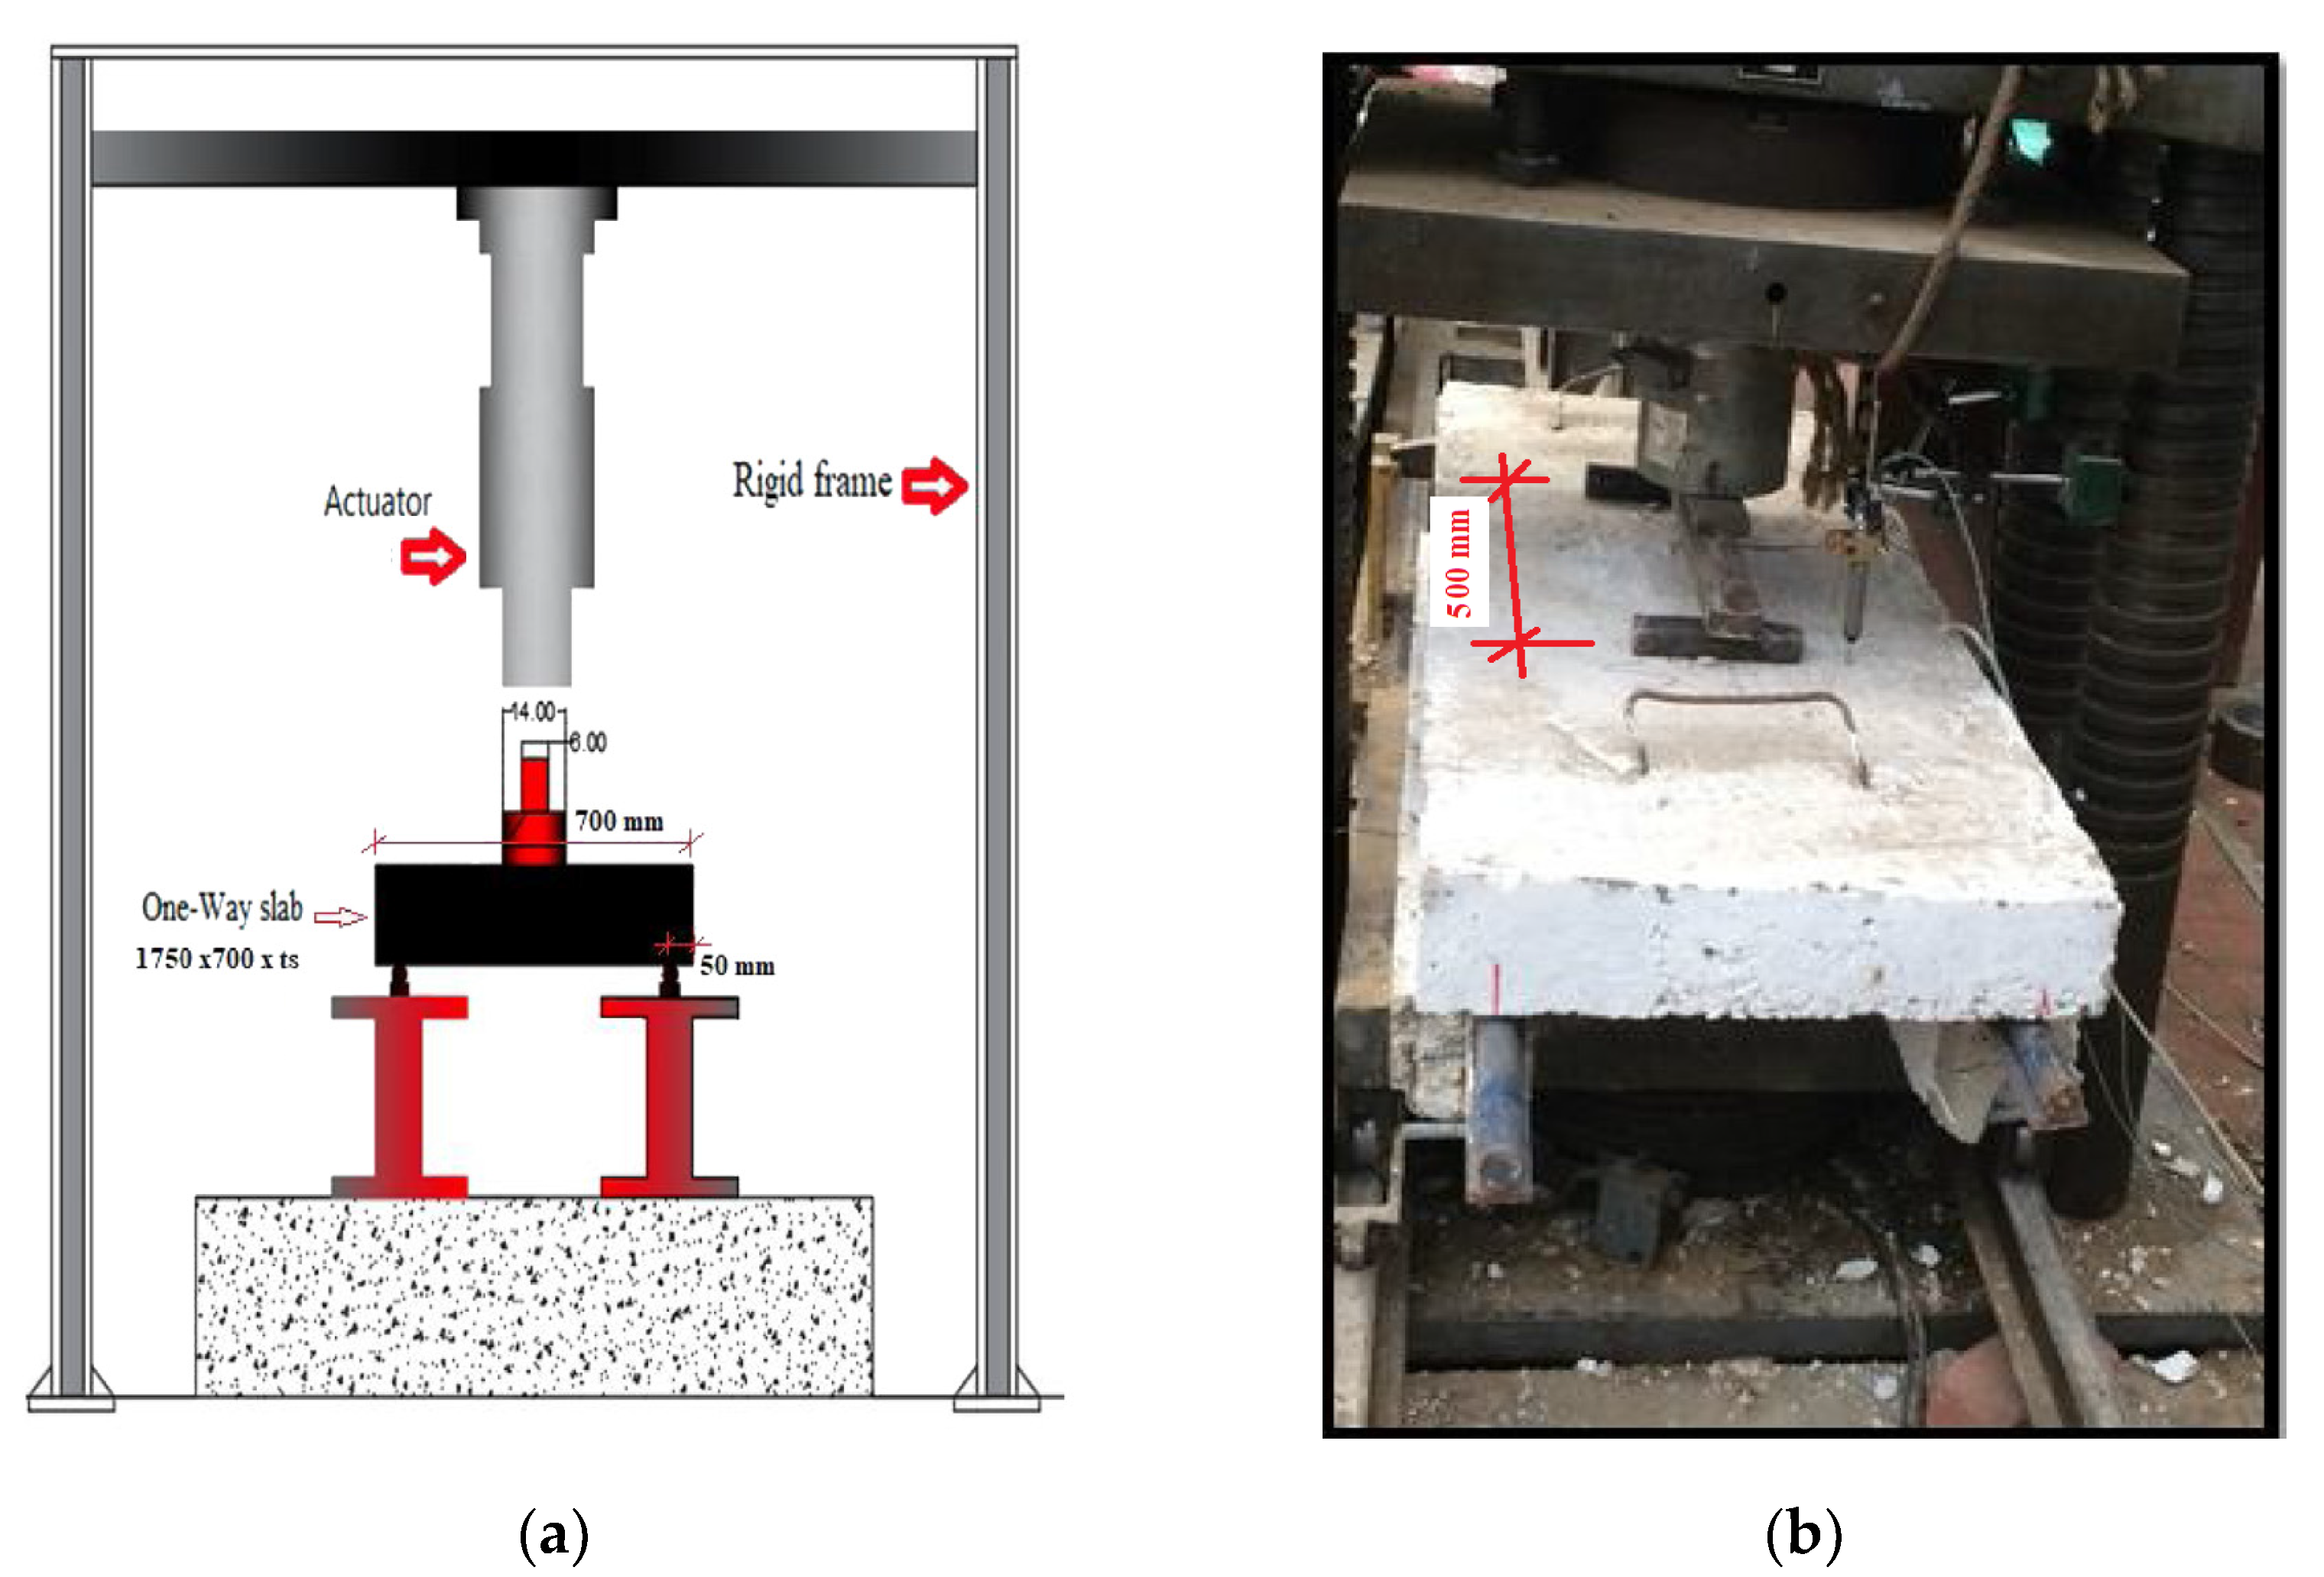
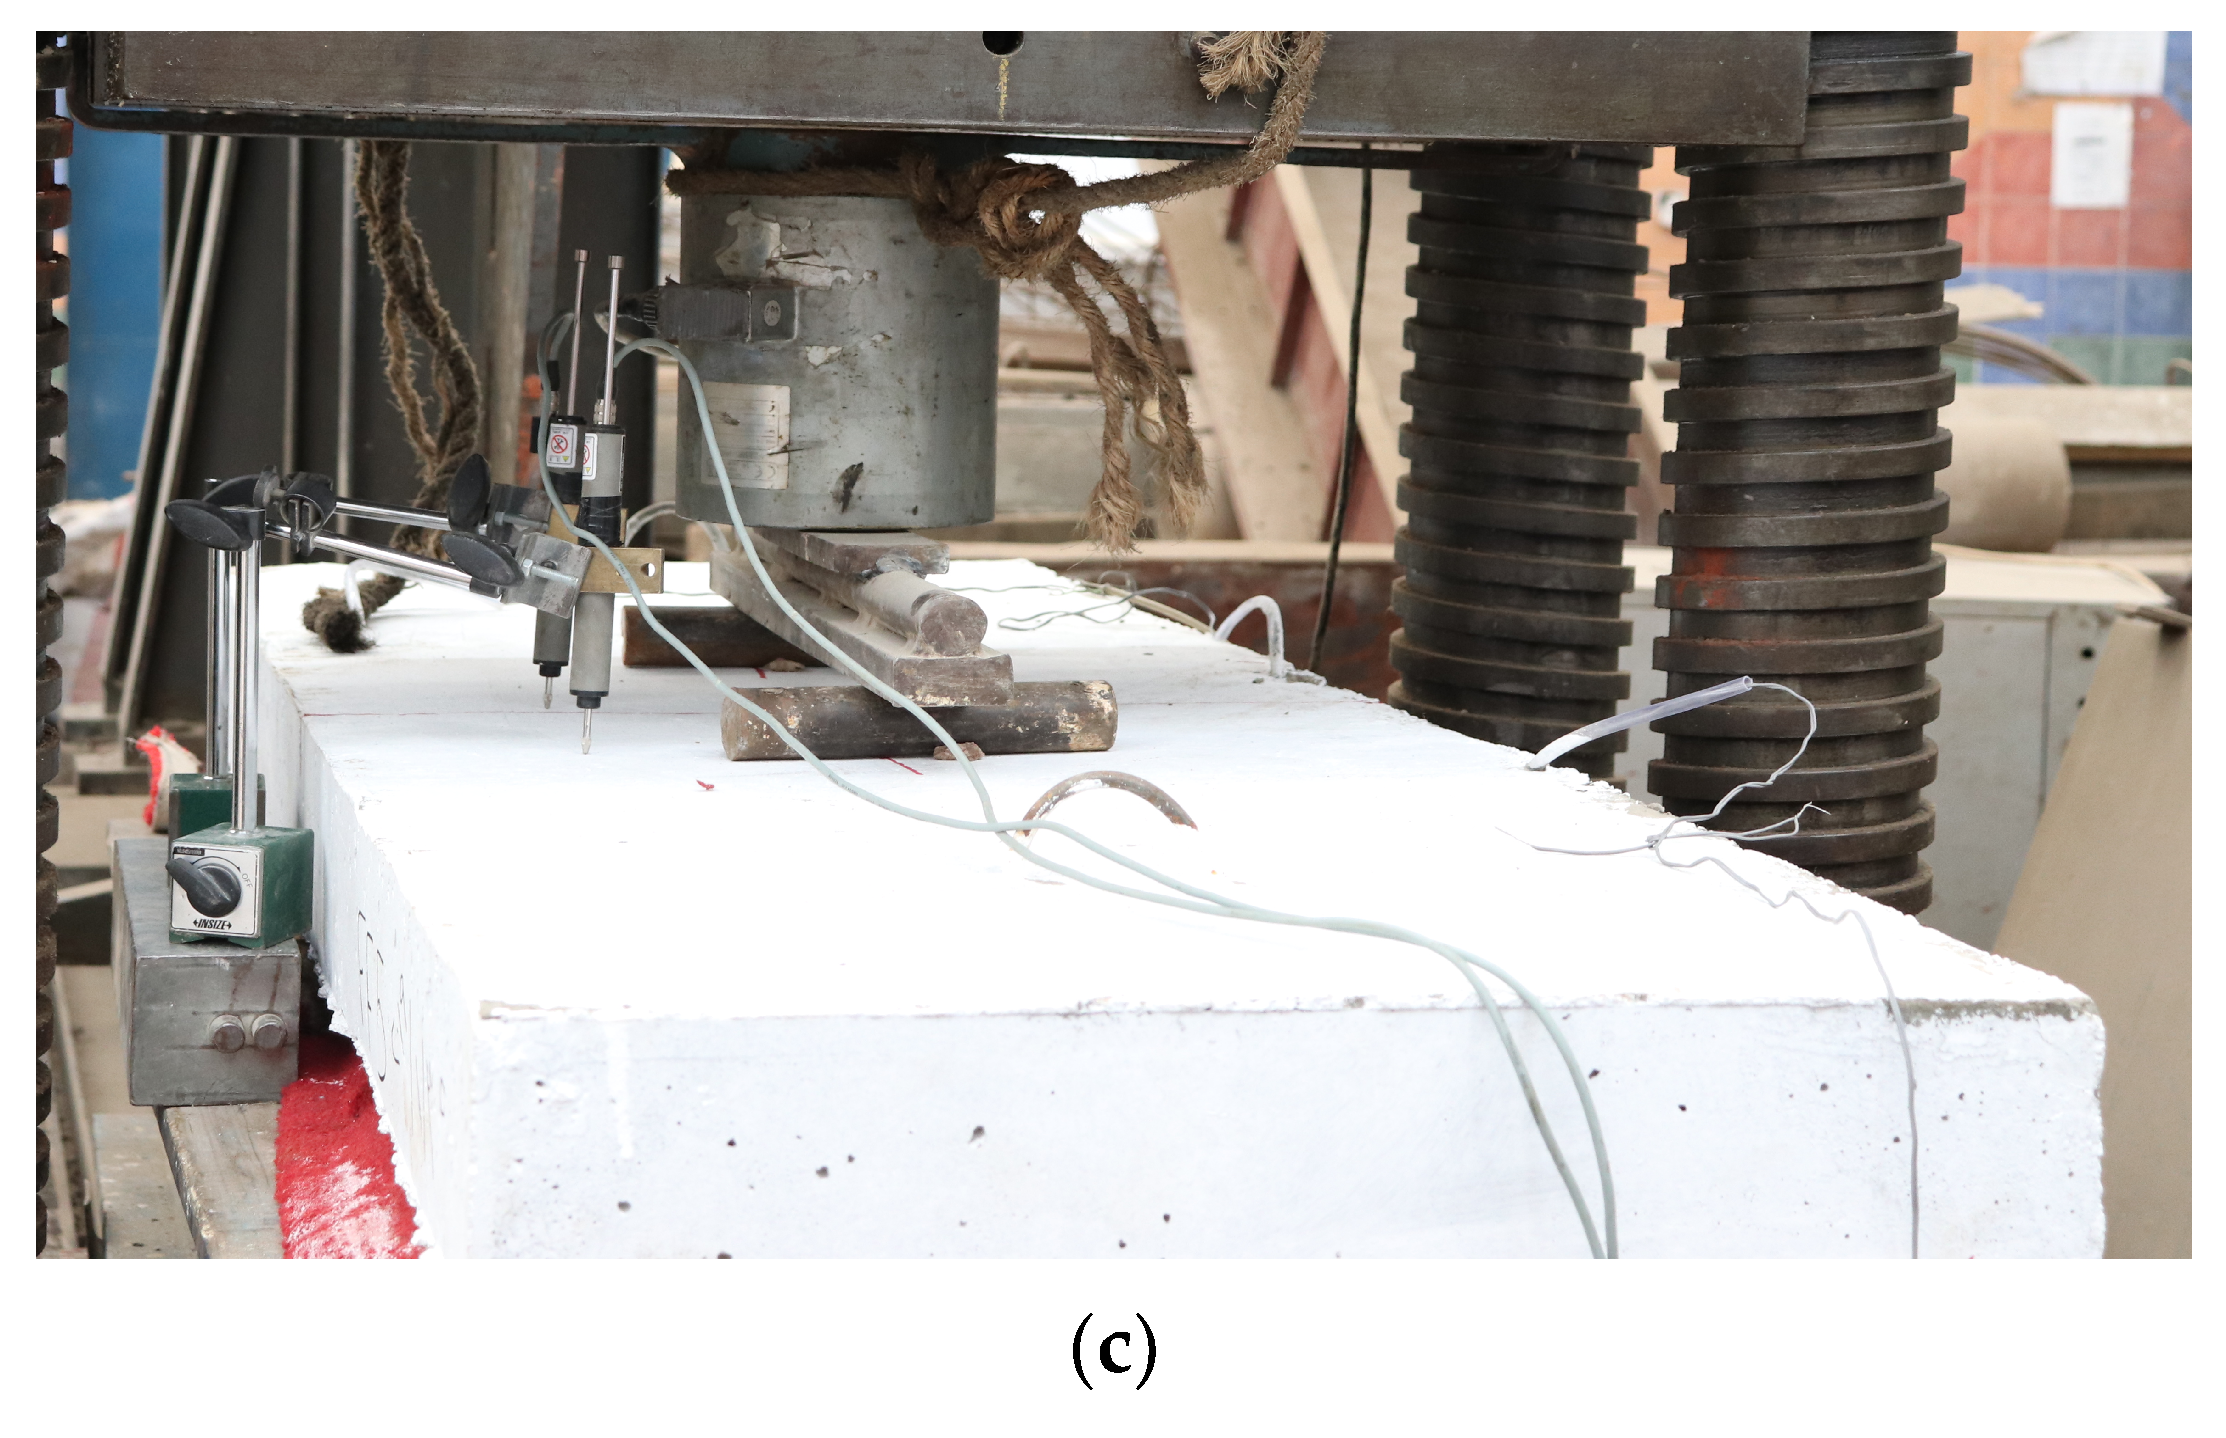
Eleven HSC slabs were examined under two-point load with a 500 mm load distance, as in Figure 5. The test was performed in the National Building Research Center under a universal testing machine with a maximum capacity of 5000 KN. Outputs were recorded using LVDTs and strain gauges.
3. Experimental Results and Discussion
The results obtained from the experimental test were given in terms of ultimate load, ultimate deflection, load–deflection curves, crack pattern, and load strains for concrete and reinforcement rebars as follows.
3.1. Ultimate Load
Table 5 shows the ultimate load for all slabs. The ultimate load for the control group (SP1 and SP2) was 148.00 kN and 139.00 kN, respectively. This is due to the decreased diameter of bars and increased bonding between the concrete and steel bars, which agrees with the results recorded by Janus et al. [33].
For Group I (SP3, SP4, and SP5), Slab SP3 recorded the lowest ultimate load of 87.85 kN, which was also lower than the control slabs by a decreasing ratio of 39.0%. This is due to the small reinforcement ratio, which led to rupture of GFRP bars. However, for SP4 and SP5, the ultimate loads were 149.30 kN and 154.40 kN, respectively.
For Group II (SP6, SP7, and SP8), Slab SP6 recorded the highest ultimate load of 180.70 kN, which was higher than Slabs SP7 and SP8, in which the ultimate loads were 149.30 kN and 154.40 kN, respectively. It was recorded that a smaller diameter indicated high performance with concrete slabs as in SP6, which recorded an ultimate load of 180.70 kN, higher than that obtained from Slabs SP7 and SP8, which recorded 149.30 kN and 129.3 kN, respectively.
Slabs (SP9, SP10, and SP11) of Group III recorded a higher ultimate load compared to the second group “Group II” because of increased concrete thickness. The ultimate loads were 313.75 kN, 256.02 kN, and 212.10 kN for SP9, SP10, and SP11, respectively.
Slab SP9 recorded an enhanced ultimate load with respect to all other slabs due to the concrete thickness and the small diameter Φ 8 of the GFRP reinforcement.
3.2. Ultimate Deflection
Table 5 shows the ultimate deflection for all slabs. For the control group, the ultimate deflation recorded was 6.75 mm and 4.89 mm for SP1 and SP2, respectively. This shows the effect of increasing the reinforcement ratio in decreasing deflection.
For Group I, Slab SP5 recorded the lowest deflection value of 3.72 mm compared to SP3 and SP4 and control slabs. The slabs SP3 and SP4 recorded a deflection of 2.47 mm and 4.91 mm, respectively.
For Group II, Slab SP6 recorded a higher deflection of 7.91 mm with an ultimate load-carrying capacity of 180.70 kN compared to Slabs SP7 and SP8, which recorded lower deflection values of 4.91 mm and 4.79 mm and an ultimate load of 149.30 kN and 129.30 kN, respectively, which agrees with Achillides and Pilakoutas [34].
For Group III, Slab SP9 recorded the highest deflection of 11.03 mm with the highest ultimate load-carrying capacity of 313.75 kN compared to slabs of all groups. This indicated that the GFRP bars enhanced the loading-carrying capacity, deflections. and ductility when using small diameters, which increased the bond between concrete and bars, as shown in Figure 6 through the load–deflection curves for all slabs.
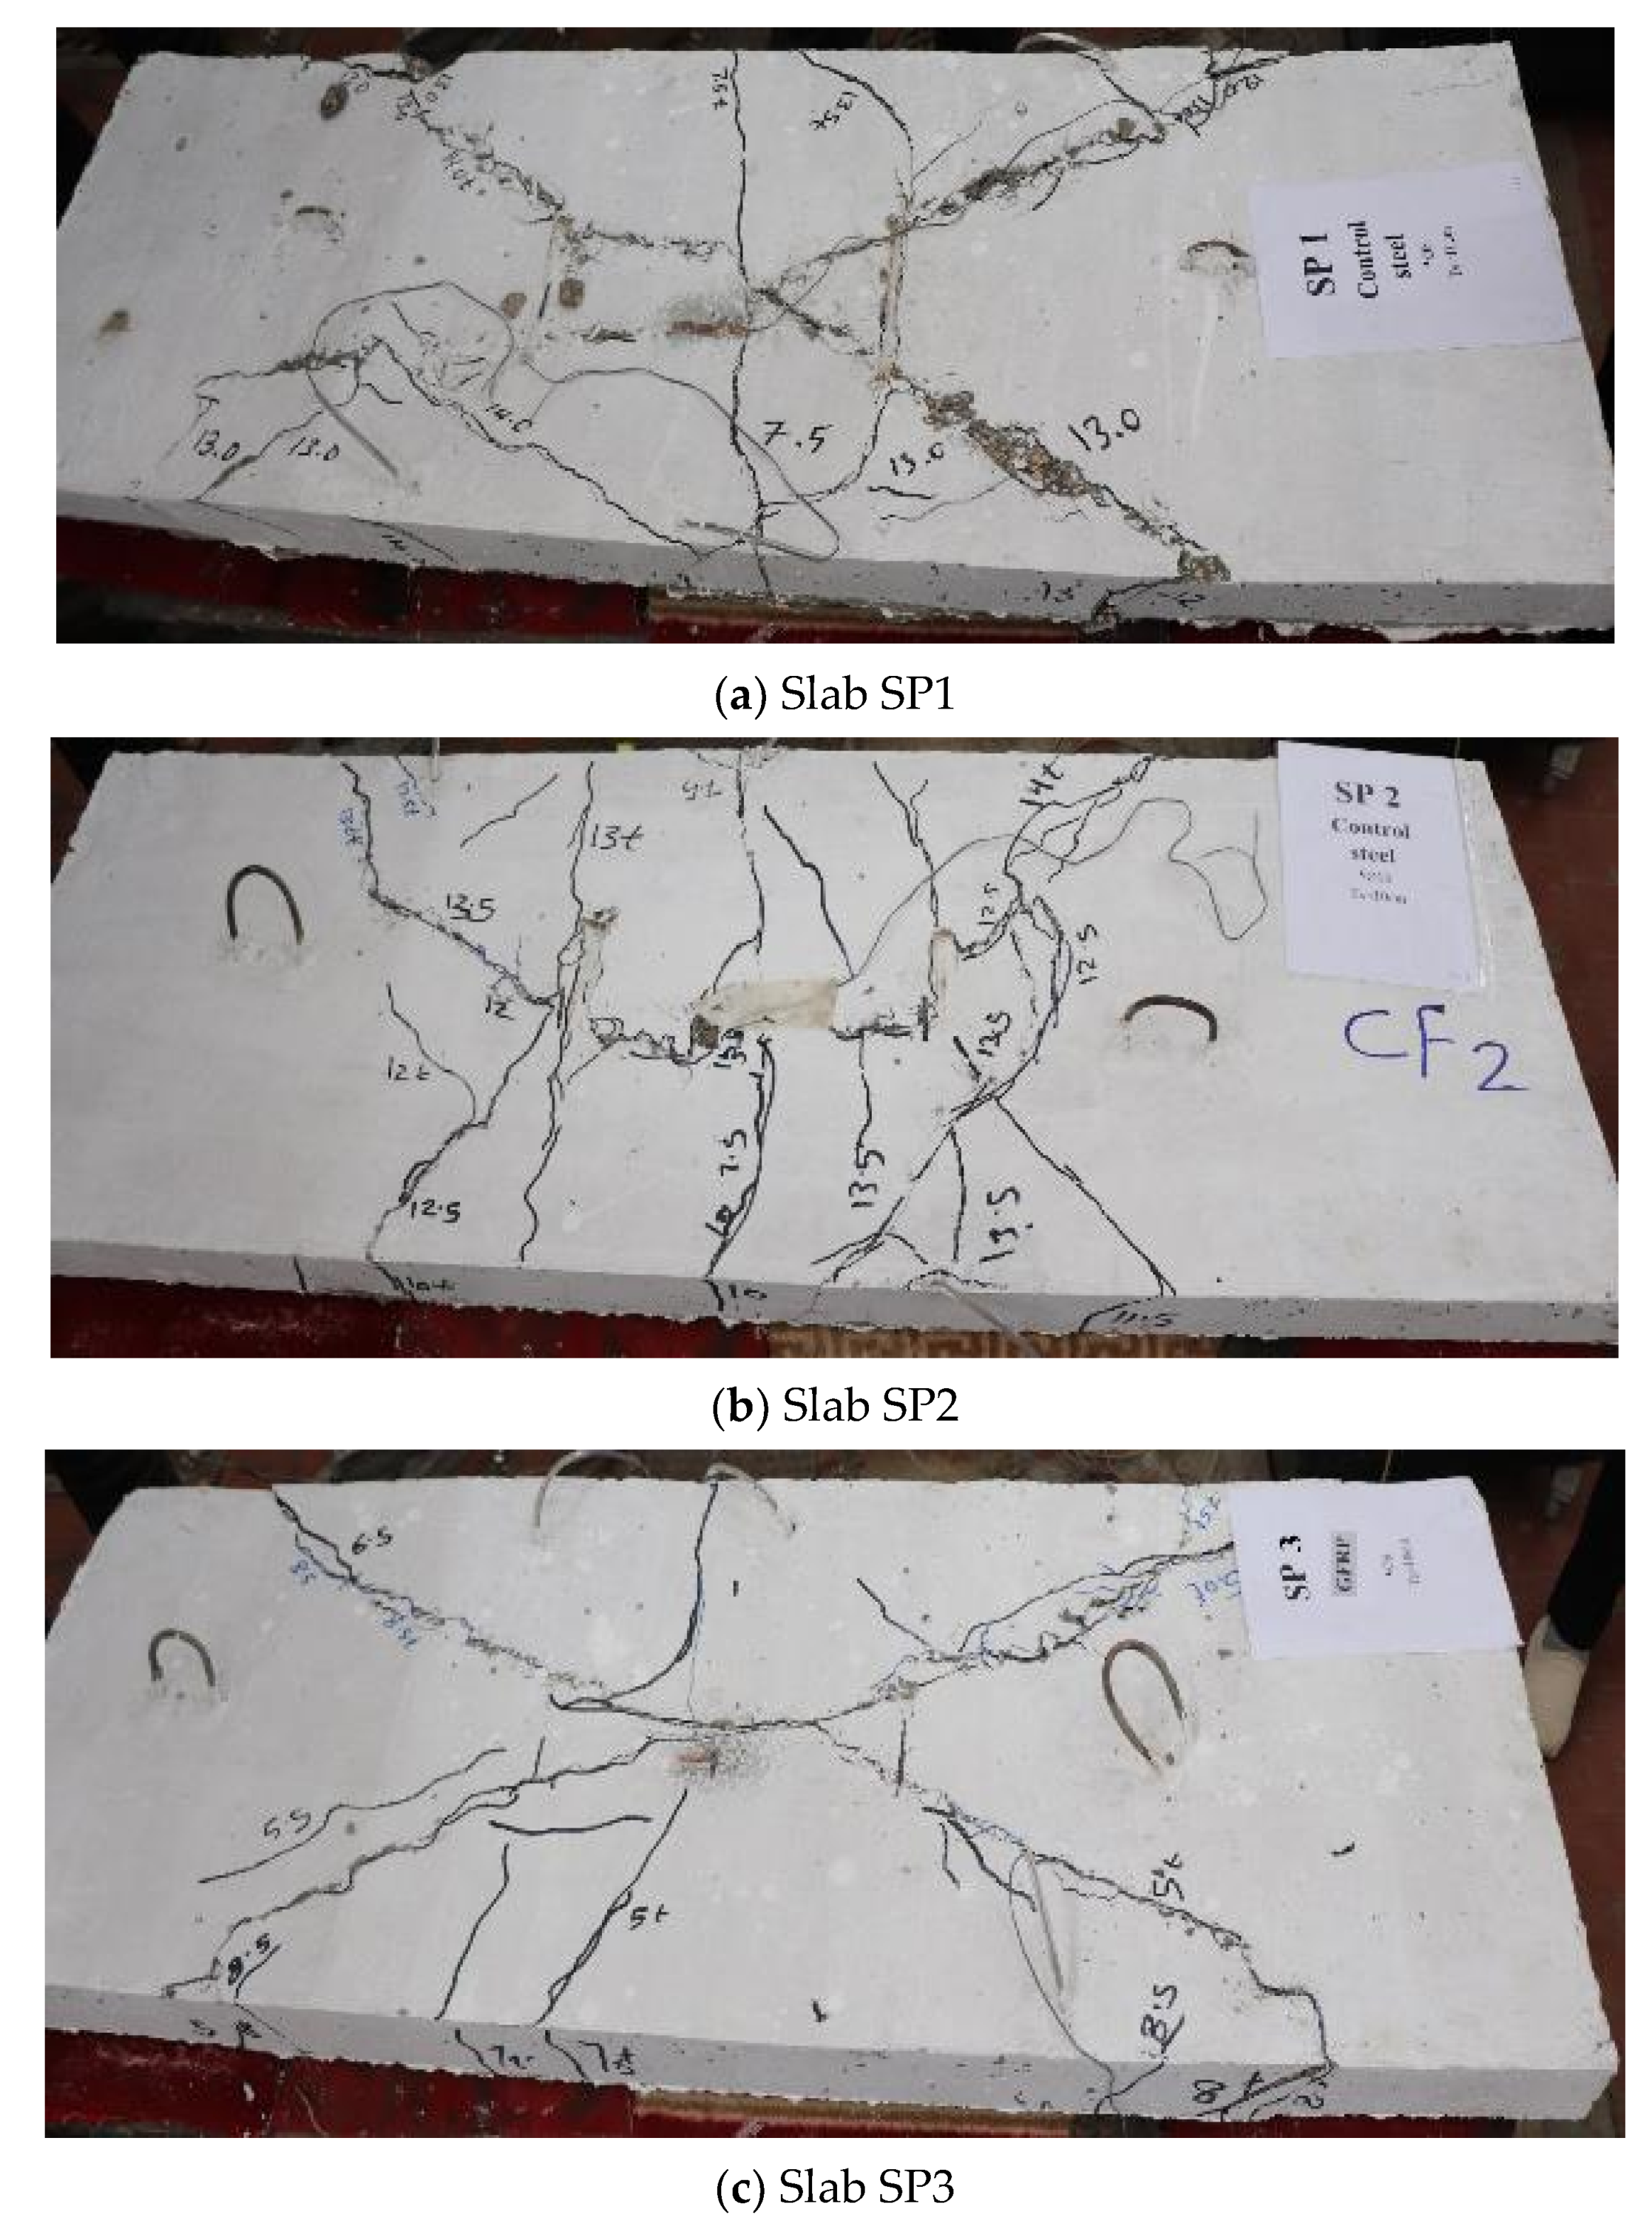
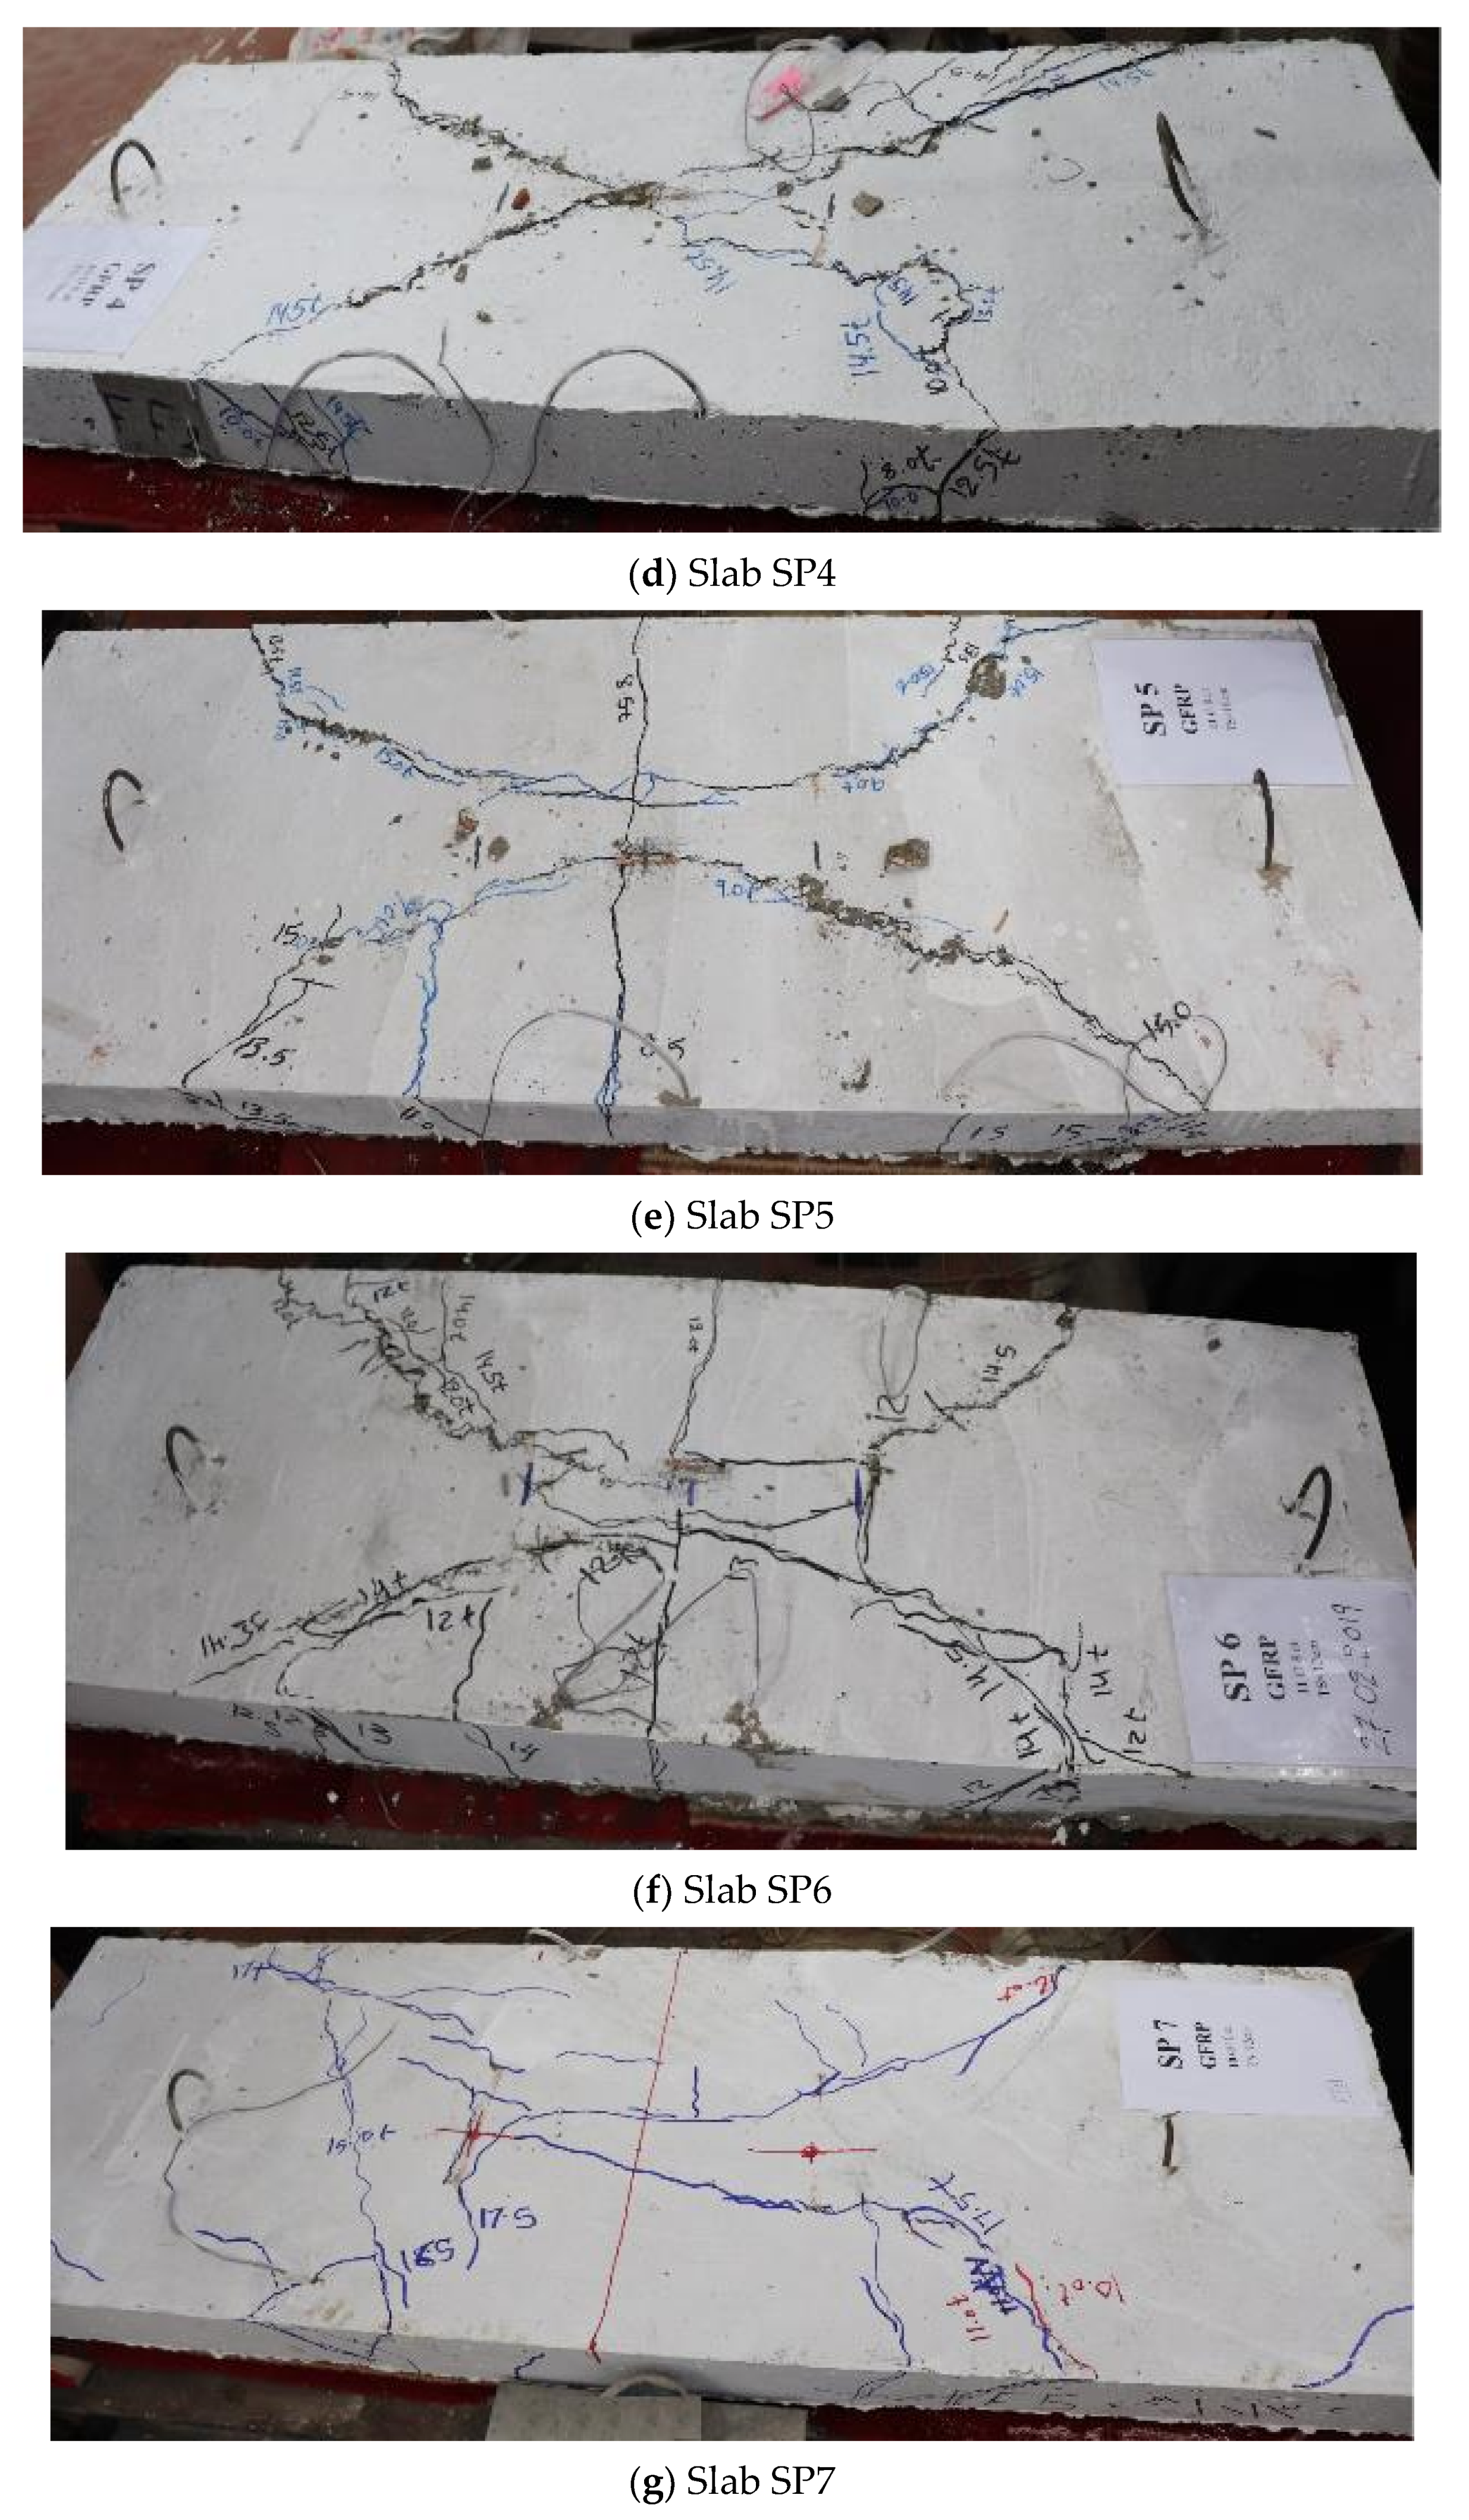
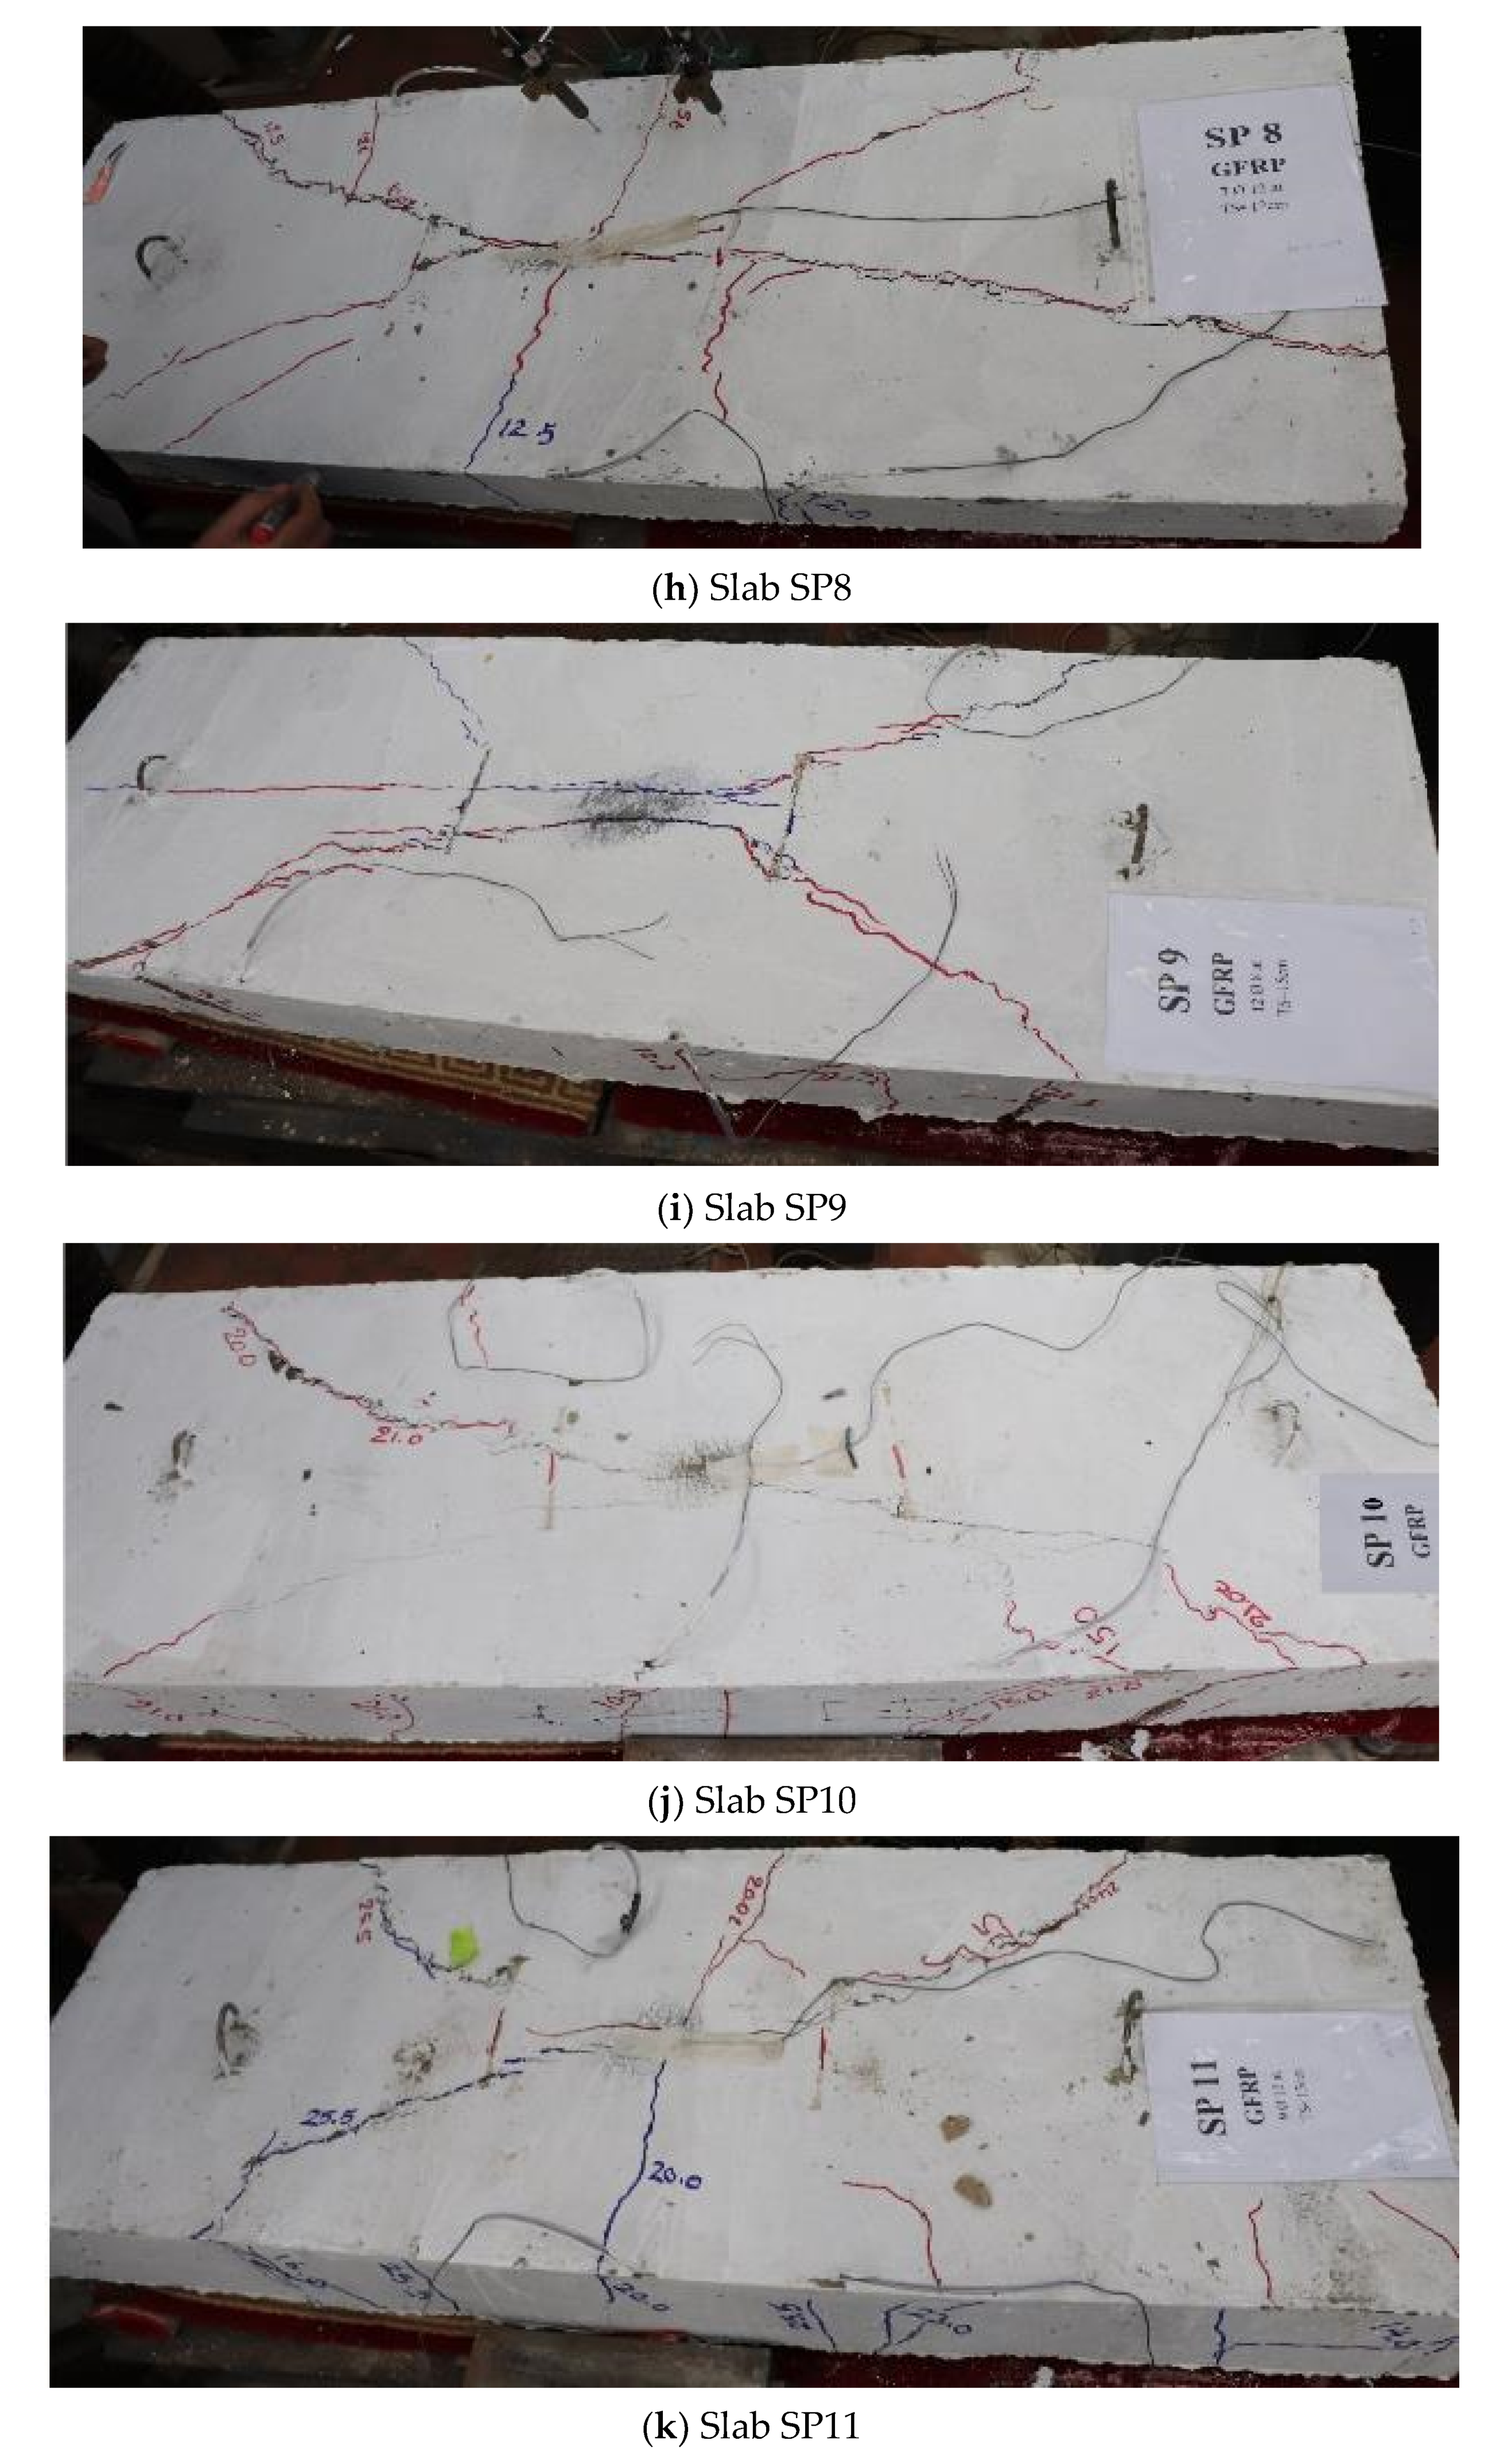
3.3. Crack Pattern and Mode of Failure
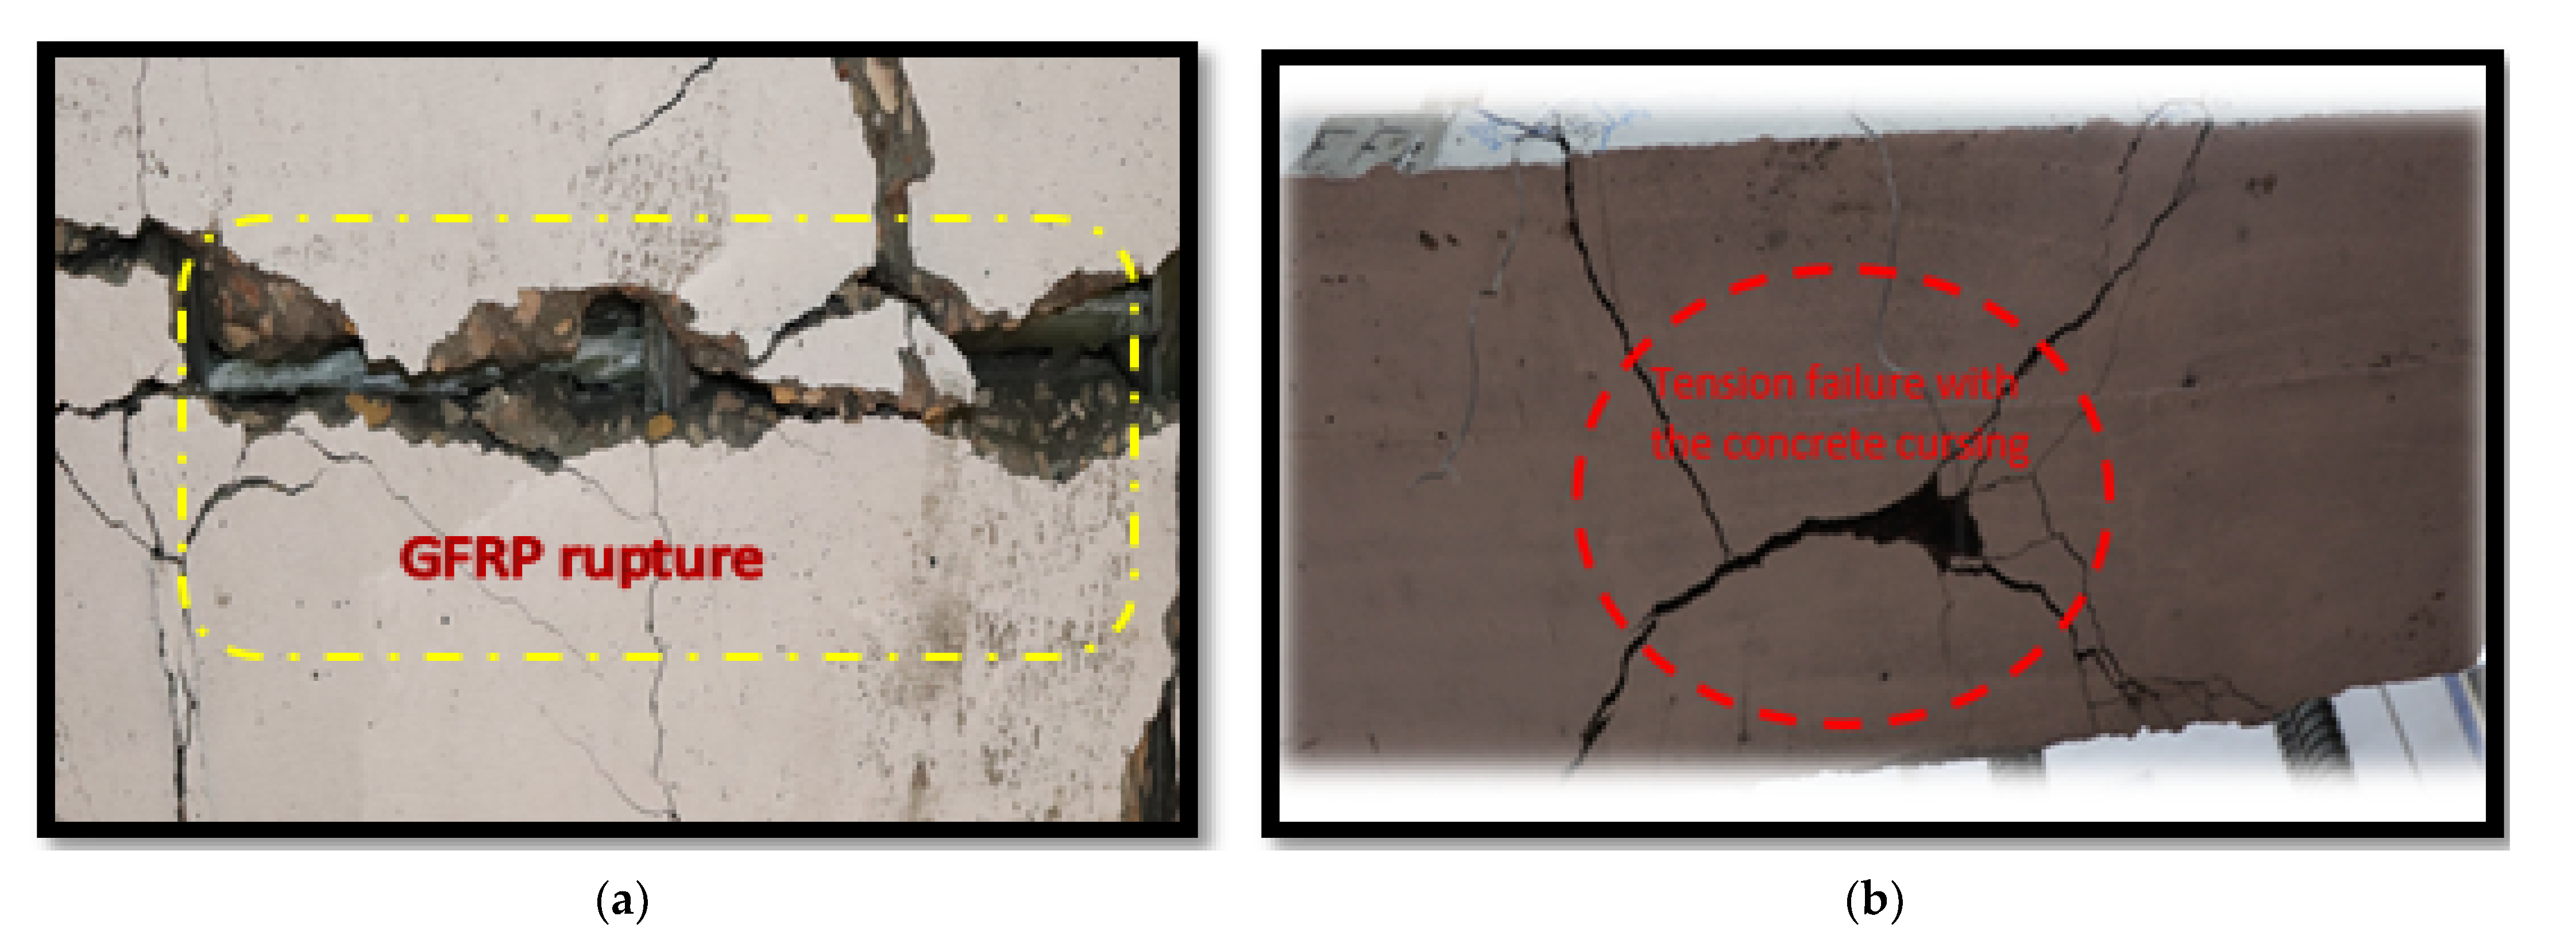
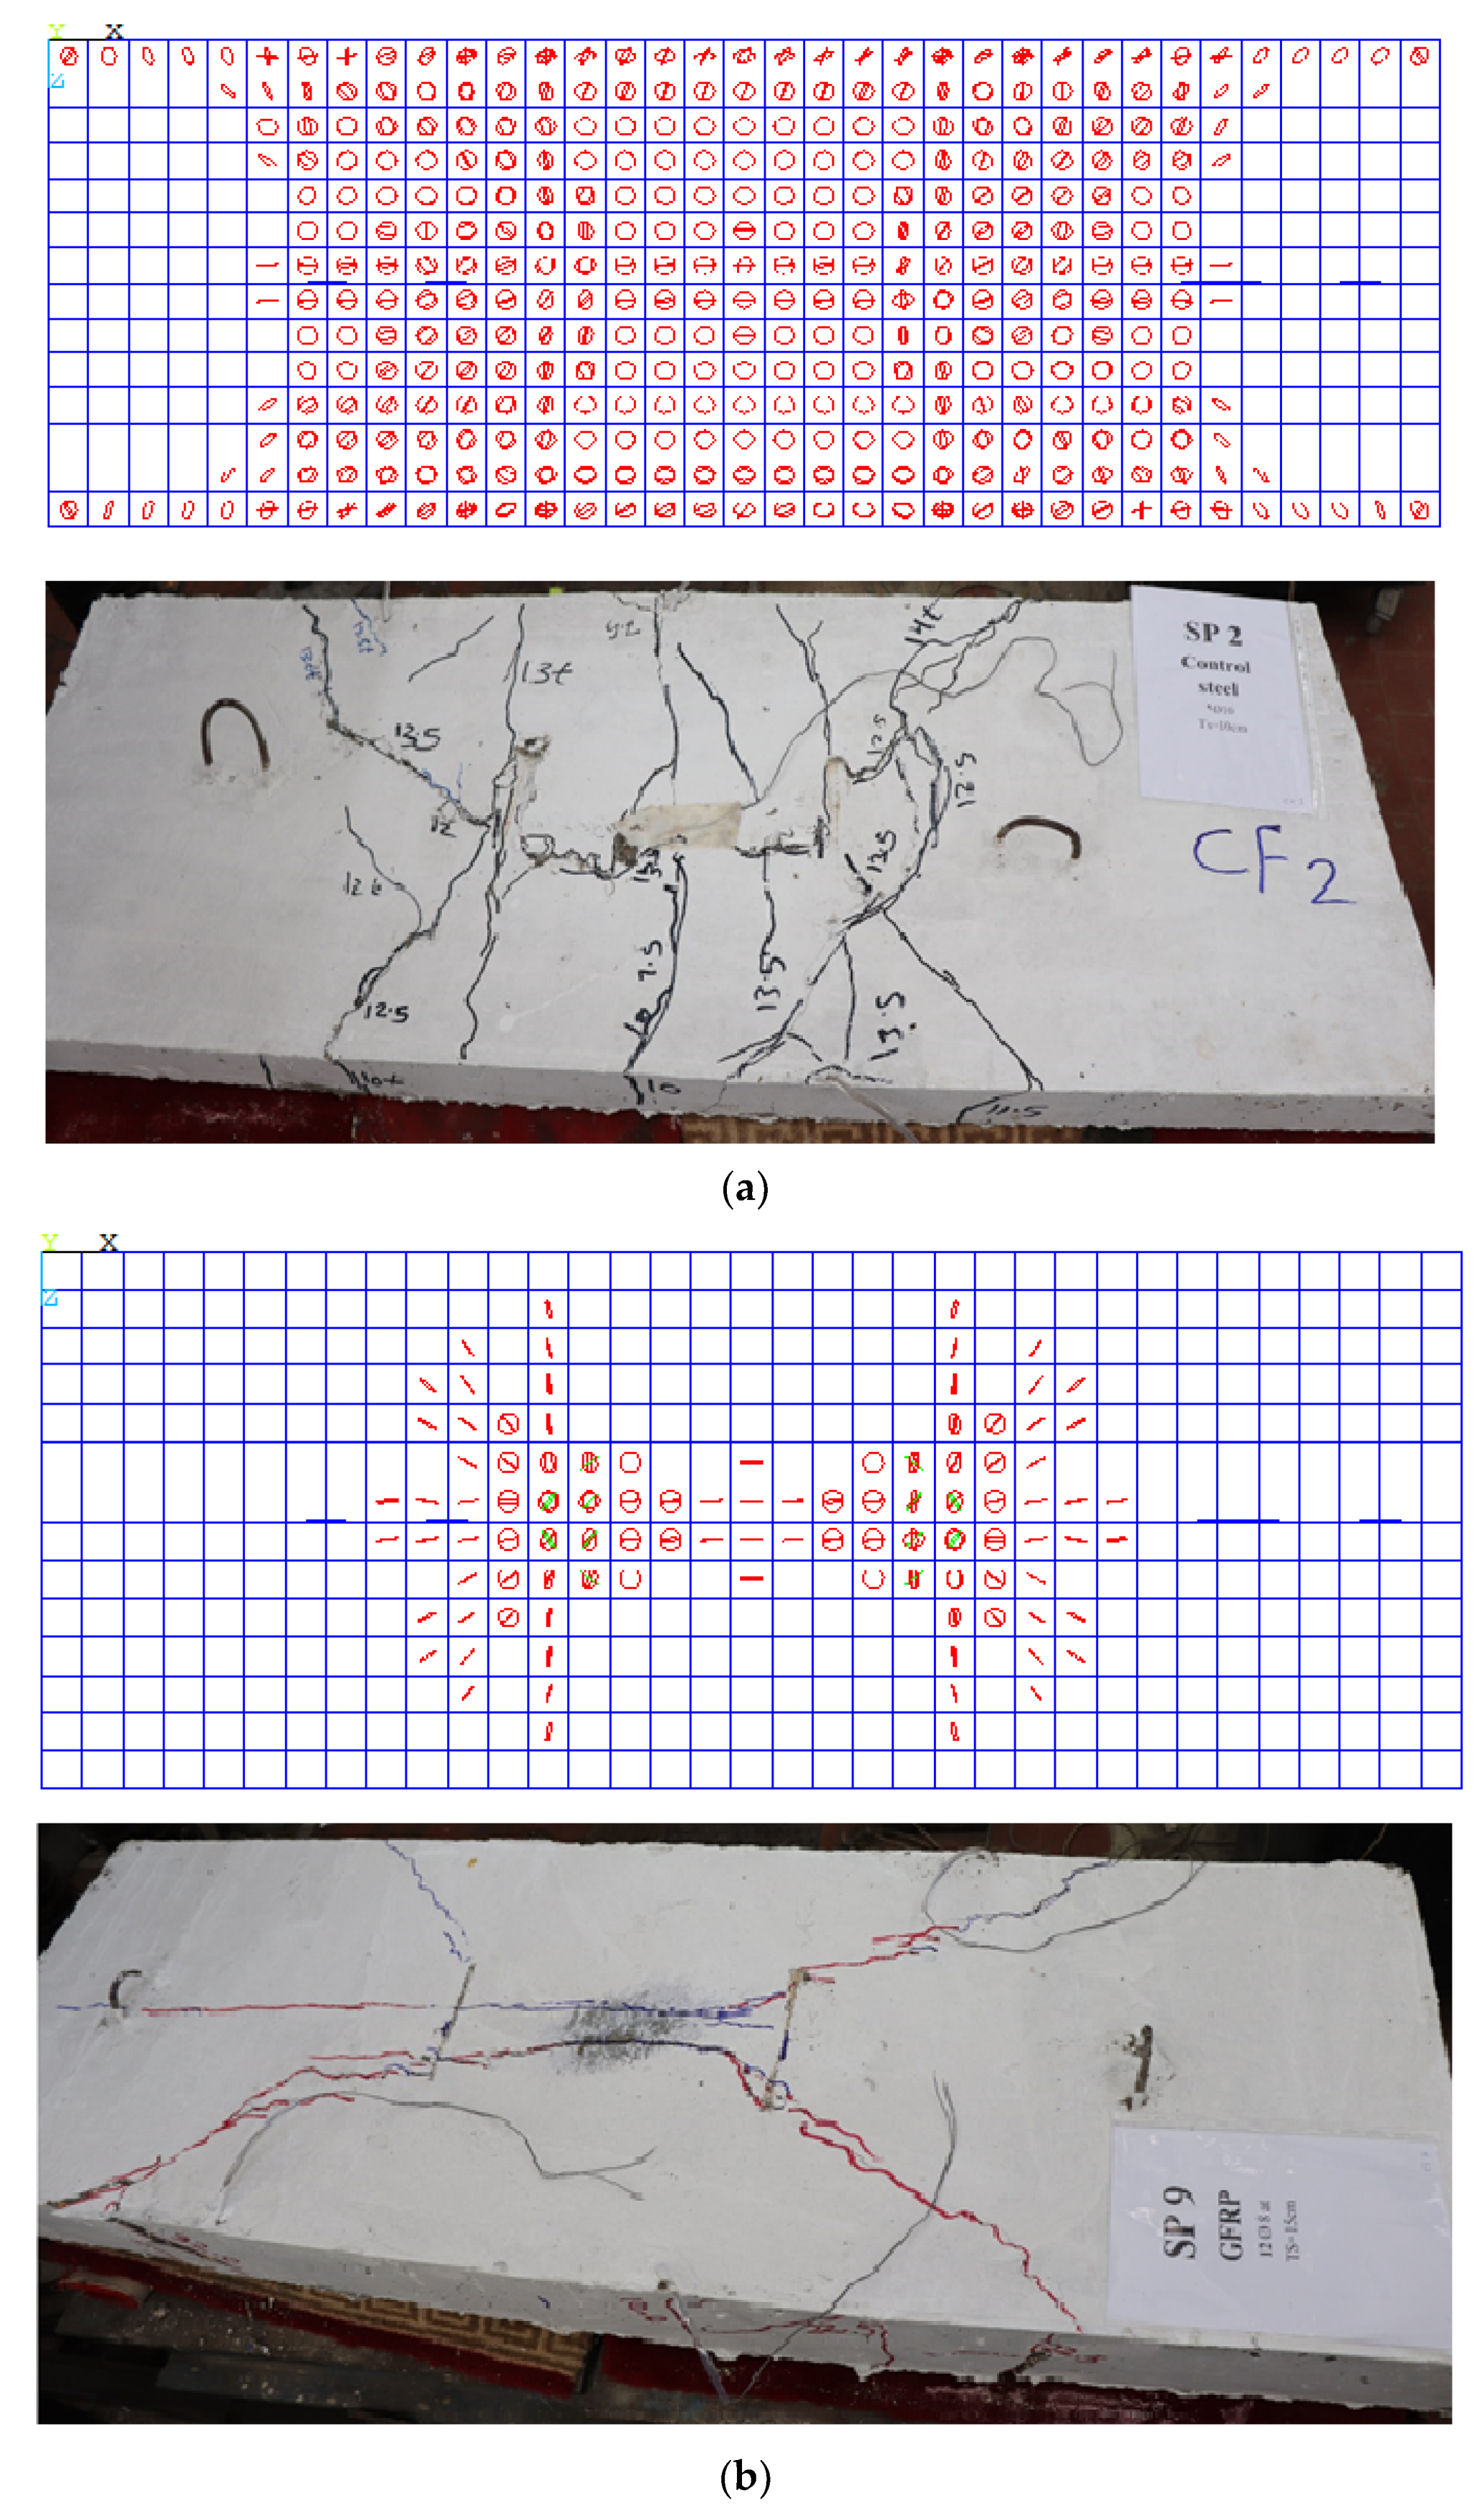
Figure 7 shows the crack propagation for all slabs. Additionally, Table 5 shows the mode of failure for all slabs. Crack pattern for the control slabs SP1 and SP2 was propagated in the tension zone, as shown in Figure 7a, and the mode of failure was tension failure (TF). The behavior of Slabs SP3, SP6, and SP9 was the same. Although the concrete capacity was still able to carry load, the GFRP bars could not, so rupture failure (RF) occurred in the GFRP bars. For Slabs SP4, SP7, and SP10, the concrete and bars failed, together with compression and rupture failure (CC and RF, respectively). However, for Slabs SP5, SP8, and SP11, a decrease in crack number and propagation was noticed, as shown in Figure 8, and the mode of failure occurred as tension cracks and GFRP rupture failure.
4. Nonlinear Finite Element Analysis (NLFEA)
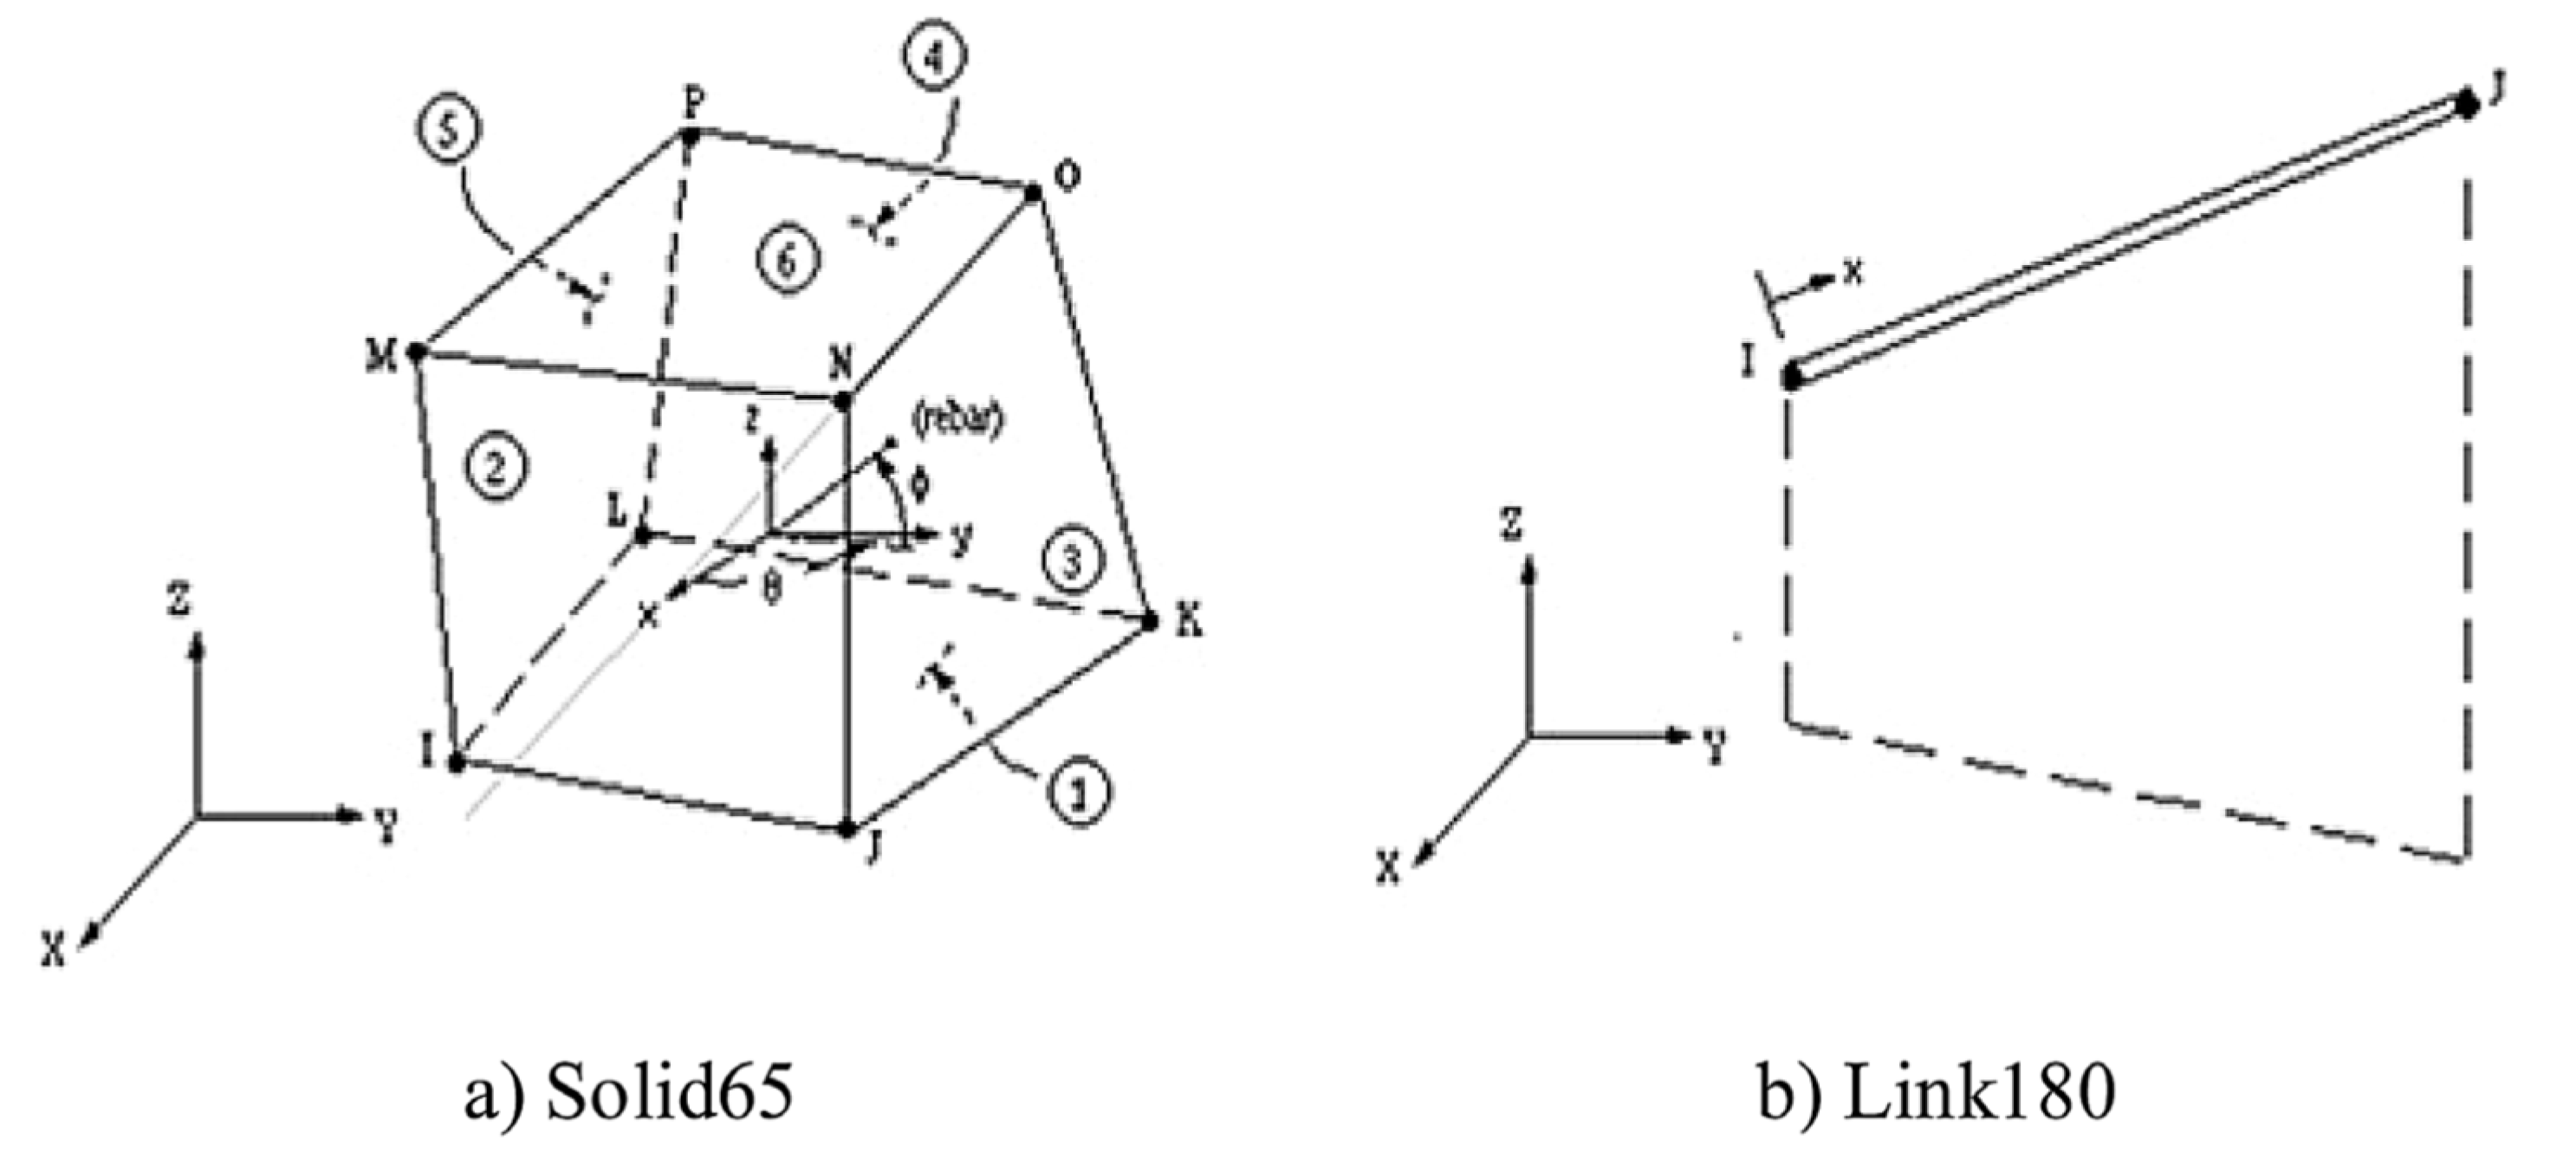
A finite element model was created to validate the experimental study using the ANSYS 2019-R1 [35] program. The Solid-65 element was employed for the representation of concrete, and the LINK-180 element was employed for steel and GFRP bar representation. Figure 9 indicates the Solid-65 and LINK-180 elements’ geometry.
4.1. Modeling
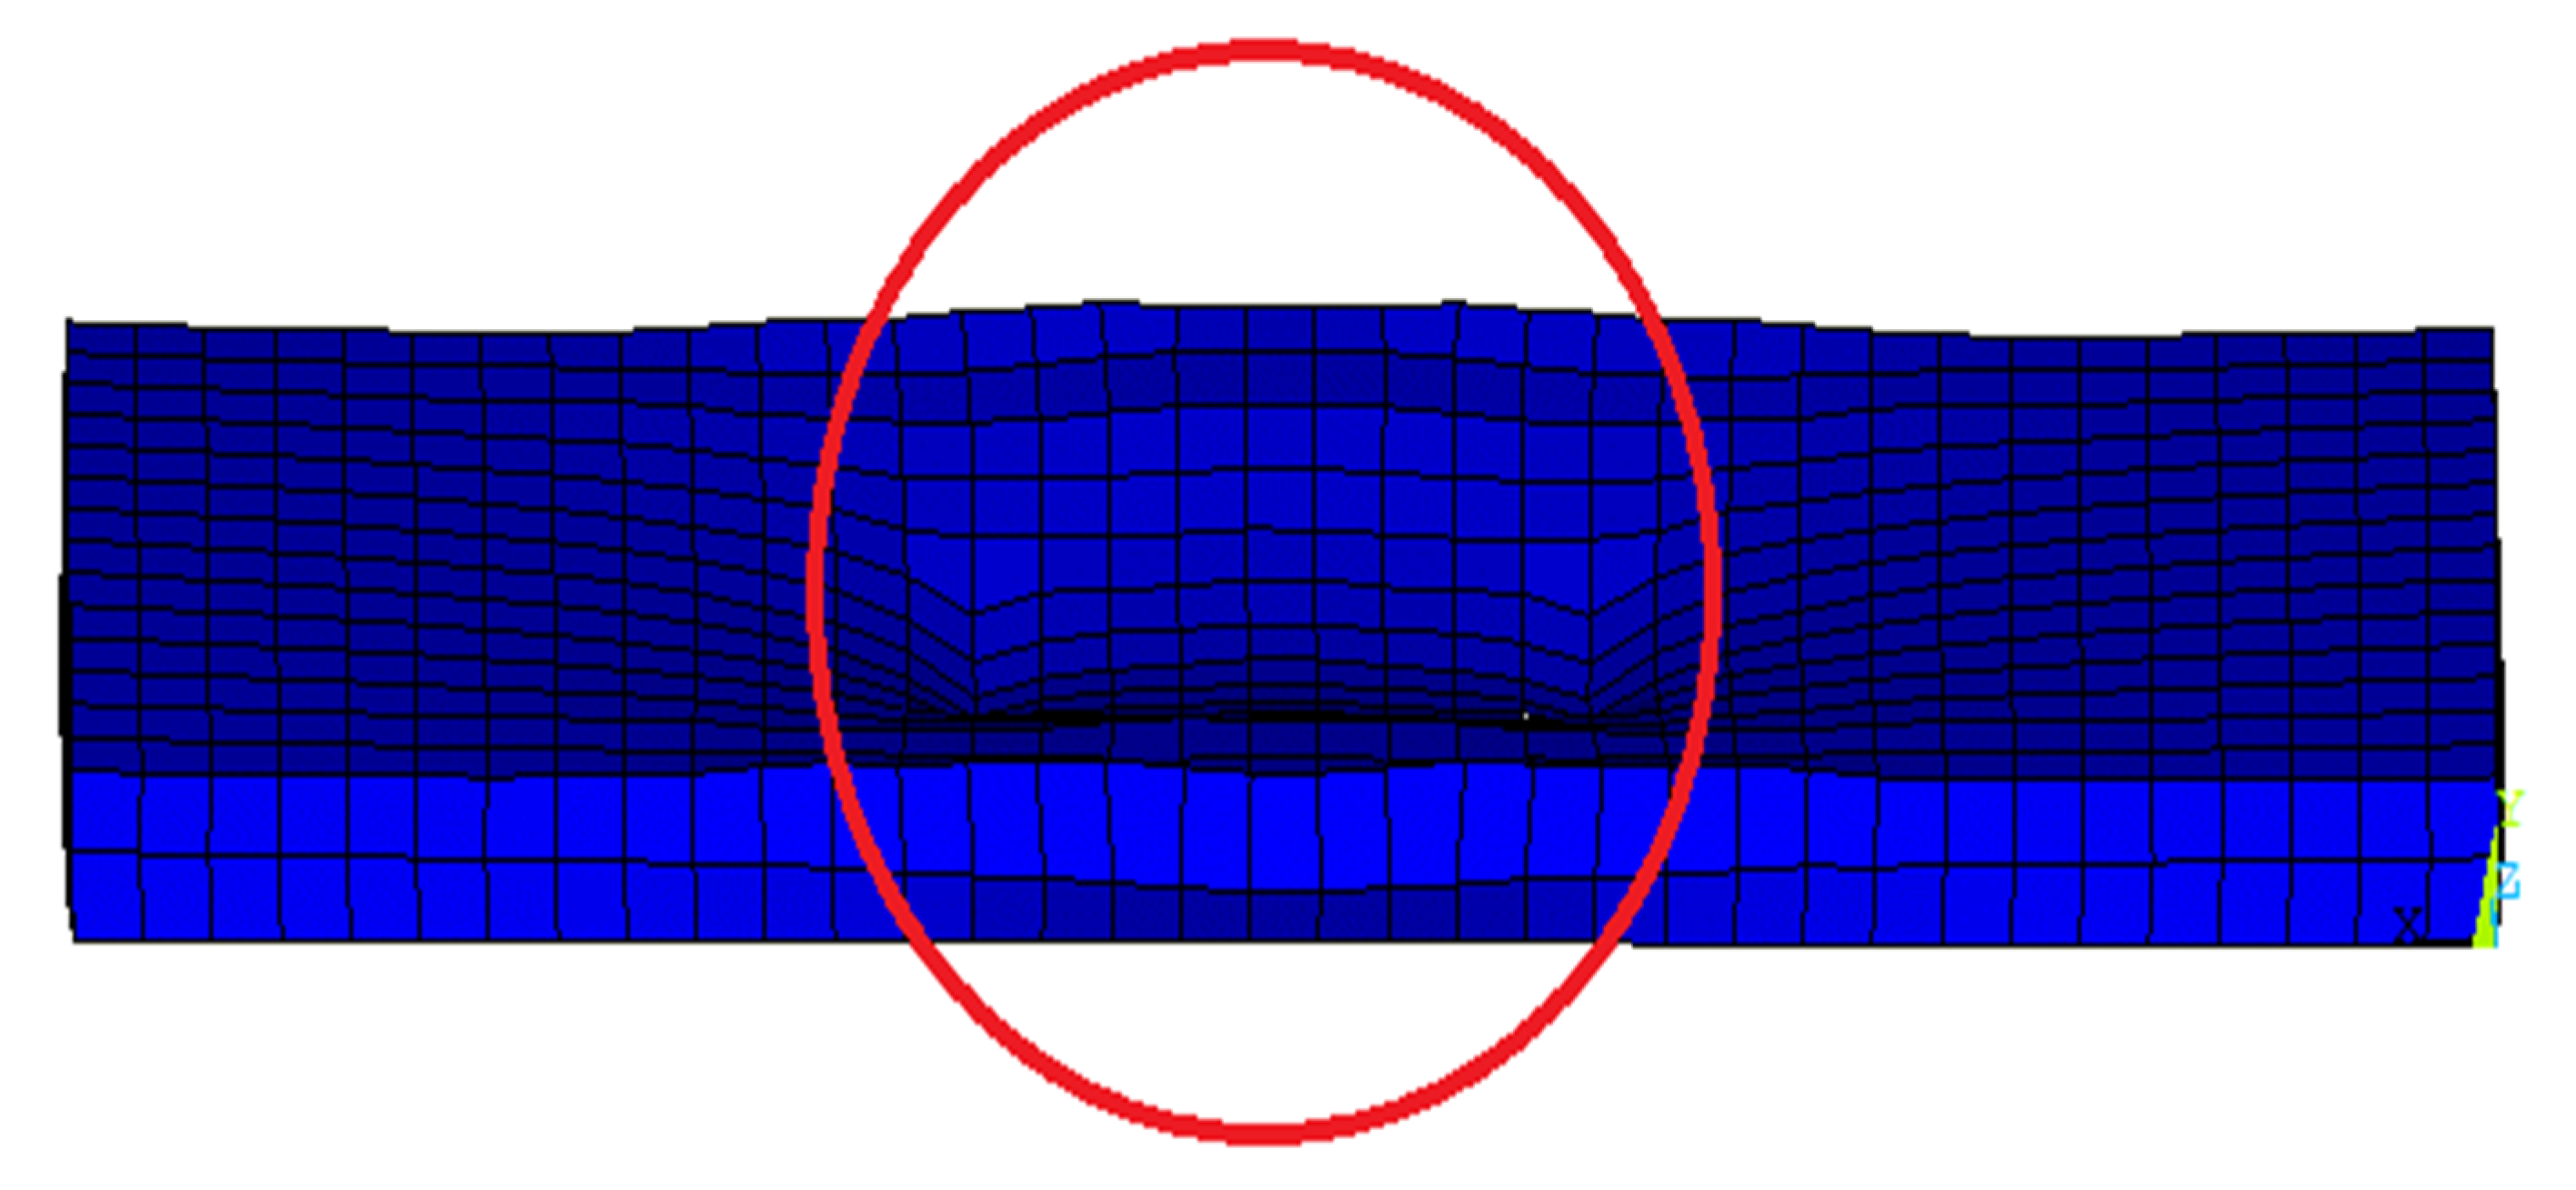
The NLFE model was used to investigate the structural performance of HSC slabs reinforced with GFRP bars using ANSYS2019-R1 software, as indicated in Figure 10. in terms of ultimate load, ultimate deflection, and crack pattern for the modeled slabs.
4.2. NLFE Ultimate Load
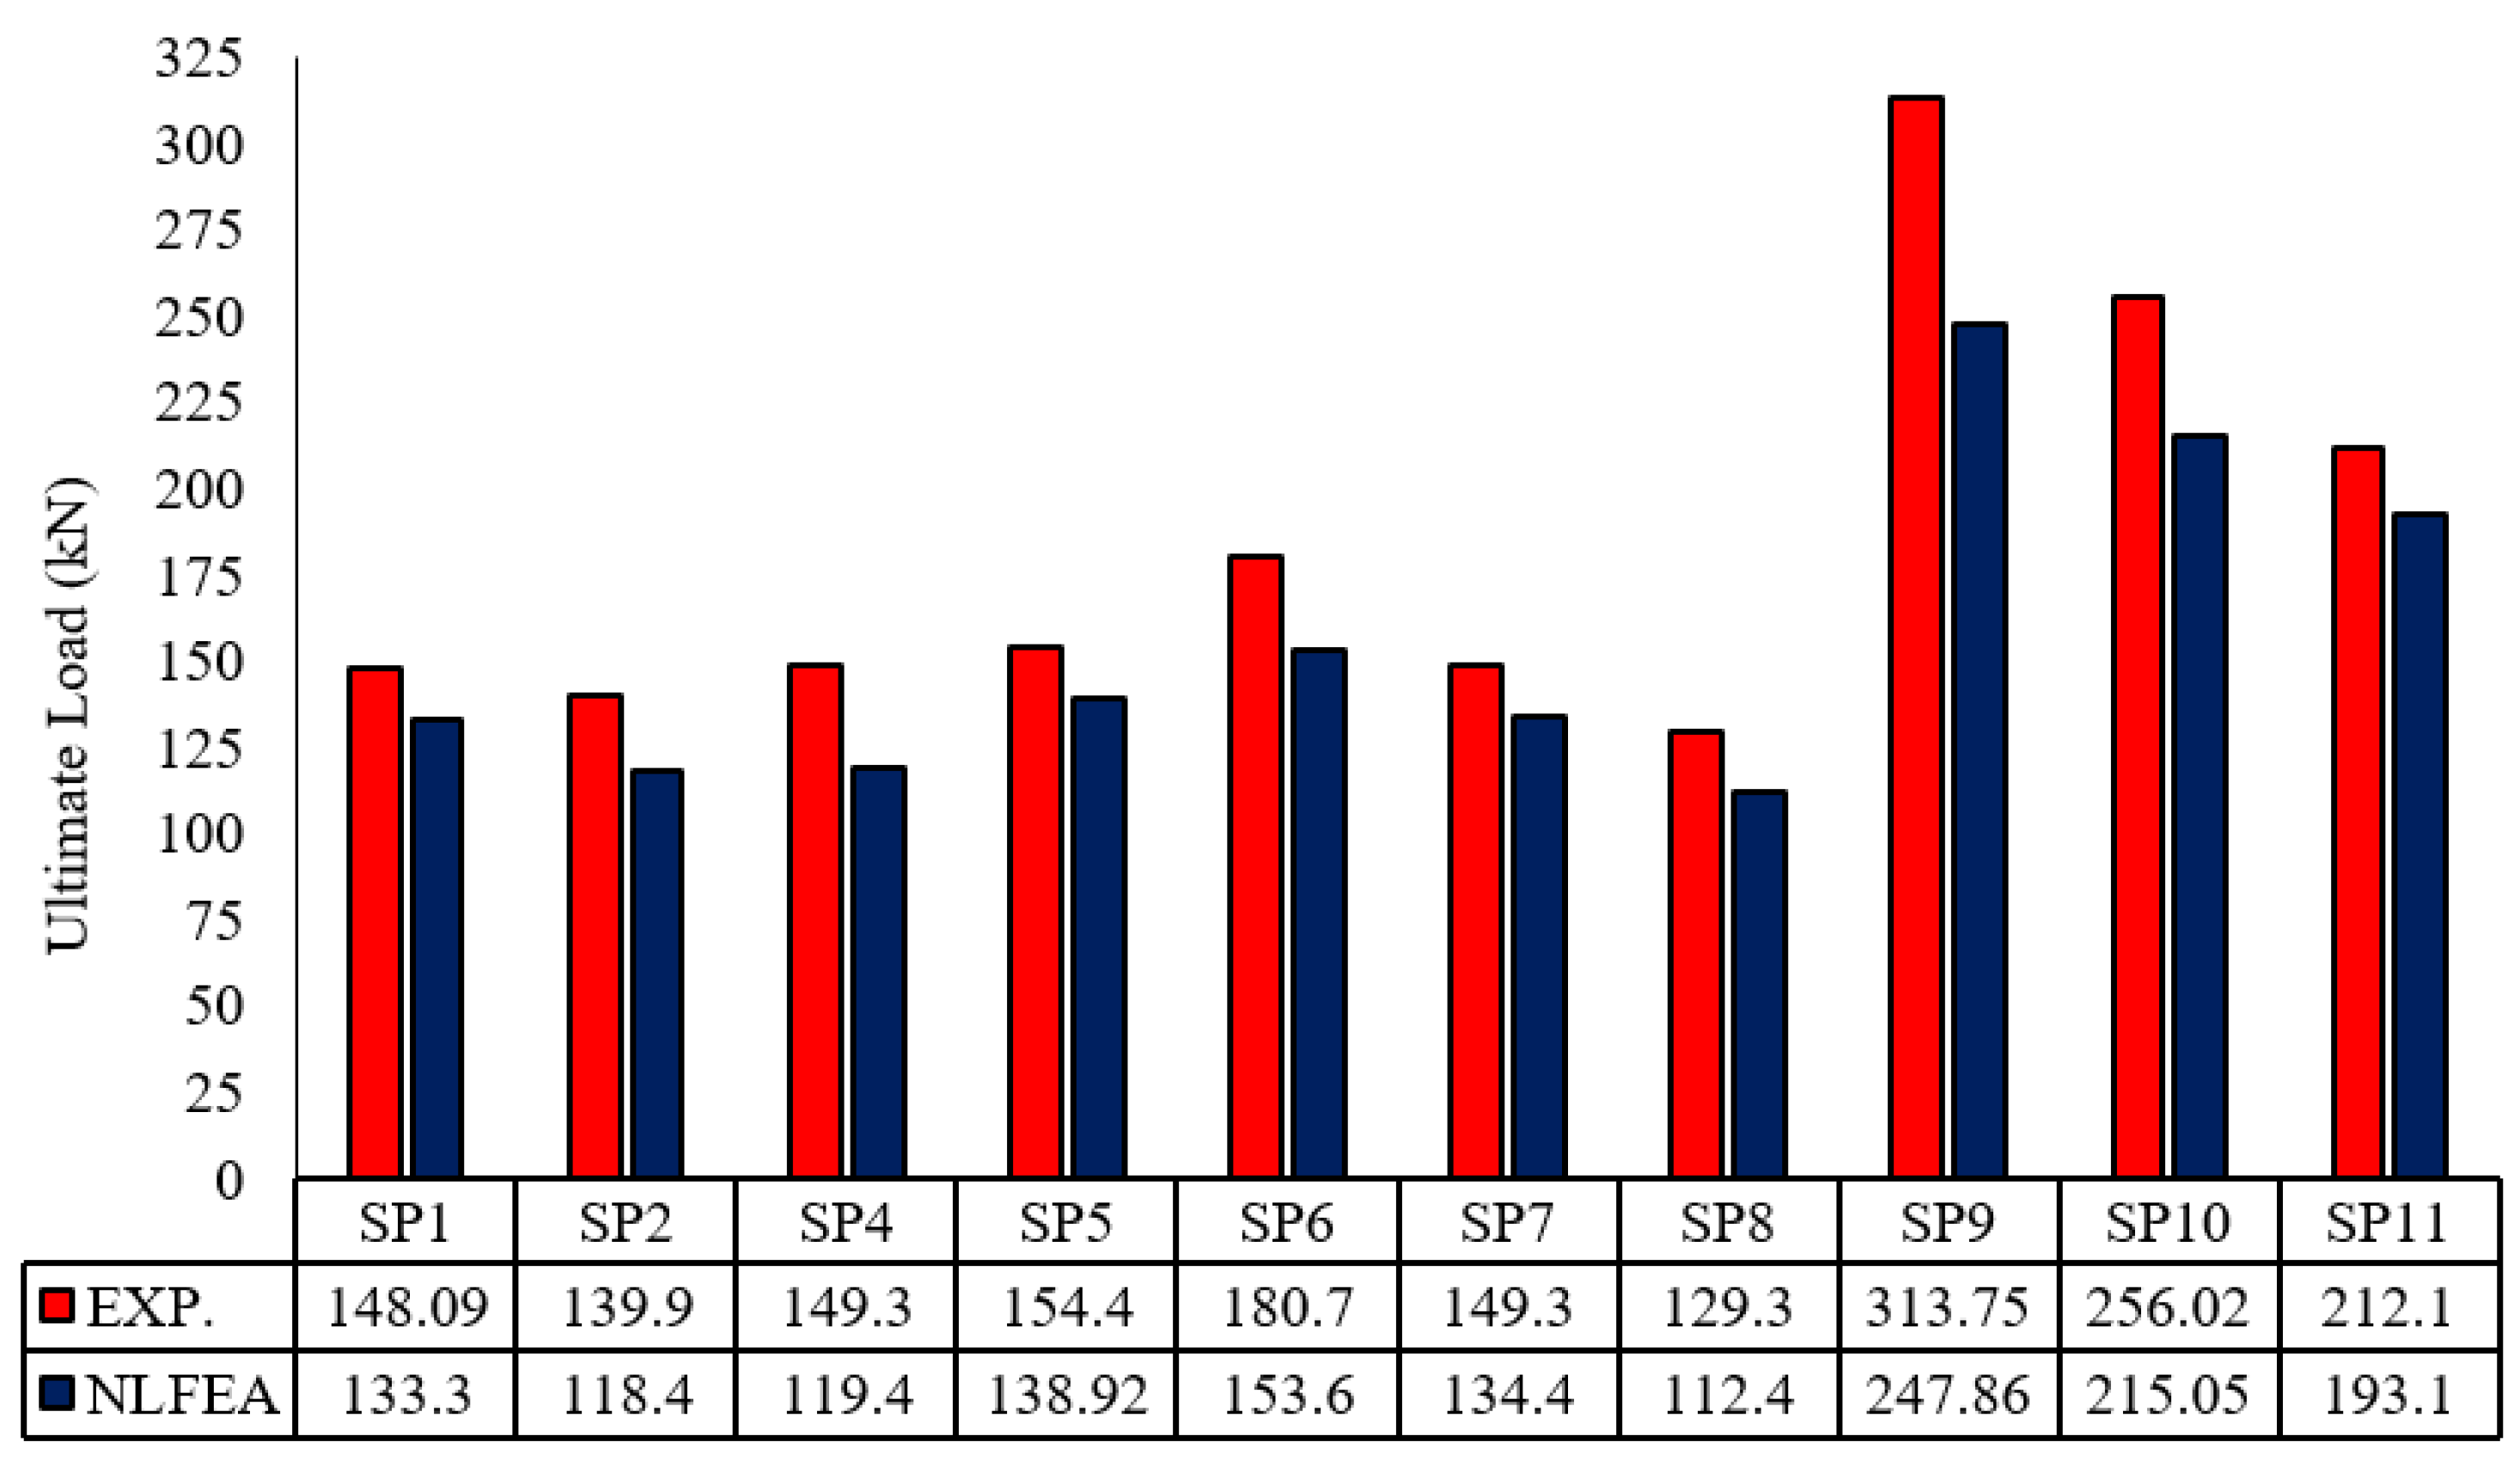
Table 6 shows the ultimate loads obtained from NLFEA. For the control slabs SP1 and SP2, the ultimate load was 133.30 kN and 118.40 kN, respectively. For Slabs SP3, SP4, and SP5, the ultimate load was 76.42 kN, 119.40 kN, and 138.92 kN, respectively. For Slabs SP6, SP7, and SP8 the ultimate load was 153.60 kN, 134.40 kN, and 112.40 kN, respectively. For Slabs SP9, SP10, and SP11, the ultimate load was 247.86 kN, 215.05 kN, and 193.10 kN, respectively.
The enhancement in ultimate load for Slab SP9 compared with the control slabs led to concrete compressive strength and concrete thickness. The enhanced ratio is slightly low due to the small values of strain and the Young’s modulus of GFRP bars.
4.3. NLFE Deflection
The NLFE deflections obtained are indicated in Table 6. Generally, the recorded deflection improved due to the use of GFRP bars with respect to control slabs. The deflection of SP1 was 6.10 mm at failure load, but it recorded an enhancement that varied between 60.0% and 45.0% for SP3, SP4, and SP5. For the second group, the deflections recorded were 6.72 mm, 4.41 mm, and 4.16 mm for SP6, SP7, and SP8, respectively. The enhancement was apparent in Slab SP8, which had the least compressive load with a ratio of 1.2 µfb. This indicates the behavior of GFRP bars in enhancing the deflections, as shown in Figure 11.
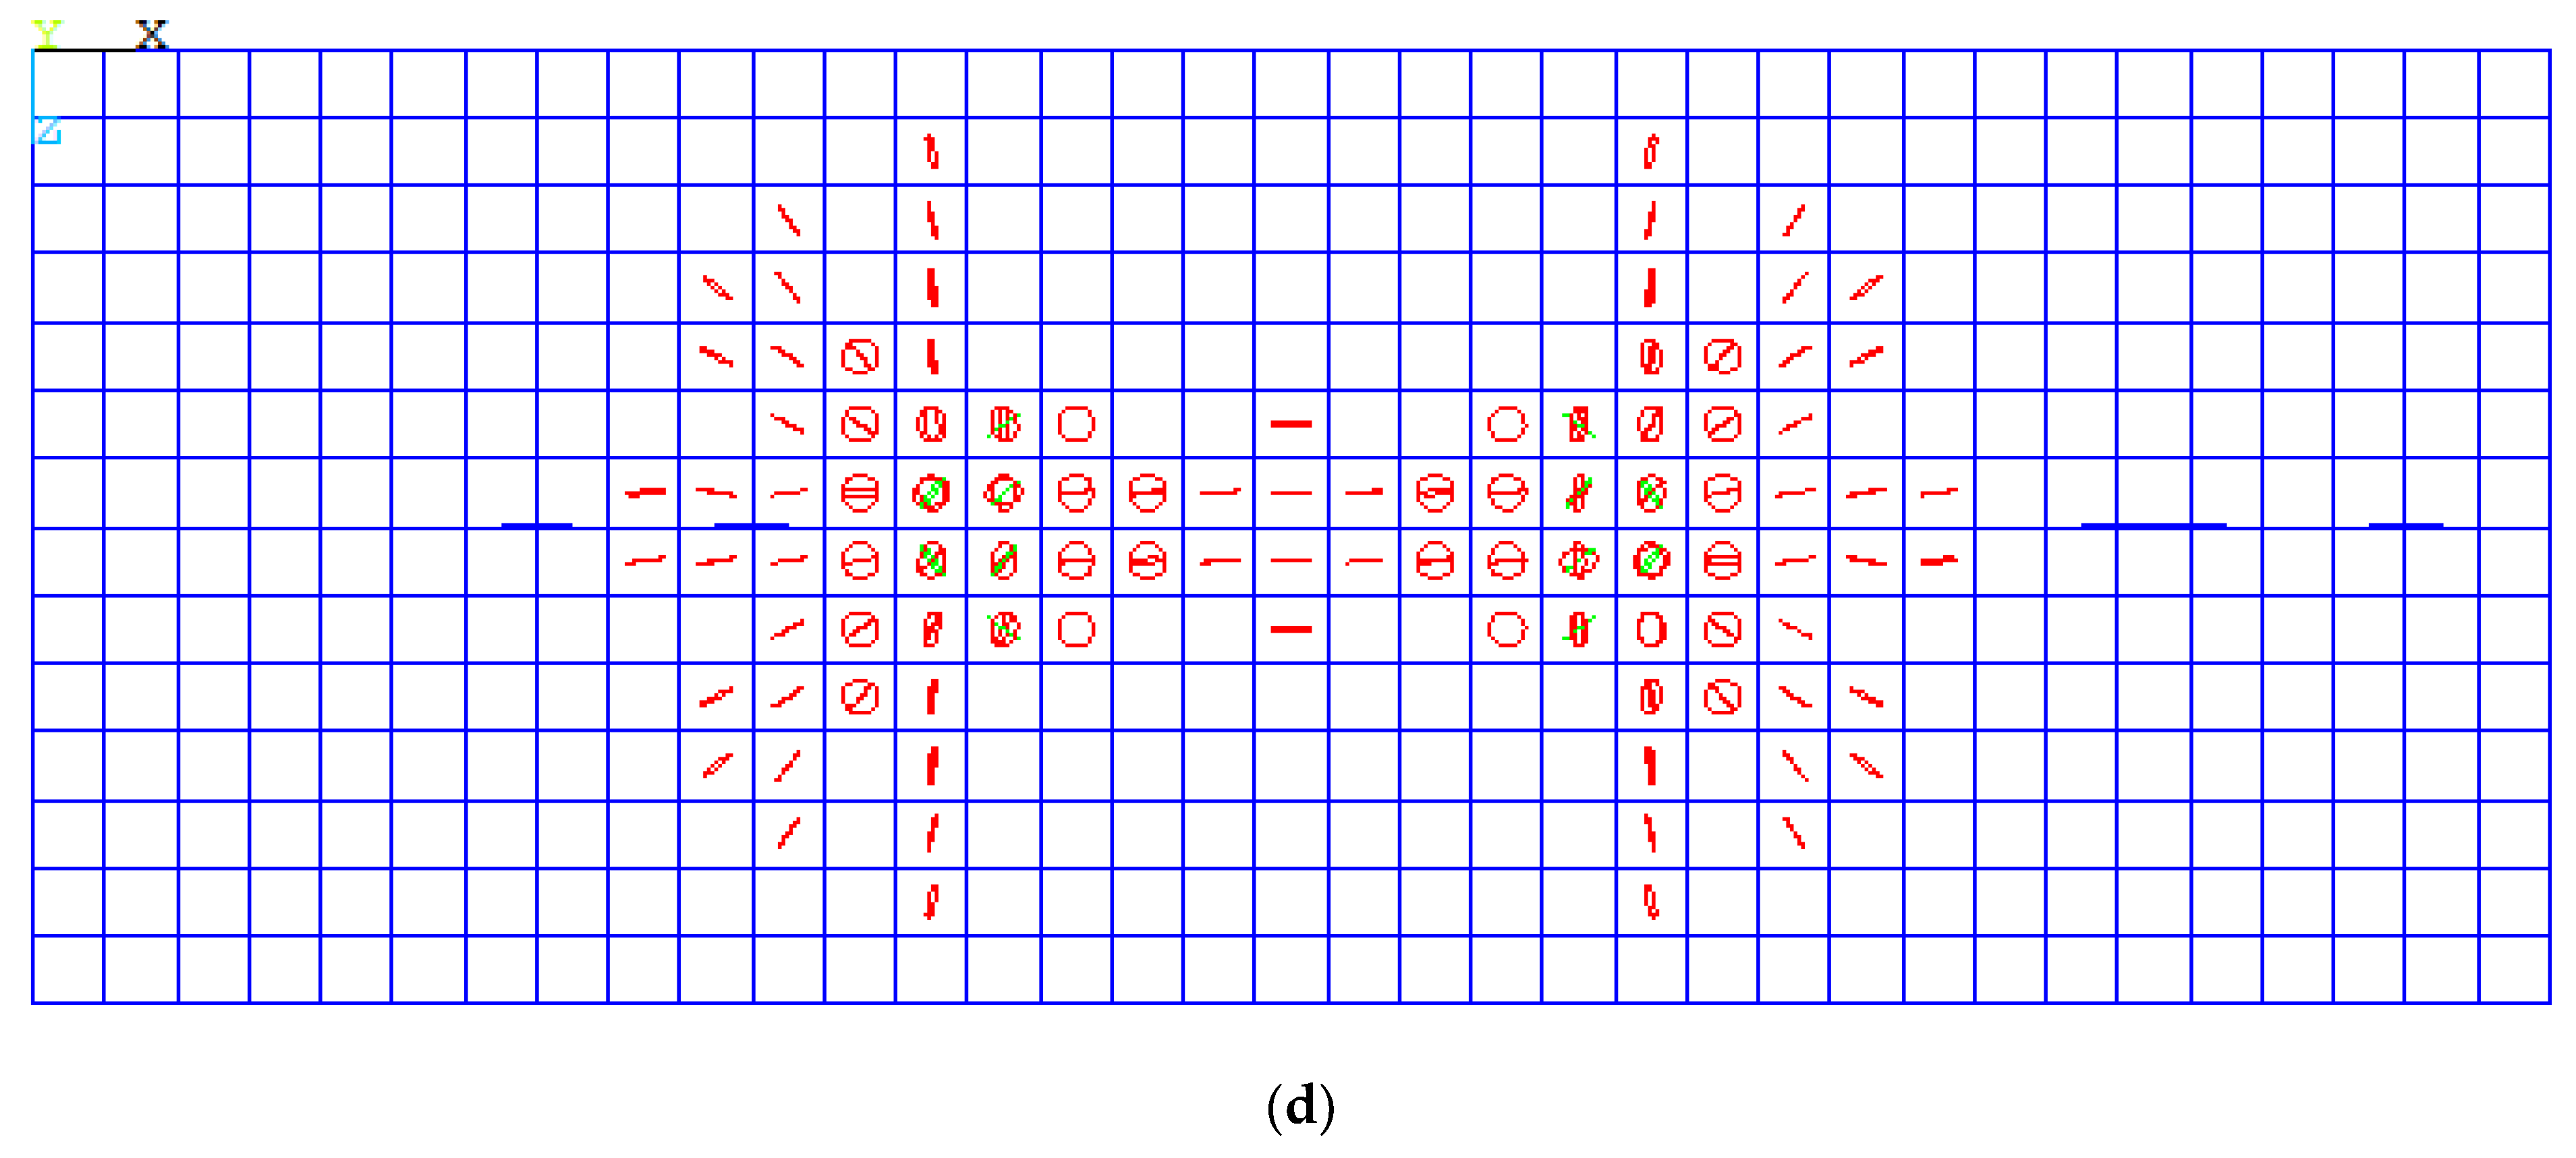
4.4. Crack Pattern and Mode of Failure
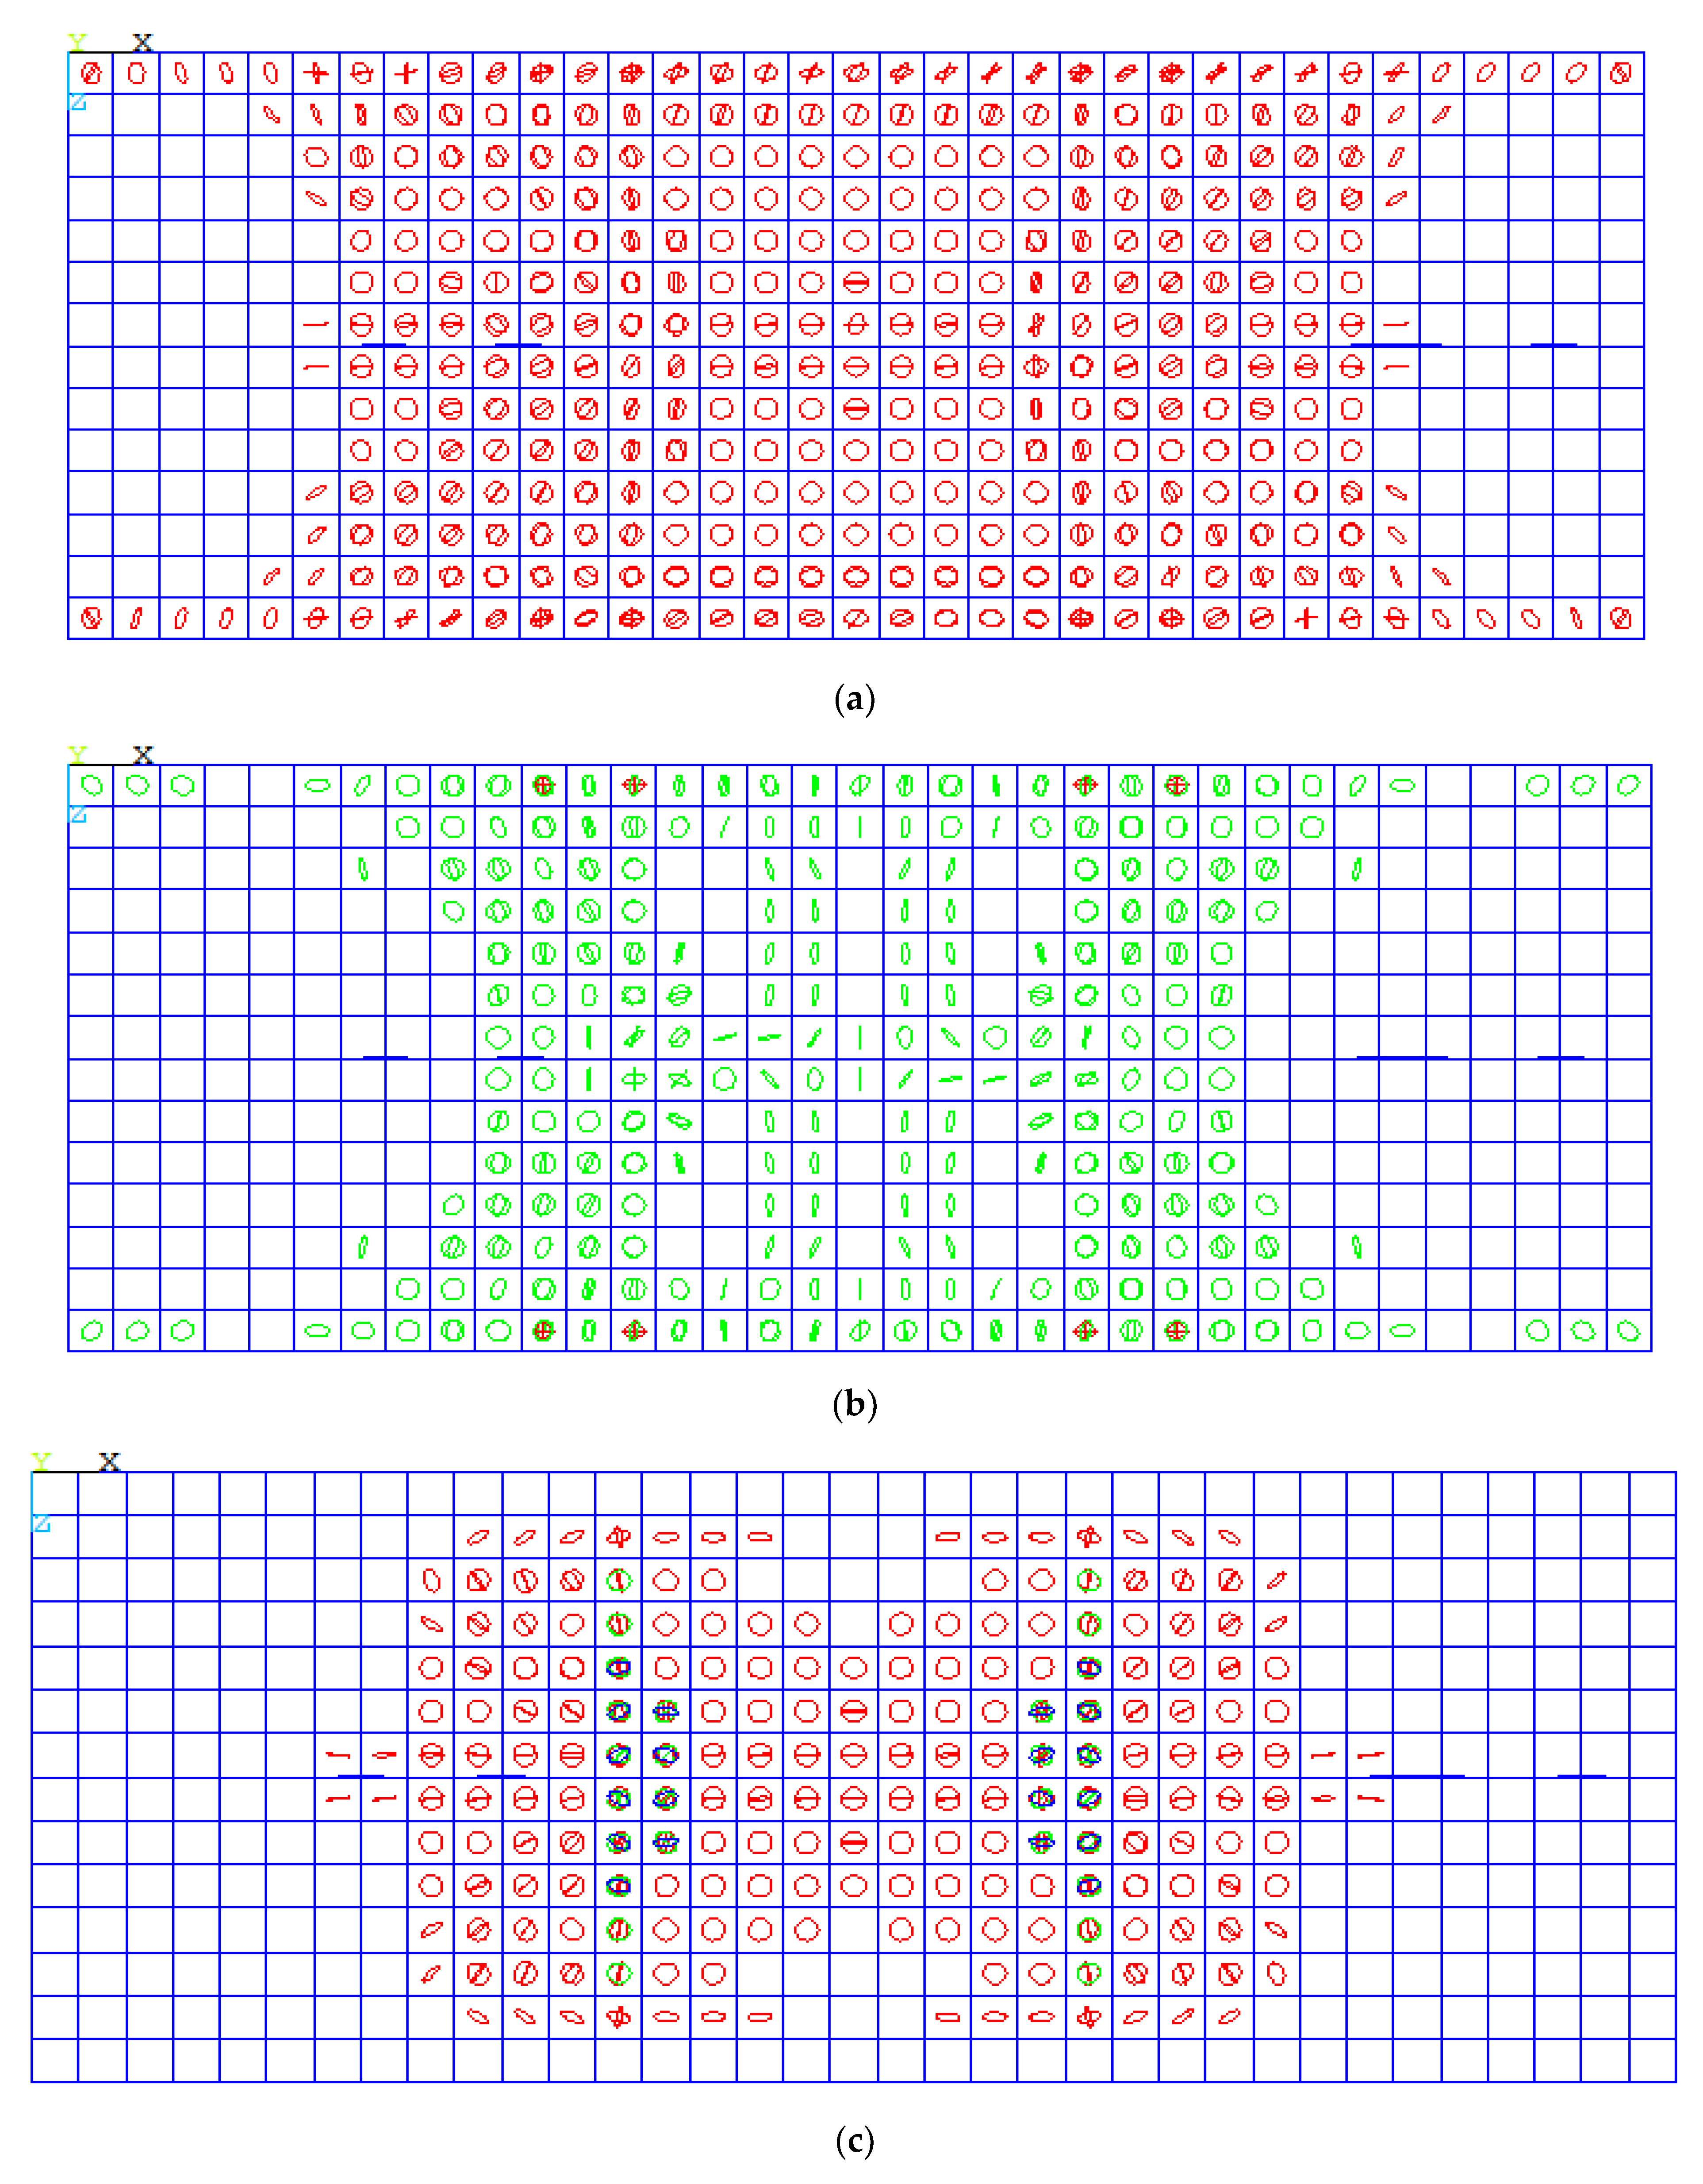
The crack pattern of the control group featured crack propagation in the tension zone, as shown in Figure 12a. Additionally, the mode of failure was tension failure (TF) due to reinforcement failure. The behavior of SP3 and SP6 was the same, while the reinforcement was less than 0.8 µb. So, the concrete capacity was still able to carry load, but the GFRP bars could not. Rupture occurred in GFRP bars, which was sudden rupture due to the brittle nature of GFRP bars, so there was RF in the bars. The mode of failure for the first group is the same for the second group in crack propagation and mode of failure. For slabs that had a reinforcement ratio of 1.2 µfb, the failure was a combination of concrete cracks in the compression zone and rupture in the GFRP bars, as shown in Figure 12d.
5. Comparisons between Experimental and NLFEA Results
There was good agreement between the experimental and ANSYS results. Comparisons were made between ultimate load, deflection, the first crack load, and crack pattern.
5.1. Comparison between Experimental and NLFE Ultimate Loads
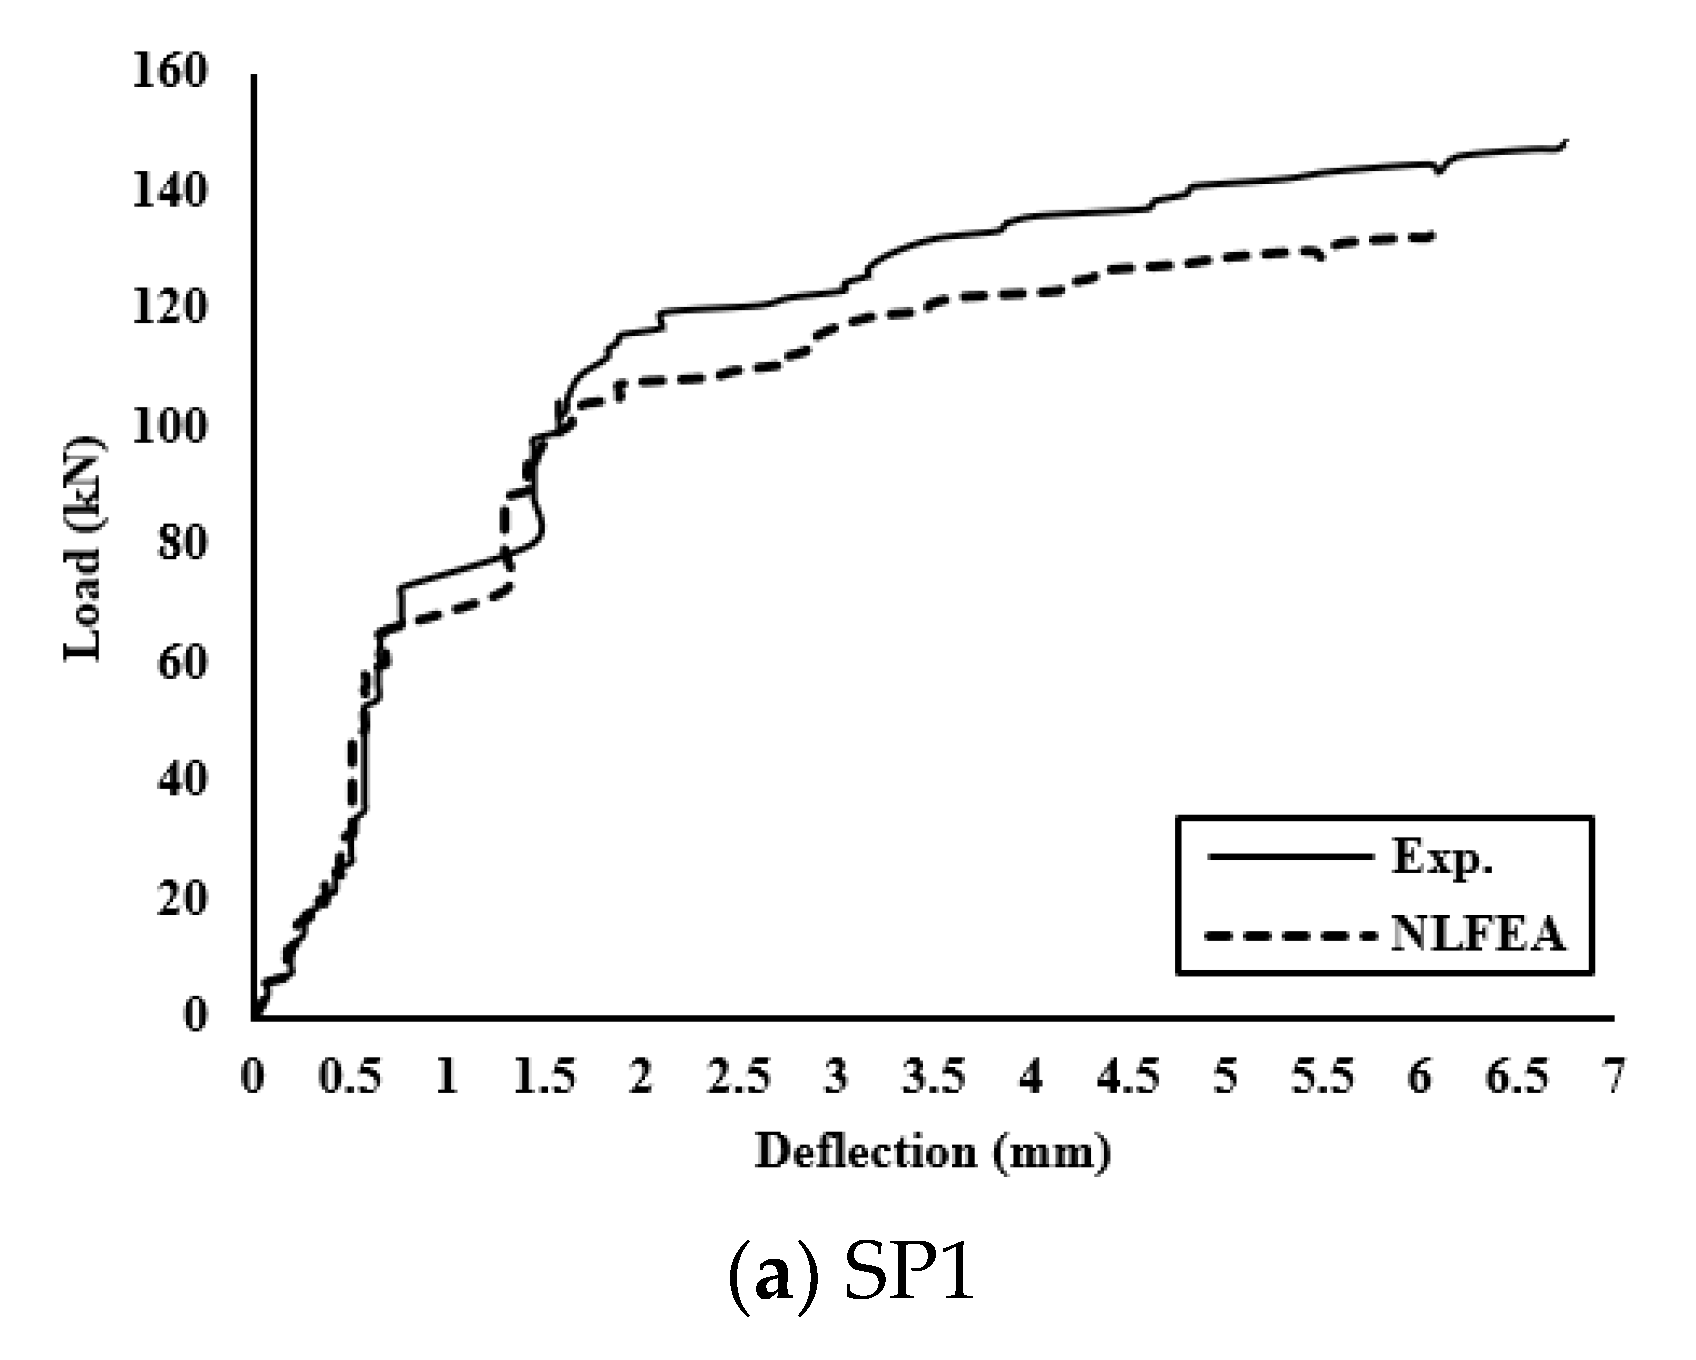
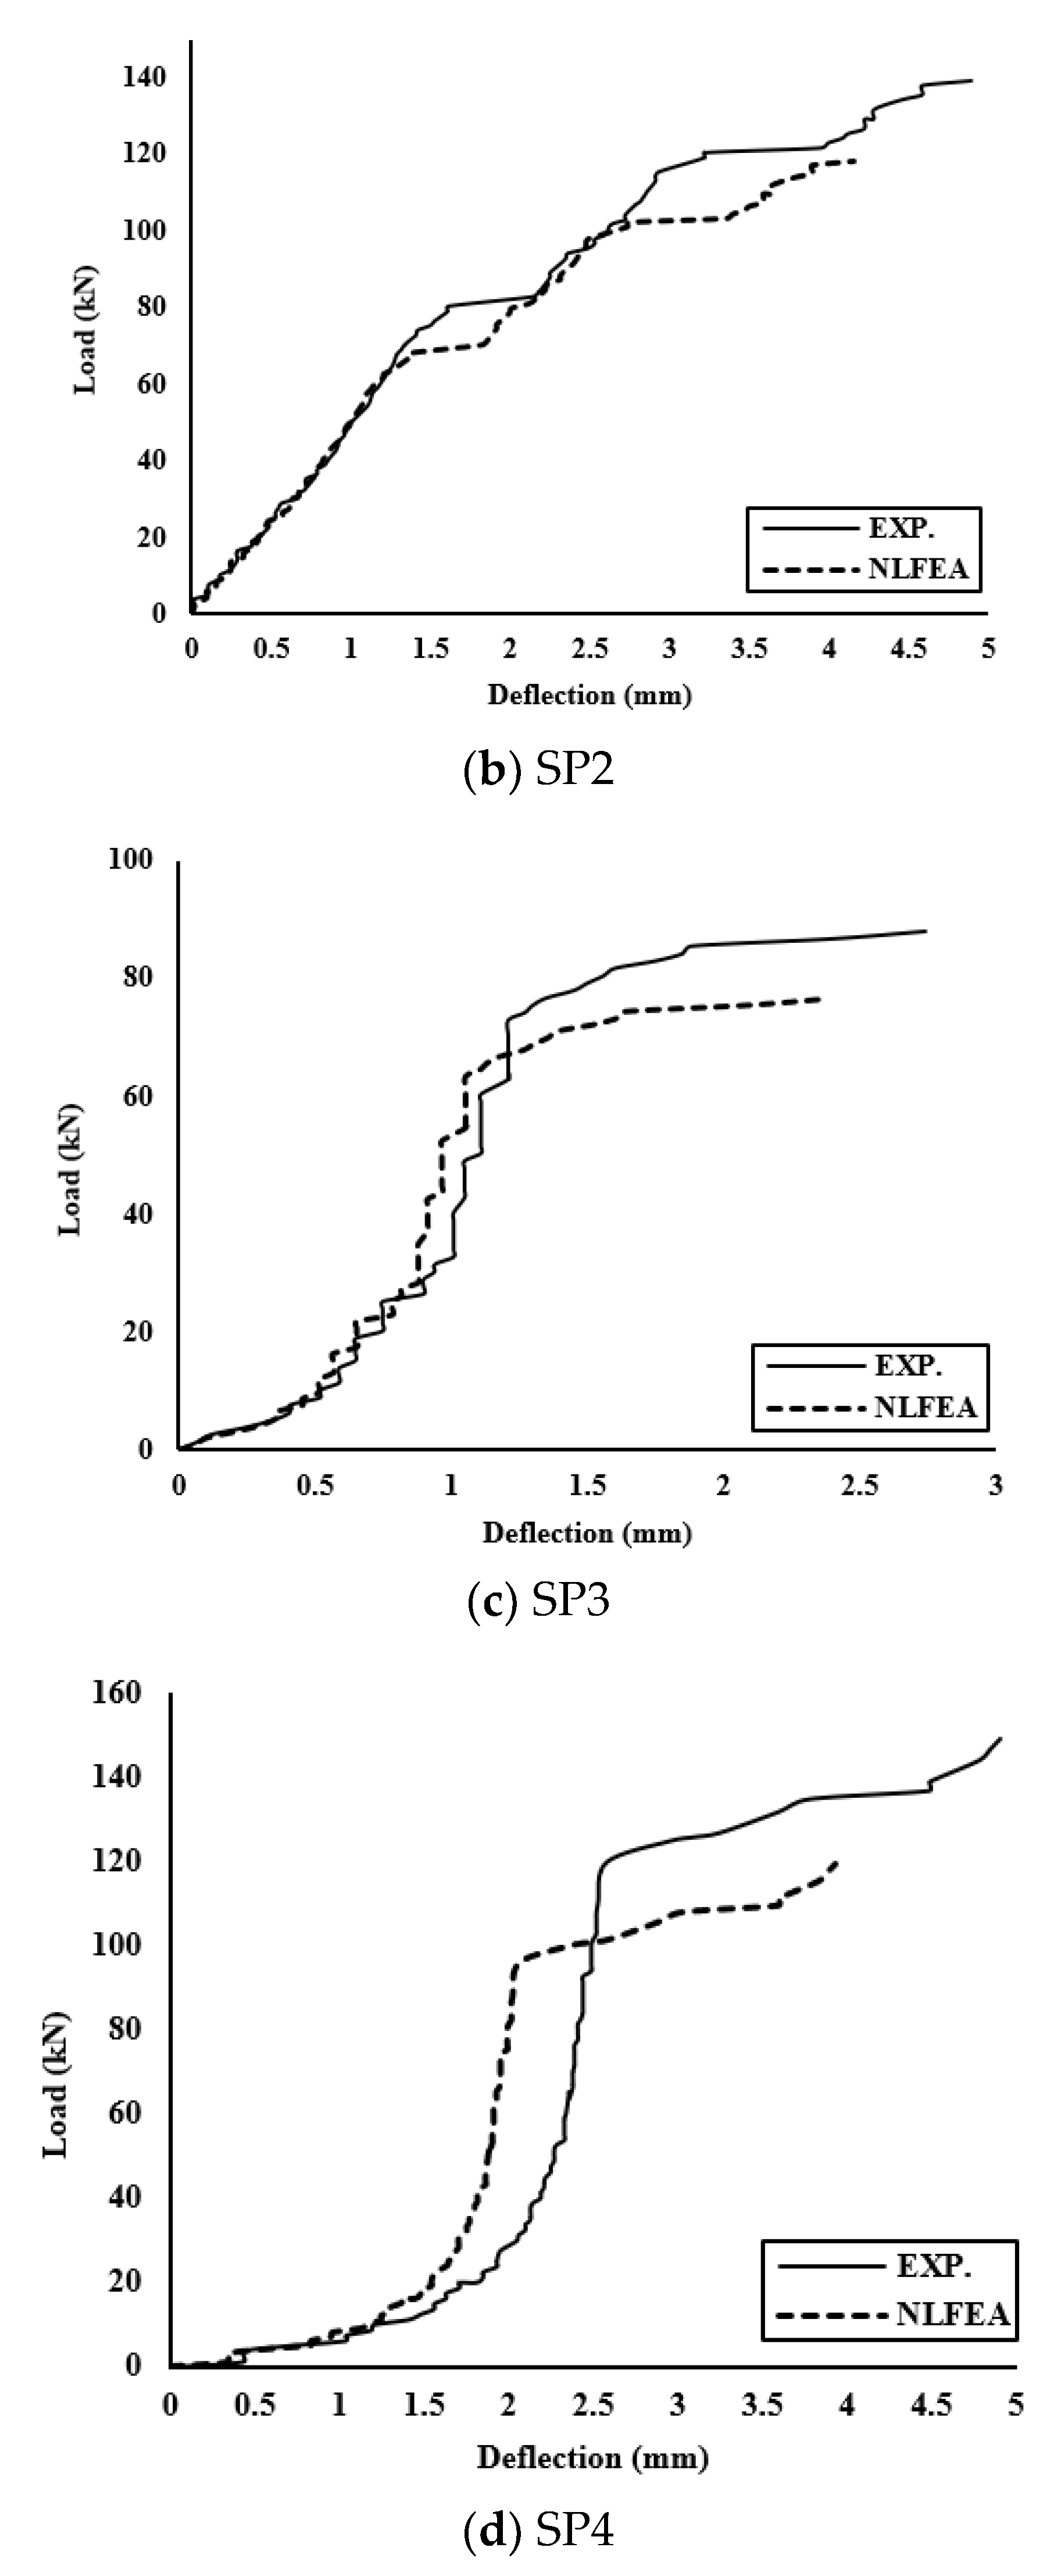
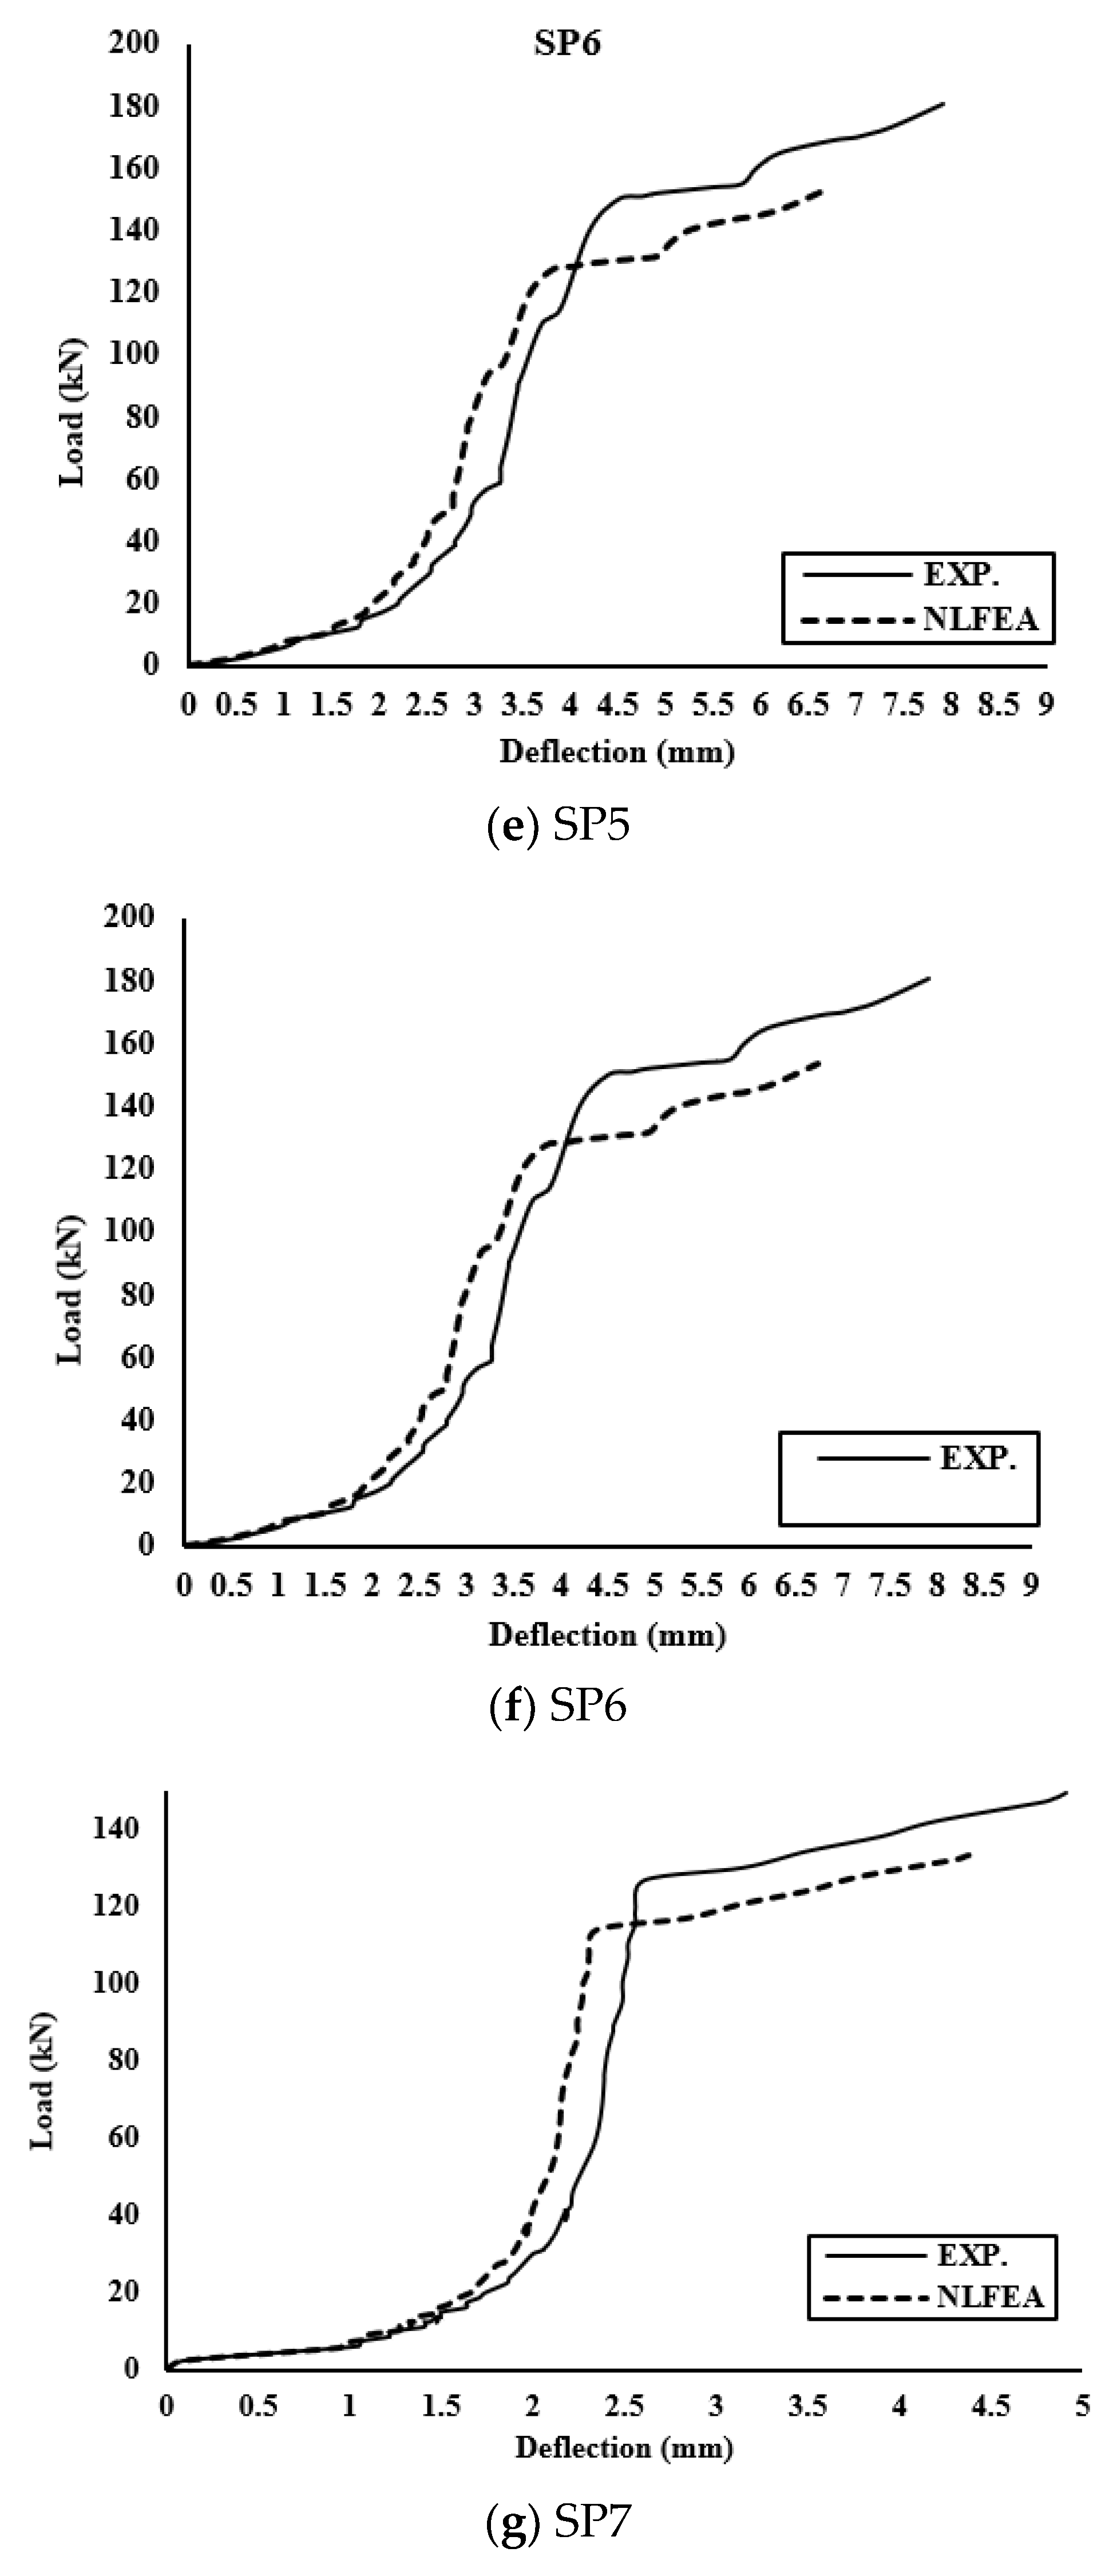
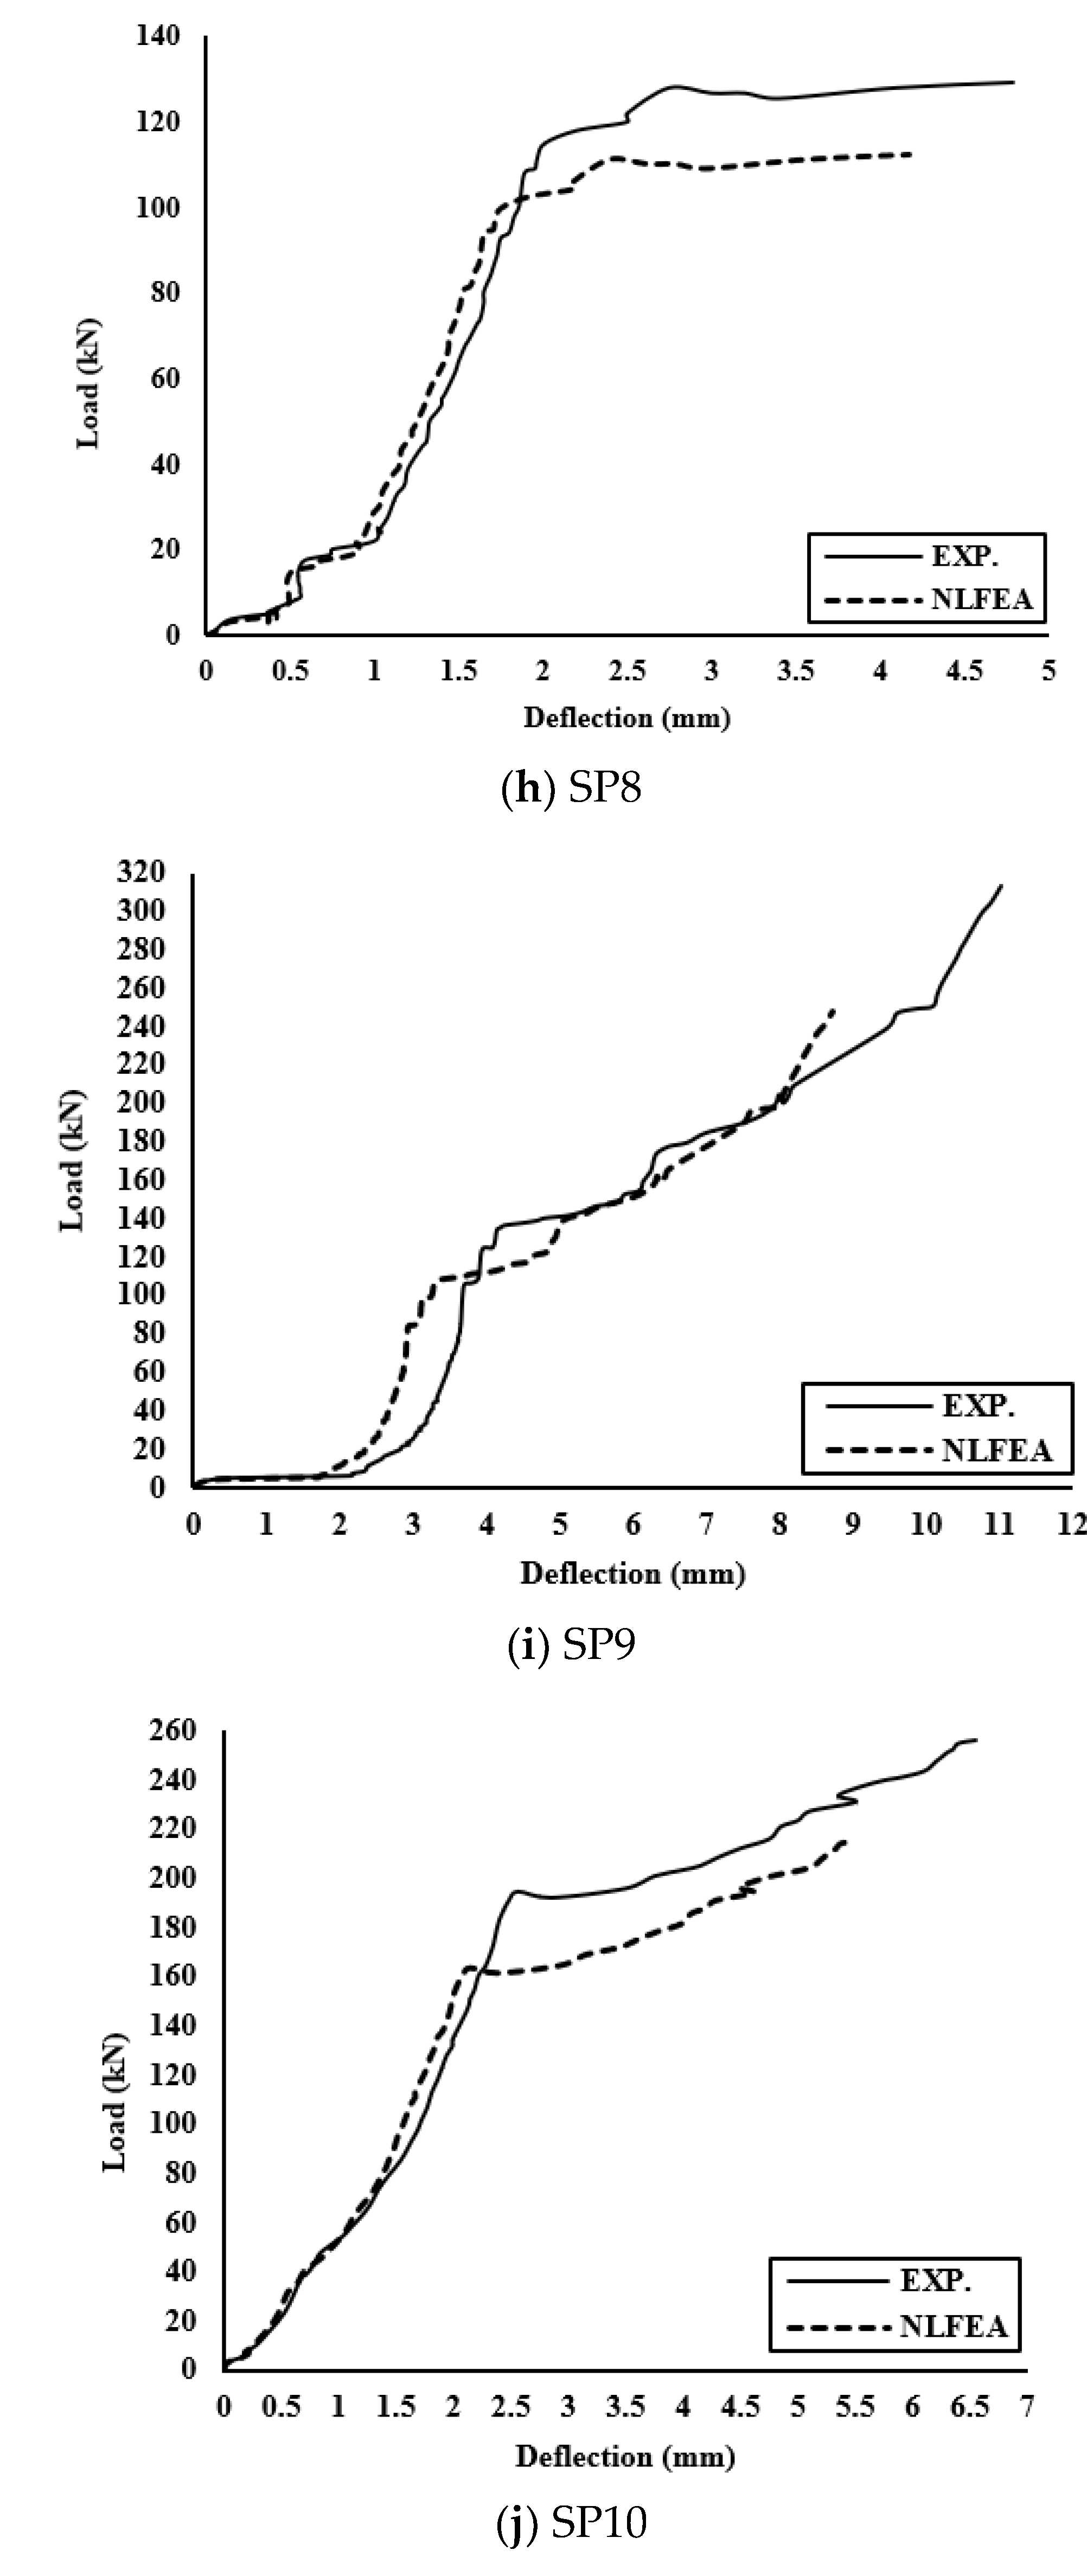
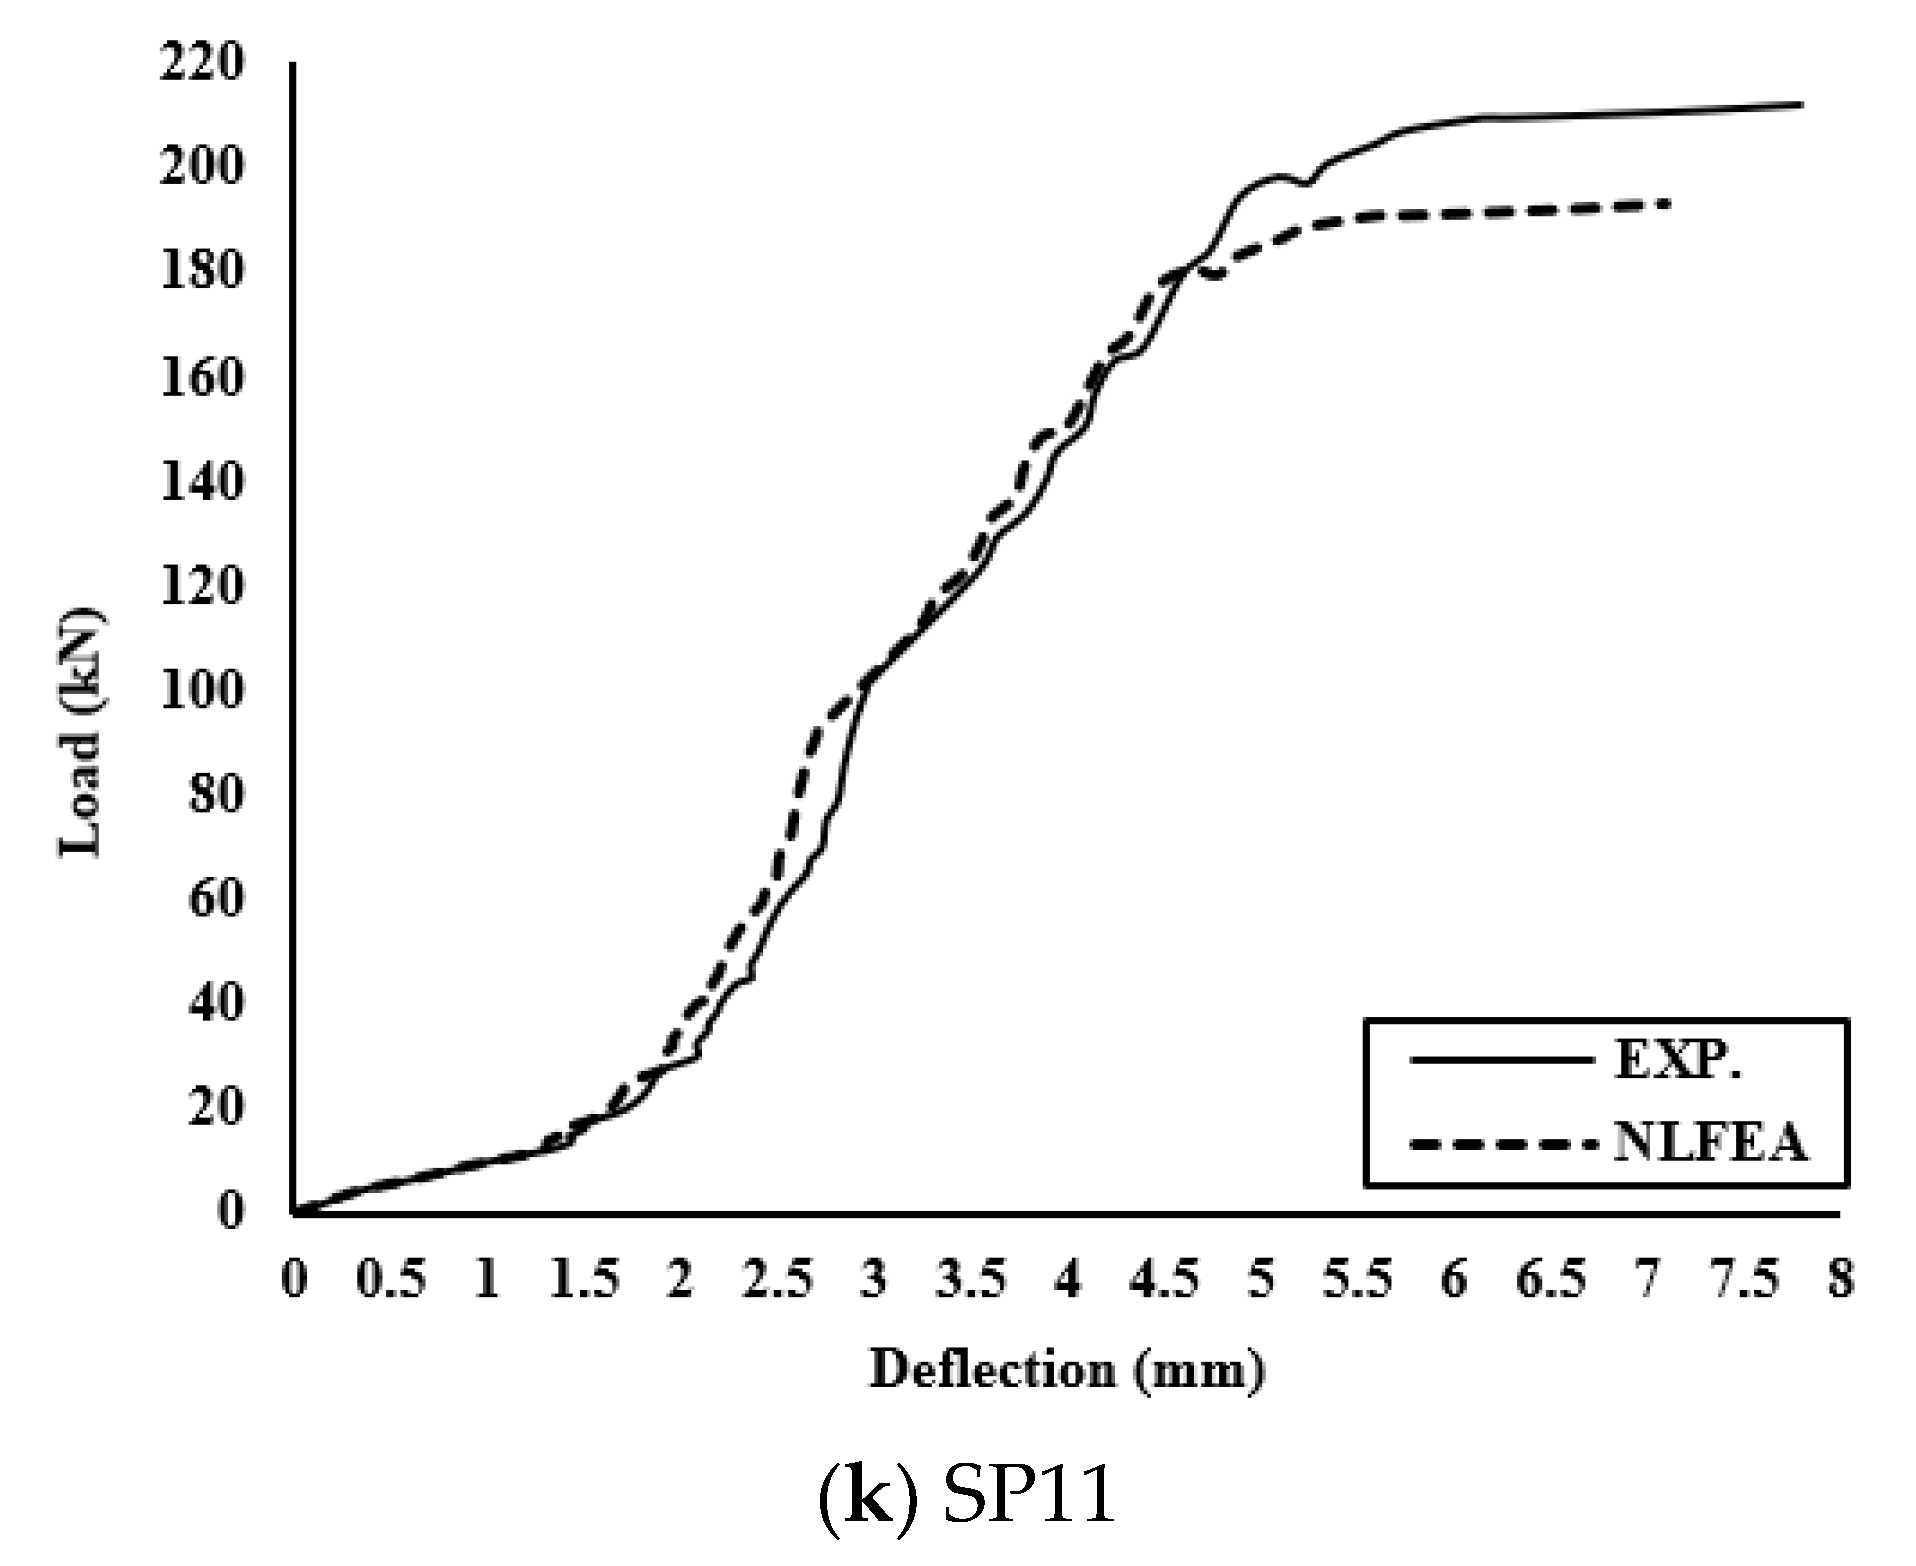
Figure 13 shows good agreement between the experimental and analytical load–deflection curves. Comparisons between the obtained results for the different groups are shown in Table 7. Pu NLFEA/Pu exp. had an average ratio of 0.86. Group II of concrete reinforced with GFRP of the same diameter but different reinforcement ratios for SP3, SP4, and SP5, respectively, has an average of 0.86. Finally, for Group II and Group III, the average ratio of agreement for all specimens is 0.87 and 0.84. The variance of 0.0015 and standard deviation of 0.04 show the effect of using NLFEA in predicting the behavior of the tested slabs, as shown in Table 7 and Figure 14.
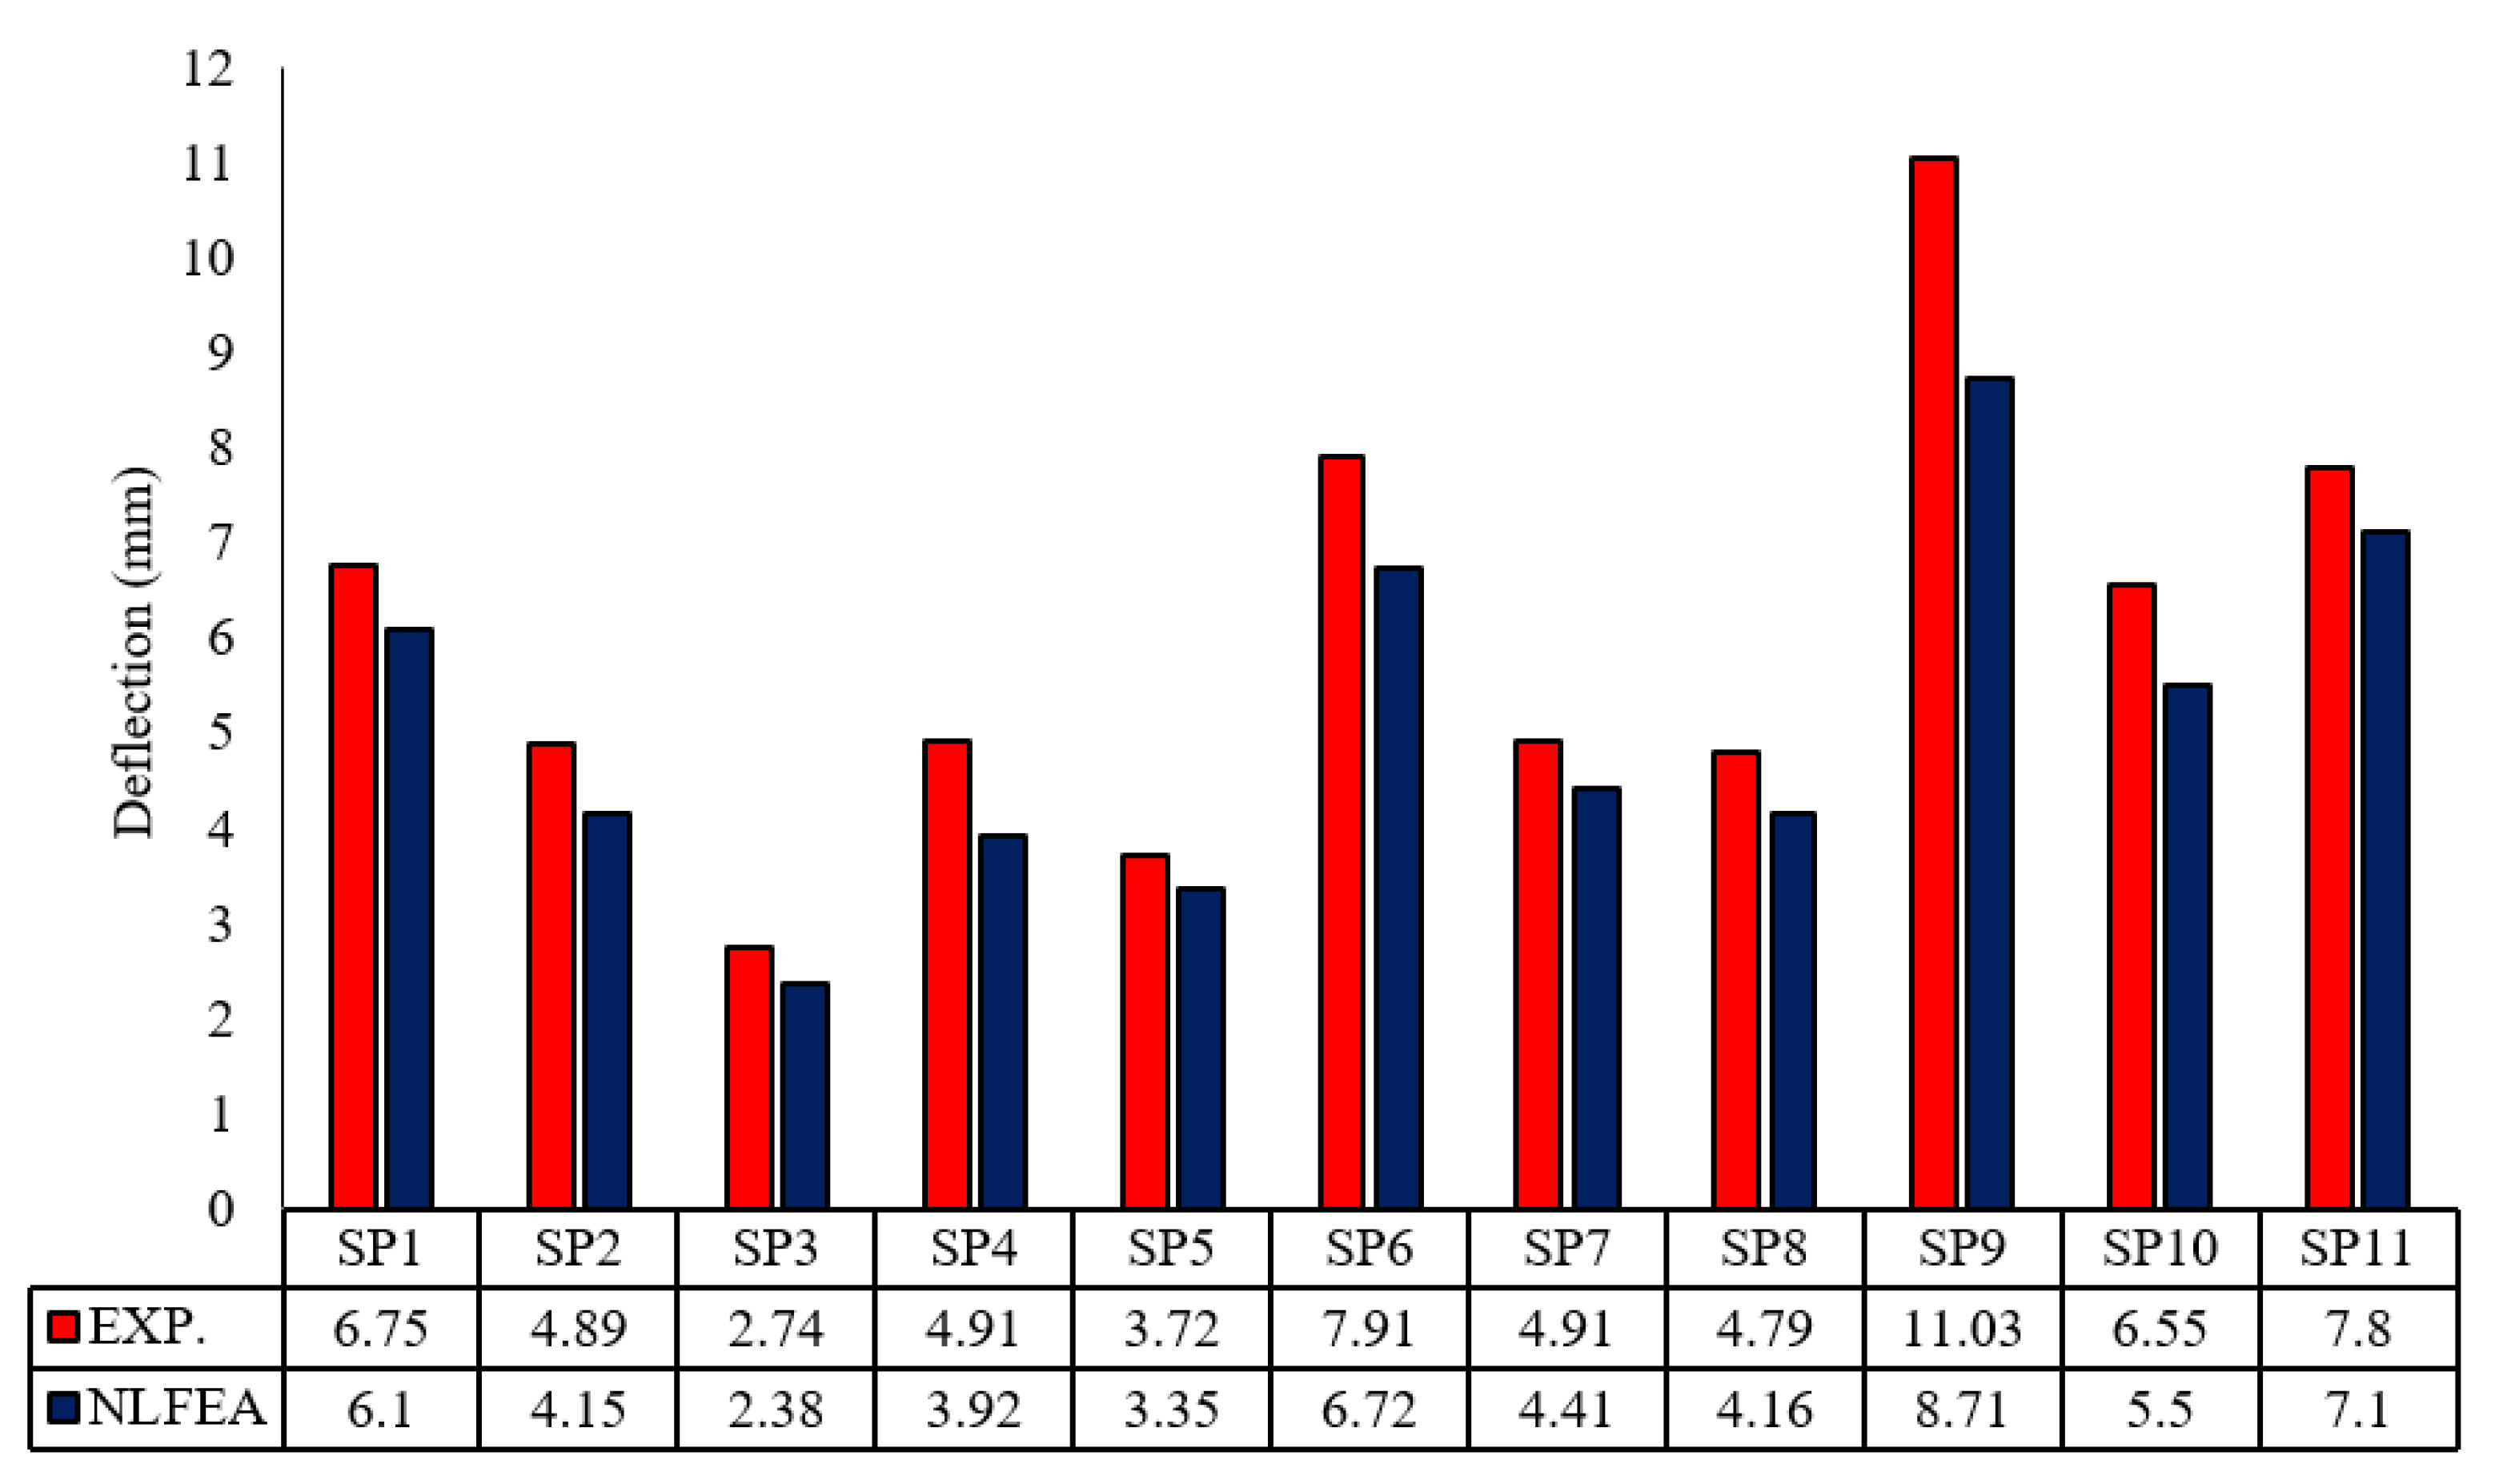
5.2. Comparison between Experimental and NLFE Deflections
Figure 15 shows the obtained deflections for all groups for both experimental and analytical studies. The load–deflection curves for the tested slabs and analytical results show good agreement, with an average of agreement of 86.0%. Table 7 shows a deflection ratio ∆u NLFEA/∆u exp. of the control group of 0.87, but for Group I, the ratios are 0.87, 0.79, and 0.90 for SP3, SP4, and SP5, respectively, and the average ratio of agreement is 0.85. This indicates that the analytical models provided an acceptable load–deflection response, as shown in Table 7. For all groups, the average of ∆u NLFEA/∆u exp is equal to 0.86, with a coefficient of variance and standard deviations of 0.0016 and 0.041, respectively.
5.3. Comparison between Experimental and NLFE Crack Patterns and Mode of Failure
The crack pattern for the control slab with a steel reinforcement started with crack propagation in the tension zone for the experimental and analytical slabs, as shown in Figure 16a, showing tension failure (TF).
However, for Slabs SP5 to SP11 reinforced with the same reinforcement ratio, a higher ultimate load, lower deflection, and decreased cracks were obtained, showing tension cracks with low propagation, as obtained from the experimental patterns. The crack patterns show good agreement between the NLFEA and experimental results.
6. Conclusions
Based on the experimental and the analytical studies, the following conclusions can be drawn:
- Using reinforcement areas of the GFRP bars less than or equal to µb led to brittle failure in GFRP bars and concrete crushing with rupture GFRP bars, respectively.
- The behavior of the tested GFRP-reinforced slabs was bilinear elastic until failure.
- There was an enhancement in deflections and crack patterns for slabs reinforced using GFRP bars, especially for equal reinforcement areas.
- The NLFEA obtained an acceptable agreement with the experimental study in terms of the ultimate loads, ultimate deflection, and crack pattern.
- The agreement between the experimental and analytical study was approximately 86.0% with a standard deviation of 0.04 and a coefficient of variance of 0.0015.
Author Contributions
Conceptualization, M.A.A., A.M.E., F.A.H. and T.A.E.-S.; data curation, F.A.H. and T.A.E.-S.; formal analysis, A.M.E., F.A.H. and T.A.E.-S.; funding acquisition, F.A.H.; investigation, A.M.E., F.A.H. and T.A.E.-S.; methodology, A.M.E., F.A.H. and T.A.E.-S.; project administration, A.M.E., F.A.H. and T.A.E.-S.; resources, A.M.E., F.A.H. and T.A.E.-S.; software, F.A.H. and T.A.E.-S.; supervision, M.A.A., A.M.E. and T.A.E.-S.; validation, A.M.E., F.A.H. and T.A.E.-S.; visualization, A.M.E., F.A.H. and T.A.E.-S.; writing—original draft, A.M.E., F.A.H. and T.A.E.-S.; writing—review & editing, M.A.A., A.M.E., F.A.H. and T.A.E.-S. All authors have read and agreed to the published version of the manuscript.
Funding
This research received no external funding.
Institutional Review Board Statement
Not applicable.
Informed Consent Statement
Not applicable.
Data Availability Statement
All data included in this study are available upon request by contact with the corresponding author.
Conflicts of Interest
The authors declare no conflict of interest.
References
- Rizkalla, S.; Hassan, T.; Hassan, N. Design Recommendations for the Use of FRP for Reinforcement and Strengthening of Concrete Structures. J. Prog. Struct. Eng. Mater. 2003, 50, 16–28. [Google Scholar] [CrossRef]
- El-Salakawy, E.; Benmokrane, B.; Desgagné, G. FRP Composite Bars for the Concrete Deck Slab of Wotton Bridge. Can. J. Civ. Eng. 2003, 30, 861–870. [Google Scholar] [CrossRef]
- Benmokrane, B.; El-Salakawy, E.; El-Ragaby, A.; Lackey, T. Designing and Testing of Concrete Bridge Decks Reinforced with Glass FRP Bars. J. Bridge Eng. 2006, 11, 217–229. [Google Scholar] [CrossRef] [Green Version]
- Benmokrane, B.; El-Salakawy, E.; El-Ragaby, A.; El-Gamal, S. Performance Evaluation of Innovative Concrete Bridge Deck Slabs Reinforced with Fibre-Reinforced Polymer Bars. Can. J. Civ. Eng. 2007, 34, 298–310. [Google Scholar] [CrossRef]
- Ospina, C.E.; Nanni, A. Current FRP Reinforced Concrete Design Trends in ACI 440.1R. In Proceedings of the 8th International Symposium on Fiber Reinforced Polymer Reinforcement for Concrete Structures, FRPRCS-8, Patras, Greece, 16–18 July 2007. [Google Scholar]
- American Concrete Institute. Guide for the Design and Construction of Concrete Reinforced with FRP Bars, ACI 440.1R07; ACI Committee 440: Farmington Hills, MI, USA, 2006; pp. 1023–1034. [Google Scholar]
- Zhang, B.; Masmoudi, R.; Benmokrane, B. Behaviour of one-way concrete slabs reinforced with CFRP grid reinforcements. Constr. Build. Mater. 2004, 18, 625–635. [Google Scholar] [CrossRef]
- Yoo, D.-Y.; Banthia, N.; Yoon, Y.-S. Flexural behavior of ultra-high-performance fiber-reinforced concrete beams reinforced with GFRP and steel rebars. Eng. Struct. 2016, 111, 246–262. [Google Scholar] [CrossRef]
- Benmokrane, B.; Chaallal, O.; Masmoudi, R. Flexural response of concrete beams reinforced with FRP reinforcing bars. ACI Struct. J. 1995, 91, 46–55. [Google Scholar]
- Masmoudi, R.; Theriault, M.; Benmokrane, B. Flexural behavior of concrete beams reinforced with deformed fiber reinforced plastic reinforcing rods. ACI Struct. J. 1998, 95, 665–675. [Google Scholar]
- Alsayed, S.H. Flexural behavior of concrete beams reinforced with GFRP bars. Cem. Concr. Compos. 1998, 20, 1–11. [Google Scholar] [CrossRef]
- Toutanji, H.A.; Saafi, M. Flexural behavior of concrete beams reinforced with glass fiber-reinforced polimer (GFRP) bars. ACI Struct. J. 2000, 97, 712–719. [Google Scholar]
- Toutanji, H.; Deng, Y. Deflection and crack-width prediction of concrete beams reinforced with glass FRP rods. Constr. Build. Mater. 2003, 17, 69–74. [Google Scholar] [CrossRef]
- Thiagarajan, G. Experimental and analytical behavior of carbon fiber-based rods as flexural reinforcement. J. Compos. Constr. 2003, 7, 64–72. [Google Scholar] [CrossRef]
- Yost, J.R.; Gross, S.P.; Dinehart, D.W. Effective moment of inertia for glass fiber reinforced concrete beams. ACI Struct. J. 2003, 100, 732–739. [Google Scholar]
- Rashid, M.A.; Mansur, M.A.; Paramasivam, P. Behavior of aramid fiber-reinforced polymer reinforced high strength concrete beams under bending. J. Compos. Constr. 2005, 9, 117–127. [Google Scholar] [CrossRef]
- Ashour, A.F. Flexural and shear capacities of concrete beams reinforced with GFRP bars. Constr. Build. Mater. 2006, 20, 1005–1015. [Google Scholar] [CrossRef]
- Nayal, R.; Rasheed, H.A. Tension stiffening model for concrete beams reinforced with steel and FRP bars. J. Mater. Civil Eng. 2006, 18, 831–841. [Google Scholar] [CrossRef]
- Kara, I.F.; Ashour, A.F. Flexural performance of FRP reinforced concrete beams. Compos. Struct. 2012, 94, 1616–1625. [Google Scholar] [CrossRef] [Green Version]
- Kara, I.F.; Ashour, A.F. Moment distribution in continuous FRP reinforced concrete beams. Constr. Build. Mater. 2013, 49, 939–948. [Google Scholar] [CrossRef] [Green Version]
- Kara, I.F.; Ashour, A.F.; Dundar, C. Deflection of concrete structures reinforced with FRP bars. Compos. Part B 2013, 44, 375–384. [Google Scholar] [CrossRef] [Green Version]
- Kassem, C.; Farghaly, A.S.; Benmokrane, B. Evaluation of flexural behavior and serviceability performance of concrete beams reinforced with FRP bars. J. Compos. Constr. 2011, 15, 682–695. [Google Scholar] [CrossRef]
- Al-Sunna, R.; Pilakoutas, K.; Hajirasouliha, I.; Guadagnini, M. Deflection behavior of FRP reinforced concrete beams and slabs: An experimental investigation. Compos. Part B 2012, 43, 2125–2134. [Google Scholar] [CrossRef]
- Barris, C.; Torres, L.; Comas, J.; Mias, C. Cracking and deflections in GFRP RC beams: An experimental study. Compos. Part B 2013, 55, 580–590. [Google Scholar] [CrossRef]
- Mahroug, M.E.M.; Ashour, A.F.; Lam, D. Experimental response and code modelling of continuous concrete slabs reinforced with BFRP bars. Compos. Struct. 2014, 107, 664–674. [Google Scholar] [CrossRef]
- Mahroug, M.E.M.; Ashour, A.F.; Lam, D. Tests of continuous concrete slabs reinforced with carbon fibre reinforced polymer bars. Compos. Part B 2014, 66, 348–357. [Google Scholar] [CrossRef]
- Dundar, C.; Tanrikulu, A.K.; Frosch, J.R. Prediction of load-deflection behavior of multi-span FRP and steel reinforced concrete beams. Compos. Struct. 2015, 132, 680–693. [Google Scholar] [CrossRef]
- Wang, X.; Wu, G.; Wu, Z.; Dong, Z.; Xie, Q. Evaluation of prestressed basalt fiber and hybrid fiber reinforced polymer tendons under marine environment. Mater. Des. 2014, 64, 721–728. [Google Scholar] [CrossRef]
- Li, C.; Xian, G.; Li, H. Water absorption and distribution in a pultruded unidirectional carbon/glass hybrid rod under hydraulic pressure and elevated temperatures. Polymers 2018, 10, 627. [Google Scholar] [CrossRef] [Green Version]
- Demakos, C.B.; Kyriazopoulos, A.; Pnevmatikos, N.; Drivas, D. Experimental investigation, and numerical simulation of curved frame structures. Procedia Struct. Integr. 2018, 10, 148–154. [Google Scholar] [CrossRef]
- Papavasileiou, G.S.; Pnevmatikos, N.G. Optimized design of steel buildings against earthquake and progressive collapse using cables. Int. J. Progress. Sci. Technol. 2018, 6, 213–220. [Google Scholar]
- ECP 208. Egyptian Code of Practice for Design Principles of the Use of Fiber Reinforced Polymers in Construction; Permanent Committee, HBNRC: Giza, Egypt, 2018. [Google Scholar]
- Janus, O.; Girgle, F.; Kostiha, V.; Stepanek, P. Effect of Surface Treatment and Test Configuration on Bond Behaviour of GFRP Rebars. In Proceedings of the 9th International Conference on Fibre-Reinforced Polymer (FRP) Composites in Civil Engineering (CICE 2018), Paris, France, 17–19 July 2018; pp. 17–19. [Google Scholar]
- Achillides, Z.; Pilakoutas, K. Bond behaviour of fibre reinforced polymer bars under direct pullout conditions. J. Compos. Constr. 2007, 8, 173–181. [Google Scholar] [CrossRef]
- ANSYS. “Engineering Analysis System User’s Manual” 2005, Vol. 1&2, and Theoretical Manual; Revision 8.0; Swanson Analysis System Inc.: Houston, PA, USA, 2005. [Google Scholar]
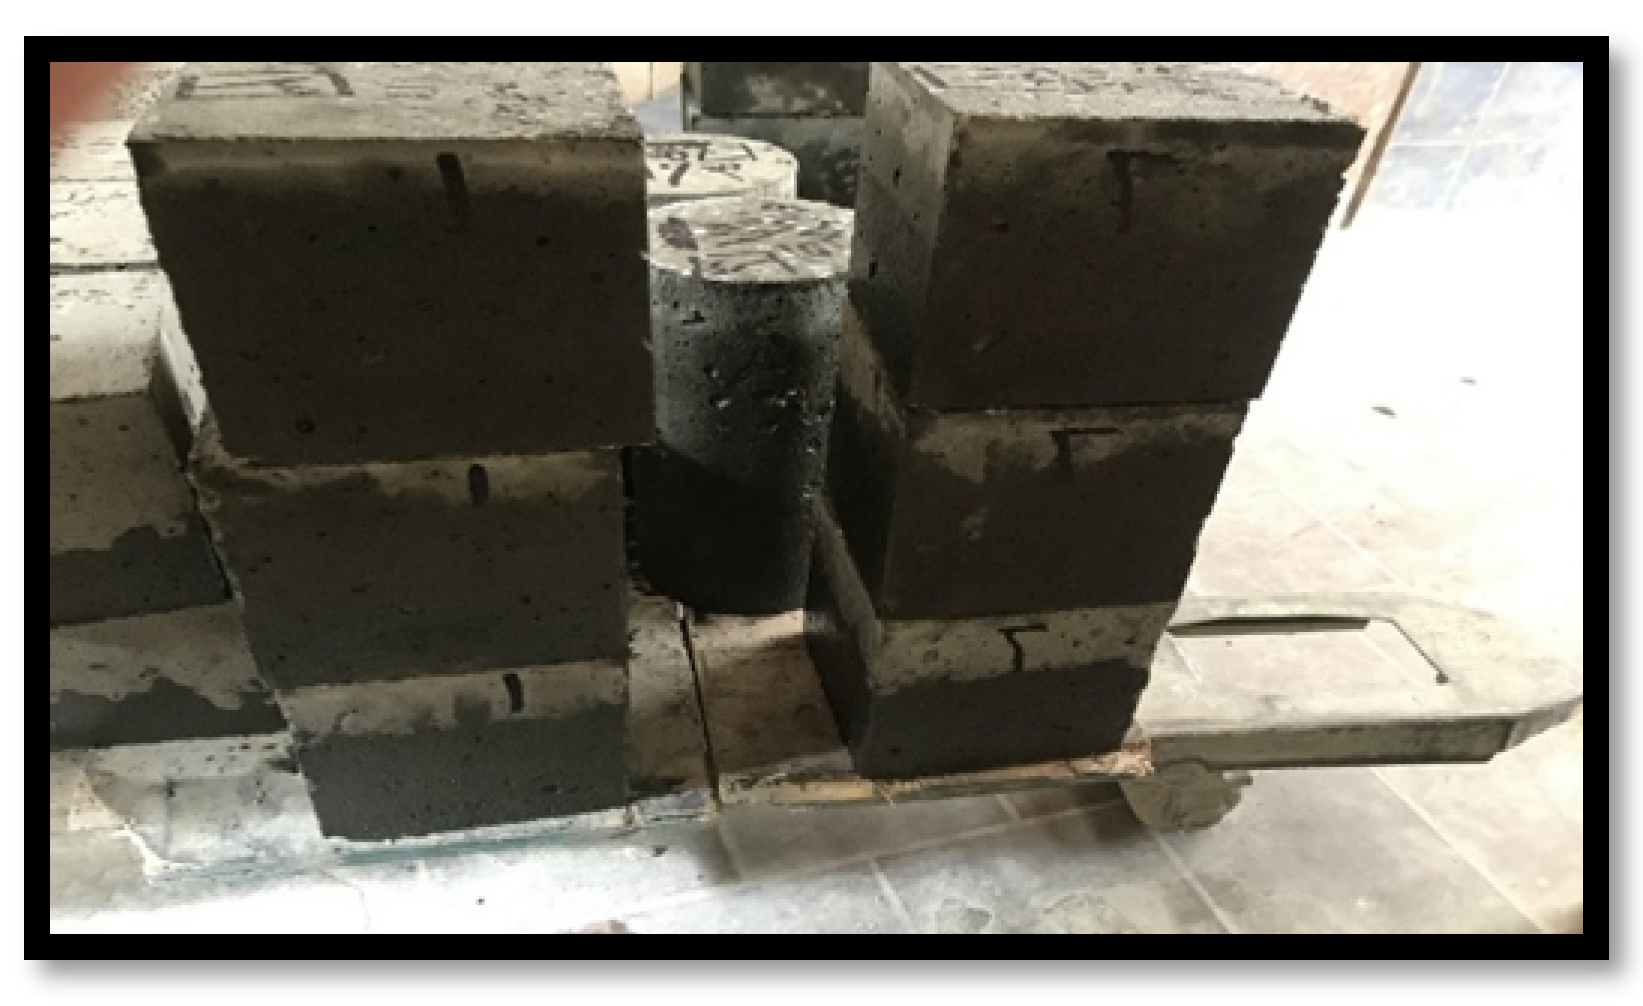
Figure 1.
Concrete cubes.

Figure 2.
Concrete cubes under testing machine.

Figure 3.
Tensile test: (a) steel bar; (b) GFRP bar of Φ 10 mm; (c) different bar diameters of Φ 8, 10, and 12 mm.
Figure 3.
Tensile test: (a) steel bar; (b) GFRP bar of Φ 10 mm; (c) different bar diameters of Φ 8, 10, and 12 mm.

Figure 4.
Slab dimensions and reinforcement.

Figure 5.
Test setup: (a) slab details, (b) flexural test setup, (c) LVDT and strain gauge locations.
Figure 5.
Test setup: (a) slab details, (b) flexural test setup, (c) LVDT and strain gauge locations.


Figure 6.
Load–deflection curves: (a) slabs with Φ 8 in control and Group I; (b) slabs with the same reinforcement ratio with different diameter (ts = 120 mm); (c) slabs with the same reinforcement ratio with different diameter (ts = 150 mm); (d) slabs with the same reinforcement ratio and different diameter (ts).

Figure 7.
Crack pattern for all slabs.


Figure 8.
Crack pattern: (a) rupture of GFRP bars; (b) tension failure with concrete crushing.

Figure 9.
Element geometry: (a) Solid-65; (b) Link-180.

Figure 10.
NLFEA model: (a) slab modeling; (b) restraints and applied loads.

Figure 11.
Sample of NLFEA deflection.

Figure 12.
NLFE crack pattern: (a) control slabs; (b) Group I slabs; (c) Group II slabs; (d) Group III slabs.
Figure 12.
NLFE crack pattern: (a) control slabs; (b) Group I slabs; (c) Group II slabs; (d) Group III slabs.


Figure 13.
Comparisons between experimental and NLFE load–deflection curves for all slabs.


Figure 14.
Comparisons between experimental and NLFE ultimate load.

Figure 15.
Comparisons between experimental and NLFE deflections.

Figure 16.
Comparisons between experimental and NLFE crack patterns: (a) slabs reinforced using steel bars; (b) slabs reinforced using GFRP.
Figure 16.
Comparisons between experimental and NLFE crack patterns: (a) slabs reinforced using steel bars; (b) slabs reinforced using GFRP.


Table 1.
Material weights.
| Materials | Per m3of Concrete (fcu = 60 MPa) |
|---|---|
| Cement | 575 kg/m3 |
| Coarse aggregate | 1100 kg/m3 |
| Fine aggregate | 580 kg/m3 |
| Water | 138 kg/m3 |
| Silica fume | 50 kg/m3 |
| Superplasticizer | 18 kg/m3 |
Table 2.
Compressive strength test results.
| Cubes | Compressive Strength (MPa) |
|---|---|
| 28 Days | |
| C−1 | 63.9 |
| C−2 | 68.2 |
| C−3 | 66.7 |
| Average | 66.3 |
Table 3.
GFRP bar tensile stresses.
| Diameter (mm) | Tensile Strength (MPa) |
|---|---|
| 8 | 490 |
| 10 | 650 |
| 12 | 750 |
Table 4.
Specimen details.
| Specimen Group | Specimen ID | Thickness (mm) | Diameter (mm) | Reinforcement Ratio % | RFT. Type |
|---|---|---|---|---|---|
| Control | SP1 | 100 | ⌀ 8 | 0.16 µb | Steel |
| SP2 | 100 | ⌀ 10 | 0.24 µb | Steel | |
| Group I | SP3 | 100 | ⌀ 8 | 0.80 µfb | GFRP |
| SP4 | 100 | ⌀ 8 | 1.00 µfb | GFRP | |
| SP5 | 100 | ⌀ 8 | 1.20 µfb | GFRP | |
| Group II | SP6 | 120 | ⌀ 8 | 1.20 µfb | GFRP |
| SP7 | 120 | ⌀ 10 | 1.20 µfb | GFRP | |
| SP8 | 120 | ⌀ 12 | 1.20 µfb | GFRP | |
| Group III | SP9 | 150 | ⌀ 8 | 1.20 µfb | GFRP |
| SP10 | 150 | ⌀ 10 | 1.20 µfb | GFRP | |
| SP11 | 150 | ⌀ 12 | 1.20 µfb | GFRP |
Table 5.
Experimental results.
| Specimen Group | Specimen ID | First Crack (kN) | Ultimate Load (kN) | Ultimate Deflection Δu (mm) | Mode of Failure |
|---|---|---|---|---|---|
| Control | SP1 | 75 | 148.00 | 6.75 | FF |
| SP2 | 75 | 139.00 | 4.89 | FF | |
| Group I | SP3 | 50 | 87.85 | 2.74 | GR |
| SP4 | 80 | 149.30 | 4.91 | GR + TF | |
| SP5 | 85 | 154.40 | 3.72 | CCT | |
| Group II | SP6 | 100 | 180.70 | 7.91 | CCT |
| SP7 | 120 | 149.30 | 4.91 | GR | |
| SP8 | 125 | 129.30 | 4.79 | GR | |
| Group III | SP9 | 100 | 313.75 | 11.03 | GR |
| SP10 | 150 | 256.02 | 6.55 | CCT | |
| SP11 | 200 | 212.10 | 7.80 | CCT |
Concrete cracking and tension (CCT) cracks, GFRP rupture (GR), flexural failure (FF).
Table 6.
NLFEA results.
| Specimen Group | Specimen ID | First Crack (kN) | Ultimate Load (kN) | ΔNLFA (mm) |
|---|---|---|---|---|
| Control | SP1 | 50 | 133.30 | 6.10 |
| SP2 | 50 | 118.40 | 4.15 | |
| Group I | SP3 | 50 | 76.42 | 2.38 |
| SP4 | 50 | 119.40 | 3.92 | |
| SP5 | 50 | 138.92 | 3.35 | |
| Group II | SP6 | 70 | 153.60 | 6.72 |
| SP7 | 70 | 134.40 | 4.41 | |
| SP8 | 70 | 112.40 | 4.16 | |
| Group III | SP9 | 82 | 247.86 | 8.71 |
| SP10 | 82 | 215.05 | 5.50 | |
| SP11 | 82 | 193.10 | 7.10 |
Table 7.
Comparisons between experimental and NLFEA results.
| Specimen Group | Spec. ID | Experimental Load (kN) | Analytical Load (kN) | Δ (mm) | ||||||
|---|---|---|---|---|---|---|---|---|---|---|
| First Crack | Ult. Load | First Crack | Ult. Load | Δexp | ΔNLFE | First Crack | Ult. Load | |||
| Control | SP1 | 75 | 148.00 | 50 | 133.30 | 6.75 | 6.10 | 0.67 | 0.90 | 0.90 |
| SP2 | 75 | 139.00 | 50 | 118.40 | 4.89 | 4.15 | 0.67 | 0.85 | 0.84 | |
| Group I | SP3 | 50 | 87.85 | 50 | 76.42 | 2.74 | 2.38 | 1.0 | 0.87 | 0.87 |
| SP4 | 80 | 149.30 | 50 | 119.40 | 4.91 | 3.92 | 0.62 | 0.80 | 0.79 | |
| SP5 | 85 | 154.40 | 50 | 138.92 | 3.72 | 3.35 | 0.59 | 0.90 | 0.90 | |
| Group II | SP6 | 100 | 180.70 | 70 | 153.60 | 7.91 | 6.72 | 0.70 | 0.85 | 0.85 |
| SP7 | 120 | 149.30 | 70 | 134.40 | 4.91 | 4.41 | 0.58 | 0.90 | 0.89 | |
| SP8 | 125 | 129.30 | 70 | 112.40 | 4.79 | 4.16 | 0.56 | 0.87 | 0.87 | |
| Group III | SP9 | 100 | 313.75 | 82 | 247.86 | 11.03 | 8.71 | 0.82 | 0.79 | 0.79 |
| SP10 | 150 | 256.02 | 82 | 215.05 | 6.55 | 5.50 | 0.55 | 0.83 | 0.84 | |
| SP11 | 200 | 212.10 | 82 | 193.10 | 7.80 | 7.10 | 0.41 | 0.91 | 0.91 | |
| Average | 0.65 | 0.86 | 0.86 | |||||||
| Variance | 0.019 | 0.0015 | 0.0016 | |||||||
| Standard Deviation | 0.15 | 0.04 | 0.041 | |||||||
Publisher’s Note: MDPI stays neutral with regard to jurisdictional claims in published maps and institutional affiliations. |
© 2021 by the authors. Licensee MDPI, Basel, Switzerland. This article is an open access article distributed under the terms and conditions of the Creative Commons Attribution (CC BY) license (https://creativecommons.org/licenses/by/4.0/).
Share and Cite
MDPI and ACS Style
Adam, M.A.; Erfan, A.M.; Habib, F.A.; El-Sayed, T.A. Structural Behavior of High-Strength Concrete Slabs Reinforced with GFRP Bars. Polymers 2021, 13, 2997. https://0-doi-org.brum.beds.ac.uk/10.3390/polym13172997
AMA Style
Adam MA, Erfan AM, Habib FA, El-Sayed TA. Structural Behavior of High-Strength Concrete Slabs Reinforced with GFRP Bars. Polymers. 2021; 13(17):2997. https://0-doi-org.brum.beds.ac.uk/10.3390/polym13172997
Chicago/Turabian StyleAdam, Maher A., Abeer M. Erfan, Fatma A. Habib, and Taha A. El-Sayed. 2021. "Structural Behavior of High-Strength Concrete Slabs Reinforced with GFRP Bars" Polymers 13, no. 17: 2997. https://0-doi-org.brum.beds.ac.uk/10.3390/polym13172997
Note that from the first issue of 2016, this journal uses article numbers instead of page numbers. See further details here.