
Macromolecular Design for Oxygen/Nitrogen Permselective Membranes—Top-Performing Polymers in 2020—

 , , , and
Abstract
:
1. Introduction
1.1. Significance of Oxygen/Nitrogen Permselective Membranes
1.2. Requirements for Polymers as Oxygen/Nitrogen Permselective Membranes
- (1)
- high processability, mechanical strength, and stability
- (2)
- high oxygen permselectivity, that is, a high oxygen permeability coefficient (PO2 (barrer)) and high oxygen separation factor (α = PO2/PN2)
- (1)
- Polymers with higher regular structures which are needed for higher α values have lower processability because they are insoluble and vice versa.
- (2)
- Polymers with higher α values have lower PO2 values and vice versa. (For the detail, see Section 1.4).
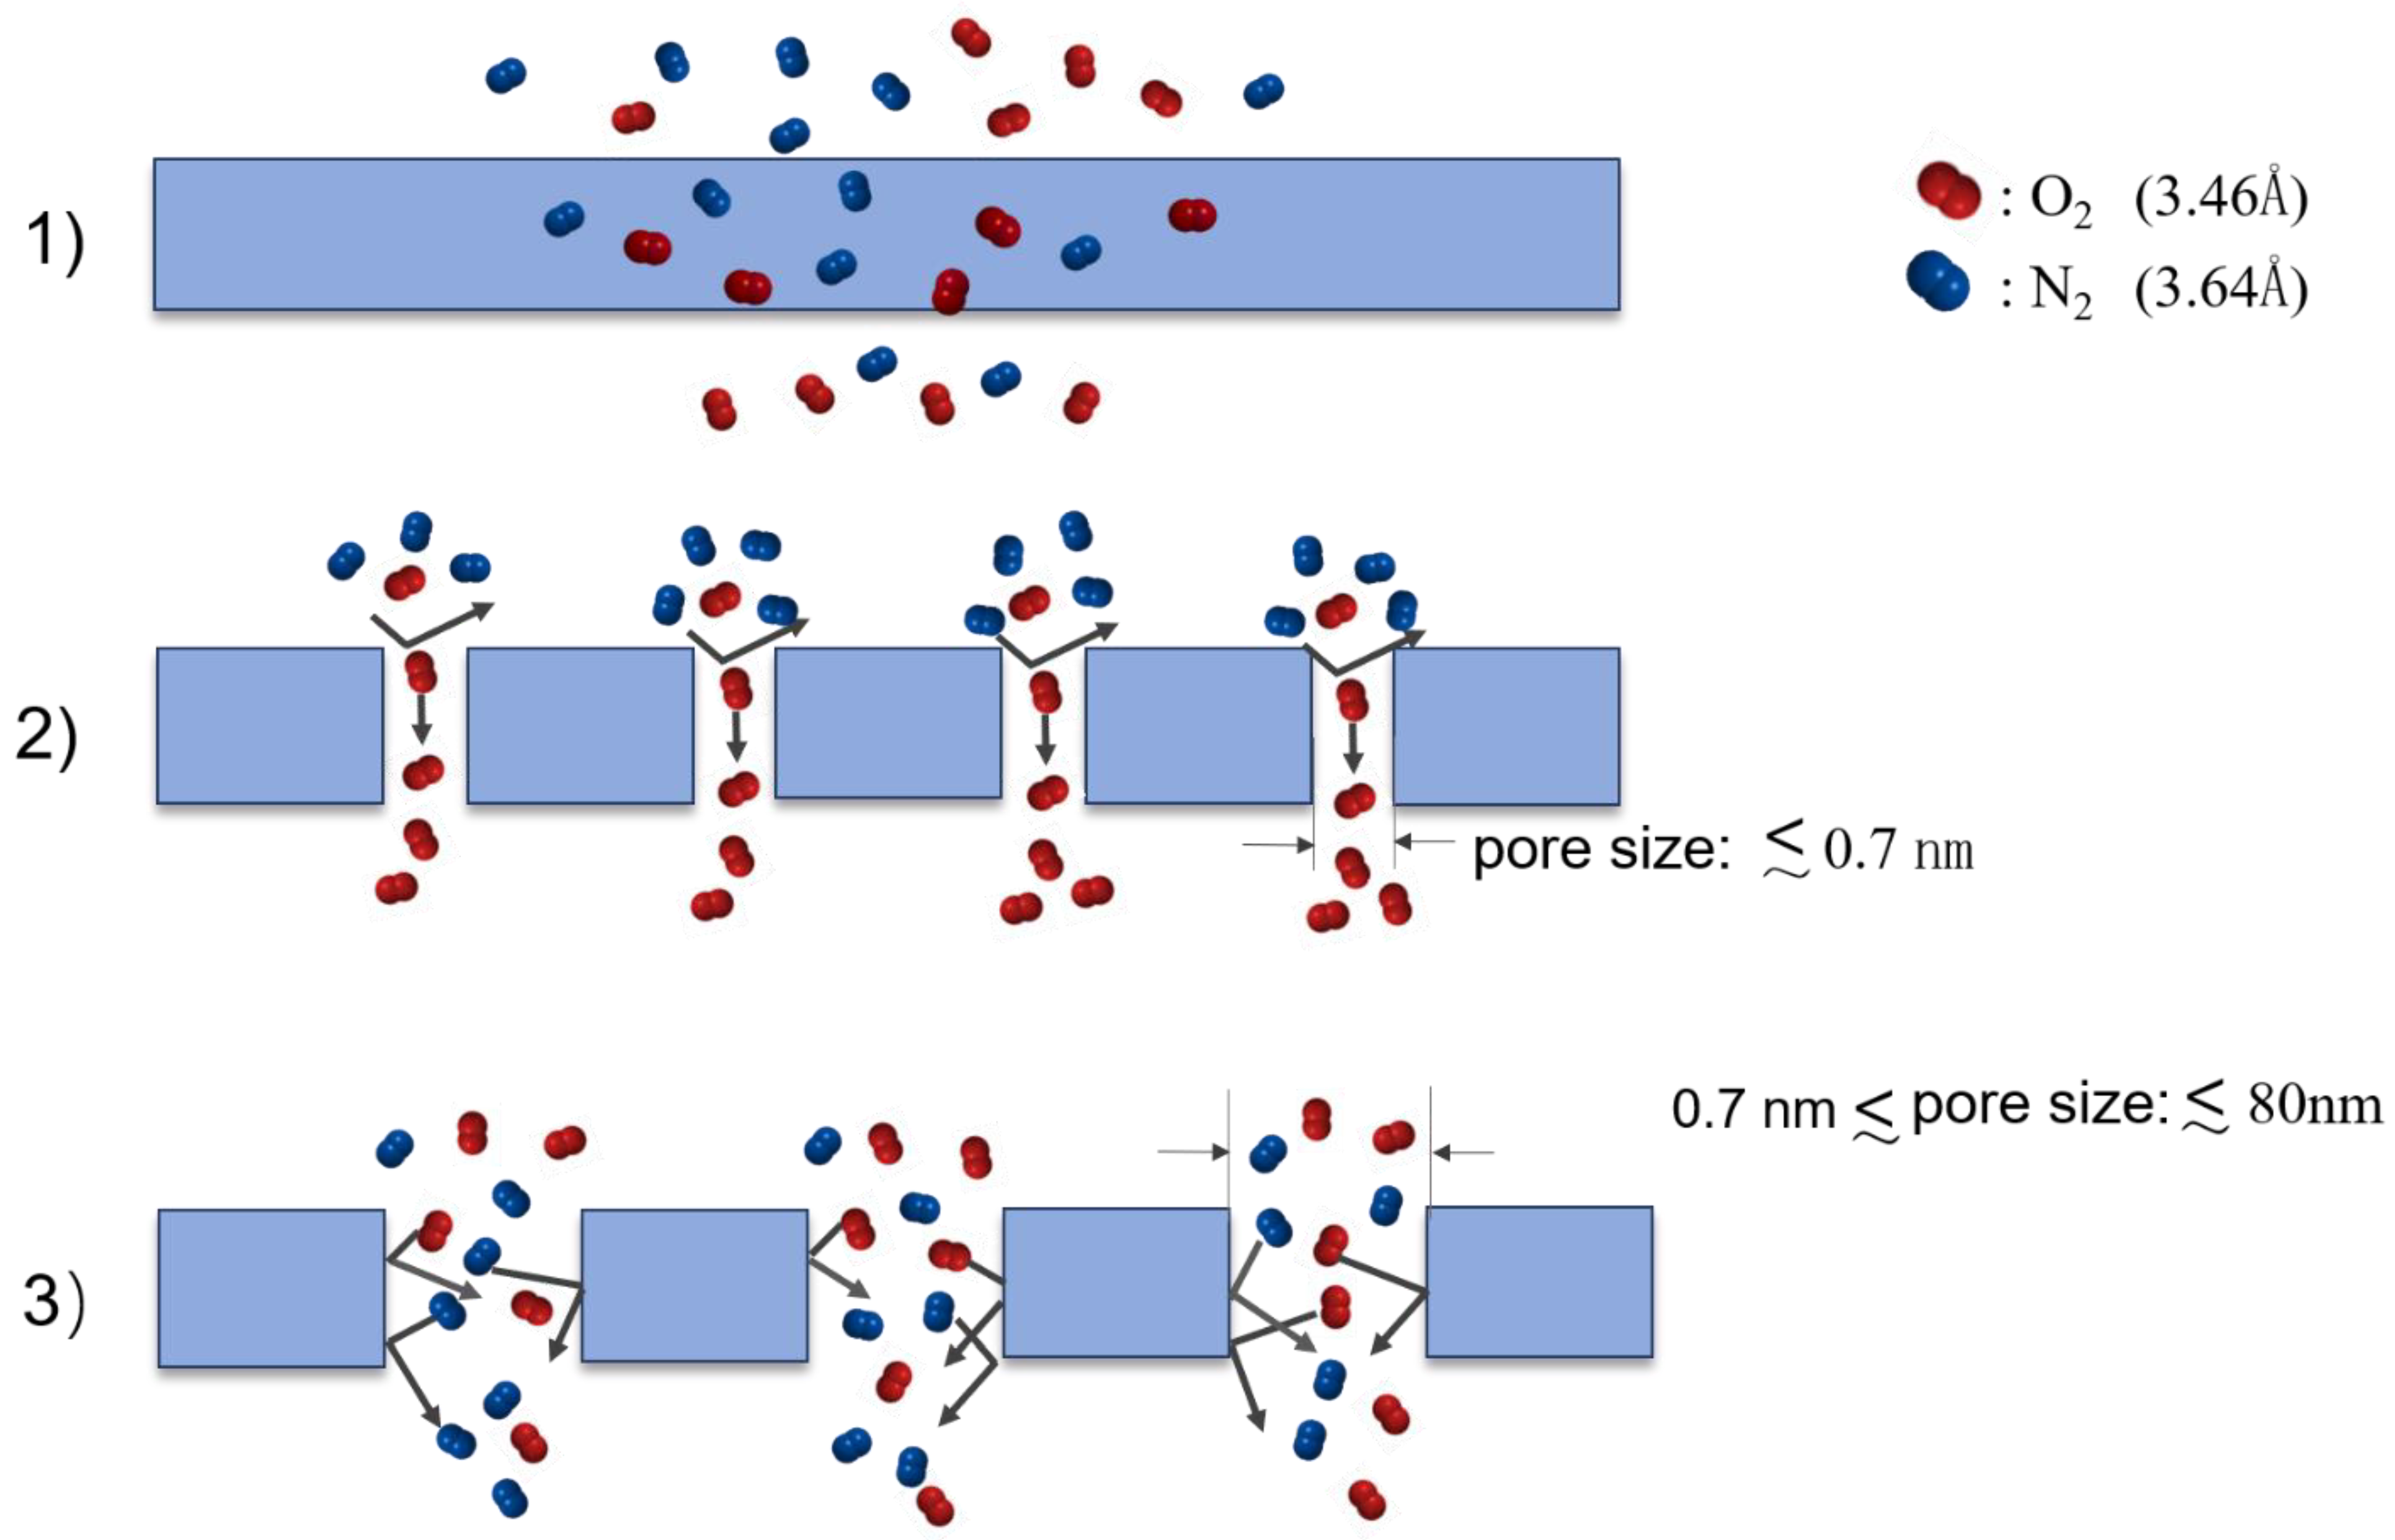
1.3. Mechanisms of Gas Permselective Membranes (Figure 1)
1.3.1. Solution-Diffusion (SD) Mechanism for Dense (Non-Porous) Membranes
1.3.2. Molecular-Sieving (MS) Mechanism for Ultramicroporous and Microporous Membranes
1.3.3. Knudsen (Kd) Mechanism for Microporous and Mesoporous Membranes
1.3.4. Transition Range between the Solution-Diffusion (SD) Mechanism for Dense (Non-Porous) Membranes, the Molecular-Sieving (MS) Mechanism for Ultra-Microporous Membranes, and the Knudsen (Kd) Mechanism for Microporous and Mesoporous Membranes
1.4. Robeson’s and Pinnau’s Upper Bound Lines
1.4.1. Existence of Upper Bound Lines in Selectivity-Permeability Plots
1.4.2. Meaning of the Upper Bound Lines—The Slope and Intercept
1.4.3. History of the Upper Bound Lines—From 1991 via 2008 to 2015
1.4.4. Aging Problems for Ultrahigh Permeable Polymers
1.4.5. Advantages and Disadvantages of Polymers as Materials for Oxygen/Nitrogen Permselective Membranes
1.5. Purposes of This Review
2. Macromolecular Design for Oxygen/Nitrogen Permselective Membranes—Top-Performing Polymers
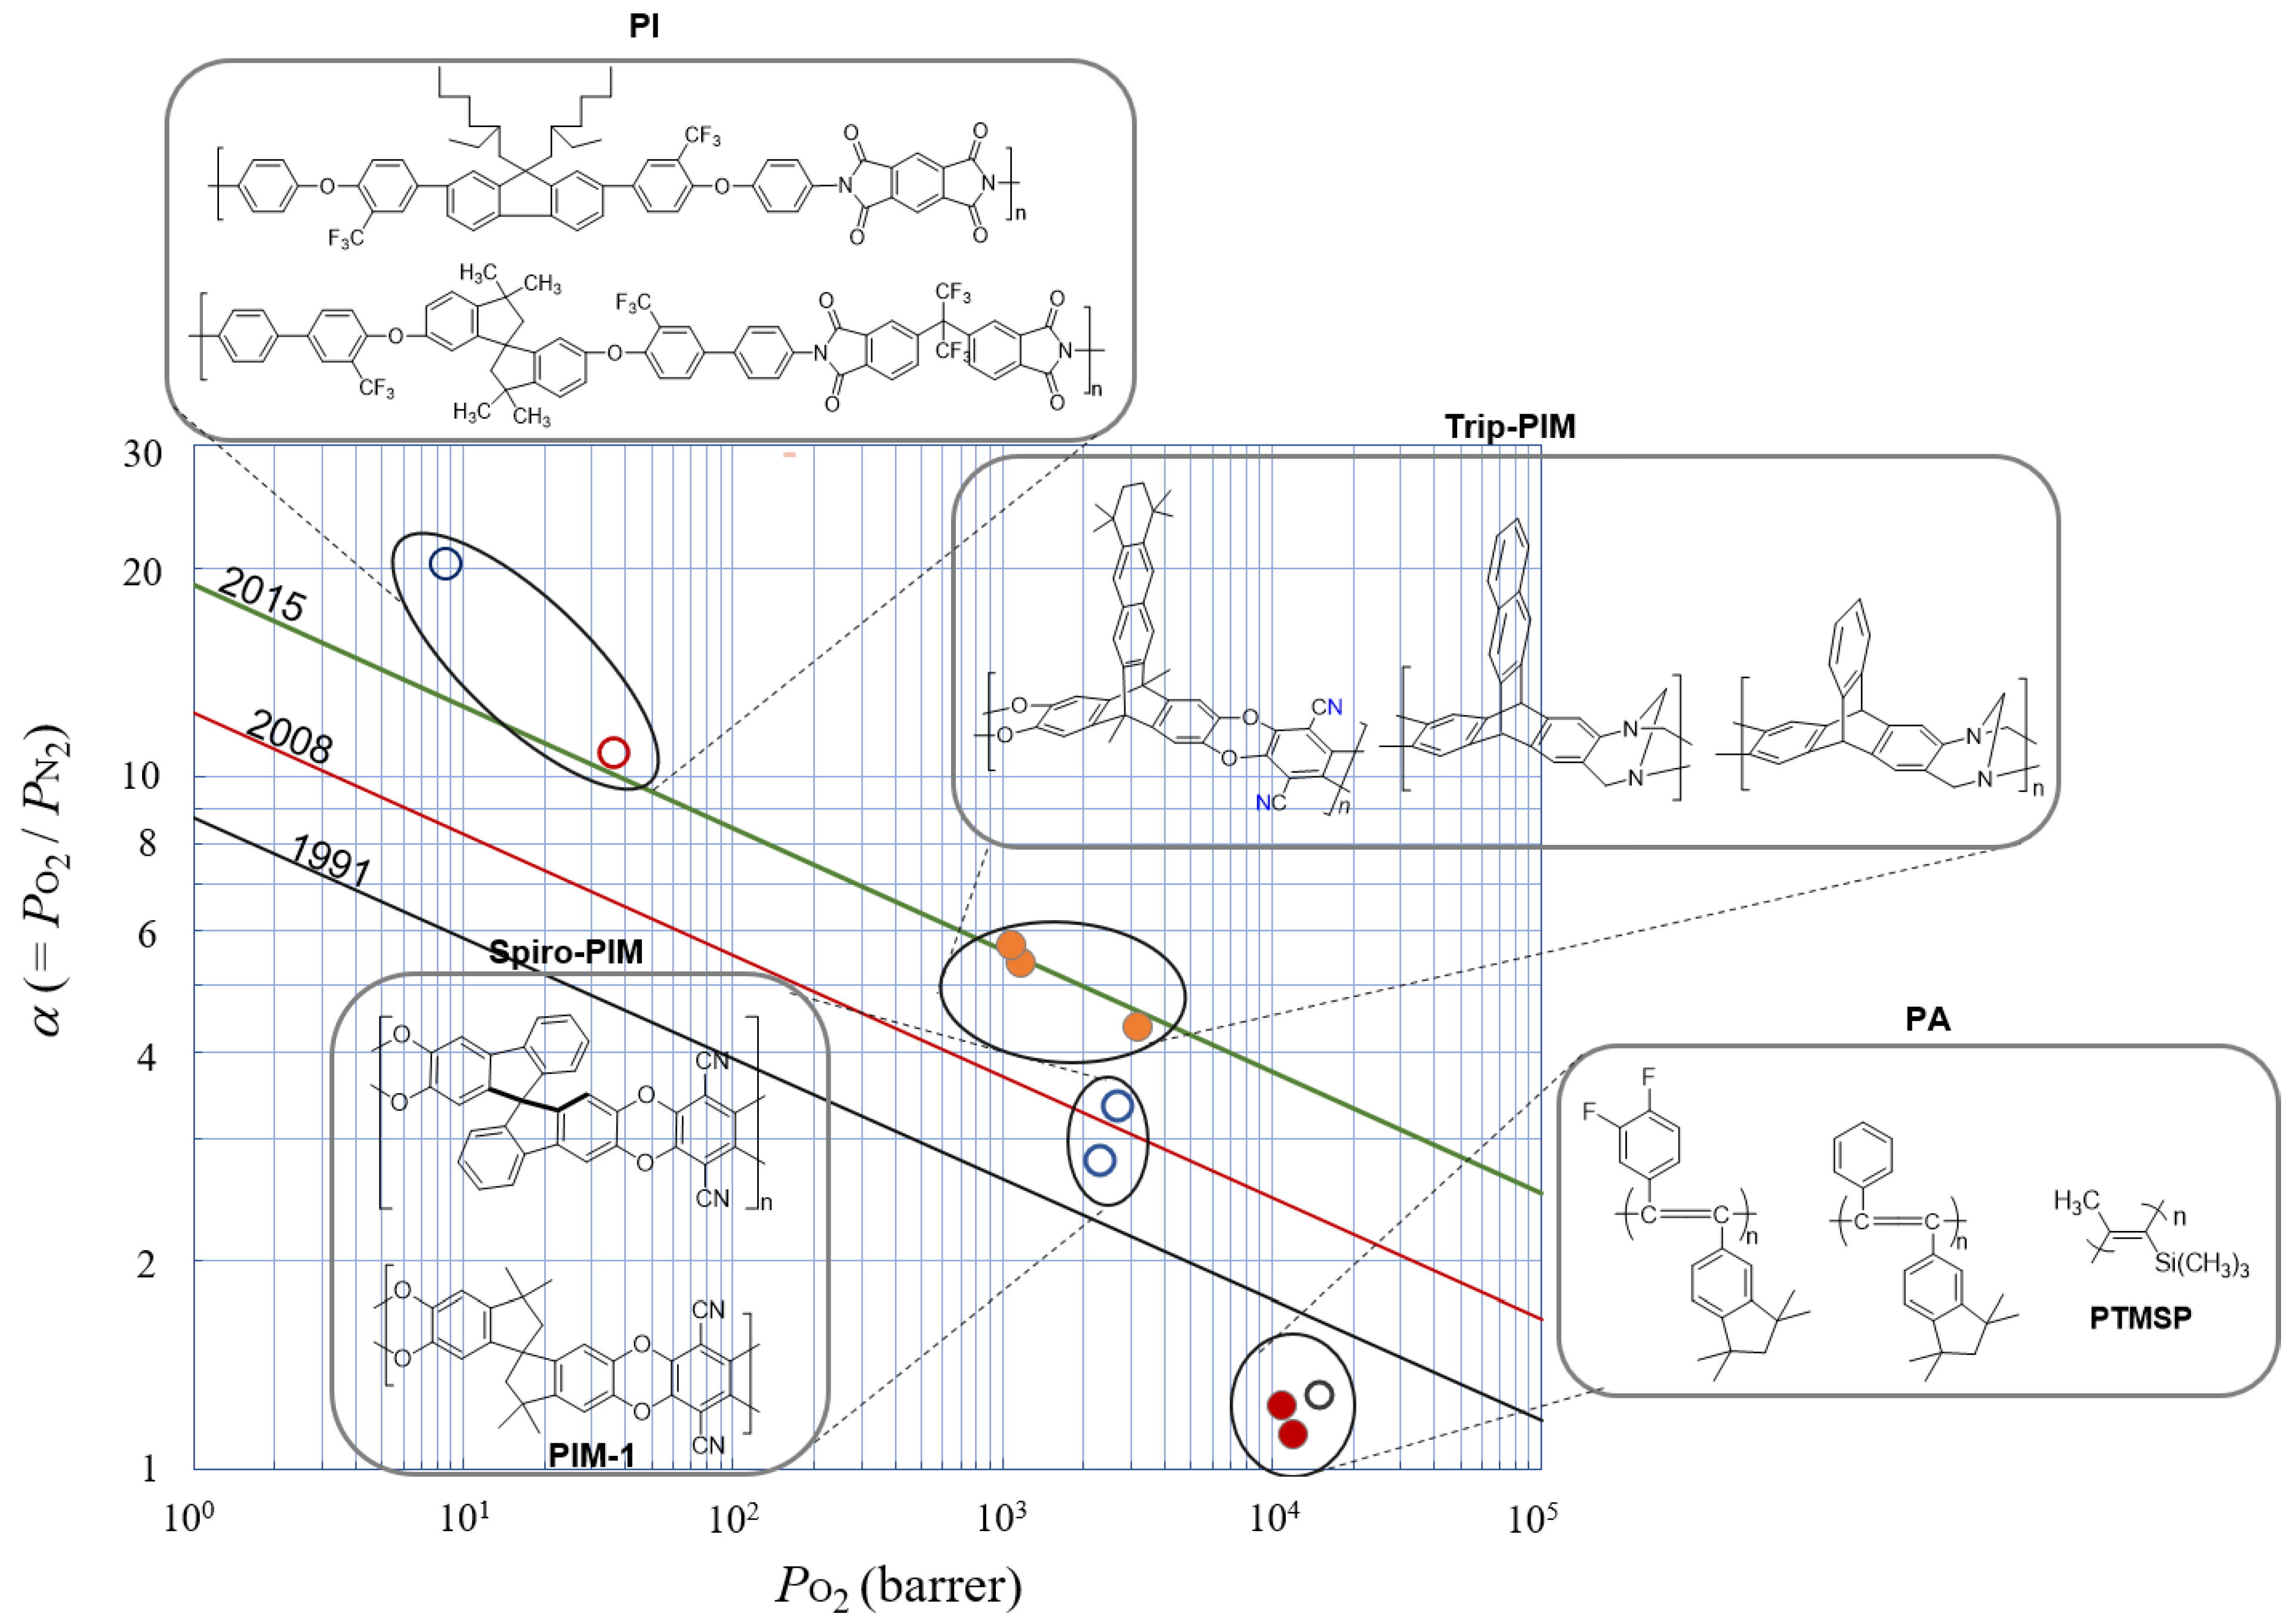
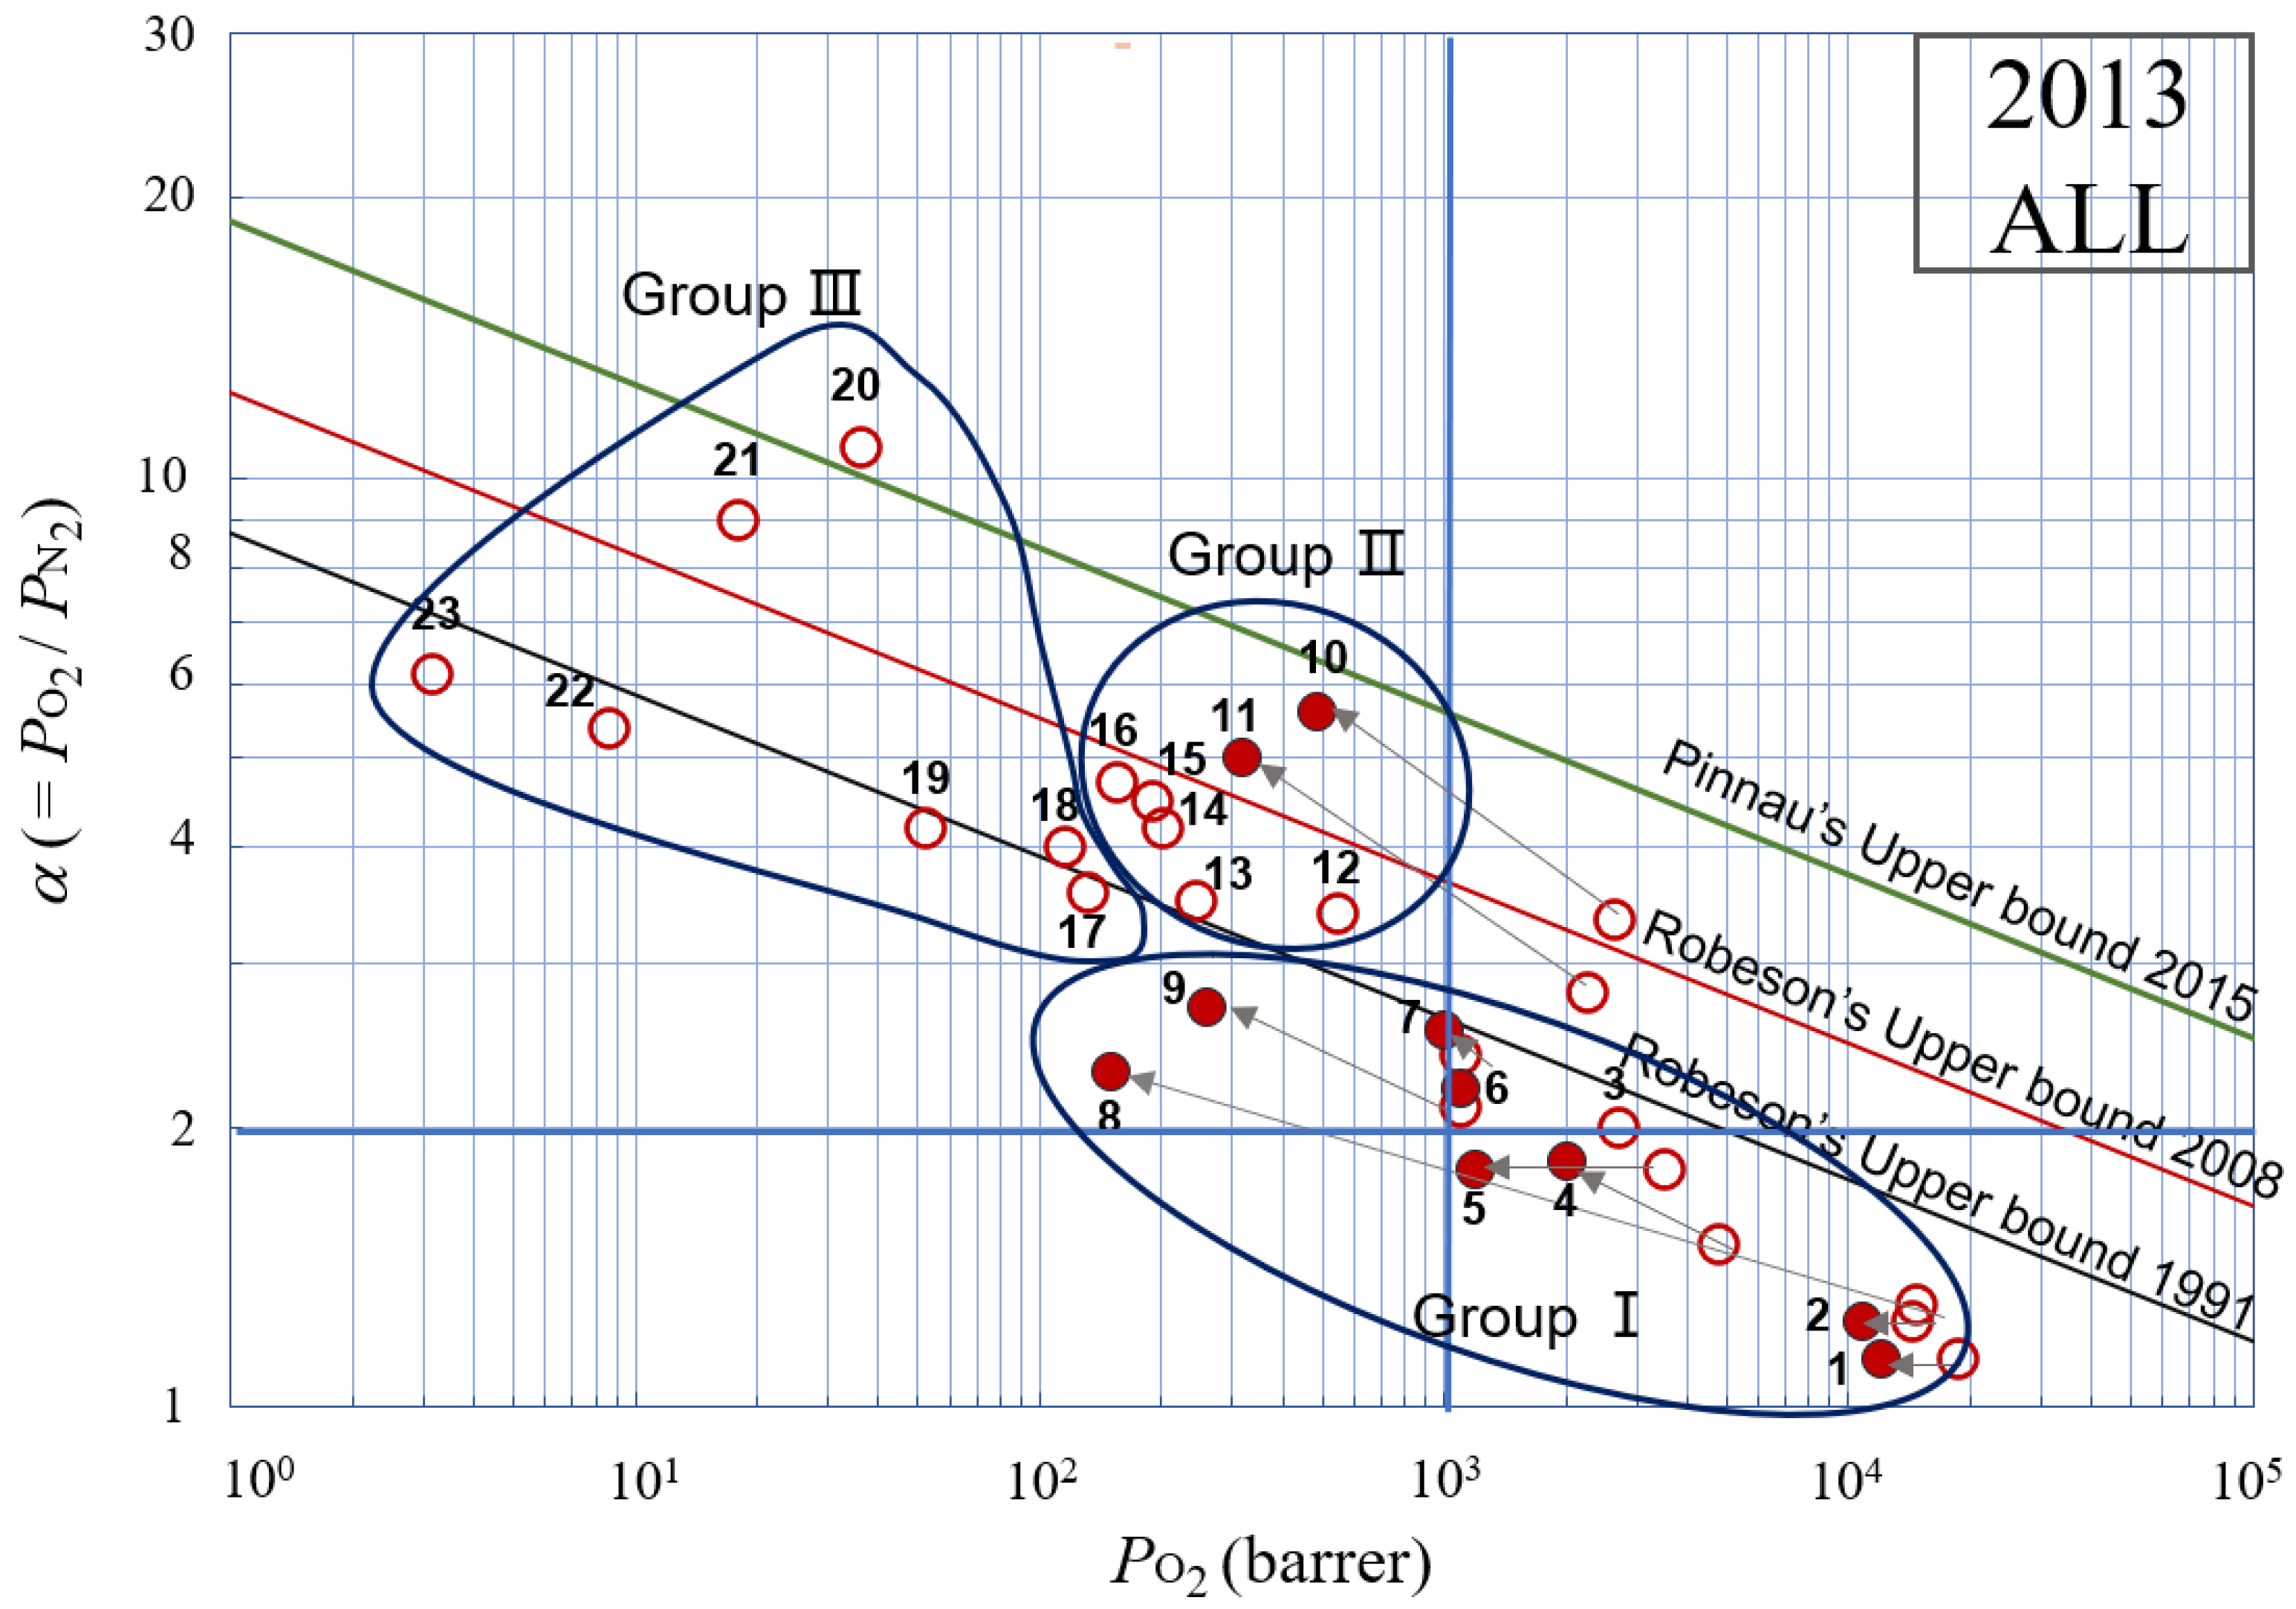
2.1. Top-Performing Polymers until 2013 as Oxygen/Nitrogen Permselective Membranes
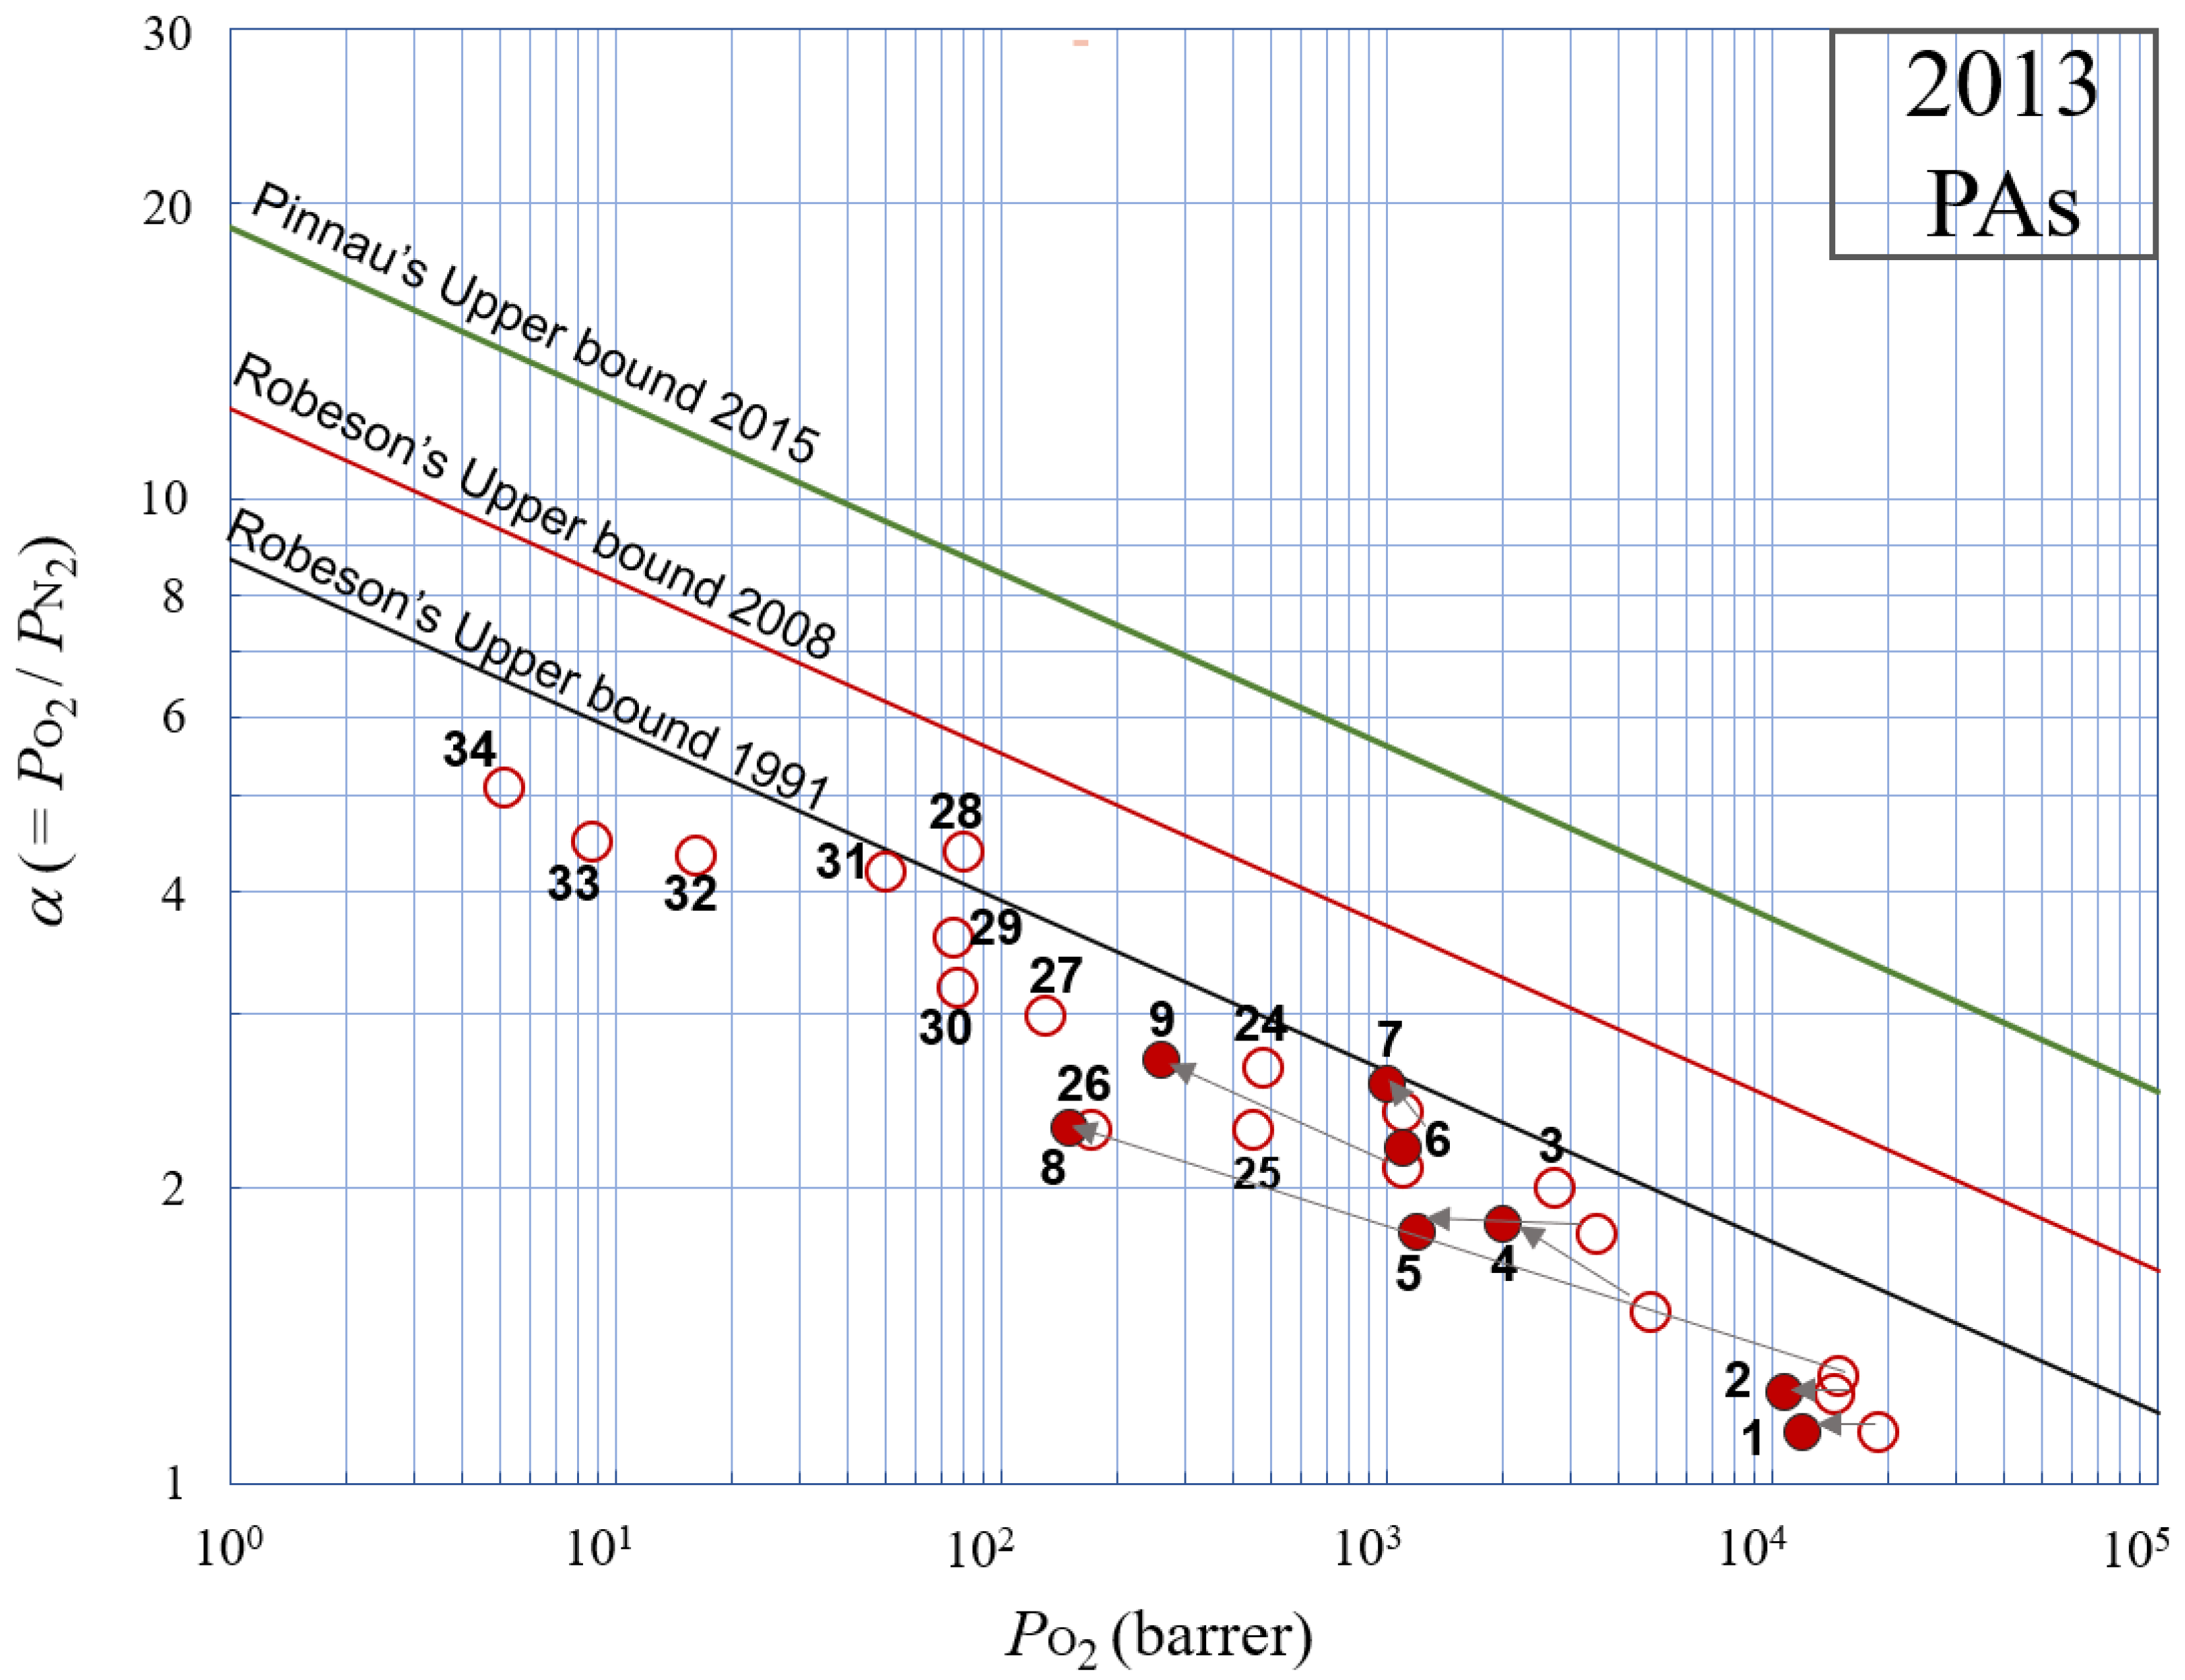
2.1.1. Poly(Substituted Acetylene)s (PAs) (Group I: Polymers 1–9 in Chart 1 and Figure 3, and Polymers 24–34 in Chart 2 and Figure 4)
2.1.2. Poly(1-Trimethylsilylpropyne) (PTMSP) (an Ultrapermeable Polymer) (Polymer 8 in Figure 3 and Figure 4)
2.1.3. Poly(Diphenylacetylene)s (PDPAs) (Polymers 1, 2, 4–7, and 9 in Chart 1)
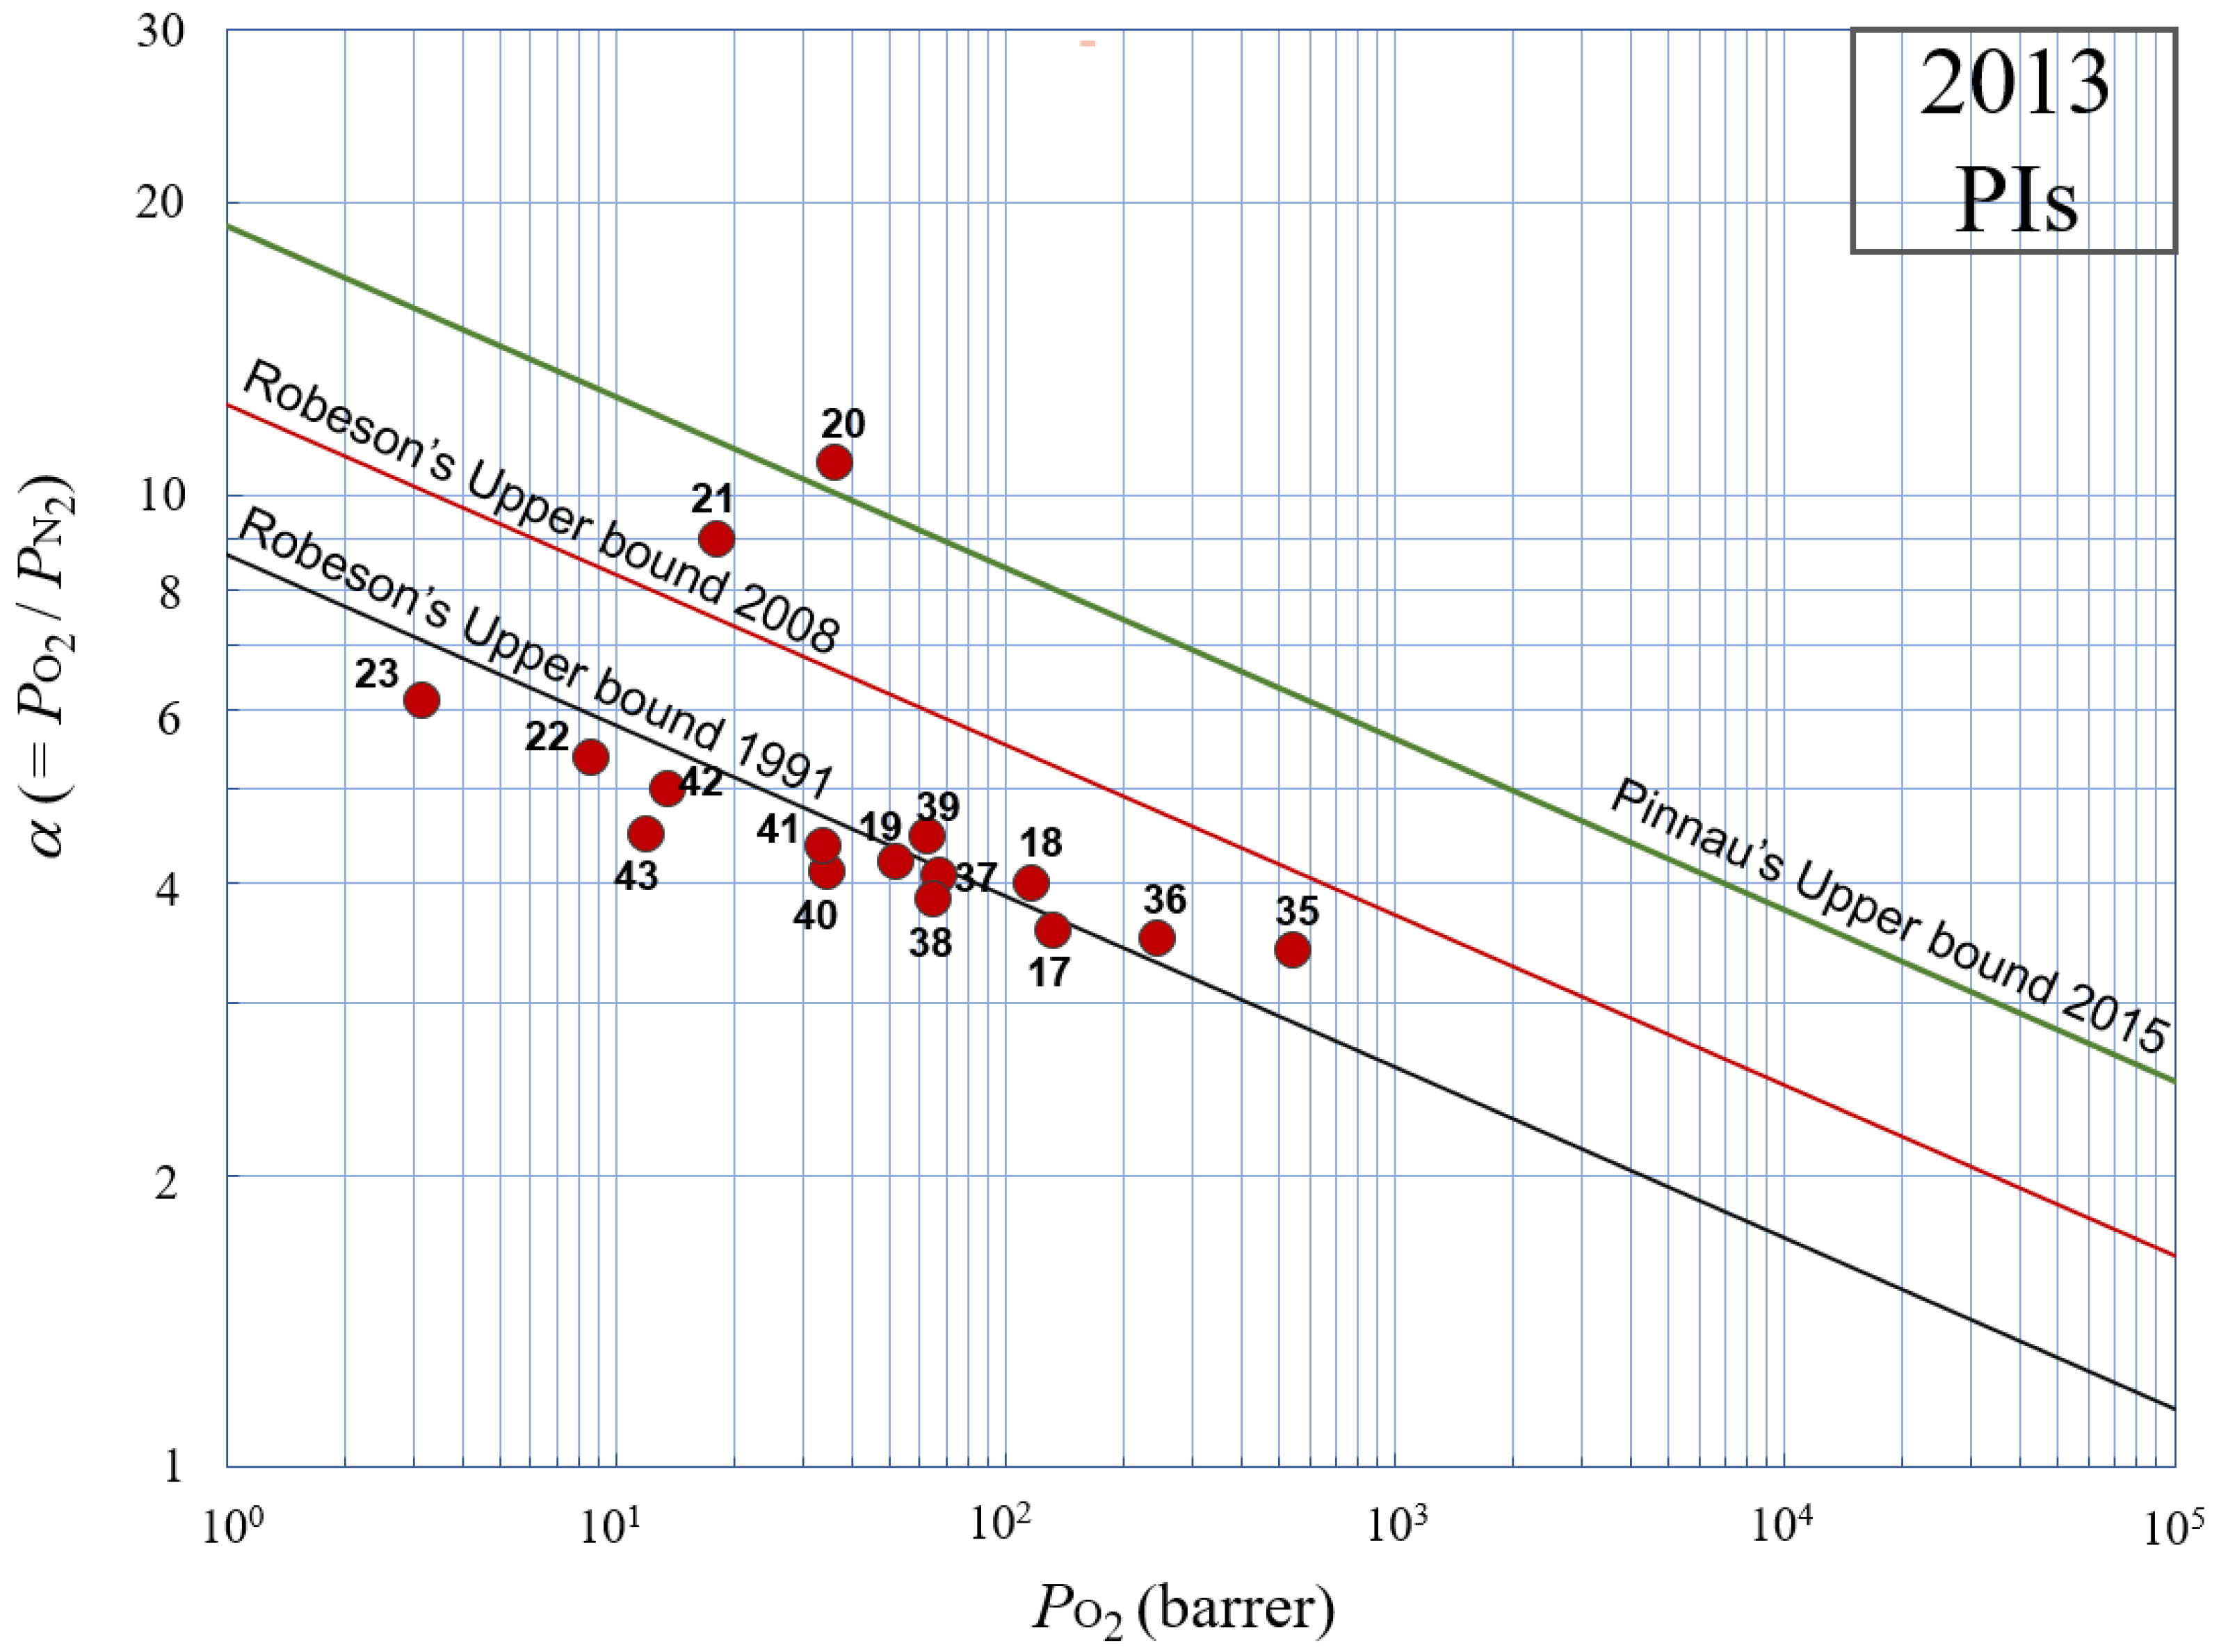
2.1.4. Spiro-PIMs (Polymers of Intrinsic Microporosity with Spirocarbons) (Group II: Polymers 10–16 in Figure 3 and Chart 1)
- (1)
- (2)
- Improved Spiro-PIM (polymers 10 and 15 in Chart 1)
- (3)
- Spiro-PIMs with side groups (modified Spiro-PIMs) (14 and 16 in Chart 1)
- (4)
- Spiro-PIM-PI (12 and 13 in Chart 1)
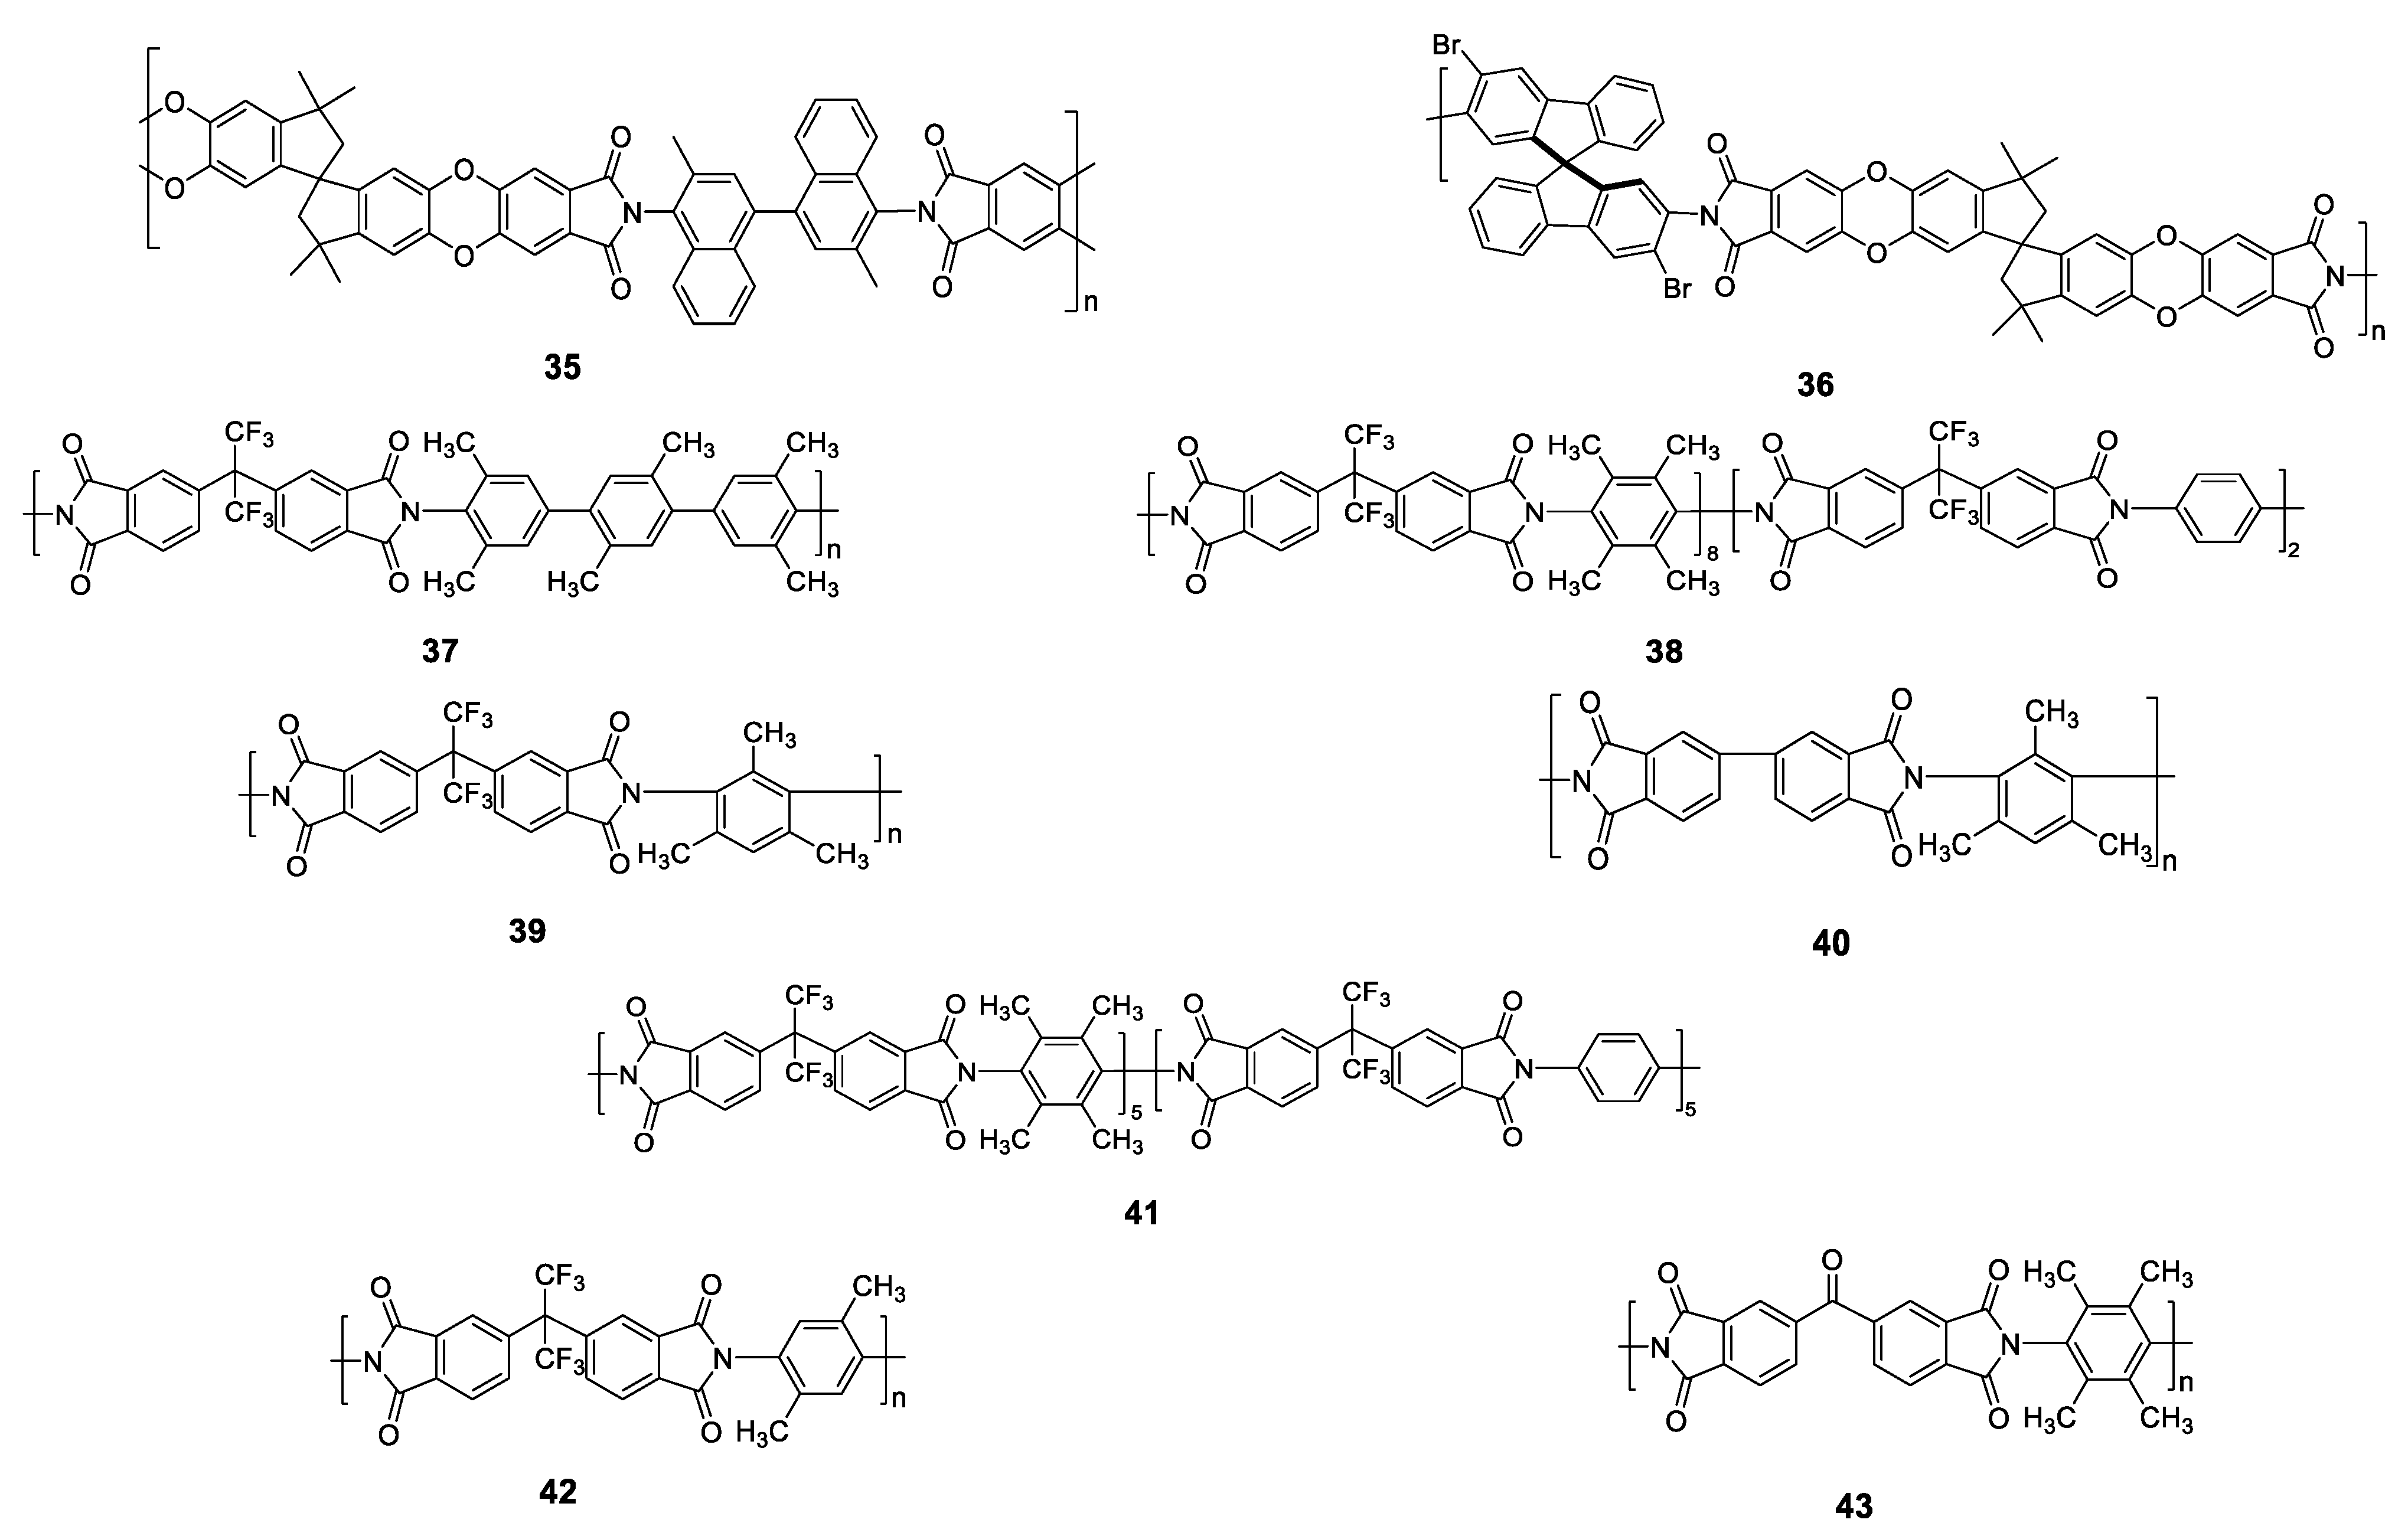
2.1.5. Polyimides (PIs) (Group III: 17–23 in Chart 1 and Figure 3, and 35–43 in Chart 3 and Figure 5)
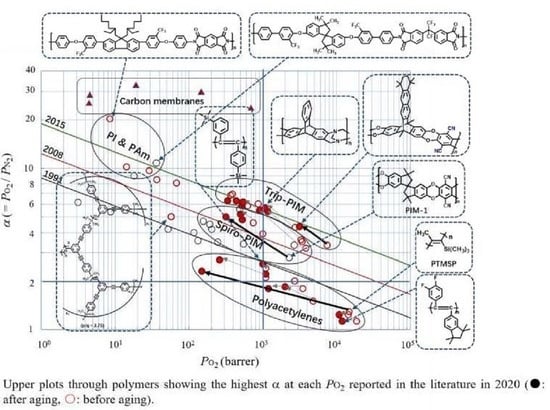
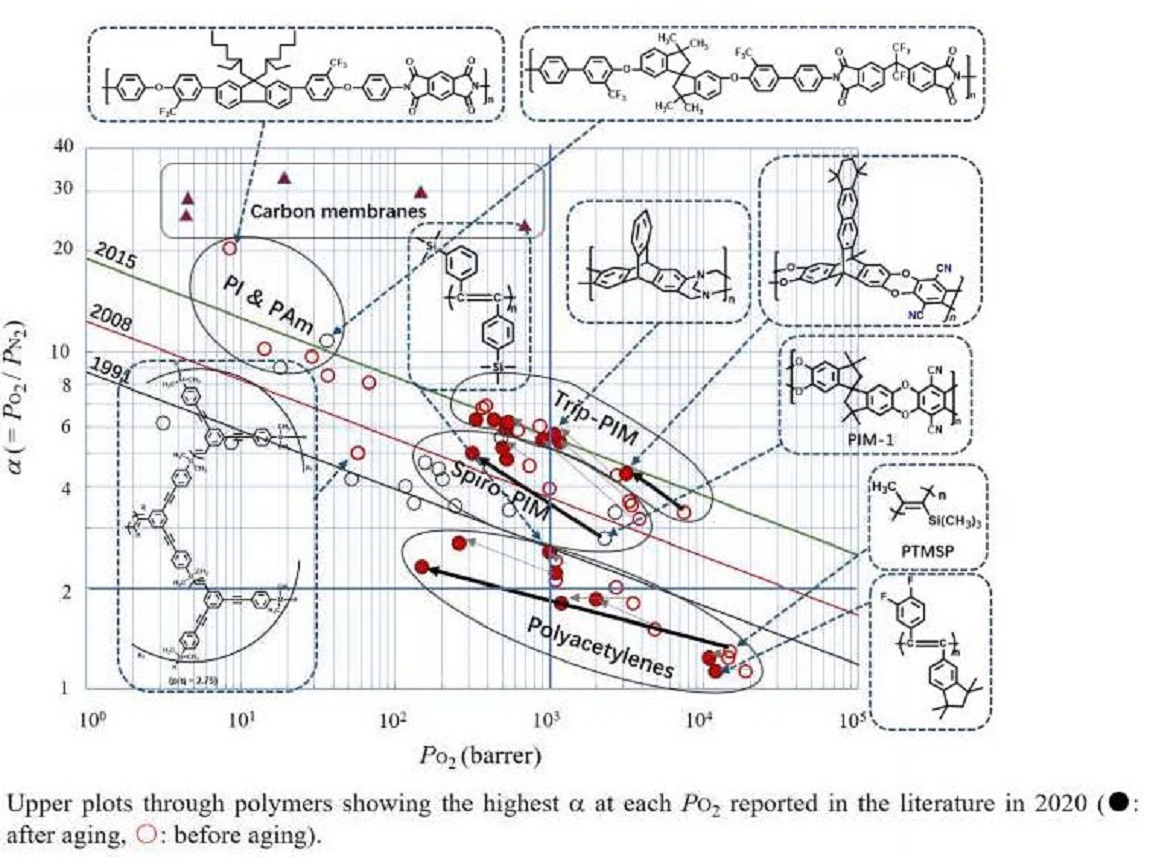
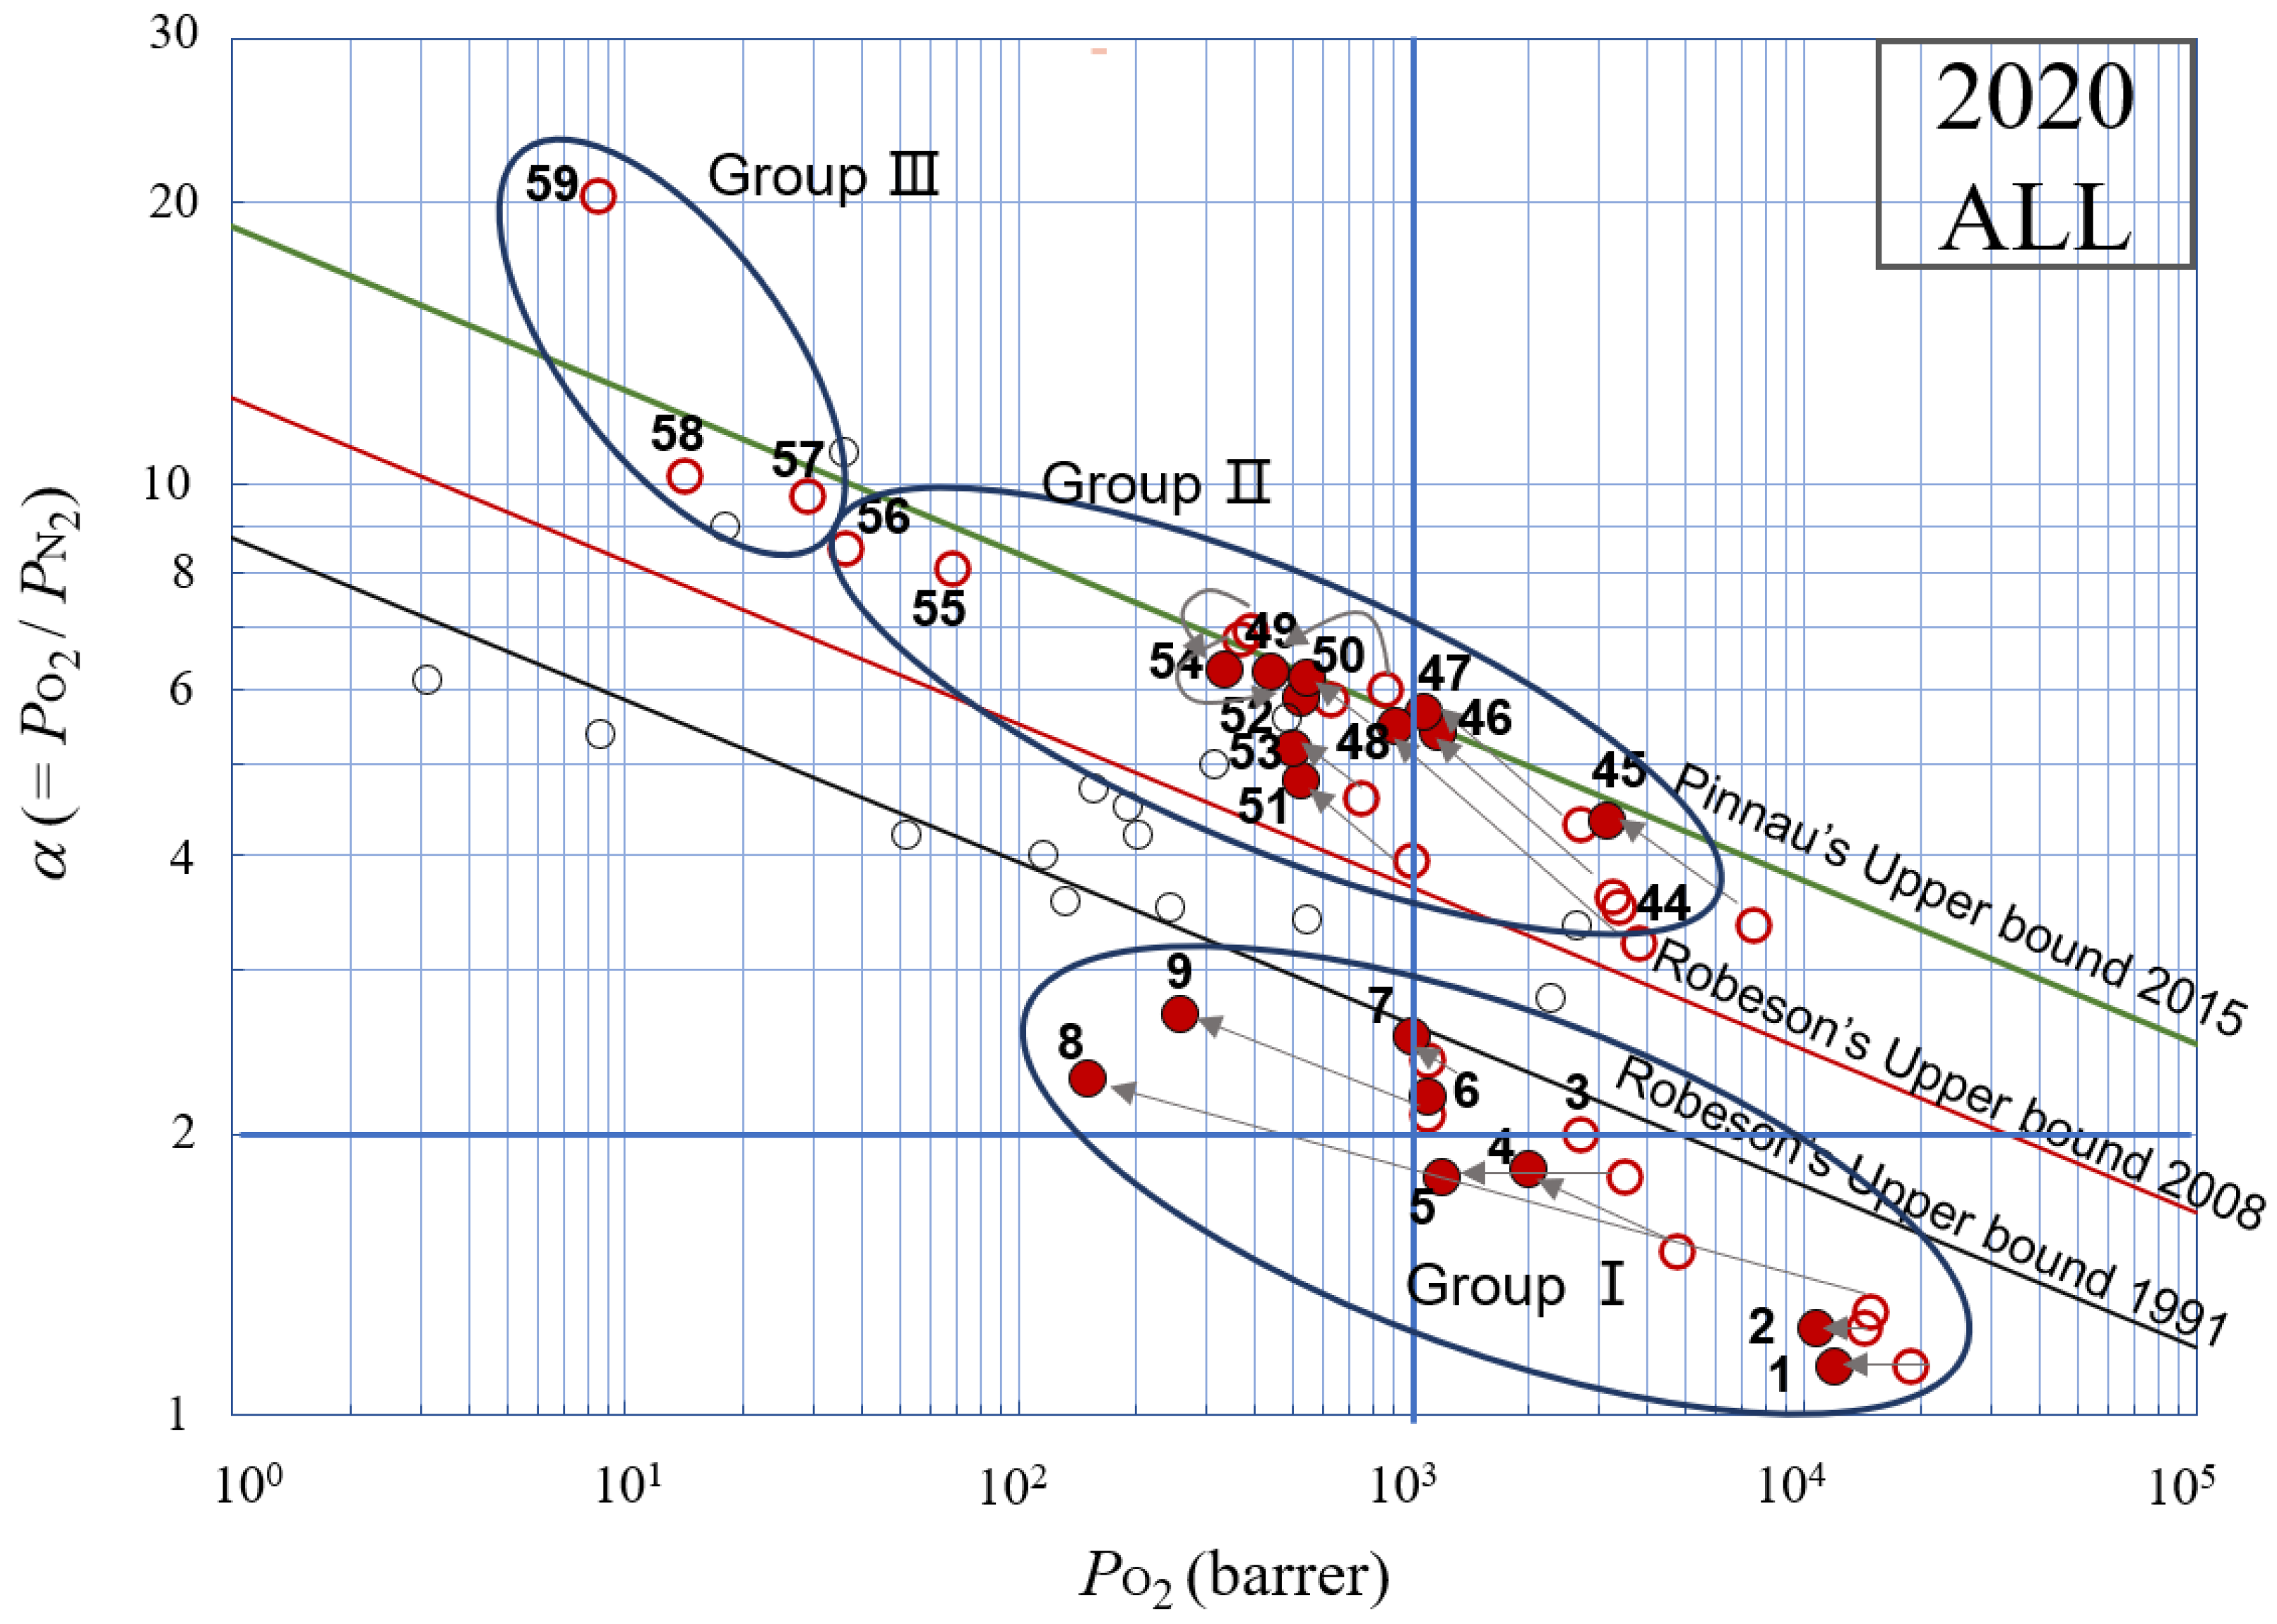
2.2. Top-Performing Polymers in 2020 as Oxygen/Nitrogen Permselective Membranes
2.2.1. Poly(diphenylacetylene)s (PDPAs) and Modified PAs (Group I; 1–9 in Figure 6 and Chart 1)
- (1)
- Poly(diphenylacetylene)s (PDPAs)
- (2)
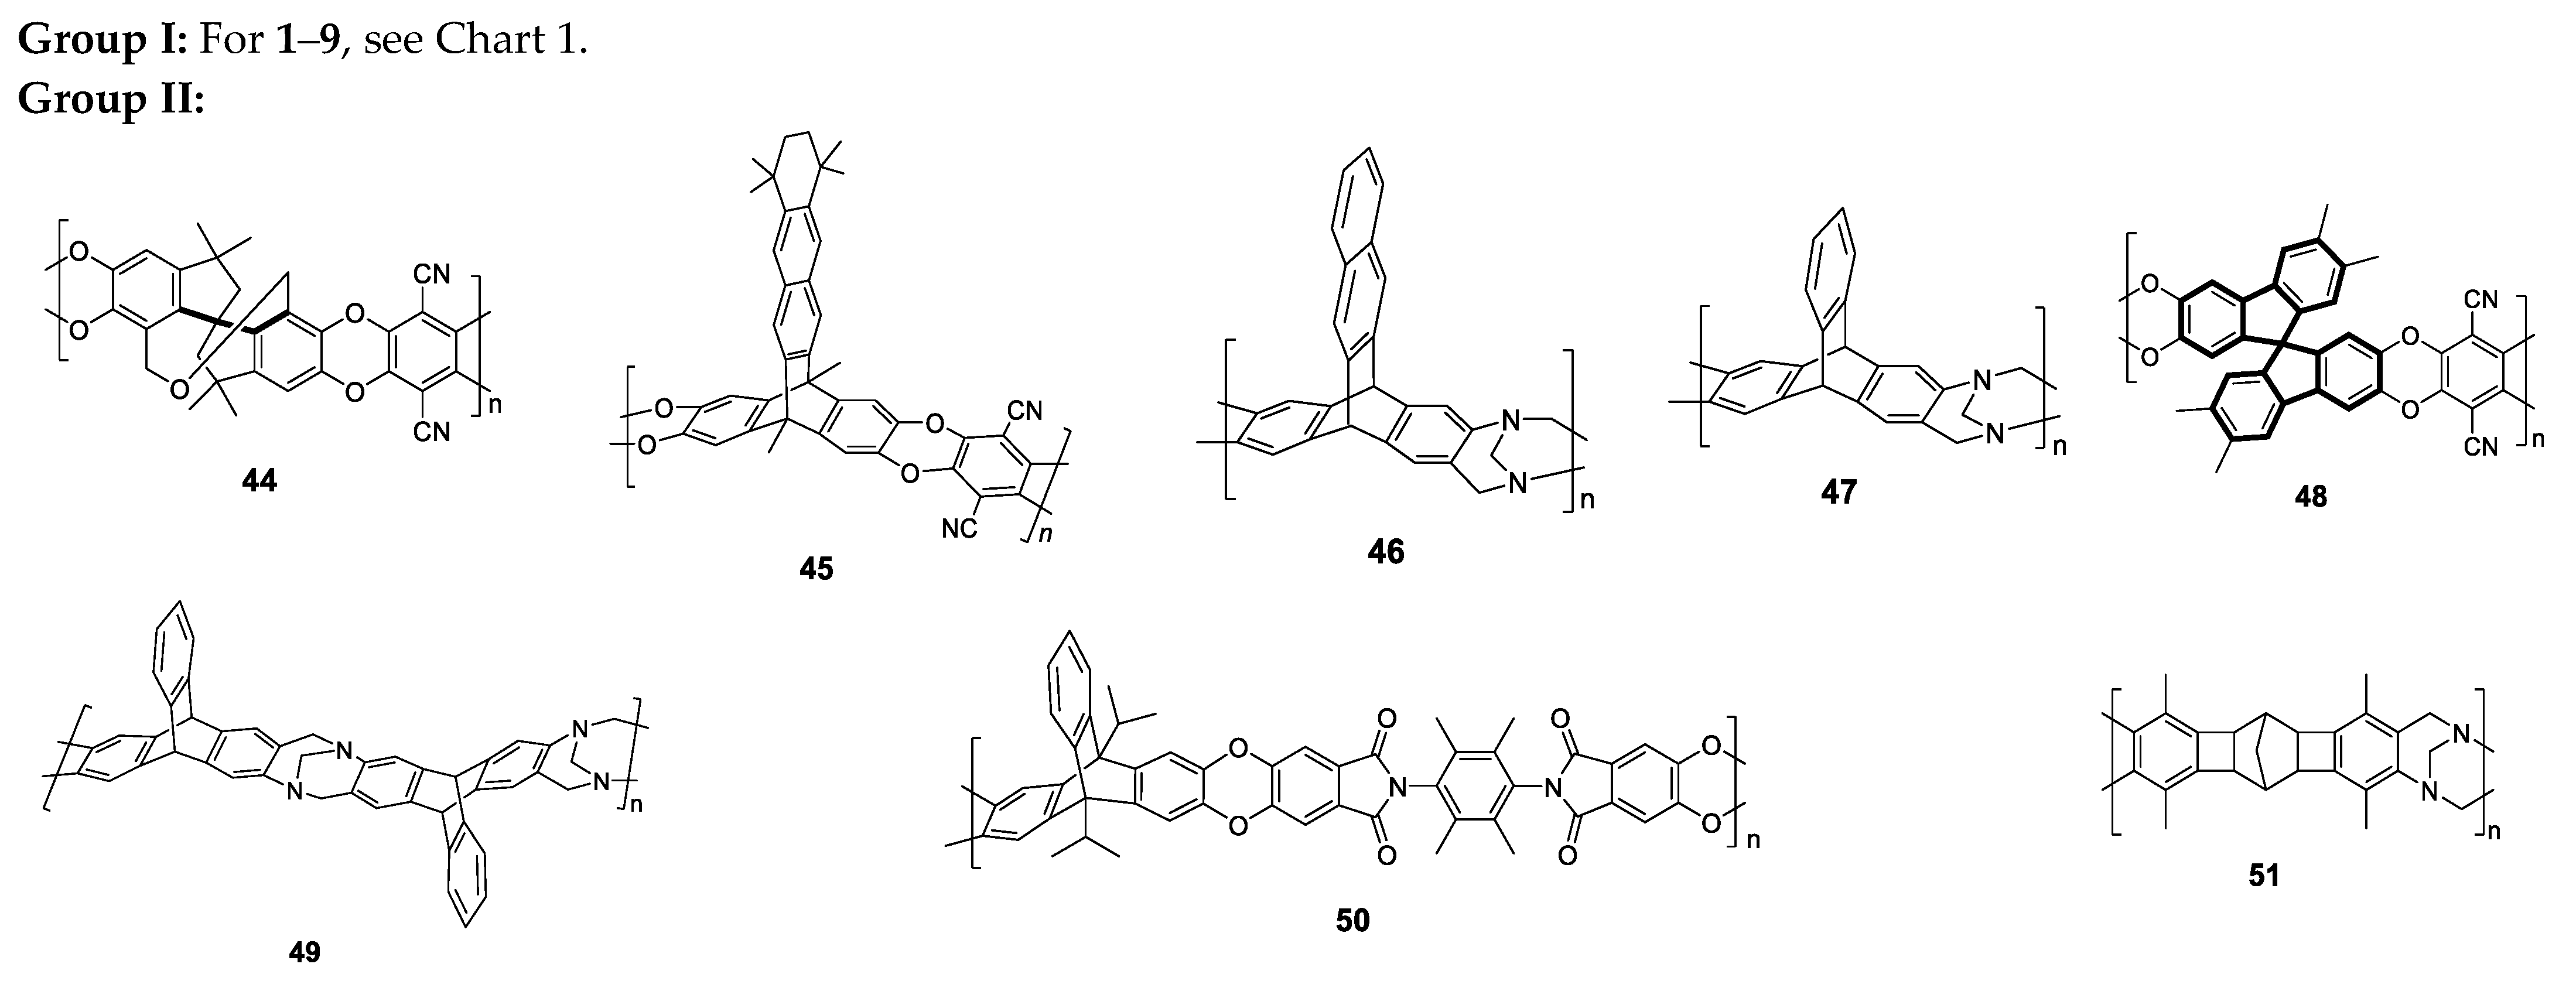
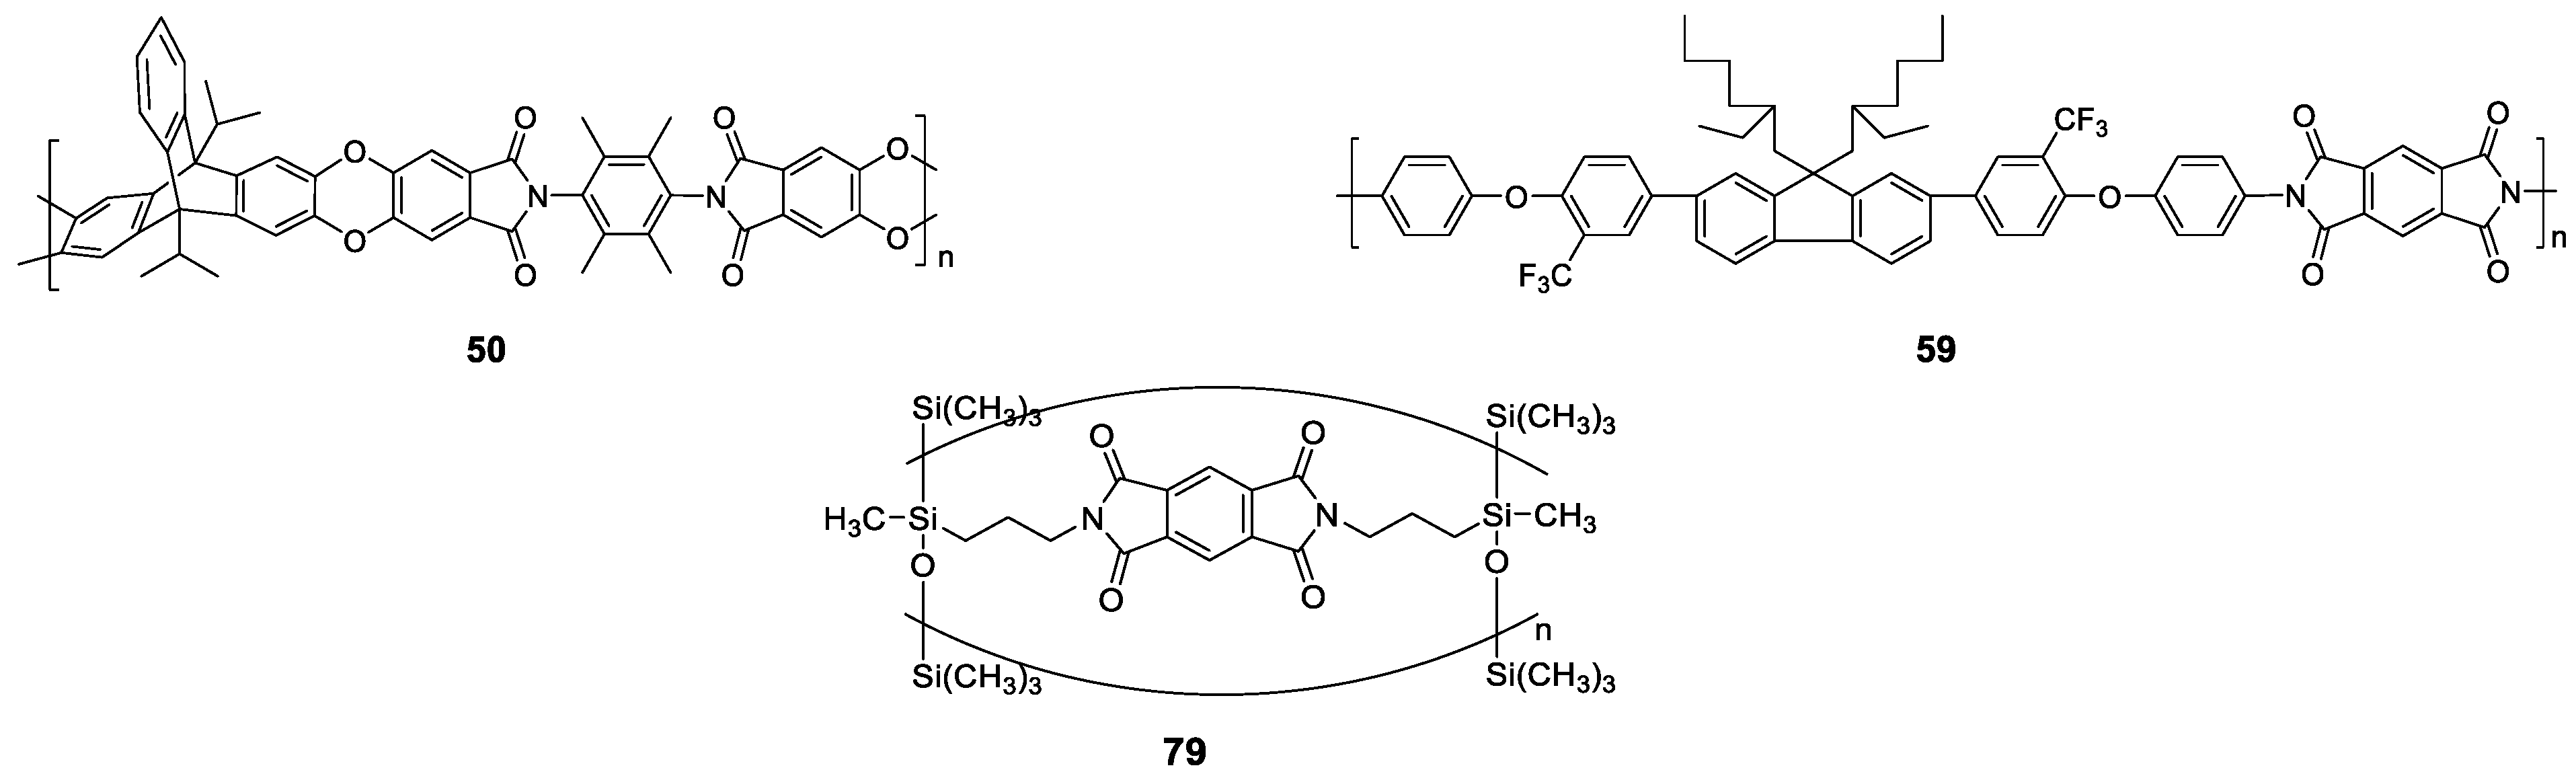
2.2.2. Ladder Polymers with Side Arylene Groups without Spirocarbons and Other Ladder Polymers (Group II; Polymers 44–56 in Figure 6 and Chart 4)
- (1)
- Ladder polymers with side arylene groups without spirocarbons (Trip-PIMs)
- (2)
- PIs with Trip
- (3)
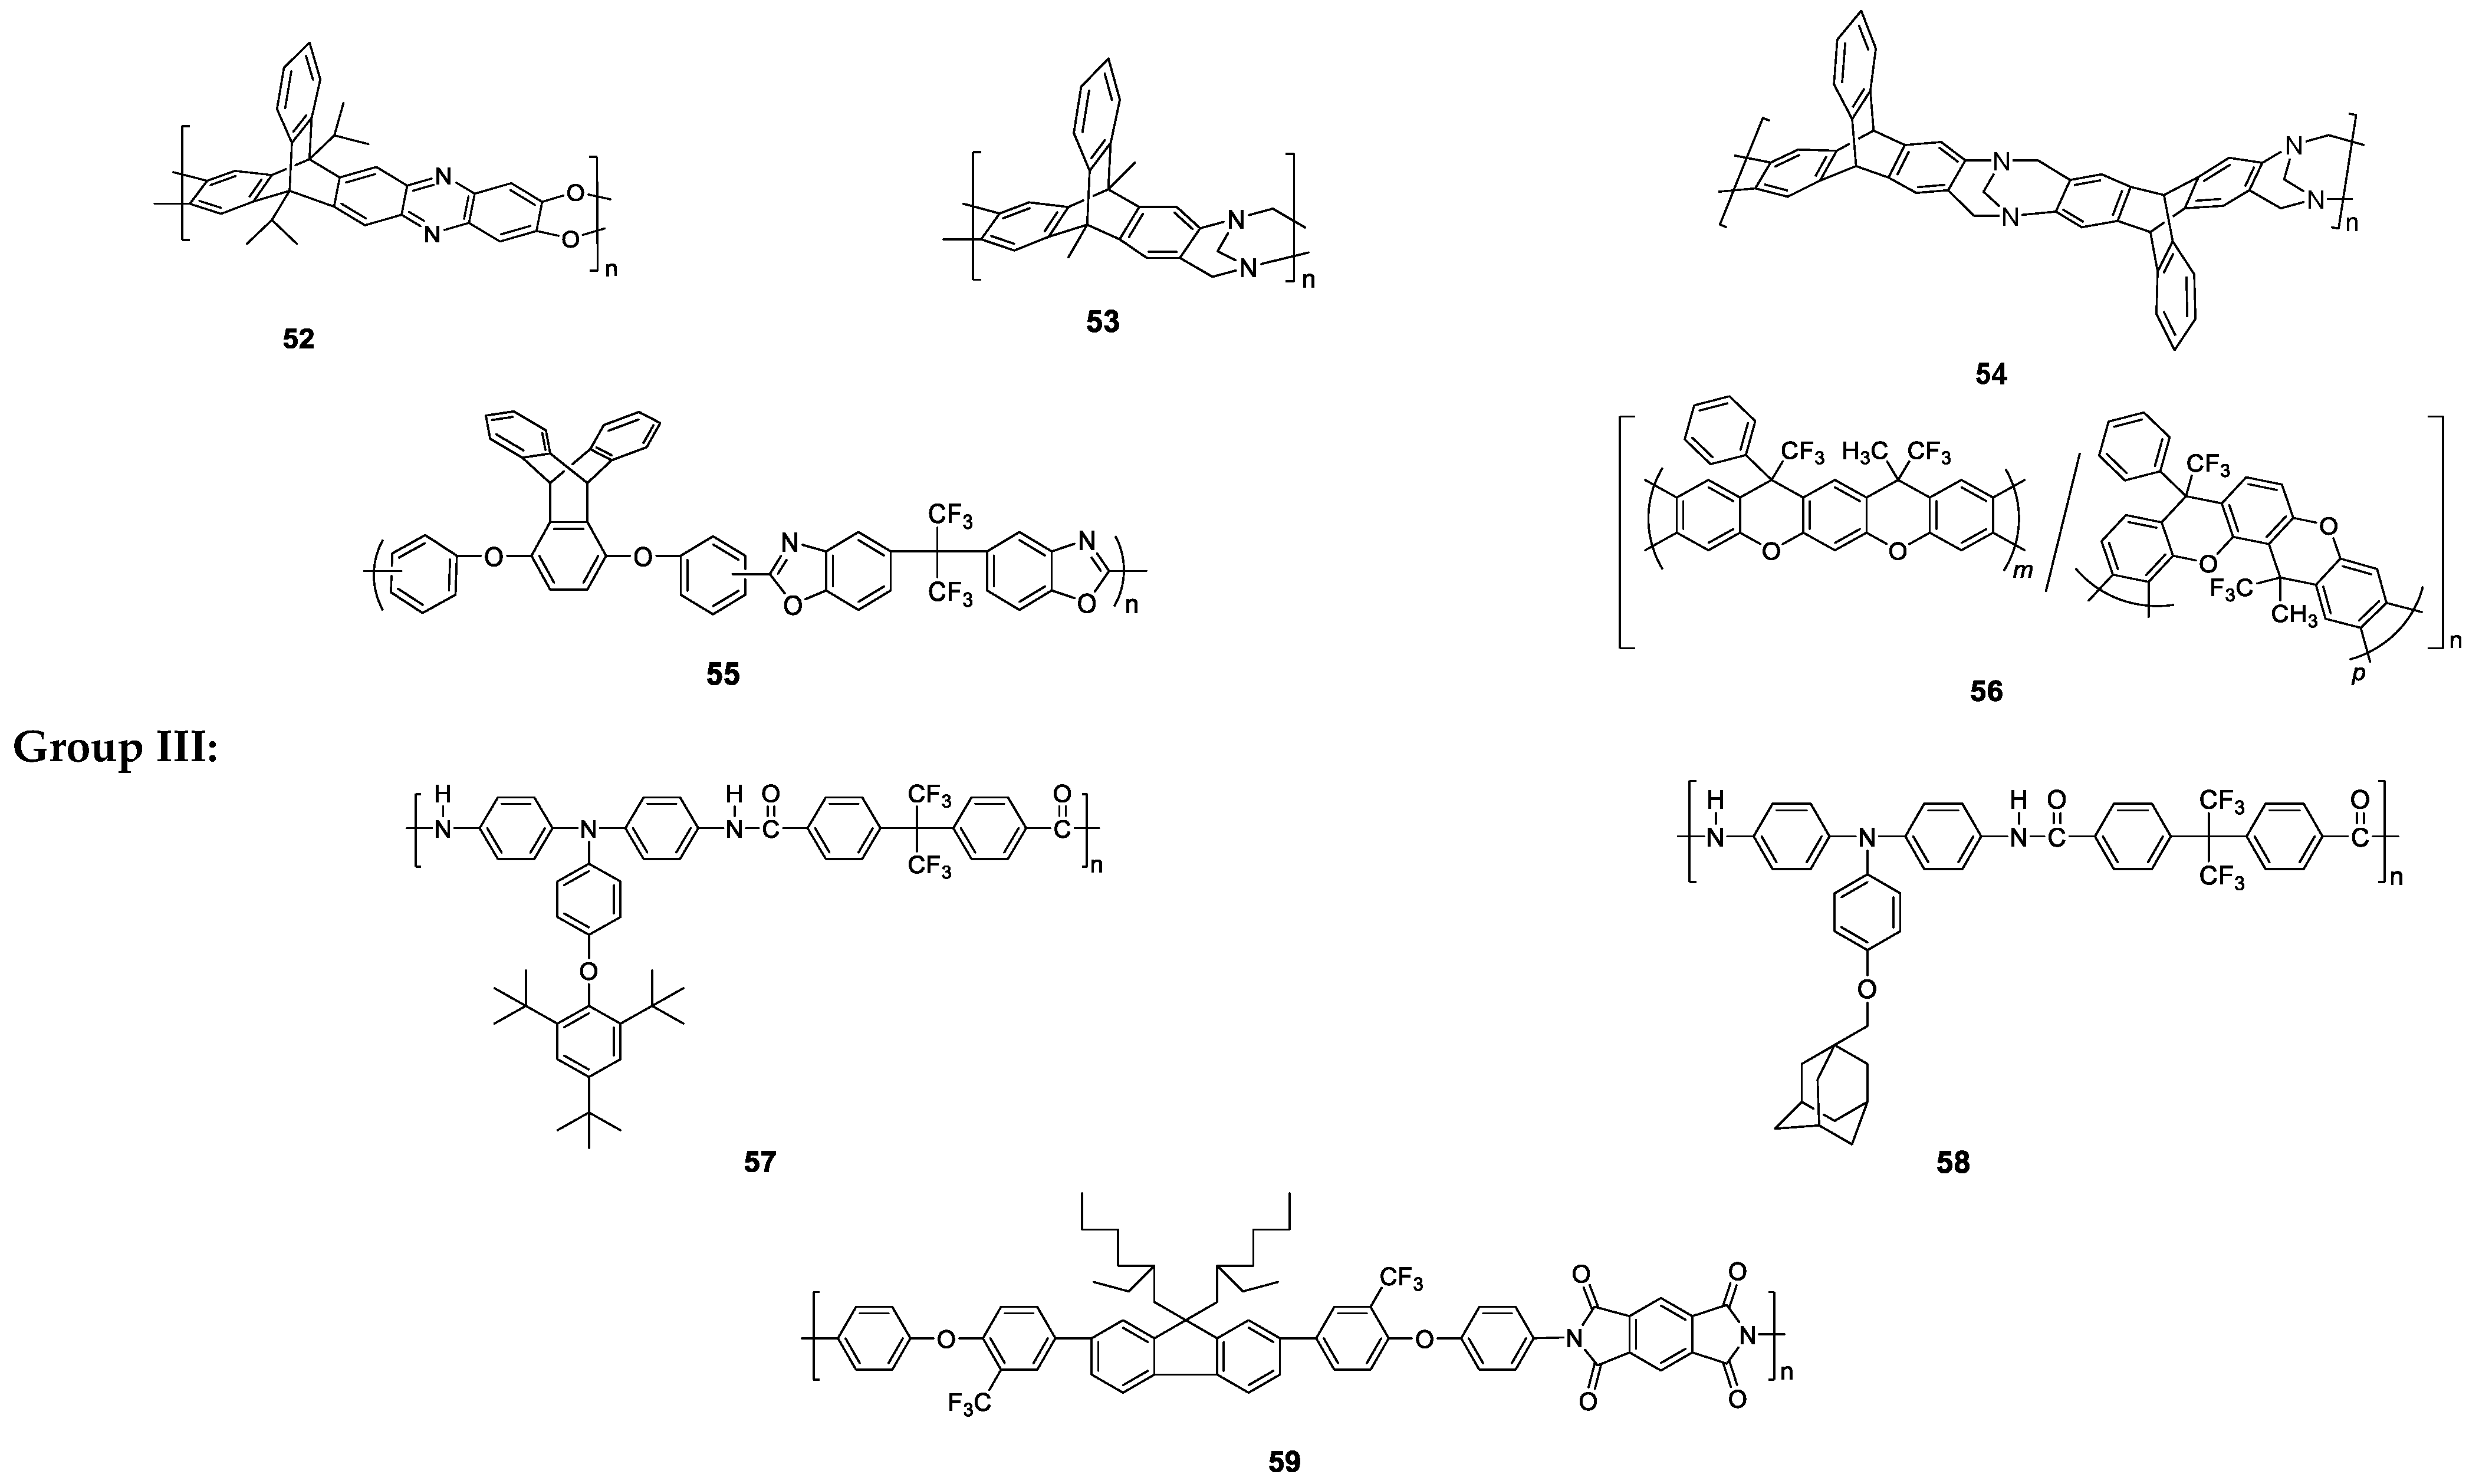
- Other ladder polymers
- (4)
- Modified Spiro-PIMs
2.2.3. PI or Polyamides (PAms) with Bulky Side Groups (Group III, 57–59 in Figure 6 and Chart 4)
2.3. Tendency of Change in Oxygen Permeation Performances by Changing Chemical Structures of Polymers
- Changing their backbone structures:
- (1)
- (2)
- (3)
- (4)
- (5)
- (6)
- (7)
- II.
- Changing their side groups:
- (8)
- (9)
- (10)
- (11)
- (12)
3. Simultaneous Improvements of Selectivity and Permeability of Polymer Membranes
3.1. Polymer Modification by Thermal Polymer Reactions
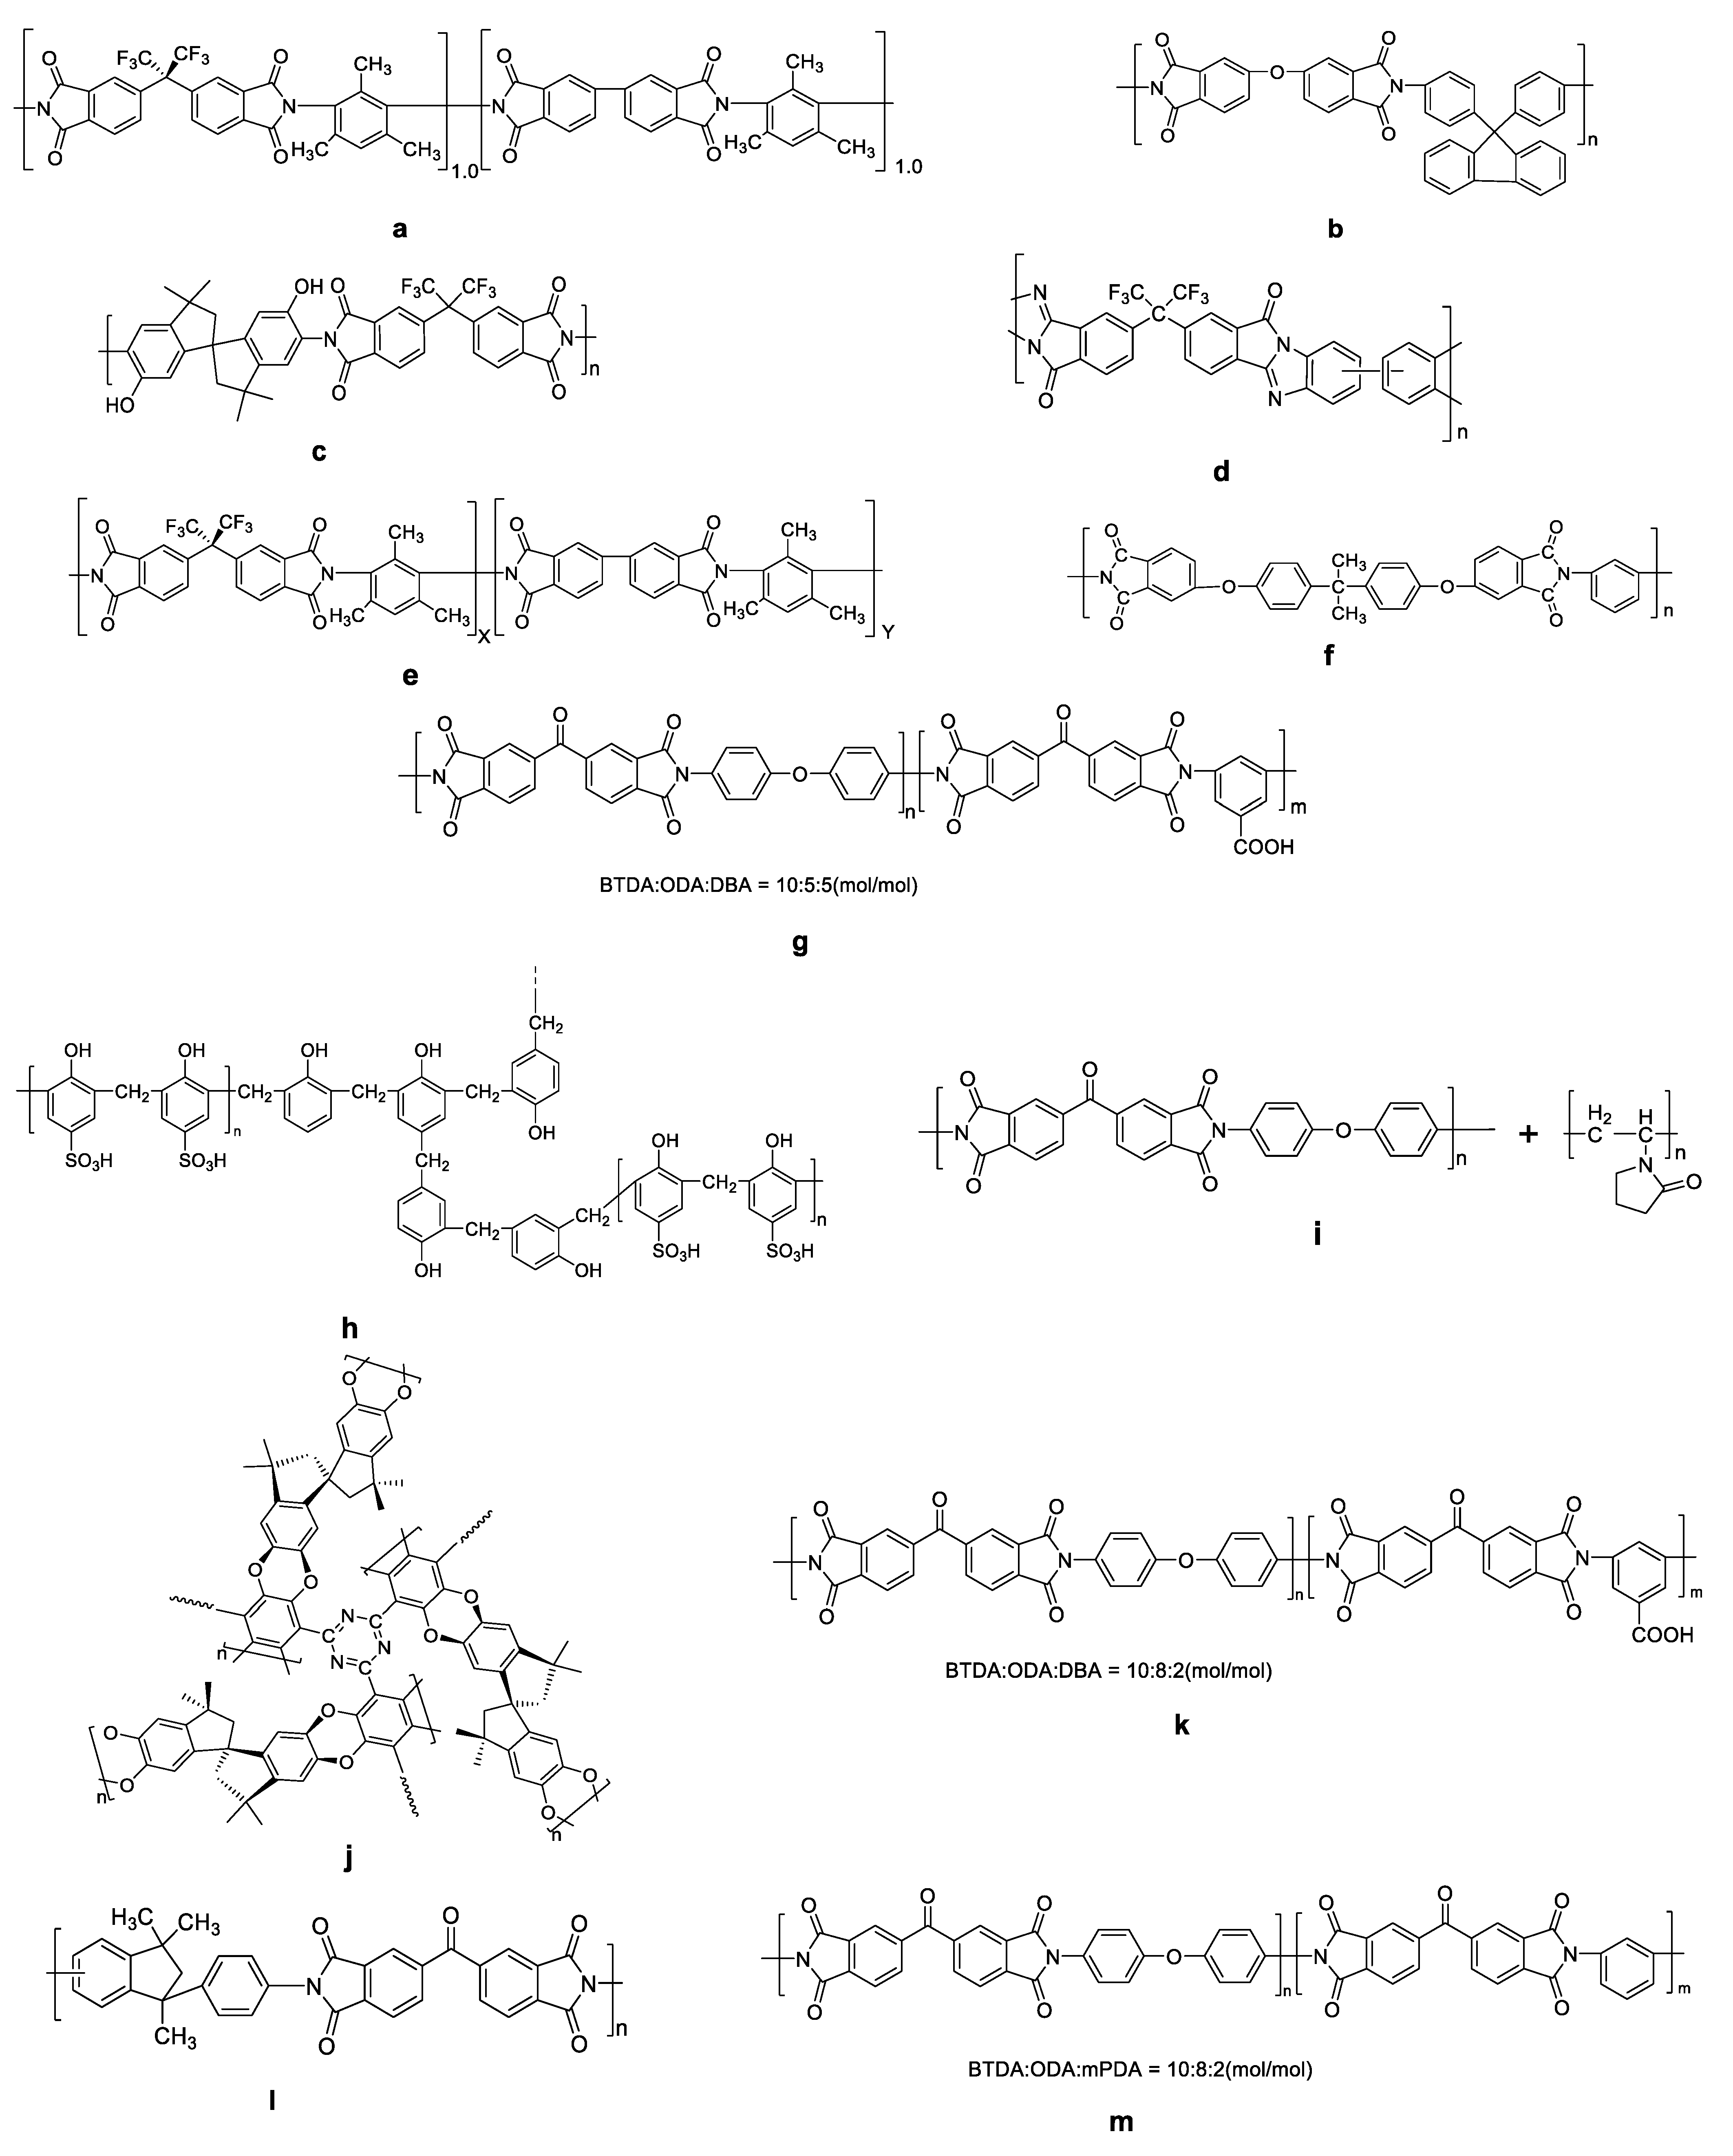
3.1.1. Thermally Rearranged Polymers (TRs)
3.1.2. Carbon Molecular Sieve Membranes (CMSM)
3.2. Polymer Membrane Modification by Blending with Microporous Additives—Mixed Matrix Membranes (MMMs)
3.2.1. Required Conditions for Simultaneous Improvements of Selectivity and Permeability by the MMM Method
3.2.2. Types of Microporous Additives
- (1)
- Zeolites [104]
- (2)
- Metal organic frameworks (MOF) [105]
- (3)
- Microporous organic cages (POC) [107]
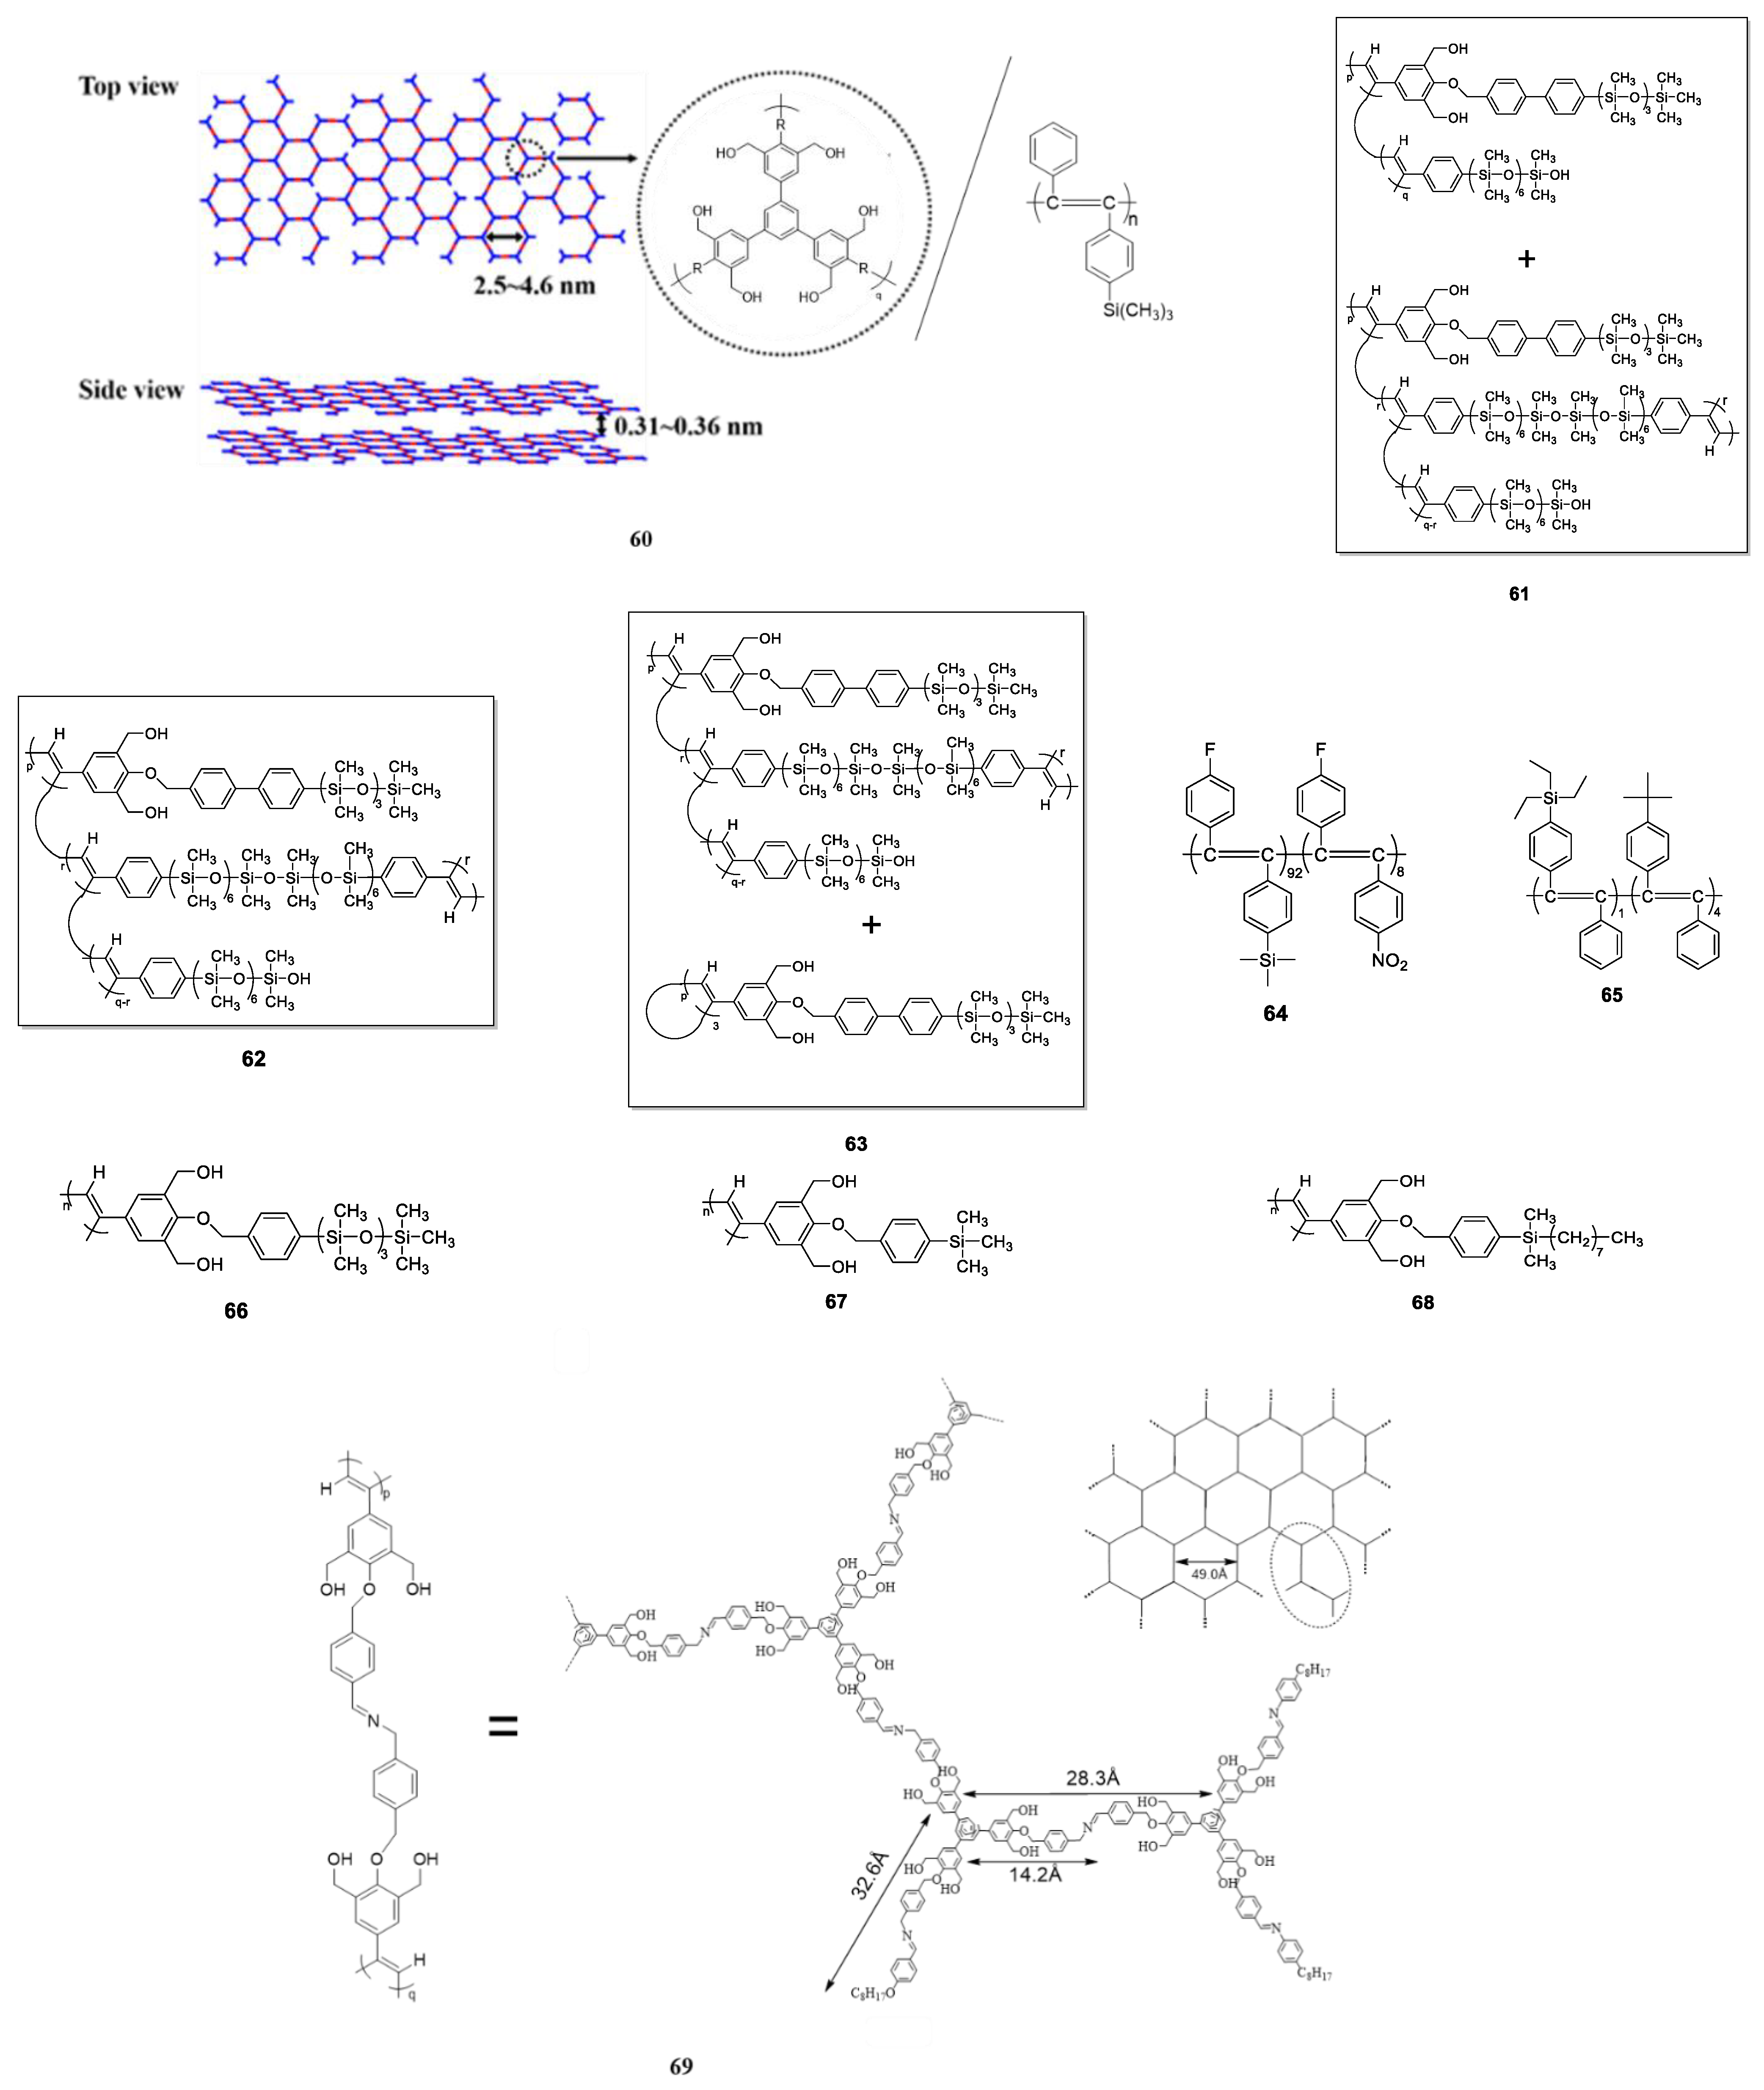
3.2.3. Sizes (Nanocrystals), Shapes (Nanosheets), and Assembled Structures of Microporous Additives
4. Concluding Remarks
4.1. High Permeable Linear Polymers, PTMSP and PIMs
4.2. High Permselective Inorganic Membranes, CMSM and Graphene
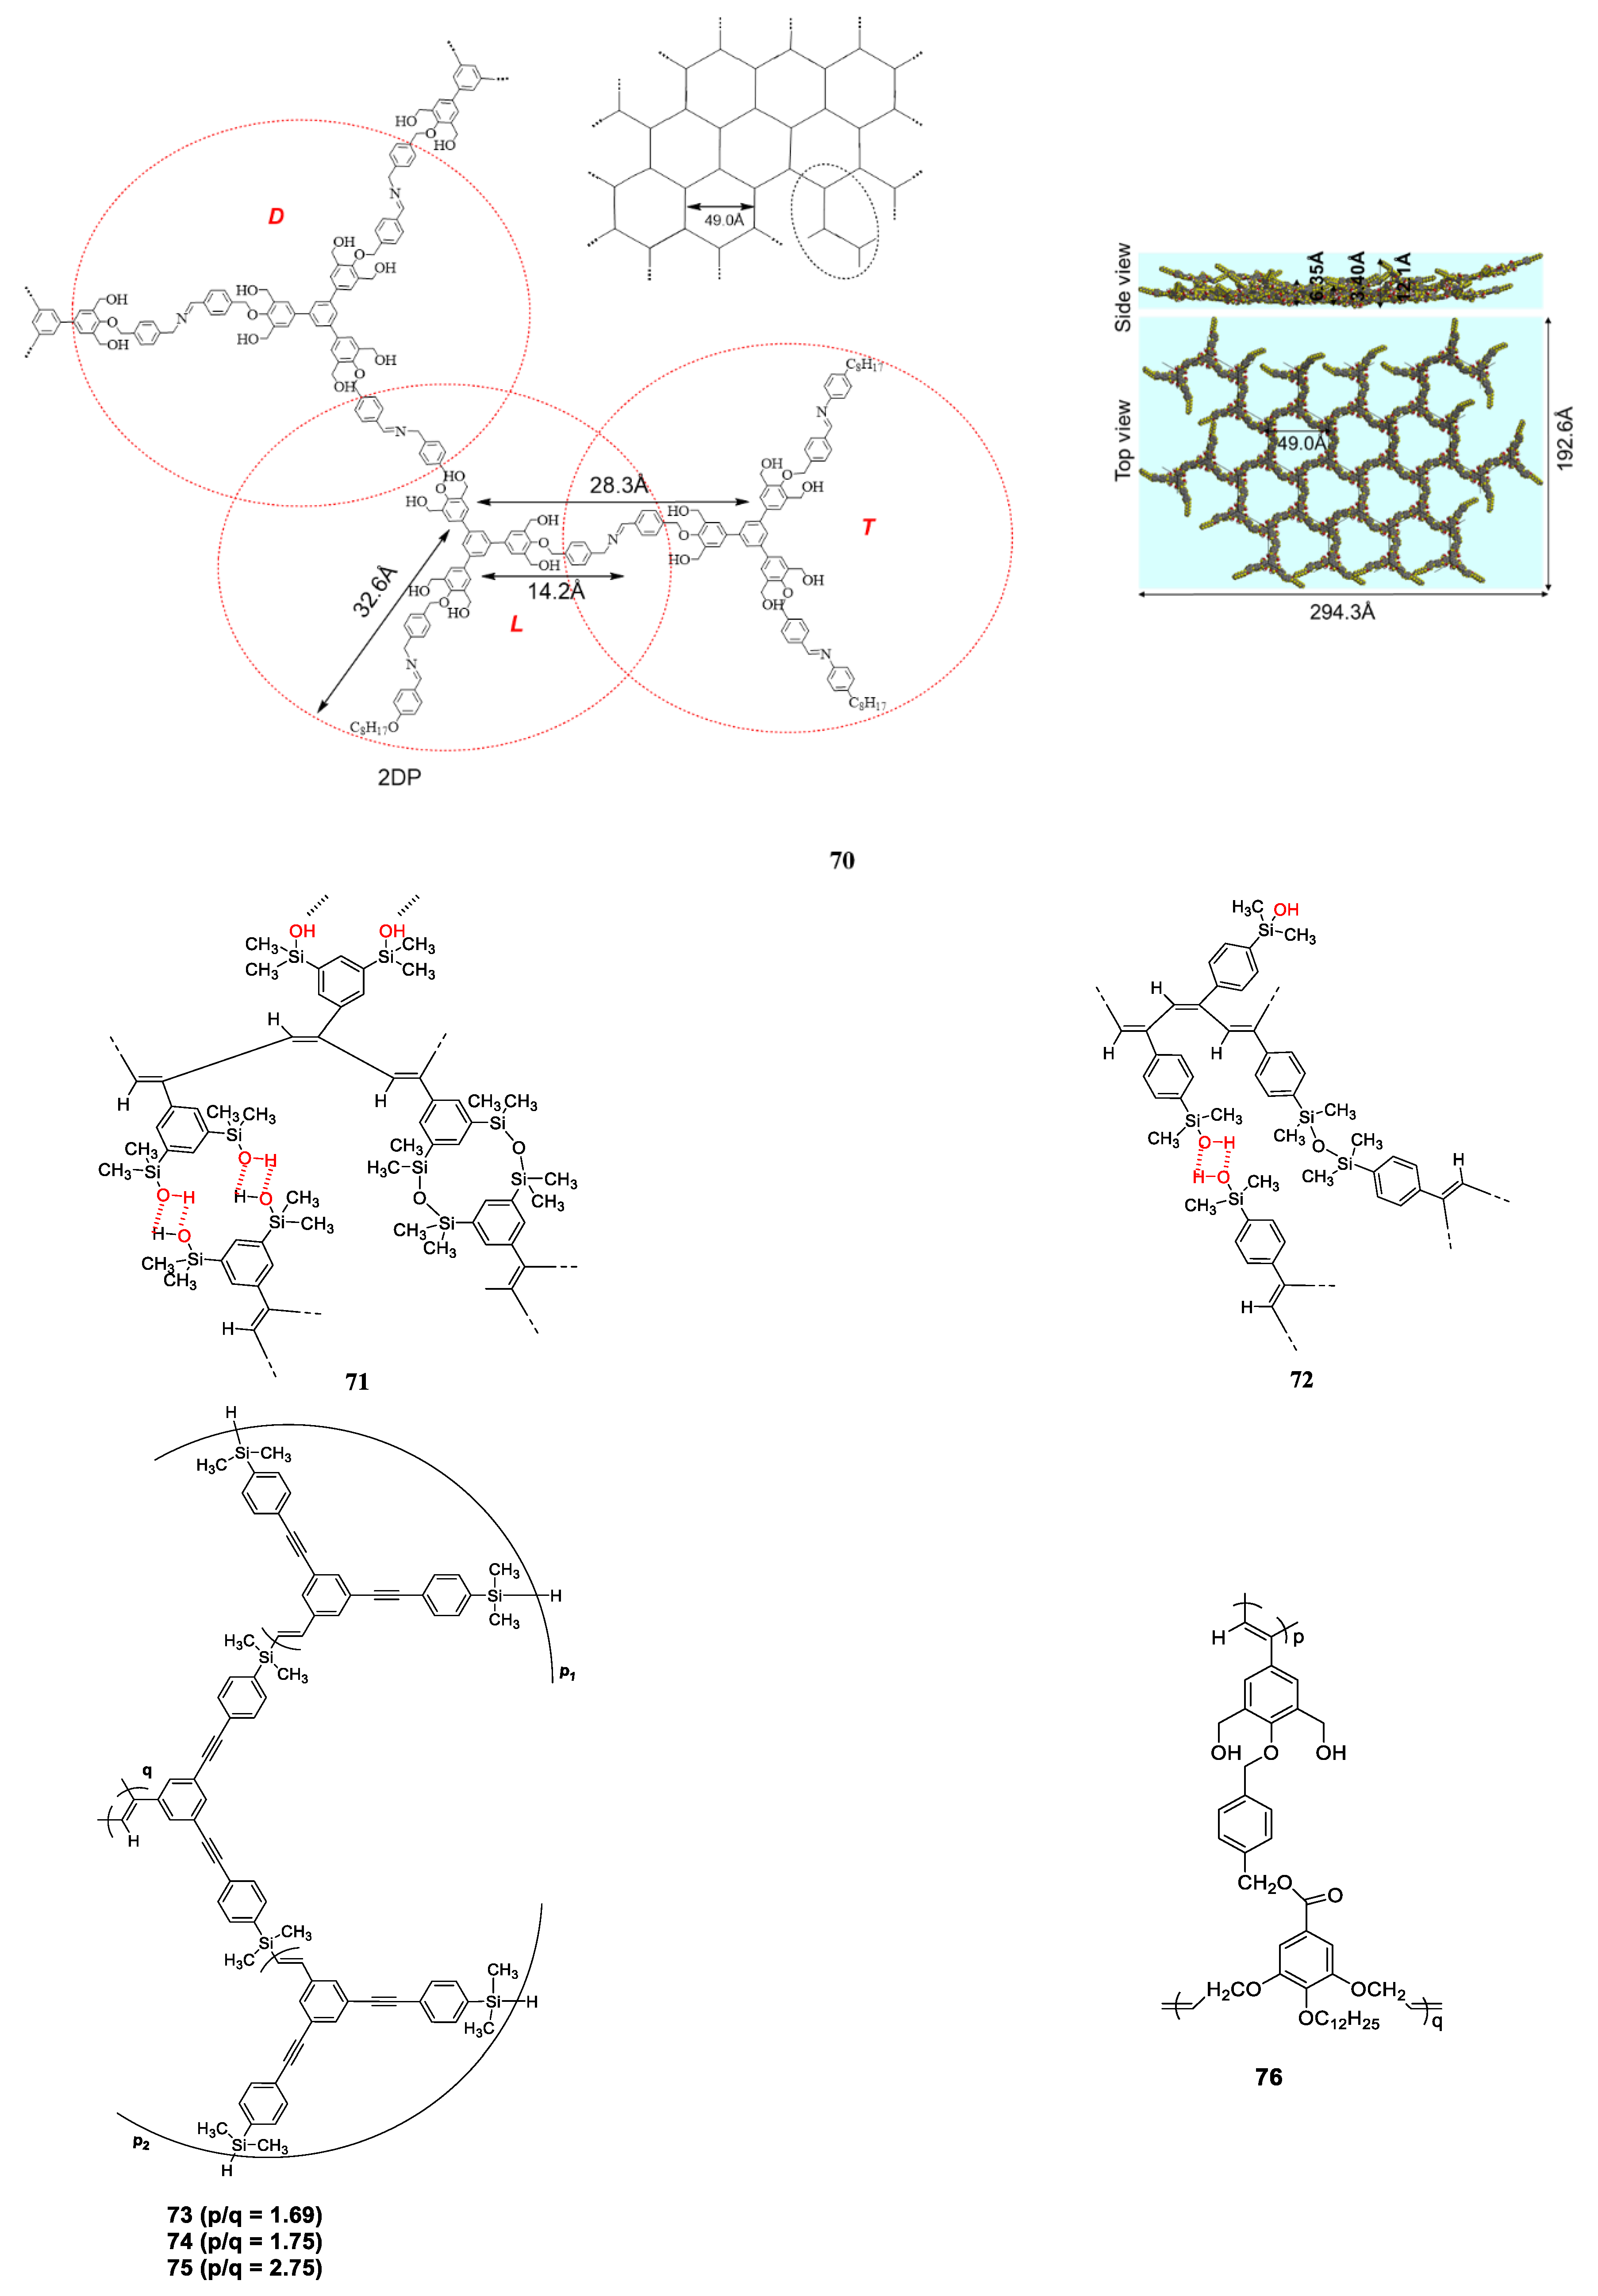
4.3. Promising Membranes from Regularly Networked Organic Polymers, 2DPs
Supplementary Materials
Author Contributions
Funding
Conflicts of Interest
References
- Aoki, T. Macromolecular design of permselective membranes. Prog. Polym. Sci. 1999, 24, 951–993. [Google Scholar] [CrossRef]
- McKeown, N.B.; Budd, P.M.; Msayib, K.J.; Ghanem, B.S.; Kingston, H.J.; Tattershall, C.E.; Makhseed, S.; Reynolds, K.J.; Fritsch, D. Polymers of Intrinsic Microporosity (PIMs): Bridging the Void between Microporous and Polymeric Materials. Chem. Eur. J. 2005, 11, 2610–2620. [Google Scholar] [CrossRef]
- Budd, P.M.; McKeown, N. Highly permeable polymers for gas separation membranes. Polym. Chem. 2010, 1, 63–68. [Google Scholar] [CrossRef]
- Usman, M.; Ahmed, A.; Yu, B.; Peng, Q.; Shen, Y.; Cong, H. A review of different synthetic approaches of amorphous intrinsic microporous polymers and their potential applications in membrane-based gases separation. Eur. Polym. J. 2019, 120, 109262. [Google Scholar] [CrossRef]
- Zhou, H.; Jin, W. Membranes with Intrinsic Micro-Porosity: Structure, Solubility, and Applications. Membranes 2019, 9, 3. [Google Scholar] [CrossRef] [Green Version]
- Baker, R.W.; Low, B.T. Gas Separation Membrane Materials: A Perspective. Macromolecules 2014, 47, 6999–7013. [Google Scholar] [CrossRef]
- Koros, W.J.; Zhang, C. Materials for next-generation molecularly selective synthetic membranes. Nat. Mater. 2017, 16, 289–297. [Google Scholar] [CrossRef]
- Sanders, D.F.; Smith, Z.P.; Guo, R.; Robeson, L.M.; McGrath, J.E.; Paul, D.R.; Freeman, B.D. Energy-efficient polymeric gas separation membranes for a sustainable future: A review. Polymer 2013, 54, 4729–4761. [Google Scholar] [CrossRef] [Green Version]
- Wijmans, J.G.; Baker, R.W. The solution-diffusion model: A review. J. Membr. Sci. 1995, 107, 1–21. [Google Scholar] [CrossRef]
- Robeson, L.M. Correlation of separation factor versus permeability for polymeric membranes. J. Membr. Sci. 1991, 62, 165–185. [Google Scholar] [CrossRef]
- Freeman, B.D. Basis of Permeability/Selectivity Trade-off Relations in Polymeric Gas Separation Membranes. Macromolecules 1999, 32, 375–380. [Google Scholar] [CrossRef]
- Robeson, L.M. The upper bound revisited. J. Membr. Sci. 2008, 320, 390–400. [Google Scholar] [CrossRef]
- Swaidan, R.; Ghanem, B.; Pinnau, I. Fine-Tuned Intrinsically Ultramicroporous Polymers Redefine the Permeability/Selectivity Upper Bounds of Membrane-Based Air and Hydrogen Separations. ACS Macro Lett. 2015, 4, 947–951. [Google Scholar] [CrossRef] [Green Version]
- Hu, Y.; Shiotsuki, M.; Sanda, F.; Freeman, B.; Masuda, T. Synthesis and Properties of Indan-Based Polyacetylenes That Feature the Highest Gas Permeability among All the Existing Polymers. Macromolecules 2008, 41, 8525–8532. [Google Scholar] [CrossRef]
- Hu, Y.; Shiotsuki, M.; Sanda, F.; Masuda, T. Synthesis and extremely high gas permeability of polyacetylenes containing polymethylated indan/tetrahydronaphthalene moieties. Chem. Commun. 2007, 4269–4270. [Google Scholar] [CrossRef]
- Morisato, A.; Pinnau, I. Synthesis and gas permeation properties of poly(4-methyl-2-pentyne). J. Membr. Sci. 1996, 121, 243–250. [Google Scholar] [CrossRef]
- Fukui, A.; Hattori, K.; Hu, Y.; Shiotsuki, M.; Sanda, F.; Masuda, T. Synthesis, characterization, and high gas permeability of poly(diarylacetylene)s having fluorenyl groups. Polymer 2009, 50, 4159–4165. [Google Scholar] [CrossRef] [Green Version]
- Sakaguchi, T.; Yumoto, K.; Shida, Y.; Shiotsuki, M.; Sanda, F.; Masuda, T. Synthesis, properties, and gas permeability of novel poly(diarylacetylene) derivatives. J. Polym. Sci. Part A Polym. Chem. 2006, 44, 5028–5038. [Google Scholar] [CrossRef]
- Kouzai, H.; Masuda, T.; Higashimura, T. Synthesis and properties of poly (diphenylacetylenes) having aliphatic para-substituents. J. Polym. Sci. Part A Polym. Chem. 1994, 32, 2523–2530. [Google Scholar] [CrossRef]
- Kwak, G.; Aoki, T.; Kaneko, T. Synthesis and stable high oxygen permeability of poly(diphenylacetylene)s with two or three trimethylsilyl groups. Polymer 2002, 43, 1705–1709. [Google Scholar] [CrossRef]
- Yampol’Skii, Y.P.; Shishatskii, S.M.; Shantorovich, V.P.; Antipov, E.M.; Kuzmin, N.N.; Rykov, S.V.; Khodjaeva, V.L.; Platé, N.A. Transport characteristics and other physicochemical properties of aged poly(1-(trimethylsilyl)-1-propyne). J. Appl. Polym. Sci. 1993, 48, 1935–1944. [Google Scholar] [CrossRef]
- Tsuchihara, K.; Masuda, T.; Higashimura, T. Polymerization of silicon-containing diphenylacetylenes and high gas permeability of the product polymers. Macromolecules 1992, 25, 5816–5820. [Google Scholar] [CrossRef]
- Bezzu, C.G.; Carta, M.; Ferrari, M.-C.; Jansen, J.C.; Monteleone, M.; Esposito, E.; Fuoco, A.; Hart, K.; Liyana-Arachchi, T.P.; Colina, C.M.; et al. The synthesis, chain-packing simulation and long-term gas permeability of highly selective spirobifluorene-based polymers of intrinsic microporosity. J. Mater. Chem. A 2018, 6, 10507–10514. [Google Scholar] [CrossRef] [Green Version]
- Bezzu, C.G.; Carta, M.; Tonkins, A.; Jansen, J.; Bernardo, P.; Bazzarelli, F.; McKeown, N.B. A Spirobifluorene-Based Polymer of Intrinsic Microporosity with Improved Performance for Gas Separation. Adv. Mater. 2012, 24, 5930–5933. [Google Scholar] [CrossRef]
- Swaidan, R.; Ghanem, B.; Litwiller, E.; Pinnau, I. Physical Aging, Plasticization and Their Effects on Gas Permeation in “Rigid” Polymers of Intrinsic Microporosity. Macromolecules 2015, 48, 6553–6561. [Google Scholar] [CrossRef] [Green Version]
- Ghanem, B.S.; McKeown, N.B.; Budd, P.M.; Selbie, J.D.; Fritsch, D. High-Performance Membranes from Polyimides with Intrinsic Microporosity. Adv. Mater. 2008, 20, 2766–2771. [Google Scholar] [CrossRef]
- Ma, X.; Salinas, O.; Litwiller, E.; Pinnau, I. Novel Spirobifluorene- and Dibromospirobifluorene-Based Polyimides of Intrinsic Microporosity for Gas Separation Applications. Macromolecules 2013, 46, 9618–9624. [Google Scholar] [CrossRef]
- Du, N.; Robertson, G.P.; Song, J.; Pinnau, I.; Guiver, M.D. High-Performance Carboxylated Polymers of Intrinsic Microporosity (PIMs) with Tunable Gas Transport Properties. Macromolecules 2009, 42, 6038–6043. [Google Scholar] [CrossRef] [Green Version]
- Budd, P.M.; Msayib, K.J.; Tattershall, C.E.; Ghanem, B.S.; Reynolds, K.J.; McKeown, N.; Fritsch, D. Gas separation membranes from polymers of intrinsic microporosity. J. Membr. Sci. 2005, 251, 263–269. [Google Scholar] [CrossRef]
- Du, N.; Robertson, G.P.; Song, J.; Pinnau, I.; Thomas, S.; Guiver, M. Polymers of Intrinsic Microporosity Containing Trifluoromethyl and Phenylsulfone Groups as Materials for Membrane Gas Separation. Macromolecules 2008, 41, 9656–9662. [Google Scholar] [CrossRef] [Green Version]
- Lin, W.-H.; Chung, T.-S. Gas permeability, diffusivity, solubility, and aging characteristics of 6FDA-durene polyimide membranes. J. Membr. Sci. 2001, 186, 183–193. [Google Scholar] [CrossRef]
- Qiu, W.; Xu, L.; Chen, C.-C.; Paul, D.R.; Koros, W.J. Gas separation performance of 6FDA-based polyimides with different chemical structures. Polymer 2013, 54, 6226–6235. [Google Scholar] [CrossRef]
- Sen, S.K.; Banerjee, S. Spiro-biindane containing fluorinated poly(ether imide)s: Synthesis, characterization and gas separation properties. J. Membr. Sci. 2010, 365, 329–340. [Google Scholar] [CrossRef]
- Kim, Y.-H.; Kim, H.-S.; Kwon, S.-K. Synthesis and Characterization of Highly Soluble and Oxygen Permeable New Polyimides Based on Twisted Biphenyl Dianhydride and Spirobifluorene Diamine. Macromolecules 2005, 38, 7950–7956. [Google Scholar] [CrossRef]
- Al-Masri, M.; Kricheldorf, A.H.R.; Fritsch, D. New Polyimides for Gas Separation. 1. Polyimides Derived from Substituted Terphenylenes and 4,4′-(Hexafluoroisopropylidene)diphthalic Anhydride. Macromolecules 1999, 32, 7853–7858. [Google Scholar] [CrossRef]
- Aoki, T.; Nakahara, H.; Hayakawa, Y.; Kokai, M.; Oikawa, E. Trimethylsilyl-group containing polyphenylacetylenes for oxygen and ethanol permselective membranes. J. Polym. Sci. Part A Polym. Chem. 1994, 32, 849–858. [Google Scholar] [CrossRef]
- Hayakawa, Y.; Nishida, M.; Aoki, T.; Muramatsu, H. Synthesis of poly(phenylacetylene)s containing trifluoromethyl groups for gas permeable membrane. J. Polym. Sci. Part A Polym. Chem. 1992, 30, 873–877. [Google Scholar] [CrossRef]
- Masuda, T.; Iguchi, Y.; Tang, B.-Z.; Higashimura, T. Diffusion and solution of gases in substituted polyacetylene membranes. Polymer 1988, 29, 2041–2049. [Google Scholar] [CrossRef] [Green Version]
- Masuda, T.; Matsumoto, T.; Yoshimura, T.; Higashimura, T. Synthesis and Properties of Poly[1-(n-alkylthio)-1-propynes. Macromolecules 1990, 23, 4902–4907. [Google Scholar] [CrossRef]
- Seki, H.; Masuda, T.; Higashimura, T. Synthesis and Properties of Poly(phenylacety1enes) Having o-Silylmethyl Groups. J. Polym. Sci. Part A Polym. Chem. 1995, 33, 117–124. [Google Scholar] [CrossRef]
- Fujita, Y.; Misumi, Y.; Tabata, M.; Masuda, T. Synthesis, Geometric Structure, and Properties of Poly(phenylacetylenes) with Bulky Para-Substituents. J. Polym. Sci. Part A Polym. Chem. 1998, 36, 3157–3163. [Google Scholar] [CrossRef]
- Aoki, T.; Shinohara, K.-I.; Kaneko, T.; Oikawa, E. Enantioselective Permeation of Various Racemates through an Optically Active Poly{1-[dimethyl(10-pinanyl)silyl]-1-propyne} Membrane. Macromolecules 1996, 29, 4192–4198. [Google Scholar] [CrossRef]
- Teraguchi, M.; Masuda, T. Synthesis and Properties of Polyacetylenes with Adamantyl Groups. J. Polym. Sci. Part A Polym. Chem. 1999, 37, 4546–4553. [Google Scholar] [CrossRef]
- Rose, I.; Bezzu, C.G.; Carta, M.; Comesaña-Gándara, B.; Lasseuguette, E.; Ferrari, M.-C.; Bernardo, P.; Clarizia, G.; Fuoco, A.; Jansen, J.C.; et al. Polymer ultrapermeability from the inefficient packing of 2D chains. Nat. Mater. 2017, 16, 932–937. [Google Scholar] [CrossRef]
- Masuda, T.; Isobe, E.; Higashimura, T.; Takada, K. Poly[1-(trimethylsilyl)-1-propyne]: A New High Polymer Synthesized with Transition-Metal Catalysts and Characterized by Extremely High Gas Permeability. J. Am. Chem. Soc. 1983, 105, 7473–7474. [Google Scholar] [CrossRef]
- Nagai, K.; Masuda, T.; Nakagawa, T.; Freeman, B.; Pinnau, I. Poly[1-(trimethylsilyl)-1-propyne] and related polymers: Synthesis, properties and functions. Prog. Polym. Sci. 2001, 26, 721–798. [Google Scholar] [CrossRef]
- Wang, X.-Y.; Lee, K.M.; Lu, Y.; Stone, M.T.; Sanchez, I.; Freeman, B. Cavity size distributions in high free volume glassy polymers by molecular simulation. Polymer 2004, 45, 3907–3912. [Google Scholar] [CrossRef]
- Han, S.H.; Misdan, N.; Kim, S.; Doherty, C.; Hill, A.J.; Lee, Y.M. Thermally Rearranged (TR) Polybenzoxazole: Effects of Diverse Imidization Routes on Physical Properties and Gas Transport Behaviors. Macromolecules 2010, 43, 7657–7667. [Google Scholar] [CrossRef]
- Ghanem, B.S.; Swaidan, R.; Litwiller, E.; Pinnau, I. Ultra-Microporous Triptycene-based Polyimide Membranes for High-Performance Gas Separation. Adv. Mater. 2014, 26, 3688–3692. [Google Scholar] [CrossRef]
- Shantarovich, V.P.; Azamatova, Z.K.; Yampolskii, Y.P. Free-Volume Distribution of High Permeability Membrane Materials Probed by Positron Annihilation. Macromolecules 1998, 31, 3963–3966. [Google Scholar] [CrossRef]
- Aoki, T.; Oikawa, E.; Hayakawa, Y.; Nishida, M. Improvement of oxygen permselectivity through polydimethylsiloxane and poly(1-trimethylsilylpropyne) films by the addition of a small amount of poly(trifluoromethyl substituted arylacetylene). J. Membr. Sci. 1991, 57, 207–216. [Google Scholar] [CrossRef]
- Lin, W.-H.; Vora, R.H.; Chung, T.-S. Gas Transport Properties of 6FDA-durene/1,4-phenylenediamine (pPDA) Copolyimides. J. Polym. Sci. Part B Polym. Phys. 2000, 38, 2703–2713. [Google Scholar] [CrossRef]
- Liu, Y.; Pan, C.; Ding, M.; Xu, J. Gas permeability and permselectivity of polyimides prepared from phenylenediamines with methyl substitution at the ortho position. Polym. Int. 1999, 48, 832–836. [Google Scholar] [CrossRef]
- Tanaka, K.; Okano, M.; Toshino, H.; Kita, H.; Okamoto, K.-I. Effect of methyl substituents on permeability and permselectivity of gases in polyimides prepared from methyl-substituted phenylenediamines. J. Polym. Sci. Part B Polym. Phys. 1992, 30, 907–914. [Google Scholar] [CrossRef]
- Koros, W.; Fleming, G.; Jordan, S.; Kim, T.; Hoehn, H. Polymeric Membrane Materials for Solution-Diffusion Based Permeation Separations. Prog. Polym. Sci. 1988, 13, 339–401. [Google Scholar] [CrossRef]
- Kim, T.; Koros, W.; Husk, G.; O’Brien, K. Relationship between Gas Separation Properties and Chemical Structure in a Series of Aromatic Polyimides. J. Membr. Sci. 1988, 37, 45–62. [Google Scholar] [CrossRef]
- Zhang, J.; Kang, H.; Martin, J.W.; Zhang, S.; Thomas, S.; Merkel, T.C.; Jin, J. The Enhancement of Chain Rigidity and Gas Transport Performance of Polymers of Intrinsic Microporosity via Intramolecular Locking of the Spiro-Carbon. Chem. Commun. 2016, 52, 6553–6556. [Google Scholar] [CrossRef]
- Rose, I.; Carta, M.; Malpass-Evans, R.; Ferrari, M.-C.; Bernardo, P.; Clarizia, G.; Jansen, J.; McKeown, N.B. Highly Permeable Benzotriptycene-Based Polymer of Intrinsic Microporosity. ACS Macro Lett. 2015, 4, 912–915. [Google Scholar] [CrossRef]
- Carta, M.; Croad, M.; Malpass-Evans, R.; Jansen, J.C.; Bernardo, P.; Clarizia, G.; Friess, K.; Lanč, M.; McKeown, N.B. Triptycene Induced Enhancement of Membrane Gas Selectivity for Microporous Tröger’s Base Polymers. Adv. Mater. 2014, 26, 3526–3531. [Google Scholar] [CrossRef] [Green Version]
- Zhu, Z.; Zhu, J.; Li, J.; Ma, X. Enhanced Gas Separation Properties of Tröger’s Base Polymer Membranes Derived from Pure Triptycene Diamine Regioisomers. Macromolecules 2020, 53, 1573–1584. [Google Scholar] [CrossRef]
- Swaidan, R.; Al-Saeedi, M.; Ghanem, B.; Litwiller, E.; Pinnau, I. Rational Design of Intrinsically Ultramicroporous Polyimides Containing Bridgehead-Substituted Triptycene for Highly Selective and Permeable Gas Separation Membranes. Macromolecules 2014, 47, 5104–5114. [Google Scholar] [CrossRef]
- Ma, X.; Lai, H.W.H.; Wang, Y.; Alhazmi, A.; Xia, Y.; Pinnau, I. Facile Synthesis and Study of Microporous Catalytic Arene-Norbornene Annulation–Tröger’s Base Ladder Polymers for Membrane Air Separation. ACS Macro Lett. 2020, 9, 680–685. [Google Scholar] [CrossRef]
- Ghanem, B.S.; Swaidan, R.; Ma, X.; Litwiller, E.; Pinnau, I. Energy-Efficient Hydrogen Separation by AB-Type Ladder-Polymer Molecular Sieves. Adv. Mater. 2014, 26, 6696–6700. [Google Scholar] [CrossRef]
- Malpass-Evans, R.; Rose, I.; Fuoco, A.; Bernardo, P.; Clarizia, G.; McKeown, N.B.; Jansen, J.C.; Carta, M. Effect of Bridgehead Methyl Substituents on the Gas Permeability of Tröger’s-Base Derived Polymers of Intrinsic Microporosity. Membranes 2020, 10, 62. [Google Scholar] [CrossRef] [PubMed] [Green Version]
- Luo, S.; Zhang, Q.; Zhu, L.; Lin, H.; Kazanowska, B.A.; Doherty, C.M.; Hill, A.J.; Gao, P.; Guo, R. Highly Selective and Permeable Microporous Polymer Membranes for Hydrogen Purification and CO2 Removal from Natural Gas. Chem. Mater. 2018, 30, 5322–5332. [Google Scholar] [CrossRef]
- Olvera, L.I.; Rodríguez-Molina, M.; Ruiz-Treviño, F.A.; Zolotukhin, M.G.; Fomine, S.; Cárdenas, J.; Gaviño, R.; Alexandrova, L.; Toscano, R.A.; Martínez-Mercado, E. A Highly Soluble, Fully Aromatic Fluorinated 3D Nanostructured Ladder Polymer. Macromolecules 2017, 50, 8480–8486. [Google Scholar] [CrossRef]
- Bera, D.; Padmanabhan, V.; Banerjee, S. Highly Gas Permeable Polyamides Based on Substituted Triphenylamine. Macromolecules 2015, 48, 4541–4554. [Google Scholar] [CrossRef]
- Bera, D.; Bandyopadhyay, P.; Ghosh, S.; Banerjee, S.; Padmanabhan, V. Highly gas permeable aromatic polyamides containing adamantane substituted triphenylamine. J. Membr. Sci. 2015, 474, 20–31. [Google Scholar] [CrossRef]
- Ghosh, S.; Banerjee, S. 9-Alkylated Fluorene-Based Poly(Ether Imide)s and Their Gas Transport Properties. J. Membr. Sci. 2016, 497, 172–182. [Google Scholar] [CrossRef]
- Zang, Y.; Aoki, T.; Teraguchi, M.; Kaneko, T.; Jia, H.; Ma, L.; Miao, F. New Synthetic Methods of Novel Nanoporous Polycondensates and Excellent Oxygen Permselectivity of Their Composite Membranes. Nanomaterials 2019, 9, 859. [Google Scholar] [CrossRef] [Green Version]
- Zhang, M.; Aoki, T.; Liu, L.; Wang, J.; Teraguchi, M.; Kaneko, T. Ultrahigh Oxygen Permeability of Chemically-Modified Membranes of Novel (Co)polyacetylenes Having a Photodegradative Backbone and Crosslinkable Side Chains. Polymer 2018, 149, 117–123. [Google Scholar] [CrossRef]
- Sakaguchi, T.; Shinoda, Y.; Hashimoto, T. Synthesis and Gas Permeability of Nitrated and Aminated Poly(diphenylacetylene)s. Polymer 2014, 55, 6680–6685. [Google Scholar] [CrossRef]
- Sakaguchi, T.; Lin, Y.; Hashimoto, T. Enhancement of oxygen permeability by copolymerization of silyl group-containing diphenylacetylenes with tert-butyl group-containing diphenylacetylene and desilylation of copolymer membranes. RSC Adv. 2017, 7, 30949–30955. [Google Scholar] [CrossRef] [Green Version]
- Xu, C.; Aoki, T.; Ma, L.; Jia, H.; Teraguchi, M.; Kaneko, T. Synthesis and Ultrahigh Oxygen Permeability of Silicon-containing cis-cisoidal Poly(substituted phenylacetylene)s. Chem. Lett. 2018, 47, 1314–1317. [Google Scholar] [CrossRef]
- Qu, Y.; Du, X.; Cheng, K.; Zang, Y.; Xu, L.; Shinohara, K.-I.; Teraguchi, M.; Kaneko, T.; Aoki, T. Synthesis and Permselectivity of a Soluble Two-Dimensional Macromolecular Sheet by Solid–Solid Interfacial Polycondensation Followed by Chemical Exfoliation. ACS Mater. Lett. 2020, 2, 1121–1128. [Google Scholar] [CrossRef]
- Wang, J.; Aoki, T.; Kaneko, T.; Teraguchi, M. Synthesis, In-Situ Membrane Preparation, and Good Gas Permselectivity of Insoluble Poly(substituted acetylene)s Loosely Cross-Linked with Short and Soft Siloxane and Silanol Linkages. Polymer 2019, 187, 122081. [Google Scholar] [CrossRef]
- Wang, J.; Li, J.; Aoki, T.; Kaneko, T.; Teraguchi, M.; Shi, Z.; Jia, H. Subnanoporous Highly Oxygen Permselective Membranes from Poly(conjugated hyperbranched macromonomer)s Synthesized by One-Pot Simultaneous Two-Mode Homopolymerization of 1,3-Bis(silyl)phenylacetylene Using a Single Rh Catalytic System: Control of Their Structures and Permselectivities. Macromolecules 2017, 50, 7121–7136. [Google Scholar] [CrossRef]
- Zang, Y.; Aoki, T.; Tanagi, H.; Matsui, K.; Teraguchi, M.; Kaneko, T.; Ma, L.; Jia, H.; Shinohara, K.-I. Synthesis of Two Well-Defined Quadruple-Stranded Copolymers having Two Kinds of Backbones by Postpolymerization of a Helical Template Polymer. Macromol. Rapid Commun. 2017, 39, 1700556. [Google Scholar] [CrossRef] [PubMed]
- Sato, T.; Teraguchi, M.; Kiuchi, M.; Kaneko, T.; Aoki, T. Quantitative Introduction of Perfluoroalkyl Groups to Poly(diphenylacetylene) Membranes via Three-step Membrane Reaction Including Click Reaction and Their Gas Permeability. Chem. Lett. 2015, 44, 1679–1681. [Google Scholar] [CrossRef]
- Xu, S.; Aoki, T.; Teraguchi, M.; Kaneko, T. High Oxygen Permselectivity through a Membrane from Novel Soluble Imido-bridged Ladder Polysiloxane. Chem. Lett. 2016, 45, 424–426. [Google Scholar] [CrossRef]
- Kim, S.; Lee, Y.M. Rigid and Microporous Polymers for Gas Separation Membranes. Prog. Polym. Sci. 2015, 43, 1–32. [Google Scholar] [CrossRef]
- Kiyono, M.; Williams, P.J.; Koros, W.J. Effect of Polymer Precursors on Carbon Molecular Sieve Structure and Separation Performance Properties. Carbon 2010, 48, 4432–4441. [Google Scholar] [CrossRef]
- Hu, C.-P.; Polintan, C.K.; Tayo, L.L.; Chou, S.-C.; Tsai, H.-A.; Hung, W.-S.; Hu, C.-C.; Lee, K.-R.; Lai, J.-Y. The gas separation performance adjustment of carbon molecular sieve membrane depending on the chain rigidity and free volume characteristic of the polymeric precursor. Carbon 2018, 143, 343–351. [Google Scholar] [CrossRef]
- Ma, X.; Swaidan, R.; Teng, B.; Tan, H.; Salinas, O.; Litwiller, E.; Han, Y.; Pinnau, I. Carbon Molecular Sieve Gas Separation Membranes Based on an Intrinsically Microporous Polyimide Precursor. Carbon 2013, 62, 88–96. [Google Scholar] [CrossRef]
- Kita, H.; Yoshino, M.; Tanaka, K.; Okamoto, K.-I. Gas Permselectivity of Carbonized Polypyrrolone Membrane. Chem. Commun. 1997, 1051–1052. [Google Scholar] [CrossRef]
- Singh-Ghosal, A.; Koros, W.J. Air Separation Properties of Flat Sheet Homogeneous Pyrolytic Carbon Membranes. J. Membr. Sci. 2000, 174, 177–188. [Google Scholar] [CrossRef]
- Rao, P.S.; Wey, M.-Y.; Tseng, H.-H.; Kumar, I.A.; Weng, T.-H. A Comparison of Carbon/Nanotube Molecular Sieve Membranes with Polymer Blend Carbon Molecular Sieve Membranes for the Gas Permeation Application. Microporous Mesoporous Mater. 2008, 113, 499–510. [Google Scholar] [CrossRef]
- Kim, Y.K.; Lee, J.M.; Park, H.B.; Lee, Y.M. The Gas Separation Properties of Carbon Molecular Sieve Membranes Derived from Polyimides Having Carboxylic Acid Groups. J. Membr. Sci. 2004, 235, 139–146. [Google Scholar] [CrossRef]
- Zhou, W.; Yoshino, M.; Kita, H.; Okamoto, K.-I. Preparation and Gas Permeation Properties of Carbon Molecular Sieve Membranes Based on Sulfonated Phenolic Resin. J. Membr. Sci. 2003, 217, 55–67. [Google Scholar] [CrossRef]
- Kim, Y.K.; Park, H.B.; Lee, Y.M. Carbon molecular sieve membranes derived from thermally labile polymer containing blend polymers and their gas separation properties. J. Membr. Sci. 2004, 243, 9–17. [Google Scholar] [CrossRef]
- Li, F.Y.; Xiao, Y.; Chung, T.-S.; Kawi, S. High-Performance Thermally Self-Cross-Linked Polymer of Intrinsic Microporosity (PIM-1) Membranes for Energy Development. Macromolecules 2012, 45, 1427–1437. [Google Scholar] [CrossRef]
- Zhang, B.; Wang, T.; Wu, Y.; Liu, Q.; Liu, S.; Zhang, S.; Qiu, J. Preparation and Gas Permeation of Composite Carbon Membranes from Poly(phthalazinone ether sulfone ketone). Sep. Purif. Technol. 2008, 60, 259–263. [Google Scholar] [CrossRef]
- Barsema, J.; Balster, J.; Jordan, V.; van der Vegt, N.; Wessling, M. Functionalized Carbon Molecular Sieve membranes containing Ag-nanoclusters. J. Membr. Sci. 2003, 219, 47–57. [Google Scholar] [CrossRef]
- Wey, M.-Y.; Tseng, H.-H.; Chiang, C.-K. Effect of MFI zeolite intermediate layers on gas separation performance of carbon molecular sieve (CMS) membranes. J. Membr. Sci. 2013, 446, 220–229. [Google Scholar] [CrossRef]
- Hosseini, S.S.; Omidkhah, M.R.; Moghaddam, A.Z.; Pirouzfar, V.; Krantz, W.; Tan, N.R. Enhancing the Properties and Gas Separation Performance of PBI–Polyimides Blend Carbon Molecular Sieve Membranes via Optimization of the Pyrolysis Process. Sep. Purif. Technol. 2014, 122, 278–289. [Google Scholar] [CrossRef]
- Kim, Y.K.; Park, H.B.; Lee, Y.M. Preparation and characterization of carbon molecular sieve membranes derived from BTDA–ODA polyimide and their gas separation properties. J. Membr. Sci. 2005, 255, 265–273. [Google Scholar] [CrossRef]
- Yoshimune, M.; Fujiwara, I.; Haraya, K. Carbon Molecular Sieve Membranes Derived from Trimethylsilyl Substituted Poly(phenylene oxide) for Gas Separation. Carbon 2007, 45, 553–560. [Google Scholar] [CrossRef]
- Park, H.B.; Lee, Y.M. Pyrolytic Carbon–Silica Membrane: A Promising Membrane Material for Improved Gas Separation. J. Membr. Sci. 2003, 213, 263–272. [Google Scholar] [CrossRef]
- Suda, H.; Haraya, K. Gas Permeation through Micropores of Carbon Molecular Sieve Membranes Derived from Kapton Polyimide. J. Phys. Chem. B 1997, 101, 3988–3994. [Google Scholar] [CrossRef]
- Steel, K.M.; Koros, W.J. Investigation of Porosity of Carbon Materials and Related Effects on Gas Separation Properties. Carbon 2003, 41, 253–266. [Google Scholar] [CrossRef]
- Zhang, C.; Koros, W.J. Ultraselective Carbon Molecular Sieve Membranes with Tailored Synergistic Sorption Selective Properties. Adv. Mater. 2017, 29, 1701631. [Google Scholar] [CrossRef] [PubMed]
- Zhang, B.; Wang, T.; Liu, S.; Zhang, S.; Qiu, J.; Chen, Z.-G.; Cheng, H. Structure and Morphology of Microporous Carbon Membrane Materials Derived from Poly(Phthalazinone Ether Sulfone Ketone). Microporous Mesoporous Mater. 2006, 96, 79–83. [Google Scholar] [CrossRef]
- Wang, T.; Zhang, B.; Qiu, J.; Wu, Y.; Zhang, S.; Cao, Y. Effects of Sulfone/Ketone in Poly(phthalazinone ether sulfone ketone) on the Gas Permeation of Their Derived Carbon Membranes. J. Membr. Sci. 2009, 330, 319–325. [Google Scholar] [CrossRef]
- Chung, T.-S.; Jiang, L.Y.; Li, Y.; Kulprathipanja, S. Mixed matrix membranes (MMMs) Comprising Organic Polymers with Dispersed Inorganic Fillers for Gas Separation. Prog. Polym. Sci. 2007, 32, 483–507. [Google Scholar] [CrossRef]
- Dechnik, J.; Gascon, J.; Doonan, C.J.; Janiak, C.; Sumby, C.J. Mixed-Matrix Membranes. Angew. Chem. Int. Ed. 2017, 56, 9292–9310. [Google Scholar] [CrossRef] [PubMed]
- Park, H.B.; Kamcev, J.; Robeson, L.M.; Elimelech, M.; Freeman, B.D. Maximizing the Right Stuff: The Trade-Off between Membrane Permeability and Selectivity. Science 2017, 356, eaab0530. [Google Scholar] [CrossRef] [Green Version]
- Slater, A.G.; Cooper, A.I. Function-led Design of New Porous Materials. Science 2015, 348, 8075. [Google Scholar] [CrossRef] [PubMed]
- Wang, H.; Holmberg, B.A.; Yan, Y. Homogeneous Polymer-zeolite Nanocomposite Membranes by Incorporating Dispersible Template-removed Zeolitenanocrystals. J. Mater. Chem. 2002, 12, 3640–3643. [Google Scholar] [CrossRef]
- Li, Y.; Chung, T.-S.; Cao, C.; Kulprathipanja, S. The Effects of Polymer Chain Rigidification, Zeolite Pore Size and Pore Blockage on Polyethersulfone (PES)-Zeolite A Mixed Matrix Membranes. J. Membr. Sci. 2005, 260, 45–55. [Google Scholar] [CrossRef]
- Xin, Q.; Liu, T.; Li, Z.; Wang, S.; Li, Y.; Li, Z.; Ouyang, J.; Jiang, Z.; Wu, H. Mixed Matrix Membranes Composed of Sulfonated Poly(ether ether ketone) and a Sulfonated Metal-Organic Framework for Has Separation. J. Membr. Sci. 2015, 488, 67–78. [Google Scholar] [CrossRef]
- Anjum, M.W.; Bueken, B.; De Vos, D.; Vankelecom, I.F. MIL-125(Ti) Based Mixed Matrix Membranes for CO2 Separation from CH4 and N2. J. Membr. Sci. 2016, 502, 21–28. [Google Scholar] [CrossRef]
- Anjum, M.W.; Vermoortele, F.; Khan, A.L.; Bueken, B.; De Vos, D.E.; Vankelecom, I.F.J. Modulated UiO-66-Based Mixed-Matrix Membranes for CO2 Separation. ACS Appl. Mater. Interfaces 2015, 7, 25193–25201. [Google Scholar] [CrossRef] [PubMed]
- Wang, H.; He, S.; Qin, X.; Li, C.; Li, T. Interfacial Engineering in Metal–Organic Framework-Based Mixed Matrix Membranes Using Covalently Grafted Polyimide Brushes. J. Am. Chem. Soc. 2018, 140, 17203–17210. [Google Scholar] [CrossRef] [PubMed]
- Bushell, A.F.; Budd, P.M.; Attfield, M.P.; Jones, J.T.A.; Hasell, T.; Cooper, A.I.; Bernardo, P.; Bazzarelli, F.; Clarizia, G.; Jansen, J.C. Nanoporous Organic Polymer/Cage Composite Membranes. Angew. Chem. Int. Ed. 2012, 52, 1253–1256. [Google Scholar] [CrossRef]
- Jiang, L.Y.; Chung, T.S. β-Cyclodextrin Containing Matrimid® Sub-Nanocomposite Membranes for Pervaporation Application. J. Membr. Sci. 2009, 327, 216–225. [Google Scholar] [CrossRef]
- Bachman, J.E.; Smith, Z.P.; Li, T.; Xu, T.; Long, J.R. Enhanced Ethylene Separation and Plasticization Resistance in Polymer Membranes Incorporating Metal-Organic Framework Nanocrystals. Nat. Mater. 2016, 15, 845–850. [Google Scholar] [CrossRef]
- Peng, Y.; Li, Y.; Ban, Y.; Jin, H.; Jiao, W.; Liu, X.; Yang, W. Metal-Organic Framework Nanosheets as Building Blocks for Molecular Sieving Membranes. Science 2014, 346, 1356–1359. [Google Scholar] [CrossRef]
- Kang, Z.; Peng, Y.; Hu, Z.; Qian, Y.; Chi, C.; Yeo, L.Y.; Tee, L.; Zhao, D. Mixed Matrix Membranes Composed of Two-Dimensional Metal–Organic Framework Nanosheets for Pre-Combustion CO2 Capture: A Relationship Study of Filler Morphology versus Membrane Performance. J. Mater. Chem. A 2015, 3, 20801–20810. [Google Scholar] [CrossRef]
- Rodenas, T.; Luz, I.; Prieto, G.; Seoane, B.; Miro, H.; Corma, A.; Kapteijn, F.; Xamena, F.X.L.I.; Gascon, J. Metal-Organic Framework Nanosheets in Polymer Composite Materials for Gas Separation. Nat. Mater. 2015, 14, 48–55. [Google Scholar] [CrossRef]
- Nishide, H.; Ohyanagi, M.; Okada, O.; Tsuchida, E. Dual-Mode Transport of Molecular Oxygen in a Membrane Containing a Cobalt Porphyrin Complex as a Fixed Carrier. Macromolecules 1987, 20, 417–422. [Google Scholar] [CrossRef]
- Song, Q.; Cao, S.; Pritchard, R.H.; Ghalei, B.; Al-Muhtaseb, S.A.; Terentjev, E.; Cheetham, A.K.; Sivaniah, E. Controlled Thermal Oxidative Crosslinking of Polymers of Intrinsic Microporosity towards Tunable Molecular Sieve Membranes. Nat. Commun. 2014, 5, 4813. [Google Scholar] [CrossRef] [PubMed] [Green Version]
- Song, Q.; Cao, S.; Zavala-Rivera, P.; Lu, L.P.; Li, W.; Ji, Y.; Al-Muhtaseb, S.A.; Cheetham, A.K.; Sivaniah, E. Photo-oxidative Enhancement of Polymeric Molecular Sieve Membranes. Nat. Commun. 2013, 4, 1918. [Google Scholar] [CrossRef] [PubMed] [Green Version]
- Kim, H.W.; Yoon, H.W.; Yoon, S.-M.; Yoo, B.M.; Ahn, B.K.; Cho, Y.H.; Shin, H.J.; Yang, H.; Paik, U.; Kwon, S.; et al. Selective Gas Transport Through Few-Layered Graphene and Graphene Oxide Membranes. Science 2013, 342, 91–95. [Google Scholar] [CrossRef] [Green Version]
- Li, H.; Song, Z.; Zhang, X.; Huang, Y.; Li, S.; Mao, Y.; Ploehn, H.J.; Bao, Y.; Yu, M. Ultrathin, Molecular-Sieving Graphene Oxide Membranes for Selective Hydrogen Separation. Science 2013, 342, 95–98. [Google Scholar] [CrossRef]
- Ding, S.-Y.; Wang, W. Covalent organic frameworks (COFs): From design to applications. Chem. Soc. Rev. 2013, 42, 548–568. [Google Scholar] [CrossRef] [PubMed]
- Zheng, Z.; Grünker, R.; Feng, X. Synthetic Two-Dimensional Materials: A New Paradigm of Membranes for Ultimate Separation. Adv. Mater. 2016, 28, 6529–6545. [Google Scholar] [CrossRef] [Green Version]


| Code | Polymer Type | PO2 (barrer) | α (=PO2/PN2) | Aging Time (days) | Thickness (μm) | Feed Gas | Ref. (year) |
|---|---|---|---|---|---|---|---|
| Group I | |||||||
| 1 | PA | 12,000 | 1.13 | 90 | 80–120 | pure | [14] (2008) |
| (18,700) | (1.13) | ||||||
| 2 | PA | 10,800 | 1.24 | 60 | - | pure | [15] (2007) |
| (14,400) | (1.24) | ||||||
| 3 | PA | (2700) | (2.00) | - | 20–40 | pure | [16] (1996) |
| 4 | PA | 2000 | 1.84 | 90 | 80 | pure | [17] (2009) |
| (4800) | (1.50) | ||||||
| 5 | PA | 1200 | 1.80 | 90 | - | pure | [18] (2006) |
| (3500) | (1.80) | ||||||
| 6 | PA | 1100 | 2.20 | - | - | pure | [19] (1994) |
| 7 | PA | 1000 | 2.55 | 90 | 30–120 | mixed | [20] (2002) |
| (1100) | (2.40) | ||||||
| 8 | PA (PTMSP) | 150 | 2.30 | 1460 | - | pure | [21] (1993) |
| (14,800) | (1.29) | [14] (2008) | |||||
| 9 | PA | 260 | 2.70 | 26 h | - | - | [22] (1992) |
| (1100) | (2.10) | ||||||
| Group II | |||||||
| 10 | Spiro-PIM | 486 | 5.60 | 2088 | 100 | pure | [23] (2018) |
| (2640) | (3.35) | 180 | pure | [24] (2012) | |||
| 11 | Spiro-PIM (PIM-1) | 317 | 5.00 | 1380 | 128 | pure | [25] (2015) |
| (2270) | (2.80) | - | pure | [24] (2012) | |||
| 12 | Spiro-PIM-PI | (545) | (3.40) | 96 | pure | [26] (2008) | |
| 13 | Spiro-PIM-PI | (243) | (3.50) | 80–100 | pure | [27] (2013) | |
| 14 | Modified Spiro-PIM | (201) | (4.20) | 70–90 | pure | [28] (2009) | |
| 15 | Spiro-PIM | (190) | (4.50) | 28 | pure | [29] (2005) | |
| 16 | Modified Spiro-PIM | (156) | (4.70) | 50–70 | pure | [30] (2008) | |
| Group III | |||||||
| 17 | PI | (132) | (3.57) | 50 | pure | [31] (2001) | |
| 18 | Spiro-PIM-PI | (116) | (4.00) | 80–100 | pure | [27] (2013) | |
| 19 | PI | (52.0) | (4.20) | 60 | pure | [32] (2013) | |
| 20 | Spiro-PIM-PI | (36.1) | (10.8) | 85 | pure | [33] (2010) | |
| 21 | Spiro-PI | (18.0) | (9.00) | 30–60 | pure | [34] (2005) | |
| 22 | PI | (8.60) | (5.38) | 30–90 | pure | [35] (1999) | |
| 23 | Modified PI | (3.14) | (6.16) | 60 | mixed | [32] (2013) | |
| Code | PO2 (Barrer) | α (=PO2/PN2) | Thickness (μm) | Feed Gas | Ref. (Year) |
|---|---|---|---|---|---|
| 24 | (473) | (2.65) | - | mixed | [36] (1994) |
| 25 | (450) | (2.30) | 30–100 | mixed | [37] (1992) |
| 26 | (171) | (2.30) | - | mixed | [36] (1994) |
| 27 | (130) | (3.00) | 10–100 | pure | [38] (1988) |
| 28 | (79.0) | (4.40) | - | pure | [39] (1990) |
| 29 | (75.0) | (3.60) | 10–100 | pure | [38] (1988) |
| 30 | (77.0) | (3.20) | - | - | [40] (1995) |
| 31 | (50.0) | (4.20) | - | - | [41] (1998) |
| 32 | (16.0) | (4.35) | 61.9–90.3 | mixed | [42] (1996) |
| 33 | (8.60) | (4.50) | - | - | [43] (1999) |
| 34 | (5.10) | (5.10) | 10–100 | pure | [38] (1988) |
| Code | PO2 (Barrer) | α (=PO2/PN2) | Thickness (μm) | Feed Gas | Ref. (Year) |
|---|---|---|---|---|---|
| 35 | 545 | 3.40 | 96 | pure | [26] (2008) |
| 36 | 243 | 3.50 | 80–100 | pure | [27] (2013) |
| 37 | 67.0 | 4.06 | 30–90 | pure | [35] (1999) |
| 38 | 64.8 | 3.84 | - | pure | [52] (2000) |
| 39 | 62.5 | 4.46 | 30 | mixed | [53] (1999) |
| 40 | 34.7 | 4.10 | - | mixed | [54] (1992) |
| 41 | 33.8 | 4.37 | - | pure | [52] (2000) |
| 42 | 13.4 | 5.00 | - | mixed | [54] (1992) |
| 43 | 11.8 | 4.48 | 30 | mixed | [53] (1999) |
| Code | Polymer Type | PO2 (Barrer) | α (=PO2/PN2) | Thickness (μm) | Casting Solvent | Feed Gas | Aging Time (Days) | Ref. (Year) |
|---|---|---|---|---|---|---|---|---|
| Group I (see Table 1) | ||||||||
| Group II | ||||||||
| 44 | Spiro-PIM | (3410) | (3.50) | - | chloroform | pure | - | [57] (2016) |
| 45 | Trip-PIM | 3160 | 4.35 | 187 | - | pure | 365 | [44] (2017) |
| (7470) | (3.35) | (195) | ||||||
| 46 | Trip-PIM | 1170 | 5.40 | 180 | chloroform | pure | 166 | [58] (2015) |
| (3290) | (3.60) | |||||||
| 47 | Trip-PIM | 1073 | 5.70 | 132 | chloroform | pure | 100 | [59] (2014) |
| (2718) | (4.30) | |||||||
| 48 | Spiro-PIM | 910 | 5.50 | 115 | chroloform | pure | 1295 | [23] (2018) |
| (3820) | (3.20) | |||||||
| 49 | Trip-PIM | 440 | 6.29 | 60 | chloroform | pure | 150 | [60] (2020) |
| (864) | (6.01) | |||||||
| 50 | Trip-PIM-PI | 542 | 6.20 | 77 | chroloform | pure | 150 | [61] (2014) |
| (627) | (5.86) | |||||||
| 51 | Ladder | 528 | 4.80 | 39 | chloroform | pure | 300 | [62] (2020) |
| (747) | (4.60) | |||||||
| 52 | Trip-PIM | 525 | 5.90 | - | chroloform | pure | 15 | [44] (2017) |
| (368) | (6.80) | - | [63] (2014) | |||||
| 53 | Trip-PIM | 500 | 5.21 | - | chloroform | pure | 407 | [64] (2020) |
| (1002) | (3.93) | |||||||
| 54 | Trip-PIM | 334 | 6.30 | - | chloroform | pure | 150 | [60] (2020) |
| (374) | (6.93) | |||||||
| 55 | Trip-PBO | (68) | (8.10) | - | DMAc | pure | - | [65] (2018) |
| 56 | Ladder | (36.5) | (8.50) | 45 | chloroform | pure | - | [66] (2017) |
| Group III | ||||||||
| 57 | PAm | (29.0) | (9.67) | 70–80 | DMAc | pure | - | [67] (2015) |
| 58 | PAm | (14.2) | (10.2) | 70–80 | DMAc | pure | - | [68] (2015) |
| 59 | PI | (8.52) | (20.3) | 65–75 | DMF | pure | - | [69] (2016) |
| Code | Polymer Type (Subcategory of PA) | PO2 (Barrer) | α (=PO2/PN2) | Thickness (μm) | Casting Solvent | Feed Gas | Ref. (Year) |
|---|---|---|---|---|---|---|---|
| 1 | DPA | 12,000 | 1.13 | 80–120 | toluene | pure | [14] (2008) |
| (18,700) | (1.13) | ||||||
| 2 | DPA | 10,800 | 1.24 | - | toluene | pure | [15] (2008) |
| (14,400) | (1.24) | ||||||
| 4 | DPA | 2000 | 1.84 | 80 | toluene | pure | [17] (2009) |
| (4800) | (1.43) | ||||||
| 5 | DPA | 1200 | 1.80 | - | toluene | pure | [18] (2006) |
| (3500) | (1.80) | ||||||
| 7 | DPA | 1000 | 2.55 | 30–120 | - | mixed | [21] (1993) [14] (2008) |
| (1100) | (2.40) | ||||||
| 8 | DPA (PTMSP) | 150 | 2.30 | - | cyclohexane | pure | [22] (1992) |
| (14,800) | (1.29) | ||||||
| 9 | DPA | 260 | 2.70 | - | - | pure | [21] (1993) |
| (1100) | (2.10) | ||||||
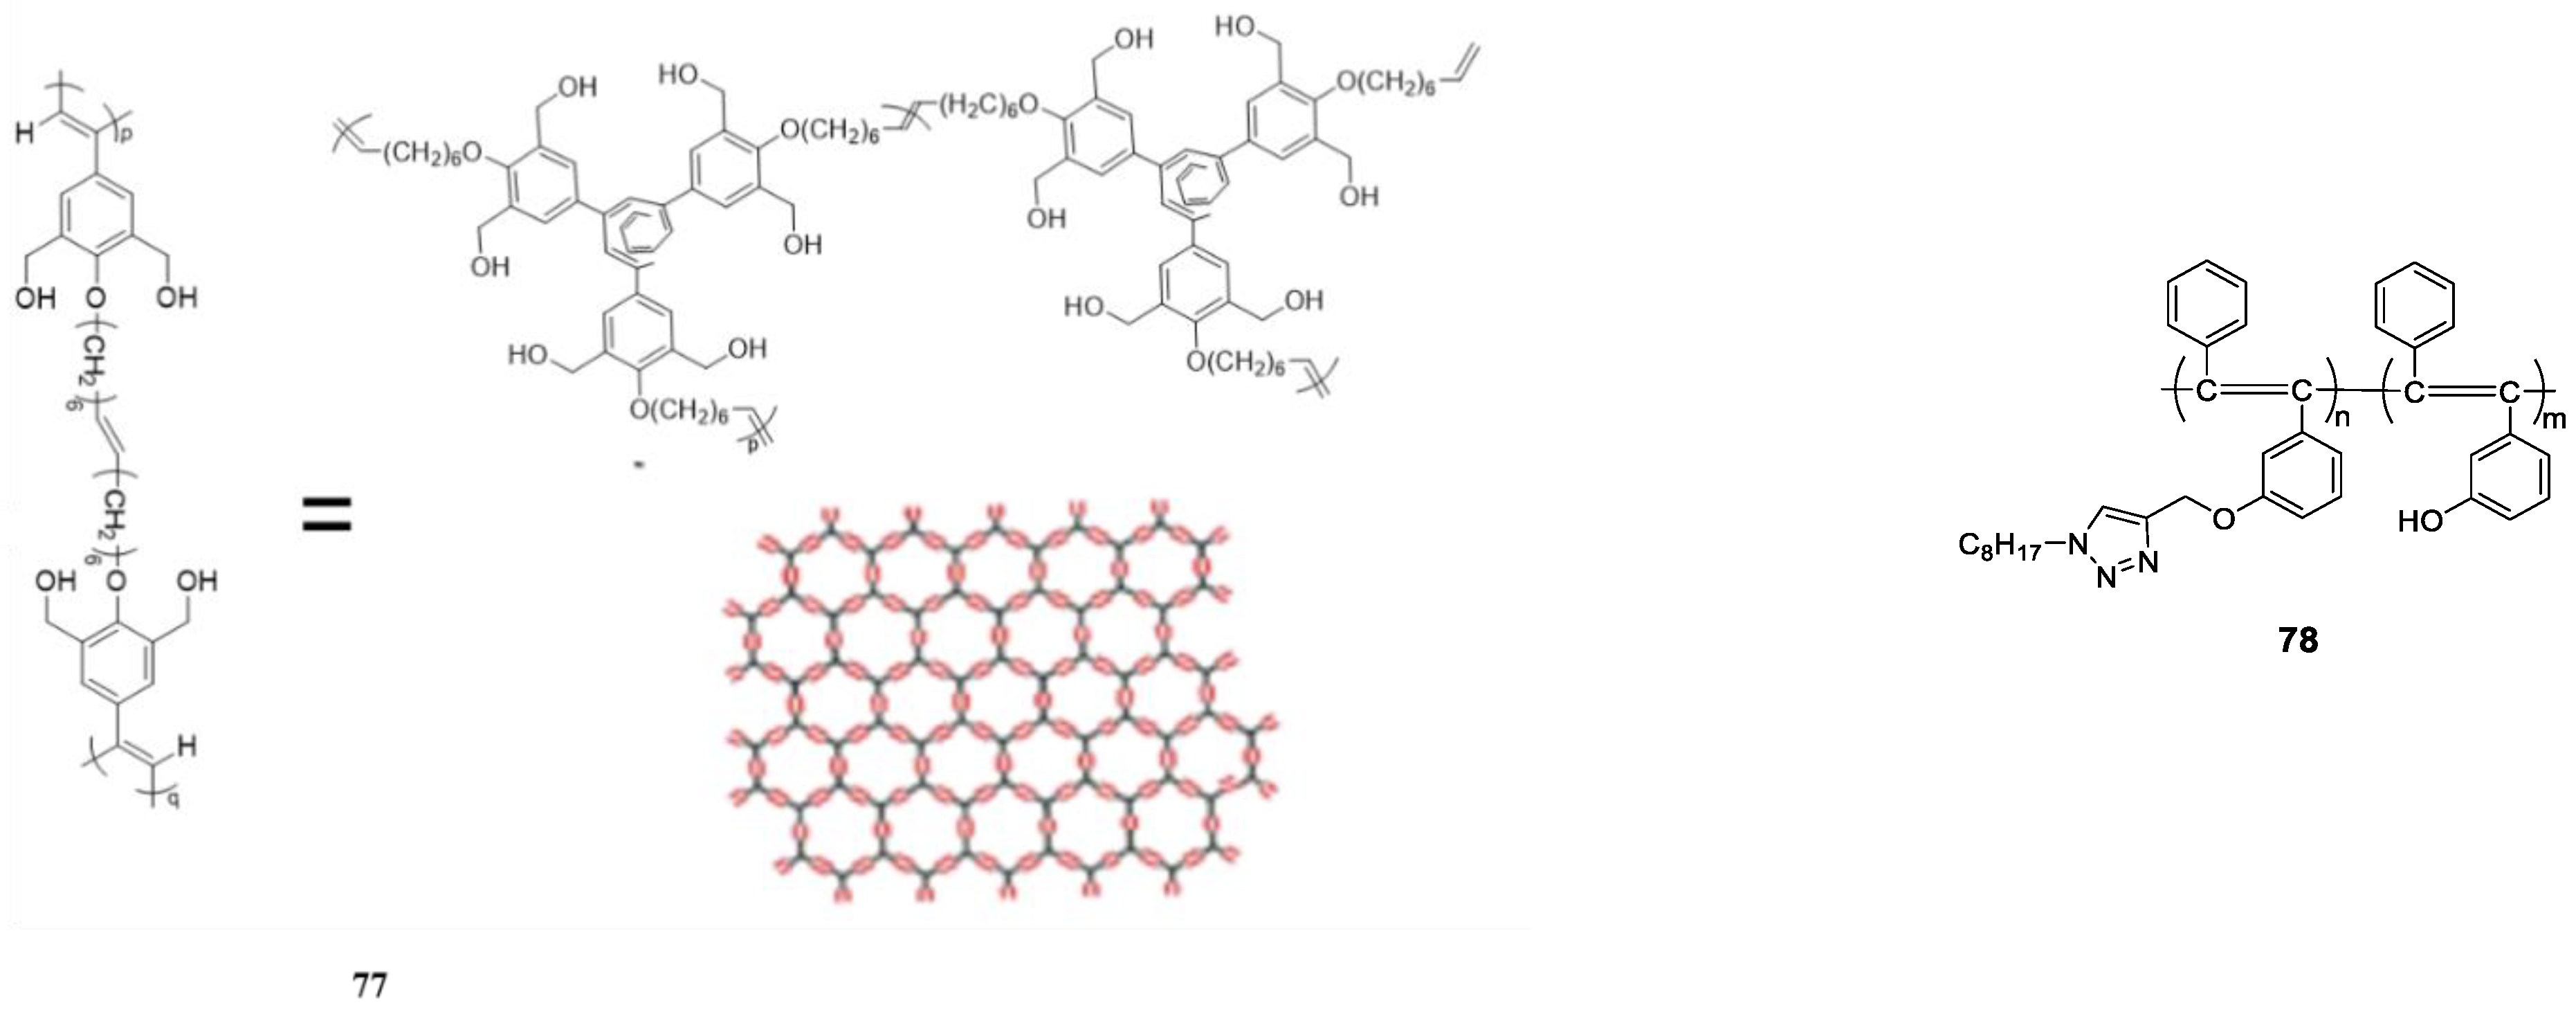
| 60 | 2DP networked (blend) | (5320) | (2.45) | 30–150 | tetrahydrofuran | mixed | [70] (2019) |
| 61 | c-c PA (networked) | (1800) | (2.57) | 40–100 | chloroform | mixed | [71] (2018) |
| 62 | c-c PA (networked) | (4500) | (2.56) | ||||
| 63 | c-c PA (networked) | (6950) | (2.44) | ||||
| 64 | DPA | (3100) | (1.82) | 50–80 | toluene | pure | [72] (2014) |
| 65 | DPA | (1400) | (2.00) | 140–200 | toluene | pure | [73] (2017) |
| 66 | c-c PA | (1740) | (2.54) | 30–50 | chloroform | mixed | [74] (2018) |
| 67 | c-c PA | (1090) | (2.83) | ||||
| 68 | c-c PA | (405) | (3.00) | ||||
| 69 | c-c PA (networked) | (224) | (4.39) | 30–120 | tetrahydrofuran | mixed | [75] (2020) |
| 70 | 2DP (networked) (calcd) | (341) | (4.24) | ||||
| 71 | c-t PA (networked) | (155) | (4.64) | 30–120 | toluene | mixed | [76] (2020) |
| 72 | c-t PA (networked) | (141) | (4.92) | ||||
| 73 | c-t PA (hyperbranched) | (112) | (4.38) | 60–120 | toluene | mixed | [77] (2017) |
| 74 | c-t PA (hyperbranched) | (106) | (4.46) | ||||
| 75 | c-t PA (hyperbranched) | (58.7) | (5.00) | ||||
| 76 | c-c PA (multi-stranded) | (101) | (3.68) | 20 | toluene | mixed | [78] (2017) |
| 77 | c-c PA (networked) | (5.00) | (6.35) | - | - | mixed | [70] (2019) |
| 78 | DPA | (4.00) | (8.90) | - | - | pure | [79] (2015) |
| Code | Polymer Type | PO2 (Barrer) | FFV | α (PO2/PN2) | αD (DO2/DN2) | αS (SO2/SN2) | Ref. (Year) |
|---|---|---|---|---|---|---|---|
| 8 | PA (PTMSP) | 4860 | 0.340 | 1.60 | 1.47 | 1.06 | [9] (1995) |
| 11 | Spiro-PIM (PIM-1) | 317 | 5.00 | [25] (2015) | |||
| (2270) | 0.26 [30] | (2.80) | 2.80 | 1.00 | [24] (2012) | ||
| 45 | Trip-PIM | 3160 (7470) | 0.309 | 4.35 | - | - | [44] (2017) |
| (3.35) | |||||||
| 46 | Trip-PIM | 1170 | - | 5.40 | 4.70 | 1.14 | [58] (2015) |
| (3290) | (3.60) | (5.00) | (0.71) | ||||
| 47 | Trip-PIM | 1073 | - | 5.70 | 5.20 | 1.10 | [59] (2014) |
| (2718) | (4.30) | (3.40) | (1.26) | ||||
| 50 | Trip-PIM-PI | 542 | 6.20 | - | - | [61] (2014) | |
| (627) | - | (5.86) | (5.06) | (1.16) | |||
| 52 | Trip-PIM | 525 | - | 5.90 | - | - | [44] (2017) |
| (368) | - | (6.80) | (6.58) | (1.03) | [63] (2014) | ||
| 53 | Trip-PIM | 500 | - | 5.21 | 5.01 | 1.04 | [64] (2020) |
| (1002) | (3.93) | (4.24) | (0.95) | ||||
| 55 | Trip-PBO | (68.0) | - | 8.10 | 6.75 | 1.18 | [65] (2018) |
| 57 | PAm | (29.0) | 0.188 | 9.67 | 3.88 | 2.47 | [67] (2015) |
| 58 | PAm | (14.2) | 0.159 | 10.2 | 4.67 | 2.19 | [68] (2015) |
| 59 | PI | (8.52) | 0.122 | 20.3 | 7.11 | 2.85 | [69] (2016) |
| Code | PO2 (Barrer) | α (=PO2/PN2) | Thickness (μm) | Feed Gas | Ref. (Year) |
|---|---|---|---|---|---|
| 50 | 627 | 5.86 | 77 | pure | [61] (2014) |
| 59 | 8.52 | 20.3 | 65–75 | pure | [69] (2016) |
| 79 | 1.67 | 4.44 | 200 | mixed | [80] (2016) |
| Code | Type of Precursors | Pyrolysis Temperature (°C) | PO2 (Barrer) | α (=PO2/PN2) | Thickness (μm) | Ref. (Year) |
|---|---|---|---|---|---|---|
| a | PI | 550 | 1530 | 7.50 | 50–80 | [82] (2010) |
| b | PI-PIM | 650 | 1354.5 | 7.00 | 45–60 | [83] (2019) |
| (4.21) | (5.90) | |||||
| c | PI-PIM | 600 | 1071 | 5.80 | 80–100 | [84] (2013) |
| d | PI | 500 | 815 | 8.20 | 40–50 | [85] (1997) |
| e | PI | 550 | 812 | 7.50 | 25–60 | [86] (2000) |
| (69.0) | (4.10) | |||||
| f | PI | 500 | 723.7 | 24.2 | - | [87] (2008) |
| (11.6) | (3.90) | |||||
| g | PI | 700 | 707 | 9.00 | 25 | [88] (2004) |
| h | Sulfonated phenolic resin | 500 | 660 | 12.0 | 22 | [89] (2003) |
| i | PI | 550 | 630 | 10.0 | 40 | [90] (2004) |
| j | PIM(cross-linked) | 300 | 582 | 6.10 | 50–60 | [91] (2011) |
| k | PI | 700 | 501 | 10.0 | 28 | [89] (2004) |
| l | PI | 650 | 383 | 6.70 | 45–60 | [83] (2019) |
| (2.46) | (6.50) | |||||
| m | PI | 700 | 256 | 11.0 | 28 | [89] (2004) |
| n | PI + ZSM | 650 | 200 | 10.3 | 50 | [92] (2008) |
| o | PI + Ag | 600 | 170 | 8.50 | 20 | [93] (2003) |
| p | PI + MFI zeolite | 600 | 168 | 10.0 | 4.5 | [94] (2013) |
| q | PBI | 580 | 156 | 29.1 | - | [95] (2014) |
| (0.009) | (2.02) | |||||
| r | PI | 700 | 136 | 15.0 | 30 | [96] (2005) |
| s | PI | 800 | 126 | 8.55 | - | [95] (2014) |
| t | PPO | 290 | 125(25.0) | 10.0(4.50) | 25–38 | [97] (2007) |
| u | PI | 800 | 69 | 9.02 | - | [95] (2014) |
| v | PI | 800 | 68 | 18.5 | 20–30 | [98] (2003) |
| w | PPO | 650 | 54.7 | 11.4 | 25–38 | [97] (2007) |
| (7.50) | (5.50) | |||||
| x | PI | 800 | 34.8 | 11.5 | 113 | [99] (1997) |
| y | PI | 800 | 25.0 | 14.0 | 35–60 | [100] (2003) |
| z | PI | 800 | 19.3 | 32.1 | 20–30 | [98] (2003) |
| (0.27) | (4.50) | |||||
| A | PI | 900 | 10.0 | 21.0 | - | [101] (2006) |
| (2.00) | (6.62) | |||||
| B | PSF | 800 | 4.50 | 27.5 | - | [102] (2006) |
| C | PSF | 800 | 4.43 | 24.6 | 50 | [103] (2009) |
| (0.27) | (3.30) |
Publisher’s Note: MDPI stays neutral with regard to jurisdictional claims in published maps and institutional affiliations. |
© 2021 by the authors. Licensee MDPI, Basel, Switzerland. This article is an open access article distributed under the terms and conditions of the Creative Commons Attribution (CC BY) license (https://creativecommons.org/licenses/by/4.0/).
Share and Cite
Wang, J.; Shi, Z.; Zang, Y.; Jia, H.; Teraguchi, M.; Kaneko, T.; Aoki, T. Macromolecular Design for Oxygen/Nitrogen Permselective Membranes—Top-Performing Polymers in 2020—. Polymers 2021, 13, 3012. https://0-doi-org.brum.beds.ac.uk/10.3390/polym13173012
Wang J, Shi Z, Zang Y, Jia H, Teraguchi M, Kaneko T, Aoki T. Macromolecular Design for Oxygen/Nitrogen Permselective Membranes—Top-Performing Polymers in 2020—. Polymers. 2021; 13(17):3012. https://0-doi-org.brum.beds.ac.uk/10.3390/polym13173012
Chicago/Turabian StyleWang, Jianjun, Zhichun Shi, Yu Zang, Hongge Jia, Masahiro Teraguchi, Takashi Kaneko, and Toshiki Aoki. 2021. "Macromolecular Design for Oxygen/Nitrogen Permselective Membranes—Top-Performing Polymers in 2020—" Polymers 13, no. 17: 3012. https://0-doi-org.brum.beds.ac.uk/10.3390/polym13173012