
Heat Analysis of Thermal Conductive Polymer Composites: Reference Temperature History in Pure Polymer Matrices


Abstract
:1. Introduction
2. Experimental Procedures
2.1. Preparation of Polymer Matrix Specimens
2.2. Preparation of TCP Composite Specimens

| Preparation Stage | Parameters | Glass/Epoxy | Glass/Polyester |
|---|---|---|---|
| Layup molding at ambient environment | Time | 24 h | MEKP hardener |
| Pressure | 3 kPa | 3 kPa | |
| Temperature | Room temperature | Room temperature | |
| Humidity | <70% | <70% | |
| Curing cycle in autoclave | Time | 15 h | 2 h |
| Pressure | 3 kPa | 3 kPa | |
| Temperature | 60 °C | 60 °C | |
| Cooling time | 8 h | 2 h |
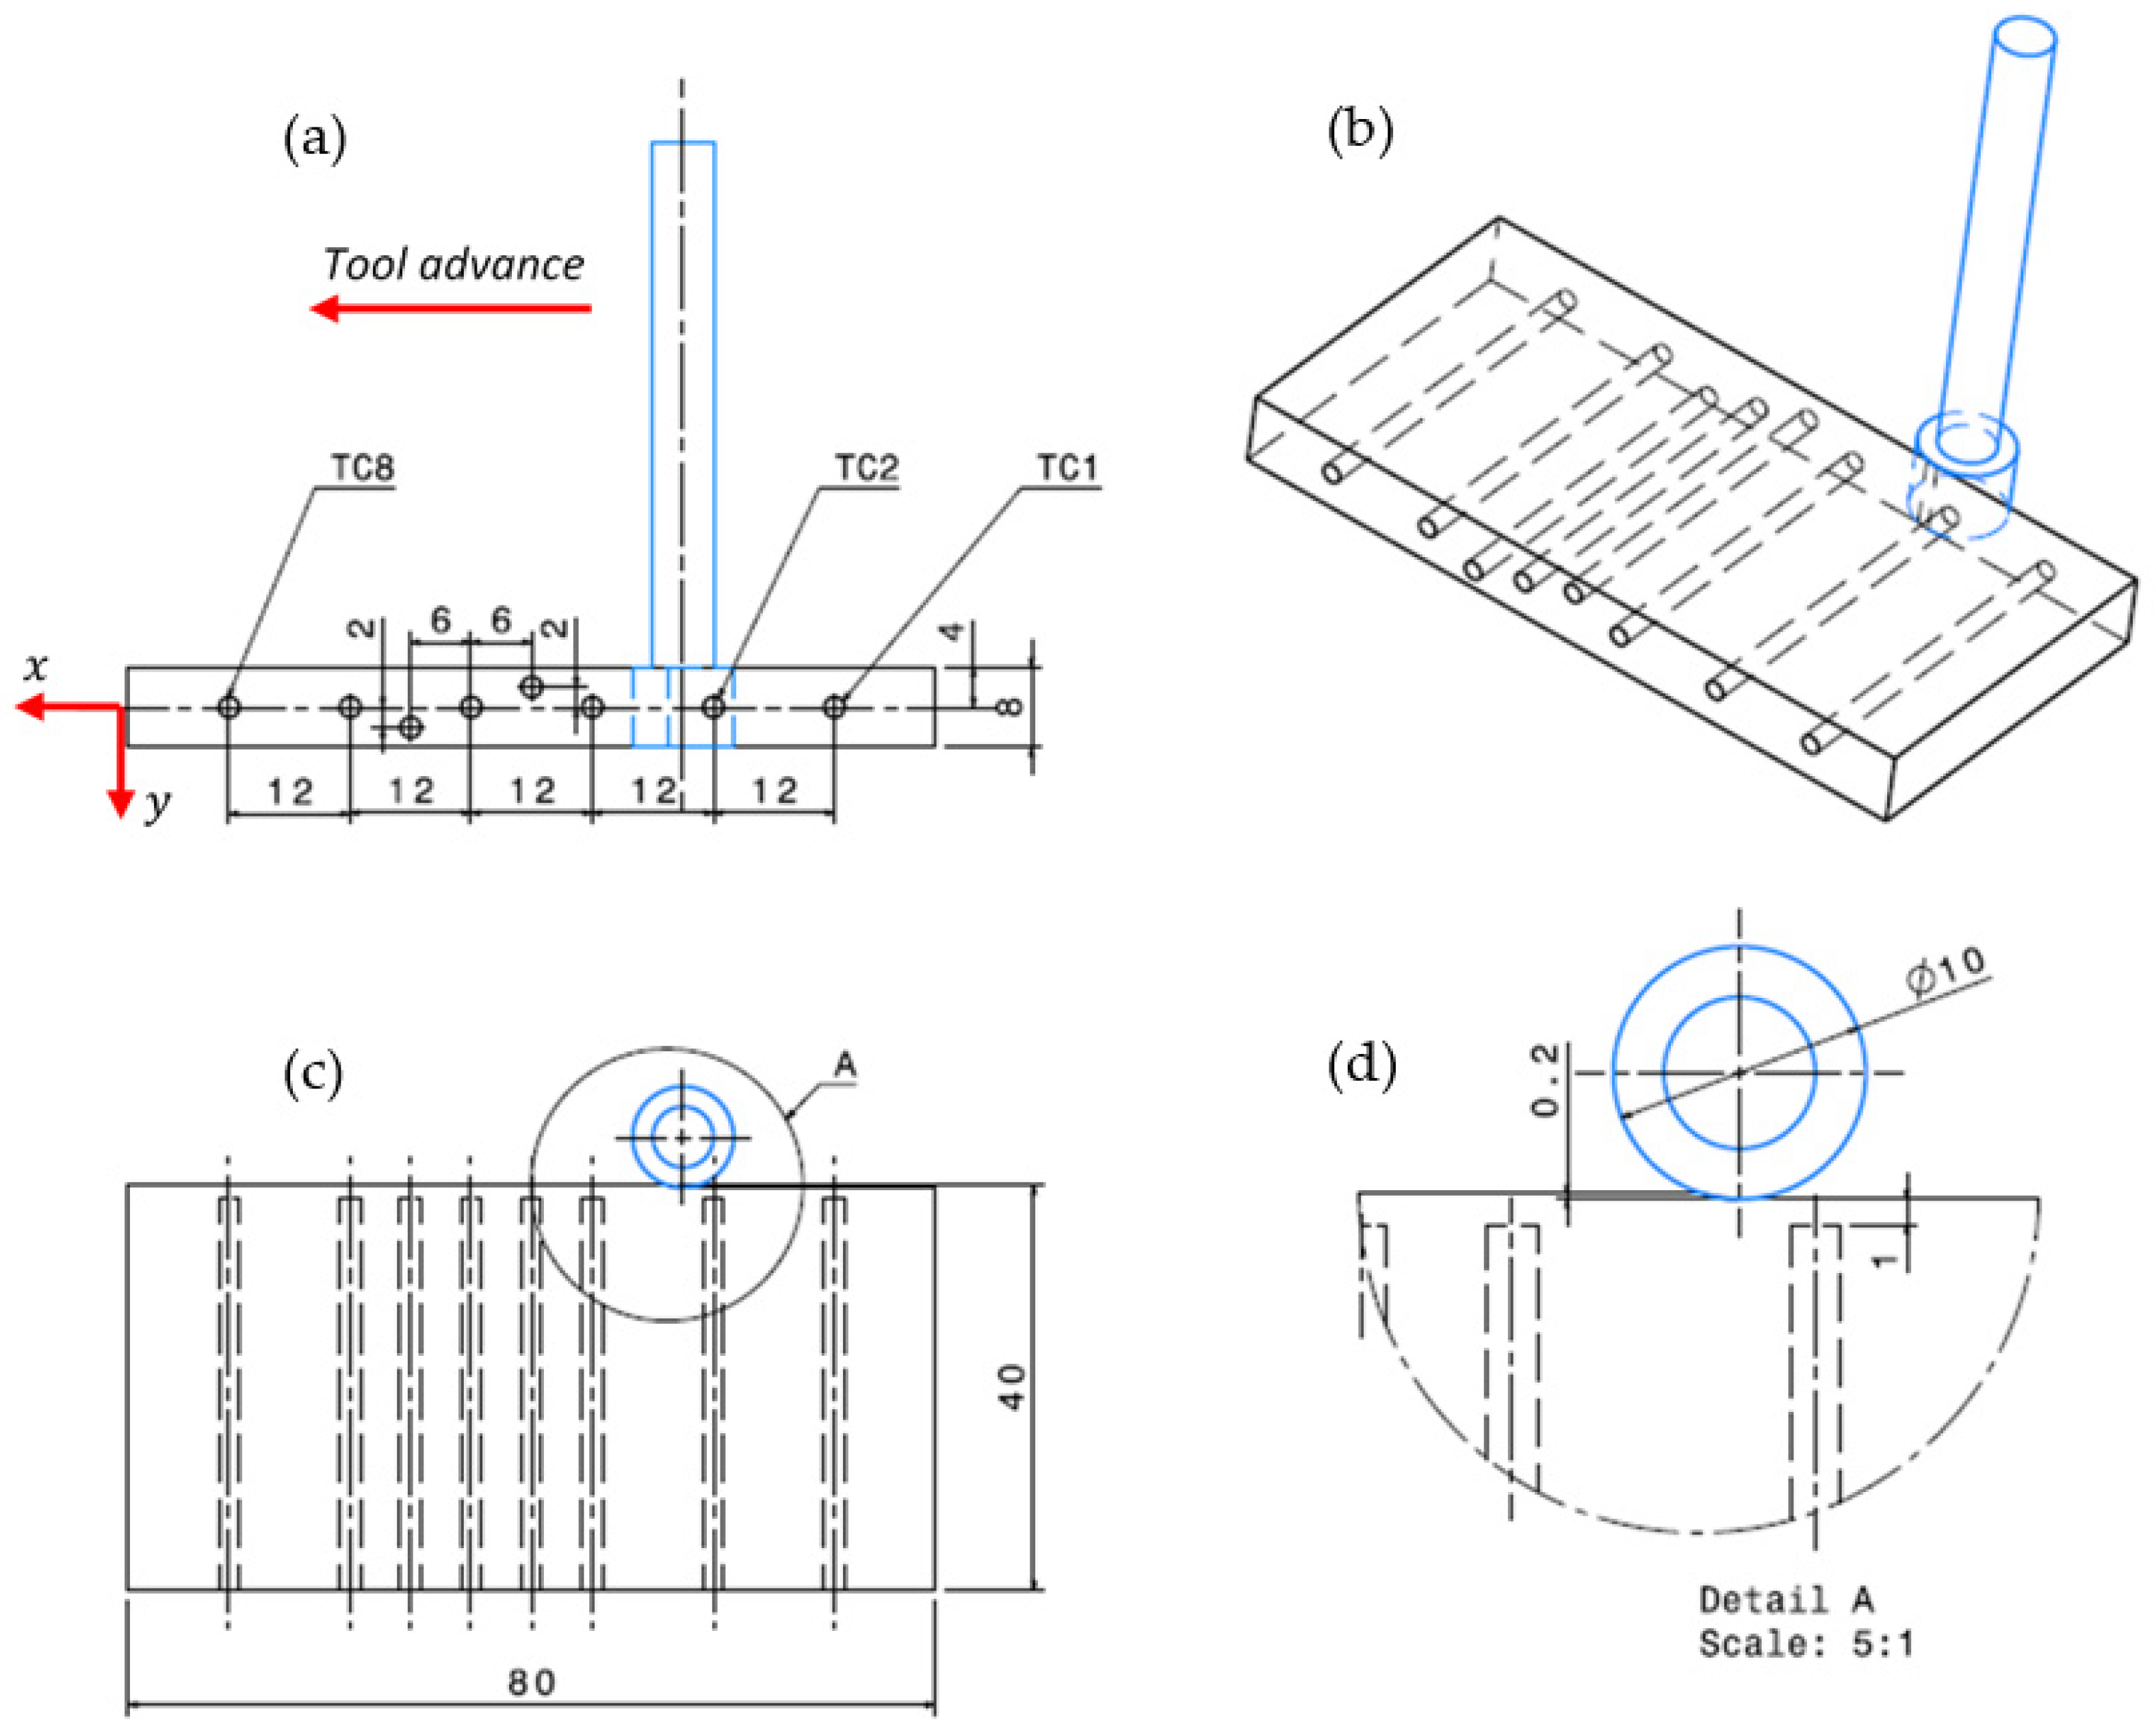
2.3. Milling Test
2.4. Temperature Acquisition
| Components | Specifications | Range |
|---|---|---|
| 8 type K TCs (Nickel-chromium/nickel-aluminum) | Measurement range Diameter of conductor Diameter of cable Precision Seebeck coefficient at 0 °C | 0.2 mm 2 mm |
| 8 Max6675 Sensor Modules for Arduino | Voltage Intensity Accuracy Resolution | ±1.5 °C 0.25 °C |
| Arduino board based on ATmega2560 with USB connection | Frequency Total inputs/outputs PWM * input Analog input UART ** | 16 MHz 54 Channels 14 Channels 16 Channels 04 Channels |
| Dupont male/female connection cables | Appropriate connecting | |
| Computer with Arduino user interface | Appropriate interface |
3. Results
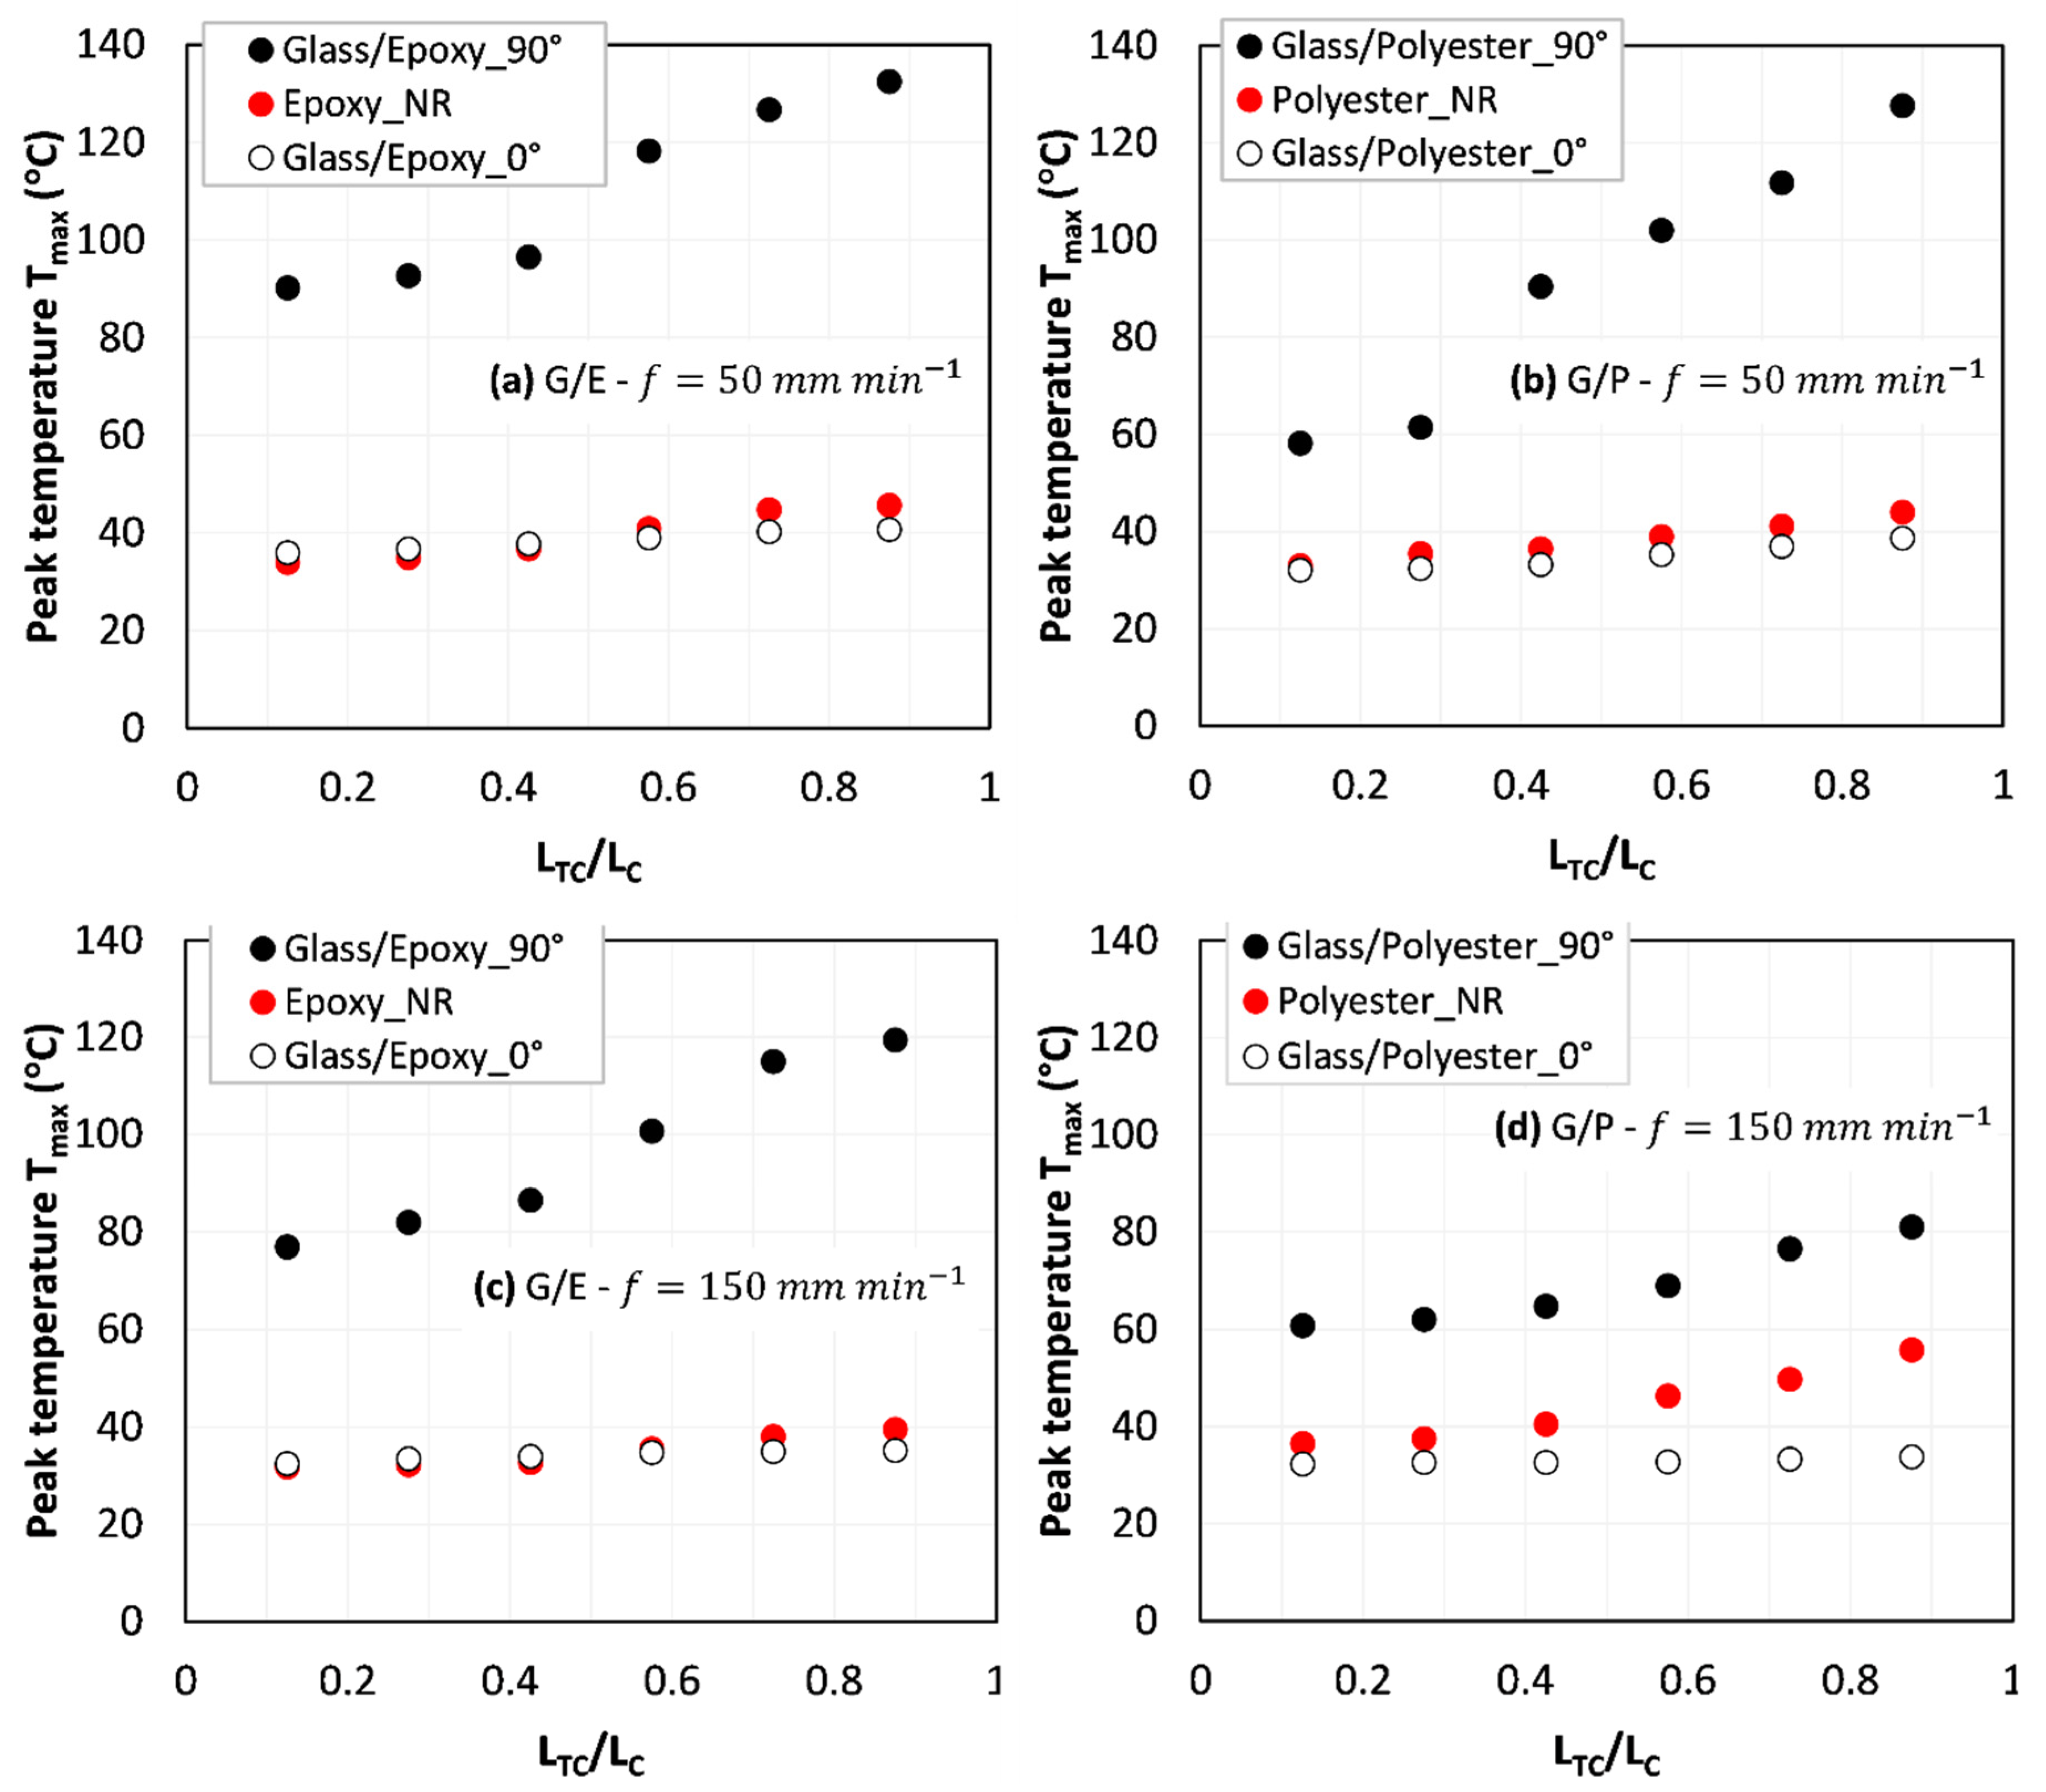
3.1. Peak Temperature vs. Cutting Length
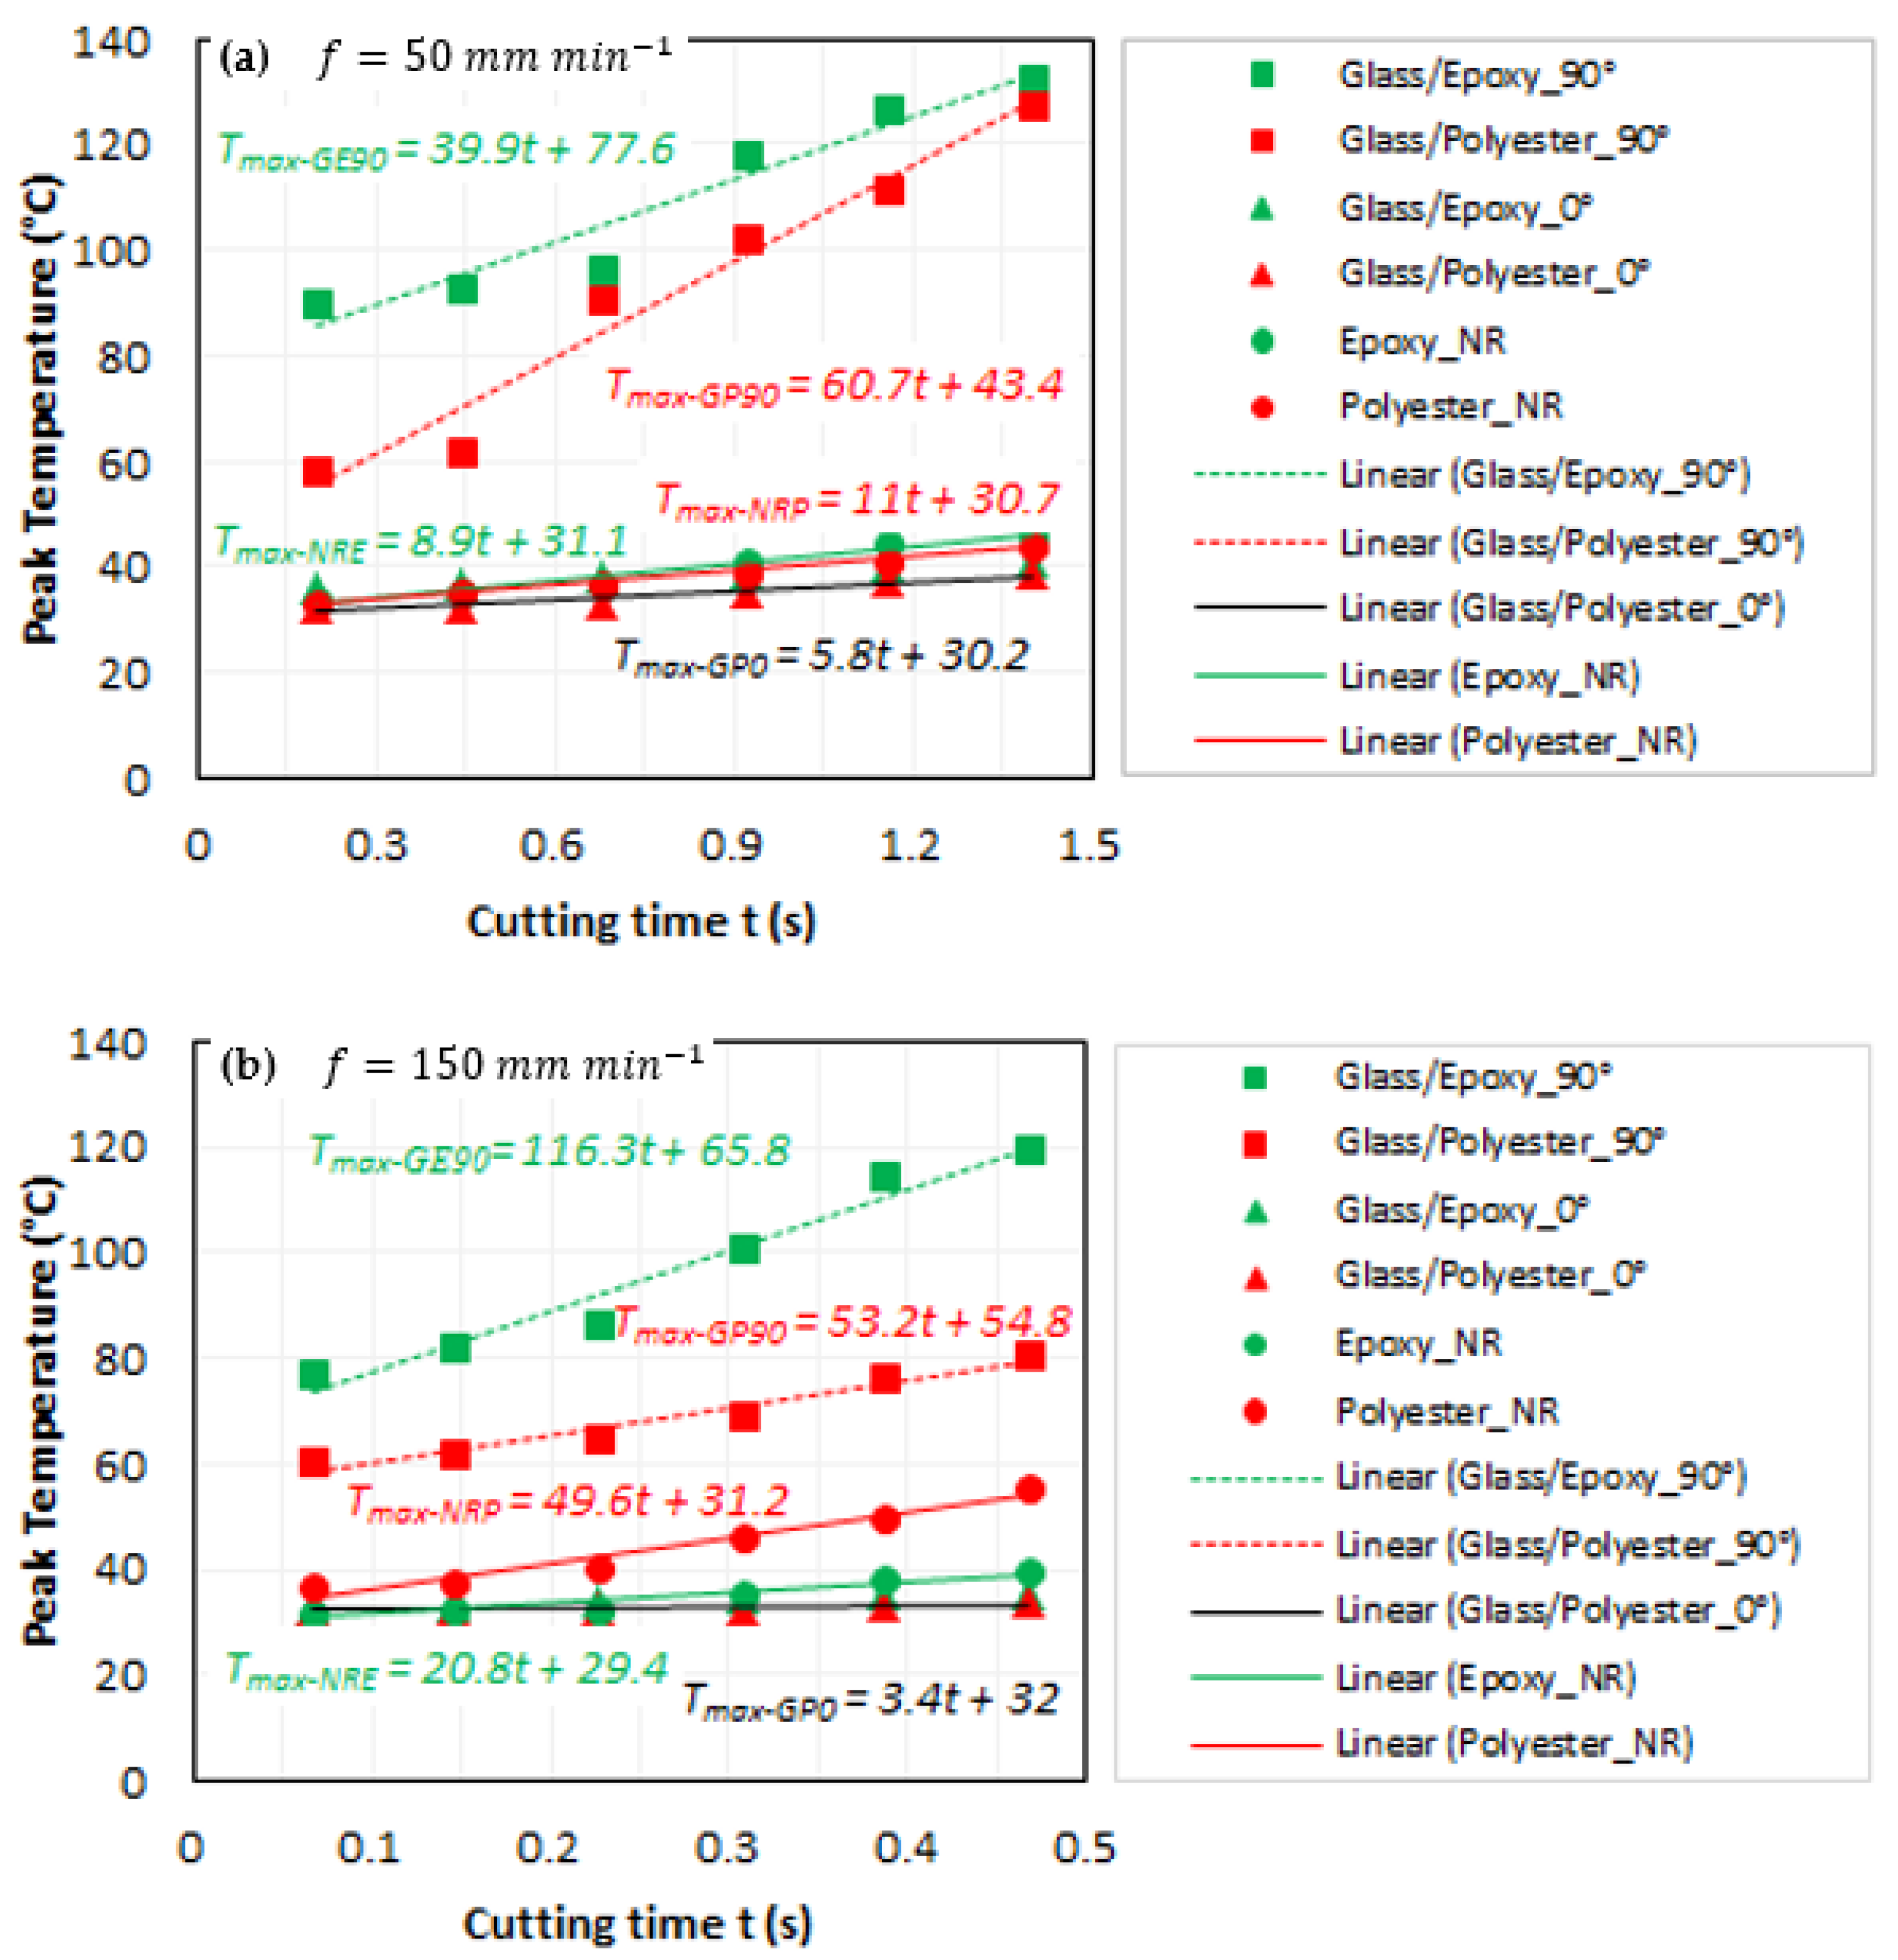
3.2. Temperature Rate vs. Feed Rate
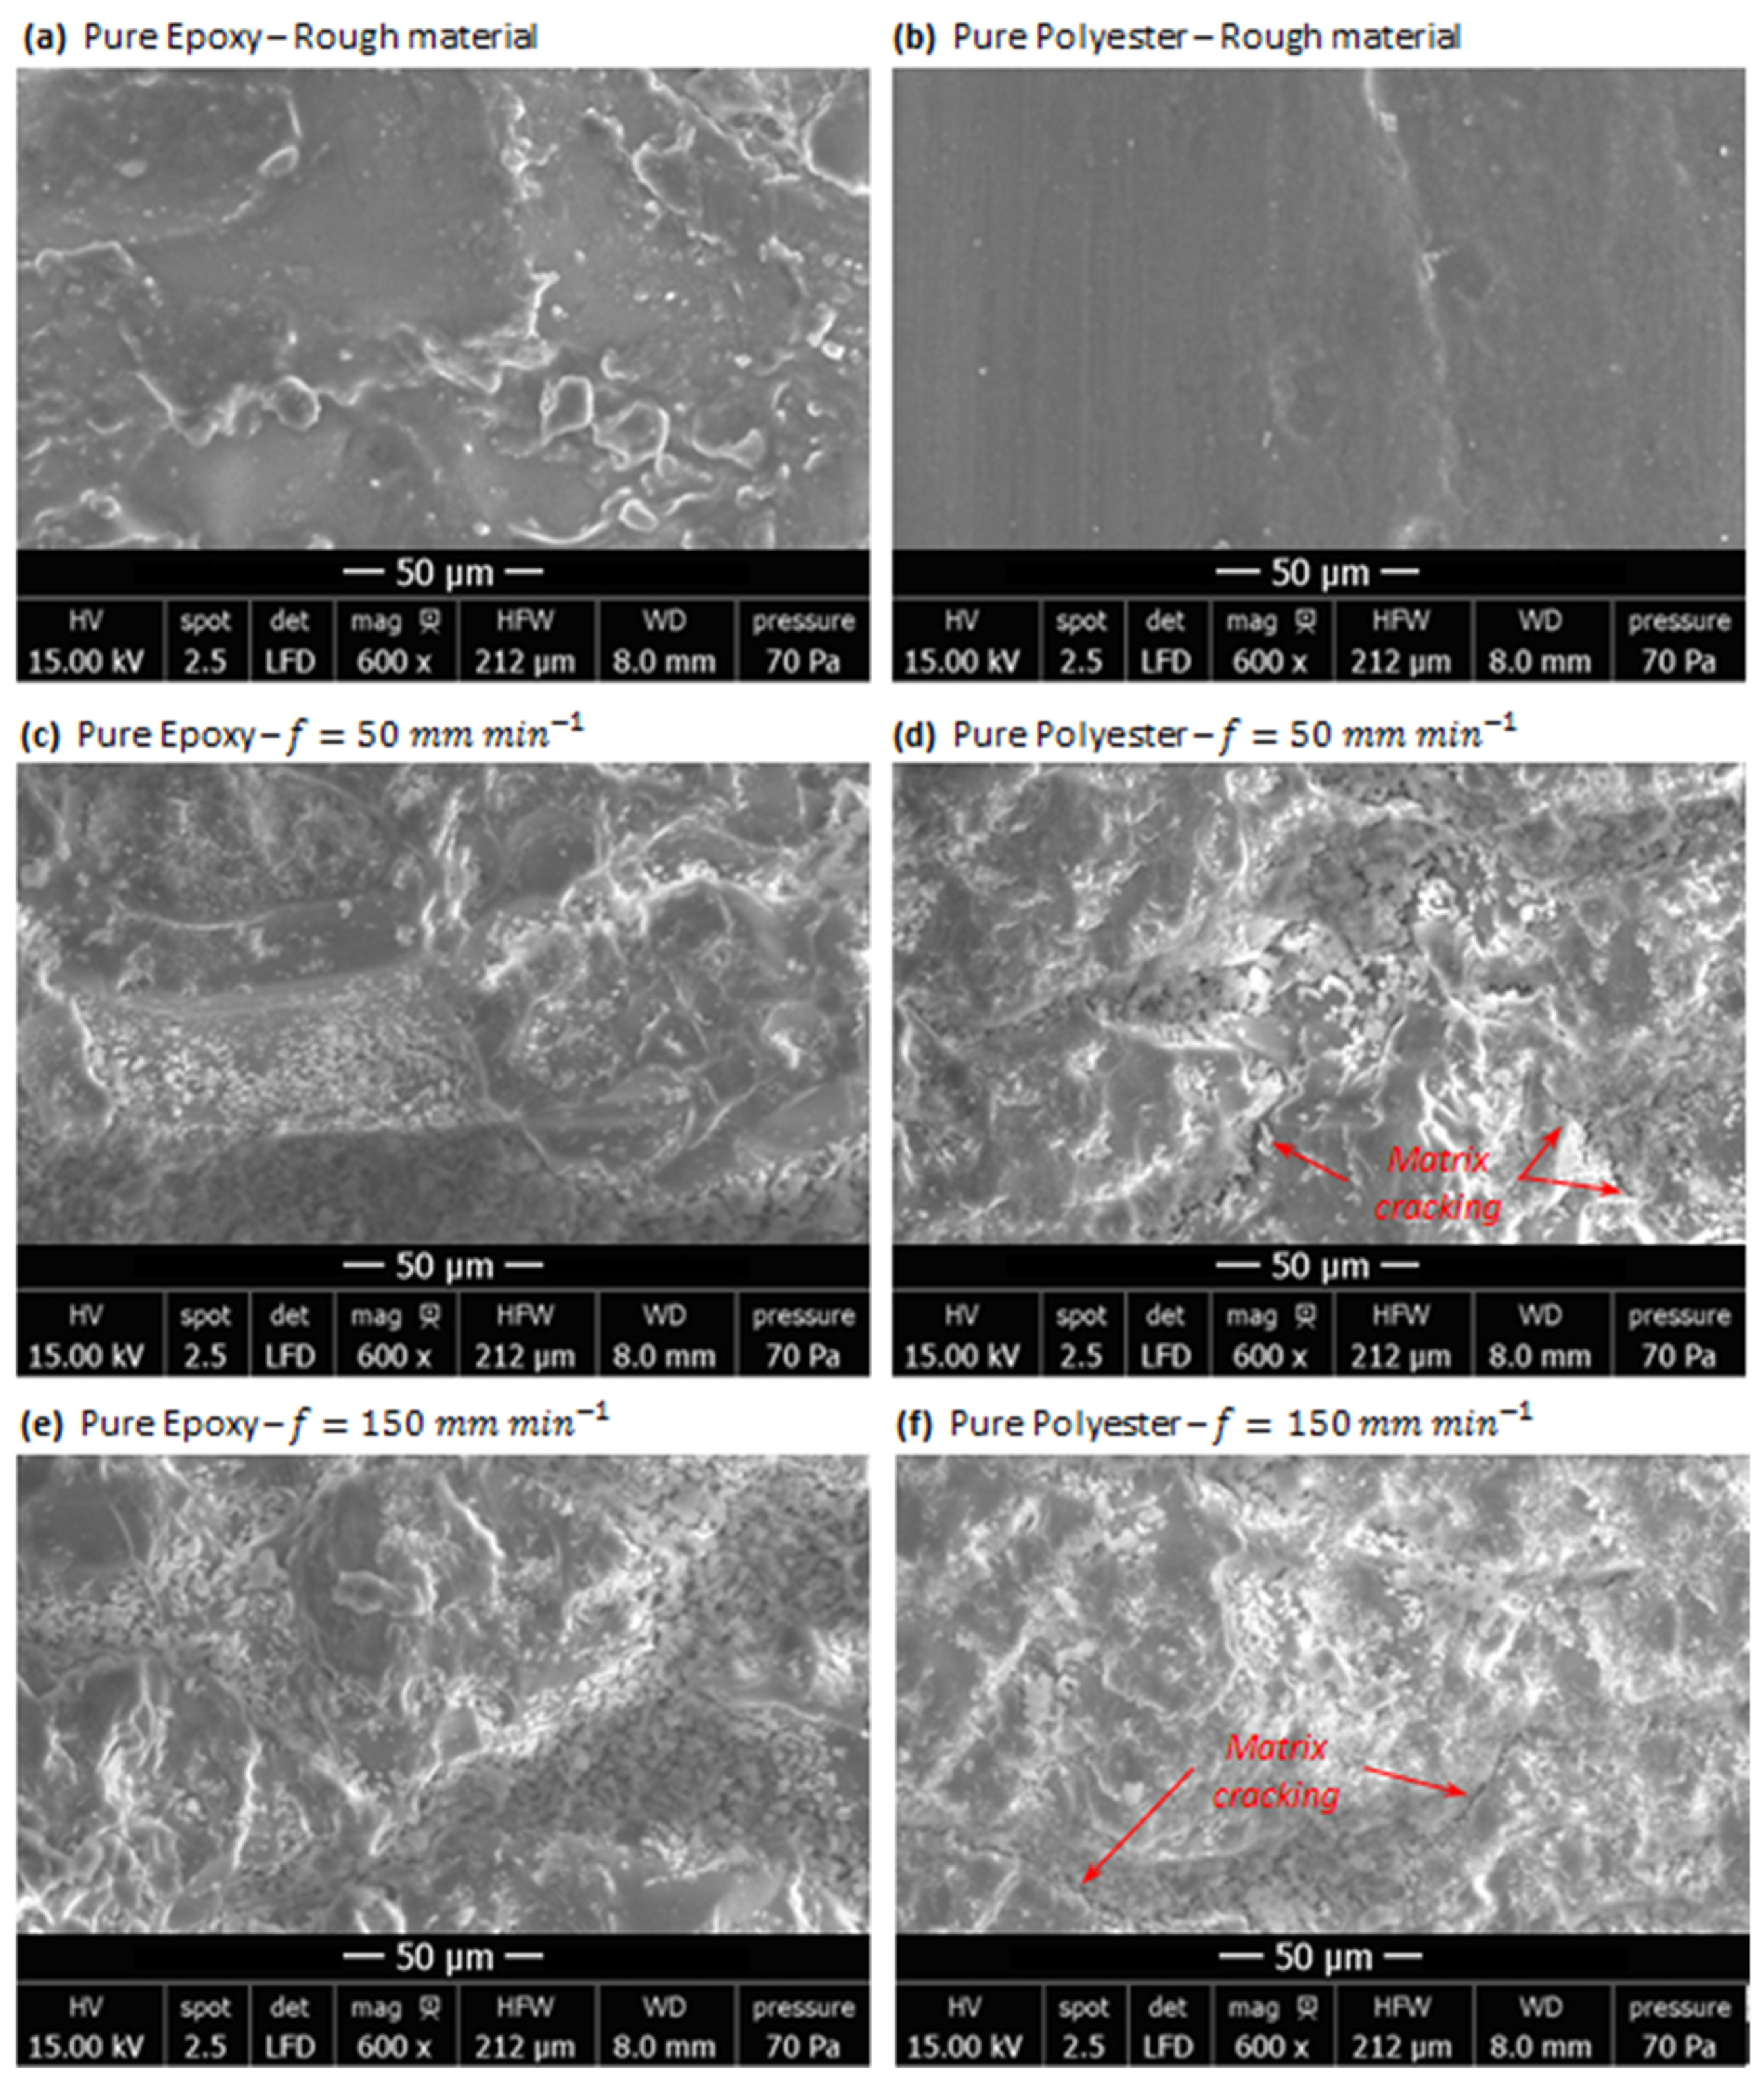
3.3. Milling-Induced Signature into Pure Polymer Matrices
3.4. Milling-Induced Signature into TCP Composites
3.4.1. When Cutting Parallel to Fiber
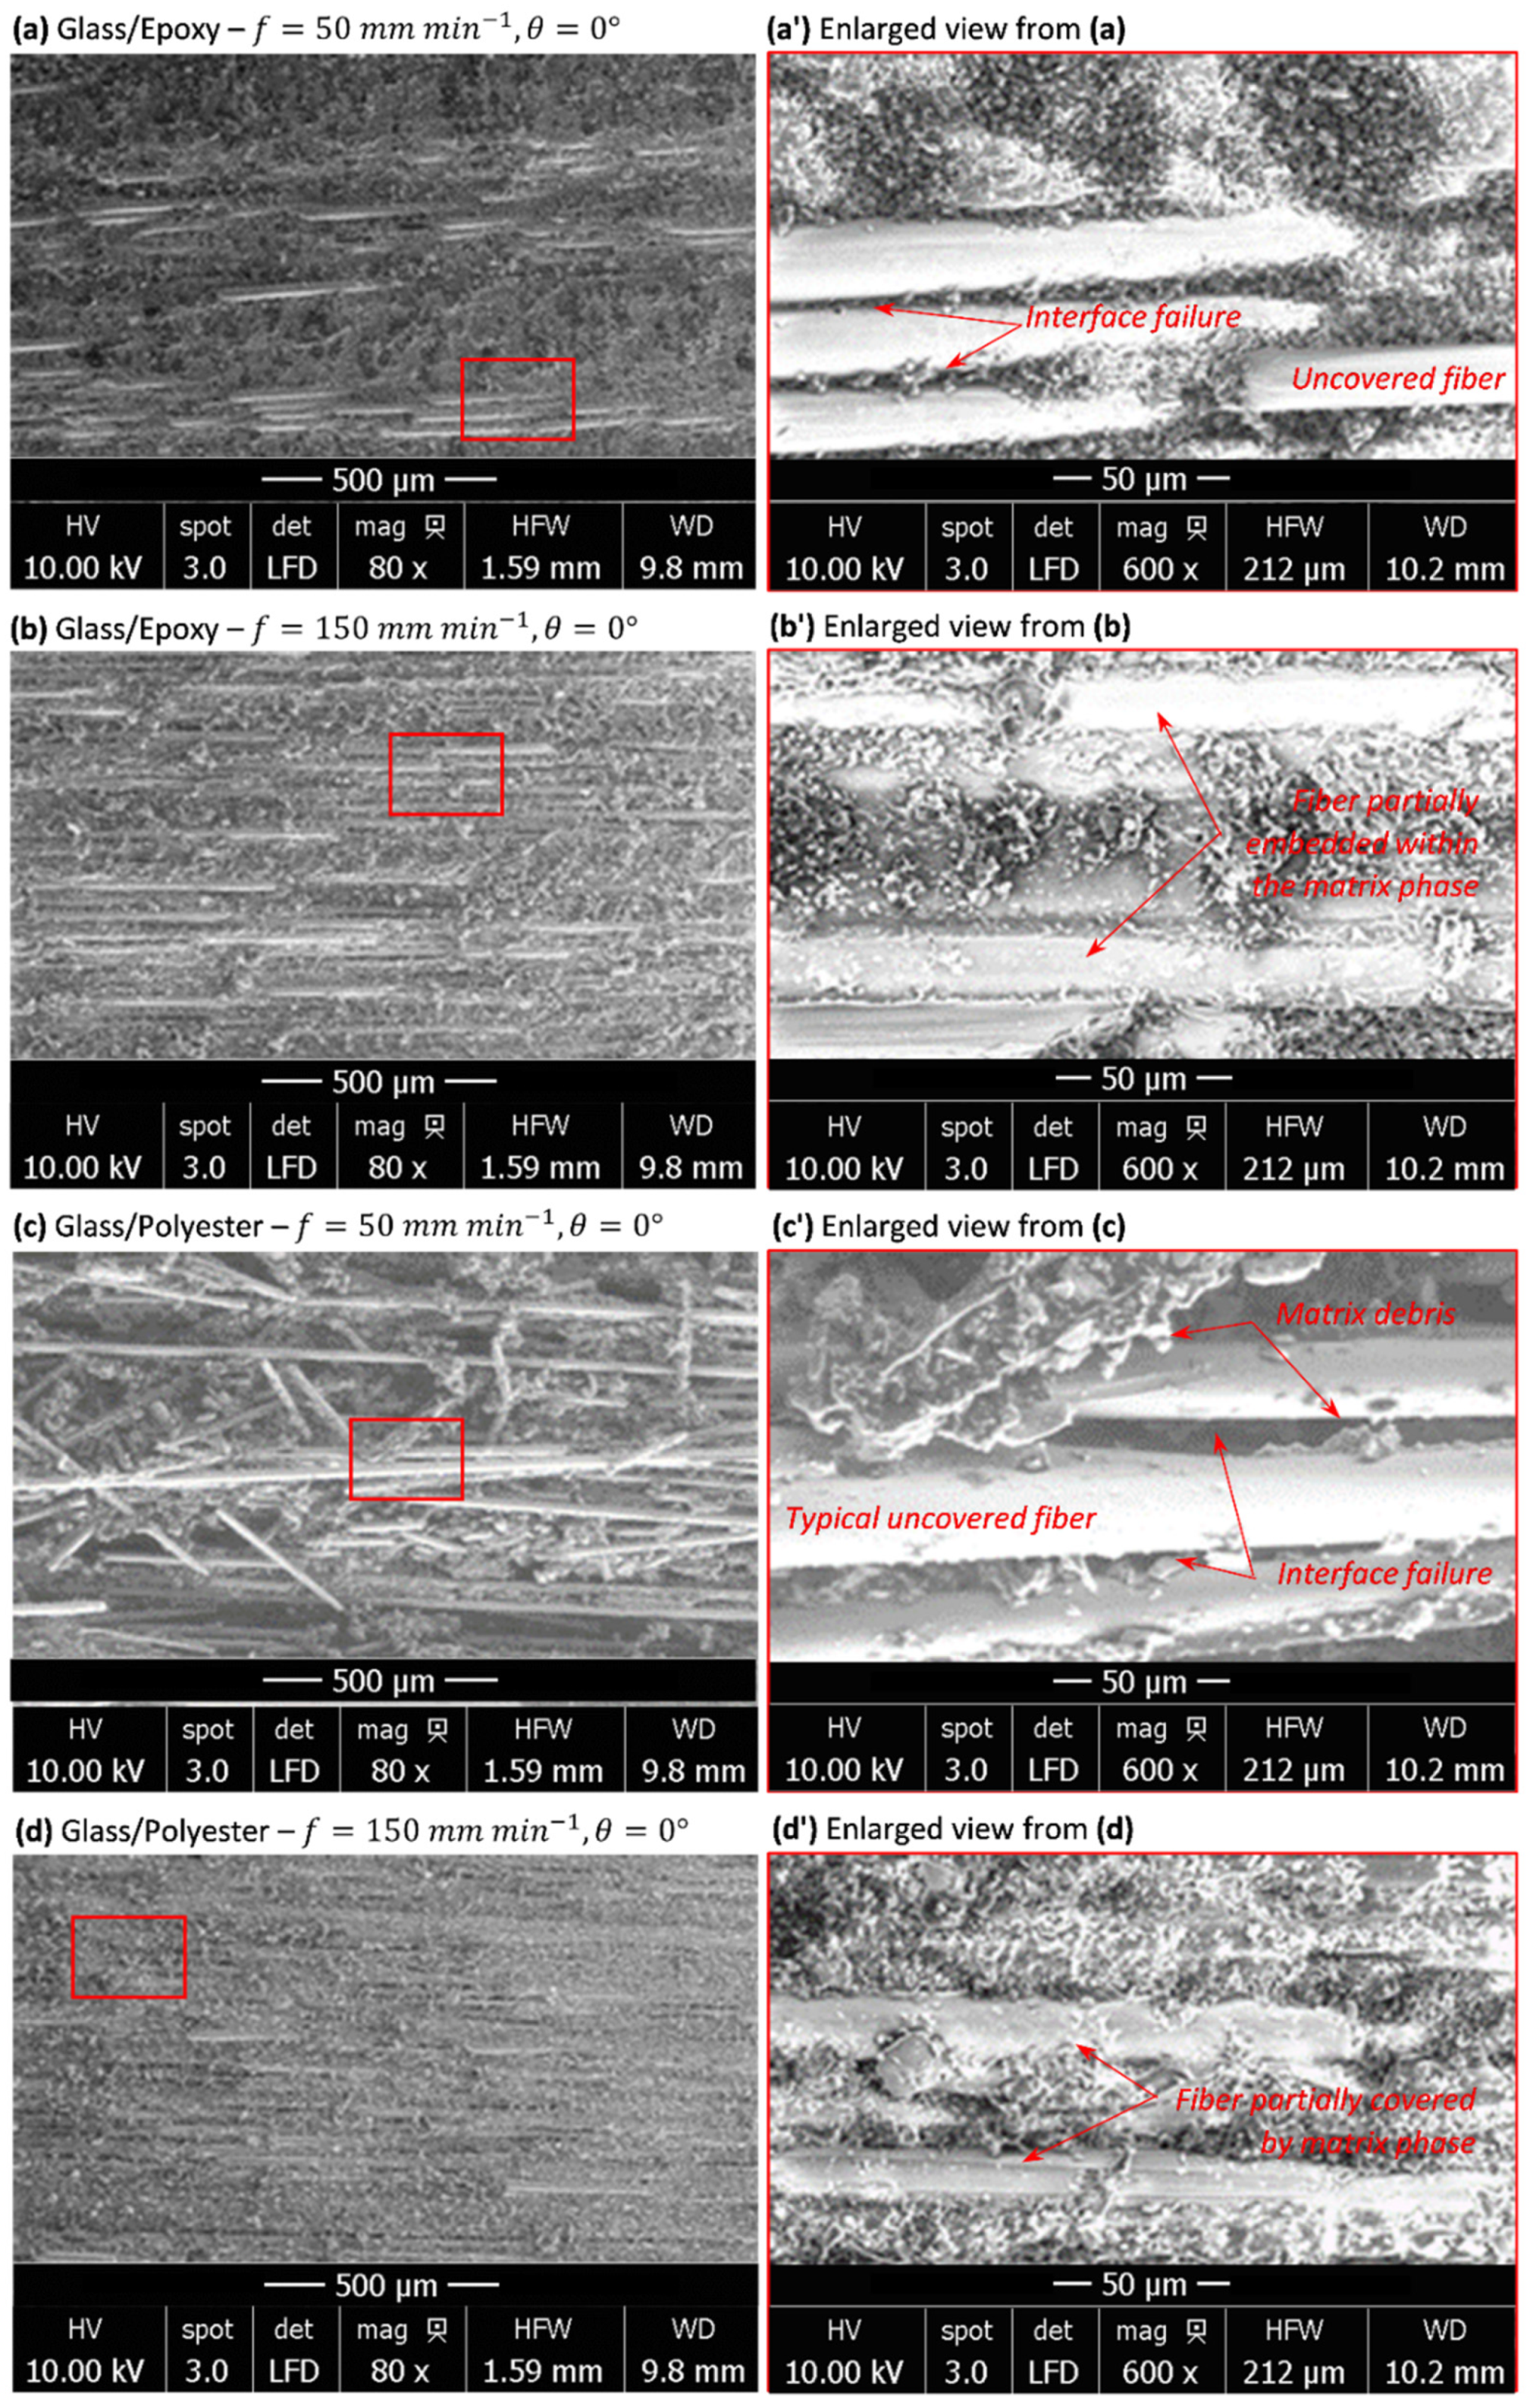
- At (Figure 5a,c), the material removal process looks different from that at the highest considered feed irrespective of the matrix type. In this case, the rest of the fibers embedded in the matrix and the free fiber fragments appear completely uncovered in the matrix phase. Observations of the respective enlarged views (Figure 5a,c) prove the total failure of fiber–matrix interfaces with the presence of pure polymer matrix debris. In fact, as glass fiber is of very low thermal conductivity, it plays a role in locally stopping heat transfer from the matrix and thus acts to localize temperature at its lateral surface (i.e., interface), which significantly enhances property degradation at fiber–matrix interfaces and leads to premature failure. On the other hand, one can recall that the specific heat capacity of glass ( [38,39]) is significantly lower than those of the considered matrices. This entails that at a specific heat threshold, glass stops to absorb heat while the matrix absorbs much higher quantity. These effects will localize heat within the fiber–matrix interfaces, which have been found to be forced to resist the opposite flux, yielded from either phase. This will accelerate fiber–matrix failure. Such failure mechanisms might also be observed through the long uncovered rests of fibers that are still embedded on the cut surface. The same failure mechanisms dominate the material removal process of both glass/epoxy and glass/polyester. However, experimental measurements (see appropriate plots in Figure 3) confirm the same temperature level when milling parallel to the fiber whatever the composite type is. This entails that in such cutting configuration, the chip formation stage is highly governed by the fiber phase, while the matrix phase fails prematurely, long before, hence favoring direct contact between the wheel abrasive grains and the glass fiber units.
- At (Figure 5b,d), the temperature rate is much lower than that obtained at . This lets us consider that heat localizes much less when feed increases. Referring to micrographs of Figure 5b,c, it can be seen that the fiber–matrix interface exists, and no matrix loss around the fiber units was observed out of the trim plan. Over the fresh surface, the fibers look covered or partially embedded by the matrix phase along either visible side. Temperature seems not to reach a value high enough to yield interface loss. In such case, a separated chip forms fragments consisting of glass fiber covered with the surrounding resin. Hence, mechanical damage rather than heat localization effects mainly governs the material removal process. While interface loss owing to heat localization at involves discontinuities in heat transfer between composite phases, continuity seems to be ensured at , but heat effects were found to be attenuated compared with mechanical ones.
3.4.2. When Cutting Perpendicular to Fiber
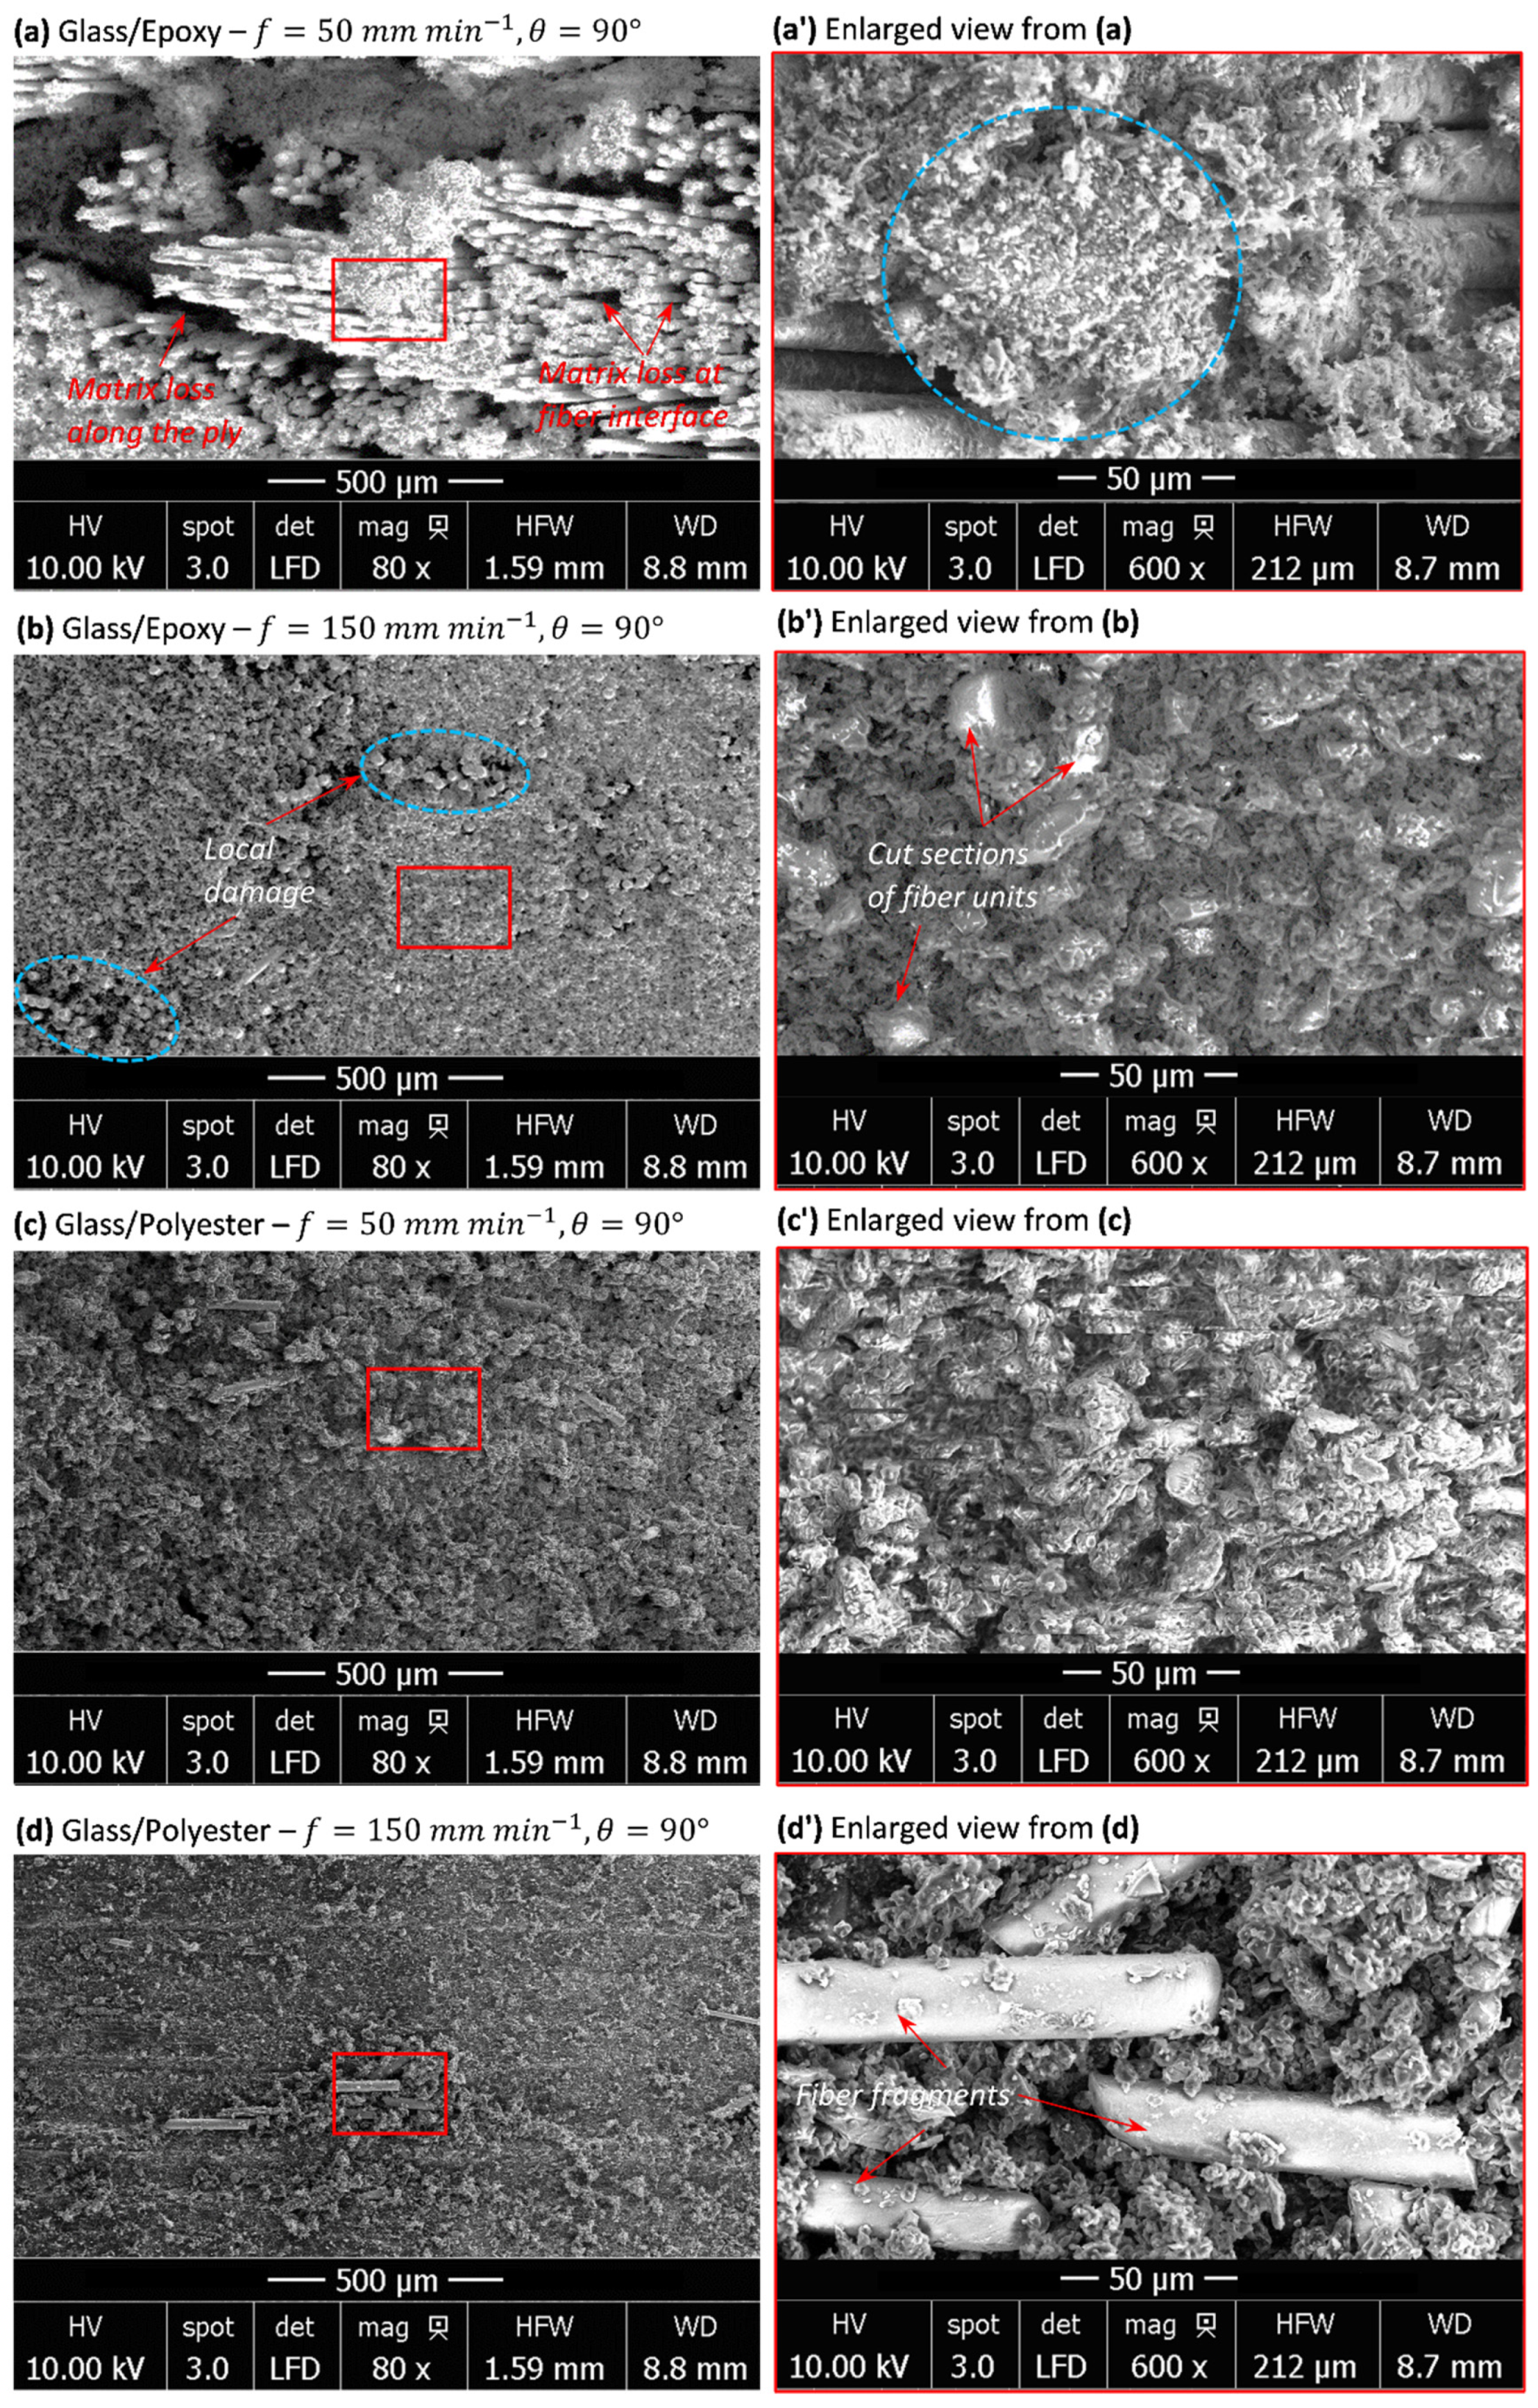
- For glass/epoxy, inspections reveal catastrophic failure, typically at . Matrix loss takes place within plies and surrounding fiber units yielding deep damage on the trim plan (Figure 6a). Cut fibers exhibit neat mode-II failure throughout the milled land. Matrix cracking seems to result from combined effects, mechanical and thermal, providing that temperature histories (Figure 3a) implicitly inform about heat generation. In fact, the highest heat localization should particularly occur when milling perpendicular to the fibers, and furthermore, for glass/epoxy, since the peak temperature reaches the maximum values at that configuration. While no fiber fragment was observed on the cut surface, free matrix residues potentially released from interfaces were detected at the trim plan (Figure 6a). Provided a fixed depth of the cut (i.e., 0.2 mm), the material removal process involves a series of neat fractures of successive fiber plies, hence resulting in a dusty chip with a relatively uniform chip size. In contrast, when cutting parallel to the fiber, the chip forms are irregular, consisting of relatively long fiber fragments (see the typical chip size in Figure 5c). However, at , micrographs exhibit a smoother cut area compared with the former one. Despite the presence of local degradation by the effect of matrix cracking (Figure 6b), subsurface damage appears less critical than that developed at a low feed rate.
- For glass/polyester, fresh surfaces inform about the cutting process much less severe than that observed in glass/epoxy despite insignificant difference in results existing when the feed rate varies. As regards glass/epoxy, matrix loss is also more visible at (Figure 6c,d). The temperature drop pointed out when the feed decreases should play a key role in the evolution of damage mechanisms. Because of the effect of relatively low thermal conductivity, glass fibers act as thermal walls to limit heat transfer. Heat localizes within the intermediate matrix phase and leads to properties’ degradation. This decides on the chip formation mechanisms and governs the surface integrity at the trim plan. Regardless of the cutting feed, the matrix phase seems to relatively dominate the initial stage of the material removal process. Before fiber failure, the matrix should release the surrounding fiber, hence motivating the uncovered fiber to be cut during wheel advance.
4. Discussion
5. Conclusions
- Milling TCP composites parallel to the fiber weakly affects the temperature history when compared with that obtained in pure polymer matrices. However, the peak temperature was found to be slightly more sensitive and typically inversely proportional to the feed rate. The lateral surface of the fiber coming into contact with the tool plays a role in favoring sliding at wheel–fiber interfaces, hence preventing severe friction, considered as the main source for generating heat. SEM inspections highlight elementary mechanisms dominating the material removal process. At , quasi-total loss of resin surrounding the fiber units precedes the final stage of chip formation due to the very low specific heat and conductivity of glass, which plays a role in localizing heat at interfaces and, hence, favors its degradation. At , the temperature rate was found to be significantly lower and heat effects appeared to be attenuated compared with the mechanical ones.
- In contrast, measurements show a significant increase in peak temperature when milling composites perpendicular to the fiber by referring to it, resulting in milling pure polymer matrices. The transverse brittle failure of fiber units leads to a fresh area with an irregular aspect rough enough to drastically enhance friction. The severe contact conditions yield heat flux capable of switching peak temperature by a large gap when compared with that found when milling parallel to the fiber. Typically, a catastrophic failure resulting in matrix loss takes place within plies and the surrounding fiber units, yielding deep damage on the trim plan when milling glass/epoxy at . A chip forms because of a series of neat fractures, leading to a uniform chip size. However, subsurface damage appears to be less critical at in spite of local degradation, resulting in matrix cracking.
- Chip formation is mainly governed by the fiber phase, while the matrix phase fails prematurely, long before, when milling parallel to the fiber at relatively low feed rates. However, the matrix phase seems to dominate the initial stage of the material removal process when milling perpendicular to the fiber, regardless of the cutting feed.
- It was revealed that TCP composites’ integrity sensitively depends on cutting conditions. The temperature generation on a fresh surface switches with the fiber orientation, hence affecting the behavior of the final structure and tool lifetime. This should motivate us to select appropriate parameters for better control of the economic impact on the glass-fiber-reinforced TCP structures.
Author Contributions
Funding
Institutional Review Board Statement
Informed Consent Statement
Data Availability Statement
Conflicts of Interest
References
- Zitoune, R.; Cadorin, N.; Collombet, F.; Šímac, M. Temperature and wear analysis in function of the cutting tool coating when drilling of composite structure: In situ measurement by optical fiber. Wear 2017, 84, 376–377. [Google Scholar] [CrossRef]
- Savovic, S.; Kovacevic, M.S.; Bajic, J.S.; Stupar, D.Z.; Djordjevich, A.; Zivanov, M.; Drljaca, B.; Simovic, A.; Oh, K. Temperature dependence of mode coupling in low-NA plastic optical fibers. J. Light Technol. 2015, 33, 89–94. [Google Scholar] [CrossRef]
- Kovacevic, M.S.; Savovic, S.; Djordjevich, A.; Bajic, J.; Stupar, D.; Kovacevic, M.; Simic, S. Measurements of growth and decay of radiation induced attenuation during the irradiation and recovery of plastic optical fibres. Opt. Laser Technol. 2013, 47, 148–151. [Google Scholar] [CrossRef]
- Silva, D.; Pamies Teixeira, J.; Machado, C.M. Methodology analysis for evaluation of drilling-induced damage in composites. Int. J. Adv. Manuf. Technol. 2014, 71, 1919–1928. [Google Scholar] [CrossRef]
- Qi, Z.; Zhang, K.; Cheng, H.; Wang, D.; Meng, Q. Microscopic mechanism-based force prediction in orthogonal cutting of unidirectional CFRP. Int. J. Adv. Manuf. Technol. 2015, 79, 1209–1219. [Google Scholar] [CrossRef]
- Pereszlai, C.; Geier, N.; Poór, D.I.; Balázs, B.Z.; Póka, G. Drilling fibre reinforced polymer composites (CFRP and GFRP): An analysis of the cutting force of the tilted helical milling process. Compos. Struct. 2021, 262, 113646. [Google Scholar] [CrossRef]
- Mohan, N.S.; Kulkarni, S.M.; Ramachandra, A. Delamination analysis in drilling process of glass fiber reinforced plastic (GFRP) composite materials. J. Mater. Processing Technol. 2007, 186, 265–271. [Google Scholar] [CrossRef]
- Karataş, M.A.; Gökkaya, H. A review on machinability of carbon fiber reinforced polymer (CFRP) and glass fiber reinforced polymer (GFRP) composite materials. Def. Technol. 2018, 14, 318–326. [Google Scholar] [CrossRef]
- Caggiano, A. Machining of Fibre Reinforced Plastic Composite Materials. Materials 2018, 11, 442. [Google Scholar] [CrossRef] [Green Version]
- Davim, J.P.; Mata, F. Influence of cutting parameters on surface roughness in turning glass-fibre-reinforced plastics using statistical analysis. Ind. Lubr. Tribol. 2004, 56, 270–274. [Google Scholar] [CrossRef]
- Davim, J.P.; Mata, F. Physical cutting model of Polyetheretherketone composites. Mater. Des. 2007, 27, 847–852. [Google Scholar] [CrossRef]
- Zenia, S.; Ayed, L.B.; Nouari, M.; Delamézière, A. Numerical analysis of the interaction between the cutting forces, induced cutting damage, and machining parameters of CFRP composites. Int. J. Adv. Manuf. Technol. 2015, 78, 465–480. [Google Scholar] [CrossRef]
- Wang, H.; Sun, J.; Zhang, D.; Guo, K.; Li, J. The effect of cutting temperature in milling of carbon fiber reinforced polymer composites. Compos. Part A Appl. Sci. Manuf. 2016, 91, 380–387. [Google Scholar] [CrossRef]
- Abhishek, K.; Datta, S.; Mahapatra, S.S. Optimization of thrust, torque, entry, and exist delamination factor during drilling of CFRP composites. Int. J. Adv. Manuf. Technol. 2015, 76, 401–416. [Google Scholar] [CrossRef]
- HoCheng, H.; Chao, Y.; Puw, H. General model for thrust force-induced delamination in drilling of composite laminates. Mach. Adv. Mater. 1995, 29–40, 175232. [Google Scholar]
- Pecat, O.; Rentsch, R.; Brinksmeier, E. Influence of milling process parameters on the surface integrity of CFRP. Procedia CIRP 2012, 1, 466–470. [Google Scholar] [CrossRef] [Green Version]
- Karpat, Y.; Bahtiyar, O.; Değer, B. Mechanistic force modeling for milling of unidirectional carbon fiber reinforced polymer laminates. Int. J. Mach. Tools Manuf. 2012, 56, 79–93. [Google Scholar] [CrossRef]
- Hintze, W.; Hartmann, D.; Schütte, C. Occurrence and propagation of delamination during the machining of carbon fibre reinforced plastics (CFRPs)–An experimental study. Compos. Sci. Technol. 2011, 71, 1719–1726. [Google Scholar] [CrossRef]
- Erkan, Ö.; Isık, B.; Çiçek, A.; Kara, F. Prediction of damage factor in end milling of glass fibre reinforced plastic composites using artificial neural network. Appl. Compos. Mater. 2013, 20, 517–536. [Google Scholar] [CrossRef]
- Faria, P.; Rubio, J.C.; Abrao, A.; Davim, J.P. The influence of tool wear on delamination when drilling glass fibre reinforced epoxy composite with high speed steel and cemented carbide tools. Int. J. Mater. Prod. Technol. 2009, 37, 129–139. [Google Scholar] [CrossRef]
- Kavad, B.V.; Pandey, A.B.; Tadavi, M.V.; Jakharia, H.C. A review paper on effects of drilling on glass fiber reinforced plastic. Procedia Technol. 2014, 14, 457–464. [Google Scholar] [CrossRef] [Green Version]
- Lokesh, K.S.; Pinto, T.; Ramachandra, C.G. Effect of tool wear and machinability studies on polymer composites: A review. Int. J. Eng. Inf. Syst. 2017, 1, 71–77. [Google Scholar]
- Criado, V.; Feito, N.; Cantero Guisández, J.L.; Díaz-Álvarez, J. A new cutting device design to study the orthogonal cutting of cfrp laminates at different cutting speeds. Materials 2019, 12, 4074. [Google Scholar] [CrossRef] [PubMed] [Green Version]
- Sheikh-Ahmad, J.; Almaskari, F.; Hafeez, F. Heat partition in edge trimming of fiber reinforced polymer composites. J. Compos. Mater. 2020, 21, 2805–2821. [Google Scholar] [CrossRef]
- Sorrentino, L.; Turchetta, S.; Bellini, C. A new method to reduce delamination during drilling of FRP laminates by feed rate control. Compos. Struct. 2018, 186, 154–164. [Google Scholar] [CrossRef]
- Yashiro, T.; Ogawa, T.; Sasahara, H. Temperature measurement of cutting tool and machined surface layer in milling of CFRP. Int. J. Mach. Tools Manuf. 2013, 70, 63–69. [Google Scholar] [CrossRef]
- Kerrigan, K.; O’Donnell, G.E. On the relationship between cutting temperature and workpiece polymer degradation during cfrp edge trimming. Procedia CIRP 2016, 55, 170–175. [Google Scholar] [CrossRef] [Green Version]
- Wang, H.; Sun, J.; Li, J.; Lu, L.; Li, N. Evaluation of cutting force and cutting temperature in milling carbon fiber-reinforced polymer composites. Int. J. Adv. Manuf. Technol. 2016, 82, 1517–1525. [Google Scholar] [CrossRef]
- Sheikh-Ahmad, J.; Almaskari, F.; Hafeez, F. Heat partition in edge trimming of glass fiber reinforced polymer (GFRP) composites. Procedia CIRP 2019, 85, 20–25. [Google Scholar] [CrossRef]
- Wang, H.; Dinwiddie, R.B.; Wilkes, K.E. Thermal Conductivity Measurements of Fiberglass. In Oak Ridge National Laboratory Report: ORNL/TM-2003/98; Owens Corning Inc.: Toledo, OH, USA, 2003; pp. 1–15. [Google Scholar]
- Aadmi, M.; Karkri, M.; El Hammouti, M. Heat transfer characteristics of thermal energy storage of a composite phase change materials: Numerical and experimental investigations. Energy 2014, 72, 381–392. [Google Scholar] [CrossRef]
- Chen, J.; Gao, X.; Song, W. Effect of various carbon nanofillers and different filler aspect ratios on the thermal conductivity of epoxy matrix nanocomposites. Results Phys. 2019, 15, 102771. [Google Scholar] [CrossRef]
- Idicula, M.; Boudenne, A.; Umadevi, L.; Ibos, L.; Candau, Y.; Thomas, S. Thermophysical properties of natural fibre reinforced polyester composites. Compos. Sci. Technol. 2006, 66, 2719–2725. [Google Scholar] [CrossRef]
- Pech-May, N.W.; Vales-Pinzón, C.; Vega-Flick, A.; Cifuentes, Á.; Oleaga, A.; Salazar, A.; Alvarado-Gil, J.J. Study of the thermal properties of polyester composites loaded with oriented carbon nanofibers using the front face flash method. Polym. Test. 2016, 50, 255–261. [Google Scholar] [CrossRef]
- Aadmi, M.; Karkri, M.; Ibos, L. Effective thermal conductivity of random two-phase composites. J. Reinf. Plast. Comp. 2014, 33, 69–80. [Google Scholar] [CrossRef]
- Bastiurea, M.; Rodeanu Bastiurea, M.S.; Andrei, G.; Dima, D.; Murarescu, M.; Ripa, M.; Circiumaru, A. Determination of specific heat of polyester composite with graphene and graphite by differential scanning calorimetry. Tribol. Ind. 2014, 36, 419–427. [Google Scholar]
- Swain, S. Synthesis and characterization of graphene based unsaturated polyester resin composites. Trans Electr. Electron. Mater 2013, 14, 53–58. [Google Scholar] [CrossRef] [Green Version]
- Bergman, T.L.; Incropera, F.P.; DeWitt, D.P.; Lavine, A.S. Fundamentals of Heat and Mass Transfer; John Wiley & Sons, Inc.: Hoboken, NJ, USA, 2011; p. 990. [Google Scholar]
- Jeon, J.; Muliana, A.; La Saponara, V. Thermal stress and deformation analyses in fiber reinforced polymer composites undergoing heat conduction and mechanical loading. Compos. Struct. 2014, 111, 31–44. [Google Scholar] [CrossRef]
- Guesmi, F.; Elfarhani, M.; Ghazali, S.; Bin Mahfouz, A.S.; Mkaddem, A.; Jarraya, A. Assessment of temperature history when abrasive milling of long fiber reinforced polymers. Adv. Acoust. Vib. 2021, 3, 269–276. [Google Scholar]


| Properties | Epoxy 1050 | Polyester TP 280 |
|---|---|---|
| Appearance | Opalescent neutral liquid | Clear blue |
| Glass transition temperature Tg | 77 °C | 87 °C |
| at 20 °C | [30,31,32] | [33,34] |
| Specific heat capacity Cp | [31,35] | [36,37] |
| Dry extract in volume | 33 ± 2% | 31 ± 1% |
| Hardener type | 1055S | MEKP |
| Gel time | 210 min at 23 °C with 1055S hardener | 30 (at 25 °C with 2% of MEKP hardener) |
| Epoxy NR | G/E 0° | G/E 90° | Polyester NR | G/P 0° | G/P 90° | ||
|---|---|---|---|---|---|---|---|
| 50 | −0.25 | 39.25 ± 0.49 | 38.5 ± 0.28 | 99 ± 1.08 | 37.5 ± 0.56 | 34 ± 0.10 | 100.75 ± 0.81 |
| 0 | 41 ± 0.42 | 39 ± 0.27 | 118.25 ± 1.29 | 39 ± 1.12 | 35.25 ± 0.42 | 102 ± 0.65 | |
| 0.25 | 42 ± 0.73 | 39.5 ± 0.14 | 125 ± 0.75 | 42.75 ± 1.62 | 36 ± 0.96 | 105.25 ± 1.61 | |
| 150 | −0.25 | 34.75 ± 0.43 | 34.25 ± 0.09 | 93.5 ± 1.42 | 42.25 ± 0.75 | 32.75 ± 0.05 | 66.25 ± 1.11 |
| 0 | 35.5 ± 0.33 | 34.75 ± 0.17 | 100.75 ± 1.72 | 46.25 ± 1.15 | 32.75 ± 0.15 | 69 ± 0.96 | |
| 0.25 | 37 ± 0.50 | 34.5 ± 0.19 | 110.25 ± 2.48 | 48.75 ± 0.66 | 33 ± 0.08 | 69.5 ± 0.39 |
Publisher’s Note: MDPI stays neutral with regard to jurisdictional claims in published maps and institutional affiliations. |
© 2022 by the authors. Licensee MDPI, Basel, Switzerland. This article is an open access article distributed under the terms and conditions of the Creative Commons Attribution (CC BY) license (https://creativecommons.org/licenses/by/4.0/).
Share and Cite
Guesmi, F.; Elfarhani, M.; Mkaddem, A.; Ghazali, S.; Bin Mahfouz, A.S.; Jarraya, A. Heat Analysis of Thermal Conductive Polymer Composites: Reference Temperature History in Pure Polymer Matrices. Polymers 2022, 14, 2084. https://0-doi-org.brum.beds.ac.uk/10.3390/polym14102084
Guesmi F, Elfarhani M, Mkaddem A, Ghazali S, Bin Mahfouz AS, Jarraya A. Heat Analysis of Thermal Conductive Polymer Composites: Reference Temperature History in Pure Polymer Matrices. Polymers. 2022; 14(10):2084. https://0-doi-org.brum.beds.ac.uk/10.3390/polym14102084
Chicago/Turabian StyleGuesmi, Fethi, Makram Elfarhani, Ali Mkaddem, Sami Ghazali, Abdullah S. Bin Mahfouz, and Abdessalem Jarraya. 2022. "Heat Analysis of Thermal Conductive Polymer Composites: Reference Temperature History in Pure Polymer Matrices" Polymers 14, no. 10: 2084. https://0-doi-org.brum.beds.ac.uk/10.3390/polym14102084