

Electrospun Smart Oxygen Indicating Tag for Modified Atmosphere Packaging Applications: Fabrication, Characterization and Storage Stability
 ,
,  , , and
Abstract
: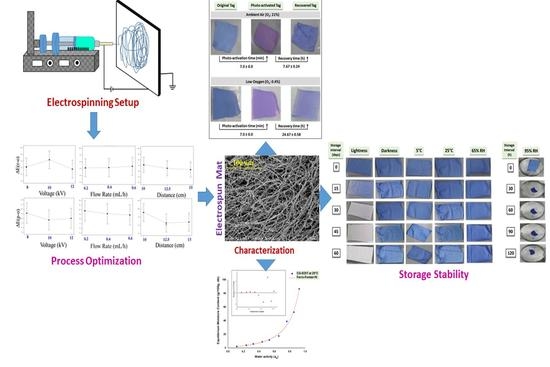
1. Introduction
2. Materials and Methods
2.1. Materials
2.2. Characterization of Electrospinning Solution and Optimization of the Electrospinning Process
2.3. Characterization of Electrospun Oxygen Indicating Tag
2.3.1. Determination of the Color Values of Digital Images of Electrospun Tags
2.3.2. Moisture Sorption Behavior of the Electrospun Tag
2.3.3. Global Migration into Food Simulants
2.3.4. Microstructure and Oxygen Sensitivity
2.4. Storage Stability of Electrospun Tag
2.5. Statistical Analysis
3. Results and Discussion
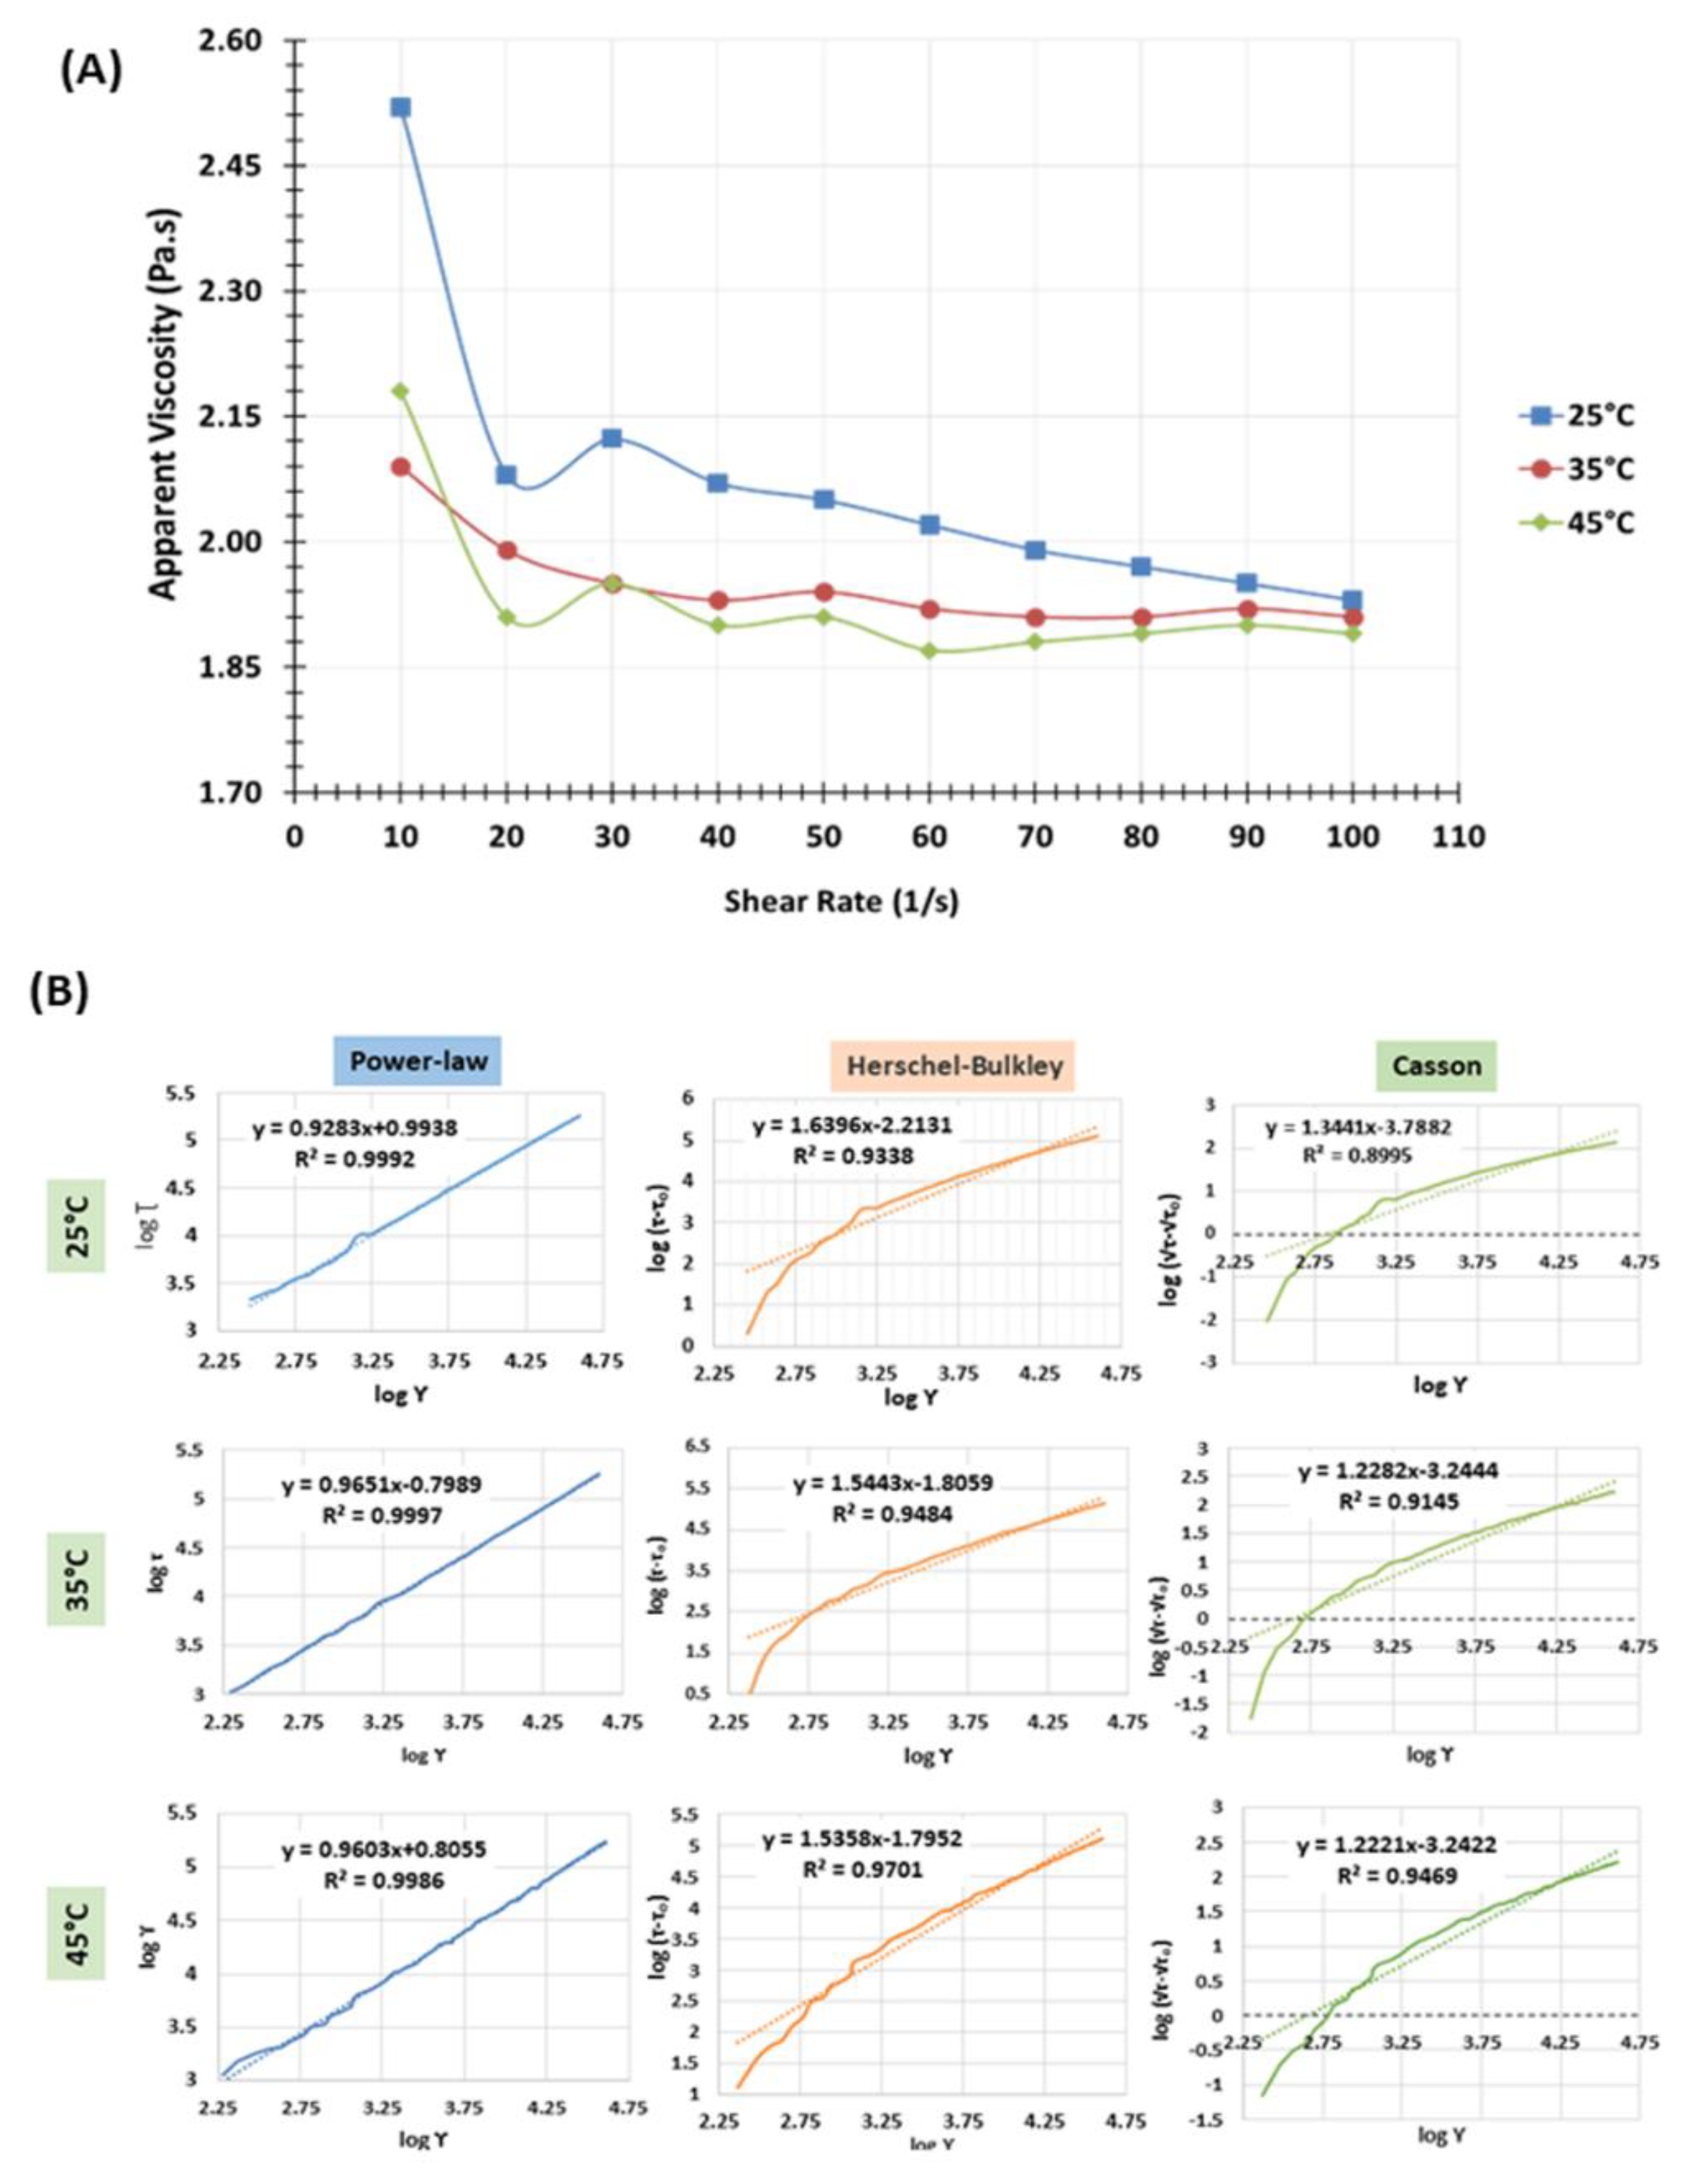
3.1. Viscosity and Flow Behavior Properties of Electrospinning Solution
3.2. Electrical Conductivity of Electrospinning Solution
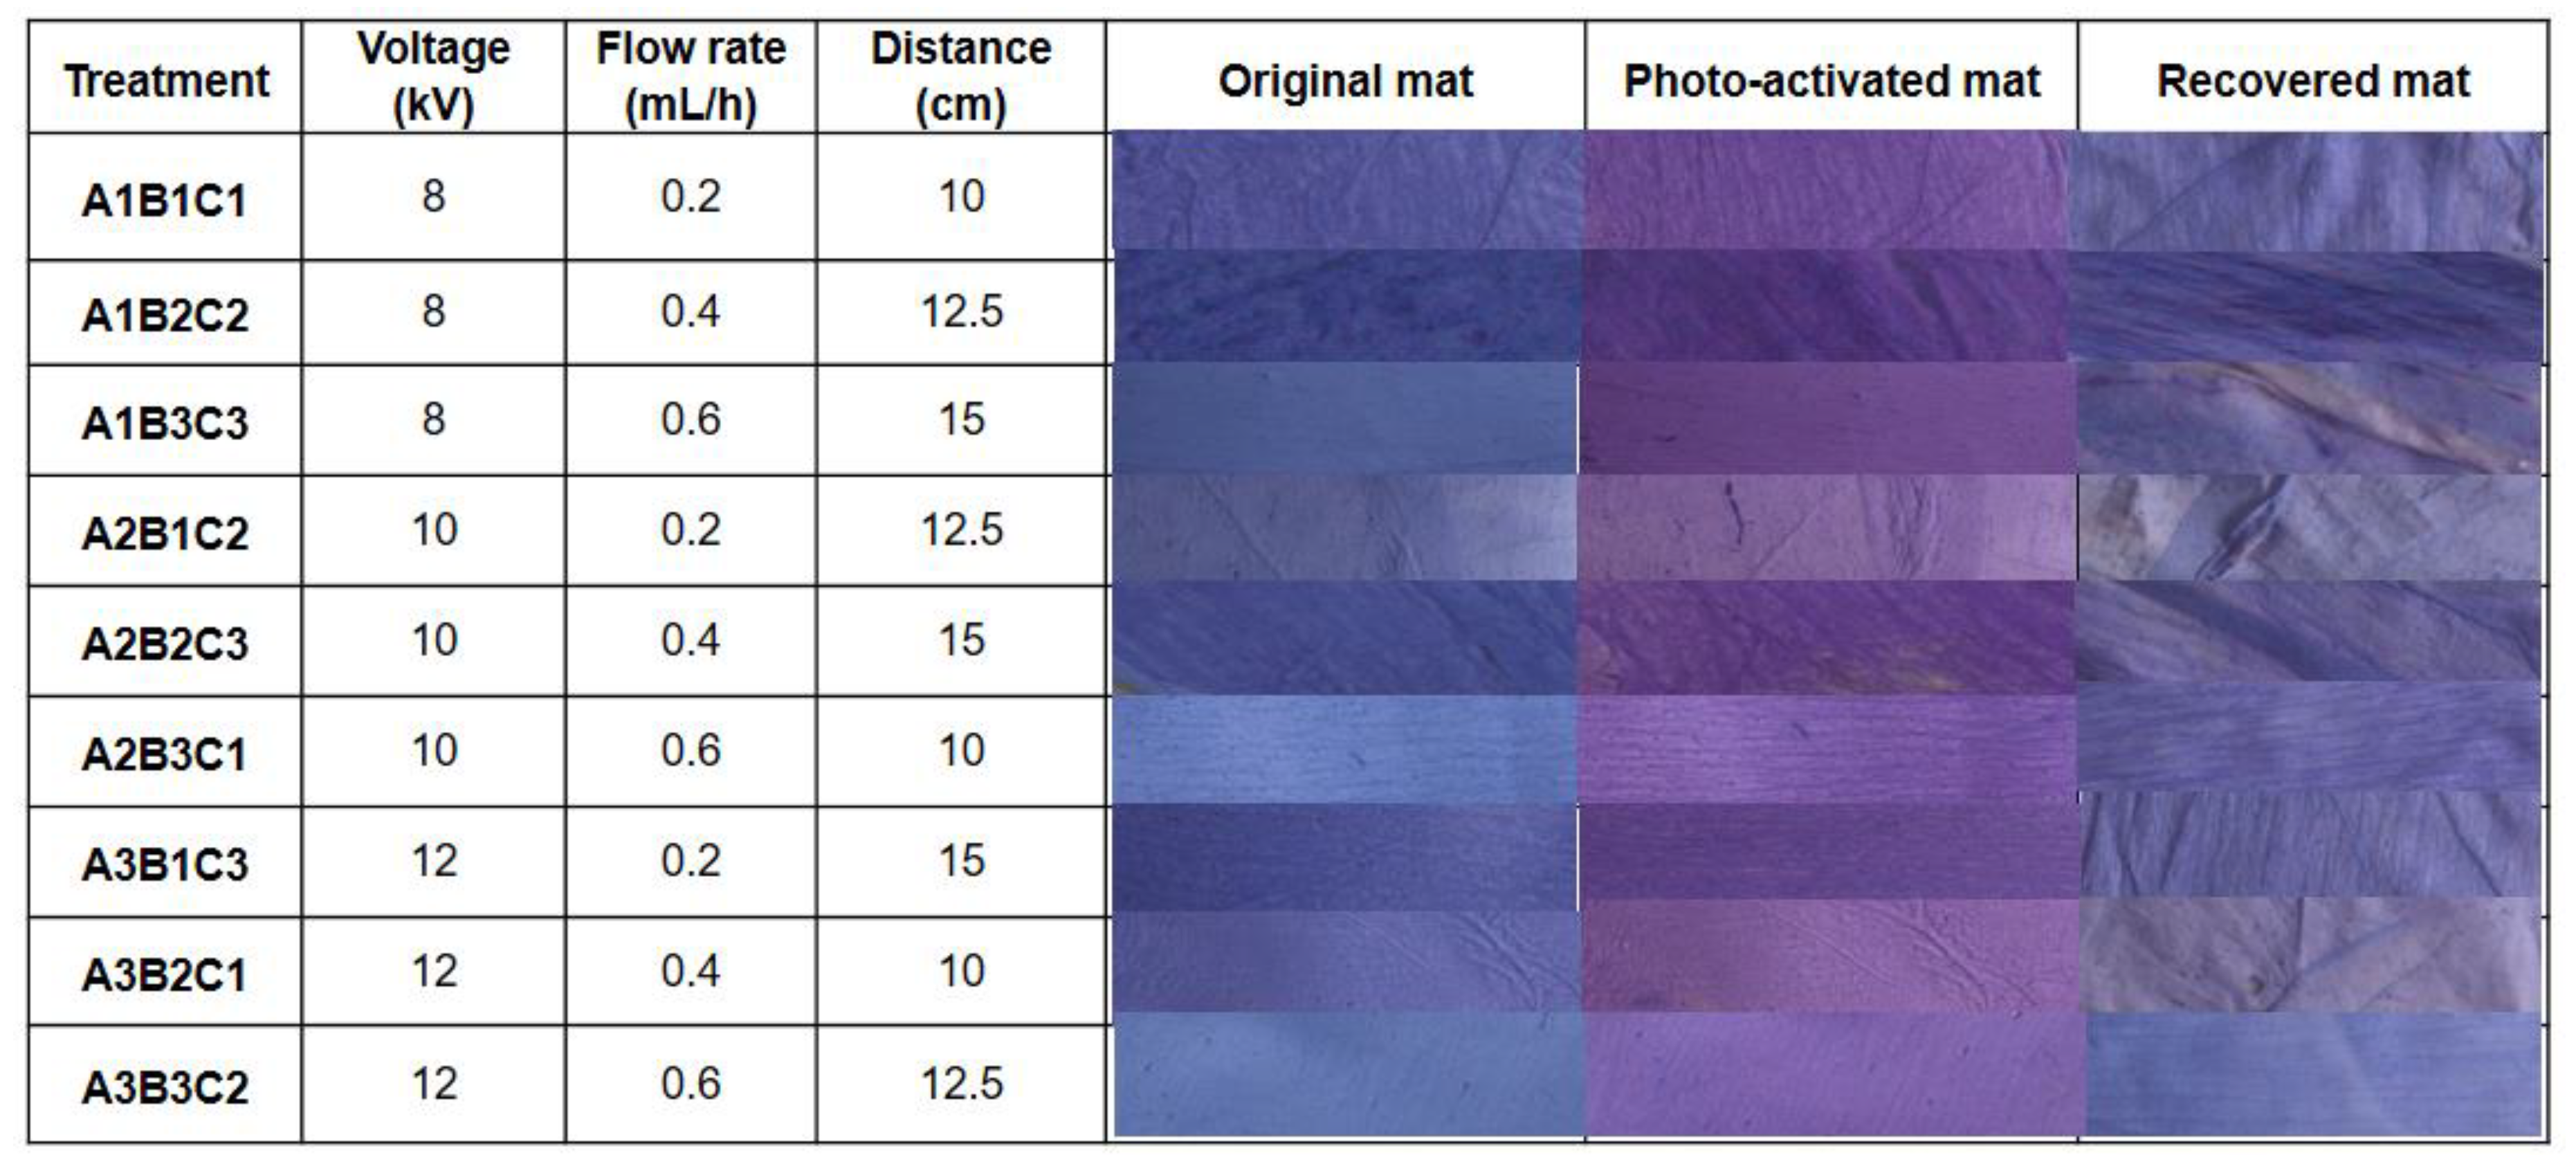
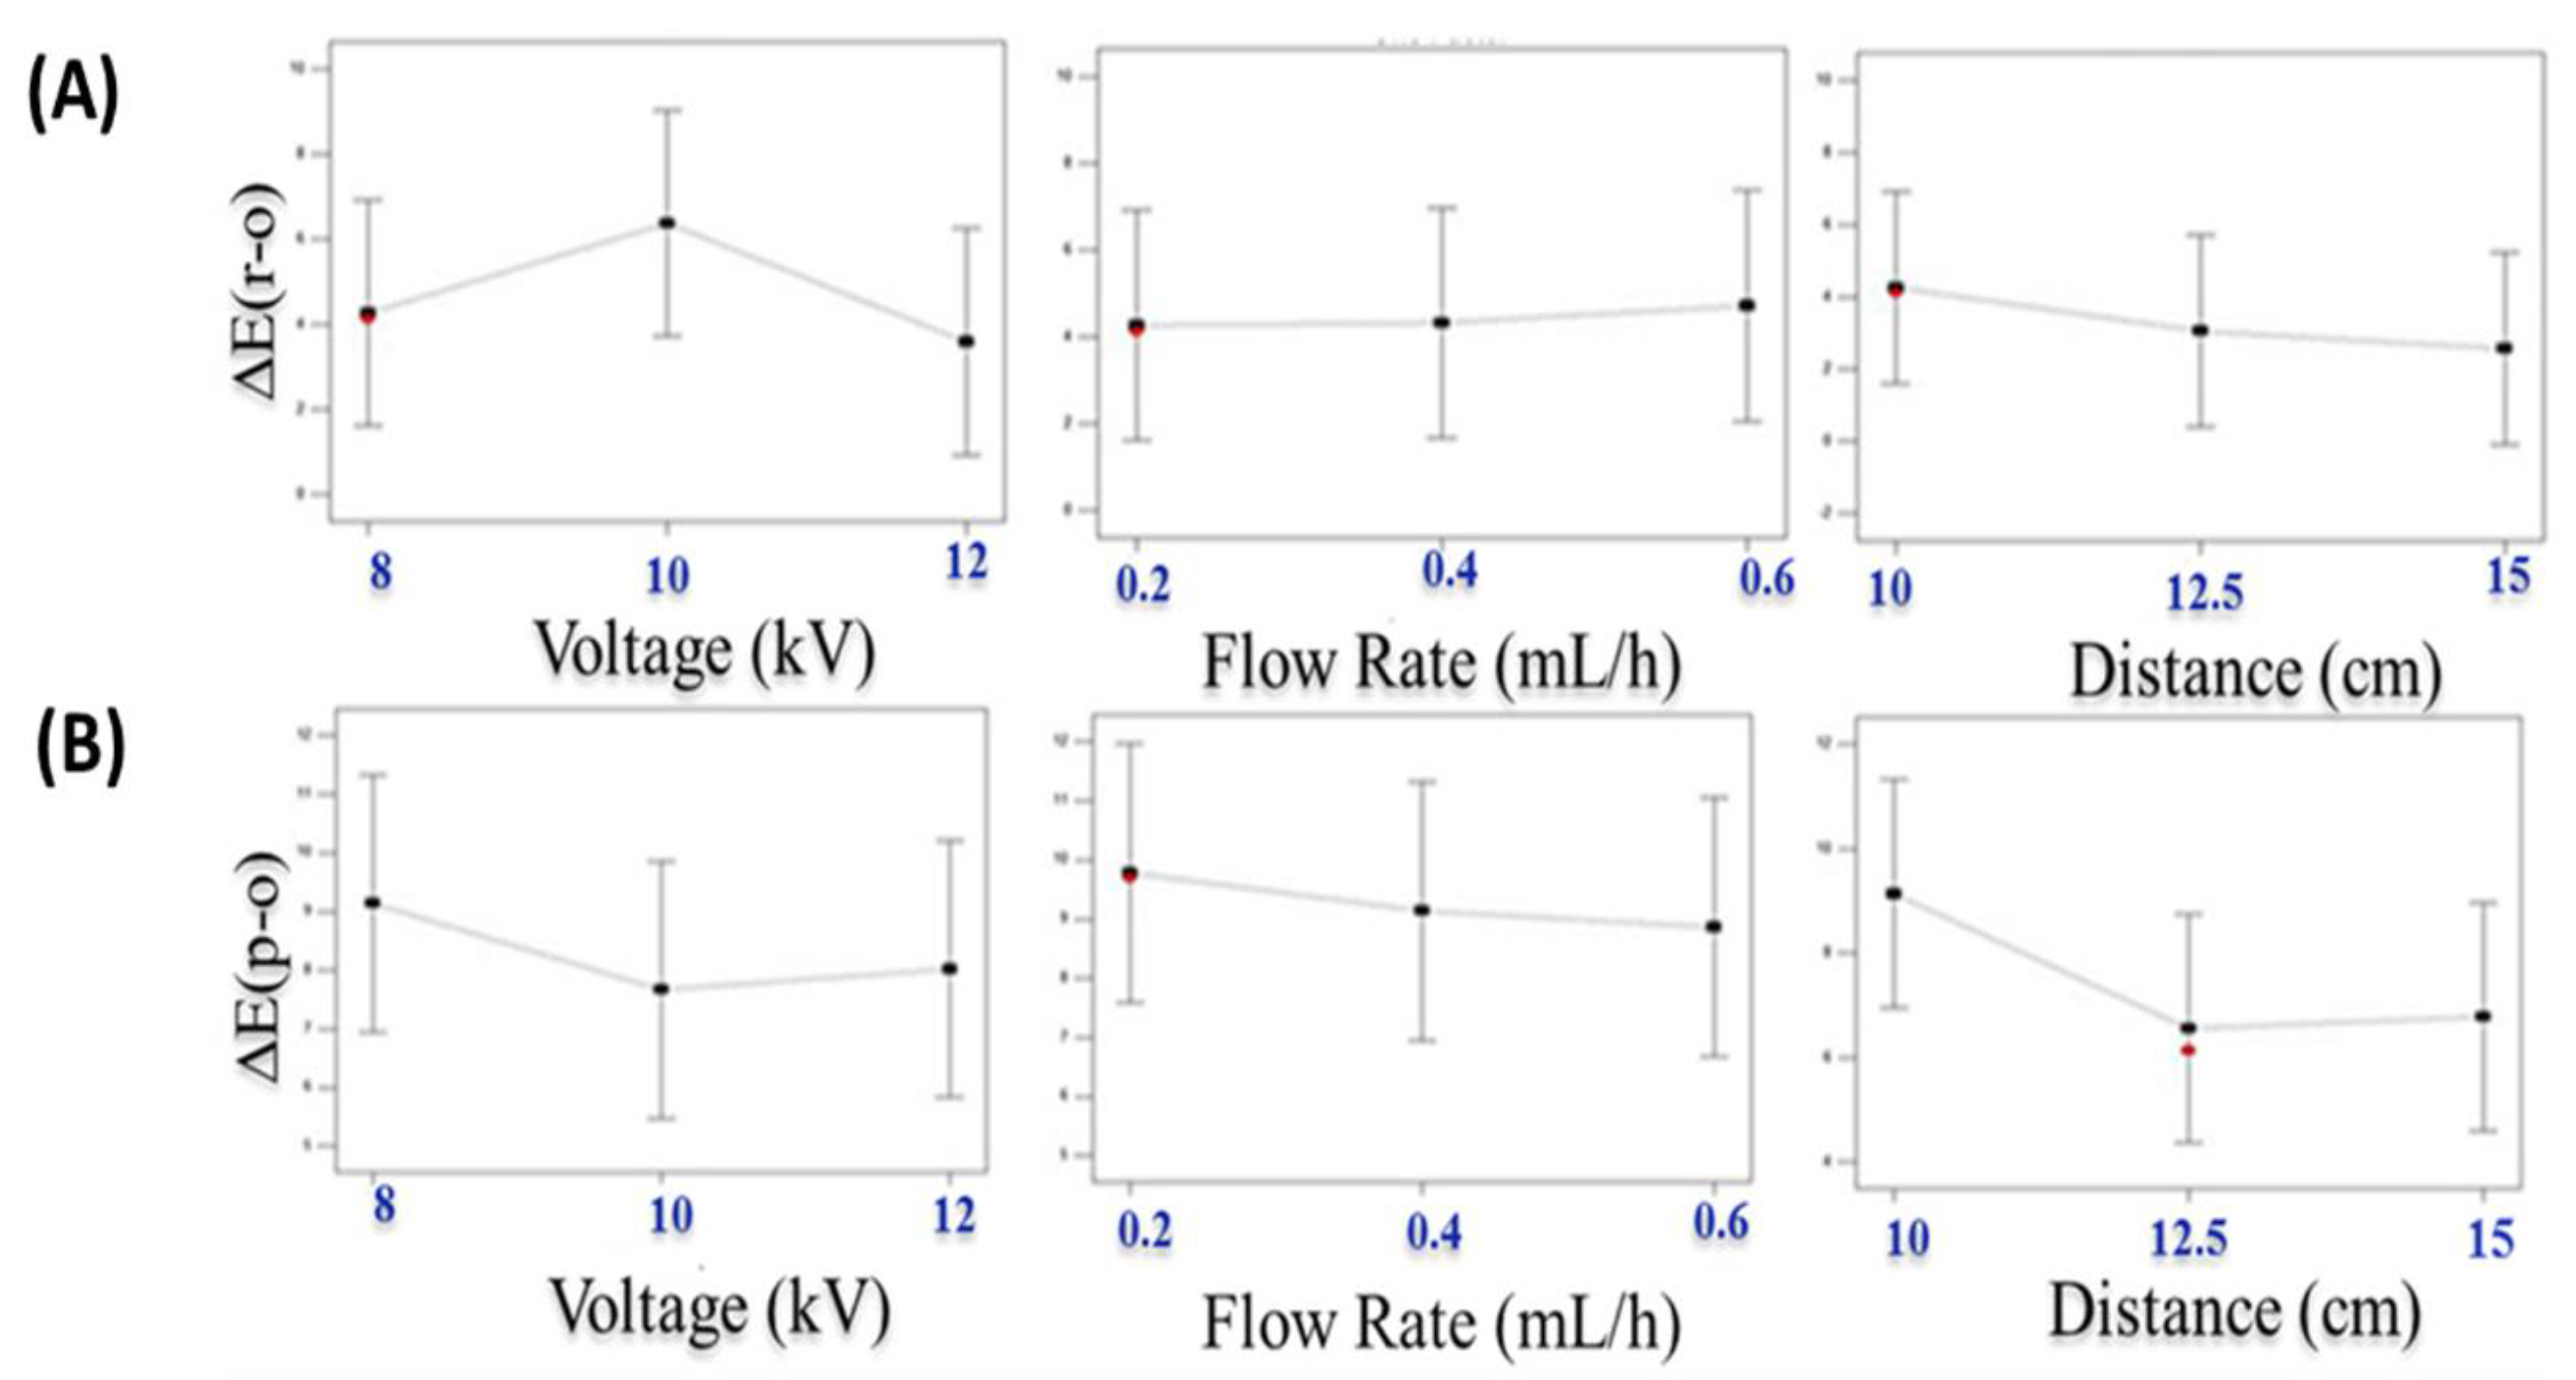
3.3. Optimization of Electrospinning Process Parameters
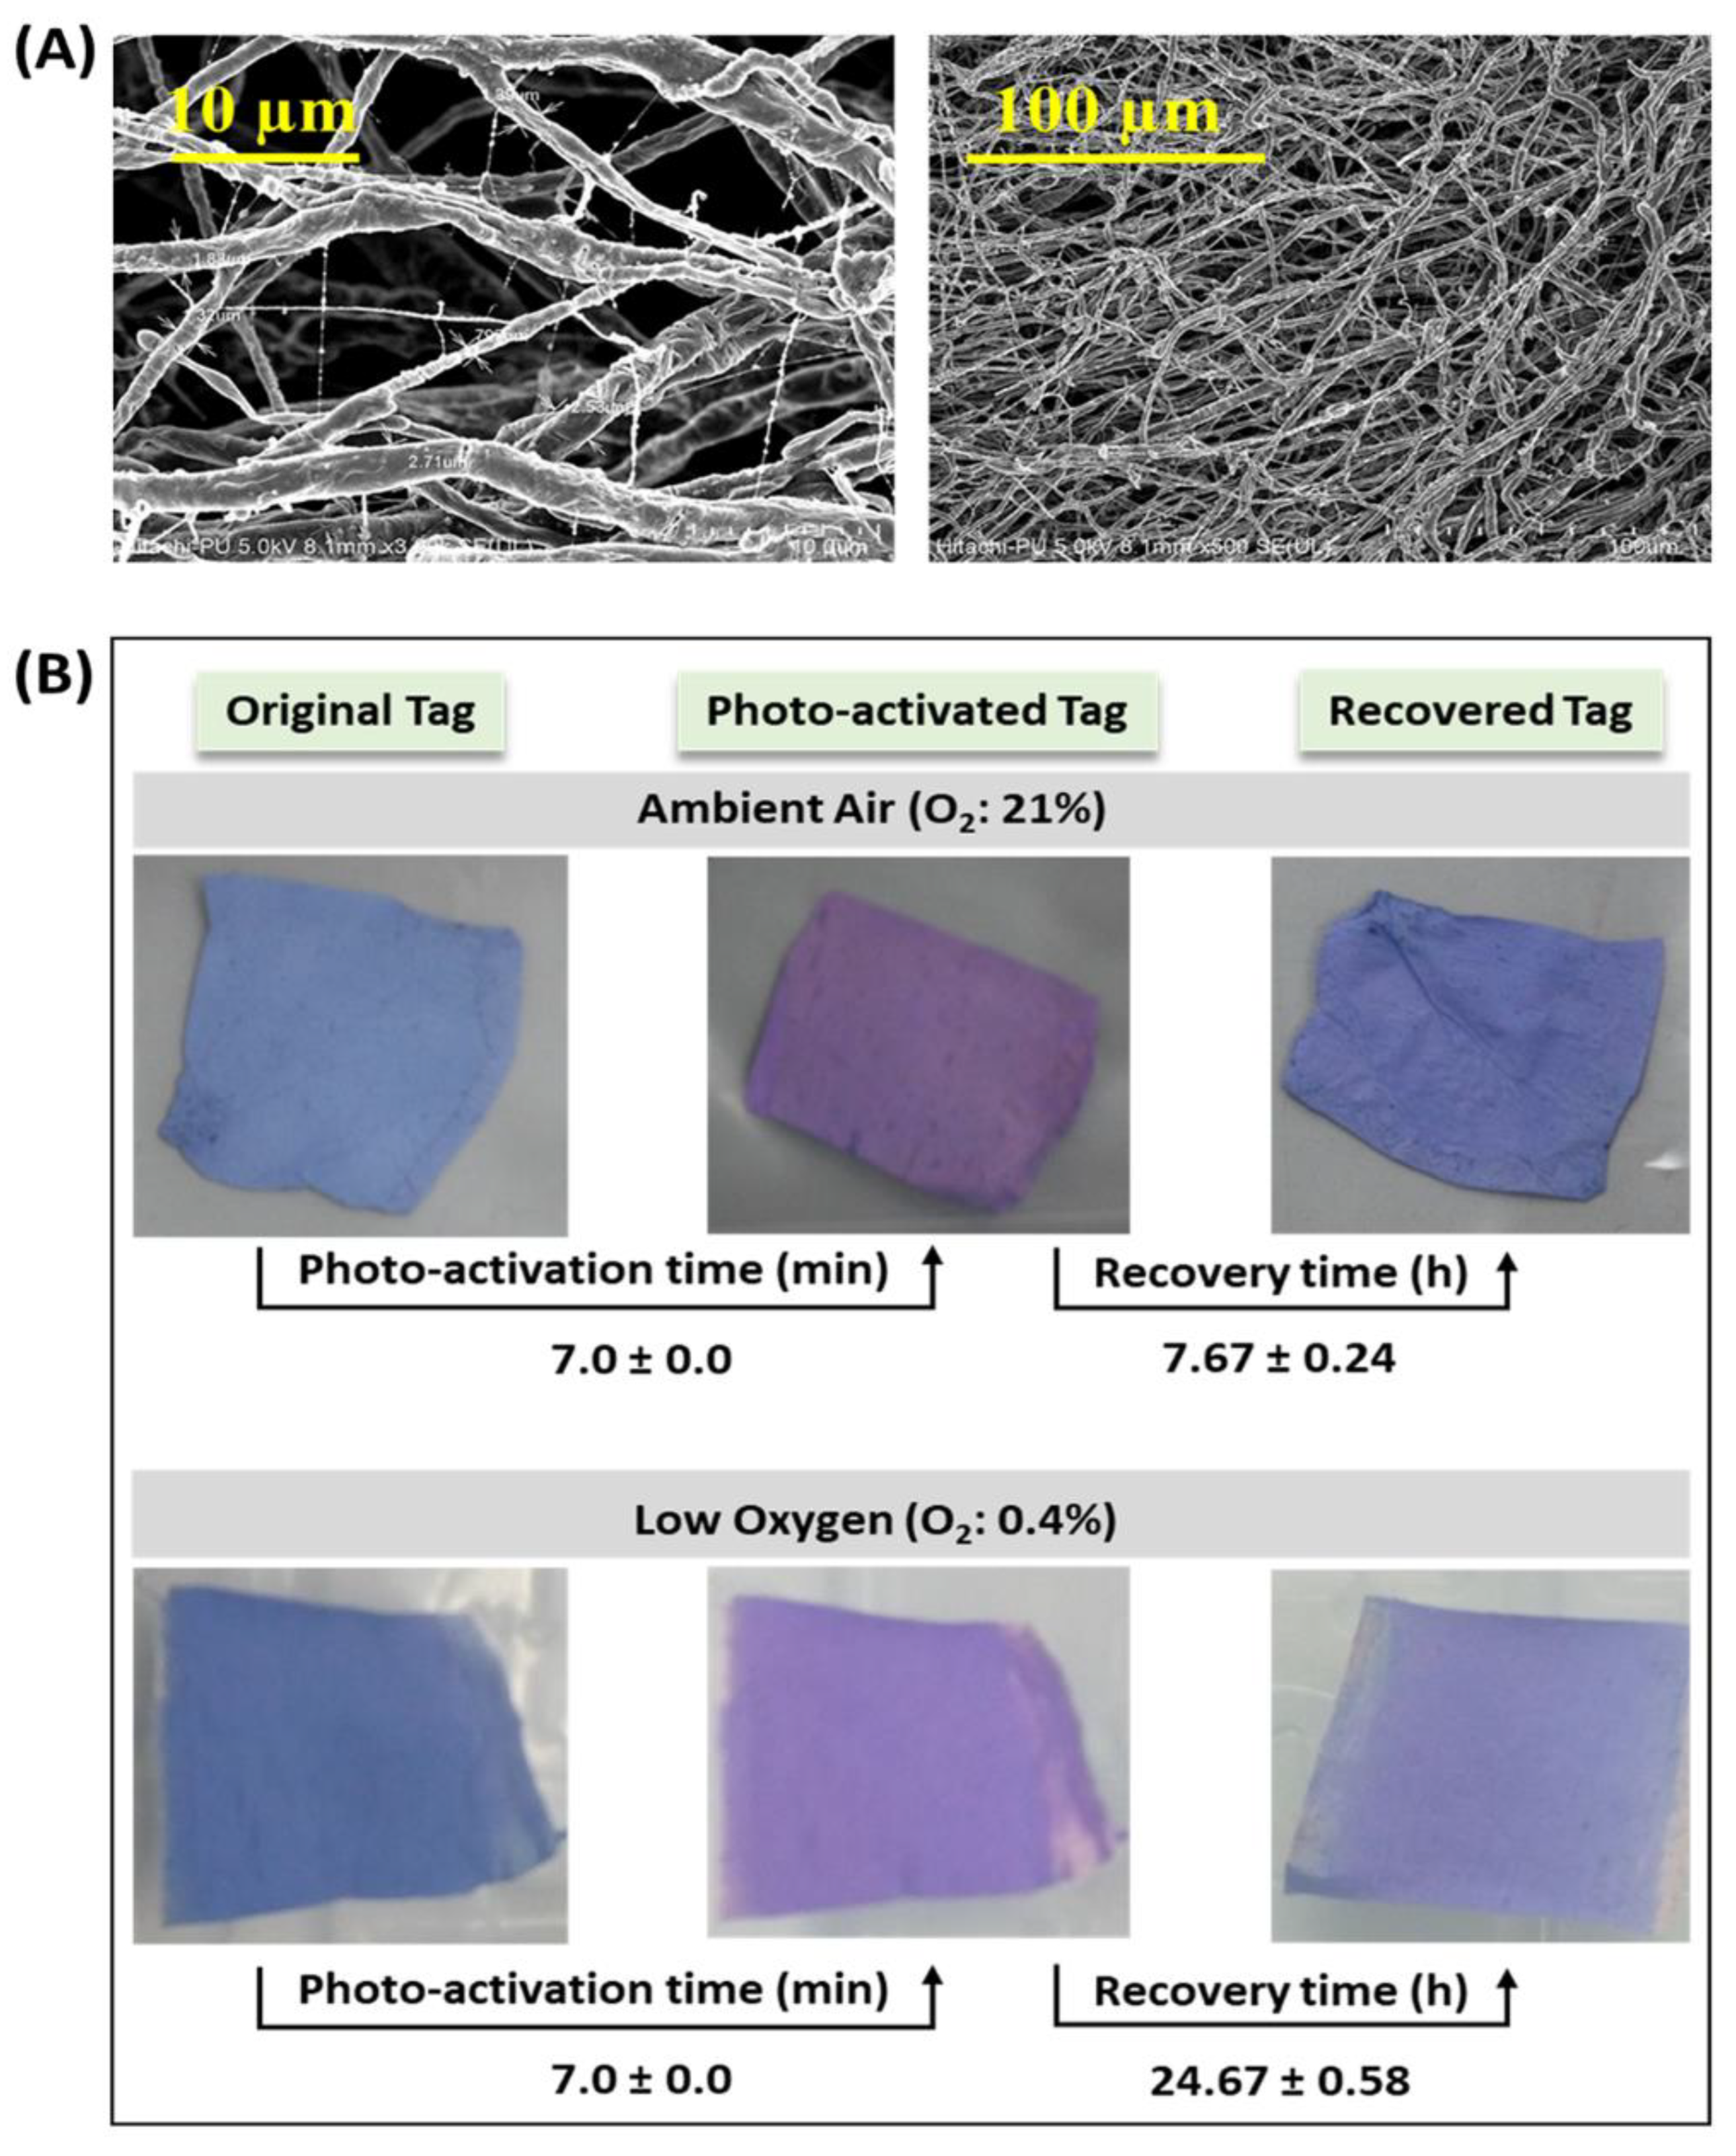
3.4. Morphology of Electrospun Tags
3.5. Photo-Activation and Recovery Times of Electrospun Tag
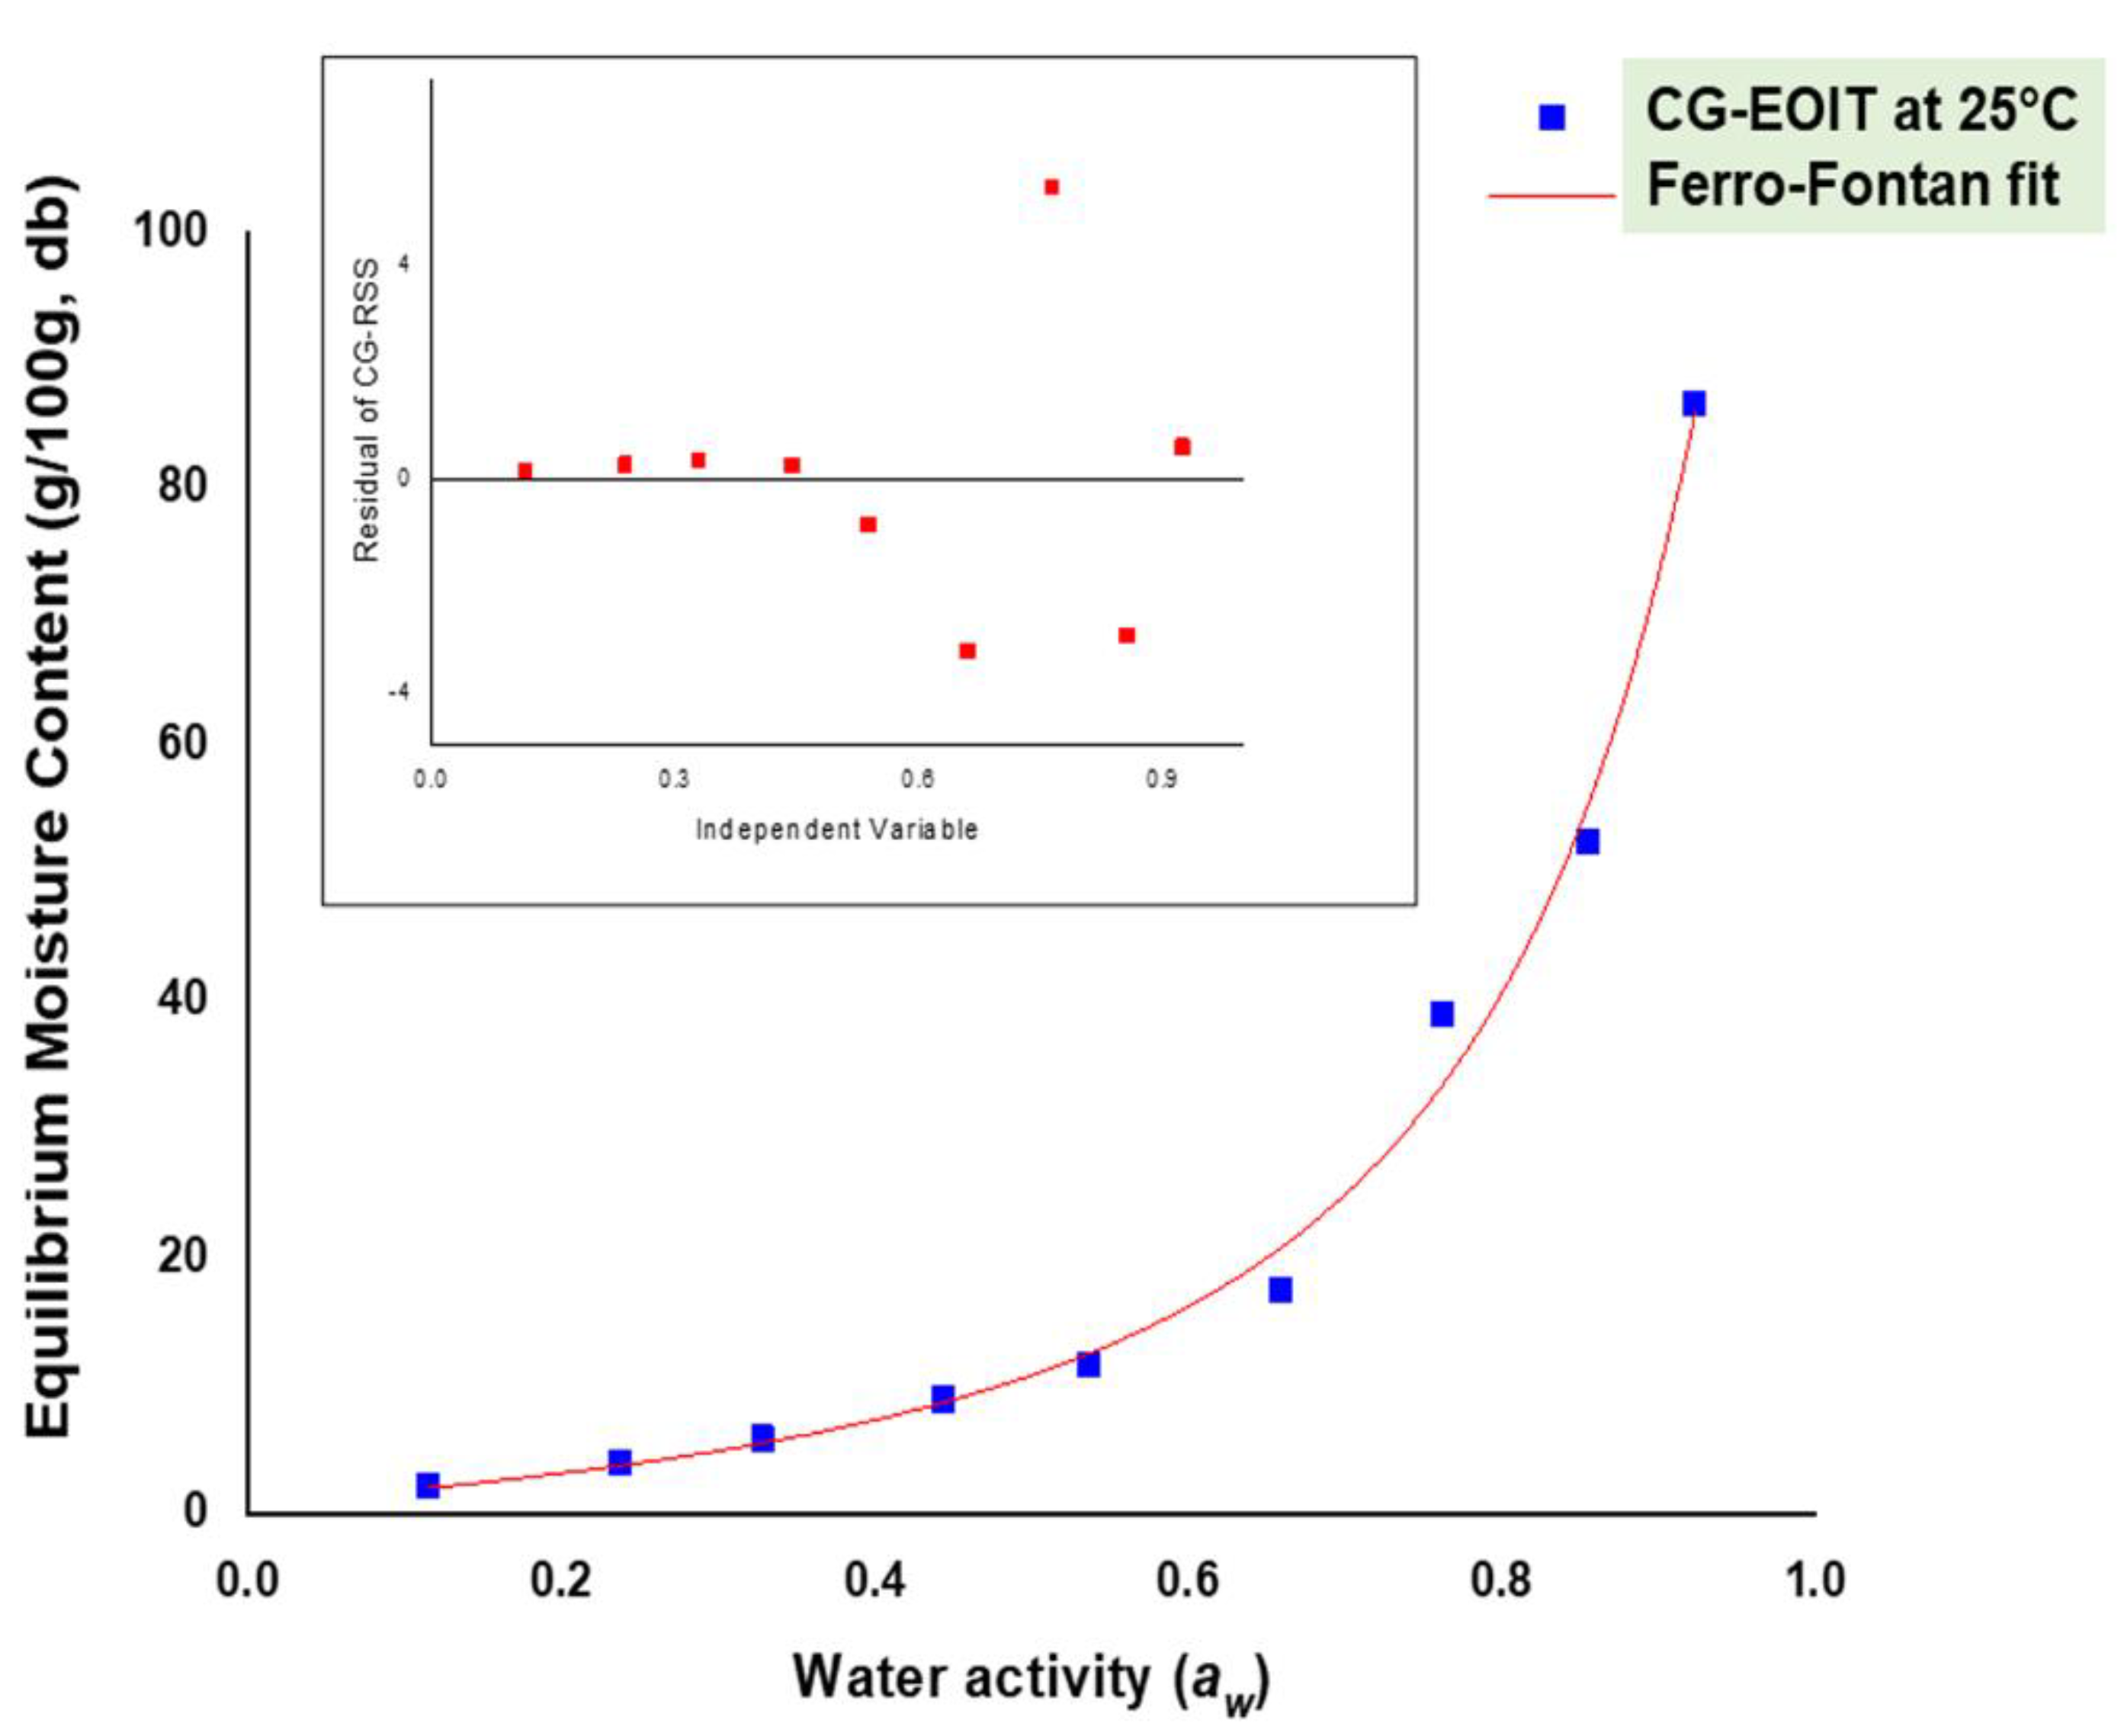
3.6. Moisture Sorption Isotherms
3.7. Migration of Electrospun Indicator Tags
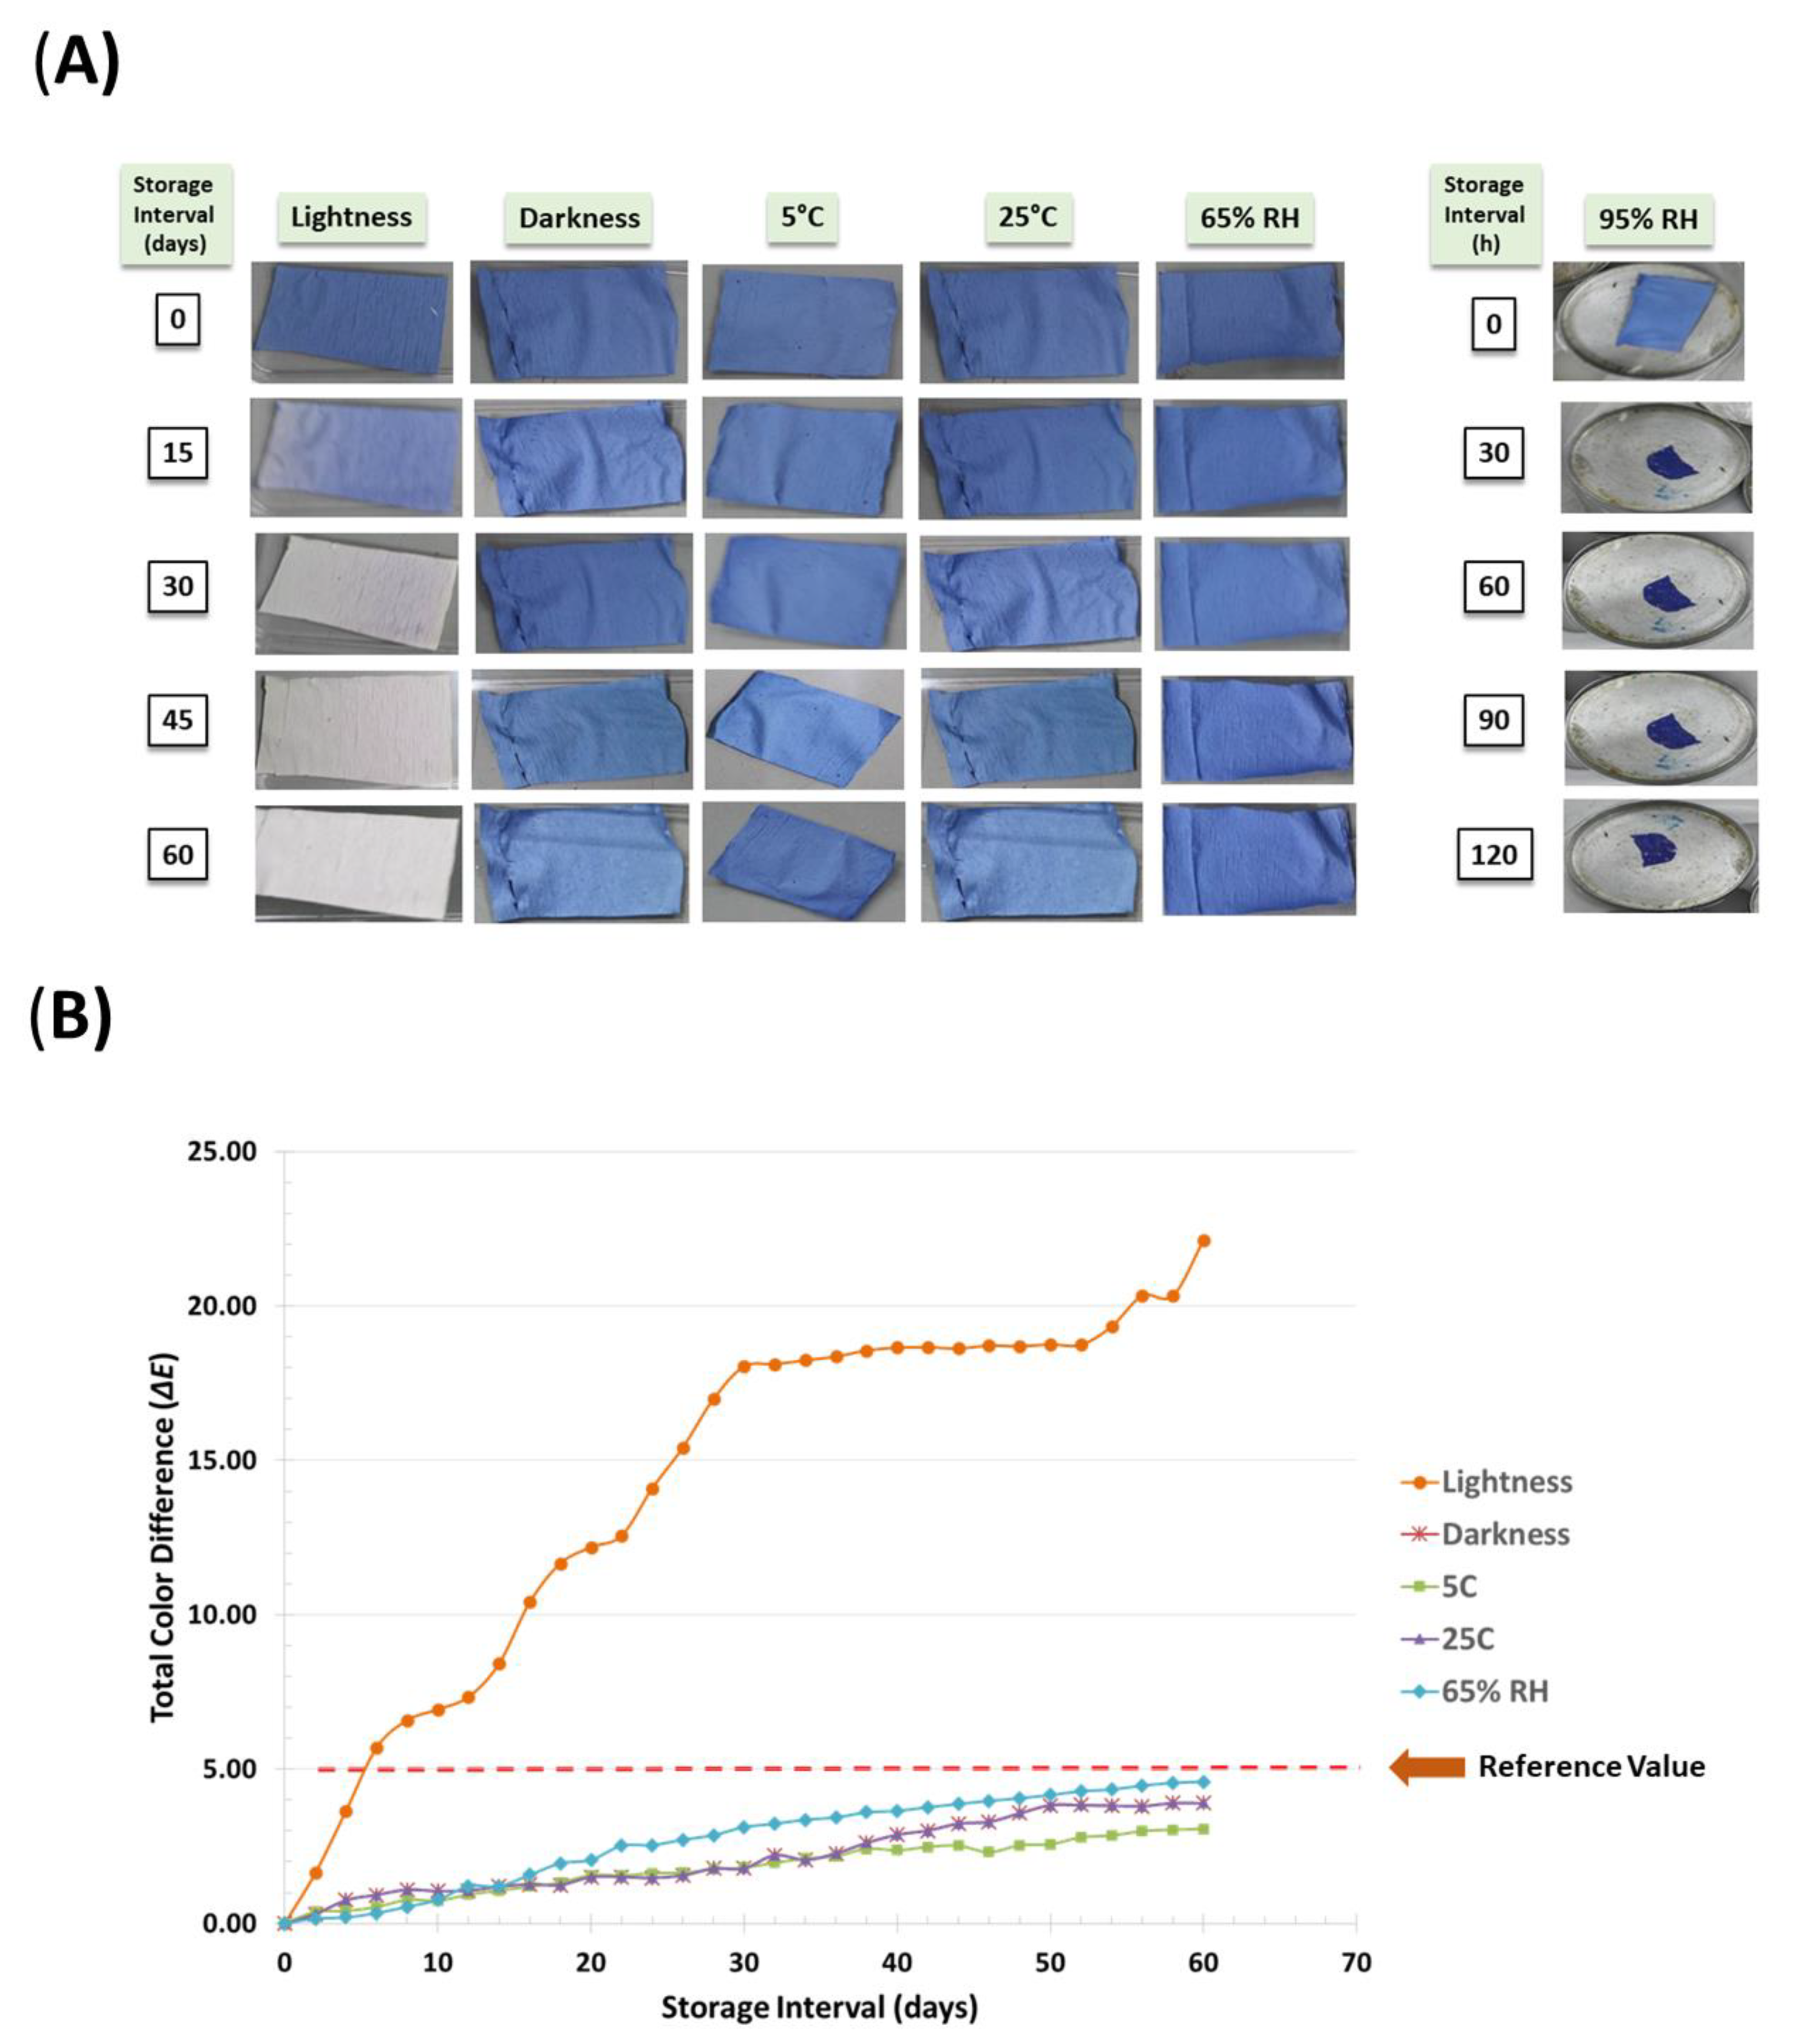
3.8. Storage Stability of Electrospun Tag
4. Conclusions
Author Contributions
Funding
Institutional Review Board Statement
Informed Consent Statement
Data Availability Statement
Acknowledgments
Conflicts of Interest
References
- Markets & Markets. Smart Food Packaging Market by Technology, Application, and Region-Global Forecast to 2025. Available online: https://www.marketsandmarkets.com/Market-Reports/smart-food-packaging-market-103797679.html (accessed on 9 July 2020).
- Mordor Intelligence. Modified Atmosphere Packaging Market-Growth, Trends, Covid-19 Impact and Forecasts (2021–2026). Available online: https://www.mordorintelligence.com/industry-reports/modified-atmosphere-packaging-market (accessed on 23 May 2021).
- Chawla, R.; Sivakumar, S.; Mishra, S.K.; Kaur, H.; Anurag, R.K. Modified atmosphere packaging for milk cake: Assessment of ideal gas composition for extending shelf life. Brit. Food J. 2021, 123, 2893–2906. [Google Scholar] [CrossRef]
- Firouz, M.S.; Mohi-Alden, K.; Omid, M. Critical review on intelligent and active packaging in the food industry: Research and development. Food Res. Int. 2021, 141, 110113. [Google Scholar] [CrossRef] [PubMed]
- Deshwal, G.K.; Panjagari, N.R. Active and intelligent packaging of cheese: Developments and future scope. In Food Additives; Miguel, L., Paz, O., Eds.; IntechOpen: London, UK, 2021. [Google Scholar] [CrossRef]
- Vu, C.H.T.; Won, K. Novel water-resistant UV-activated oxygen indicator for intelligent food packaging. Food Chem. 2013, 140, 52–56. [Google Scholar] [CrossRef] [PubMed]
- Deshwal, G.K.; Panjagari, N.R.; Badola, R.; Singh, A.K.; Minz, P.S.; Ganguly, S.; Alam, T. Characterization of biopolymer based UV activated intelligent oxygen indicator for food packaging applications. J. Packag. Technol. Res. 2018, 2, 29–43. [Google Scholar] [CrossRef]
- Xie, S.Y.; Liu, X.H.; Li, H.B.; Huang, C. The application of oxygen indicator in food packaging. Adv. Mat. Res. 2014, 945, 2037–2042. [Google Scholar] [CrossRef]
- Wen, J.; Huang, S.; Sun, Y.; Chen, Z.; Wang, Y.; Li, H.; Liu, X. Titanium dioxide nanotube-based oxygen indicator for modified atmosphere packaging: Efficiency and accuracy. Materials 2018, 11, 2410. [Google Scholar] [CrossRef] [Green Version]
- Otles, S.; Yalcin, B. Intelligent food packaging. Log. Forum. 2008, 4, 3. Available online: https://www.logforum.net/pdf/4_4_3_2008.pdf (accessed on 23 May 2021).
- Saarinen, J.J.; Remonen, T.; Tobjork, D.; Aarnio, H.; Bollstrom, R.; Osterbacka, R.; Toivakka, M. Large-scale roll-to-roll patterned oxygen indicators for modified atmosphere packages. Packag. Technol. Sci. 2017, 30, 219–227. [Google Scholar] [CrossRef]
- Ding, B.; Wang, M.; Yu, J.; Sun, G. Gas sensors based on electrospun nanofibers. Sensors 2009, 9, 1609–1624. [Google Scholar] [CrossRef] [Green Version]
- Noah, N.M. Design and synthesis of nanostructured materials for sensor applications. J. Nanomater. 2020, 2020, 8855321. [Google Scholar] [CrossRef]
- Hasseb, A.A.; Ghani, N.T.A.; Shehab, O.R.; Nashar, R.M.E. Application of molecularly imprinted polymers for electrochemical detection of some important biomedical markers and pathogens. Curr. Opin. Electrochem. 2022, 31, 100848. [Google Scholar] [CrossRef]
- Ziai, Y.; Petronella, F.; Rinoldi, C.; Nakielski, P.; Zakrzewska, A.; Kowalewski, T.A.; Augustyniak, W.; Li, X.; Calogero, A.; Sabaa, I.; et al. Chameleon-inspired multifunctional plasmonic nanoplatforms for biosensing applications. NPG Asia Mater. 2022, 14, 18. [Google Scholar] [CrossRef]
- Steinhauer, S. Gas sensors based on copper oxide nanomaterials: A review. Chemosensors 2021, 9, 51. [Google Scholar] [CrossRef]
- Power, A.C.; Gorey, B.; Chandra, S.; Chapman, J. Carbon nanomaterials and their application to electrochemical sensors: A review. Nanotechnol. Rev. 2018, 7, 19–41. [Google Scholar] [CrossRef]
- Xu, K.; Fu, C.; Gao, Z.; Wei, F.; Ying, Y.; Xu, C.; Fu, G. Nanomaterial-based gas sensors: A review. Instrum. Sci. Technol. 2018, 46, 115–145. [Google Scholar] [CrossRef]
- Rozemarie, M.L.; Andrei, B.; Liliana, H.; Cramariuc, R.; Cramariuc, O. Electrospun based polyaniline sensors-a review. IOP Conf. Ser. Mater. Sci. Eng. 2017, 209, 012063. [Google Scholar] [CrossRef]
- Sameen, D.E.; Ahmed, S.; Lu, R.; Li, R.; Dai, J.; Qin, W.; Zhang, Q.; Li, S.; Liu, Y. Electrospun nanofibers food packaging: Trends and applications in food systems. Crit. Rev. Food Sci. 2021, 1–14. [Google Scholar] [CrossRef]
- Punia Bangar, S.; Chaudhary, V.; Thakur, N.; Kajla, P.; Kumar, M.; Trif, M. Natural Antimicrobials as Additives for Edible Food Packaging Applications: A Review. Foods 2021, 10, 2282. [Google Scholar] [CrossRef]
- Göksen, G.; Fabra, M.J.; Ekiz, H.I.; López-Rubio, A. Phytochemical-loaded electrospun nanofibers as novel active edible films: Characterization and antibacterial efficiency in cheese slices. Food Control 2020, 112, 107133. [Google Scholar] [CrossRef]
- Beniwal, A. Sunny. Electrospun SnO2/PPy nanocomposite for ultra-low ammonia concentration detection at room temperature. Sens. Actuat B-Chem. 2019, 296, 126660. [Google Scholar] [CrossRef]
- Mousavi, S.; Kang, K.; Park, J.; Park, I. A room temperature hydrogen sulfide gas sensor based on electrospun polyaniline-polyethylene oxide nanofibers directly written on flexible substrates. RSC Adv. 2016, 6, 104131–104138. [Google Scholar] [CrossRef]
- Rianjanu, A.; Triyana, K.; Nugroho, D.B.; Kusumaatmaja, A.; Roto, R. Electrospun polyvinyl acetate nanofiber modified quartz crystal microbalance for detection of primary alcohol vapor. Sens. Actuators A Phys. 2020, 301, 111742. [Google Scholar] [CrossRef]
- Chaudhary, V.; Punia Bangar, S.; Thakur, N.; Trif, M. Recent Advancements in Smart Biogenic Packaging: Reshaping the Future of the Food Packaging Industry. Polymers 2022, 14, 829. [Google Scholar] [CrossRef] [PubMed]
- Yurova, N.S.; Danchuk, A.; Mobarez, S.N.; Wongkaew, N.; Rusanova, T.; Baeumner, A.J.; Duerkop, A. Functional electrospun nanofibers for multimodal sensitive detection of biogenic amines in food via a simple dipstick assay. Anal. Bioanal. Chem. 2018, 410, 111–1121. [Google Scholar] [CrossRef] [PubMed]
- Mohammadi, M.A.; Hosseini, S.M.; Yousefi, M. Application of electrospinning technique in development of intelligent food packaging: A short review of recent trends. Food Sci. Nutr. 2020, 8, 4656–4665. [Google Scholar] [CrossRef] [PubMed]
- Mihindukulasuriya, S.D.; Lim, L.T. Oxygen detection using UV-activated electrospun poly (ethylene oxide) fibers encapsulated with TiO2 nanoparticles. J. Mater. Sci. 2013, 48, 5489–5498. [Google Scholar] [CrossRef]
- Yılmaz, M.; Altan, A. Optimization of functionalized electrospun fibers for the development of colorimetric oxygen indicator as an intelligent food packaging system. Food Packag. Shelf Life 2021, 28, 100651. [Google Scholar] [CrossRef]
- Henke, P.; Kirakci, K.; Kubát, P.; Fraiberk, M.; Forstová, J.; Mosinger, J. Antibacterial, antiviral and oxygen-sensing nanoparticles prepared from electrospun materials. ACS Appl. Mater. Interfaces 2016, 8, 25127–25136. [Google Scholar] [CrossRef]
- Polat, S.; Trif, M.; Rusu, A.; Šimat, V.; Čagalj, M.; Alak, G.; Meral, R.; Özogul, Y.; Polat, A.; Özogul, F. Recent advances in industrial applications of seaweeds. Crit. Rev. Food Sci. Nutr. 2021, 8, 1–30. [Google Scholar] [CrossRef]
- Rusu, A.V.; Criste, F.L.; Mierliţă, D.; Socol, C.T.; Trif, M. Formulation of Lipoprotein Microencapsulated Beadlets by Ionic Complexes in Algae-Based Carbohydrates. Coatings 2020, 10, 302. [Google Scholar] [CrossRef] [Green Version]
- Benito-González, I.; Göksen, G.; Pérez-Bassart, Z.; López-Rubio, A.; Sánchez, R.; Alonso, J.M.; Gavara, R.; Gallur, M.; Martínez-Sanz, M. Pilot plant scale-up of the production of optimized starch-based biocomposites loaded with cellulosic nanocrystals from Posidonia oceanica waste biomass. Food Packag. Shelf Life 2021, 30, 100730. [Google Scholar] [CrossRef]
- Dash, K.K.; Deka, P.; Bangar, S.P.; Chaudhary, V.; Trif, M.; Rusu, A. Applications of Inorganic Nanoparticles in Food Packaging: A Comprehensive Review. Polymers 2022, 14, 521. [Google Scholar] [CrossRef] [PubMed]
- Fahmy, H.M.; Aly, A.A.; Sayed, S.M.; Abou-Okeil, A. K-carrageenan/Na-alginate wound dressing with sustainable drug delivery properties. Polym. Advan. Technol. 2021, 32, 1793–1801. [Google Scholar] [CrossRef]
- Shearer, S.A.; Payne, F.A. Color and defect sorting of bell peppers using machine vision. Trans. ASAE 1990, 33, 1245–1250. [Google Scholar] [CrossRef]
- Kumari, A.; Emerald, E.; Magdaline, F.; Simha, V.; Pushpadass, H.A. Effects of baking conditions on color, texture and crumb grain characteristics of Chhana Podo. Int J. Dairy Technol. 2015, 68, 270–280. [Google Scholar] [CrossRef]
- Panjagari, N.R.; Singh, A.K.; Ganguly, S.; Indumati, K.P. Beta-glucan rich composite flour biscuits: Modelling of moisture sorption isotherms and determination of sorption heat. J. Food Sci. Technol. 2015, 52, 5497–5509. [Google Scholar] [CrossRef] [Green Version]
- Brunauer, S.; Emmet, P.H.; Teller, E. Adsorption of gases in multimolecular layer. J. Am. Chem. Soc. 1938, 62, 1723–1732. [Google Scholar] [CrossRef]
- Van-den-Berg, C.; Bruin, S. Water activity and its estimation in food systems: Theoretical aspects. In Water Activity: Influence on Food Quality; Rockland, L.B., Stewart, G.F., Eds.; Academic Press: New York, NY, USA, 1981; p. 26. [Google Scholar]
- Belbekhouche, S.; Bras, J.; Siqueira, G.; Chappey, C.; Lebrun, L.; Khelifi, B.; Dufresne, A. Water sorption behavior and gas barrier properties of cellulose whiskers and microfibrils films. Carbohyd. Polym. 2011, 83, 1740–1748. [Google Scholar] [CrossRef]
- Fontan, C.F.; Chirife, J.; Sancho, E.; Iglesias, H.A. Analysis of a model for water sorption phenomena in foods. J. Food Sci. 1982, 47, 1590–1594. [Google Scholar] [CrossRef]
- Peleg, M. Assessment of a semi-empirical four parameter general model for sigmoid moisture sorption isotherms. J. Food Process. Eng. 1993, 16, 21–37. [Google Scholar] [CrossRef]
- D’Arcy, R.L.; Watt, I.C. Analysis of sorption isotherms of non-homogeneous sorbents. Trans. Faraday Soc. 1970, 66, 1236–1245. [Google Scholar] [CrossRef]
- IS: 9845; Indian Standard: Determination of Overall Migration of Constituents of Plastics Materials and Articles Intended to Come in Contact with Food Stuffs–Method of Analysis. Bureau of Indian Standards: New Delhi, India, 1998.
- Nussinovitch, A. Carrageenans. In Hydrocolloid Applications: Gum Technology in the Food and Other Industries; Nussinovitch, A., Ed.; Blackie Academic & Professional: London, UK, 1997; pp. 40–62. [Google Scholar]
- Elfak, A.M.; Pass, G.; Phillips, G.O. The effect of shear rate on the viscosity of solutions of sodium carboxymethylcellulose and κ-carrageenan. J. Sci. Food Agric. 1979, 30, 724–730. [Google Scholar] [CrossRef]
- Nishinari, K.; Watase, M. Effects of sugars and polyols on the gel-sol transition of kappa-carrageenan gels. Thermochimica Acta. 1992, 206, 149–162. [Google Scholar] [CrossRef]
- Lu, J.W.; Zhu, Y.L.; Guo, Z.X.; Hu, P.; Yu, J. Electrospinning of sodium alginate with poly (ethylene oxide). Polymer 2006, 47, 8026–8031. [Google Scholar] [CrossRef]
- Alborzi, S.; Lim, L.T.; Kakuda, Y. Electrospinning of Sodium Alginate-Pectin Ultrafine Fibers. J. Food Sci. 2010, 75, C100–C107. [Google Scholar] [CrossRef]
- Horuz, T.I.; Belibagli, K.B. Production of electrospun gelatin nanofibers: An optimization study by using Taguchi’s methodology. Mater. Res. Express 2017, 4, 015023. [Google Scholar] [CrossRef]
- Mills, A. Oxygen indicators and intelligent inks for packaging food. Chem. Soc. Rev. 2005, 34, 1003–1011. [Google Scholar] [CrossRef]
- Vu, C.H.T.; Won, K. Leaching-resistant carrageenan-based colorimetric oxygen indicator films for intelligent food packaging. J. Agric. Food Chem. 2014, 62, 7263–7267. [Google Scholar] [CrossRef]
- Francis, F.J. Colorimetry of foods. In Physical Properties of Foods; Peleg, M., Bagley, E.B., Eds.; AVI Publishing: Westport, NY, USA, 1983; pp. 105–124. [Google Scholar]
- Khankaew, S.; Boonsupthip, W.; Nandhivajrin, C.; Suppakul, P. Effect of dispersants on particle size and size dispersion of a nanosemiconductor, and pH on color transition of a novel TiO2-based, UVA-activated, oxygen bio-indicator. In Proceedings of the 27th IAPRI Symposium on Packaging, Valencia, Spain, 8–11 June 2015. [Google Scholar]
- Albetran, H.; Dong, Y.; Low, I.M. Characterization and optimization of electrospun TiO2/PVP nanofibers using Taguchi design of experiment method. J. Asian Ceram. Soc. 2015, 3, 292–300. [Google Scholar] [CrossRef] [Green Version]
- Mills, A.; Lawrie, K. Novel photocatalyst-based colorimetric indicator for oxygen: Use of a platinum catalyst for controlling response times. Sens. Actuators B Chem. 2011, 157, 600–605. [Google Scholar] [CrossRef]
- Lawrie, K.; Mills, A.; Hazafy, D. Simple inkjet-printed, UV-activated oxygen indicator. Sens. Actuators B Chem. 2013, 176, 1154–1159. [Google Scholar] [CrossRef]
- Mills, A.; Hazafy, D. Nanocrystalline SnO2-based, UVB-activated, colorimetric oxygen indicator. Sens. Actuators B Chem. 2009, 136, 344–349. [Google Scholar] [CrossRef]
- Alves, V.D.; Castelló, R.; Ferreira, A.R.; Costa, N.; Fonseca, I.M.; Coelhoso, I.M. Barrier properties of carrageenan/pectin biodegradable composite films. Procedia. Food Sci. 2011, 1, 240–245. [Google Scholar] [CrossRef] [Green Version]
- Gontard, N.; Guilbert, S.; Cuq, J.L. Water and glycerol as plasticizers affect mechanical and water vapor barrier properties of an edible wheat gluten film. J. Food Sci. 1993, 58, 206–211. [Google Scholar] [CrossRef]
- Hernandez-Munoz, P.; Kanavouras, A.; Perry, K.W.N.; Gavara, R. Development and characterization of biodegradable films made from wheat gluten protein fractions. J. Agric. Food Chem. 2003, 51, 7647–7654. [Google Scholar] [CrossRef]
- Galus, S.; Lenart, A. Development and characterization of composite edible films based on sodium alginate and pectin. J. Food Eng. 2013, 115, 459–465. [Google Scholar] [CrossRef]
- Fan, Y.; Yang, J.; Duan, A.; Li, X. Pectin/sodium alginate/xanthan gum edible composite films as the fresh-cut package. Int. J. Biol. Macromol. 2021, 181, 1003–1009. [Google Scholar] [CrossRef]
- Alves, V.D.; Costa, N.; Coelhoso, I.M. Barrier properties of biodegradable composite films based on kappa-carrageenan/pectin blends and mica flakes. Carbohydr. Polym. 2010, 79, 269–276. [Google Scholar] [CrossRef]
- Chen, C.H.; Kuo, W.S.; Lai, L.S. Effect of surfactants on water barrier and physical properties of tapioca starch/decolorized hsian-tsao leaf gum films. Food Hydrocoll. 2009, 23, 714–721. [Google Scholar] [CrossRef]


| Treatment | Lightness | Redness | Blueness | ∆E(r-o) | ∆E(p-o) | ||||||
|---|---|---|---|---|---|---|---|---|---|---|---|
| Lo* | Lp* | Lr* | ao* | ap* | ar* | bo* | bp* | br* | |||
| A1B1C1 | 16.00 ± 0.77 bA | 15.74 ± 1.05 cdA | 15.93 ± 0.79 bcA | 5.65 ± 1.14 dA | 10.68 ± 1.24 abB | 5.06 ± 1.38 bcA | −16.23 ± 0.99 abA | −15.94 ± 0.52 aA | −14.26 ± 0.82 aB | 2.71 ± 0.60 abA | 5.08 ± 0.24 aB |
| A1B2C2 | 12.13 ± 0.78 aAB | 11.64 ± 0.90 aA | 13.38 ± 0.41 aB | 4.44 ± 0.82 dA | 10.03 ± 0.97 abB | 5.26 ± 0.34 bcA | −16.56 ± 1.26 abA | −15.79 ± 1.08 aA | −15.06 ± 0.28 aA | 2.53 ± 0.32 aA | 5.89 ± 0.79 abB |
| A1B3C3 | 16.00 ± 0.73 bA | 14.85 ± 0.80 bcA | 16.44 ± 0.93 bcA | 4.71 ± 0.81 dA | 10.79 ± 0.49 abB | 5.21 ± 0.66 bcA | −14.79 ± 1.09 bcA | −14.74 ± 1.02 abA | −10.35 ± 0.85 bB | 4.69 ± 0.79 cA | 6.24 ± 0.55 abB |
| A2B1C2 | 16.54 ± 0.96 bA | 18.50 ± 0.88 eB | 18.82 ± 1.00 dB | 3.29 ± 0.40 bcA | 8.91 ± 0.91 aB | 4.15 ± 0.72 abcA | −13.53 ± 0.99 cA | −12.41 ± 1.68 cA | −11.12 ± 0.72 bA | 3.76 ± 0.35 abcA | 6.14 ± 0.80 ab |
| A2B2C3 | 13.38 ± 0.52 aA | 13.19 ± 0.95 abA | 14.68 ± 1.23 abA | 4.82 ± 0.97 dA | 11.73 ± 0.83 bB | 5.5 ± 1.31 cA | −15.73 ± 0.97 abAB | −16.29 ± 0.84 aA | −14.32 ± 0.95 aB | 2.54 ± 0.73 aA | 7.02 ± 0.28 bB |
| A2B3C1 | 13.77 ± 0.88 aA | 14.78 ± 0.94 bcA | 16.57 ± 0.62 cB | 5.32 ± 0.72 dA | 10.06 ± 2.07 abB | 5.18 ± 0.84 bcA | −17.12 ± 1.21 aA | −15.53 ± 1.10 aAB | −13.5 ± 0.67 aA | 4.62 ± 0.46 cA | 5.23 ± 0.99 aA |
| A3B1C3 | 17.08 ± 0.94 bA | 18.38 ± 1.31 eAB | 20.02 ± 1.57 dB | 5.24 ± 0.78 dA | 11.09 ± 1.64 abB | 3.82 ± 0.36 abA | −16.5 ± 0.76 abA | −13.35 ± 1.21 bcB | −10.09 ± 1.74 bC | 7.47 ± 1.42 dA | 6.97 ± 1.00 bA |
| A3B2C1 | 18.90 ± 1.71 cA | 17.33 ± 1.15 deA | 19.09 ± 1.38 dA | 1.85 ± 0.34 aA | 10.18 ± 0.92 abB | 3.21 ± 0.85 aA | −15.77 ± 0.83 abAB | −16.53 ± 0.70 aA | −14.29 ± 1.42 aB | 3.17 ± 1.10 abA | 8.53 ± 0.61 cB |
| A3B3C2 | 19.78 ± 0.91 cA | 18.82 ± 1.10 eA | 18.35 ± 0.36 dA | 2.47 ± 0.6 abA | 11.91 ± 1.20 bB | 5.56 ± 0.67 cA | −17.03 ± 1.38 aA | −15.91 ± 0.82 aA | −15.09 ± 0.55 aA | 4.14 ± 0.44 bcA | 9.70 ± 0.53 cB |
| Model | Parameter | Estimated Values | Model | Parameter | Estimated Values |
|---|---|---|---|---|---|
| BET (aw = 0.1–0.5) | Mo | 7.37 | Peleg (aw = 0.1–0.9) | A | 112.39 |
| Cb | 2.43 | B | 23.09 | ||
| R2 | 0.9979 | C1 | 6.96 | ||
| P | 0.489 | C2 | 1.24 | ||
| RMS% | 2.46 | R2 | 0.9859 | ||
| P | 4.82 | ||||
| RMS% | 11.20 | ||||
| GAB (aw = 0.1–0.9) | K | 0.74 | D’Arcy & Watt (aw = 0.1–0.9) | K1 | 2.81 × 10⁻⁶ |
| C | 2.13 | K2 | −228.30 | ||
| Mo | 9.84 | K3 | −5.19 | ||
| R2 | 0.9896 | K4 | 0.92 | ||
| χ2 | 8.51 | K5 | 15.88 | ||
| P | 6.82 | R2 | 0.9844 | ||
| RMS% | 16.60 | P | 7.07 | ||
| RMS% | 17.75 | ||||
| Ferro-Fontan (aw = 0.1–0.9) | A | 1.20 | Park (aw = 0.1–0.9) | A | −0.489 |
| B | 3.49 | B | −7.19 | ||
| C | 0.58 | H | 19.69 | ||
| R2 | 0.9897 | K | 17.31 | ||
| P | 6.138 | n | 6.61 | ||
| RMS% | 9.16 | R2 | 0.9823 | ||
| P | 4.94 | ||||
| RMS% | 9.09 |
Publisher’s Note: MDPI stays neutral with regard to jurisdictional claims in published maps and institutional affiliations. |
© 2022 by the authors. Licensee MDPI, Basel, Switzerland. This article is an open access article distributed under the terms and conditions of the Creative Commons Attribution (CC BY) license (https://creativecommons.org/licenses/by/4.0/).
Share and Cite
Panwar, S.; Panjagari, N.R.; Singh, A.K.; Deshwal, G.K.; Badola, R.; Minz, P.S.; Goksen, G.; Rusu, A.; Trif, M. Electrospun Smart Oxygen Indicating Tag for Modified Atmosphere Packaging Applications: Fabrication, Characterization and Storage Stability. Polymers 2022, 14, 2108. https://0-doi-org.brum.beds.ac.uk/10.3390/polym14102108
Panwar S, Panjagari NR, Singh AK, Deshwal GK, Badola R, Minz PS, Goksen G, Rusu A, Trif M. Electrospun Smart Oxygen Indicating Tag for Modified Atmosphere Packaging Applications: Fabrication, Characterization and Storage Stability. Polymers. 2022; 14(10):2108. https://0-doi-org.brum.beds.ac.uk/10.3390/polym14102108
Chicago/Turabian StylePanwar, Shivam, Narender Raju Panjagari, Ashish Kumar Singh, Gaurav Kr Deshwal, Richa Badola, Prashant Saurabh Minz, Gulden Goksen, Alexandru Rusu, and Monica Trif. 2022. "Electrospun Smart Oxygen Indicating Tag for Modified Atmosphere Packaging Applications: Fabrication, Characterization and Storage Stability" Polymers 14, no. 10: 2108. https://0-doi-org.brum.beds.ac.uk/10.3390/polym14102108