Article

Synthesis of Gelatin-γ-Polyglutamic Acid-Based Hydrogel for the In Vitro Controlled Release of Epigallocatechin Gallate (EGCG) from Camellia sinensis

by
John Philip Domondon Garcia
1,
Ming-Fa Hsieh
2,
Bonifacio Tobias Doma, Jr.
1,
Dorothy Caminos Peruelo
3,
Ing-Ho Chen
4 and
Hung-Maan Lee
4,5,*
1
School of Chemical Engineering and Chemistry, Mapua Institute of Technology, Muralla St., Intramuros, Manila 1002, Philippines
2
Department of Biomedical Engineering and Center for Nanotechnology, Chung Yuan Christian University, 200, Chung Pei Rd., Chung Li 32023, Taiwan
3
Department of Chemistry, Xavier University-Ateneo de Cagayan, Cagayan de Oro City 9000, Philippines
4
Buddhist Tzu Chi General Hospital and Tzu Chi University, Hualien 97002, Taiwan
5
Taoyuan Armed Forces General Hospital, Taoyuan 32551, Taiwan
*
Author to whom correspondence should be addressed.
Submission received: 31 October 2013 / Revised: 12 December 2013 / Accepted: 16 December 2013 / Published: 27 December 2013
(This article belongs to the Special Issue Polymers for Drug Delivery)

Abstract

:
The antioxidant property and other health benefits of the most abundant catechin, epigallocatechin gallate (EGCG), are limited because of poor stability and permeability across intestine. Protecting the EGCG from the harsh gastrointestinal tract (GIT) environment can help to increase its bioavailability following oral administration. In this study, EGCG was loaded to hydrogel prepared from ionic interaction between an optimized concentration of gelatin and γ-polyglutamic acid (γ-PGA), with ethylcarbodiimide (EDC) as the crosslinker. Physicochemical characterization of hydrogel was done using Fourier transform-infrared spectroscopy (FT-IR), differential scanning calorimetry (DSC) and scanning electron microscopy (SEM). The dependence of the swelling degree (SD) of the hydrogel to the amount of gelatin, γ-PGA, EDC, swelling time and pH was determined. A high SD of the crosslinked hydrogel was noted at pH 4.5, 6.8 and 9.0 compared to pH 7.4, which describes pH-responsiveness. Approximately 67% of the EGCG from the prepared solution was loaded to the hydrogel after 12 h post-loading, in which loading efficiency was related to the amount of EDC. The in vitro release profile of EGCG at pH 1.2, 6.8 and 7.4, simulating GIT conditions, resulted in different sustained release curves. Wherein, the released EGCG was not degraded instantly compared to free-EGCG at controlled temperature of 37 °C at different pH monitored against time. Therefore, this study proves the potential of pH-responsive gelatin-γ-PGA-based hydrogel as a biopolymer vehicle to deliver EGCG.

Graphical Abstract

1. Introduction

Green tea (Camellia sinensis) leaves contain approximately 36% polyphenols, the majority of which are catechins [1]. Catechins (flavan-3-ols), a flavonoid, are divided into major and minor substances. The major substances are epicatechin (EC), epicatechin gallate (ECG), epigallocatechin (EGC) and epigallocatechin gallate (EGCG). The minor substances, which are epimers of major catechins, are catechin (C), catechin gallate (CG), gallocatechin (GC) and gallocatechin gallate (GCG). These substances account for the bitter and astringent taste of the tea.
Among the major catechins, EGCG is the most abundant component of tea extract, accounting for about 48%–55% of the total polyphenols [2]. EGCG exhibits favorable therapeutic effects, such as anti-cancer, anti-inflammatory, antioxidant, anti-viral, cardio-protective and neuro-protective, and has a cholesterol modulation mechanism [3,4,5]. Relative to vitamin C, E and butylated hydroxyanisole (BHA) or butylated hydroxytoluene (BHT), EGCG has 2–4 times higher sulfated effects when used as sulfated agents in general cosmetics, where the sulfated agents protect vital cells by combining free radicals [6]. According to other studies, the EGCG-mediated biological activities are connected to its antioxidant properties, mainly due to its structure, which is capable of scavenging the free radicals, or by chelating metals with redox properties [7,8].
However, due to the poor oral bioavailability of tea catechins, its health benefits are limited. An estimated concentration of at least 10 μM is required for the EGCG to show an evident therapeutic result [9], but previous studies have shown that following an oral administration of EGCG in rats, the EGCG absorbed into its systemic circulation is at most 5% of the original dose. [10]. The poor oral bioavailability of catechins, mainly EGC and EGCG, is attributed to their poor stability, as shown in studies of in vitro digestive simulated gastro-intestinal tract (GIT) conditions [11], and to poor intestinal permeability [12,13].
The addition of bovine, soy, rice milk, ascorbic acid and citrus juice resulted in the increase of post-digestion recovery of EGCG, EGC, ECG and EC [11]. Hence, protecting the catechins from the GIT environment will increase their post-digestion recovery for oral delivery purposes. Loading catechins, mostly EGCG, into a biopolymer vehicle is one way to protect them from GIT instability and for the sustained-delivery of catechins. However, the biopolymer vehicle candidate must pass several criteria, such as biocompatibility, toxicity, physical-mechanical properties and acid-environment characteristics [14].
Hydrogel, which is defined as a three-dimensional polymer network capable of absorbing an aqueous solvent [15], was used as a biopolymer vehicle in previous studies [16,17,18]. The composition of hydrogels can be natural polymers or synthetic polymers. Among natural polymers, gelatin has gained attention for hydrogel formation, due to its abundance and properties. Gelatin is the product of the partial hydrolysis of collagen. Type-A gelatin results in the acid treatment of collagen from pig skin, resulting in an isoelectric point (IEP) of 7.0 to 9.0 [19]. γ-Polyglutamic acid (γ-PGA), found in natto, a traditional Japanese fermented food, is a non-toxic, edible and anionic polypeptide [20]. Gelatin and γ-PGA at a pH = 7.4 aqueous solution can form a polycation and polyanion, respectively, which, by ionic interaction, will form polyion complex insoluble hydrogels [21].
The objective of this study was to load the EGCG into the ionic hydrogel prepared from gelatin and γ-PGA to protect EGCG from the harsh GIT environment for an oral delivery system. Further, optimization of the concentration between the two polypeptides was performed by using the factors of swelling degree (SD) and loading efficiency. The relationship describing the dependence of the SD to the concentration of the two polypeptides, the crosslinker, swelling time and pH was also discussed. The release profile of EGCG and the pH-responsive characteristics of the hydrogel were also investigated in in vitro simulated digestive GIT conditions. Physicochemical characterization of the hydrogel was also done using SEM, FT-IR and differential scanning calorimetry (DSC).
Only a few studies covered the potential of hydrogel based on gelatin and γ-PGA as a biopolymer vehicle for EGCG, a water soluble compound. Considering the oxidation of EGCG when exposed for a long duration of time, the loading efficiency of this hydrogel and the optimum loading time were also determined.

2. Experimental Section

2.1. Materials

Dried green tea leaves were obtained from Ten Ren Tea Co. (Taiwan). Gelatin from porcine skin, type-A gelatin and N-ethylcarbodiimide hydrochloride (EDC) were purchased from Sigma-Aldrich Co. (St. Louis, MO, USA). γ-PGA (Na+ form, low molecular weight) was acquired from Vedan (Taiwan). The salts used to prepare 0.15 M of phosphate buffered saline (PBS), such as KCl, KH2PO4, NaCl and Na2HPO4 salts, were all purchased from Sigma-Aldrich Co. Hydrochloric acid was obtained from Fisher Scientific (Waltman, MA, USA). Solvents, such as ethanol and chloroform from Echo Chemical Co., Ltd (Taiwan) and ethyl acetate from Seed Chem Company (Melbourne, Australia), were used for EGCG extraction. The 95% EGCG standard used in the determination of extract purity was purchased from Sigma-Aldrich Co.

2.2. Extraction of EGCG from Green Tea Leaves

EGCG was extracted according to a previously reported method [22]. Firstly, dried green tea leaves were ground, and then, 10 grams of powdered green tea was dissolved in 150 mL 65% ethanol refluxed at 100 °C for 15 min. The green tea residue was vacuum filtered using advantec filter paper grade no. 131. The ethanol solvent in the filtrate was removed using a rotary evaporator (N-1200A, Eyela, Tokyo, Japan). The dried solid was subjected to a vacuum dryer for further removal of ethanol. Millipore pure water was used to dissolve the dried solid, which was transferred to a separatory funnel for extraction against an equal volume of chloroform twice. Next, the resulting water phase was extracted against ethyl acetate two times. Using the rotary evaporator and vacuum dryer again, the dried extracts were obtained from the ethyl acetate phase. The dried extract was then washed with a small amount of reverse osmosis water and stored at −80 °C. Finally, the frozen extract was subjected to a freeze drier (FDU-1200, Eyela, Tokyo, Japan) to obtain a powdered EGCG extract stored in low humidity containers. Purity determination of EGCG extract was done using UV-Vis spectrophotometer (UV-1800, Shimadzu, Kyoto, Japan) at a 275 nm wavelength.

2.3. Synthesis of Hydrogels

Ionic hydrogels were prepared according to a previous procedure with some modification [17]. Briefly, a specific amount of gelatin (8, 10, 12 w/v%) was initially dissolved and mixed in phosphate buffered solution (PBS) (pH = 7.4), maintained at a temperature of 37 °C. After 4 min, γ-PGA solution (0.5, 1, 2, 4 w/v%) was added for a final volume of 1 mL. When the solution was already homogenized after another 4 min, 1 mL of EDC crosslinker solution (0.75, 1.3, 2.5 mg/mL), or 1 mL of PBS (pH = 7.4) for uncrosslinked hydrogel, was added and continuously stirred for about 1 min before placing it in 12-well polystyrene plates (Costar, Corning, Tewksbury, MA, USA) with a diameter of 2.2 cm. The hydrogels were set for gelation for 12 h at 4 °C. After, the hydrogels were washed with 40 mL PBS (pH = 7.4) for 30 min at 60 rpm shaking (Laboratory Shaker, Shin Kwang, Taiwan).

2.4. Characterization of Hydrogels

2.4.1. Determination of Swelling Degree

Washed hydrogels were swollen in PBS for six hours, shaken also at 60 rpm, and the swollen weight was recorded at every 2-h interval, placing filter papers on the top and bottom of the hydrogels to pat dry before weighing. Lastly, they were dried in an oven at 65 °C for two days until dehydrated; then, the dried weight was recorded. The effect of the concentration of gelatin, γ-PGA and EDC on the hydrogel’s capability to absorb water against time was determined using Equation (1).
SDi = (MwiMd)/ Md
where SDi is the swelling degree at specific time i, Mwi is the swollen weight and Md is the dry weight.

2.4.2. Fourier Transform-Infrared Spectroscopy (FT-IR)

FT-IR analyses of gelatin, γ-PGA, EGCG, loaded and unloaded dried hydrogels were done using a Jasco FT/IR-410 (Tokyo, Japan) in transmission mode in the wavelength range of 400–4000 cm−1. The thin disks were prepared from samples with the addition of KBr salt in a 1:100 ratio.

2.4.3. Differential Scanning Calorimetry (DSC)

The miscibility of gelatin and γ-PGA was investigated using a Jade DSC (Perkin Elmer, Waltham, MA, USA) in the range of 25 °C up to 250 °C at a heating rate of 10 °C/min. Included in the thermogram analysis was the effect of the crosslinker on the thermal properties of the hydrogel.

2.4.4. Scanning Electron Microscopy (SEM)

The surface morphology of the freeze-dried hydrogel was examined using an SEM Tabletop Microscope-1000 (Hitachi, Tokyo, Japan) and a Field Emission SEM (JSM-7600F, JEOL, Tokyo, Japan). The solid samples were mounted on a stub using double-sided adhesive tape before being coated with gold using the ion sputter method (E-1010, Hitachi) and an auto fine coater (JFC-1600, JEOL).

2.5. Loading of EGCG to Hydrogels

Washed hydrogel was freeze-dried prior to loading. Then, EGCG was loaded by soaking freeze-dried hydrogel in a known EGCG solution in a covered 3.8-cm glass vial, shaken at 100 rpm. The EGCG solution was prepared by using PBS for a total volume of 10 mL. Initially, the optimum loading time was determined by monitoring the remaining EGCG in the solution as representative of the cumulative loaded EGCG against time up to 24 h using UV-Vis at 275 nm. Then, using the optimum loading time, uncrosslinked and different degrees of crosslinked hydrogels were soaked in EGCG solution. The loading efficiency was calculated as follows:
Loading efficiency (%) = ((CtCf) / Ct) × 100
where Ct is the initial total EGCG present in the solution and Cf is the free EGCG present in the solution after the soaking of the hydrogel.
The loaded hydrogel was again freeze-dried to remove excess absorbed solvent.

2.6. In Vitro EGCG Release Kinetics

The release of EGCG was done in three pH levels of solution, such as 1.2, 6.8 and 7.4, to act as GIT fluids, specifically simulating gastric fluid, the jejunal region of small intestine and the ileum segment, respectively [23]. Approximately, 0.1 M HCl was used to make pH 1.2, while PBS was used to for pH 6.8 and 7.4. In a 3.8-cm covered glass vial, 10 mL of solution at a specific pH were poured, and the vial was placed in a water bath to maintain a temperature of 37 °C. Then, loaded freeze-dried hydrogel was placed inside the vial with a magnetic stir bar rotating at 200 rpm. At various time intervals (0.25, 0.5, 0.75, 1, 1.5, 2, 3, 4 5, 6, 7, 8, 10 and 12 h), a 1-mL aliquot was carefully withdrawn to measure the released EGCG and immediately replaced with 1 mL of fresh solution. A correction on the released EGCG, due to dilution, in every time interval, was noted. The percentage of EGCG released was based on the total EGCG loaded into the hydrogel from its loading efficiency.
In vitro release data is fitted to Peppas equation [Equation (3)] to determine the drug release mechanism of the hydrogel:
ln F = n ln t + ln k
where F is fractional cumulative release, n is the diffusional exponent, k is constant and t is time in seconds.

2.7. Instability of EGCG in In Vitro Simulated Digestive GIT Conditions

Firstly, 40 mL of HCl solution at pH 1.2 and PBS at pH 6.8 and 7.4 were placed in a covered glass container and put in an oven at a temperature of 37 °C. Once the solvents at the three different pH levels maintained their temperature, EGCG solutions were prepared and continuously shaken at 100 rpm inside the oven, where light was not present, to avoid photo-oxidation. The initial concentration of EGCG in the three solutions was determined using UV-Vis spectroscopy. Then, the EGCG concentration was monitored for 0.25, 0.5, 0.75, 1, 1.5, 2, 2.5 and 3 h using a 1-mL aliquot. Fresh solution was added every time the aliquot was withdrawn.

2.8. Statistical Analysis

One-way analysis of variance (ANOVA) was used to determine the statistical significance (α = 0.05) of mean differences and the mean comparison following the Tukey, Scheffe and Bonferroni tests. Data analysis and graphical software (Origin 8, OriginLab Corp., Northampton, MA, USA) was used. All data are mean values with the standard deviation presented as the mean ± the standard deviation (n = 2).

3. Results and Discussion

3.1. Optimization of Hydrogel Formulation

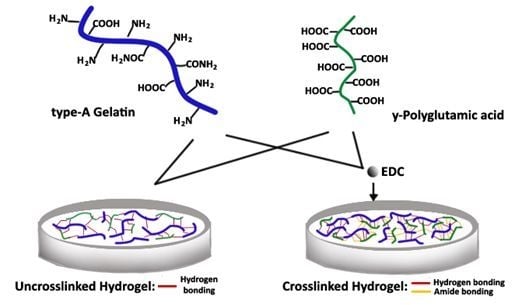
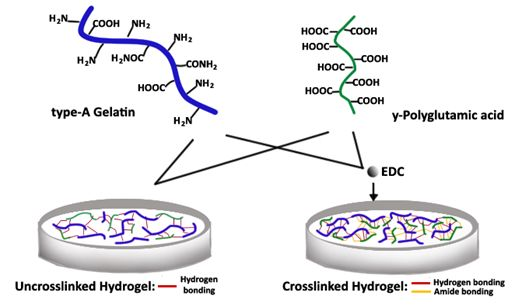
The hydrogel was prepared by the ionic interaction of type-A gelatin and γ-PGA with EDC as the crosslinker. During synthesis at pH = 7.4, gelatin with an isoelectric point (IEP) of 9.0 is cationic, while γ-PGA is naturally anionic. In Figure 1, the interaction between the polymers is illustrated. The type-A gelatin charge is mainly due to its carboxyl, amino and guanidino groups on the side chains [24,25]. On the γ-PGA side chain, only the carboxyl group is present [26]. Using the EDC, gelation of the two polymers at a lower temperature triggers the formation of an amide bond between the carboxyl group of γ-PGA and the amino group of gelatin. A hydrogen bond is also present between the two polymers. By varying the concentration of the two polymers and the crosslinker, the crosslinking density changes, which is represented by the change in its water uptake as SD (swelling degree) [27].
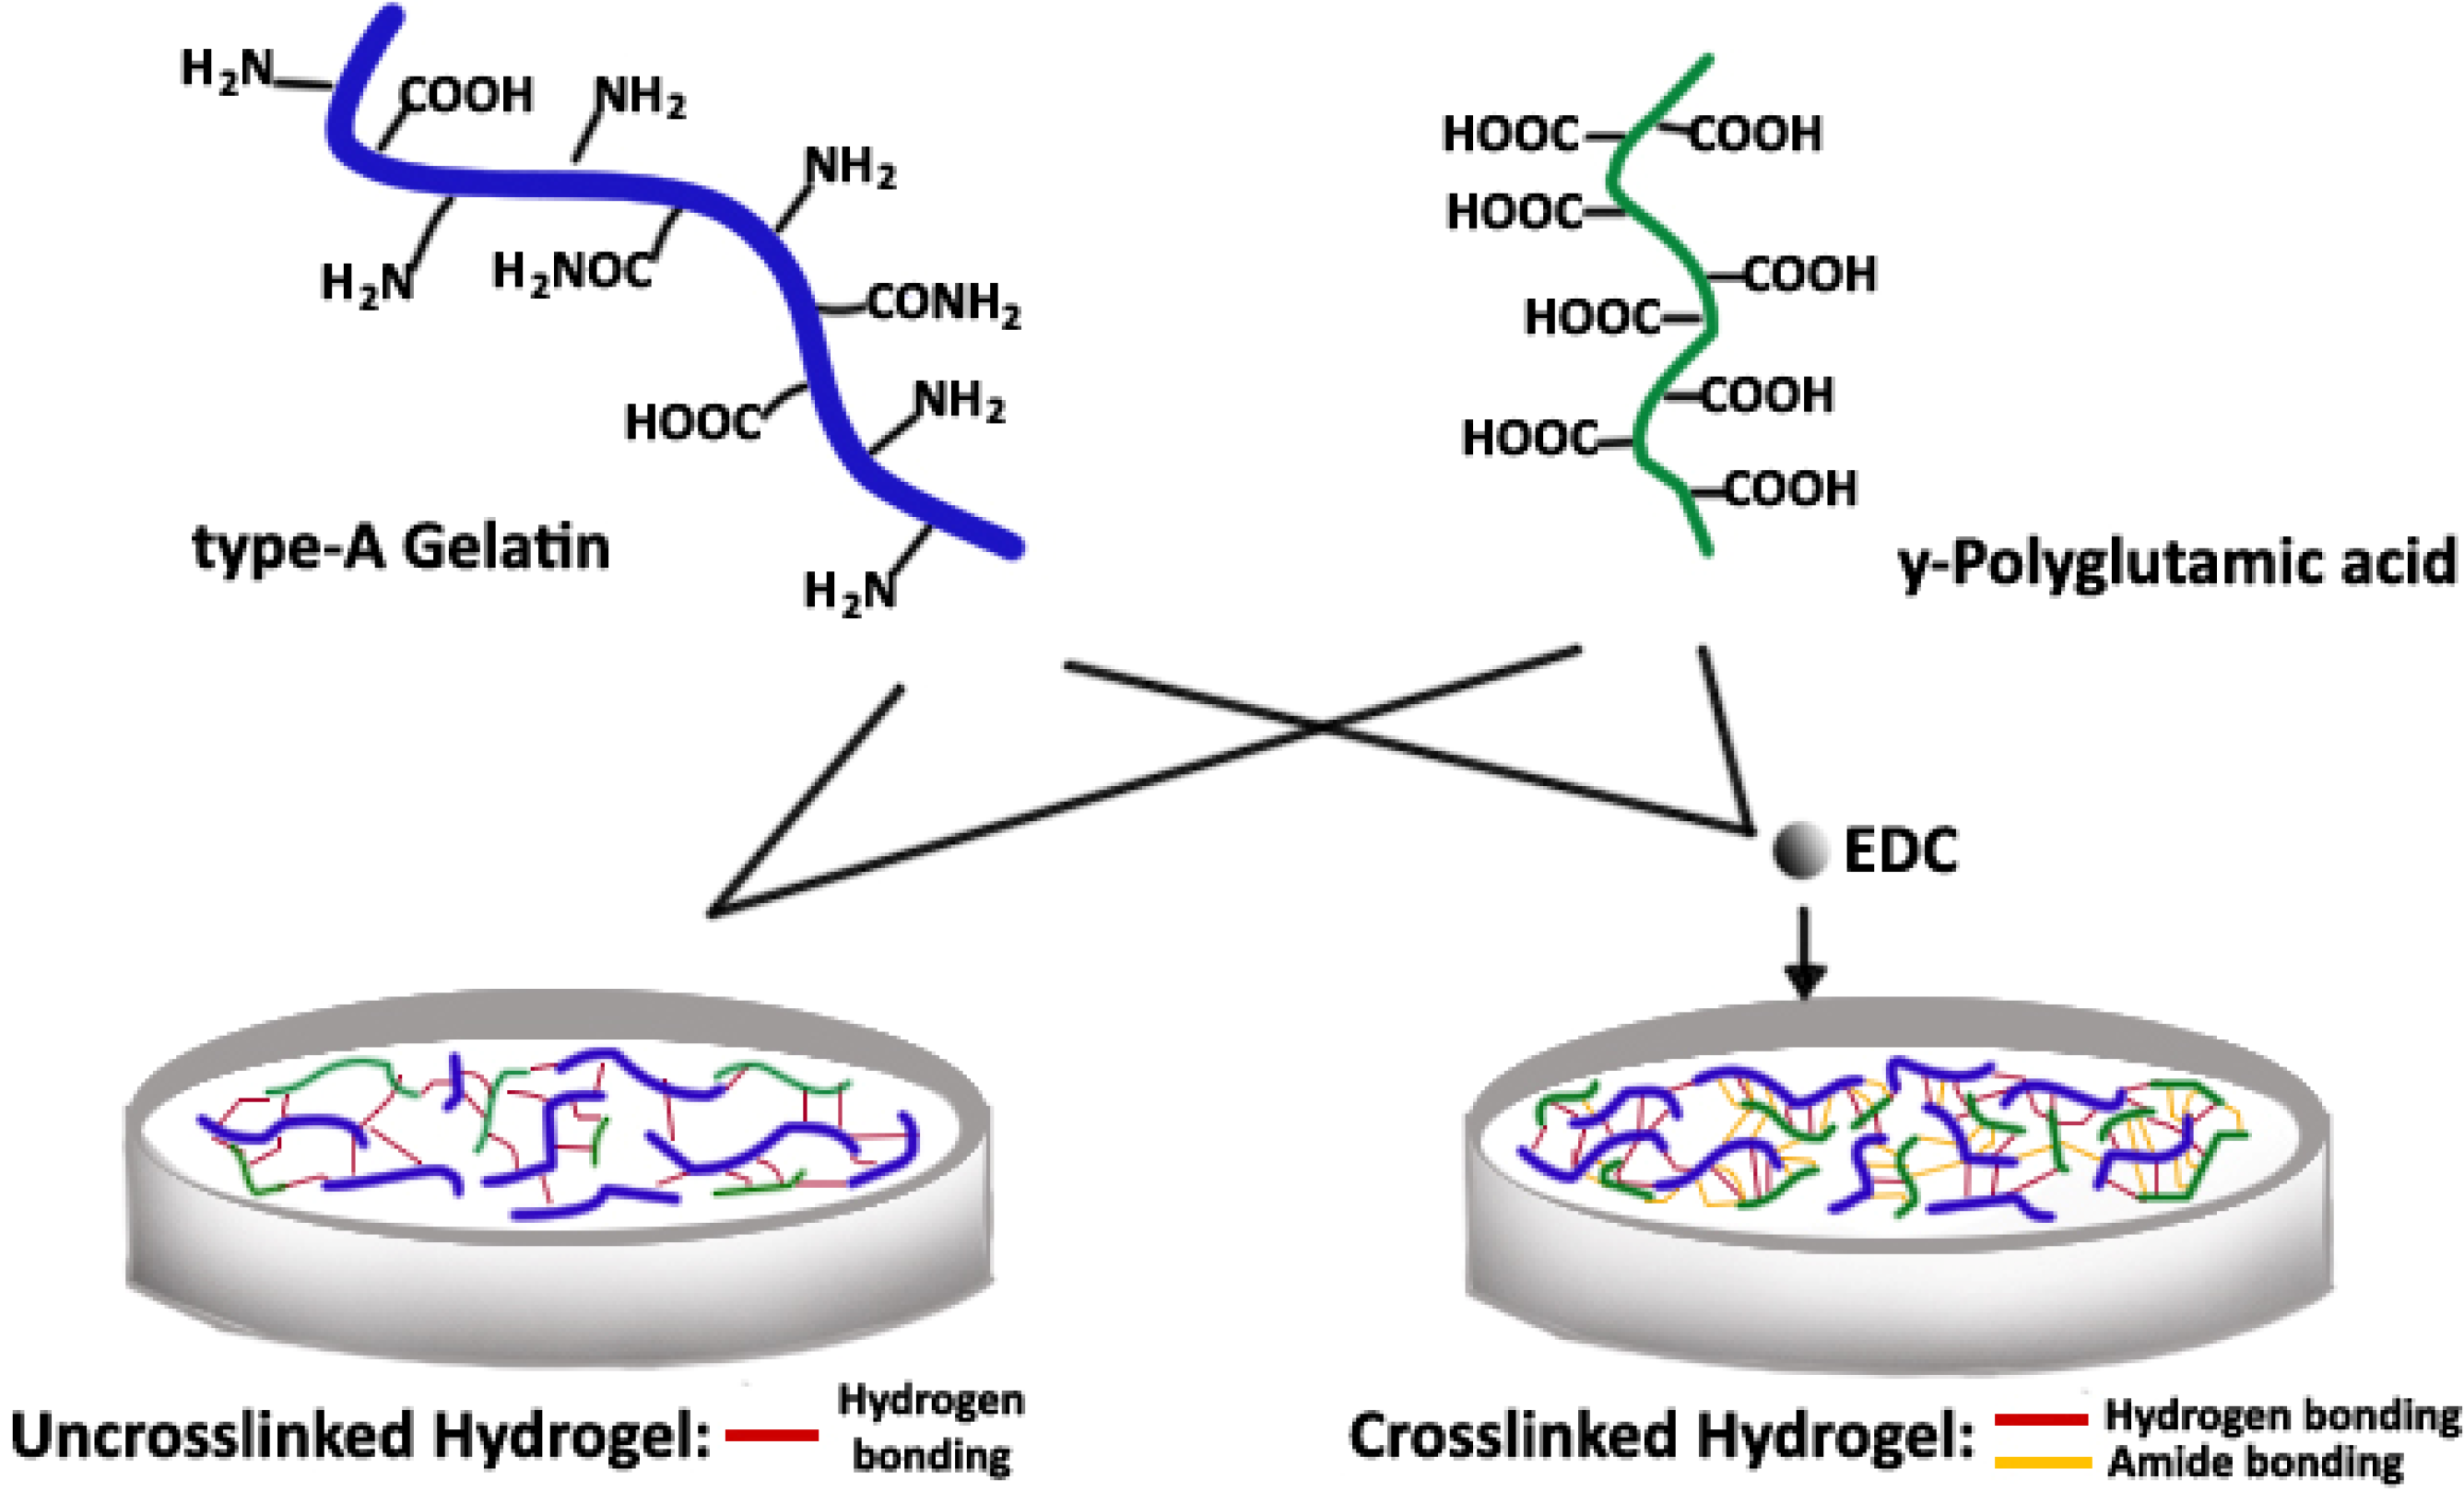
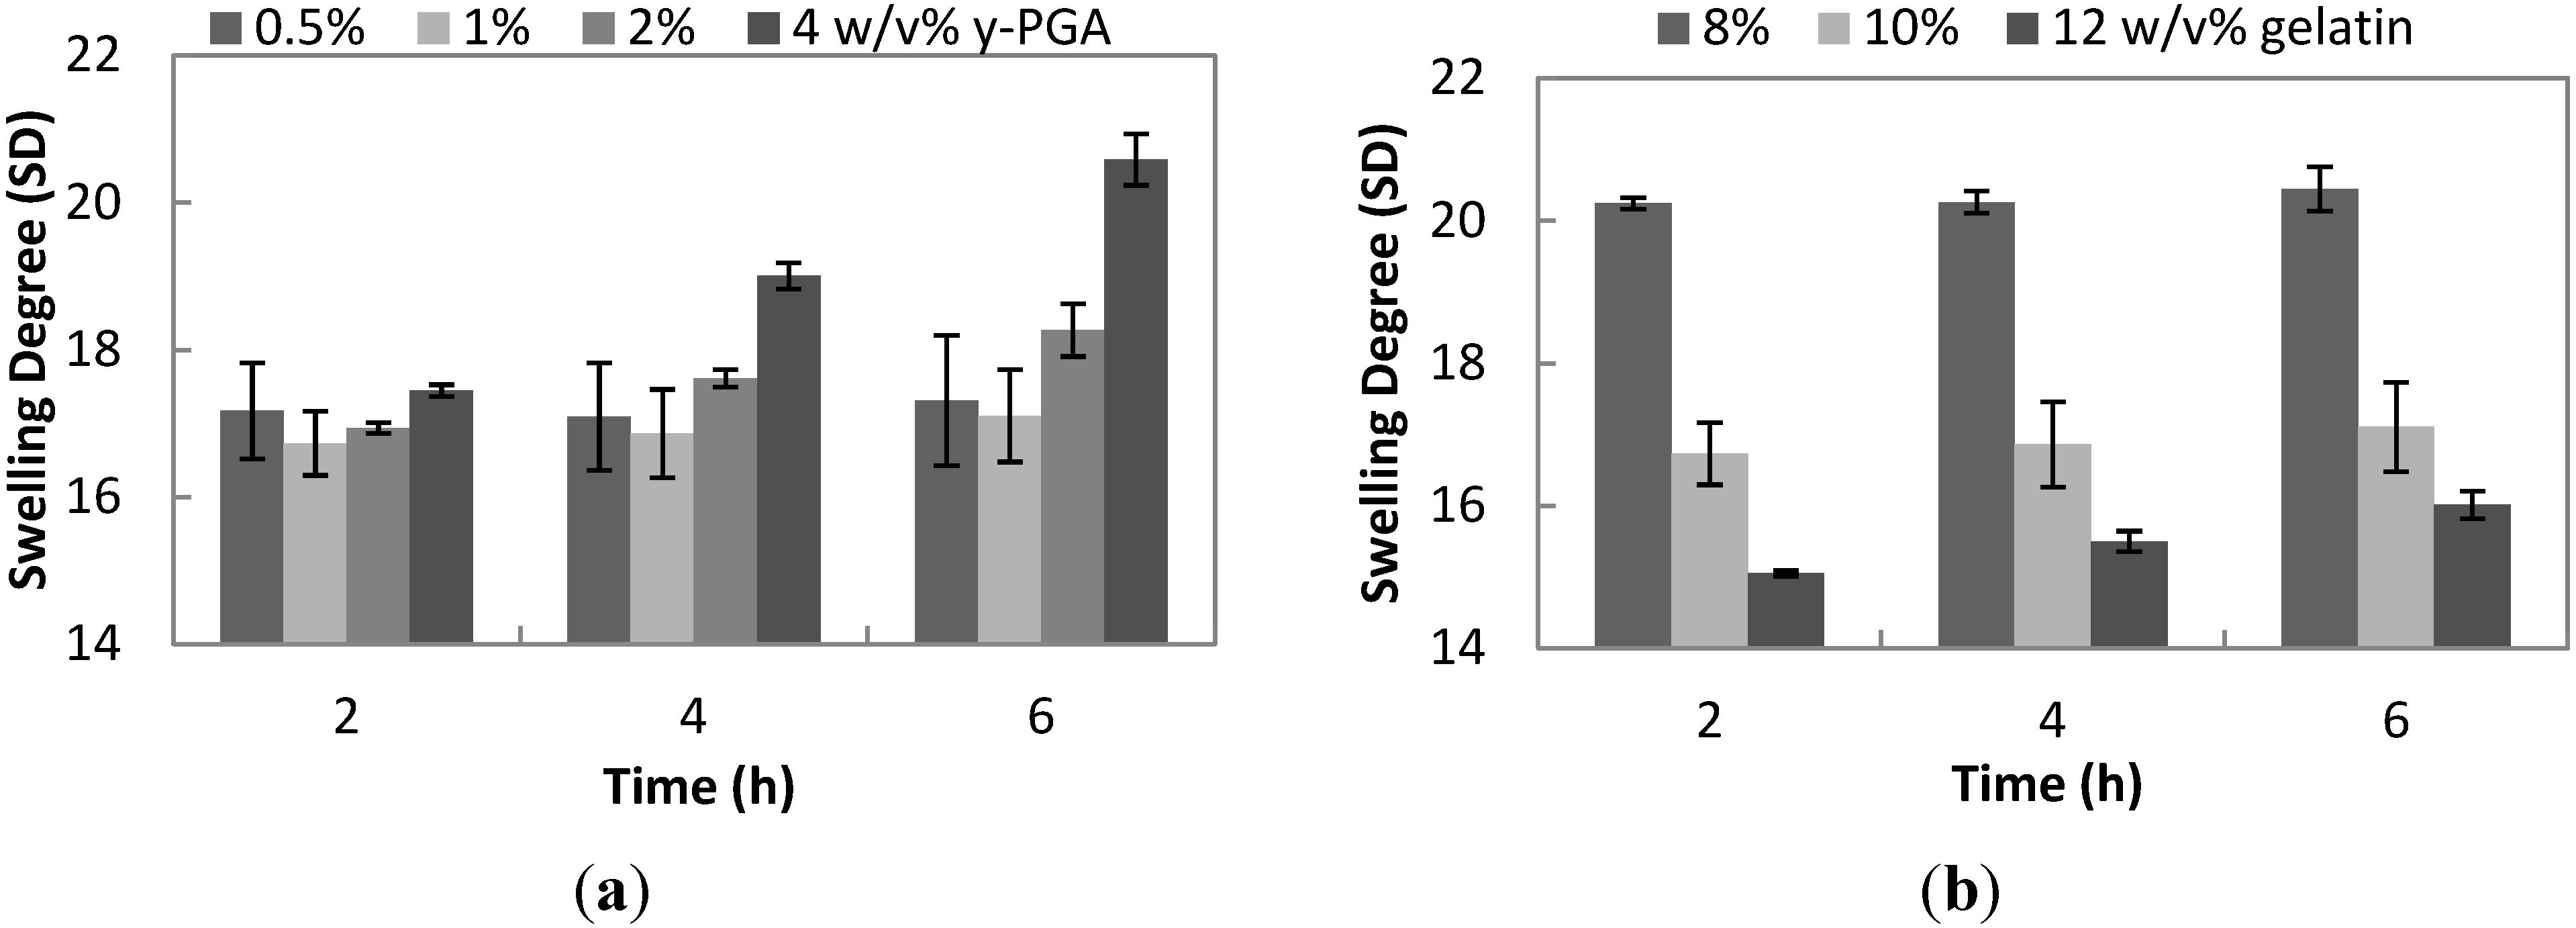
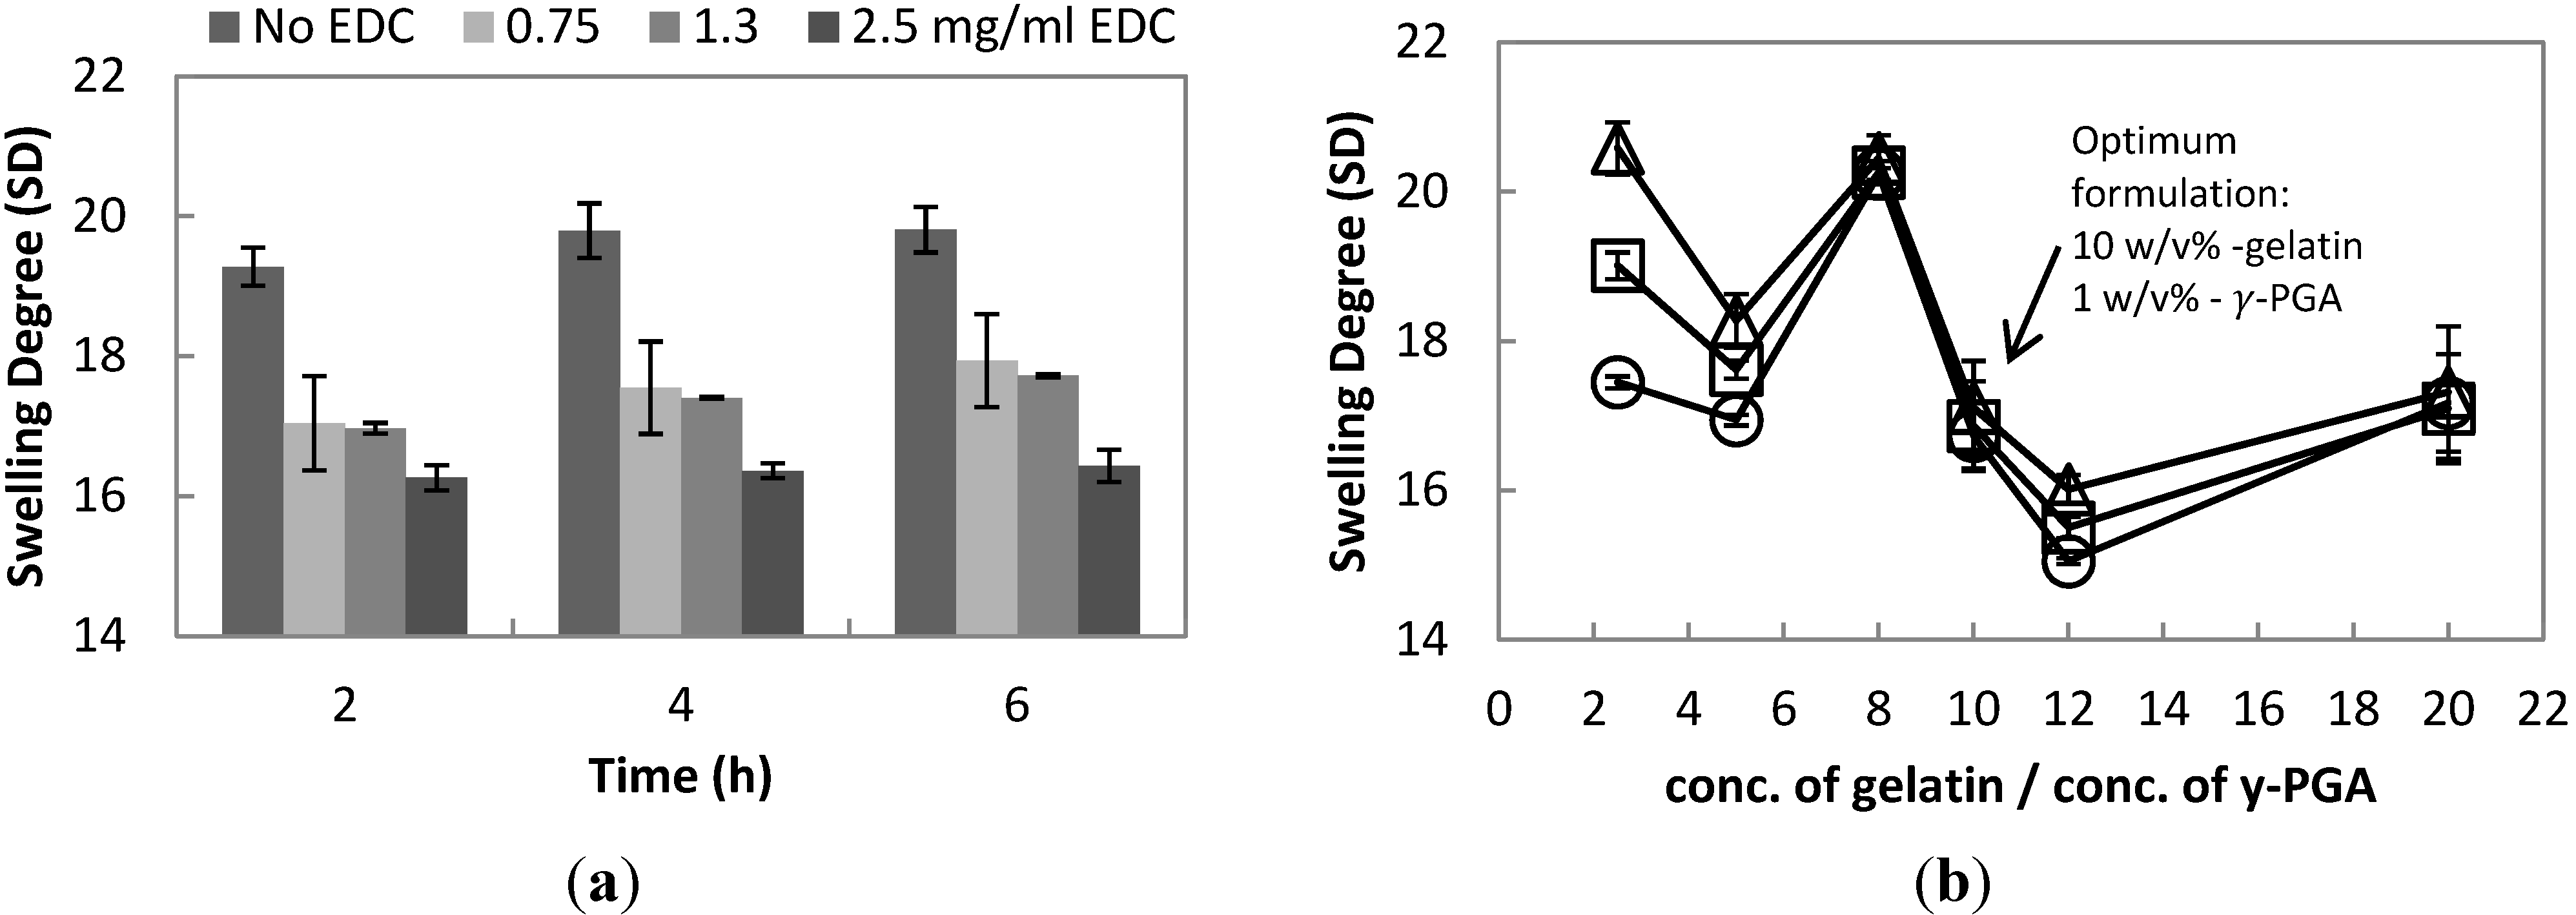
For the first 2 h of the swelling kinetics of increasing γ-PGA, as shown in Figure 2a, the means of four different formulations have no statistical difference. Notably, the SD of 1% γ-PGA has the lowest value. After 4 h of swelling, 4% γ-PGA with an SD of 19.01 ±0.18 is significantly different from 1% γ-PGA with an SD 16.86 ± 0.60. At the last swelling time of 6 h, 4% γ-PGA posted the highest SD of 20.58 ± 0.35, which is an 8% increase from its SD at 4 h and an 18% increase from the initial SD at 2 h. Among all formulations, only 0.5% and 1% γ-PGA SD did not significantly change during the 6-h swelling.
Notably, the trend is that as the concentration of γ-PGA increases, the SD also increases, but this is not evident between 0.5% and 1%, wherein it decreases. This only proves that the optimal concentration of the carboxyl group from γ-PGA to interact for hydrogel formation is 1%, above which, excess γ-PGA will interfere with the gelation process [28]. Although, the SD means of 0.5% and 1% are not statistically different from the entire 6 h of swelling.
Figure 1. The effect of the crosslinker [ethylcarbodiimide (EDC)] on the ionic interaction of type-A gelatin and γ-Polyglutamic acid (γ-PGA) for the synthesis of hydrogel at a pH=7.4 and a temperature of 4 °C.
Polymers 06 00039 g001
Figure 2. (a) The effect of increasing concentration of γ-PGA [0.5, one, two and 4 w/v% (g/mL)] on the swelling degree (SD) of hydrogel at a constant formulation of 10 w/v% gelatin and of 1.3 mg/mL EDC, swelled in phosphate buffered saline (PBS) (pH = 7.4) for 6 h; (b) The effect of increasing concentration of gelatin [eight, 10 and 12 w/v% (g/mL)] on the swelling degree (SD) of hydrogel at a constant formulation of 1 w/v% γ-PGA and of 1.3 mg/mL EDC, swelled in PBS (pH = 7.4) for 6 h.
Polymers 06 00039 g002
Conversely, there is an inverse relationship between increasing concentration of gelatin and its SD, as shown in Figure 2b. Hydrogel of 8% gelatin, swelled for six hours, has the highest value of SD, 20.45 ± 0.31, but there is no significant difference in its SD in the entire swelling time. Similarly, the SD of 10% gelatin did not significantly increase from 2 to 6 h of swelling. On the other hand, the SD of 12% gelatin increases significantly by about 6%, from an SD of 15.05 ± 0.04 after 2 h of swelling to 16.01 ± 0.19 for 6 h of swelling.
The chemical crosslinker used is EDC (carbodiimide) is a non-toxic water soluble compound that acts as a catalyst for the formation of the amide bond between the amino groups of lysine and hydroxylysine of gelatin to the carboxylic groups of γ-PGA or to the carboxylic groups of glutamic and aspartic acid of another gelatin strand. EDC is not integrated in the linkage, as it only facilitates the formation of the bond, making it a suitable crosslinker [25].
As shown in Figure 3a, the SD of uncrosslinked hydrogel of a value of 19.28 ± 0.27 has a 13% difference compared to crosslinked hydrogel with 0.75 mg/mL EDC of a value of 17.04 ± 0.67 after 2 h of swelling. This represents the increase of its crosslinking density. Hydrogel with 1.3 mg/mL EDC has the only significant change throughout the swelling time of 2–6 h, in comparison to 0.75 and 2.5 mg/mL EDC and uncrosslinked hydrogel. Thus, the ideal amount of EDC to be used in synthesizing hydrogel is 1.3 mg/mL EDC.
The swelling degree is one of the considerations in deciding the ideal formulation for synthesizing hydrogel; since, as indicated in various studies, SD has a proportional relationship with drug release [29]. In Figure 3b, the plot of SD against the ratio of the concentrations of the two polymers proved that there is an optimal value of γ-PGA for a specific amount of gelatin manifested by different SD properties. Theoretically, during drug release, the swelling of hydrogel will take place first, and then, diffusion of the drug from the hydrogel to the solution will follow. Hence, when controlled release is desired, a low value of SD with only a gradual increase against time is preferable. Hydrogel synthesized with 10 w/v% gelatin and 1 w/v% γ-PGA showed a gradual increase in SD, making it the optimal formulation. Although, the formulation with 12% gelatin and 1% γ-PGA has the lowest SD, its SD value greatly increases with time, which can have a negative result on drug release.
Figure 3. (a) The effect of increasing concentration of EDC (zero, 0.75, 1.3 and 2.5 mg/mL) to the swelling degree (SD) of hydrogel at a constant gelatin concentration of 10 w/v% and γ-PGA of 1 w/v%, swelled in PBS (pH=7.4) for 6 h; (b) The swelling degree of hydrogel with a constant EDC of 1.3 mg/mL in PBS (pH = 7.4) of different ratios of gelatin (eight, 10 and 12 w/v%) over -PGA (0.5, one, two and 4 w/v%) (-○-, 2 h; -□-, 4 h; -∆-, 6 h of swelling).
Polymers 06 00039 g003

3.2. Characterization of Gelatin-γ-PGA-Based Hydrogel

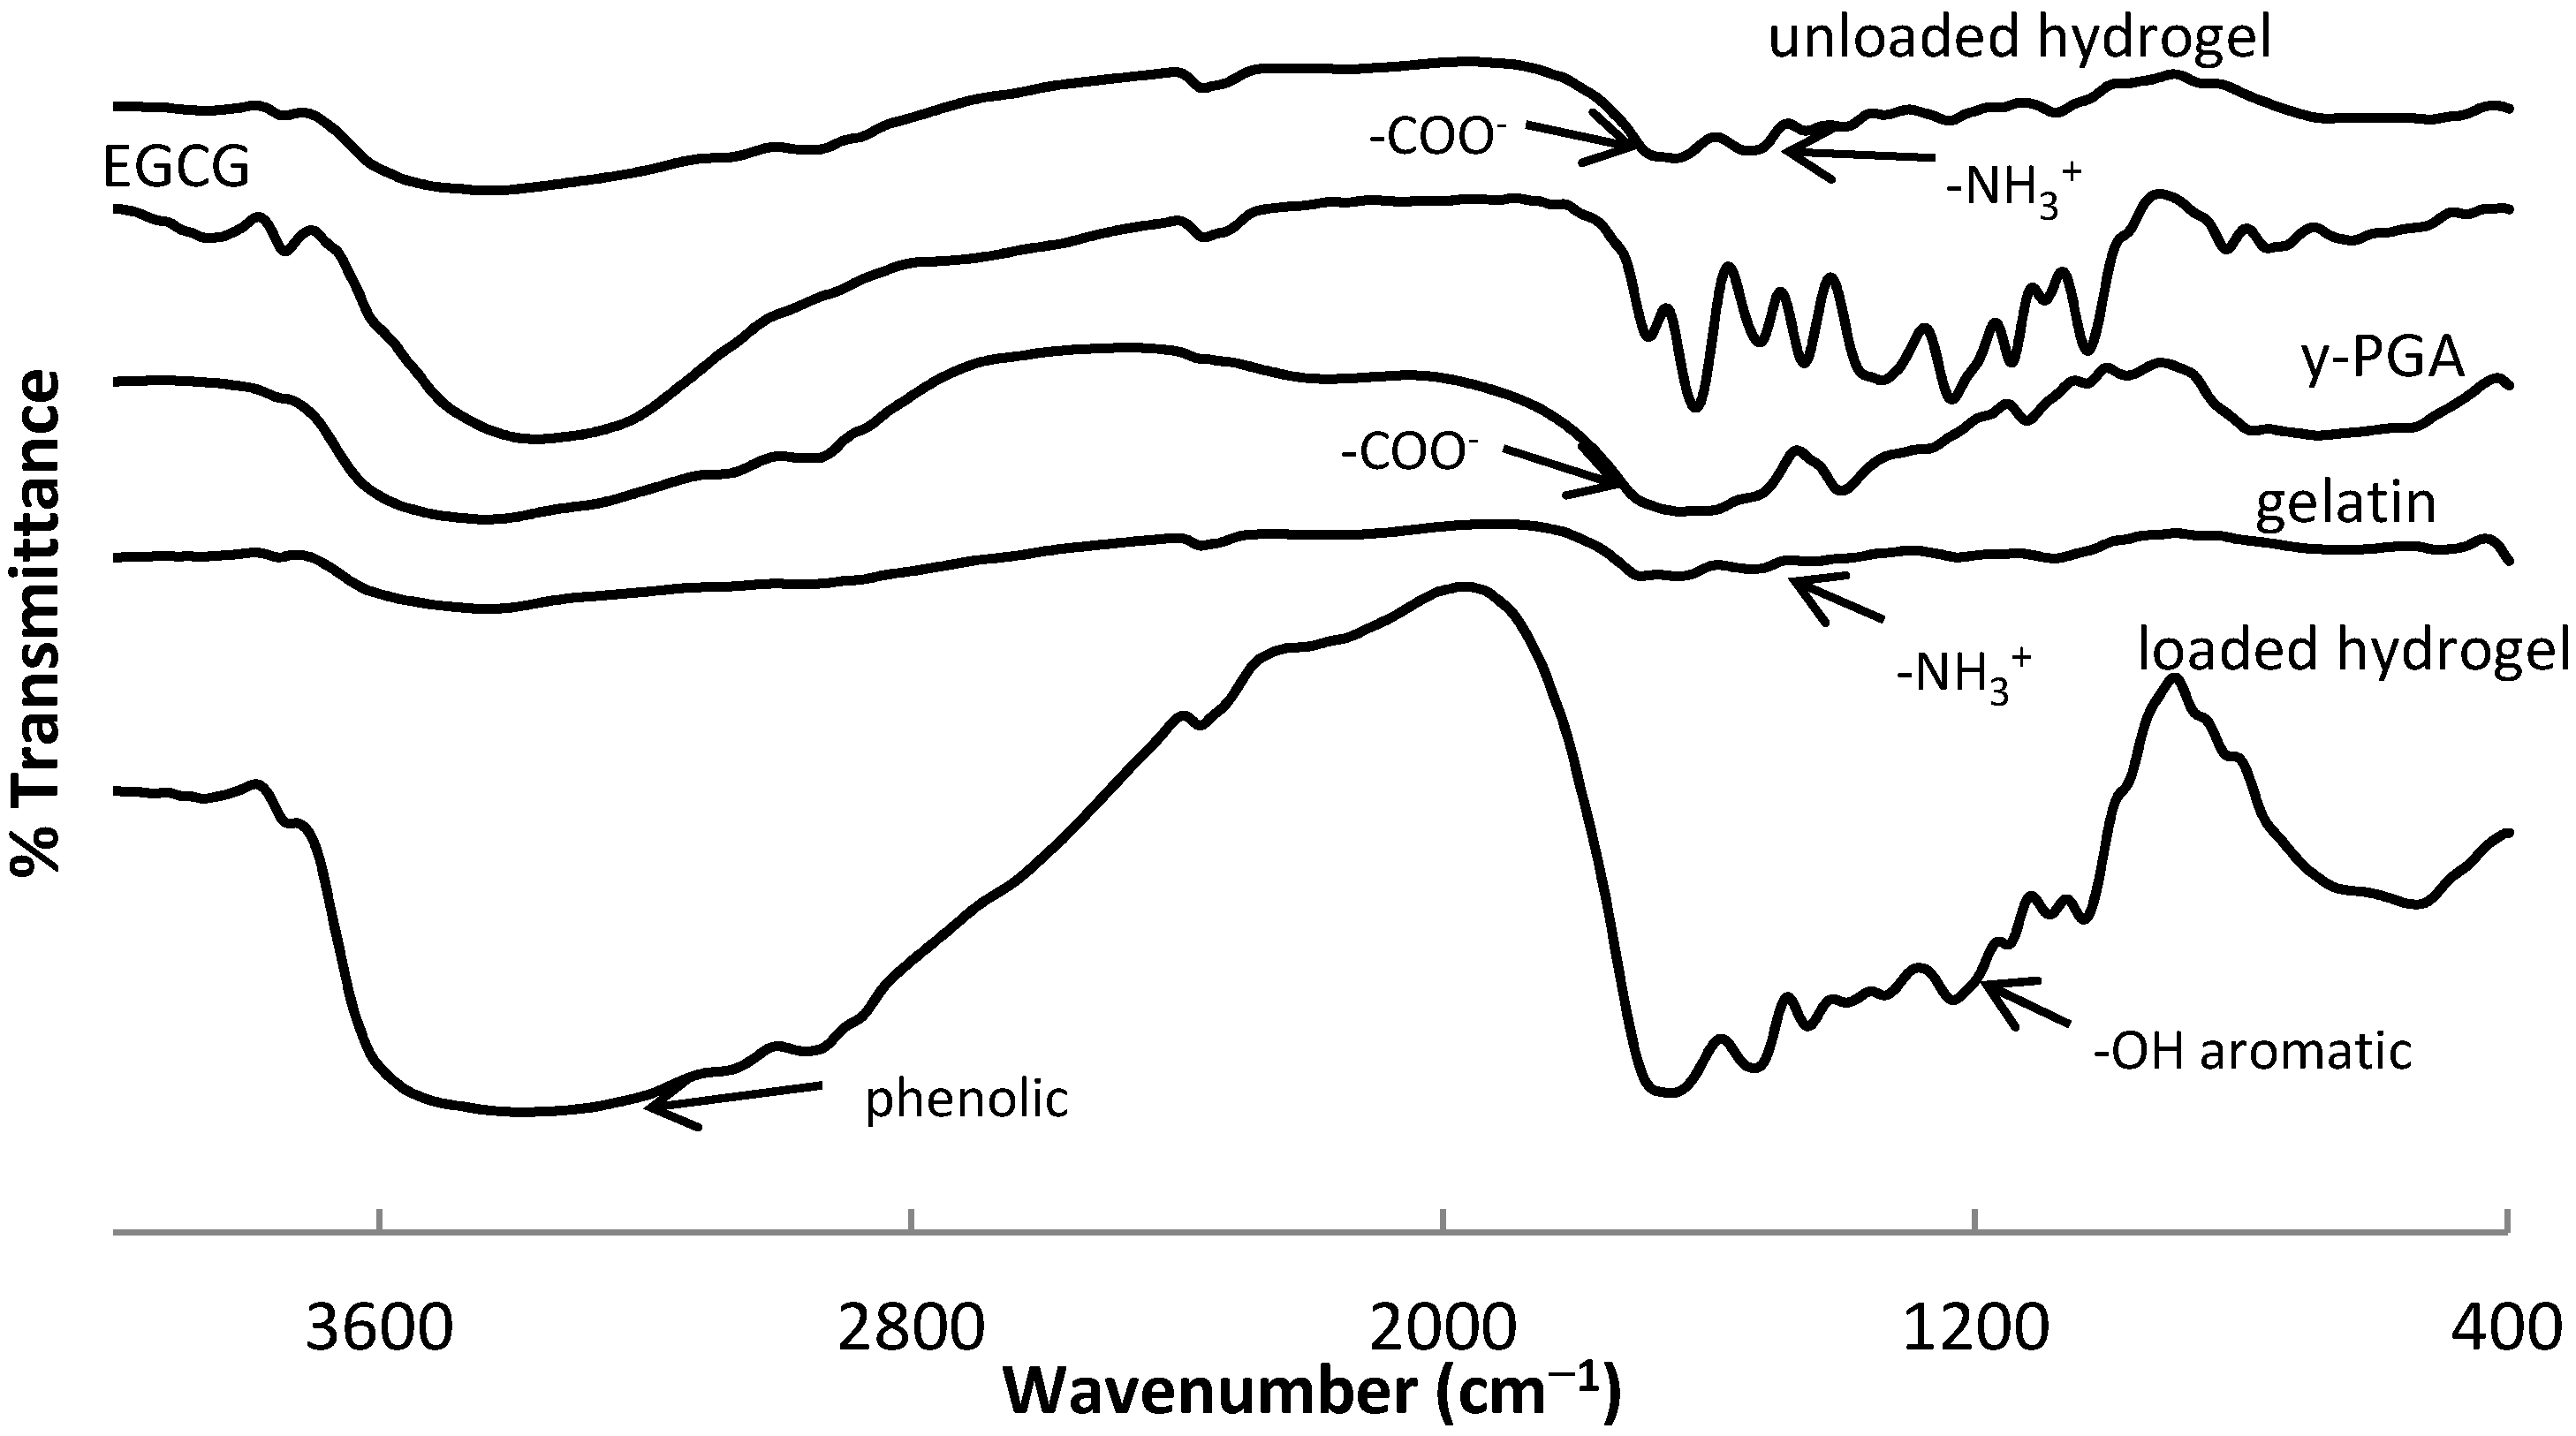
The FT-IR spectra of the two polymers and EGCG are shown in Figure 4. The characteristic peak at 1643 cm−1 in the γ-PGA spectrum represents carboxylic ions (–COO), while in the gelatin spectrum, the observed peak at 1535 cm−1 is for a protonated amino group (–NH3+) or N–H (amide) [30,31]. The characteristic peak assigned to the aliphatic side chain of gelatin is at 2970 cm−1 [32]. Comparing it with the peaks of freeze-dried crosslinked unloaded hydrogel, the 1643 cm−1 peak for γ-PGA shifted to 1650 cm−1, and the peak 1535 cm−1 for gelatin moved to 1542.8 cm−1. This proves the ionic interaction between the negatively charged carboxylic group (–COO) of γ-PGA and the positively charged amino group (–NH3+) of gelatin, forming the insoluble hydrogel. As studied previously, a shift at peaks of interacting groups of different polymers indicates the formed hydrogen bond or other types of bonds between the chemical or functional groups [33].
The characteristic bands in the FT-IR spectrum of extracted EGCG (65% purity) at 822, 1030, 1146, 1234, 1342, 1458, 1523 and 1620 cm−1 indicate the presence of C–H alkenes, –C–O alcohols, C–OH alcohols, –OH aromatic, C–O alcohols, C-H alkanes, C=C aromatic ring and C=C alkenes, respectively. At a wavenumber higher than 3200 cm−1, such as the characteristic band with a peak at 3363 corresponds to O-H linkage of phenolic and hydroxyl groups [34]. The characteristic band of EGCG at 1,234 cm−1 indicates that the -OH aromatic is retained in the spectrum of EGCG-loaded hydrogel. The 1030 cm−1 band for EGCG shifted to 1038 cm−1, from 1146 to 1153 cm−1 and from 1342 to 1338 cm−1, respectively, after loading it in the hydrogel. The peaks of unloaded hydrogel at 1080, 1454, 1543 and 1651 cm−1 shifted to 1088, 1450, 1531 and 1655 cm−1, respectively. These peak shifts only suggest that EGCG is effectively loaded to the hydrogel. Furthermore, the characteristic peak of EGCG at 3363 shifted to a broad peak at 3390 cm−1, indicating the interaction of EGCG with gelatin and γ-PGA when loaded.
Figure 4. FT-IR spectra of extracted epigallocatechin gallate (EGCG) (65% purity), type-A gelatin, γ-PGA, freeze-dried, unloaded hydrogel (10%-gelatin, 1%-γ-PGA and 1.3 mg/mL EDC) and EGCG-loaded hydrogel of the same formulation as that of the unloaded one. Peaks in the gelatin spectrum are not clearly shown, as its percentage of transmittance is relatively small.
Polymers 06 00039 g004
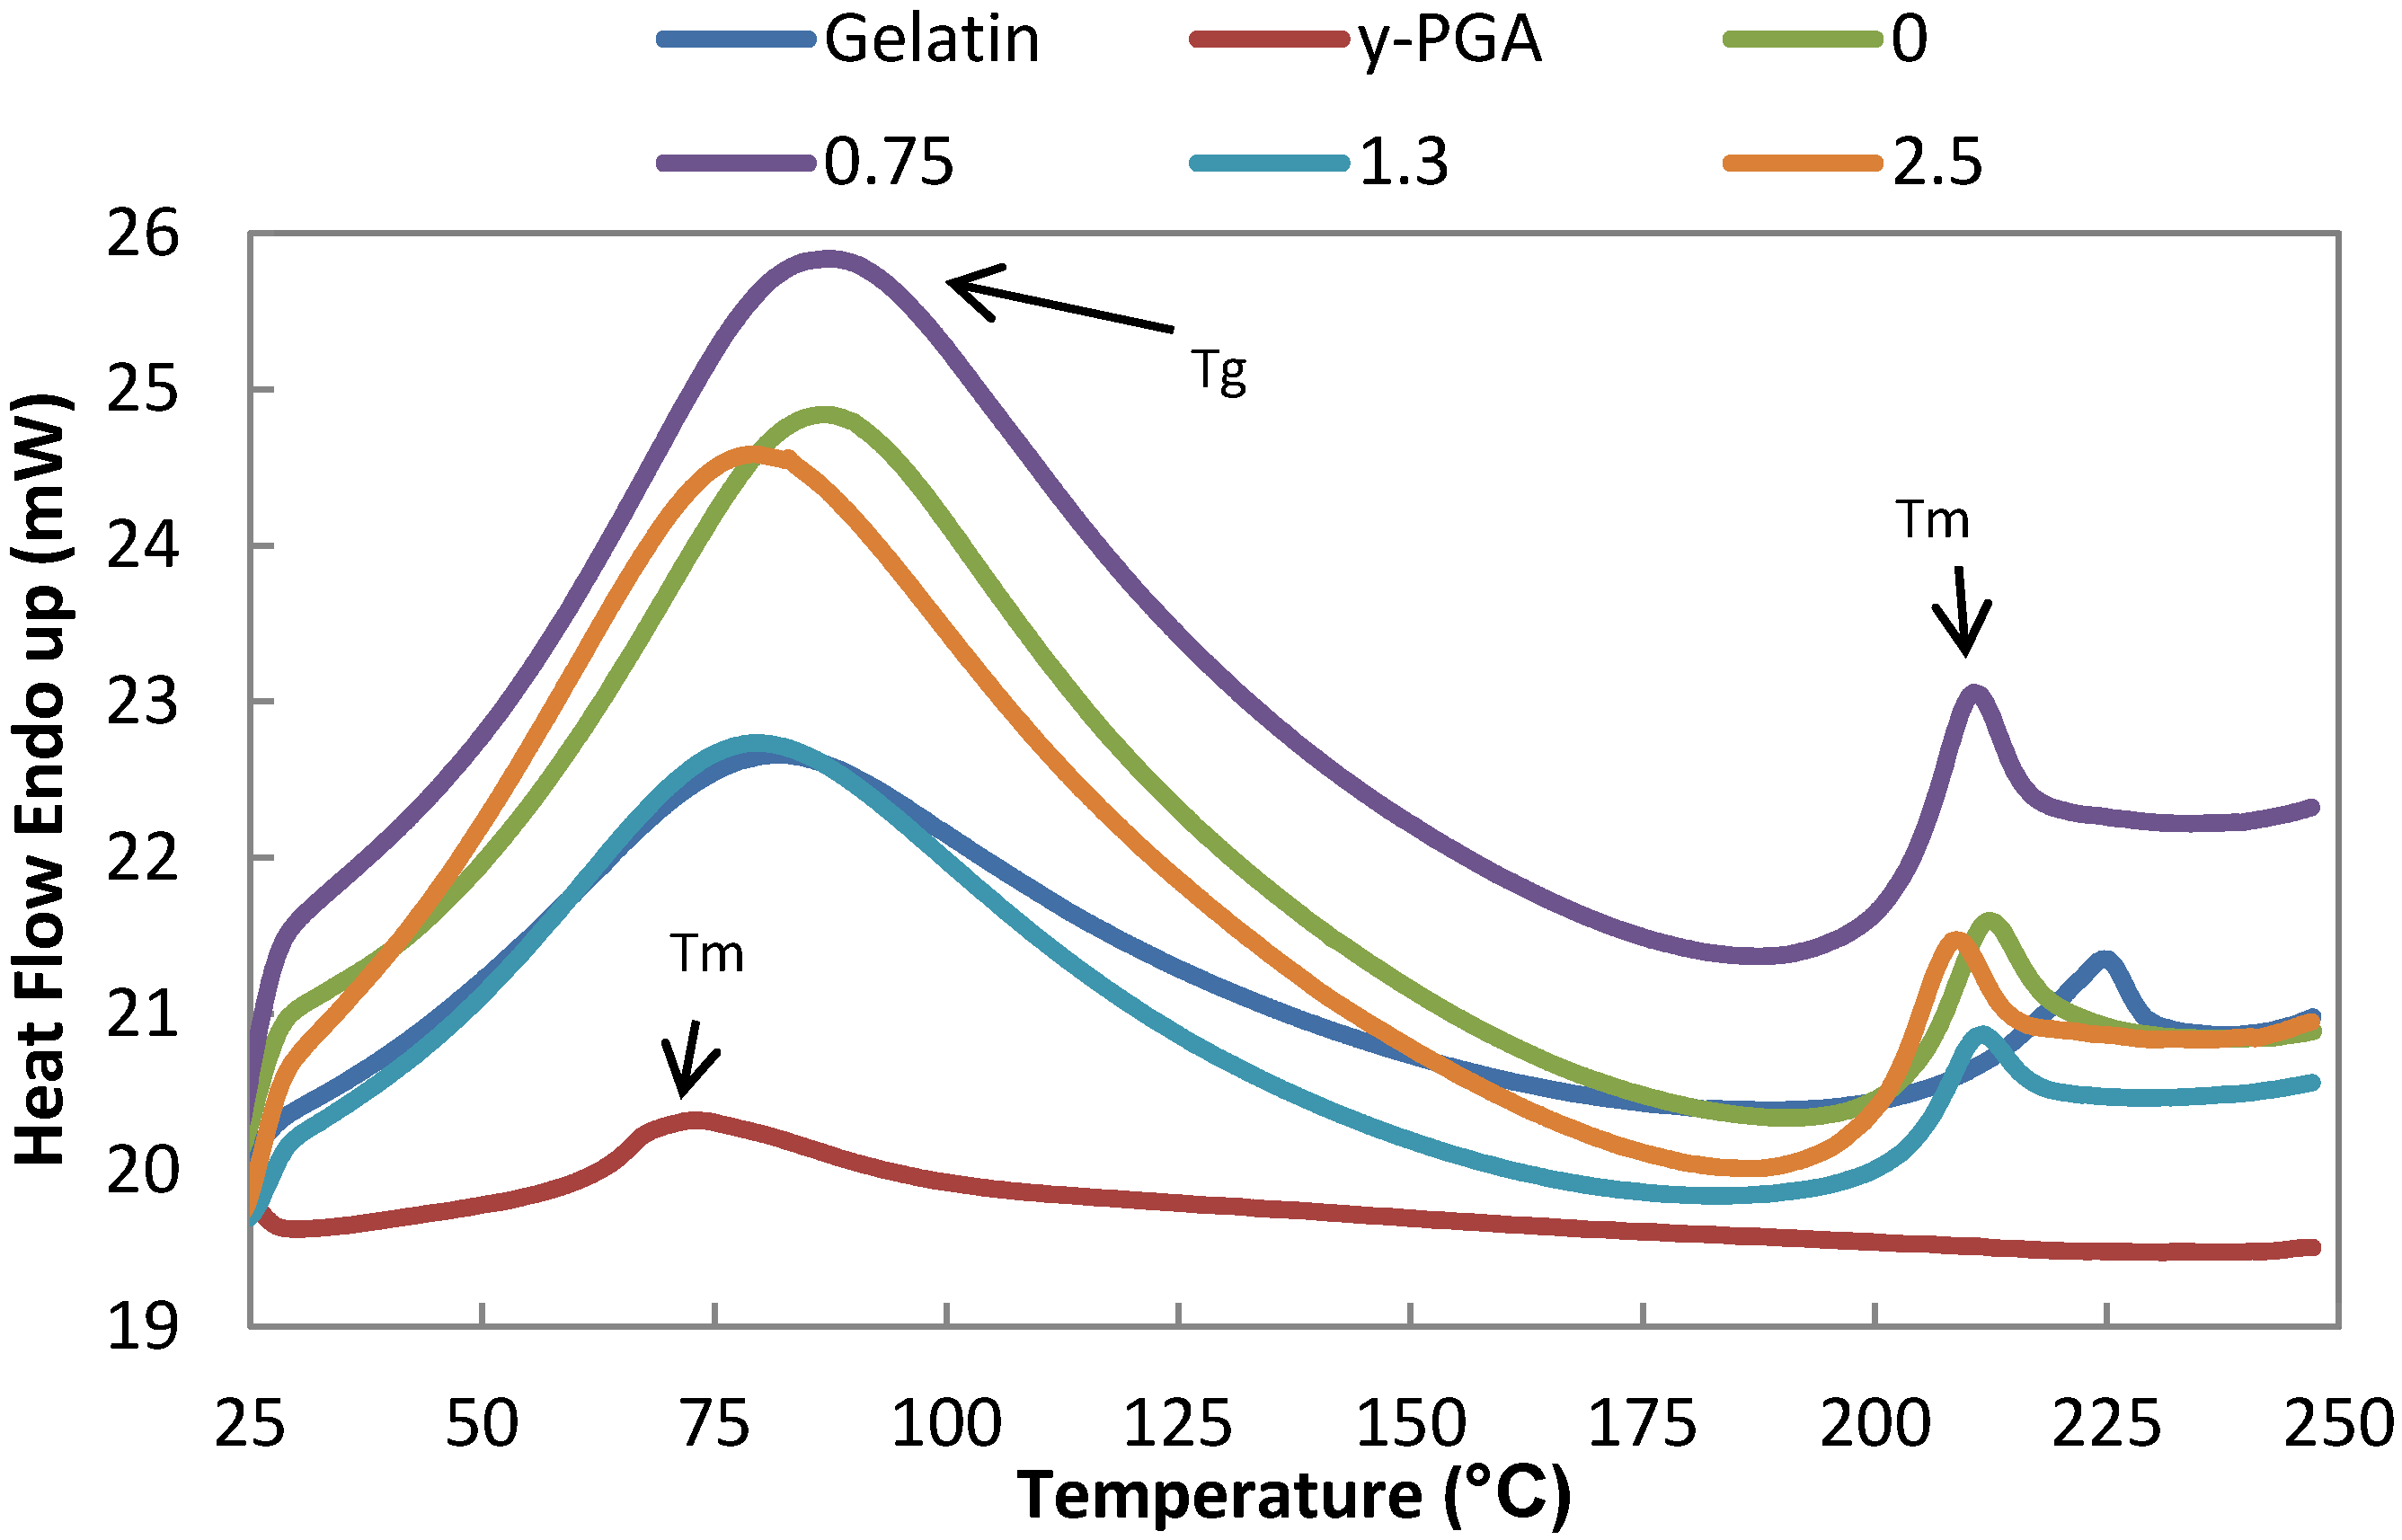
Thermal stability of hydrogels, as well as miscibility between gelatin and γ-PGA are studied using DSC. Thermograms are presented in Figure 5, where the effect of the crosslinker on the thermal properties of the hydrogel is also determined.
Figure 5. Thermogram of gelatin, γ-PGA, uncrosslinked (no EDC) and crosslinked hydrogels using 0.75, 1.3 and 2.5 mg/mL EDC at a heating rate of 10 °C/min. Tm, melting point; Tg, glass transition temperature.
Polymers 06 00039 g005
The thermogram of γ-PGA only shows one peak at approximately 73 °C, which is associated with its melting point, Tm. The thermal properties of hydrogel are affected by water content, and since hydrogel is hygroscopic, preparation upon DSC analysis can alter its water content and change its thermal property in comparison to what is usually reported in the literature [35]. In the gelatin thermogram, a broad peak at 82 °C and a relatively small peak at 225 °C correspond to its glass transition temperature, Tg, and Tm, respectively [36]. The uncrosslinked hydrogel thermogram shows a peak at 87 °C, relatively different from the Tg and Tm of gelatin and γ-PGA. Another peak is observed at 212 °C, which is lower than the Tm of gelatin. The shifts in the endothermic peaks of hydrogel in comparison to the peaks of its polymers suggested the interaction and miscibility of gelatin and γ-PGA having new distinct thermal properties. Crosslinking the hydrogel with 0.75 mg/mL EDC did not change the thermal properties of the hydrogel significantly with its Tg of 87 °C and Tm of 211 °C. However, by using 1.3 mg/mL EDC, there is a change in its Tg, having a new peak at 80 °C, but the same Tm of 212 °C. Lastly, at the highest concentration of EDC at 2.5 mg/mL, the Tg is at 80 °C and the Tm changes to 209 °C.
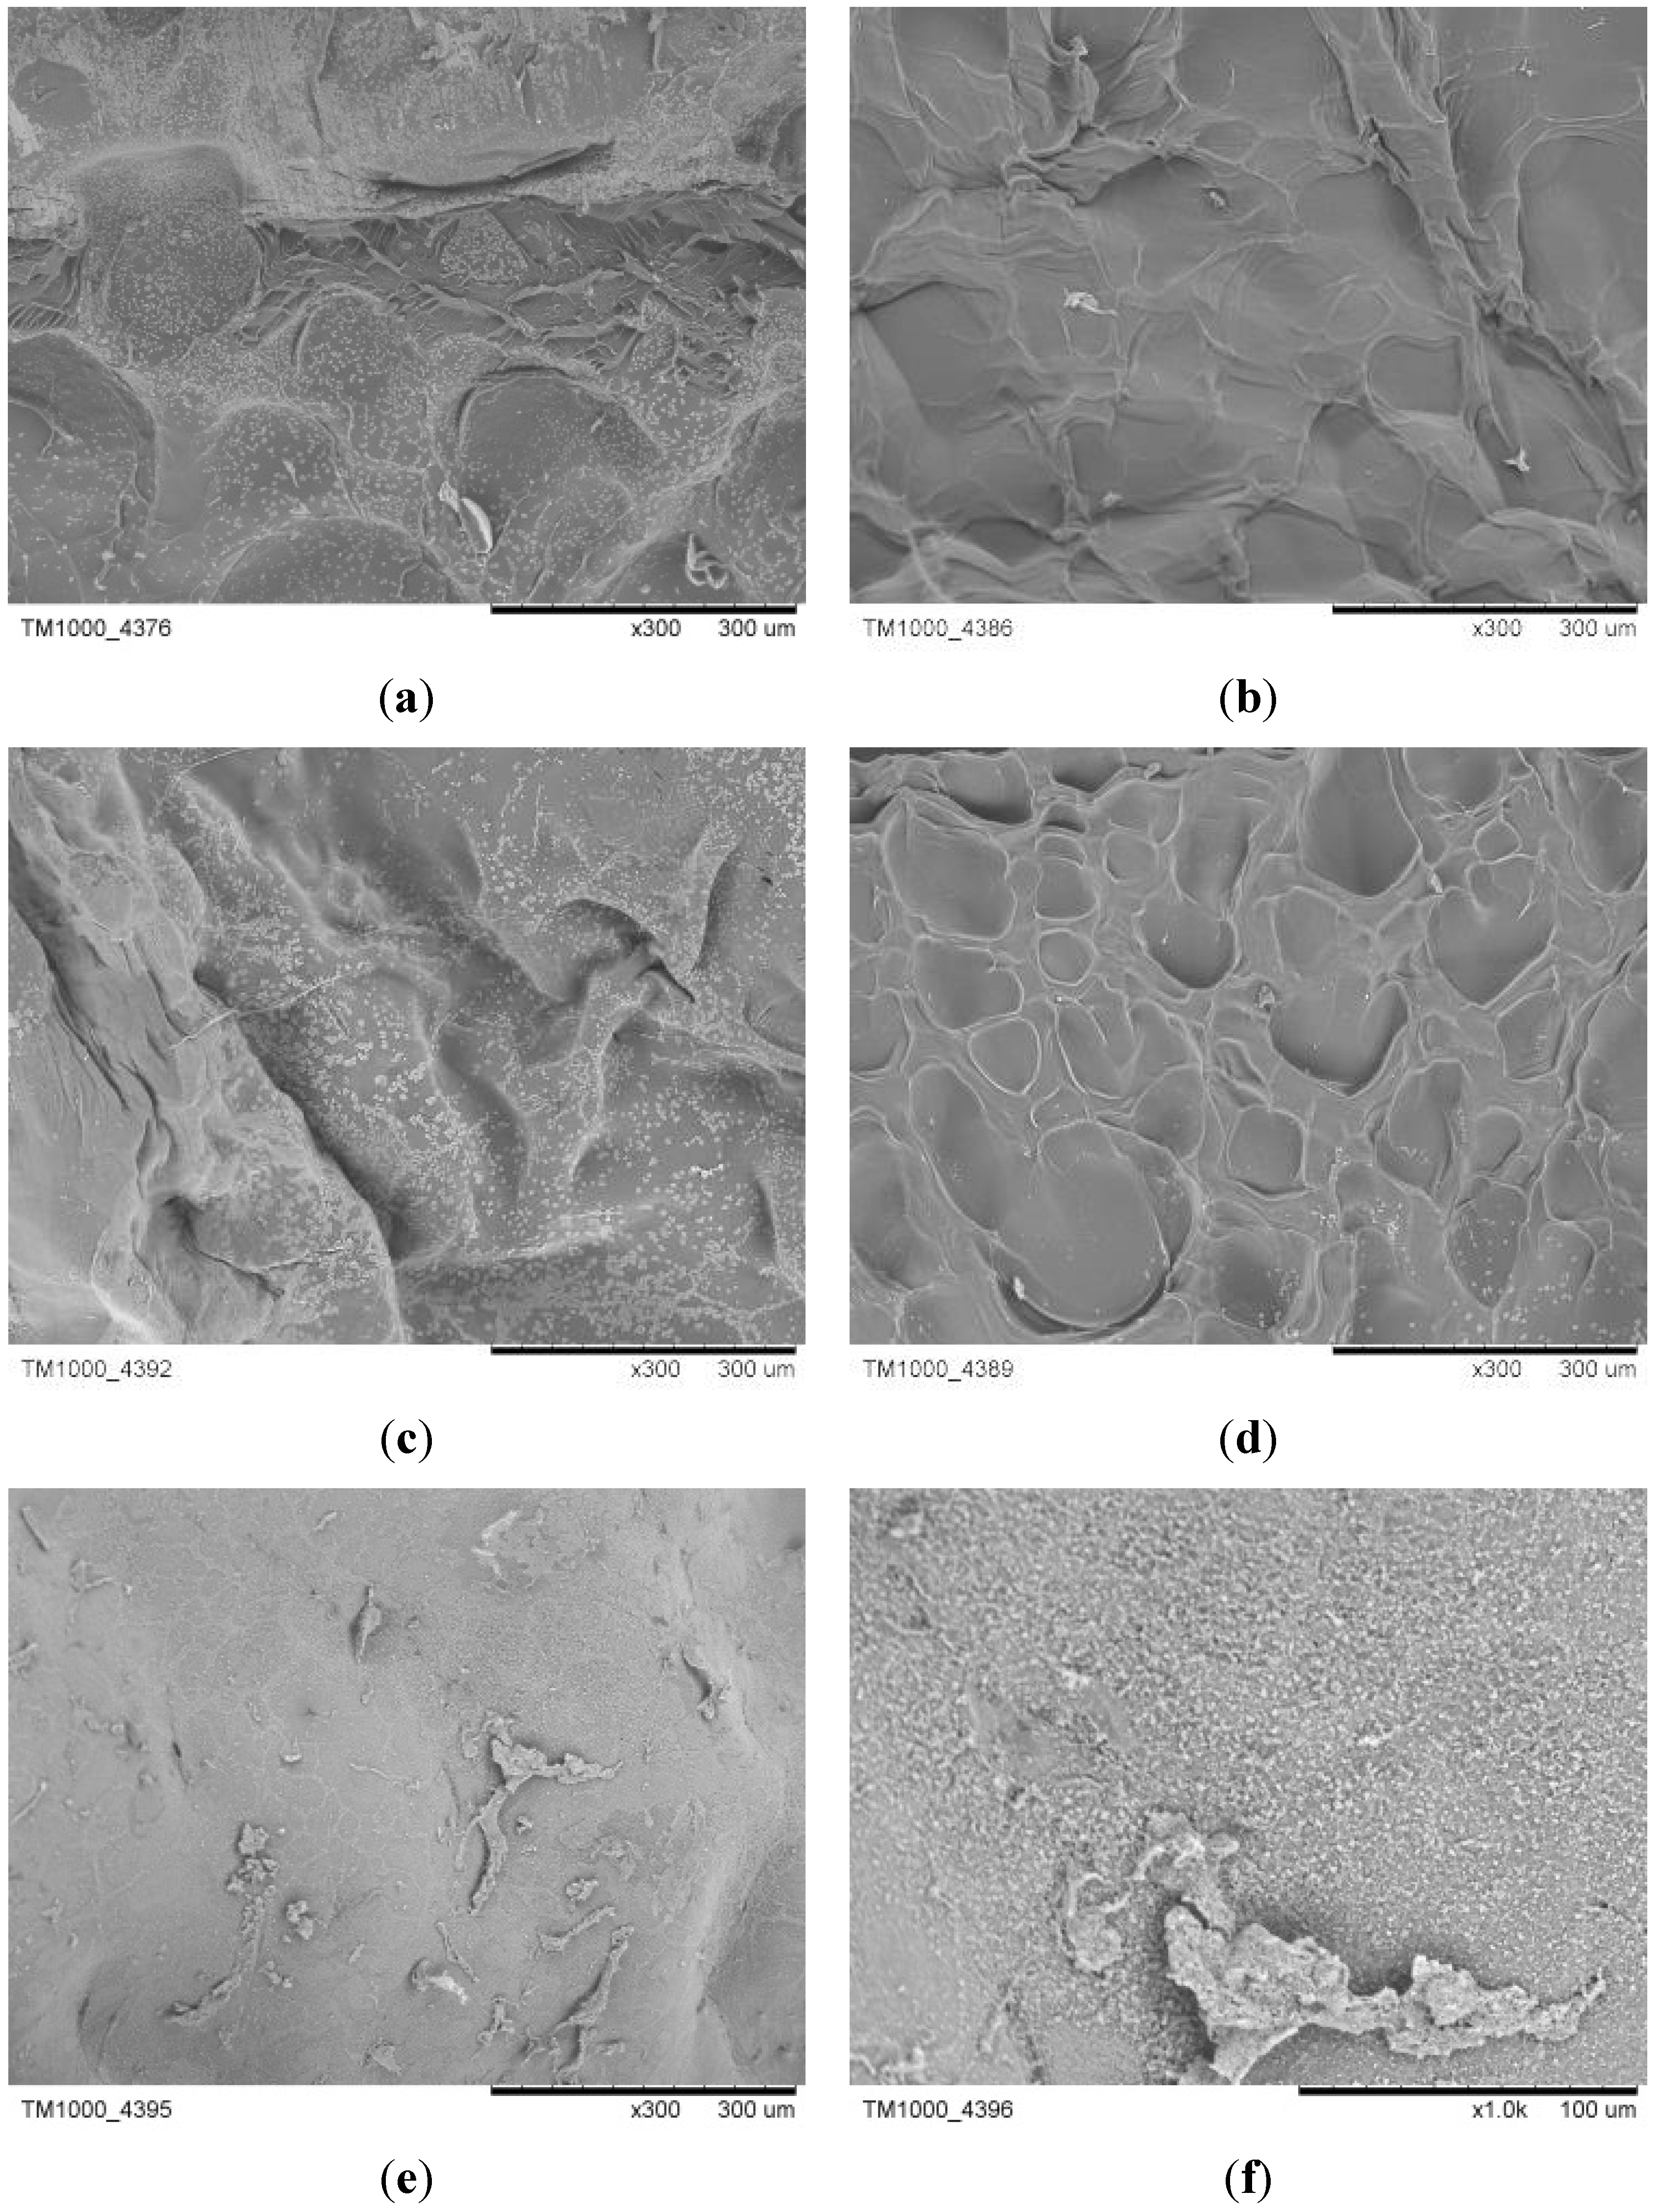
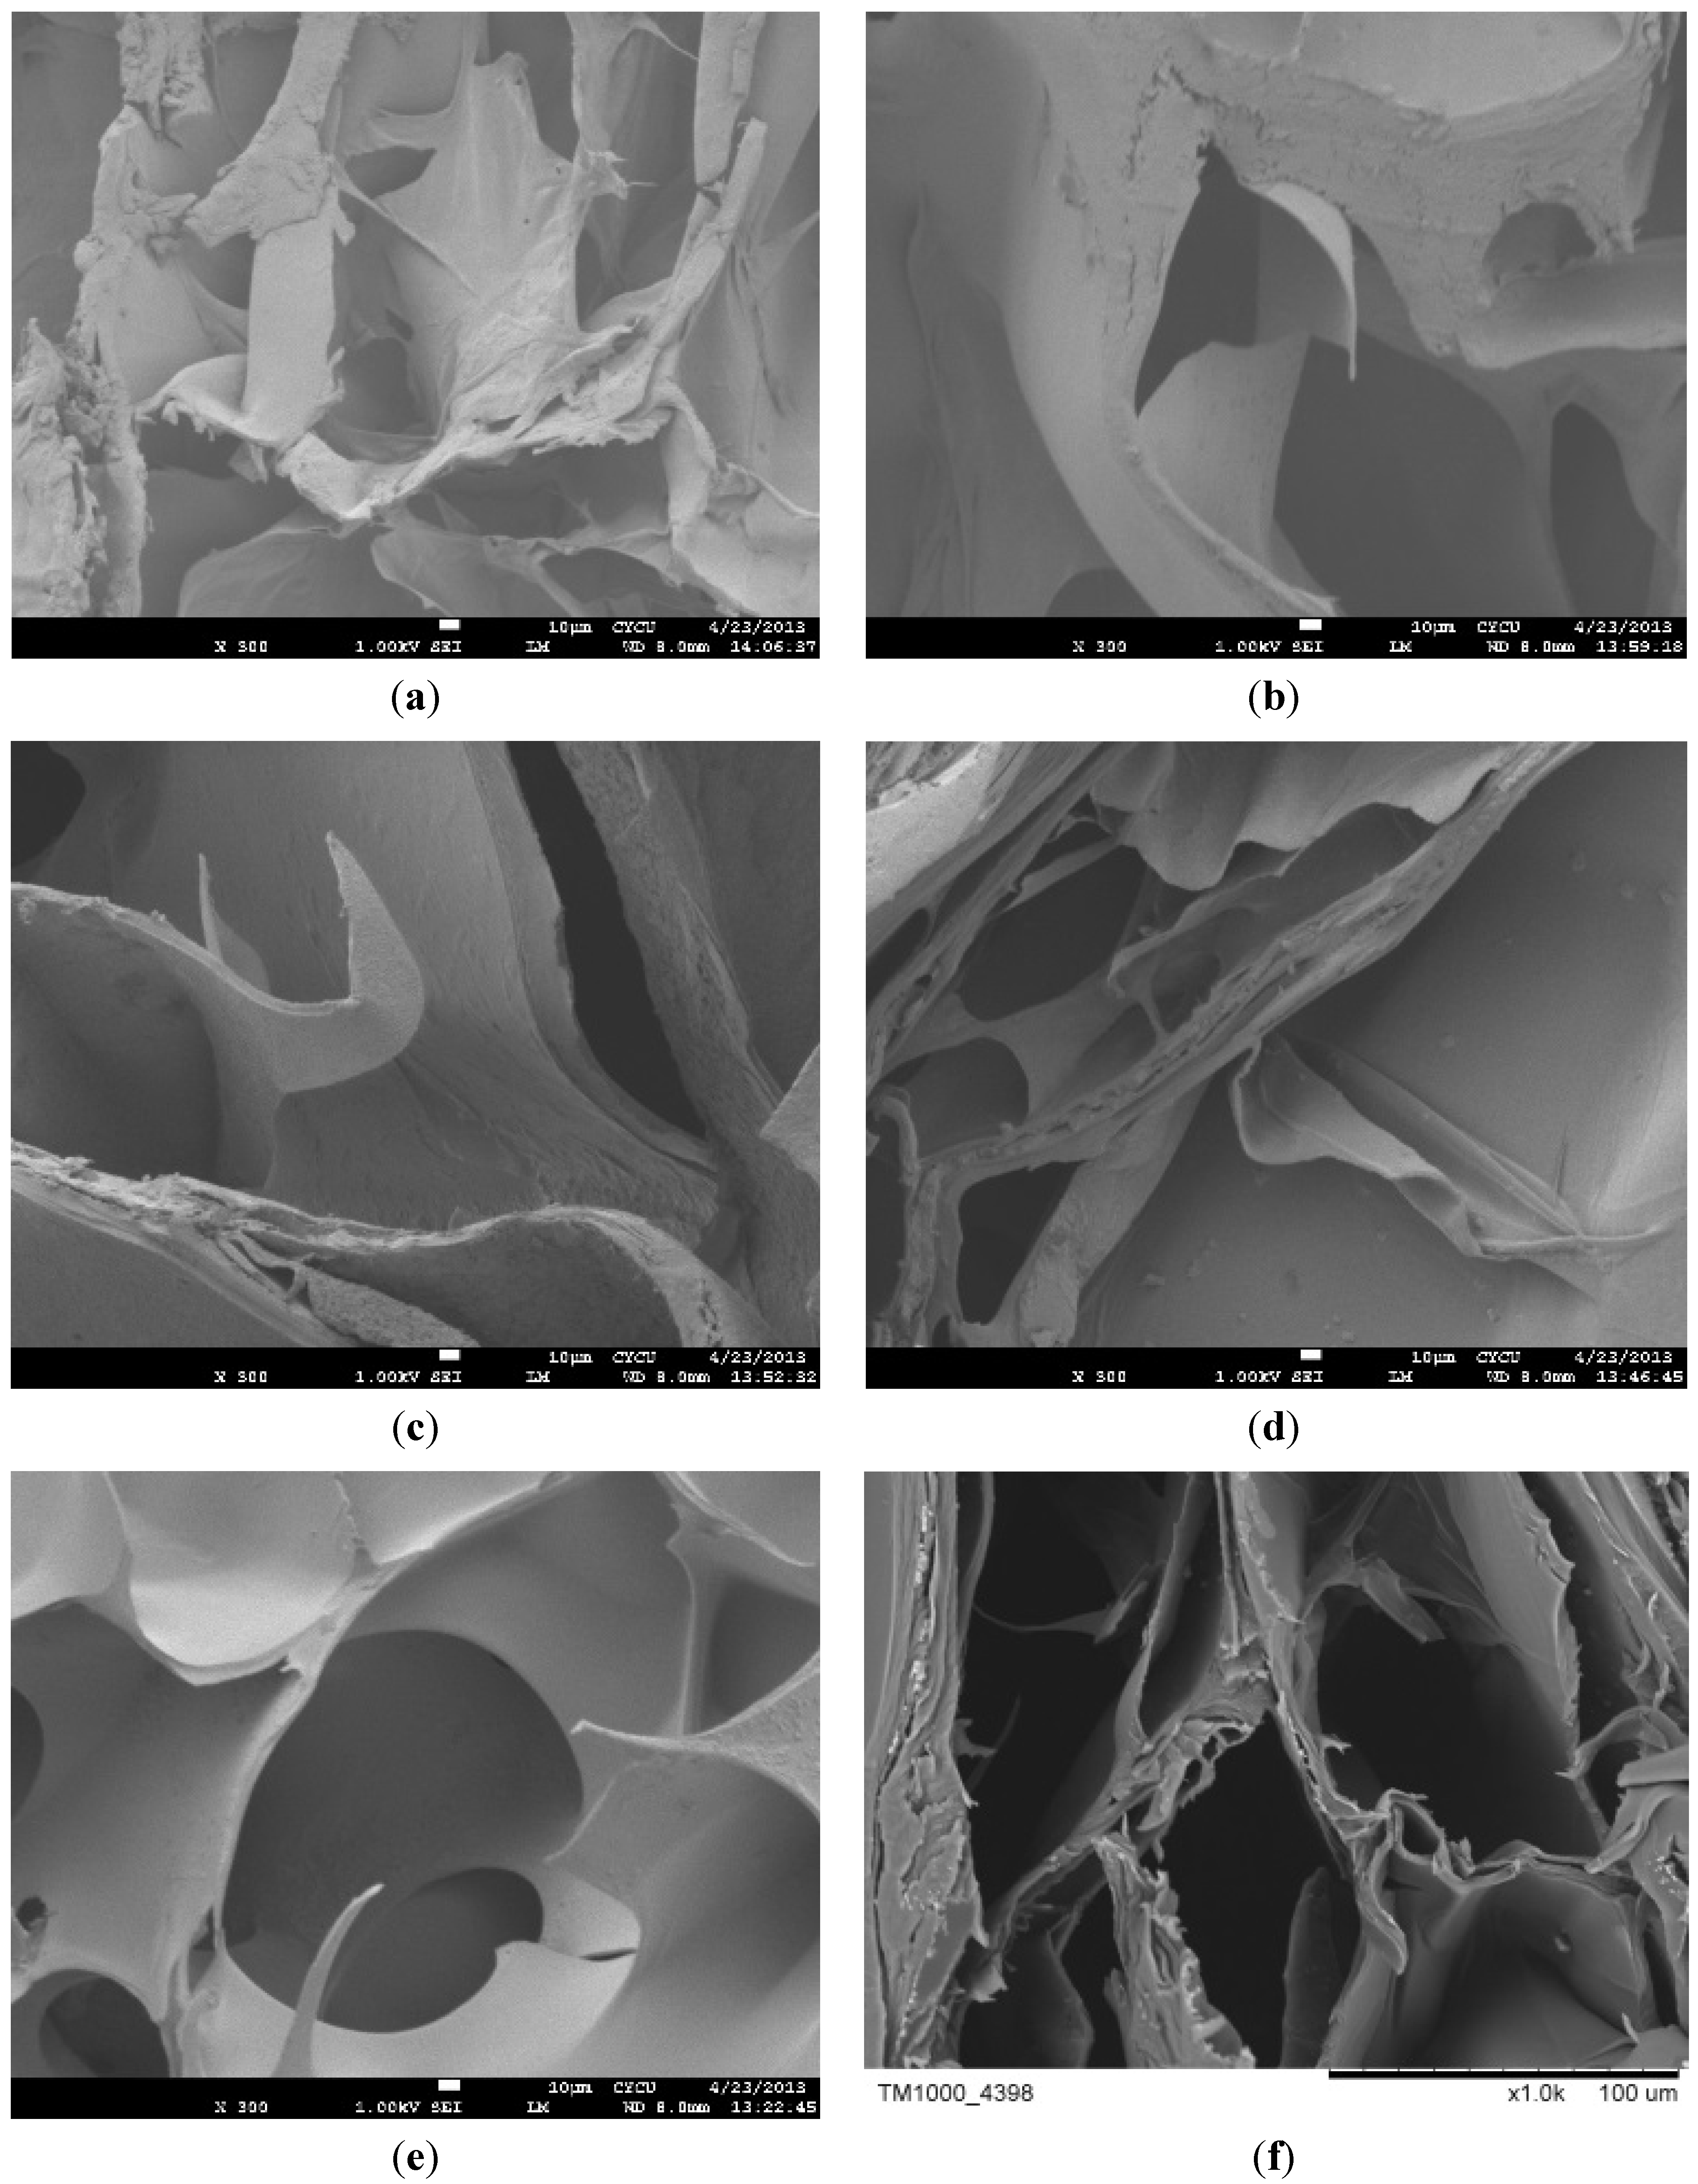
The surface morphology and polymer networks of hydrogels are studied using SEM, as shown in Figure 6 for the surface and Figure 7 for the cross-section. Crosslinking of hydrogel did not change the surface of the freeze-dried hydrogel, as shown in Figure 6b–d, compared to Figure 6a. This result is consistent with having a rough wrinkled surface, but without any holes. In the network of hydrogel inside, there is a change, due to crosslinking, as illustrated by Figure 7a, compared to Figure 7b–d. As the crosslinking concentration increases, the network becomes more organized, and the pores become smaller. The void spaces are the result of the freeze-drying of the synthesized hydrogel. These structures suggest that the mechanism during swelling is for the solvent to diffuse first into the surface layer before the void spaces between networks of hydrogel are filled up.
After loading of EGCG and a second freeze-drying, the surface of the hydrogel becomes smooth (Figure 6e,f) and the network becomes more systematic (Figure 7e), with a pore size of approximately 50 μm (Figure 7f).
Figure 6. Scanning electron micrograph of the surface of freeze-dried hydrogel at 300× for (ae) and 1000× for (f): (a) uncrosslinked; (b) with 0.75 mg/mL EDC; (c) with 1.3 mg/mL EDC; (d) with 2.5 mg/mL EDC; (e,f) EGCG-loaded hydrogel.
Polymers 06 00039 g006
Figure 7. Scanning electron micrograph of the cross-section of freeze-dried hydrogel at 300× for (ae) and 1000× for (f): (a) uncrosslinked; (b) with 0.75 mg/mL EDC; (c) with 1.3 mg/mL EDC; (d) with 2.5 mg/mL EDC; (e,f) EGCG-loaded hydrogel. The scale bar = 10 μm.
Polymers 06 00039 g007

3.3. pH-Responsiveness of Hydrogel

Hydrogels composed of polymers with ionic groups or dependent on ionic interaction between polymers respond to external pH. As the ionic group is either protonated or deprotonated, depending on its nature and pKa, the SD of the hydrogel significantly changes with pH [37,38].
The pH responsiveness of gelatin-γ-PGA-based hydrogel was determined with a phosphate buffer solution of pH = 4.5 and 9.0, since these values approach the pKa and IEP of glutamic acid and gelatin (high boom), respectively [17,25]. The pH values of 6.8 and 7.4 were also chosen, because these were used in in vitro release studies.
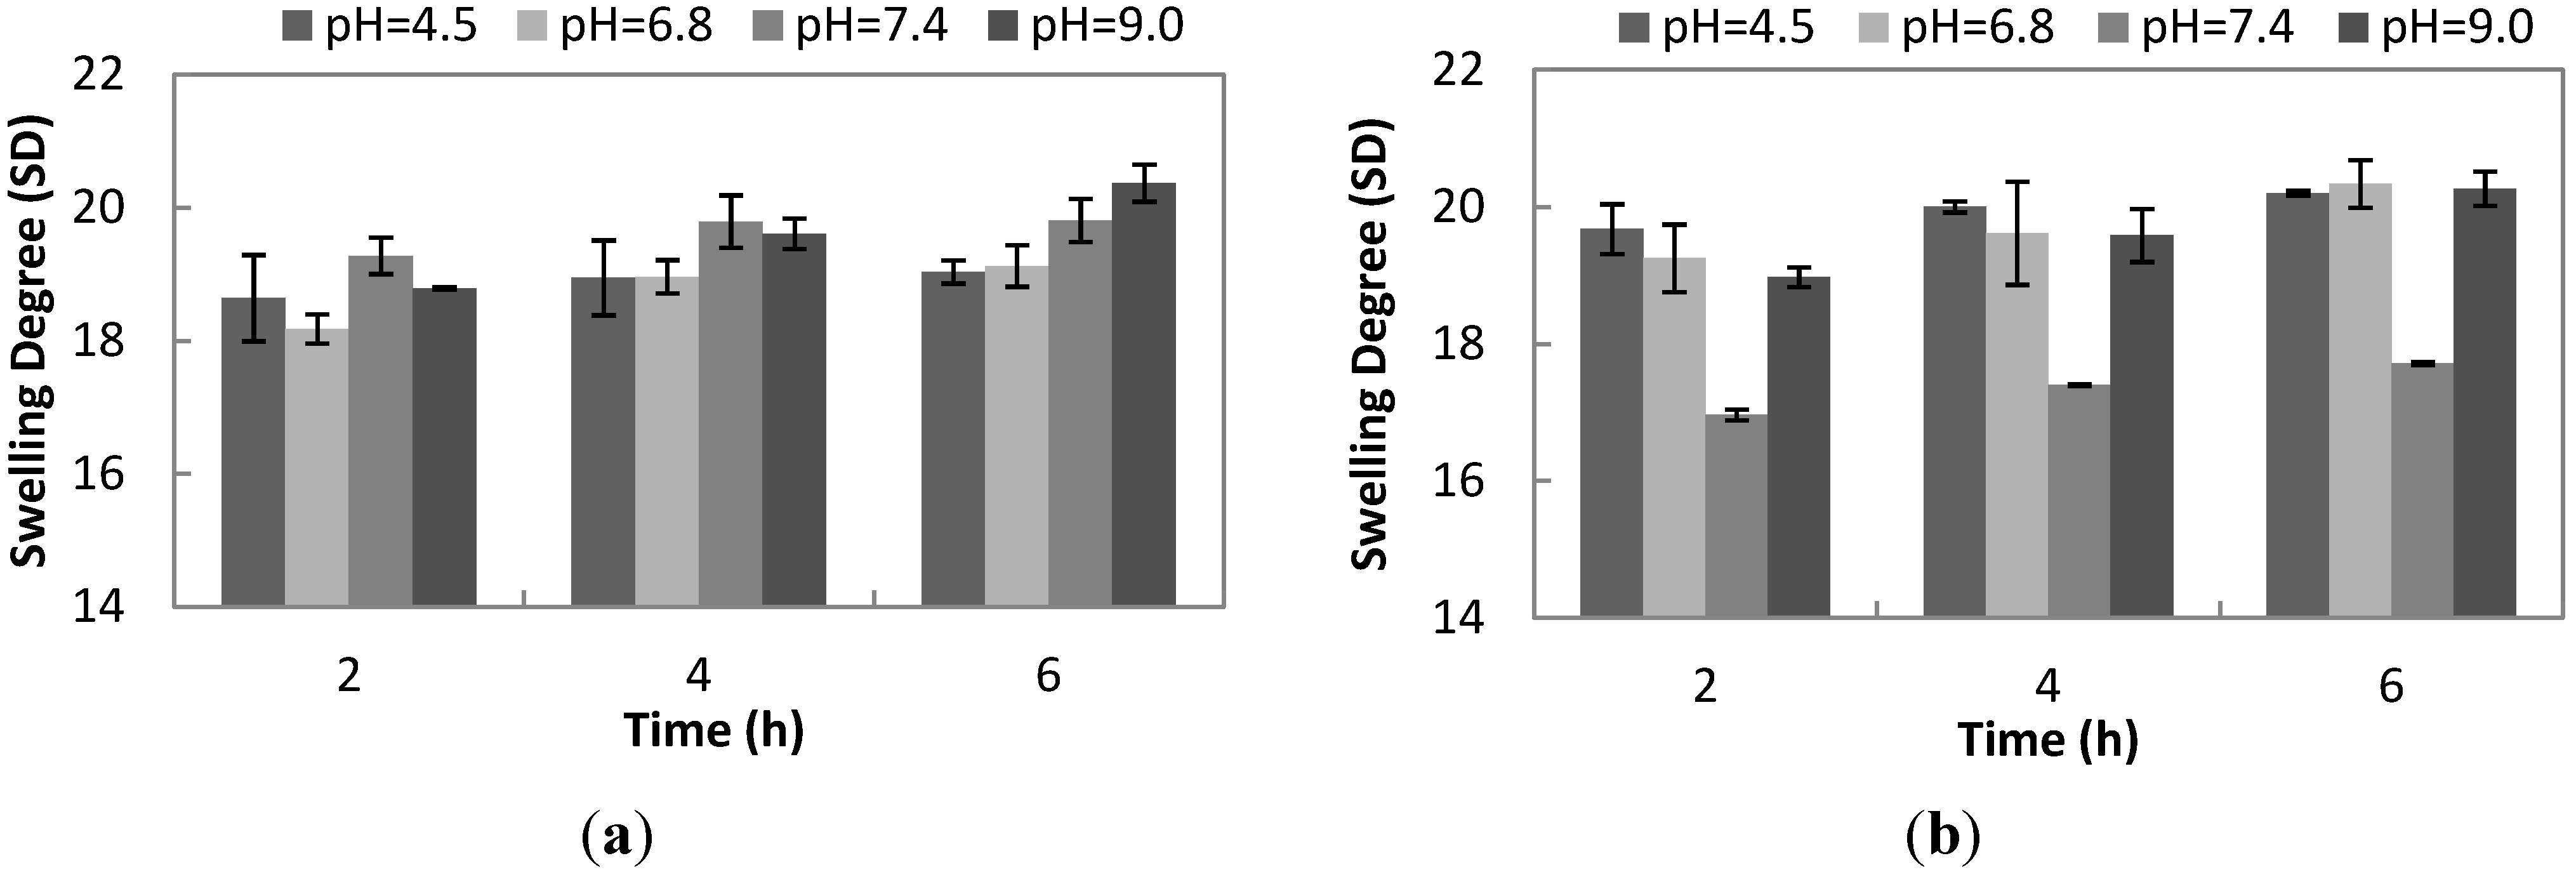
The SD at different pH values of uncrosslinked hydrogel (Figure 8a) is not statistically different from 2 h up to 4 h of swelling time. However, in the sixth hour of swelling, the SD at pH 9.0 is significantly different from the SD at pH 4.5 and pH 6.8. In other words, uncrosslinked hydrogel is more sensitive to higher pH approaching the pKa of gelatin. Hence, some of the positively charged amino groups of gelatin are being deprotonated. As a result, repulsion among a negatively charged carboxylic group of γ-PGA and gelatin occurs, increasing the SD, as has also been reported in other studies using γ-PGA [15]. In comparison to pH 4.5, there is still an interaction, not in terms of gelatin and γ-PGA, but between carboxylic group of gelatin and an amino group of another gelatin strand, as evidenced by the near constant value of the SD at pH 4.5 throughout 6 h of swelling.
Figure 8b clearly shows that the SD at pH 7.4 is statistically different from the SD at pH 4.5, 6.8 and 9.0. The properties of crosslinked hydrogel differ from uncrosslinked hydrogel, because of the presence of an amide bond formed (Figure 1). Meanwhile, the hydrogen bond is present in the hydrogel, regardless of whether using a crosslinker. At neutral pH 7.4, the amide bond, as well as the hydrogen bond are strong, making a compact and tight structure. Thus, significant movement of the network upon the absorption of water is not allowed. This results in a lower SD with a value of only 17.72 ± 0.02 after 6 h of swelling. Therefore, the presence of an amide bond has a big impact on the SD of crosslinked hydrogel at different pH values.
Figure 8. (a) Swelling kinetics of uncrosslinked hydrogel (10 w/v% gelatin and 1 w/v% γ-PGA) at different pH values for two, four and 6 h. (b) Swelling kinetics of optimized formulation of crosslinked hydrogel (10 w/v% gelatin, 1 w/v% γ-PGA and 1.3 mg/mL EDC) at different pH values for two, four and 6 h.
Polymers 06 00039 g008

3.4. Loading and In Vitro Release Kinetics Study

EGCG was loaded into hydrogel by the post-loading method, since in situ loading is not possible, as EGCG is sensitive to oxidation. Then, freeze-drying is used to remove the solvent absorbed during loading. The optimized loading time is determined to be 12 h. A loading time longer than 12 h will not result in a significant increase in the loading efficiency, but will only expose the EGCG to further degradation and oxidation.
As the crosslinking concentration increases, the hydrogel loading efficiency decreases, as shown in Table 1. This inverse relationship is related to its decreasing SD as EDC concentration increases (Figure 3a); whereas the percent difference between the SD of hydrogel with 0.75 and 1.3 mg/mL EDC at 6 h of swelling is 1.21%, similar to the percent difference in their loading efficiency of 1.97%, also the percent difference between the SD at 1.3 and 2.5 mg/mL EDC of 7.55% is similar to the difference in their loading efficiency of 7.16%. This suggests that the loading efficiency of hydrogel is dependent on its SD. It can be interpreted that the diffusion of EGCG into the hydrogel with 2.5 mg/mL EDC is limited, due to a low SD. The mechanism of loading EGCG is comprised of the swelling of hydrogel, followed by the diffusion of EGCG into the surface, up to the networks of the hydrogel inside. Then, during freeze-drying, only absorbed water is removed from the hydrogel. Consequently, the difference between the loading efficiency of hydrogel with 0.75 and 1.3 mg/mL EDC is relatively small compared to 2.5 mg/mL. Although, 2.5 mg/mL posted the lowest SD, which is the ideal property to retard the release of drug, it has also the lowest loading efficiency. The optimal EDC concentration is 1.3 mg/mL in terms of loading efficiency and similar when the basis is in terms of swelling degree (Figure 3a).
Table 1. The effect of the crosslinker on the loading efficiency of hydrogel
Gelatin concentration (w/v%)γ-PGA concentration (w/v%)EDC concentration (mg/mL)Loading efficiency (%)
1010.7568.71 ± 1.47
1.367.37 ± 0.43
2.562.72 ± 2.13
The in vitro release kinetics of EGCG from hydrogel was studied at a temperature of 37 °C using HCl solution at pH 1.2 and PBS (0.15 M) at pH 6.8 and 7.4. The pH of GIT changes and is always varying, but these three pH values have been used in many studies conducting preliminary and in vitro release tests to mimic the pH conditions of the GIT. A solution at pH 1.2 represents gastric fluid in the stomach, while buffer solutions at pH 6.8 and pH 7.4 simulate the jejunal region of small intestine and the ileum segment, respectively [20,23,39].
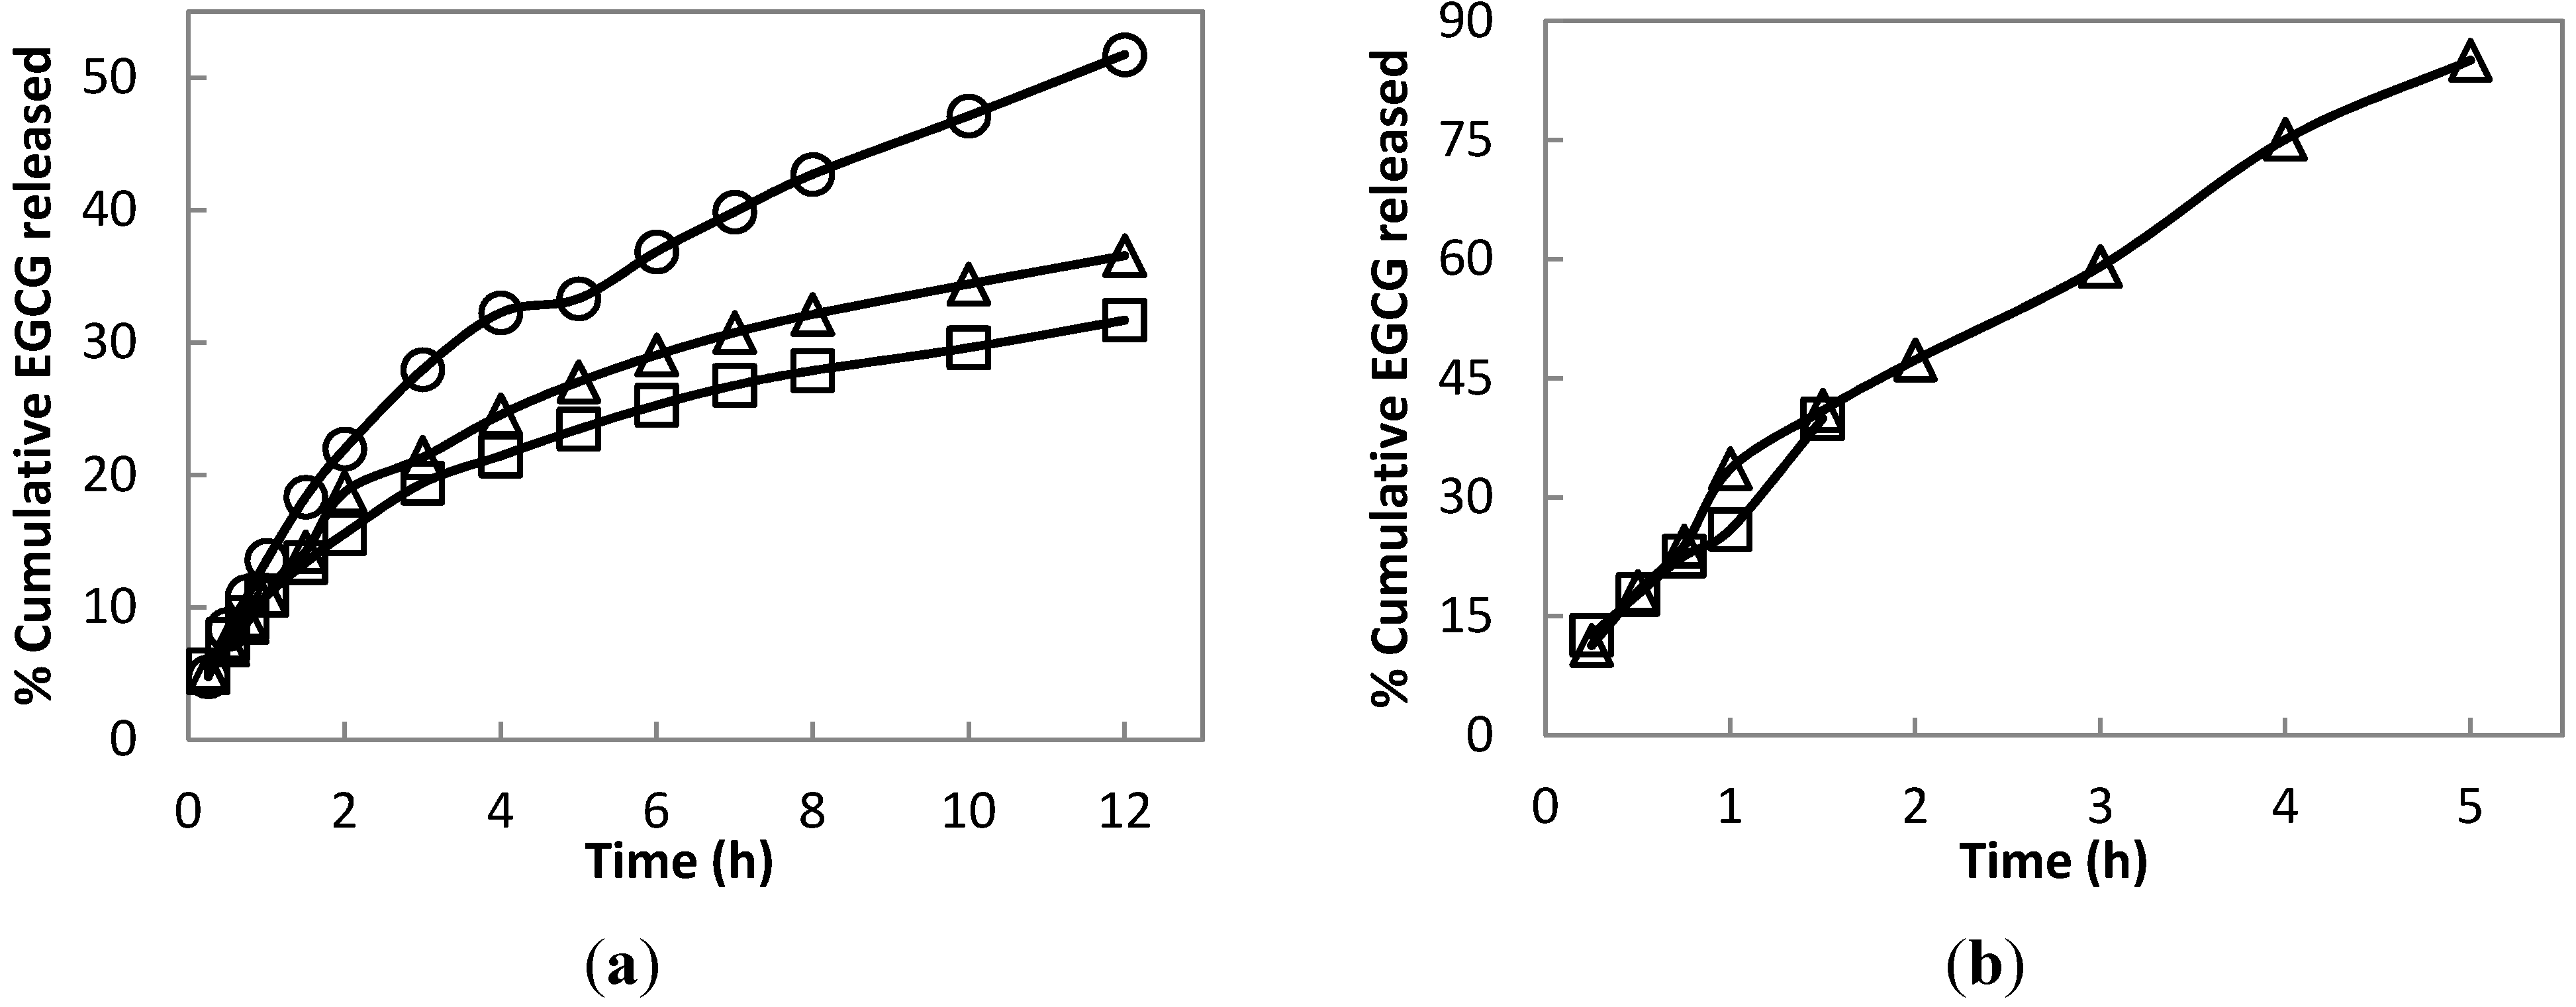
The optimized formulation of hydrogel at pH 1.2 posted a 51.72% cumulative release of EGCG compared to a lower EGCG release at pH 6.8 and 7.4 after 12 h (Figure 9a). In contrast, uncrosslinked hydrogel (Figure 9b) shows a high rate of EGCG release, with 85.07% cumulative release in only 5 h at pH 7.4. The release profile using uncrosslinked hydrogel was only monitored up to 5 h at pH 7.4 and 1.5 h at pH 6.8. This is because, past these hours, the release medium becomes cloudy, due to the disintegration of the hydrogel. A cloudy aliquot significantly affects the absorbance of the medium, causing errors in the UV determination of the released EGCG.
The crosslinking of hydrogel can greatly affect its release profile properties (Figure 9a,b) and pH responsiveness (Figure 8a,b). Notably, the release profile of EGCG at any pH using the optimized crosslinked hydrogel shows no observed burst release. This good property of the synthesized hydrogel suggests a sustained release of EGCG that can last up to several hours and withstand an environment of low to neutral pH. In the GIT, the hydrogel is first exposed to a low pH of 1.2 for about 2 h, the average gastric emptying time [39]. Based on these conditions, this accounts for about 21.97% of EGCG released, after which, there is still a significant amount of EGCG remaining in the hydrogel to be released in the succeeding path of GIT.
Figure 9. (a) In vitro release kinetics of EGCG from the optimized formulation of crosslinked hydrogel in PBS of different pH values (-○-, pH 1.2; -□-, pH 6.8; -∆-, pH 7.4) and temperature maintained at 37 °C. (b) In vitro release kinetics of EGCG from uncrosslinked hydrogel in PBS of different pH values (-□-, pH 6.8; -∆-, pH 7.4) and temperature maintained at 37 °C.
Polymers 06 00039 g009
Based on the n values presented in Table 2, the drug release mechanism of cylindrical crosslinked hydrogel at any pH is characterized by anomalous transport, intermediate between Fickian and Case II. However, the n value at pH 6.8 is closer to 0.45, signifying that anomalous transport at this pH is more of a Fickian diffusion. The drug release mechanism under Fickian diffusion means that the first 60% normalized drug released at any time is described by a constant multiplied by the square root of time. Conversely, in Case II transport, the normalized water uptake at any time is linearly related to time [40].
Table 2. Diffusional exponent (n) and constant (k) of cylindrical crosslinked hydrogel at different pH values from a fitted Peppas equation.
pHr2nk
1.20.98560.59623.86 × 10−3
6.80.99330.4676.88 × 10−3
7.40.98650.52844.92 × 10−3

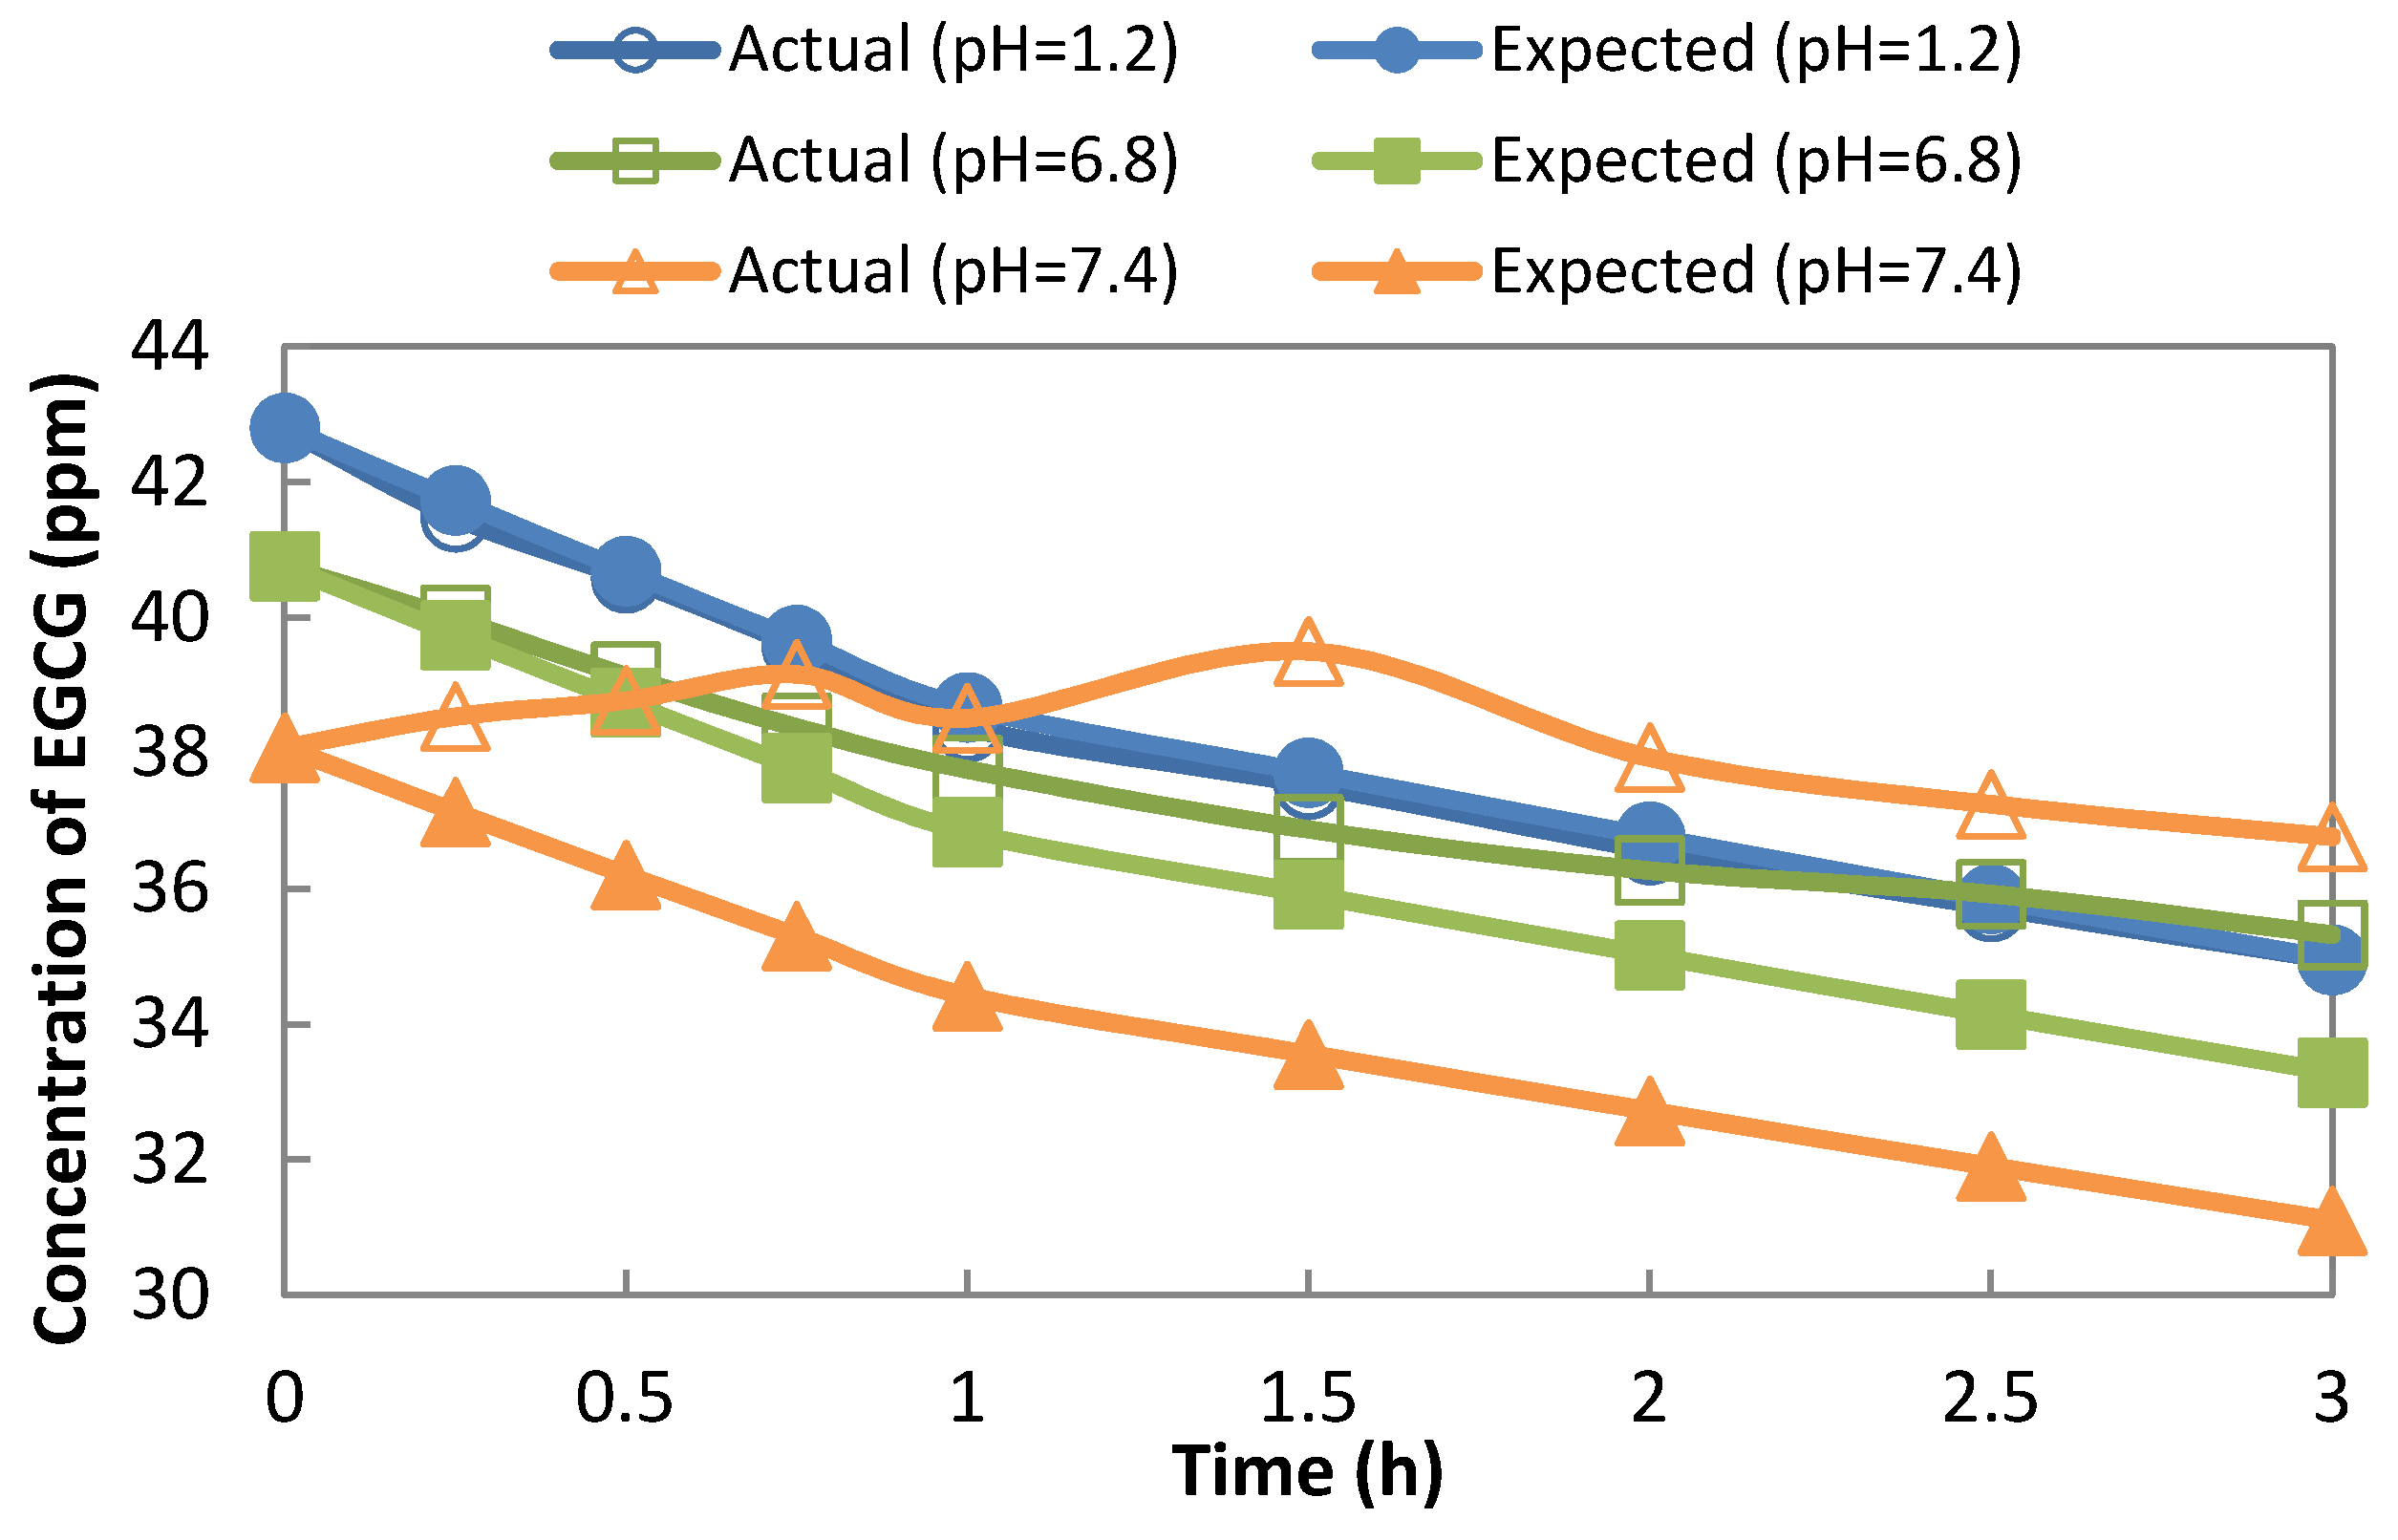
3.5. Instability of Free-EGCG in Solutions

To determine the stability of EGCG in in vitro simulated GIT conditions, the concentration of free-EGCG in the solution was monitored against time, as shown in Figure 10. Since the EGCG solution becomes diluted throughout time by replacing the aliquot withdrawn with fresh solution, there is a plot of the expected concentration of EGCG, as its initial concentration was predetermined. This expected concentration of EGCG is compared to the actual concentration of EGCG based on UV-Vis determination. A deviation of the two plots can be interpreted as the corresponding stability of EGCG in the solution at a specific pH. As shown in Figure 10, EGCG is stable at pH 1.2, proven by the overlapping of its actual and expected concentration curves. However, as the pH becomes higher, the two curves deviate more, with a big difference at pH 7.4. It can be interpreted that EGCG is more unstable in an alkaline solution.
In comparison, the controlled release of EGCG from hydrogel provides stability for EGCG, as shown in Figure 9a. There is no instance at any pH of the solution where the concentration of EGCG from the releasing medium decreased, even though monitored up to 12 h. This means that the released EGCG is not degraded instantly and, then, is compensated for by the continuous release of EGCG. The only reason why at different pH values the sustained-release curves differ is because of the pH-responsiveness of the hydrogel. It is major concern that free EGCG (or released EGCG) is subject to oxidation in the medium (or physiological fluid in the human body). Hu et al. reported that EGCG was protected from oxidation by encapsulating polymers of a casein peptides/chitosan mixture. In their report, the enhanced permeation of released EGCG was observed in the in vitro permeation test of Caco-2 cell monolayers [41]. This indicates the good stability of EGCG in intestinal fluid. Shutava et al. utilized a polyelectrolyte layer-by-layer technique to coat EGCG over gelatin core nanoparticles. It was shown that the biological activity of EGCG, blocking the signaling pathway of the breast cancer cell line in their study, remained [42]. Therefore, the utilization of biopolymers to protect EGCG from oxidation is an essential practice for forming a drug delivery system.
Figure 10. Concentration of free-EGCG against time at pH 1.2, 6.8 and 7.4 at a temperature maintained at 37 °C.
Polymers 06 00039 g010

4. Conclusions

Synthesized pH-responsive hydrogel by ionic interaction between type-A gelatin and γ-PGA was successfully loaded with EGCG, as proven in FT-IR spectra. The optimization of hydrogel formulation is based on the swelling degree (SD) and loading efficiency. The swelling kinetics of hydrogel is proportional to γ-PGA concentration, but not to gelatin and EDC concentrations. Meanwhile, loading efficiency decreases as the degree of crosslinking increases, because of a lower SD. Thus, the post-loading mechanism is related to its swelling mechanism. The optimized hydrogel formulation is 10 w/v% type-A gelatin, 1 w/v% γ-PGA and 1.3 mg/mL EDC. The in vitro release kinetics of EGCG from optimized crosslinked hydrogel at pH 1.2, 6.8 and 7.4, simulating GIT conditions, and at 37 °C shows sustained release curves with no observed burst release. This EGCG release behavior of the hydrogel was determined to be intermediate between Fickian diffusion and Case II transport at any pH using the power law model known as the Peppas equation. This study also showed that an alkaline solution can lead to the instable behavior of EGCG in the solution.

Acknowledgments

The authors would like to thank the National Science Council, in part for financial support under contract no. NSC 101-2632-M-033-001-MY2, and Taoyuan Armed Forces General Hospital for project no. 10019. Gratitude is also extended to the Division of Biomedical Engineering, the National Health Research Institute for SEM microscopy.

Conflicts of Interest

The authors declare no conflict of interest.

References

  1. Perva-Uzunalić, A.; Škerget, M.; Knez, Ž.; Weinreich, B.; Otto, F.; Grüner, S. Extraction of active ingredients from green tea (Camellia sinensis): Extraction efficiency of major catechins and caffeine. Food Chem. 2006, 96, 597–605. [Google Scholar] [CrossRef]
  2. Jun, X.; Shuo, Z.; Bingbing, L.; Rui, Z.; Ye, L.; Deji, S.; Guofeng, Z. Separation of major catechins from green tea by ultrahigh pressure extraction. Int. J. Pharm. 2010, 386, 229–231. [Google Scholar] [CrossRef]
  3. Nagle, D.G.; Ferreira, D.; Zhou, Y.D. Epigallocatechin-3-gallate (egcg): Chemical and biomedical perspectives. Phytochemistry 2006, 67, 1849–1855. [Google Scholar] [CrossRef]
  4. Ho, H.-Y.; Cheng, M.-L.; Weng, S.-F.; Leu, Y.-L.; Chiu, D.T.-Y. Antiviral effect of epigallocatechin gallate on enterovirus 71. J. Agric. Food Chem. 2009, 57, 6140–6147. [Google Scholar] [CrossRef]
  5. Yang, C.S.; Wang, X.; Lu, G.; Picinich, S.C. Cancer prevention by tea: Animal studies, molecular mechanisms and human relevance. Nat. Rev. Cancer 2009, 9, 429–439. [Google Scholar] [CrossRef]
  6. Row, K.H.; Jin, Y. Recovery of catechin compounds from korean tea by solvent extraction. Bioresour. Technol. 2006, 97, 790–793. [Google Scholar] [CrossRef]
  7. Dugas, A.J., Jr.; Castañeda-Acosta, J.; Bonin, G.C.; Price, K.L.; Fischer, N.H.; Winston, G.W. Evaluation of the total peroxyl radical-scavenging capacity of flavonoids:  Structure-activity relationships. J. Nat. Prod. 2000, 63, 327–331. [Google Scholar] [CrossRef]
  8. Rice-Evans, C.A.; Miller, N.J.; Paganga, G. Structure-antioxidant activity relationships of flavonoids and phenolic acids. Free Radic. Biol. Med. 1996, 20, 933–956. [Google Scholar] [CrossRef]
  9. Yang, C.S.; Sang, S.; Lambert, J.D.; Lee, M.-J. Bioavailability issues in studying the health effects of plant polyphenolic compounds. Mol. Nutr. Food Res. 2008, 52, S139–S151. [Google Scholar]
  10. Zhu, M.; Chen, Y.; Li, R.C. Oral absorption and bioavailability of tea catechins. Planta Med. 2000, 66, 444–447. [Google Scholar] [CrossRef]
  11. Green, R.J.; Murphy, A.S.; Schulz, B.; Watkins, B.A.; Ferruzzi, M.G. Common tea formulations modulate in vitro digestive recovery of green tea catechins. Mol. Nutr. Food Res. 2007, 51, 1152–1162. [Google Scholar] [CrossRef]
  12. Huo, C.; Wan, S.B.; Lam, W.H.; Li, L.; Wang, Z.; Landis-Piwowar, K.R.; Chen, D.; Dou, Q.P.; Chan, T.H. The challenge of developing green tea polyphenols as therapeutic agents. Inflammopharmacology 2008, 16, 248–252. [Google Scholar] [CrossRef]
  13. Wang, X.; Wang, Y.-W.; Huang, Q. Enhancing Stability and Oral Bioavailability of Polyphenols Using Nanoemulsions. In Micro/Nanoencapsulation of Active Food Ingredients; American Chemical Society: Washington, DC, USA, 2009; Volume 1007, pp. 198–212. [Google Scholar]
  14. Lee, J.-S.; Chung, D.; Lee, H.G. Optimization of calcium pectinate gel beads for sustained-release of catechin using response surface methodology. Int. J. Biol. Macromol. 2008, 42, 340–347. [Google Scholar] [CrossRef]
  15. Renò, F.; Carniato, F.; Rizzi, M.; Marchese, L.; Laus, M.; Antonioli, D. Poss/gelatin-polyglutamic acid hydrogel composites: Preparation, biological and mechanical characterization. J. Appl. Polym. Sci. 2013, 129, 699–706. [Google Scholar] [CrossRef]
  16. Einerson, N.J.; Stevens, K.R.; Kao, W.J. Synthesis and physicochemical analysis of gelatin-based hydrogels for drug carrier matrices. Biomaterials 2003, 24, 509–523. [Google Scholar] [CrossRef]
  17. Layman, H.; Spiga, M.-G.; Brooks, T.; Pham, S.; Webster, K.A.; Andreopoulos, F.M. The effect of the controlled release of basic fibroblast growth factor from ionic gelatin-based hydrogels on angiogenesis in a murine critical limb ischemic model. Biomaterials 2007, 28, 2646–2654. [Google Scholar] [CrossRef]
  18. Silva, A.K.A.; Richard, C.; Bessodes, M.; Scherman, D.; Merten, O.-W. Growth factor delivery approaches in hydrogels. Biomacromolecules 2008, 10, 9–18. [Google Scholar]
  19. Young, S.; Wong, M.; Tabata, Y.; Mikos, A.G. Gelatin as a delivery vehicle for the controlled release of bioactive molecules. J. Control. Release 2005, 109, 256–274. [Google Scholar] [CrossRef]
  20. Tang, D.-W.; Yu, S.-H.; Ho, Y.-C.; Huang, B.-Q.; Tsai, G.-J.; Hsieh, H.-Y.; Sung, H.-W.; Mi, F.-L. Characterization of tea catechins-loaded nanoparticles prepared from chitosan and an edible polypeptide. Food Hydrocoll. 2013, 30, 33–41. [Google Scholar] [CrossRef]
  21. Magnin, D.; Lefebvre, J.; Chornet, E.; Dumitriu, S. Physicochemical and structural characterization of a polyionic matrix of interest in biotechnology, in the pharmaceutical and biomedical fields. Carbohydr. Polym. 2004, 55, 437–453. [Google Scholar] [CrossRef]
  22. Chen, C.-H.; Hsieh, M.-F.; Ho, Y.-N.; Huang, C.-M.; Lee, J.-S.; Yang, C.-Y.; Chang, Y. Enhancement of catechin skin permeation via a newly fabricated mpeg-pcl-graft-2-hydroxycellulose membrane. J. Membr. Sci. 2011, 371, 134–140. [Google Scholar] [CrossRef]
  23. Philip, A.K.; Philip, B. Colon targeted drug delivery systems: A review on primary and novel approaches. Oman Med. J. 2010, 25, 70–78. [Google Scholar] [CrossRef]
  24. Sigma-Aldrich, Product Information Sheet: Gelatin; Sigma-Aldrich, Inc.: St. Louis, MO, USA, 2013.
  25. Gorgieva, S.; Kokol, V. Collagen- vs. Gelatine-Based Biomaterials and Their Biocompatibility: Review and Perspective. In Biomaterials Applications for Nanomedicine; Pignatello, R., Ed.; InTech: Rijeka, Croatia, 2011; p. 458. [Google Scholar]
  26. Shih, I.-L.; Van, Y.-T. The production of poly-(γ-glutamic acid) from microorganisms and its various applications. Bioresour. Technol. 2001, 79, 207–225. [Google Scholar] [CrossRef]
  27. Lin, C.-C.; Metters, A.T. Hydrogels in controlled release formulations: Network design and mathematical modeling. Adv. Drug Deliv. Rev. 2006, 58, 1379–1408. [Google Scholar] [CrossRef]
  28. Hsu, S.-H.; Lin, C.-H. The properties of gelatin-poly (γ-glutamic acid) hydrogels as biological glues. Biorheology 2007, 44, 17–28. [Google Scholar]
  29. Rathna, G.V.N. Gelatin hydrogels: Enhanced biocompatibility, drug release and cell viability. J. Mater. Sci: Mater. Med. 2008, 19, 2351–2358. [Google Scholar] [CrossRef]
  30. Lin, Y.-H.; Lin, J.-H.; Peng, S.-F.; Yeh, C.-L.; Chen, W.-C.; Chang, T.-L.; Liu, M.-J.; Lai, C.-H. Multifunctional gentamicin supplementation of poly(γ-glutamic acid)-based hydrogels for wound dressing application. J. Appl. Polym. Sci. 2011, 120, 1057–1068. [Google Scholar] [CrossRef]
  31. Pinotti, A.; García, M.A.; Martino, M.N.; Zaritzky, N.E. Study on microstructure and physical properties of composite films based on chitosan and methylcellulose. Food Hydrocoll. 2007, 21, 66–72. [Google Scholar] [CrossRef]
  32. Chen, Y.-C.; Yu, S.-H.; Tsai, G.-J.; Tang, D.-W.; Mi, F.-L.; Peng, Y.-P. Novel technology for the preparation of self-assembled catechin/gelatin nanoparticles and their characterization. J. Agric. Food Chem. 2010, 58, 6728–6734. [Google Scholar]
  33. Wanchoo, R.K.; Sharma, P.K. Viscometric study on the compatibility of some water-soluble polymer—Polymer mixtures. Eur. Polym. J. 2003, 39, 1481–1490. [Google Scholar]
  34. Zhu, B.; Li, J.; He, Y.; Yoshie, N.; Inoue, Y. Hydrogen-bonding interaction and crystalline morphology in the binary blends of poly(ε-caprolactone) and polyphenol catechin. Macromol. Biosci. 2003, 3, 684–693. [Google Scholar] [CrossRef]
  35. Ho, G.-H.; Ho, T.-I.; Hsieh, K.-H.; Su, Y.-C.; Lin, P.-Y.; Yang, J.; Yang, K.-H.; Yang, S.-C. γ-polyglutamic acid produced by Bacillus subtilis (natto): Structural characteristics, chemical properties, and biological functionalities. J. Chin. Chem. Soc. 2006, 53, 1363–1384. [Google Scholar]
  36. Fakirov, S. Gelatin and Gelatin-Based Biodegradable Composites: Manufacturing, Properties, and Biodegradation Behavior. In Handbook of Engineering Biopolymers: Homopolymers, Blends, and Composites; Fakirov, S., Bhattacharya, D., Eds.; Carl Hanser Verlag: München, Germany, 2007. [Google Scholar]
  37. Amin, S.; Rajabnezhad, S.; Kohli, K. Hydrogels as potential drug delivery systems. Sci. Res. Essay 2009, 3, 1175–1183. [Google Scholar]
  38. Bajpai, S.K.; Dubey, S. Synthesis and swelling kinetics of a pH-sensitive terpolymeric hydrogel system. Iran. Polym. J. 2004, 13, 189–203. [Google Scholar]
  39. Xing, L.; Dawei, C.; Liping, X.; Rongqing, Z. Oral colon-specific drug delivery for bee venom peptide: Development of a coated calcium alginate gel beads-entrapped liposome. J. Control. Release 2003, 93, 293–300. [Google Scholar] [CrossRef]
  40. Siepmann, J.; Peppas, N.A. Higuchi equation: Derivation, applications, use and misuse. Int. J. Pharm. 2011, 418, 6–12. [Google Scholar] [CrossRef]
  41. Hu, B.; Ting, Y.W.; Yang, X.Q.; Tang, W.P.; Zeng, X.X.; Huang, Q.R. Nanochemoprevention by encapsulation of (−)-epigallocatechin-3-gallate with bioactive peptides/chitosan nanoparticles for enhancement of its bioavailability. Chem. Commun. 2012, 48, 2421–2423. [Google Scholar] [CrossRef]
  42. Shutava, T.G.; Balkundi, S.S.; Vangala, P.; Steffan, J.J.; Bigelow, R.L.; Cardelli, J.A.; O’Neal, D.P.; Lvov, Y.M. Layer-by-layer-coated gelatin nanoparticles as a vehicle for delivery of natural polyphenols. ACS Nano 2009, 3, 1877–1885. [Google Scholar] [CrossRef]

