Article

Nutritional and Visual Diagnosis in Broccoli (Brassica oleracea var. italica L.) Plants: Disorders in Physiological Activity, Nutritional Efficiency and Metabolism of Carbohydrates

by
Hilário Júnior de Almeida
1,2,
Victor Manuel Vergara Carmona
1,3,
Valéria Santos Cavalcante
4,5,*,
Arthur Bernardes Cecílio Filho
1,
Renato de Mello Prado
1,
Rilner Alves Flores
4,
Bernardo Melo Montes Nogueira Borges
1 and
Munir Mauad
2
1
Departamento de Produção Vegetal, Universidade Estadual Paulista (UNESP), Via de Acesso Prof. Paulo Donato Castellane, Jaboticabal 14884-900, São Paulo, Brazil
2
Faculdade de Ciências Agrárias, Universidade Federal da Grande Dourados (UFGD), Dourados 79804-970, Mato Grosso do Sul, Brazil
3
Facultad de Recursos Naturales Renovables, Universidad Arturo Prat (UNAP), Avda Arturo Prat, Iquique 1100000, Región de Tarapacá, Chile
4
Departamento de Solos e Adubos, Universidade Estadual Paulista (UNESP), Via de Acesso Prof. Paulo Donato Castellane, Jaboticabal 14884-900, São Paulo, Brazil
5
Departamento de Solos, Universidade Federal de Viçosa (UFV), Av. Peter Henry Rolfs, Viçosa 36570-900, Minas Gerais, Brazil
*
Author to whom correspondence should be addressed.
Submission received: 8 September 2020 / Revised: 4 October 2020 / Accepted: 9 October 2020 / Published: 15 October 2020
(This article belongs to the Collection Nutrition Management of Hydroponic Vegetable Crops)

Abstract

:
Information on the nutritional status of plants enables adequate fertilisation management. Thus, the aim of this study was to evaluate how nutritional disorders alter the biological, nutritional and biochemical mechanisms of broccoli (Brassica oleracea var. italica L.) plants grown under greenhouse conditions. A complete nutrient solution and omissions of macronutrients were tested in a completely randomised design with four replicates. Broccoli plants grown with the omission of N and Ca were the first of show deficiency symptoms and the greatest reduction in the net photosynthetic rate and stomatal conductance, with evidently impaired plant growth and biomass. Omissions of macronutrients affected carbohydrate partitioning, and the content of soluble sugars significantly decreased by more 60% in response to Mg omission. With K omission, the contents of soluble sugars and starch increased in broccoli leaves by 40% and 60%, respectively. K transport increased in plants grown without Ca. S translocation decreased with the absence of any macronutrient in the nutrient solution. Deficiencies in the nutrients N, K, and Ca cause the most critical early damage in the photosynthetic apparatus and in the nutritional balance of broccoli plants, so attention should be given to replenishing these nutrients in plantations.

1. Introduction

The lack of nutrients is increasingly worrying due to the constant loss of natural fertility of agricultural soils [1]. Thus, the diagnosis and identification of the ways by which crops respond to the presence or absence of nutrients in the environment, influencing both production and food quality, is vitally important for proper fertilisation management.
The nutritional status of crops is the momentary condition of macro- and micronutrient contents in plant tissues. It reflects their growth, development and, consequently, the production and quality of the harvested food. Understanding the mechanisms of the effects/responses that occur during the cultivation of plants and the conditions of the productive environment are fundamental for reliable nutritional diagnoses that lead to the best recommendation of fertiliser use by farmers [2].
The symptoms of nutritional deficiency are the culmination of several metabolic disturbances in plants, with consequent negative effects on yield and crop quality [3]. The essential evaluation of plant nutritional status can be diagnosed by a chemical analysis of plant tissues, physiological parameters (e.g., gas exchange) and by a visual diagnosis [4]. In addition, with nutritional data it is possible to determine the efficiency indices that indicate the ability of plants to thrive in deficient environments [5,6].
There are many nutrient–environment interactions and biological and biochemical functions that nutrients exert in plants, so the identification of deficiency symptoms is relatively complex, as nutritional stress can trigger variable symptomatology between species of the same genus [7]. Thus, it is necessary to carry out studies relating nutrient levels in plants with nutritional, physiological and biochemical disturbances, especially in new varieties of plants of agricultural importance.
Due to the importance of this subject, there are several works in the literature on nutritional disorders in plants [6,8,9,10]. However, no such studies have been found in the literature on broccoli (Brassica oleracea var. italica L.). This crop occupies approximately one million hectares worldwide, and production exceeds 19 million tons a year [11]. Broccoli is of great importance in the human diet and contains functional substances that can be used in the nutraceutical and pharmaceutical industries [12,13]. Due to the importance of this crop and the complexity of macronutrient deficiency, there is a need to verify changes that directly affect broccoli production. Therefore, we aimed in this study to evaluate how broccoli plants with nutritional disorders alter their biological, nutritional and biochemical characteristics.

2. Materials and Methods

2.1. Experiment Site

The experiment was conducted in a hydroponic greenhouse at São Paulo State University (UNESP), Jaboticabal Campus (21°15′22″ W, 48°18′58″ S). During the greenhouse experiment, the average maximum temperature was 30 ± 15 °C, the average minimum temperature was 27 ± 14 °C, the average relative humidity was 45%, and the average irradiance was 1800 mmol m−2 s−1.

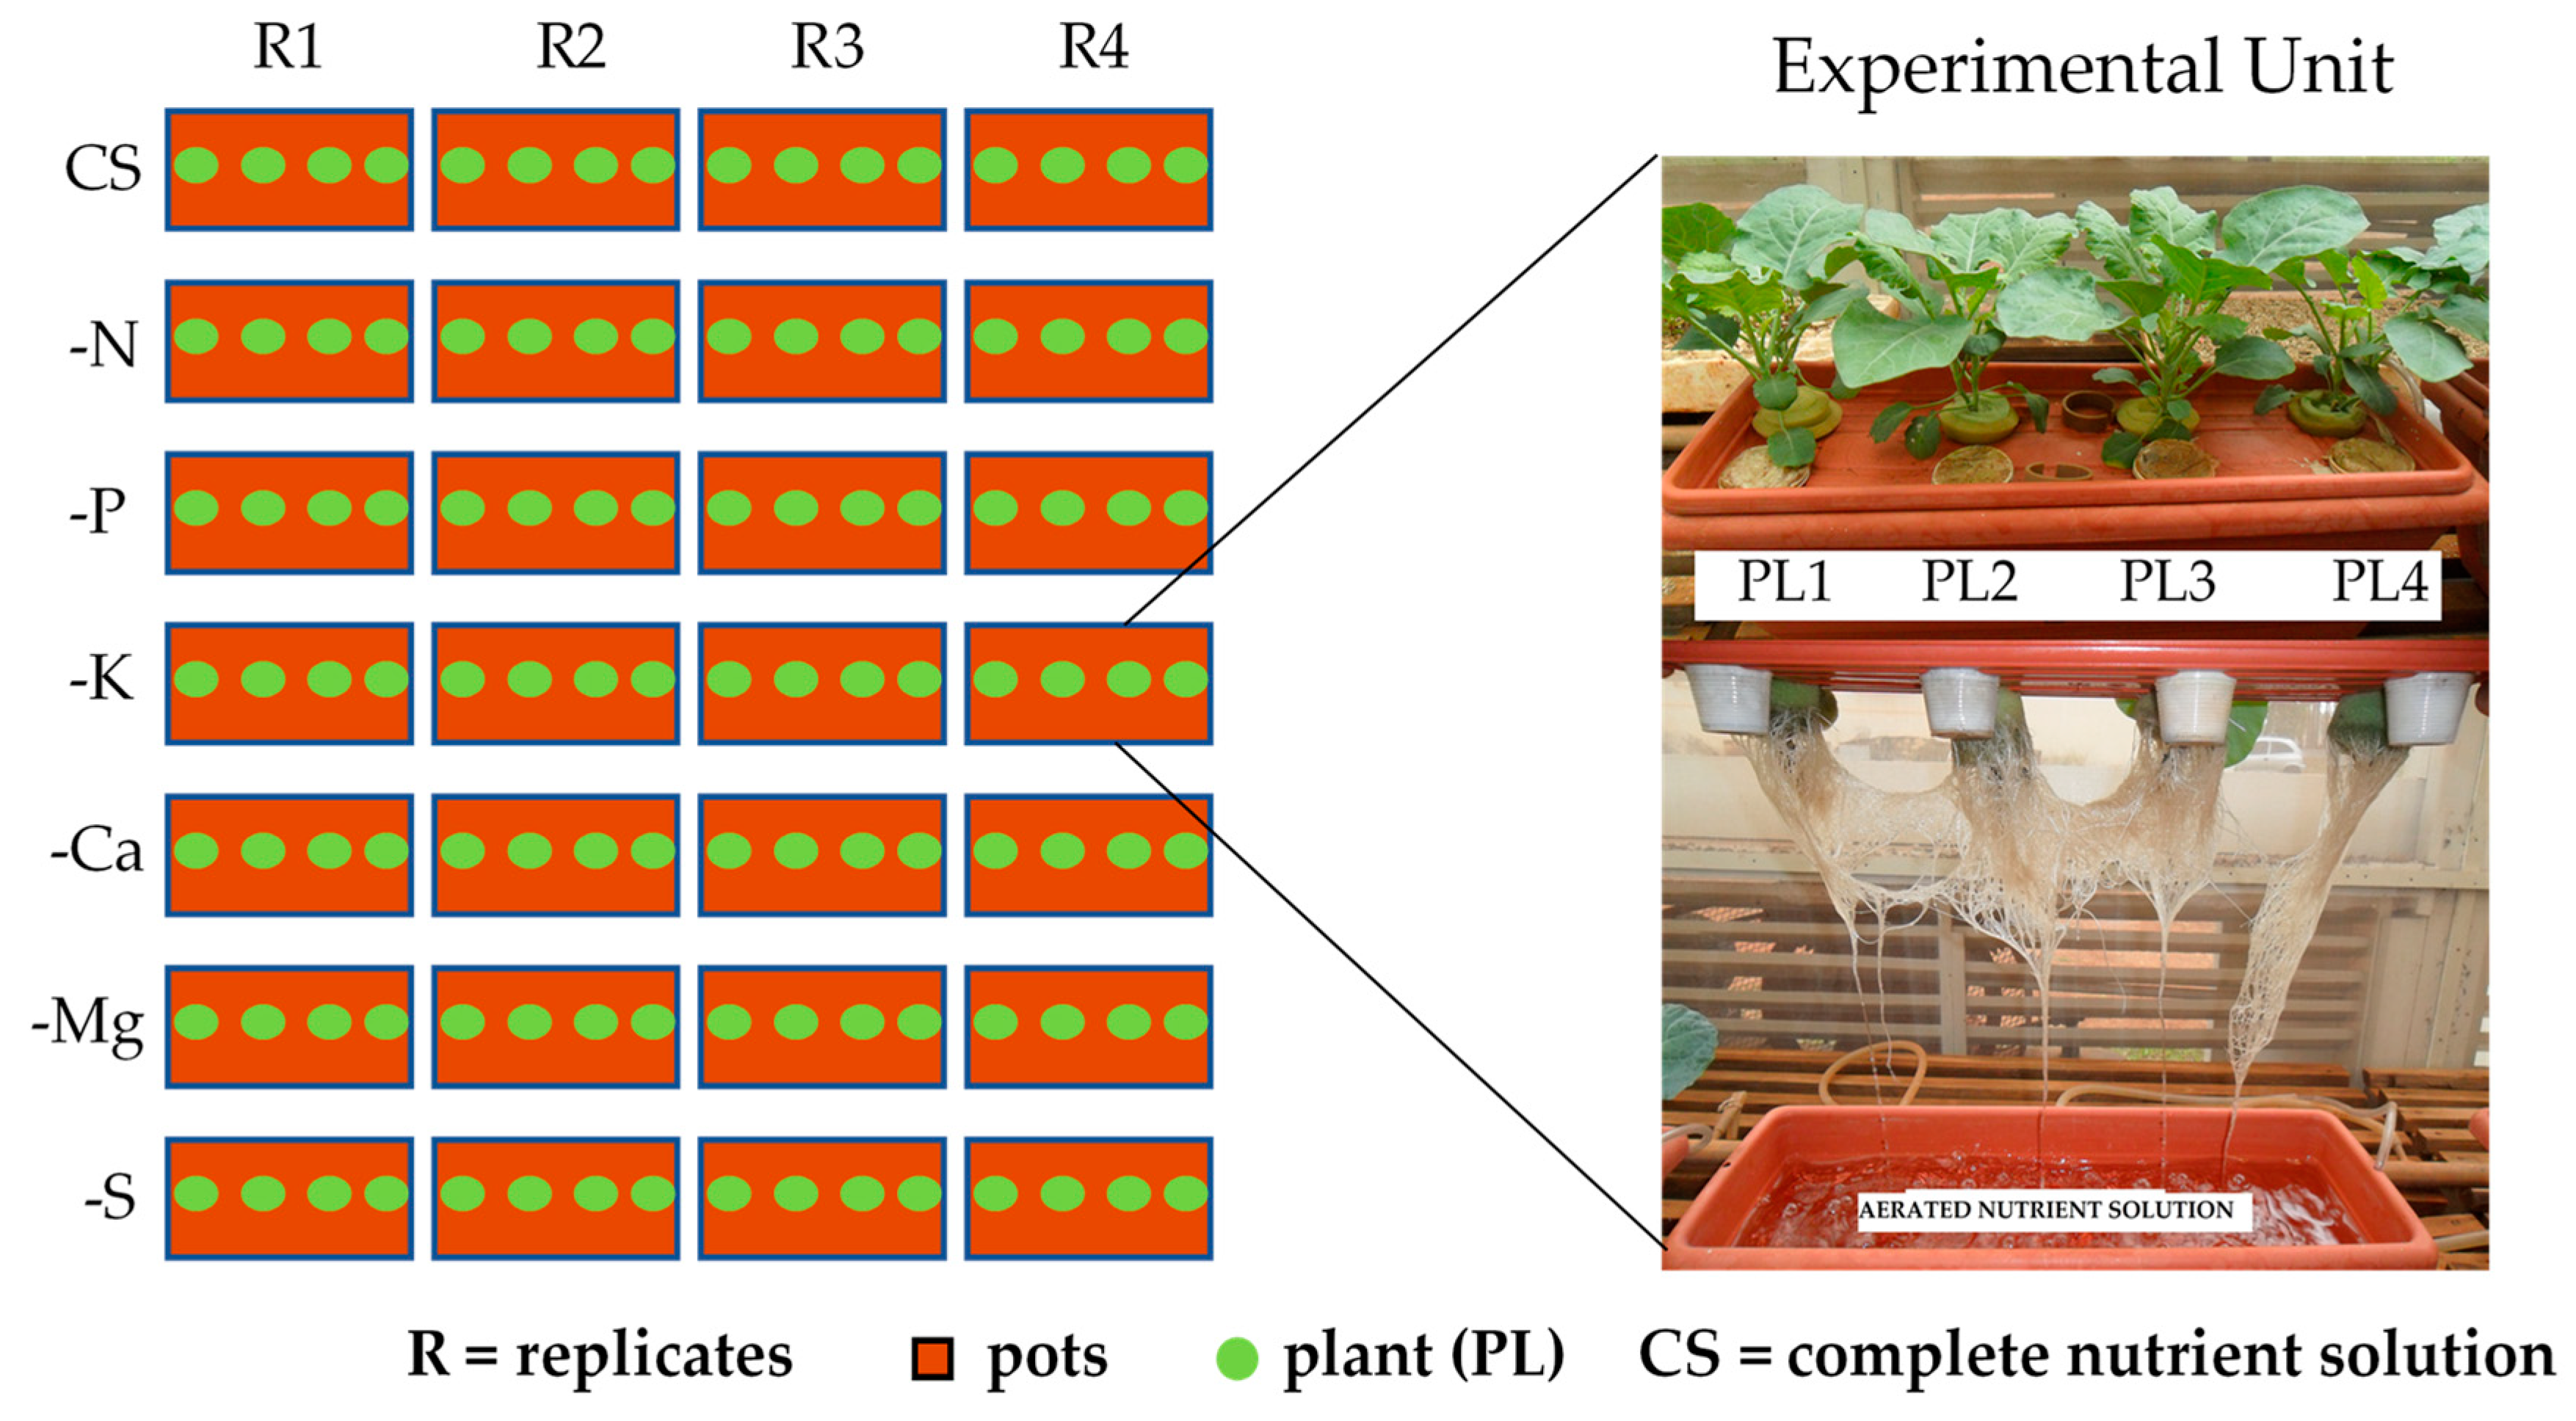
2.2. Experimental Design and Treatments

The design of the experiment was a completely randomised design with four replicates. The treatments were: complete nutrient solution (CS), and omission of nitrogen (-N), phosphorus (-P), potassium (-K), calcium (-Ca), magnesium (-Mg), or sulphur (-S). Each experimental unit was represented by four plants (Figure 1). During the experiment, the pots were rotated each week to ensure the same environmental conditions among treatments.

2.3. Conducting the Experiment

Broccoli (Brassica oleracea var. italica L.) seeds ‘Avenger’ were sown in 128-cell expanded polystyrene trays filled with vermiculite and irrigated with deionised water during the first five days. The Avenger cultivar was chosen because it is the most commonly planted cultivar by South American producers, having as its main characteristics high productivity, a vigorous plant and root system, low lateral sprouting, defined and fine-grained florets, and an average cycle of 105 days. From the sixth to the twelfth day, the seedlings were irrigated with a modified Hoagland nutrient solution at 5% ionic strength [14]. The seedlings were then washed with deionised water and transplanted into six-litre pots containing nutrient solution at 50% ionic strength. The seedlings were kept in this solution for four days to adapt. After this period, they were cultivated in a nutrient solution according to each treatment (Table 1).
Throughout the experiment, the culture solution was subjected to constant aeration and the pH was monitored daily. It was adjusted to 5.5 ± 0.2 by correction with sodium hydroxide (NaOH) or 0.1 M hydrochloric acid (HCl). The nutrient solution exchange was performed considering a 30% reduction in the initial electrical conductivity, and the replacement of evapotranspirated water was performed using deionised water.
Plants were harvested at 38 days after transplantation (DAT) when deficiency symptoms arose, except for plants receiving the -N and -Ca treatments, which were harvested at 24 DAT due to an earlier onset of visual symptoms of nutritional disorder and senescence.

2.4. Growth Evaluations and SPAD (Soil Plant Analysis Development) Reading

Nutritional deficiency symptoms were evaluated daily, and the symptoms were photographed. During the experiment, the following biometric evaluations were performed weekly on broccoli shoots: plant height (measured from the plant base to the apex of the last fully developed new leaf), number of leaves fully developed per plant, and indirect measurement of chlorophyll content (SPAD reading), determined using a SPAD chlorophyll meter (OPTI-Sciences®, model CCM-200, Hudson, NY, USA) on three fully developed leaves near the plant apex per experimental unit.
At the end of the experiment, the plants were separated into shoots and roots, and then washed in running water. They were passed through a 0.1 M HCl, neutral detergent and deionised water solution [15]. The leaves of each plant were detached for the evaluation of leaf area using a LI-COR 3100® electronic meter (cm2 per plant). Then, the plant material was immediately placed for drying in a forced air circulation oven at 65 °C until a constant mass was achieved to determine the biomass (in grams). The samples were then weighed using an analytical scale.

2.5. Evaluation of Macronutrient Content and Accumulation

After determining shoot and root biomass, the samples were ground in a Wiley knife mill and passed through a 2-mm sieve. The fine powder obtained from the plant material was digested in HNO3 + HClO4 (3:1) (for the determination of P, K, Ca, Mg and S) and in H2SO4 (for the determination of N) in a digestion block heated gradually up to 203 °C. After obtaining the extract, the nutrient contents were determined using the methods proposed by Miyazawa et al. [16]. From the multiplication of nutrient contents by the dry matter (roots, shoots and whole plant), the accumulation of each macronutrient analysed was obtained.

2.6. Nutrient Absorption, Transport and Use Efficiency Indexes

Nutrient accumulation and dry matter data of the different parts of the plants were calculated as follows: (i) absorption efficiency (AEy) = (total accumulation of the nutrient y in the plant)/(root dry matter), according to Swiader et al. [17]; (ii) transport efficiency (TEy) = ((accumulation of the nutrient y in shoots)/(total accumulation of the nutrient y in the plant)) × 100, according to Li et al. [18]; and use efficiency (UEy) = (total dry matter)2/(total accumulation of the nutrient y in the plant), according to Siddiqi and Glass [19].

2.7. Gas Exchange Evaluation

The following physiological analyses were performed on fully developed leaves closer to the plant apex: net photosynthetic rate (Pn, μmol m−2 s−1), stomatal conductance (gs, mmol m−2 s−1), and transpiration rate (E, μmol m−2 s−1). For this purpose, a portable Infrared Gas Analyzer (LI-COR 6400, Lincoln, NE, USA) was used.

2.8. Content of Starch and Total Soluble Sugars (SS)

For biochemical analyses, carbohydrates were determined in leaves, as proposed by Dubois et al. [20]. Thus, the starch content was determined by extraction with 80% ethanol in a water bath for 30 min at 80 °C, and then 30% HClO4 was added for 30 min at 25 °C. This process was repeated once more to obtain the total extract, when 5% phenol + concentrated H2SO4 concentrate were added for spectrophotometer reading at 490 nm.
For the determination of soluble sugars content (SS), the extraction was performed with distilled water for 30 min at 100 °C. Then, the samples were centrifuged (1000 rpm) to obtain the total extract water and 5% phenol and concentrated H2SO4 were added for spectrophotometer reading at 490 nm. In both analyses, glucose content dissolved in water were used to plot the standard curve.

2.9. Data Analysis

The experimental data were subjected to univariate analysis of variance, and then the means were compared by Tukey test (p ≤ 0.05). Plant height, leaf number and SPAD readings over the evaluation days, a regression analysis was performed according to the number of days after transplantation. Calculations of the basic descriptive statistics and ANOVAs were performed using SISVAR software.

3. Results

3.1. Visual Diagnosis

Broccoli (Brassica oleracea var. italica L.) plants grown using the -N treatment showed initial symptoms at 12 DAT (Table 2). There was a mixed coloration between grey-green and yellowish-green on the adaxial face of older leaves, as well as a purplish colour on the petiole and the abaxial face of the leaf blade (Figure 2c,d). These symptoms intensified during the broccoli growth cycle with N omission, and at the end of the experiment, the old leaves showed a purplish red hue on the abaxial surface, while the intermediate and young leaves showed a yellowish-green hue.
Plants manifested initial symptoms of P deficiency at 32 DAT with the -P treatment (Table 2). Initially, some necrotic patches appeared on the adaxial face of the leaf limb and purpling of the petiole and the abaxial face of the leaf blade (Figure 2e). Plants grown with -P treatment also showed a more intense green colour than that observed in CS. The symptoms of deficiency of this element were more evident in the root system architecture, with a severe decrease in the length of the main root and an increase in root density, which were thinner than the roots of CS plants. At the end of the experiment, the leaf blades of some old leaves were yellowing, while the ribs remained green, which is known as thick reticulate (Figure 2f).
Plants showed early symptoms of K deficiency at 22 DAT in the -K treatment (Table 2). Leaf growth was abnormal, deformed, small and wilted (Figure 2g). However, despite the damage caused to broccoli leaves, K omission did not affect the number of leaves, since there was a decrease in leaf abscission. Initially, the leaves of the lower third of the plants had a very intense green colour, with slightly wrinkled and downward curved leaves. Then, internerval chlorosis began. Subsequently, the tertiary ribs were yellowed, necrotic and showed small brownish-yellow irregular coalescent spots that evolved into soggy spots (Figure 2h). At the end of the experiment, marginal chlorosis was observed in older leaf blades, starting at the leaf apex and progressing to total necrosis.
After N, Ca was the nutrient for which the deficient nutrient solution showed the earliest effect. Plants showed initial symptoms of Ca deficiency at 17 DAT for the nutrient solution in the absence of this nutrient (Table 2). Initially, there was yellowing of young leaves and apical meristem, followed by various necrotic spots along the entire adaxial face of leaves, making them leathery and tanned, culminating in apical meristem necrosis (Figure 2i). In some intermediate leaves, it was possible to observe enlarged spots of yellowish colour, later evolving to a darker colour and acquiring a gelatinous aspect and finally necrosing at the end of the experiment. Other very evident aspects were the suppression of leaf limb growth, resulting in deformed, wilted leaves with an abnormal downward curvature (epinasty). Among the treatments, Ca omission was responsible for the lowest root growth, which became blackened and rotted (Figure 2j). Ca deficiency greatly reduced the vegetative development of broccoli plants, showing very small, stunted plants with a very small number of leaves, which also caused a drastic decrease in size.
Plants showed initial symptoms of Mg deficiency at 32 DAT with the nutrient solution prepared without this nutrient (Table 2). The mature leaves of the middle and lower third of the plants acquired a lighter green colour, so that only the edges of the ribs kept the normal green colour (Figure 2k). There was a large increase in leaf size which, due to intense withering, had a flaccid appearance (Figure 2l). After one week, the internerval region of old leaf blades showed intense yellowish spots and the ribs acquired a greenish grey colour. Old leaves became leathery and chlorotic spots turned white, followed by the death of leaf tissues.
The -S treatment plants manifested the initial symptoms of S deficiency at 24 DAT (Table 2). There was a small decrease in plant height and leaf number and size when compared to the CS treatment. There was also the appearance of some elongated and yellowish spots on young leaves (Figure 2m,n). In the root system, no differences were observed in relation to the control treatment.

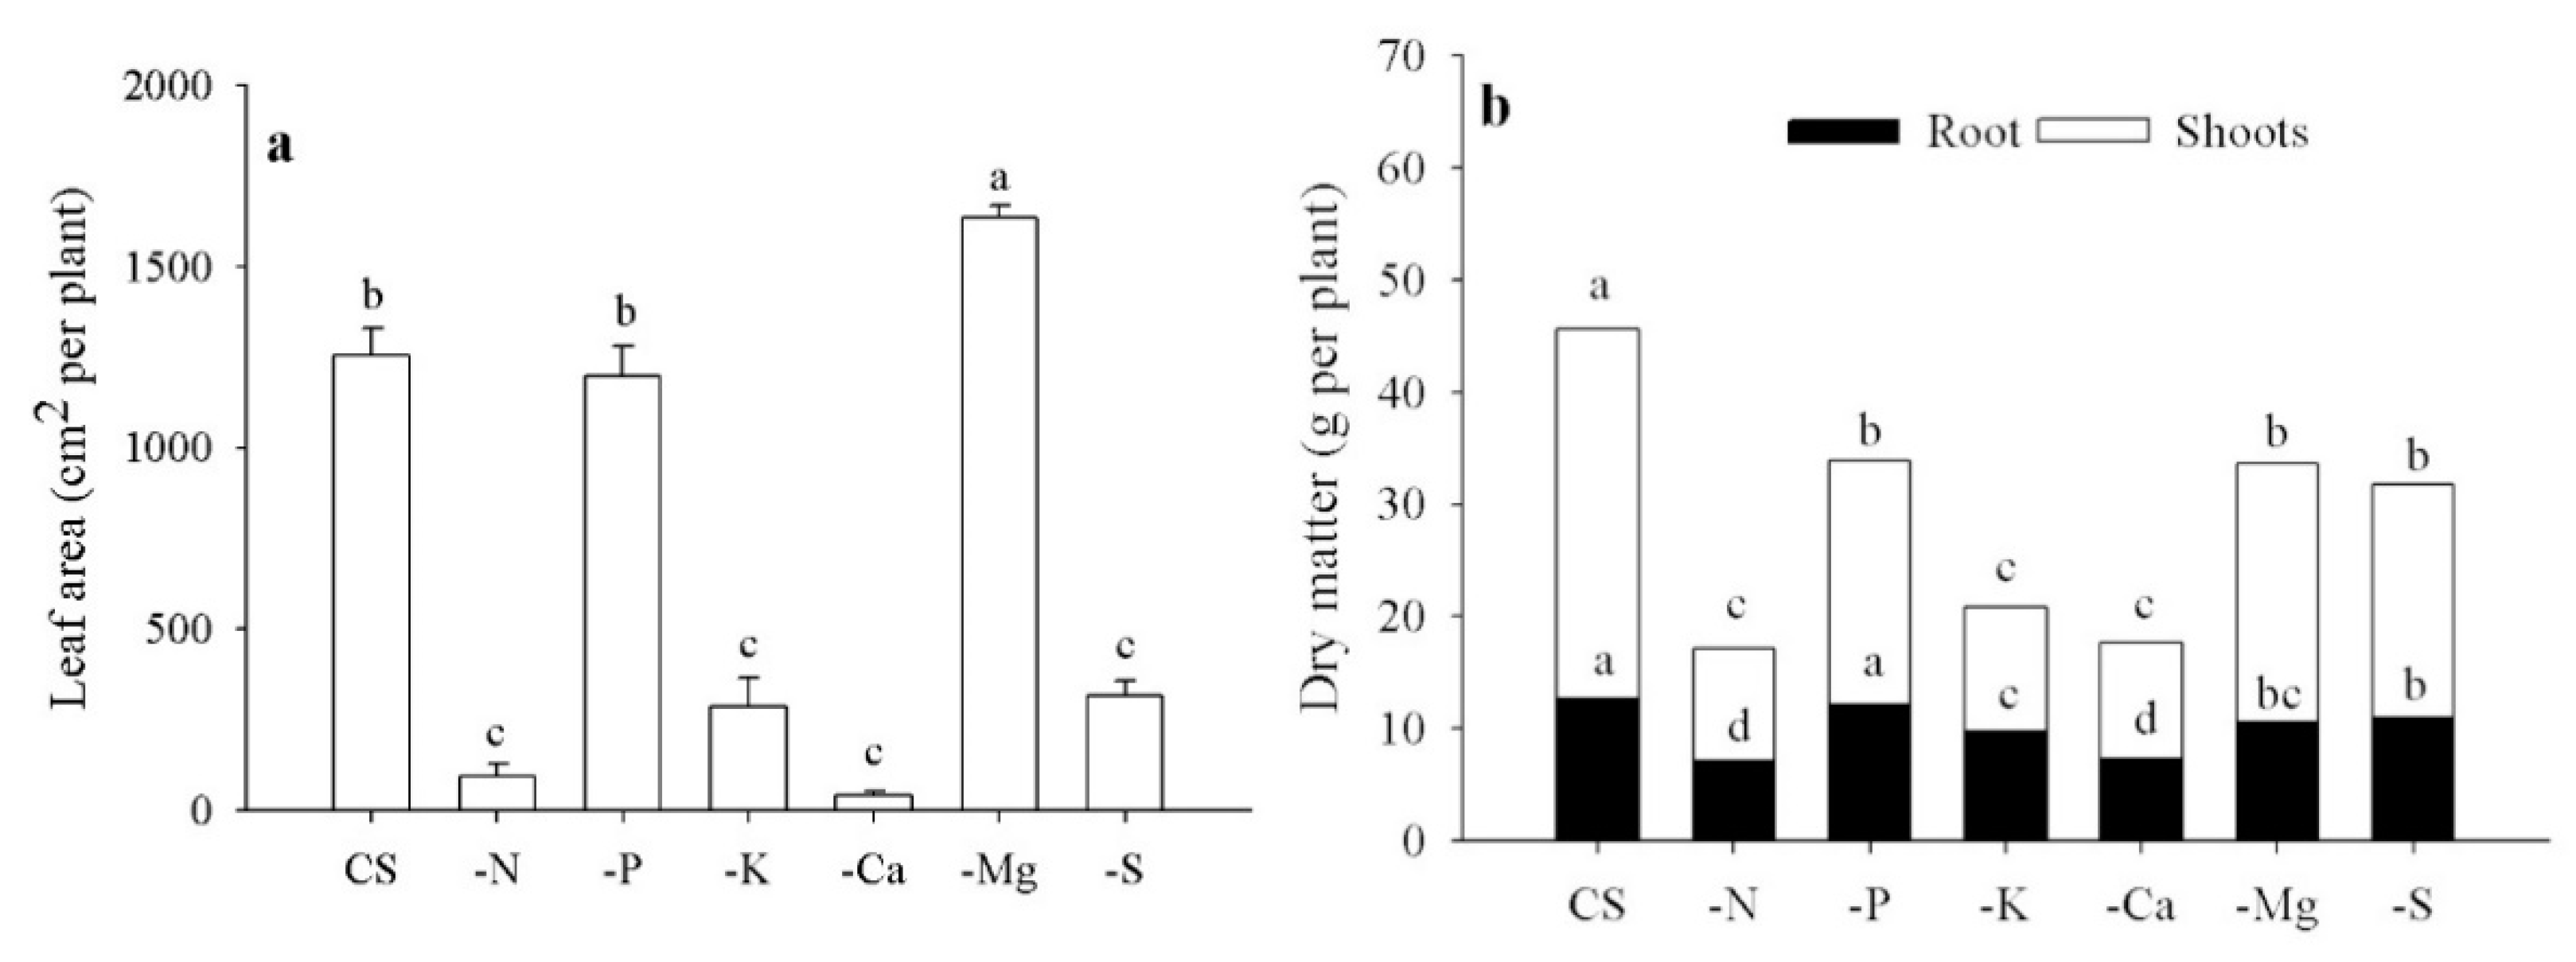
3.2. Growth Evaluations and SPAD Readings

N-omission treatment broccoli plants showed an increase in plant height up to 15 DAT, three days after the onset of deficiency symptoms. It was 52% lower than the height of CS plants (Table 2). Shortly thereafter, the growth slowed down until the end of the experiment. Similarly, the omission of Ca in the nutrient solution increased plant height only up to 18 DAT, i.e., one day after the onset of deficiency symptoms, which led to a considerable difference in relation to the control. In the K omission treatment, although plant height was not affected as drastically as in the N and Ca omission treatments, the deceleration started as early as five days after the symptoms of deficiency manifested. At this moment, the plants were 10.0 cm smaller than CS plants (Table 2). On the other hand, broccoli plants grown in the absence of S, Mg and P, even after the onset of deficiency symptoms, at 24, 32 and 32 DAT, respectively, increased in height until the end of the experiment. However, this trait was lower in these treatments compared to the CS treatment (Table 2).
Regarding the total number of fully developed leaves, broccoli plants were the most affected in the absence of Ca and N. The maximum values were obtained at 16 and 17 DAT, respectively, with about four leaves less than in CS plants evaluated in the same period (Table 2). Although the difference is minimal, it is interesting to note that plants in the N omission treatment, even when showing symptoms of deficiency, continued to produce more leaves, while plants grown without Ca in the solution ceased to produce leaves one day before symptom visualisation. Under the omission of K, a similar behaviour was observed for plants grown in the absence of Ca. The plants ceased leaf production one day before symptoms were observed in this treatment, but the difference observed in relation to CS plants at 21 DAT was only one leaf (Table 2).
Similar to what was observed for plant height under the omission of S, the number of leaves increased steadily up to 38 DAT, even with deficiency symptoms being noted 14 days before and in the new leaves of plants (Figure 2n). However, at the end of the experiment, the plants of this treatment had about 13% fewer leaves than the CS plants (Table 2). On the other hand, the maximum number of leaves in plants cultivated under the omission of P and Mg was reached on the same day as the visualisation of symptoms of nutritional deficiency, i.e., 32 and 31 DAT, respectively, reaching 16 leaves (Table 2).
The regression study showed that the SPAD readings decreased steadily once the -N treatment was applied. The maximum value was verified in the first evaluation (Table 2). On the other hand, in the Ca and K omission treatments, the maximum SPAD readings of broccoli plants was obtained before the onset of symptoms, at 14 and 21 DAT, respectively. It was 24% and 37% higher than CS plants on these evaluation days. In the case of the P omission treatment, even manifesting deficiency symptoms at 32 DAT, there was an increase in SPAD readings until the end of the experiment, which were very close to those obtained in CS plants (Table 2). In plants grown under the omission of Mg, the SPAD readings did not vary after the manifestation of deficiency symptoms.
Leaf areas of plants treated with N, K, Ca and S omission decreased by 92%, 77%, 96% and 75%, respectively, compared to CS plants. However, in the absence of Mg, the leaf area of broccoli increased approximately 30%, and the leaf area of plants under P omission did not differ from CS plants (Figure 3a).
Root dry matter production decreased in all broccoli plants under macronutrient omissions, except for P omission (Figure 3b). Plants under omissions of N and Ca showed the greatest reductions in root growth, i.e., 43% in both treatments compared to CS plants, followed by the -K (23%), -Mg (17%) and -S (13%) treatments. The treatments -N, -K and -Ca had the least dry matter of broccoli shoots, i.e., 70%, 66% and 68%, respectively, compared to CS, followed by the treatments -P (34%), -Mg (30%) and -S (36%).

3.3. Macronutrient Content and Accumulation

The highest N contents in shoots were found in plants grown under P and K omission, while the lowest value was observed in the -N treatment (Table 3). The treatments -Ca, -Mg and -S had no significant effects on the N content in shoots. On the other hand, the N content in broccoli roots decreased when cultivated in the absence of Ca and N, showing decreases of 83% and 48%, respectively, compared to the found in CS plants, while Mg omission increased by 25% and the absence of P increased the N content in roots by 16%.
The highest P levels in shoots were found in broccoli grown in the absence of K, concentrating twice as much P than in CS plants (Table 3). In addition to the omission of K, the omissions of N, Ca, Mg and S also showed an increase in leaf contents of P, but to a lesser extent. In the roots of broccoli plants, P levels decreased in the absence of any of the macronutrients in the nutrient solution, mainly in the treatments -N, -P and -Ca. The decrease in the K content in shoots was caused by the omission of all macronutrients. The most severe omissions were K and N. In root tissues of broccoli plants grown under Mg, P, S and N omission, K increased by 64, 64, 56 and 30% and, in the -Ca and -K treatments, the values decreased by 84% and 55%, respectively (Table 3).
The highest levels of Ca in shoots were presented by plants that received the treatments -K, -Mg and -S, with increases greater than 27%, while plants of the -Ca treatment presented a drastic decrease in the leaf content of the nutrient in comparison to the CS treatment. N and P omissions had no significant effects on the Ca content in shoots. In roots, all macronutrient omission treatments caused a decrease in Ca levels. Mg in shoots, as well as in roots of plants cultivated with the -Ca treatment, increased by 41% and 55% compared to the CS treatment, respectively, while the -Mg and -S treatments caused reductions in the content of this macronutrient in both evaluated parts. The content of S in shoots did not vary with the treatments -N, -P and -K, but the omission of Mg, Ca and S themselves reduced the levels of this macronutrient. In roots, the S content increased when plants were cultivated under P omission, while this nutrient decreased in the -K, -Ca and -S treatments when compared to the CS treatment.
The accumulation of N, P, K, Ca, Mg and S in CS plants was 1417.9, 256.6, 1938.3, 889.5, 212.1 and 230.8 mg per plant, respectively. Under the individual restriction of each of the macronutrients, the accumulation was -N = 239.9, -P = 93.7, -K = 311.7, -Ca = 39.9, -Mg = 49.7 and -S = 43.5 mg per plant, i.e., 83.1%, 64.0%, 84.0%, 96.0%, 77.0% and 81.1% less accumulation in plants deficient in N, P, K, Ca, Mg and S, respectively. Considering the accumulation of macronutrients in the whole plant, the omissions of N, K, Ca and S decreased the accumulation of all evaluated macronutrients (Table 4).
There were no differences in N accumulation in the whole plant, as well as in broccoli shoots, among plants cultivated in the CS treatment and in the -P and -Mg treatments. However, the results showed a marked decrease in N accumulation in broccoli of the treatments -N, -Ca and -K (83%, 70% and 49%, respectively), compared to the amount accumulated in the CS treatment (Table 4). In roots, besides the omissions of P and Mg, the omission of S did not differ from CS plants as to the accumulation of N.
The accumulation of P in the whole plant and in broccoli roots decreased with the omission of macronutrients. The plants cultivated in -P, -N and -Ca accumulated N the least. Regarding the accumulation of P in shoots, there were no differences between the CS and the plants cultivated in the treatments -Mg, -K and -S, which presented greater nutrient accumulation in plants. Macronutrient omission treatments also caused a decrease in K accumulation in broccoli plants, specifically in their shoots (Table 4). The results show that the decrease was marked when plants were submitted to Ca (76%), N (84%) and K (87%) omission. In roots, the accumulation of K increased when the plants were deprived of P, Mg and S. However, in the treatments -N, -K and especially -Ca, there was a decrease in the accumulation of K.
Restrictions of any macronutrient in the nutrient solution also limited the accumulation of Ca in broccoli plants. Similar behaviour was also observed in roots, especially in plants of the treatments -N and -Ca. Evaluating the effects of macronutrient omission, specifically in shoots, the treatments -Mg, -S and -P did not change the accumulation of Ca. However, the accumulation of this macronutrient decreased when plants were cultivated in the absence of K, N and Ca alone. Mg and S accumulation in broccoli plants, as well as in shoots, was lower with the omission of any macronutrient in the nutrient solution. In roots, only the treatments -S, -N and -Mg reduced the accumulation of Mg and, as for the accumulation of S in roots, there was no difference between CS and -P plants. However, in the other treatments, the accumulation of S decreased.

3.4. Efficiency Indexes
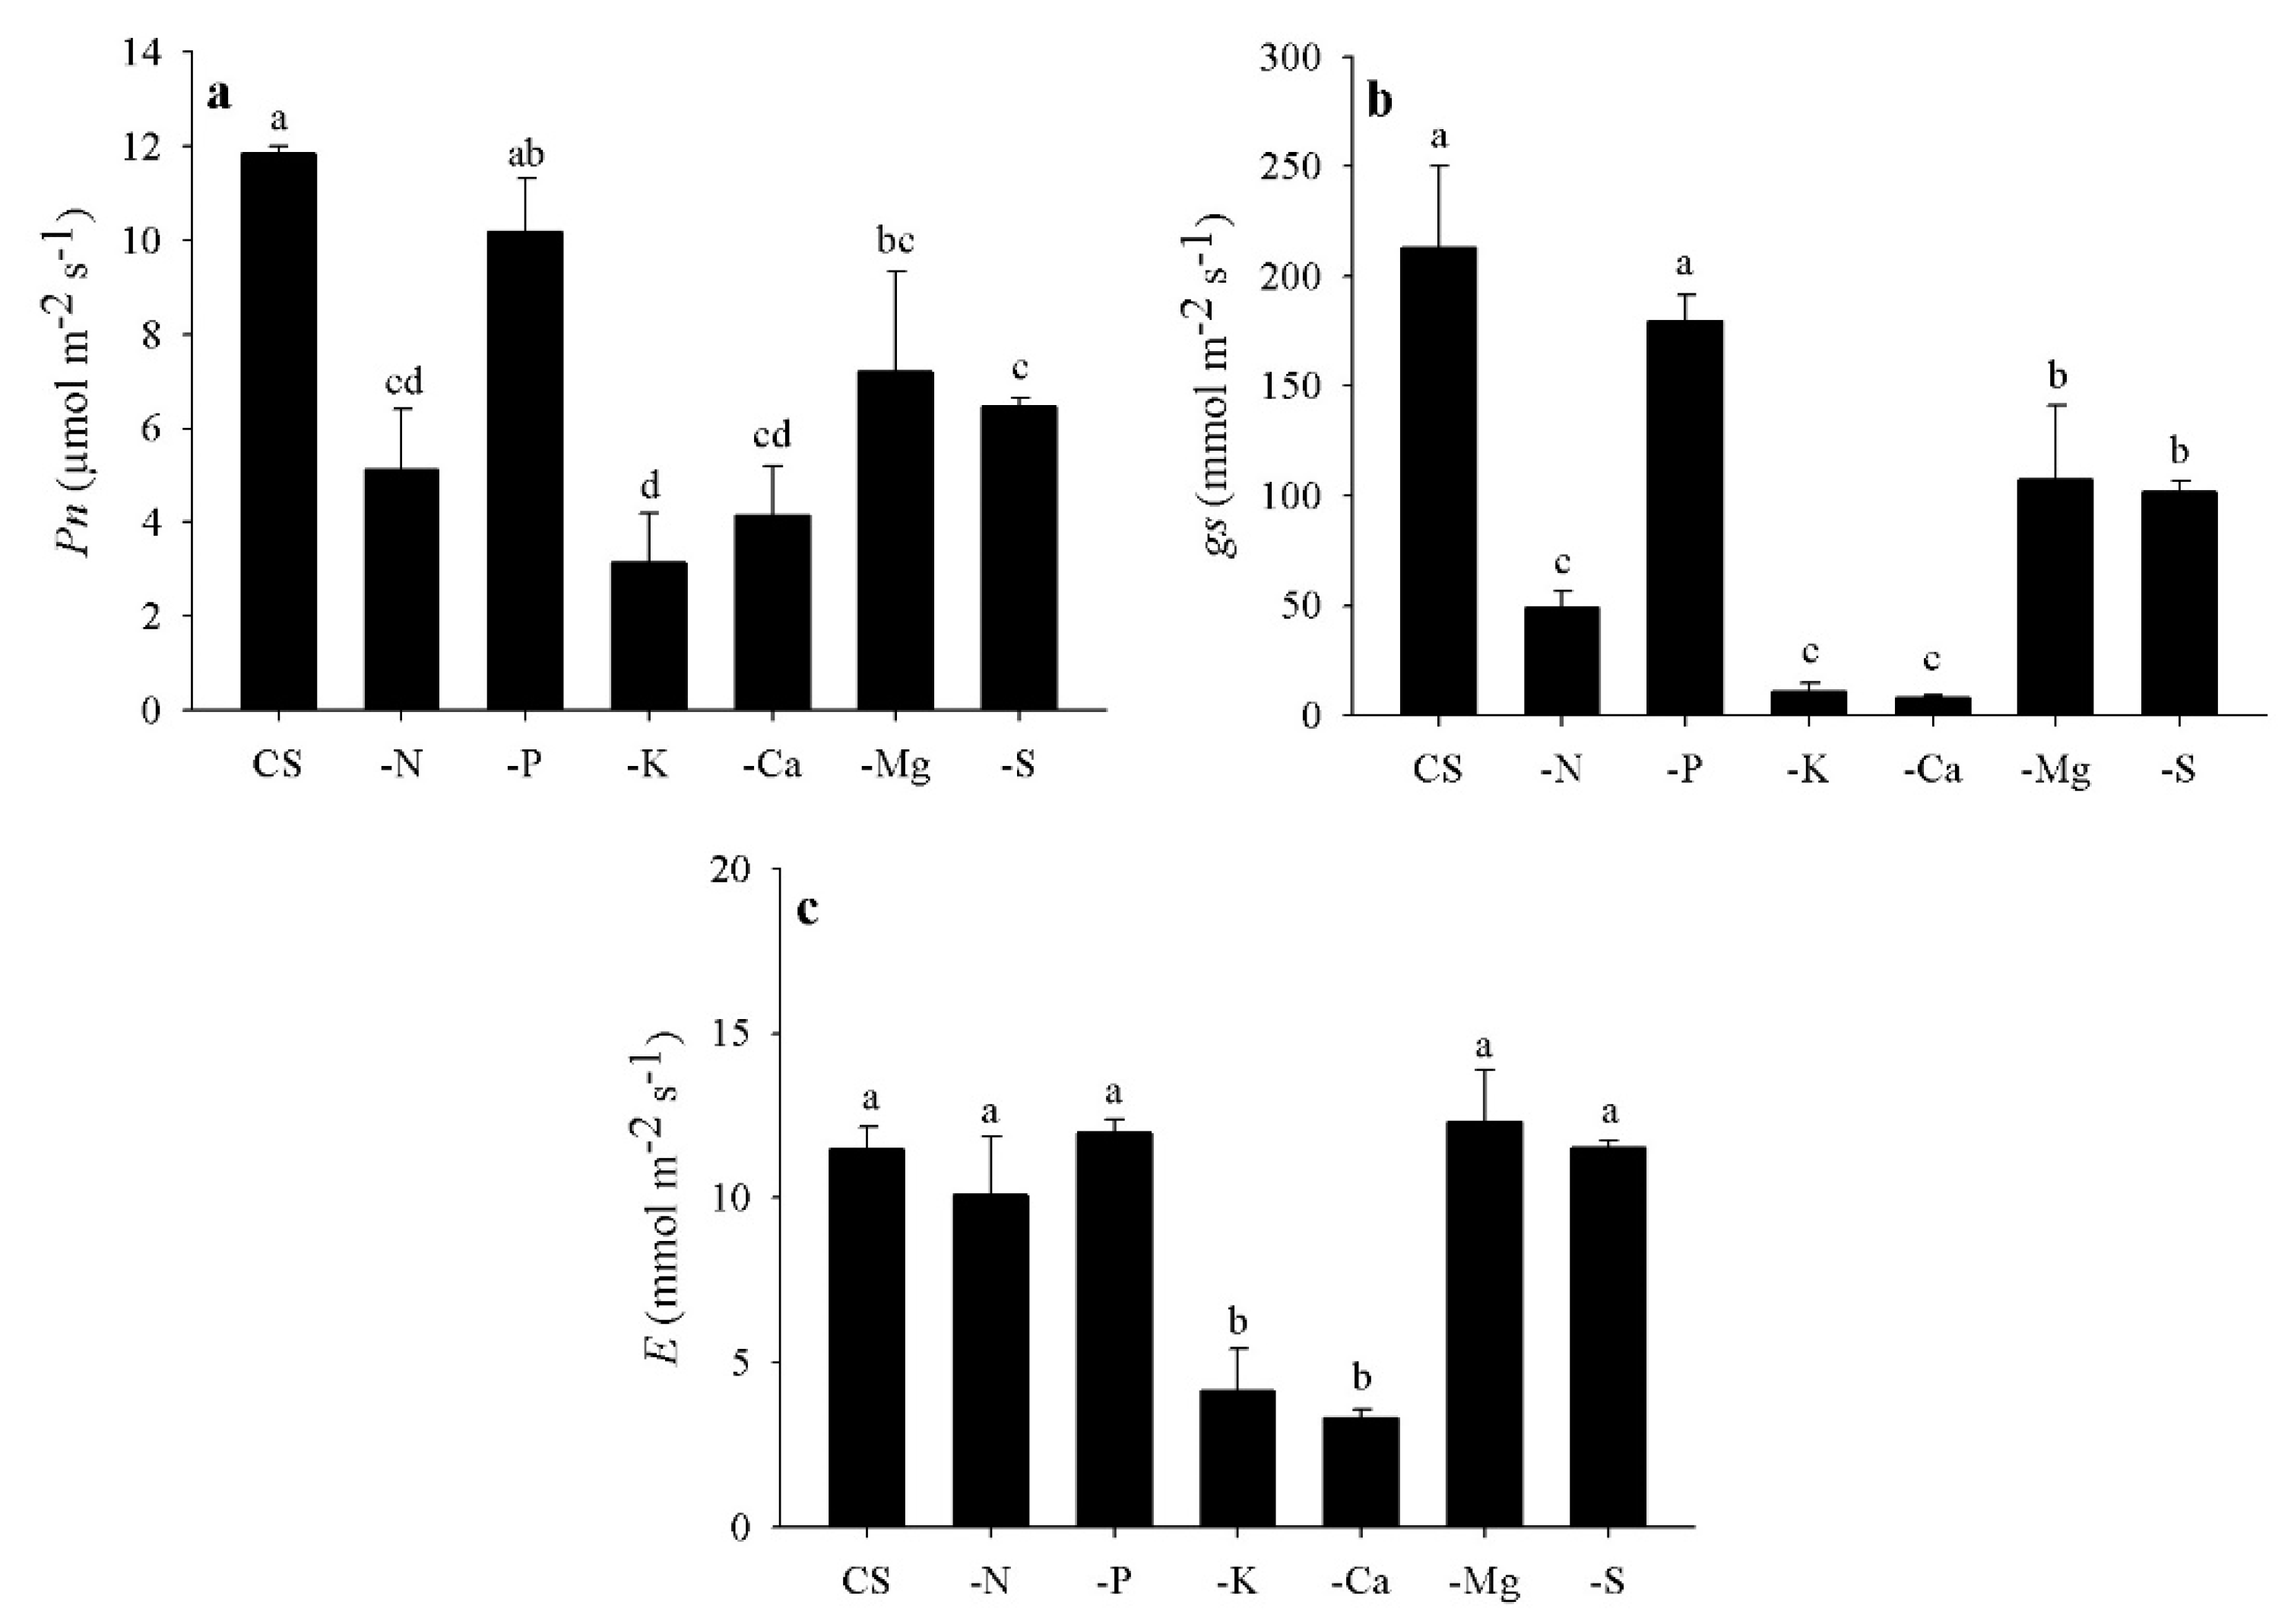
The efficiency of N uptake was not affected by the -P and -Mg treatments. However, plants grown under -N, -Ca and -K omission absorbed N the least (Table 5). P, K and S absorption decreased in all treatments with no macronutrients in the nutrient solution. Thus, compared to the plants of the CS treatment, there were decreases in P uptake ranging from 9% (-K treatment) to 67% (-P treatment); for K, from 25% (-Mg treatment) to 83% (-K treatment); and for S, the decreases ranged from 27% (-P treatment) to 79% (-S treatment). The absorption efficiency (AE) of Mg decreased in most treatments, except for the -Ca treatment. A similar behaviour was observed for the -Mg treatment in relation to Ca absorption; this was the only treatment where no significant differences were observed in relation to the control.
There was a 20% increase in N transport in plants under Ca omission compared to CS plants (Table 5). In the -Ca treatment, more than 90% of the absorbed N was transported to the shoots. However, with the omission of other macronutrients, there were reductions of up to 70% in the transport of N absorbed by roots to shoots. In the treatments -N, -K, -Ca and -Mg, the percentage of P transported to shoots was 10, 12, 25 and 8% higher than that obtained in plants of the CS treatment, respectively. However, there was no difference in P transport between plants grown in CS and those of the -P and -S treatments.
K transport increased in plants grown without Ca, so that more than 90% of K was transported to shoots, which is equivalent to 8% more than in CS plants (Table 5). Plants cultivated with the treatments -N, -K, -P, -S and -Mg decreased by 32, 26, 24, 19 and 16% the TE of K from roots to broccoli shoots, respectively. The TE of Ca increased in the -S, -Mg and -P treatments compared to control plants. However, there was no difference in the TE of Ca between CS and plants cultivated in the absence of Ca, K and N. Regarding Mg transport in broccoli plants, only the omission of S did not reduce it. The lowest Mg transport occurred in plants deficient in K and Ca. Thus, Mg transport was about 14%, 9%, 21%, 17% and 11% lower in plants grown with solutions without N, P, K, Ca and Mg, respectively, compared to CS plants. S translocation decreased with the absence of any macronutrient in the nutrient solution.
The use efficiency (UE) of a given nutrient suggests the ability of a plant to use the absorbed mineral for growth or biomass production. Table 5 shows that the UE of omitted macronutrients, except for the omission of N, was higher than that found for CS plants, since the UE of P, K, Ca, Mg and S was about 63%, 54%, 225%, 128% and 154% higher for the treatments -P, -K, -Ca, -Mg and -S, respectively. On the other hand, all treatments presented a lower nutrient UE, except for the omitted nutrient, compared to plants grown in the control solution.

3.5. Gas Exchange

The -N, -K and -Ca treatments caused the lowest values of Pn and gs, with reductions exceeding 50% compared to CS plants (Figure 4a,b). With the omission of Mg and S, the decreases were less marked for these variables. On the other hand, plants grown in the absence of P did not alter their gas exchange. Regarding E, plants deficient in K and Ca, when compared to CS plants, showed reductions of 63% and 71%, respectively. In other macronutrient omissions there were no differences from CS plants (Figure 4c).

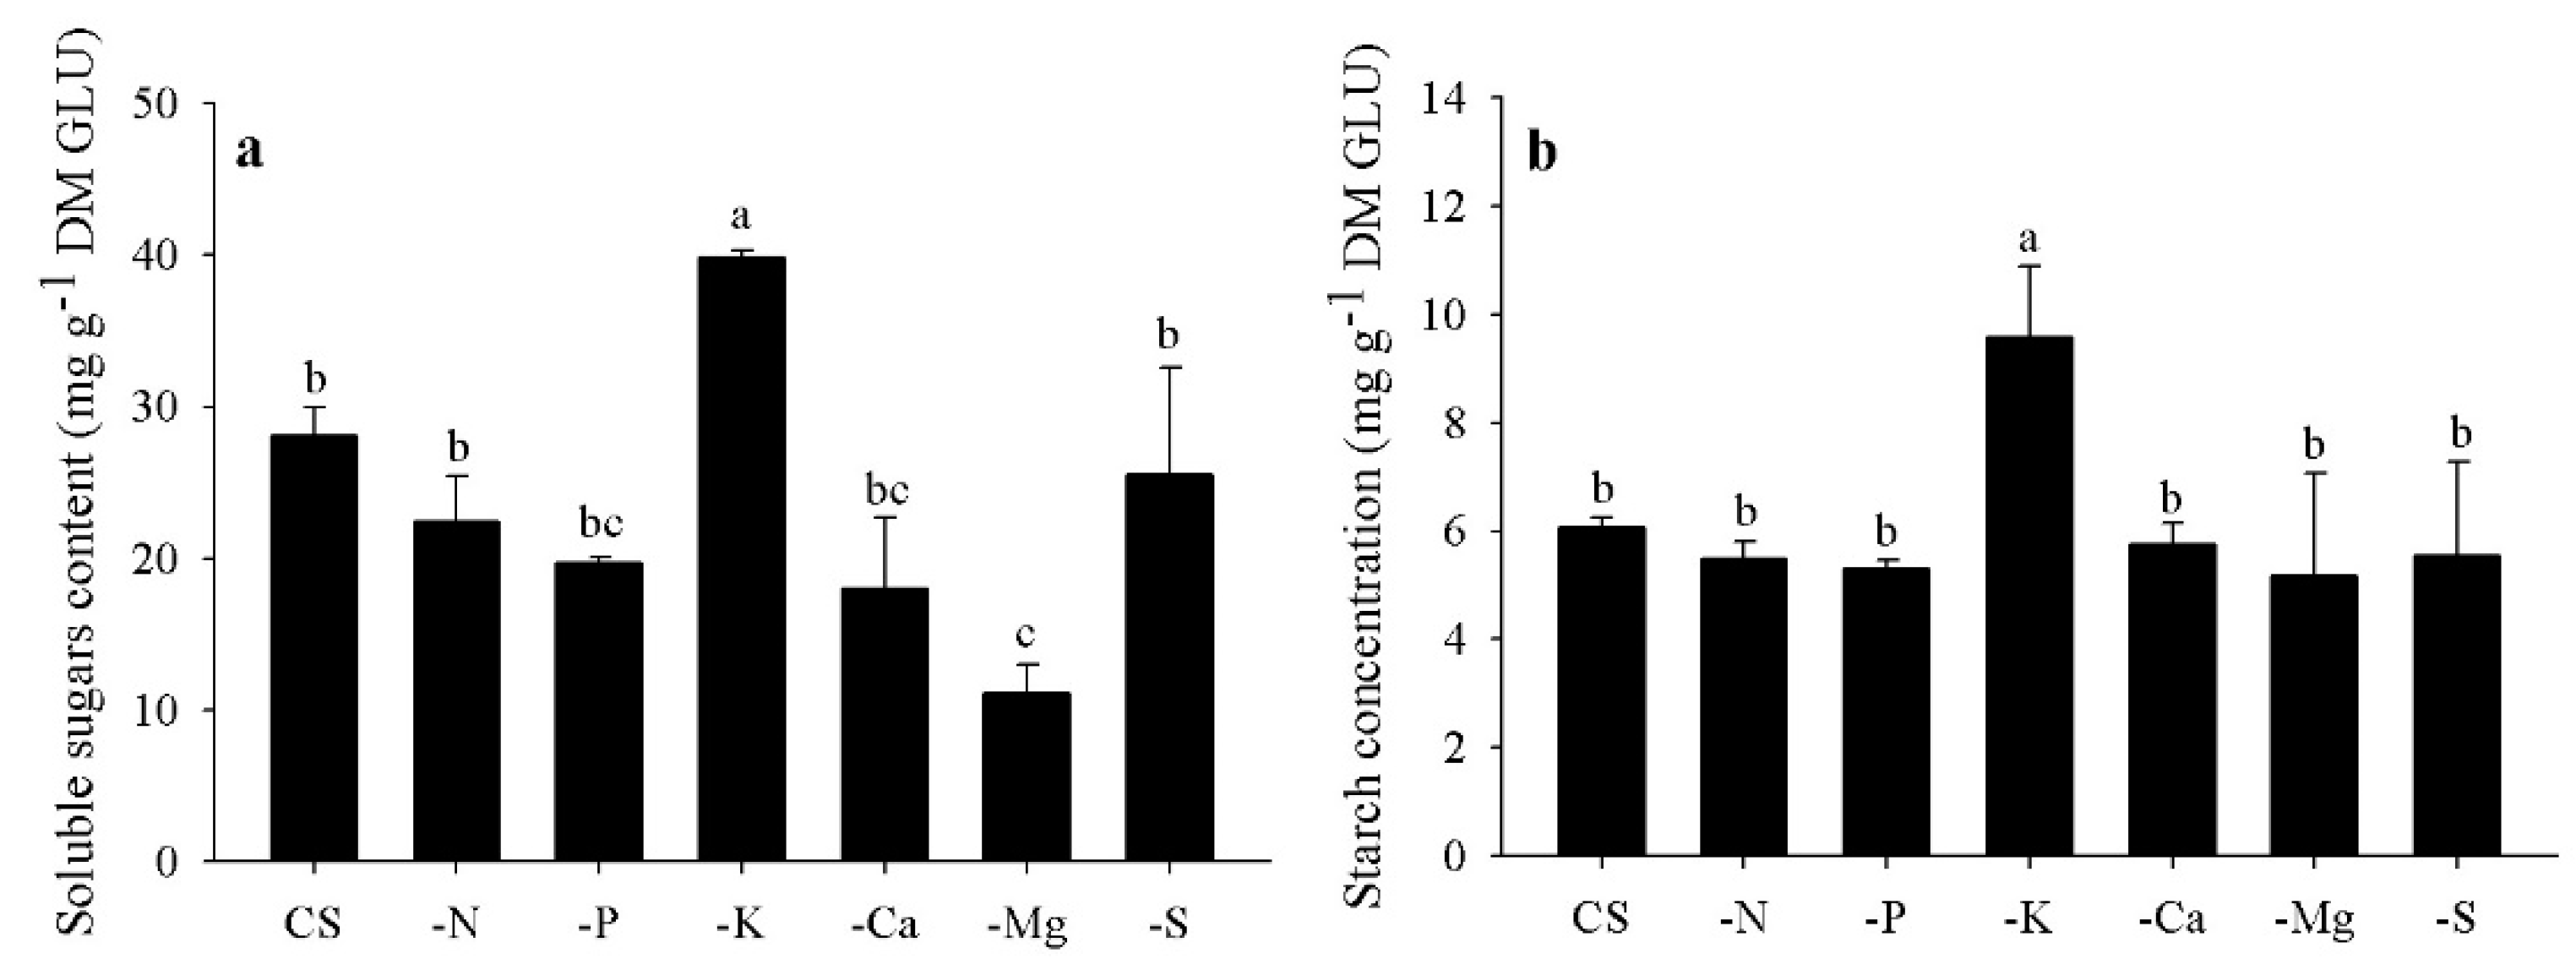
3.6. Starch and Soluble Sugars (SS) Contents

The SS content of broccoli plants was influenced by the -Mg treatment. There was a decrease by more than 60% in the content of this biochemical compound compared to CS plants (Figure 5a). On the other hand, the omission of K resulted in a 40% increase in SS content and a 60% increase in starch content in relation to the CS treatment (Figure 5b). However, the other treatments had no effect on the content of these compounds.

4. Discussion

In the present study, the omission of nutrients in broccoli plants allowed the characterisation of symptoms of macronutrient deficiency, with significant effect (p ≤ 0.05) at the biometric (growth), biochemical and physiological levels, which finally led to a visual manifestation (Figure 2). Although there are many reports in the literature regarding the effects of nutrient deficiency on plants and although there is consensus on their characteristics [3,21], expression may vary depending on the conditions of the plant’s surroundings [8] or on the species studied [2,22]. Thus, for example, symptoms of K deficiency began in older leaves of plants with internerval chlorosis and there was chlorosis in the leaf limb margins only at the end of the experiment. In cucumber plants, this trait is identified in leaves of the middle third within days of omitting K from the nutrient solution [8].
N deficiency in leaf tissues may cause proteolysis with a consequent redistribution of amino acids, resulting in chloroplast degradation and decreased chlorophyll content, as demonstrated by the reduction of SPAD readings in plants under N omission (Table 2). This supports the efficiency of this method (chlorophyll meter-SPAD) for the indirect assessment of the nutritional status of N in broccoli plants, as reported for other species [23,24]. However, more work should be done to validate and better understand this correlation considering different environmental exposure conditions [25]. Yellowing and purple staining are also observed in N-deficient cauliflower plants [2]. This colouring is a product of the disintegration of chlorophyll molecules and anthocyanin synthesis due to carbohydrate accumulation and inability to form nitrogen compounds in leaf tissues [3].
In addition, the omission of N had a negative effect on Pn and gs (Figure 4a,b). Therefore, the production of photoassimilates was not enough to sustain the proper development of plants, compromising biomass production, plant height, number of leaves, leaf area, dry matter and, consequently, crop yield [3]. It is noteworthy that at 24 DAT, when plants under -N treatment were collected, more than 90% of N was accumulated in leaf tissues [26], indicating a mechanism of plants trying to overcome low N in the plant. However, due to the nutrient’s vital role in physiological and biochemical processes, its deficiency favoured the occurrence of both early symptoms and effects on plant growth.
With the omission of N, as with the other nutrients, there was a total nutritional imbalance of plants (Table 3) because there are different interactions, either synergistic, antagonistic or null, in the absorption of nutrients by roots and their distribution within the different organs of plants [7]. Thus, with the omission of N, there was an increase in P content in shoots and a decrease of N in roots. The opposite was observed for the K content, showing that the lack of a certain element may cause deficiencies or excesses of other elements [2,7]. This was corroborated by the decrease in the AE of all nutrients evaluated in plants of the -N treatment in relation to the CS treatment (Table 5). The AE indicates the ability of the plant to absorb or extract nutrients from the nutrient solution.
Ca supports the structural function of the cell wall by forming Ca-pectate complexes in the middle lamella, and thus strengthens cellular tissues. It also plays roles in cell division and stretching [21]. Thus, its deficiency affected both root and shoot growth (Figure 3), with evident loss in nutrient absorption capacity (Table 5), and accumulation in the plant (Table 4). Next, N omission was the treatment that most restricted plant height and number of leaves (Table 2). Ca and N preferentially accumulate in the leaf tissues of broccoli plants [26]. However, in the case of deficiency, Ca was not redistributed to other organs; symptoms of meristematic tissue deficiency appeared (Figure 2i,j). These results reflect the low efficiency of broccoli plants in absorbing and transporting; however, in Ca deficiency, there was an increase in the efficiency of using Ca in relation to other omissions and to the control treatment (Table 5), besides the nutritional disturbances caused by nutrient deficiency.
K participates directly in the metabolism of N in plants either by the synthesis and/or by activation of enzymes such as nitrate reductase, which catalyses the reduction of nitrate into nitrite to be later transported to chloroplasts, where it is reduced into ammonium [27]. This probably explains the 47% increase in N content in the shoots of broccoli plants submitted to K omission in the solution (Table 3). With the inhibition of enzymatic activity involved in N reduction necessary for protein synthesis, there was an increase in the content of soluble nitrogen compounds, such as putrescins. These compounds are toxic and may cause leaf tissue necrosis (Figure 2h).
Associated with the decrease observed for gas exchange as well as the accumulation of soluble sugars and starch (Figure 4 and Figure 5), changes in the K content altered the metabolism and transport of photoassimilates, causing reductions in photosynthesis, not only through the mechanism of stomata, but also by inhibiting Rubisco activity [9]. Consequently, K deficiency further modified assimilate partitioning by altering the content of metabolites in broccoli tissues (Figure 5). According to Gerardeaux et al. [28], this accumulation of sugars in plants may be a strategy to prevent the loss of cell turgor, thus compensating for the effects of nutrient deficiency. On the other hand, inhibition of basipetal translocation of sugars via phloem in K-deficient plants imposes constraints on root growth of plants ([29], Figure 3b), where the -K treatment was responsible for a 23% decrease in production of root dry matter compared to control plants. However, this effect on root growth did not cause such drastic effects on plant height and leaf number as in the -Ca treatment (Table 2).
Maybe the absence of K and Ca caused the greatest disturbance. These treatments reduced the efficiency translocation and absorption of the other macronutrients in the absence of these nutrients in the solution in relation to the control treatment (Table 5). K and Ca participate as enzymatic cofactors in osmotic regulation and control of cell membrane permeability, and thus in the establishment of turgor and cellular electroneutrality [3]. Thus, stomatal movements are regulated by the cell turgor of guard cells, which manifested by a significant decrease in leaf gas exchange due to the lack of minerals ([27], Figure 4).
P was the least accumulated nutrient in the shoots of broccoli CS plants (Table 4). Its omission in the solution caused fewer drastic growth losses as observed for the -N, -K, -Ca and -S treatments. It was the last treatment to manifest symptoms of deficiency, along with the -Mg treatment (Table 2; Figure 3). This was attributed to the low nutrient requirement at the vegetative stage of cultivation [26] and its high mobility within the plant [21], which in turn explains the symptomatology described for older leaves (Figure 2f). However, these results contrasted with those found by other studies on lisianthus [29] and cauliflower [2], where P deficiency caused a severe decrease in plant growth, which may be related to the different mechanisms used by these plants to cope with abiotic stress conditions [7]. Thus, the increase in P efficiency indexes may be paramount to avoid damage to the plant photosynthetic system, as was the case of -P treatment plants (Table 5), in which both the TE and UE of nutrients were high due to P deficiency, preventing the decrease in gas exchange (Figure 4) and, therefore, better supporting the growth of plants.
Mg and S were the least accumulated macronutrients in both roots and whole CS broccoli plants (Table 4); however, they were the nutrients that showed greater efficiency of use when they were omitted from the solution, together with Ca, which suggested a way for the plant to try to adapt to stress [6]. The omission of both affected leaf gas exchange (Figure 4) and plant growth similarly, except for leaf area, where the -Mg treatment was much less restrictive (Table 2; Figure 3). This can be attributed to its high mobility, since about 80% of the Mg present in plants is found in the phloem [21]. As in the -N treatment, leaf chlorosis caused by the omission of Mg was attributed to decreased chlorophyll synthesis and chloroplast disruption ([30], Figure 2k). However, in this case, the decrease in SPAD readings of broccoli leaves was not as drastic as in the -N treatment (Table 2).
Mg deficiency adversely affects the Rubisco involved in the fixation of CO2, which may explain the reduction in the photosynthesis rate [31]. In the literature, there are reports of the most destructive effect of Mg deficiency on leaf sugar accumulation, affecting plant growth, photosynthetic activity and leaf morphology [31,32], as verified in the present study with the reduction of the content of total soluble sugars in the leaves, where the -Mg treatment yielded a larger leaf area compared to the other treatments (Figure 3a).
On the other hand, there are reports in the literature where Mg-deficient plants tend to concentrate sugars in leaf tissues as a product of poor carbohydrate partitioning within plants [33]. However, contrasting behaviour was found in the present work (Figure 5). According to Guo et al. [34], Mg deficiency in plants results in the interruption of sucrose loading in the phloem, which implies the accumulation of carbon in the source leaves. A decline in the concentration of Mg-ATP at phloem loading sites may be the main reason for inhibiting sucrose transport from source leaves and is analogous to sucrose accumulation in leaves under K deficiency.
As mentioned earlier, the deficiency of one nutrient may cause an imbalance in other nutrients in the plant, such as in the -Mg treatment, where P was about 27% more concentrated in broccoli plant shoots grown under Mg omission than in control plants. This may be one of the reasons for the inhibition of carbohydrate synthesis in leaf tissues [21].
Regarding the omission of S, the dry matter of shoots of the cultivated plants was lower compared to the CS plants. A smaller leaf area was also observed (Figure 3a,b). Added to this, there was less growth of the plant shoots (Table 2). Similar results were obtained by Cavalcante et al. [6] working with the omission of macronutrients in watermelon. These results support this study’s results because S deficiency is more drastic in plant shoots because the cell walls and chloroplasts are composed of sulpholipids, which can be shown by a reduction in Pn and gs (Figure 4). In addition, there was a nutritional imbalance in the whole plant (Table 4) and in the nutritional efficiency indexes (Table 5). However, no changes were found for the content of soluble sugars and starch under the omission of S, as observed by Lunde et al. [35]. These authors associated the general decrease in monosaccharides with a general reduction in photosynthesis and excess starch accumulation in stressed plants. Possibly, at the time of evaluation, S deficiency had not influenced biochemical activity.
Based on these results, N, K and Ca are the most required macronutrients by broccoli plants. In this sense, the extraction of macronutrients in the whole CS plant followed decreasing order: K > N > Ca > P > S > Mg; in shoots, K > N > Ca > S > Mg > P; and in roots, N > K > Ca > P > Mg > S. Also, from the results obtained in CS plants, we found that the macronutrients N (75.9%), P (51.7%) K (85.3%), Ca (74.0%), Mg (71.4%) and S (79.6%) are preferably transported and accumulated in the shoots of broccoli plants.

5. Conclusions

The omission of macronutrients causes several changes in the photosynthetic apparatus and in the nutritional balance of broccoli plants. There is an evident effect on carbohydrate partitioning, which is reflected in biomass production capacity and manifestation of visual deficiency symptoms. N, K and Ca are the nutrients that cause the most critical and early recognisable damage to plants. The omission of K and Ca provided a drastic reduction in gas exchange and had a negative effect on the translocation efficiency of macronutrients, which indicates that there is a relationship between these two nutrients that is important for the nutritional balance in broccoli plants. Special attention should be paid to Ca in broccoli plantations, as the plants were highly sensitive to this deficiency with reduced growth 1 d after the appearance of the first symptoms of deficiency.

Author Contributions

Conceptualization, H.J.d.A., R.d.M.P. and A.B.C.F.; Data curation, H.J.d.A., B.M.M.N.B. and R.A.F.; Formal analysis, H.J.d.A. and V.M.V.C.; Investigation, H.J.d.A., B.M.M.N.B. and R.A.F.; Project administration, H.J.d.A.; Funding acquisition, H.J.d.A.; A.B.C.F.; R.d.M.P. and M.M.; Validation, H.J.d.A. and A.B.C.F. and R.d.M.P.; Visualisation, V.M.V.C. and V.S.C.; Writing—original draft, V.M.V.C. and V.S.C.; Writing—review & editing, H.J.d.A., A.B.C.F.; V.M.V.C. and V.S.C. All authors have read and agreed to the published version of the manuscript.

Funding

This research received no external funding.

Acknowledgments

We thank to CNPq for the scholarship to the first author.

Conflicts of Interest

The authors declare no conflict of interest.

References

  1. FAO; ITPS. Status of the World’s Soil Resources (SWSR)—Main Report. Food and Agriculture Organization of the United Nations and Intergovernmental Technical Panel on Soils. 2015. Available online: http://www.fao.org/3/a-i5228e.pdf (accessed on 13 March 2015).
  2. Bianco, M.S.; Filho, A.B.C.; Carvalho, L.B. Nutritional status of the cauliflower cultivar ‘Verona’ grown with omission of out added macronutrients. PLoS ONE 2015, 10, 1–17. [Google Scholar] [CrossRef] [PubMed] [Green Version]
  3. Taiz, L.; Zeiger, E.; Moller, I.M.; Murphy, A. Fisiologia e Desenvolvimento Vegetal; Artmed: Porto Alegre, Brazil, 2017; p. 889. [Google Scholar]
  4. Schjoerring, J.K.; Cakmak, I.; White, P.J. Plant nutrition and soil fertility: Synergies for acquiring global green growth and sustainable development. Plant Soil 2019, 434, 1–6. [Google Scholar] [CrossRef] [Green Version]
  5. Berry, W. Symptoms of deficiency in essential minerals. In Plant Physiology Online; Taiz, L., Zeiger, E., Eds.; The American Society of Plant Biologists: Rockville, MD, USA, 2016; Available online: http://6e.plantphys.net/topic05.01.html (accessed on 3 October 2016).
  6. Cavalcante, V.S.; Prado, R.M.; Vasconcelos, R.L.; Almeida, H.J.; Silva, T.R. Growth and Nutritional Efficiency of Watermelon Plants Grown under Macronutrient Deficiencie. HortScience 2019, 54, 738–742. [Google Scholar] [CrossRef] [Green Version]
  7. Bouain, N.; Krouk, G.; Lacombe, B.; Rouached, H. Getting to the root of plant mineral nutrition: Combinatorial nutrient stresses reveal emergent properties. Trends Plant Sci. 2019, 24, 542–553. [Google Scholar] [CrossRef] [PubMed]
  8. Carmona, V.V.; Costa, L.C.; Filho, A.B.C. Symptoms of nutrient deficiencies on cucumbers. Int. J. Plant Soil Sci. 2015, 8, 1–11. [Google Scholar] [CrossRef]
  9. Cavalcante, V.S.; Prado, R.M.; Almeida, H.J.; Cruz, F.J.R.; Santos, D.M.M. Gaseous exchanges, growth and foliar anatomy of sugarcane plants grown in potassium (K) deprived nutrient solution. Aust. J. Crop Sci. 2015, 9, 577–584. [Google Scholar]
  10. Santos, E.F.; Macedo, F.G.; Zanchim, B.J.; Lima, G.P.P.; Lavres, J. Prognosis of physiological disorders in physic nut to N, P, and K deficiency during initial growth. Plant Physiol. Biochem. 2017, 115, 249–258. [Google Scholar] [CrossRef] [Green Version]
  11. FAOSTAT. Database, Crops. 2019. Available online: http://www.fao.org/faostat/en/#data/QC (accessed on 4 April 2019).
  12. Bachiega, P.; Salgado, J.M.; Carvalho, J.E.; Ruiz, A.L.T.G.; Schwarz, K.; Tezotto, T.; Morzelle, M.C. Antioxidant and antiproliferative activities in different maturation stages of broccoli (Brassica oleracea Italica) biofortified with selenium. Food Chem. 2016, 190, 771–776. [Google Scholar] [CrossRef] [PubMed] [Green Version]
  13. Yilmaz, E.; Bagci, P.O. Production of phytotherapeutics from broccoli juice by integrated membrane processes. Food Chem. 2018, 242, 264–271. [Google Scholar] [CrossRef]
  14. Hoagland, D.R.; Arnon, D.L. The Water Culture Methods for Growing Plants without Soil; California Agricultural Experiment Station: Berkeley, CA, USA, 1950; p. 39. [Google Scholar]
  15. Boaretto, A.E.; van Raij, B.; Silva, F.C.; Chitolina, J.C.; Tedesco, M.J.; Carmo, C.A.F.S. Amostragem, acondicionamento e preparo de amostras de plantas para análise química. In Manual de Análises Químicas de Solos, Plantas e Fertilizantes; Silva, F.C., Ed.; EMBRAPA: Brasília, Brazil, 2009; pp. 59–86. [Google Scholar]
  16. Miyazawa, M.; Pavan, M.A.; Muraoka, T.; Carmo, C.A.F.S.; Melo, W.J. Análises químicas de tecido vegetal. In Manual de Análises Químicas de Solos, Plantas e Fertilizantes; Silva, F.C., Ed.; EMBRAPA: Brasília, Brazil, 2009; pp. 191–233. [Google Scholar]
  17. Swiader, J.M.; Chyan, Y.; Freiji, F.G. Genotypic differences in nitrate uptake and utilization efficiency in pumpkin hybrids. J. Plant Nutr. 1994, 17, 1687–1699. [Google Scholar] [CrossRef]
  18. Li, B.; Mckeand, S.E.; Allen, H.L. Genetic variation in nitrogen use efficiency of loblolly pine seedlings. For. Sci. 1991, 37, 613–626. [Google Scholar]
  19. Siddiqi, M.Y.; Glass, A.D. Utilization index: A modified approach to the estimation and comparison of nutrient utilization efficiency in plants. J. Plant Nutr. 1981, 4, 289–302. [Google Scholar] [CrossRef]
  20. Dubois, M.; Gilles, K.A.; Hamilton, J.K.; Rebers, P.A.; Smith, F. Colorimetric method for determination of sugars and related substances. Anal. Chem. 1956, 28, 350–356. [Google Scholar] [CrossRef]
  21. Hawkesford, M.; Horst, W.; Kichey, T.; Lambers, H.; Schjoerring, J.; Moller, J.S.; White, P. Functions of macronutrients. In Marschner’s Mineral Nutrition of Higher Plants; Marschner, P., Ed.; Academic Press: London, UK, 2012; pp. 135–189. [Google Scholar]
  22. Costa, L.C.; Carmona, V.M.V.; Filho, A.B.C.; Nascimento, C.S. Sintomas de deficiências de macronutrientes em melancieira. Commun. Sci. 2017, 8, 80–92. [Google Scholar] [CrossRef] [Green Version]
  23. Pôrto, M.L.; Puiatti, M.; Fontes, P.C.R.; Cecon, P.R.; Alves, J.C.; Arruda, J.A. Índice SPAD para o diagnóstico do estado de nitrogênio na cultura da abobrinha. Hortic. Bras. 2011, 29, 311–315. [Google Scholar] [CrossRef]
  24. Garcez, T.B.; Megda, M.M.; Artur, A.G.; Monteiro, F.A. Production and Spad reading in Marandu palisadegrass fertilized with nitrogen and magnesium. J. Plant Nutr. 2014, 37, 1475–1486. [Google Scholar] [CrossRef]
  25. Xiong, D.; Chen, J.; Yu, T.; Gao, W.; Ling, X.; Li, Y.; Peng, S.; Huang, J. SPAD-based leaf nitrogen estimation is impacted by environmental factors and crop leaf characteristics. Sci. Rep. 2015, 5, 1–12. [Google Scholar] [CrossRef] [PubMed] [Green Version]
  26. Cecílio Filho, A.B.; Carmona, V.M.V.; Schiavon, A.A., Jr. Broccoli growth and nutrient accumulation. Científica 2017, 45, 95–104. [Google Scholar] [CrossRef] [Green Version]
  27. Hasanuzzaman, M.; Bhuyan, B.; Nahar, K.; Hossain, S.; Al-Mahmud, J.; Hossen, S.; Masud, A.A.C.; Fujita, M. Potassium: A vital regulator of plant responses and tolerance to abiotic stresses. Agronomy 2018, 8, 31. [Google Scholar] [CrossRef] [Green Version]
  28. Gerardeaux, E.; Jordan-Meille, L.; Constantin, J.; Pellerin, S.; Dingkuhn, M. Changes in plant morphology and dry matter partitioning caused by potassium deficiency in Gossypium hirsutum (L.). Environ. Exp. Bot. 2010, 67, 451–459. [Google Scholar] [CrossRef]
  29. Chen, C.-T.; Lee, C.-L.; Yeh, D.-M. Effects of nitrogen, phosphorus, potassium, calcium, or magnesium deficiency on growth and photosynthesis of Eustoma. HortScience 2018, 53, 795–798. [Google Scholar] [CrossRef]
  30. Gransee, A.; Führs, H. Magnesium mobility in soils as a challenge for soil and plant analysis, magnesium fertilization and root uptake under adverse growth conditions. Plant Soil. 2013, 368, 5–21. [Google Scholar] [CrossRef] [Green Version]
  31. Hermans, C.; Verbruggen, N. Physiological characterization of Mg deficiency in Arabidopsis thaliana. J. Exp. Bot. 2005, 56, 2153–2161. [Google Scholar] [CrossRef] [PubMed] [Green Version]
  32. Hermans, C.; Bourgis, F.; Faucher, M.; Strasser, R.J.; Delrot, S.; Verbruggen, N. Magnesium deficiency in sugar beets alters sugar partitioning and phloem loading in young mature leaves. Planta 2005, 220, 541–549. [Google Scholar] [CrossRef] [PubMed]
  33. Farhat, N.; Elkhouni, A.; Zorrig, W.; Smaoui, A.; Abdelly, C.; Rabhil, M. Effects of magnesium deficiency on photosynthesis and carbohydrate partitioning. Acta Physiol. Plant. 2016, 38, 145–155. [Google Scholar] [CrossRef]
  34. Guo, W.; Nazim, H.; Liang, Z.; Yang, D. Magnesium deficiency in plants: An urgent problem. Crop J. 2016, 4, 83–91. [Google Scholar] [CrossRef] [Green Version]
  35. Lunde, C.; Zygadlo, A.; Simonsen, H.T.; Nielsen, P.L.; Blennow, A.; Haldrup, A. Sulfur starvation in rice: The effect on photosynthesis, carbohydrate metabolism, and oxidative stress protective pathways. Physiol. Plant. 2008, 134, 508–521. [Google Scholar] [CrossRef]
Figure 1. Representation of the experimental design and plants grown in the hydroponic system.
Agronomy 10 01572 g001
Figure 2. Visual symptoms of nutrient deficiency in broccoli (Brassica oleracea var. italica L.) plants grown in a complete nutrient solution (a,b) and omitting nitrogen (c,d), phosphorus (e,f), potassium (g,h), calcium (i,j), magnesium (k,l), and sulphur (m,n).
Agronomy 10 01572 g002
Figure 3. Leaf area (a) and dry matter (b) of broccoli (Brassica oleracea var. italica L.) plants cultivated with a complete nutrient solution (CS) and under macronutrient omission (-N, -P, -K, -Ca, -Mg and -S). Mean values (column) followed by different letters indicate a statistically significant difference by the Tukey test (p ≤ 0.05).
Agronomy 10 01572 g003
Figure 4. Net photosynthetic rate (Pn) (a), stomatal conductance (gs) (b) and transpiration rate (E) (c) of broccoli (Brassica oleracea var. italica L.) plants cultivated with a complete nutrient solution (CS) and under the omission of macronutrients (-N, -P, -K, -Ca, -Mg and -S). Mean values (column) followed by different letters indicate statistically significant difference by the Tukey test (p ≤ 0.05).
Agronomy 10 01572 g004
Figure 5. Soluble sugars (a) and starch (b) contents in shoots of broccoli (Brassica oleracea var. italica L.) plants grown in a complete nutrient solution (CS) and under the omission of macronutrients (-N, -P, -K, -Ca, -Mg and -S). Mean values (column) followed by different letters indicate a statistically significant difference by the Tukey test (p ≤ 0.05).
Agronomy 10 01572 g005
Table 1. Composition of the modified nutrient solution.
9Stock SolutionCS-N-P-K-Ca-Mg-S
Stock Solution Volume Per L of Final Solution
mol L−1---------------------------- mL L−1---------------------------------
KH2PO41.011--111
KNO31.05-5-533
Ca(NO3) 5H2O1.05-55-44
MgSO4 7H2O1.022222--
KCl1.0-51--22
CaCl2 2H2O1.0-5---11
NH4H2PO41.0---15--
NH4NO31.0---2---
(NH4)2SO41.0-----2-
MgNO3 6H2O1.0------2
Micronutrients1111111
Fe EDDHA1111111
Micronutrient solution (0.04 mol L−1 H3BO3, 0.009 mol L−1 MnCl2 4H2O, 0.0007 g L−1 ZnCl2, 0.0002 mol L−1 CuCl2, 0.0001 g L−1 H2MoO4 H2O); and 0.000184 mol L−1 Fe EDDHA.
Table 2. Height, number of leaves and SPAD readings of broccoli (Brassica oleracea var. italica L.) plants grown under macronutrient omission in nutrient solution.
Treat.EquationDATD (a)ValueD (b)DATmax (c)Valuemax (d)R2
Plant Height (cm)
CSy = 0.91824672 + 1.12909052x--3845.00.99 **
-Ny = 4.20130816 + 0.55908387x − 0.01824500x2128.3158.50.96 **
-Py = 6.42223729 + 0.72724158x3229.73836.00.87 **
-Ky = -3.2585786 + 1.84660483x − 0.03459323x22220.62721.40.94 **
-Cay = 1.21979350 + 1.28588367x − 0.03578473x21712.71812.80.94 **
-Mgy = -0.1353877 + 1.39611512x − 0.01845996x23225.63826.30.94 **
-Sy = 7.49758709 + 0.48716448x2419.23825.00.90 **
Number of leaves
CSy = 8.44067676 + 0.31460594x--3820.00.87 **
-Ny = 2.41799644 + 0.86095054x − 0.02517633x2129.2179.70.96 **
-Py = 4.71305113 + 0.70604835x − 0.01074269x23216.33216.30.87 **
-Ky = 0.50041459 + 1.33187830x − 0.03202433x22214.32114.30.99 **
-Cay = 3.97384343 + 0.67795485x − 0.02148872x2179.3169.30.93 **
-Mgy = 1.72788326 + 0.91283468x − 0.01472306x23216.03116.00.95 **
-Sy = 7.92279412 + 0.23308824x2413.53817.50.77 **
SPAD readings
CSy = 28.1581834 + 0.48175923x--3850.60.45 **
-Ny = 36.5755164 − 0.95082810x1234.90735.00.89 **
-Py = 19.3321594 + 02.13131758x − 0.03850833x23248.03848.80.41 **
-Ky = -21.525585 + 7.81561651x − 0.18668696x22260.02160.30.93 **
-Cay = 34.0619555 + 1.81493501x − 0.06720483x21745.41446.30.82 **
-Mgy = 34.6999518 − 0.43722765x + 0.02425081x23245.53245.50.62 *
-Sy = 34.181250024---ns
**, * and ns: significant at 1%, 5% and not significant, respectively, by F test. (a) DATD = Days after transplantation on which the nutritional deficiency symptom was visualised; (b) ValueD = Value reached at the time of visualisation of the nutritional deficiency symptom; (c) DATmax. = Days after transplantation with the maximum value of the variable; (d) Valuemax. = Maximum value reached.
Table 3. Nutrient content in shoots and roots of broccoli (Brassica oleracea var. italica L.) plants cultivated with a complete nutrient solution (CS) and with the omission of macronutrients.
Treat.NPKCaMgS
Shoot
________________________________g kg−1__________________________
CS32.6 ± 1.0 c4.0 ± 0.1 c49.9 ± 1.6 a19.9 ± 1.5 bc4.6 ± 0.3 b5.6 ± 0.2 a
-N13.3 ± 1.7 d4.9 ± 0.3 b25.8 ± 1.9 c15.9 ± 1.7 c4.0 ± 0.3 bc5.2 ± 0.5 a
-P43.8 ± 1.5 ab2.5 ± 0.6 d35.0 ± 0.9 b23.6 ± 2.7 ab4.0 ± 0.2 bc5.3 ± 0.4 a
-K48.1 ± 2.3 a10.8 ± 0.6 a13.7 ± 0.4 d26.2 ± 1.6 a4.3 ± 0.2 bc5.6 ± 0.5 a
-Ca37.4 ± 0.3 bc5.6 ± 0.1 b38.3 ± 1.1 b2.6 ± 0.1 d6.5 ± 0.5 a4.3 ± 0.5 b
-Mg40.4 ± 1.0a bc5.1 ± 0.2 b38.2 ± 2.2 b25.4 ± 1.1 a1.3 ± 0.1 d4.3 ± 0.1 b
-S34.2 ± 1.9 bc5.1 ± 0.2 b37.7 ± 1.8 b26.0 ± 0.2 a3.7 ± 0.1 c1.1 ± 0.1 c
MSD (a)10.50.85.94.90.70.9
CV (b)12.86.67.510.67.08.7
Root
________________________________g kg−1__________________________
CS28.5 ± 1.7 bc10.3 ± 0.1 a23.5 ± 1.6 c19.1 ± 1.9 a5.1 ± 0.6 b3.9 ± 0.1 bc
-N14.8 ± 0.3 d4.1 ± 0.3 c30.6 ± 2.9 b7.2 ± 0.4 e4.2 ± 0.2 bc3.5 ± 0.1 cd
-P34.2 ± 2.0 ab2.9 ± 0.3 d38.4 ± 2.1 a9.5 ± 0.3 de4.3 ± 0.3 bc4.6 ± 0.3 a
-K22.9 ± 0.4 c7.0 ± 0.9 b10.5 ± 1.6 d13.3 ± 1.7 b5.1 ± 1.0 b3.2 ± 0.2 d
-Ca4.9 ± 0.1 e2.5 ± 0.3 d3.7 ± 0.2 e1.8 ± 0.2 f7.9 ± 0.4 a2.5 ± 0.1 e
-Mg37.9 ± 2.9 a7.5 ± 0.2 b38.5 ± 2.1 a12.8 ± 0.6 bc1.9 ± 0.2 d4.2 ± 0.4 ab
-S31.3 ± 1.2 b7.2 ± 0.4 b36.6 ± 2.5 ab10.8 ± 0.6 cd3.2 ± 0.2 c1.9 ± 0.2 f
MSD6.00.96.12.31.10.4
CV10.57.210.39.619.96.2
Mean values followed by different letters in the column indicate statistically significant difference by Tukey test (p ≤ 0.05). (a) MSD = Minimum significant difference; (b) CV = Coefficient of variation.
Table 4. Nutrient accumulation in shoots, roots and whole broccoli (Brassica oleracea var. italica L.) plants cultivated with a complete nutrient solution (CS) and with the omission of macronutrients.
Treat.NPKCaMgS
Shoots
________________________________mg per plant__________________________
CS1072.6 ± 87.0 a132.1 ± 14.7 a1641.2 ± 146.3 a656.9 ± 89.1 a150.9 ± 7.5 a183.4 ± 12.2 a
-N133.7 ± 17.7 d48.7 ± 4.1 b259.3 ± 42.4 c159.2 ± 29.7 b40.1 ± 3.2 de52.4 ± 5.9 d
-P1000.2 ± 88.3 a58.7 ± 16.5 b760.8 ± 74.8 b541.6 ± 58.2 a91.2 ± 11.1 b122.3 ± 15.8 b
-K495.2 ± 66.5 c112.4 ± 14.7 a209.1 ± 144.0 c271.4 ± 39.2 b44.6 ± 4.7 d57.7 ± 8.2 d
-Ca389.3 ± 3.1 c58.6 ± 0.9 b397.6 ± 27.4 c27.0 ± 1.1 c67.6 ± 5.1 c44.3 ± 4.7 d
-Mg932.4 ± 44.1 a117.9 ± 10.9 a885.8 ± 124.6 b587.1 ± 57.8 a30.0 ± 2.9 e99.4 ± 7.4 c
-S712.3 ± 77.6 b106.8 ± 0.8 a785.3 ± 8.1 b541.6 ± 26.0 a77.1 ± 2.8 c23.0 ± 2.9 e
MSD (a)145.625.3223.0115.813.921.1
CV (b)9.312.113.812.78.411.0
Root
________________________________mg per plant__________________________
CS345.3 ± 41.4 a124.6 ± 10.9 a297.0 ± 21.7 b232.5 ± 32.6 a61.1 ± 5.8 a47.4 ± 4.9 ab
-N106.2 ± 5.1 c29.7 ± 1.9 cd219.3 ± 13.8 c51.6 ± 4.9 c30.1 ± 2.5 bc24.8 ± 1.1 cd
-P417.8 ± 53.9 a35.0 ± 4.5 c468.0 ± 57.4 a115.2 ± 6.7 b51.7 ± 4.8 a55.8 ± 7.2 a
-K222.8 ± 7.6 b67.8 ± 9.6 b102.6 ± 17.2 d130.1 ± 17.3 b49.4 ± 10.2 a30.9 ± 1.9 c
-Ca35.7 ± 1.3 c18.0 ± 1.7 d26.9 ± 1.5 e12.8 ± 1.1 d57.4 ± 1.7 a18.4 ± 0.5 d
-Mg402.3 ± 70.5 a78.9 ± 5.2 b406.8 ± 48.7 a135.7 ± 10.2 b19.7 ± 3.1 c44.1 ± 5.4 b
-S343.6 ± 13.2 a79.3 ± 3.9 b401.6 ± 28.1 a118.2 ± 6.1 b34.7 ± 1.8 b20.5 ± 2.4 d
MSD86.210.374.834.411.89.3
CV14.014.611.913.211.811.8
Whole plant
________________________________mg per plant__________________________
CS1417.9 ± 77.9 a256.6 ± 14.4 a1938.3 ± 152.8 a889.5 ± 76.6 a212.1 ± 4.8 a230.8 ± 8.6 a
-N239.9 ± 14.5 e78.3 ± 5.8 c478.7 ± 46.4 c210.8 ± 29.9 d70.2 ± 4.8 e77.3 ± 6.6 de
-P1418.0 ± 80.6 a93.7 ± 11.9 c1228.8 ± 103.7 b656.8 ± 55.7 b142.9 ± 11.9 b178.1 ± 14.4 b
-K718.0 ± 60.8 c180.3 ± 12.8 b311.7 ± 139.7 c401.6 ± 31.3 c94.1 ± 12.1 d88.6 ± 7.9 d
-Ca424.9 ± 4.4 d76.6 ± 2.2 c424.5 ± 28.8 c39.9 ± 0.9 e124.9 ± 5.7 c62.7 ± 4.8 ef
-Mg1334.7 ± 99.6 a196.9 ± 12.9 b1292.6 ± 165.1 b722.9 ± 51.5 b49.7 ± 4.9 f143.4 ± 9.9 c
-S1055.9 ± 90.8 b186.1 ± 3.1 b1186.9 ± 33.4 b659.9 ± 21.8 b111.8 ± 3.9 c43.5 ± 5.3 f
MSD161.823.4253.2102.717.620.1
CV7.56.711.28.76.67.4
Mean values followed by different letters in the column indicate statistically significant difference by Tukey test (p ≤ 0.05). (a) MSD = Minimum significant difference; (b) CV = Coefficient of variation.
Table 5. Absorption, transport and use efficiency of macronutrients in broccoli (Brassica oleracea var. italica L.) plants cultivated with a complete nutrient solution (CS) and under macronutrient omission.
Treat.NPKCaMgS
Absorption Efficiency
________________________________mg g−1__________________________
CS117.9 ± 7.5 a21.2 ± 0.4 a160.3 ± 6.2 a73.7 ± 4.4 a17.6 ± 1.4 a19.2 ± 0.9 a
-N32.6 ± 1.9 e10.8 ± 0.7 d66.4 ± 5.8 d28.5 ± 2.9 d9.7 ± 0.4 b10.7 ± 0.9 c
-P111.8 ± 8.7 a6.9 ± 0.4 e101.0 ± 6.3 c51.5 ± 5.2 c11.3 ± 0.9 b14.0 ± 0.6 b
-K77.3 ± 7.8 c19.2 ± 0.4 b26.0 ± 1.4 e43.0 ± 1.8 c9.6 ± 0.3 b9.4 ± 0.3 cd
-Ca58.5 ± 0.4 d10.5 ± 0.4 d57.0 ± 2.4 d5.4 ± 0.2 e17.2 ± 0.9 a8.6 ± 0.8 d
-Mg125.5 ± 8.5 a18.5 ±1.3 b119.1 ±12.2 b68.0 ±5.7 ab4.6 ± 0.4 c13.4 ± 1.0 b
-S94.0 ± 5.6 b16.9 ± 0.4 c108.2 ± 2.8 bc60.1 ± 1.4 b10.1 ± 0.2 b3.9 ± 0.4 e
MSD (a)15.11.514.58.41.81.7
CV (b)7.44.56.97.76.86.7
Transport efficiency
________________________________%__________________________
CS75.9 ± 0.8 b51.7 ± 0.9 c85.3 ± 1.0 b74.0 ± 2.6 c71.4 ± 2.6 a79.6 ± 0.8 a
-N54.7 ± 2.9 d61.8 ± 1.2 b53.9 ± 4.2 e74.7 ±3.2 bc57.1 ± 2.1 bc67.7 ± 2.1 b
-P69.2 ± 2.7 c58.4 ±5.9 bc61.9 ± 3.3 d81.4 ±1.7 ab62.3 ± 1.6 b67.2 ± 3.3 b
-K70.1 ± 3.8 bc63.8 ± 3.8 b59.7 ± 4.0 de68.8 ± 5.3 c50.4 ± 3.9 d66.4 ± 2.7 b
-Ca91.5 ± 0.2 a76.4 ± 1.7 a93.5 ± 0.1 a67.8 ± 2.6 c54.0 ±1.9 cd70.5 ± 2.2 b
-Mg69.8 ± 3.3 c59.7 ± 2.3 b69.6 ± 2.9 c81.0 ± 2.3 ab60.4 ± 3.1 b69.1 ± 2.6 b
-S66.6 ± 1.3 c57.4 ± 1.3 bc66.2 ± 1.4 cd82.0 ± 1.3 a68.9 ± 1.1 a52.8 ± 0.9 c
MSD5.86.86.66.95.85.2
CV (%)3.54.84.13.94.13.3
Use efficiency
________________________________g mg−1__________________________
CS1.5 ± 0.0 a8.3 ± 0.2 b1.1 ± 0.0 b2.4 ± 0.1 b10.0 ± 0.5 b9.2 ± 0.2 b
-N1.2 ± 0.0 b3.8 ± 0.1 e0.6 ± 0.0 e1.4 ± 0.1 cd4.2 ± 0.1 d3.8 ± 0.2 d
-P0.8 ± 0.1 cd13.6 ± 1.4 a0.9 ± 0.0 c1.8 ± 0.2 c8.3 ± 0.6 c6.7 ± 0.7 c
-K0.8 ± 0.0 e2.3 ± 0.0 f1.7 ± 0.1 a1.0 ± 0.0 d4.5 ± 0.0 d4.7 ± 0.3 d
-Ca0.7 ± 0.0 de4.0 ± 0.2 de0.7 ± 0.0 de7.8 ± 0.3 a2.5 ± 0.1 e5.0 ± 0.5 d
-Mg0.8 ± 0.0 cd5.7 ± 0.1 c0.8 ± 0.0 c1.5 ± 0.0 c22.8 ± 1.2 a7.8 ± 0.2 bc
-S0.9 ± 0.0 c5.4 ± 0.5 cd0.8 ± 0.0 cd1.5 ± 0.0 c9.0 ± 0.4 bc23.4 ± 1.5 a
MSD0.11.40.10.41.41.6
CV (%)7.59.96.17.96.98.0
Mean values followed by different letters in the column indicate statistically significant difference by Tukey test (p ≤ 0.05). (a) MSD = Minimum significant difference; (b) CV = Coefficient of variation.
Publisher’s Note: MDPI stays neutral with regard to jurisdictional claims in published maps and institutional affiliations.

