Article

CAX1a TILLING Mutations Modify the Hormonal Balance Controlling Growth and Ion Homeostasis in Brassica rapa Plants Subjected to Salinity

by
Eloy Navarro-León
1,*,
Francisco Javier López-Moreno
2,
Santiago Atero-Calvo
1,
Alfonso Albacete
3,4,
Juan Manuel Ruiz
1 and
Begoña Blasco
1
1
Department of Plant Physiology, Faculty of Sciences, University of Granada, 18071 Granada, Spain
2
IFAPA, Institute of Research and Training in Agriculture and Fisheries, 18004 Granada, Spain
3
Department of Plant Nutrition, CEBAS-CSIC, Campus Universitario de Espinardo, 30100 Murcia, Spain
4
Department of Plant Production and Agrotechnology, Institute for Agri-Food Research and Development of Murcia (IMIDA), C/Mayor s/n, 30150 La Alberca, Murcia, Spain
*
Author to whom correspondence should be addressed.
Submission received: 6 October 2020 / Revised: 30 October 2020 / Accepted: 31 October 2020 / Published: 3 November 2020
(This article belongs to the Special Issue Hormone Signaling and Regulation in Cultivated Plants)

Abstract

:
Salinity is a serious issue for crops, as it causes remarkable yield losses. The accumulation of Na+ affects plant physiology and produces nutrient imbalances. Plants trigger signaling cascades in response to stresses in which phytohormones and Ca2+ are key components. Cation/H+ exchangers (CAXs) transporters are involved in Ca2+ fluxes in cells. Thus, enhanced CAX activity could improve tolerance to salinity stress. Using the TILLING (targeting induced local lesions in genomes) technique, three Brassica rapa mutants were generated through a single amino acidic modification in the CAX1a transporter. We hypothesized that BraA.cax1a mutations could modify the hormonal balance, leading to improved salinity tolerance. To test this hypothesis, the mutants and the parental line R-o-18 were grown under saline conditions (150 mM NaCl), and leaf and root biomass, ion concentrations, and phytohormone profile were analyzed. Under saline conditions, BraA.cax1a-4 mutant plants increased growth compared to the parental line, which was associated with reduced Na+ accumulation. Further, it increased K+ concentration and changed the hormonal balance. Specifically, our results show that higher indole-3-acetic acid (IAA) and gibberellin (GA) concentrations in mutant plants could promote growth under saline conditions, while abscisic acid (ABA), ethylene, and jasmonic acid (JA) led to better signaling stress responses and water use efficiency. Therefore, CAX1 mutations directly influence the hormonal balance of the plant controlling growth and ion homeostasis under salinity. Thus, Ca2+ signaling manipulation can be used as a strategy to improve salinity tolerance in breeding programs.

1. Introduction

Saline soils represent 3.1% of the total land area of the Earth. Thereby, salinity is a serious issue for crops because it causes remarkable yield losses [1]. This problem has become more important over the last years and it is expected to be even more important in the future because of climate change [2]. Most crop species are affected by salinity including species from the Brassicaceae family, such as cabbage, broccoli, and rapeseed [3]. The most common and soluble salt compound is NaCl. The high concentration of Na+ and Cl ions in saline soils cause osmotic potential imbalances hampering water and nutrients uptake. The accumulation of Na+ in plants alters the osmotic potential and causes direct toxicity and nutrient imbalances affecting plant physiology [1]. The similarity of Na+ with K+ hinders K+ uptake and activity in the plant. Thus, Na+ accumulates in the cytosol displacing K+ and also Ca2+ ions from their active sites and inhibits enzyme activities. In addition, the altered K+/Na+ impairs photosynthesis processes [4] and causes oxidative stress, as indicated by a high reactive oxygen species (ROS) accumulation triggering the activation of antioxidant responses [5,6].
As in other stresses, plants trigger phytohormone-mediated responses to cope with saline stress [2]. Plant hormones are compounds from different chemical groups involved in numerous processes in plants. They are crucial for plant adaptation to stress because they mediate adaptive responses that modulate growth, development, and plant nutrition. The resilience of plants to stress is highly dependent on the regulation of hormone signaling pathways [7,8]. Abscisic acid (ABA) and ethylene have been classically considered stress-related hormones. ABA is an important hormone in salinity response because it regulates the water status via stomata closure and the expression of ABA-responsive genes for long-term responses [9]. In addition, ABA regulates the synthesis and accumulation of osmoprotectants, such as proline and some proteins [3,10]. Alternatively, ethylene synthesis is usually activated as a response to stress and is considered as the main senescence-related hormone. Under salinity, senescence is favored by ABA and the ethylene precursor 1-aminocyclopropane-1-carboxylic acid (ACC) accumulation, as well as by a decrease of indole-3-acetic acid (IAA) and cytokinins (CKs) levels [2]. Indeed, other hormones have been demonstrated to regulate stress responses. Auxins, such as IAA, are involved in the physiological response that modulates oxidative stress and prevents oxidative damage, while CKs protect plants against salinity that maintains growth and delays senescence [9]. Other important phytohormones affected by salinity are gibberellins (GAs) associated with sugar signaling and antioxidant system modulation [11]. Furthermore, jasmonic acid (JA) and salicylic acid (SA) are usually related to biotic stresses, although both hormones are involved in stress signaling in response to salinity and other abiotic stresses [9,12].
Besides phytohormones in cooperation with them, Ca2+ is a second messenger that fulfills a crucial role in signaling cascades in response to stress [13]. During stress signaling, the Ca2+ signal is very fast and occurs much earlier than ABA accumulation and, thereby, Ca2+ acts in ABA signaling processes [4]. In response to salinity, Ca2+ is involved in salt sensing, Na+ extrusion/sequestration, pH regulation, and cellular barriers synthesis [14]. Indeed, the supplementation of plants with CaCl2 has been demonstrated to improve salinity tolerance [4]. This positive effect has been observed in many crops including the Brassicaceae species [15,16]. Alternatively, seed priming with CaCl2 has beneficial effects on the hormonal balance of the plant alleviating salinity stress symptoms. CaCl2 application reduced ABA and SA levels and increased IAA, promoting plant growth [17]. Besides, Ca2+ application maintains membrane integrity, reducing K+ leakage and preventing Na+ accumulation, and, thereby, sustaining K+/Na+ selectivity [1].
Cation/H+ exchangers (CAXs) are a family of Ca2+/H+ antiporters situated on plasma and organelle membranes including vacuoles. CAXs transporters remove Ca2+ from the cytosol to generate different Ca2+ profiles in the cell. Thus, CAX transporters fulfill a key role in the generation of Ca2+ gradients involved in stress signaling [18]. Adequate Ca2+ homeostasis driven by CAX and other transporters could be crucial to improving Ca2+ fluxes and stress tolerance [19], as it was observed in the halophyte species Suaeda salsa [20]. Furthermore, CAX1 is the CAX transporter with the highest Ca2+/H+ activity [18], thus the modification of CAX1 activity could be useful to improve the tolerance to salinity stress [19]. TILLING (targeting induced local lesions in genomes) is a promising technique that generates new variants in target genes [21]. Using this technique, three new variants were produced in Brassica rapa ssp. trilocularis ’R-o-18′ CAX1a transporter: BraA.cax1a-4, BraA.cax1a-7, and BraA.cax1a-12 [22]. These mutations change amino acids that could affect protein conformation and thereby improve CAX1 function [23]. As observed in a previous experiment, BraA.cax1a mutations induce changes in phytohormone profile [24]. Given the role of phytohormones in salinity stress, this study aims to test whether changes in Ca+2 signaling through BraA.cax1a mutations could modify the hormonal balance of the plant leading to improved growth under salinity.

2. Materials and Methods

2.1. Plant Material and Growth Conditions

As plant material, we used three Brassica rapa ssp. trilocularis ‘R-o-18’ mutants (BraA.cax1a-4, BraA.cax1a-7, and BraA.cax1a-12) and the parent line R-o-18 (without changes in BraA.CAX1a). The amino acidic changes produced in BraA.CAX1a transporter were: BraA.cax1a-4 (A-to-T change at amino acid 77), BraA.cax1a-7 (R-to-K change at amino acid 44), and BraA.cax1a-12 (P-to-S change at amino acid 56). Mutant plants were generated as described by Lochlainn et al. [22] and Graham et al. [23]. Seeds were germinated on filter paper in Petri dishes and then transplanted to pots (13 cm × 13 cm × 12.5 cm) filled with vermiculite. Pots were placed in trays (55 cm × 40 cm × 8.5 cm). Plants were grown in a chamber with controlled conditions: relative humidity (60–80%), temperature (23/18 °C; day/night), photoperiod (14/10 h; day/night), and a photosynthetic photon flux density of 350 µmol m−2 s−1 registered at the top of plants using a 190 SB quantum sensor (LI-COR Inc., Lincoln, NE, USA). Plants were supplied with a nutritive solution composed of 6 mM KH2PO4, 4 mM KNO3, 4 mM Ca(NO3)2·4H2O, 2 mM MgSO4·7H2O, 1 mM NaH2PO4·2H2O, 10 µM H3BO3, 5 µM Fe-chelate (Sequestrene; 138FeG100), 2 μM MnCl2·4H2O, 1 µM ZnSO4, 0.25 μM CuSO4·5H2O, and 0.1 μM Na2MoO4·2H2O. The pH of the nutritive solution was kept between 5.5 and 6.0.

2.2. Experimental Design, Treatments, and Plant Sampling

Treatments were applied 30 days after sowing and were maintained for 21 days. Plants received two different treatments: control (without NaCl added to the nutrient solution) and salinity (150 mM NaCl supplemented to the nutrient solution). The factors considered in the experiment were the salinity (S) and the mutation (M). The experimental design comprised a randomized complete block with 8 treatments, 3 trays per treatment, and 8 plants per tray, thus a total of 24 plants were grown for each treatment. At the end of the experiment, plant leaves and roots were rinsed, dried, and weighed to obtain the fresh weight (FW). Then, leaves and roots were lyophilized to determine the dry weight (DW) and a part of the lyophilized leaf material was used to determine the phytohormone concentrations. Nine independent replicates from each treatment (n = 9) were finally used for the analytical determinations.

2.3. Analysis of Na+, Ca2+, and K+ Concentrations

Ca2+, Na+, and K+ were determined subjecting the leaf samples to a mineralization process by wet digestion [25]. Next, 150 mg of dry leaves were milled and mineralized with a combination of nitric acid and hydrogen peroxide at 30%. Then, 20 mL of Milli-Q water were added and element concentrations were measured using ICP-MS (X-Series II; Thermo Fisher Scientific Inc., Waltham, MA, USA).

2.4. Hormone Extraction and Analysis

Phytohormone concentrations were determined in leaves according to Albacete et al. [26] with some modifications. Lyophilized samples (30 mg) were mixed with 1 mL of cold (−20 °C) extraction mixture of methanol/water (80/20, v/v). Samples were centrifuged (20,000× g, 15 min, 4 °C) and re-extracted for 30 min at 4 °C in 1 mL of the same extraction solution. Supernatants were passed through Sep-Pak Plus †C18 cartridges (SepPak Plus, Waters, Milford, MA 01757 USA) and evaporated at 40 °C under vacuum. The residue was dissolved in 1 mL methanol/water (20/80, v/v) using an ultrasonic bath. The dissolved samples were filtered through Millex nylon membrane filters 13 mm diameter of 0.22 µm pore size (Millipore, Bedford, MA, USA). Filtered extracts (10 µL) were injected in a U-HPLC-MS system consisting of an Accela Series U-HPLC coupled to an Exactive mass spectrometer (Thermo Fisher Scientific Inc., Waltham, MA, USA) with a heated electrospray ionization (HESI) interface. The mass spectra were measured using the Xcalibur software version 2.2. For phytohormones quantification, calibration curves were constructed (1, 10, 50, and 100 µg L−1) and corrected for 10 µg L−1 deuterated internal standards. Total CKs were calculated as the sum of trans-zeatin (tZ) and isopentenyl adenine (iP) concentrations. Total GAs were calculated as the sum of gibberellin A1 (GA1), gibberellin A3 (GA3), and gibberellin A4 (GA4) concentrations.

2.5. Statistical Analysis

The mean and standard error of each treatment was calculated from the 9 individual data of each parameter analyzed. To assess the differences between treatments we performed a one-way analysis of variance (ANOVA) with 95% confidence. A two-tailed ANOVA was used to determine whether the NaCl treatment (S), the BraA.cax1a mutations (M), or their interaction (S × M) significantly influenced the results. Means were compared using Fisher’s least significant differences (LSD). The significance levels were stated as * p < 0.05, ** p < 0.01, *** p < 0.001, or NS (not significant). A principal components analysis (PCA) was performed to assess relationships between treatments and all parameters analyzed. All statistical analyses were carried out using the Statgraphics Centurion 16.1.03 software.

3. Results

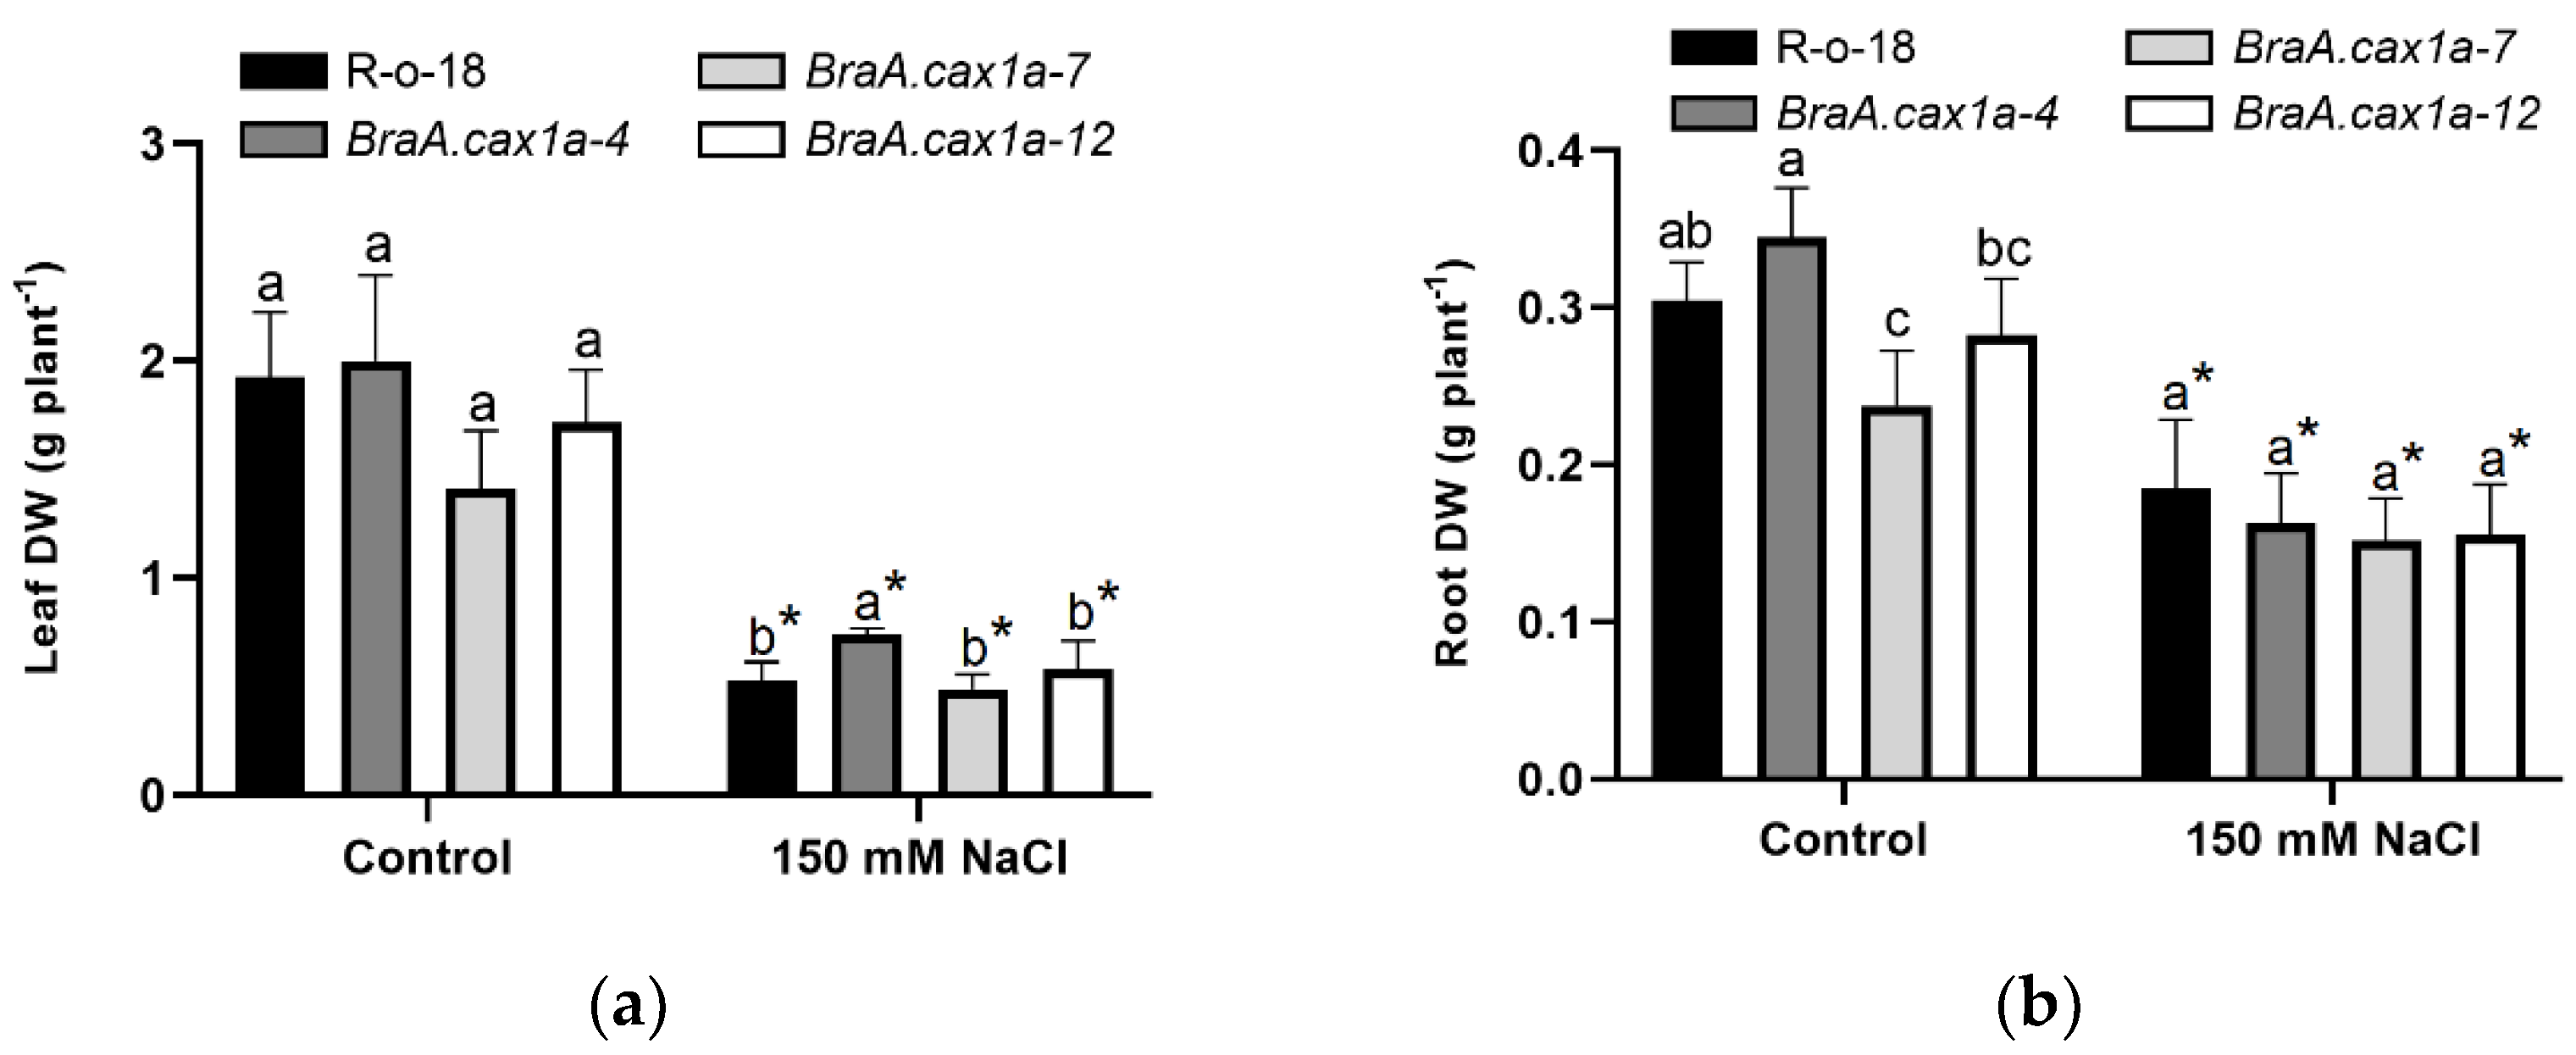
3.1. Plant Biomass and Cation Concentration

Plants grown under salinity conditions presented a remarkable decrease in leaf and root DW (Figure 1). However, BraA.cax1a-4 plants grown under salinity showed significantly higher leaf biomass in comparison to the other mutants and the parent line. Indeed, this mutant presented 41% higher leaf DW than R-o-18 plants (Figure 1a). Nonetheless, the four lines analyzed did not show significant differences in root DW under saline conditions (Figure 1b). Regarding cation concentrations, salinity reduced leaf Ca2+ concentration in comparison to control conditions in all lines, but no differences were observed between lines under salinity conditions. As expected, NaCl application strongly increased Na+ concentration in leaves. However, this increment was lower in BraA.cax1a-4 plants, which showed the lowest Na+ concentration. Additionally, NaCl application reduced K+ concentration, although this reduction was lower in BraA.cax1a-4 plants, which presented the highest K+ concentration in comparison to the other genotypes. Consequently, BraA.cax1a-7 plants presented the highest Na+/K+ ratio, followed by BraA.cax1a-12, R-o-18, and BraA.cax1a-4 plants. Specifically, BraA.cax1a-4 mutant plants showed 42% lower Na+/K+ ratio than R-o-18 plants (Table 1).

3.2. Phytohormone Concentrations

Salinity increased total CKs, total GAs, and provoked differential changes in the concentrations of other hormones in R-o-18 and mutant plants (Figure 2; Table 2). Under saline conditions, BraA.cax1a-4 was the only mutant that showed significantly higher IAA levels (55%) in comparison to R-o-18 plants (Table 2). Regarding GAs under saline conditions, BraA.cax1a-4 plants presented the highest GA concentrations. The other two mutants presented similar values than R-o-18 plants (Figure 2a). Particularly, BraA.cax1a-4 showed significant increments in all GAs (4-fold higher than R-o-18), while in BraA.cax1a-7 only GA1 increased in comparison to the parent line (Table 2). Concerning CKs, iP decreased in the BraA.cax1a-4 mutant in comparison to R-o-18, whereas incremented in BraA.cax1a-7 plants. Importantly, tZ increased in both BraA.cax1a-4 and BraA.cax1a-7 mutants, and its absolute concentrations were much higher than those of iP, leading to increased total CK content (Figure 2b). ABA concentration was significantly higher in BraA.cax1a-4 plants (57%) in comparison to R-o-18 plants. All mutants showed higher ACC levels in comparison to the parent line. SA increased in BraA.cax1a-4 and BraA.cax1a-7 mutants, whereas JA concentration increased in BraA.cax1a-4 and BraA.cax1a-12 in comparison to the parental R-o-18 (Table 2).

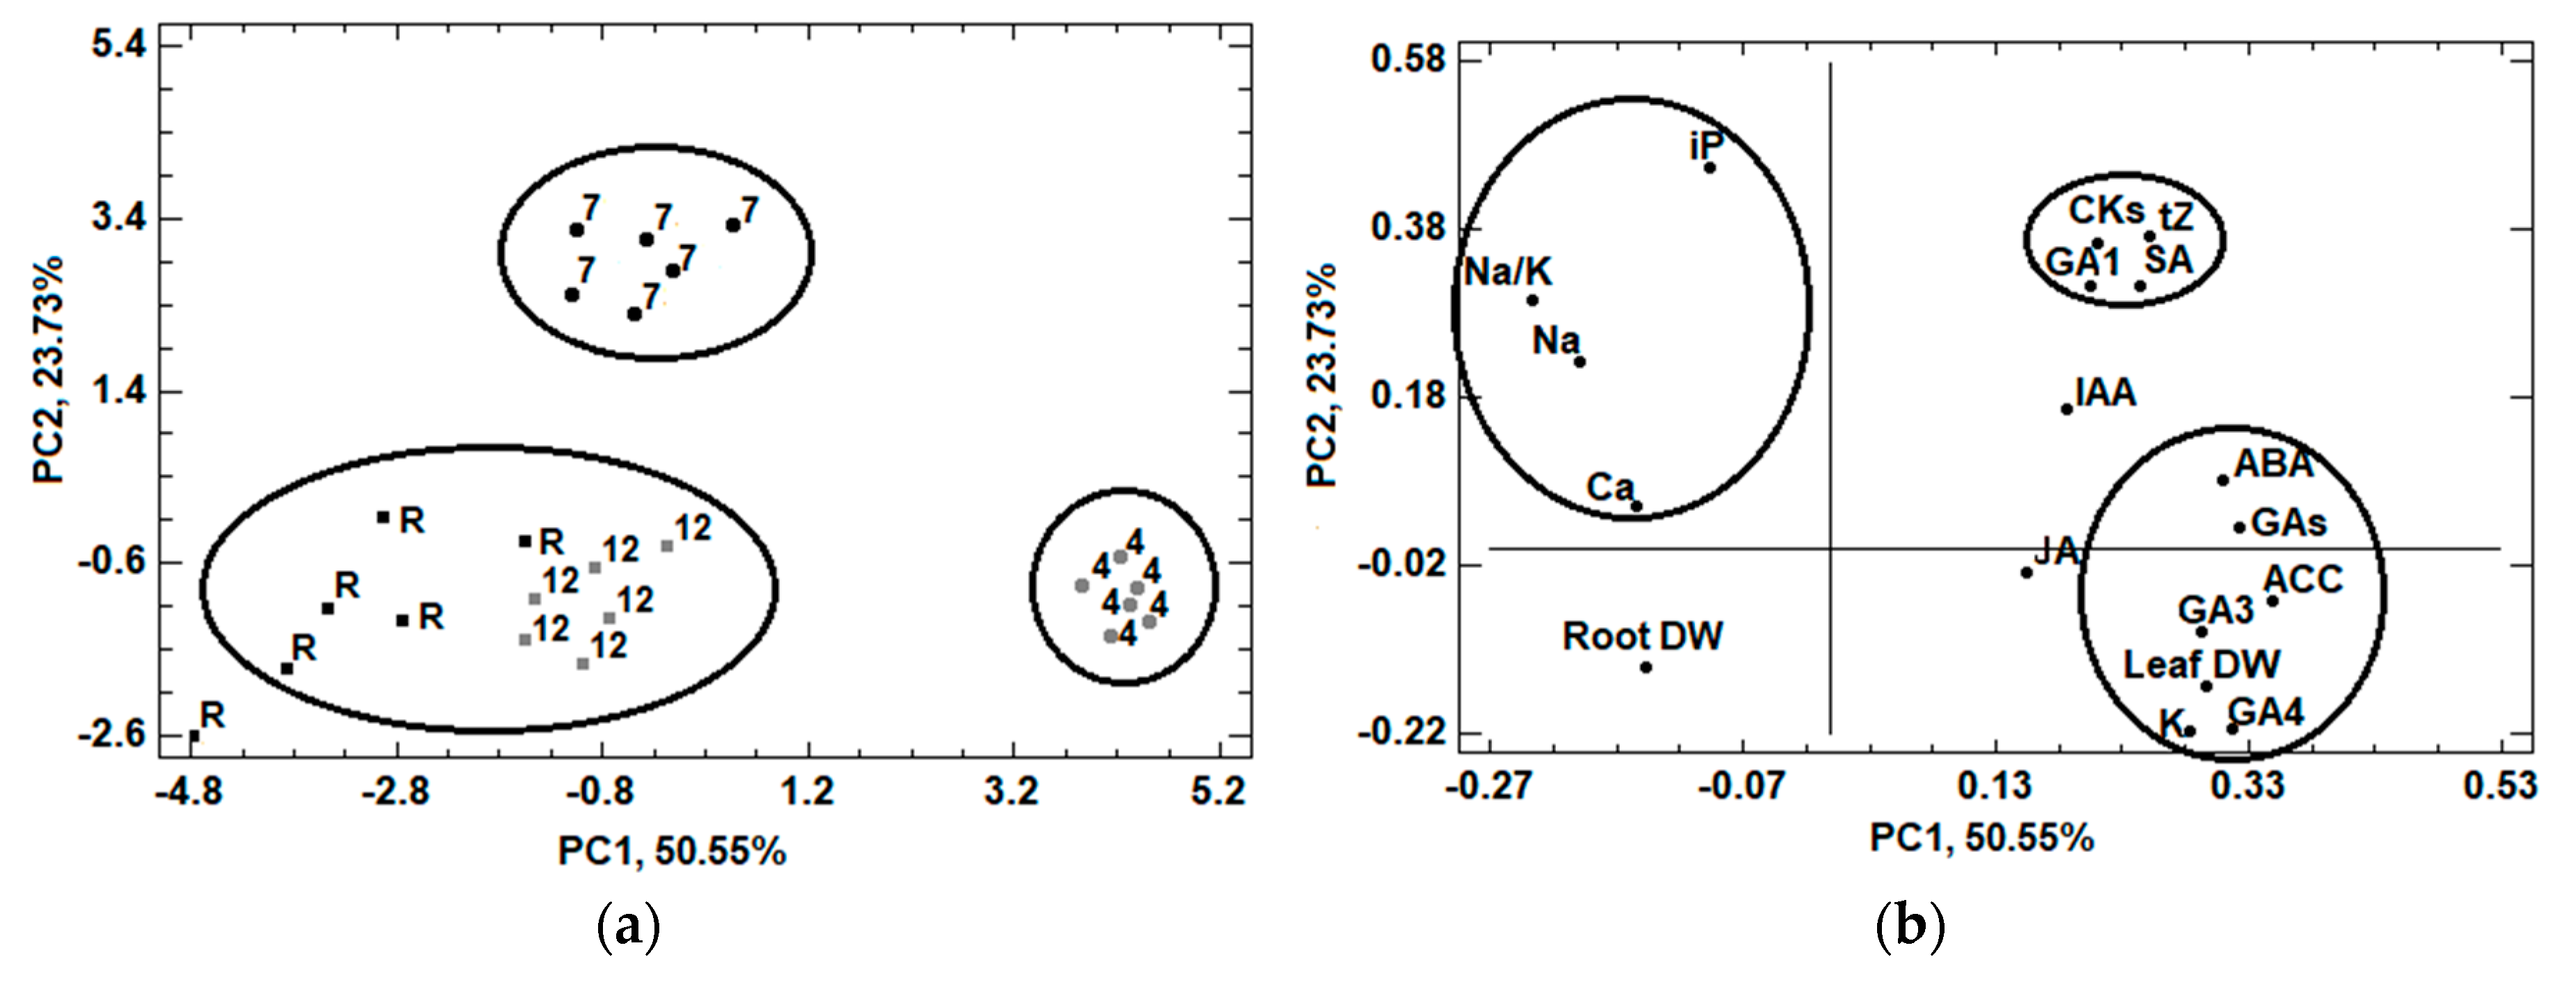
3.3. Principal Component Analysis

A principal component analysis (PCA) was performed to detect general trends in the data and to evaluate the relationships among parameters. The first principal component (PC1) of the score plot clearly separated BraA.cax1a-4 from the rest of the lines and accounted for 50.55% of the variance within the data. The second principal component (PC2) separated BraA.cax1a-7 from the other lines and accounted for 23.73% of the variance (Figure 3a). The PCA loading plot revealed three clusters (Figure 3b). The first cluster associated leaf DW with K+, GA3, GA4, ACC, GAs, and ABA levels. The second cluster related Na+, Na+/K+ ratio, Ca2+, and iP levels. Finally, the third cluster, grouped tZ, total CK, GA1, and SA concentrations (Figure 3b).

4. Discussion

Improved growth responses under salinity are associated with salinity tolerance. According to leaf DW results (Figure 1a), BraA.cax1a-4 presented higher performance under salinity in comparison to other lines. Several studies observed that a better Ca2+ and K+ nutrition and homeostasis provide salt tolerance due to Ca2+-associated signaling processes in response to stress and because it is a Na+ antagonist [4,27]. In addition, Ca2+ improves the accumulation of other nutrients and reduces Na+/K+ ratio [11,13]. Although BraA.cax1a-4 plants did not present higher Ca2+ concentration, they registered lower Na+ and higher K+ concentrations, leading to a better Na+/K+ ratio (Table 1). A previous study showed that this fact could be due to BraA.cax1a-4 plants favors the transport of K+ over Na+ to the shoot from roots [28]. Hence, the modification of CAX1 activity could result in different ion accumulation, because of changes in Ca2+ fluxes (but not absolute concentrations) in BraA.cax1a-4, improving Na+ and K+ homeostasis and thereby growth [29]. This is supported by the close relationship between leaf DW and K+ concentration observed in loading plot analysis (Figure 3b). Alternatively, Ca2+ is involved in modulating ROS levels that are generated by oxidative stress caused by salinity [5]. Thus, as observed in a previous study, the higher tolerance of BraA.cax1a-4 plants could also be related to this ROS modulation [28].
The possible alteration of Ca2+ fluxes by BraA.cax1a mutations could affect the function of Ca2+ sensors, such as calmodulins and protein kinases, that are crucial for hormone synthesis and signaling. Thus, the improved growth response under salinity of BraA.cax1a-4 plants could be also related to changes in the hormonal balance, as it has been proposed in the present study. Indeed, auxins, and particularly the active compound IAA, have crucial roles in stress signaling responses in B. rapa seedlings [3] and also participate in redox and antioxidative metabolism [9]. However, IAA concentration usually decreases and, thereby, senescence is promoted in plants grown under salt stress [30]. In the present study, we did not observe a significant reduction in IAA concentration. Thus, BraA.cax1a-4 was the line with the highest IAA concentration, which could contribute to the higher growth observed in this mutant under salinity conditions (Table 2). In fact, the greater IAA levels might enhance ROS detoxification under saline stress which could increase the tolerance to NaCl [31], as previously demonstrated in BraA.cax1a-4 mutants [28].
CKs regulate several physiological processes, promote plant growth, and play important roles in salinity tolerance [32,33,34]. A decrease in CKs usually is an early response to salt stress [10], although the contrary was also reported by Ghanem et al. [35]. These authors observed that CK concentrations increased in plants grown under salt stress as a response to increased salinity tolerance in tomato. This study agrees with our findings as we observed an increment in the CK concentrations in the plants subjected to salinity. Total CK concentrations significantly increased in the mutant, which presented the highest biomass under salinity, BraA.cax1a-4, compared to the parent line (Figure 2b). However, their role in the control of growth of BraA.cax1a mutants seems to be limited since the PCA analysis revealed that CKs do not associate with any of the growth-related parameters recorded in this assay (Figure 3b).
Some studies have stated that GA accumulation in plants grown under abiotic stress provide salinity tolerance [36], whereas other studies have shown GA reduction because of repressor protein accumulation, leading to plant growth reduction [4]. Our results show that total GAs—especially GA3—markedly increased in BraA.cax1a-4 plants under salinity (Table 2, Figure 2a). GA3 is the main GA that regulates important steps in plant growth and development and alleviates salt stress [10]. Furthermore, Khan et al. [11] proved that the exogenous application of GA3 to linseed, alone or in combination with Ca2+, reduced the damage to membranes and improved water status. Therefore, this particular increment in GA3 and GA4 could also explain the higher biomass of the BraA.cax1a-4 mutants under salinity stress, as suggested by the close association between GAs and leaf DW in the PCA (Figure 3b).
Despite auxins, CKs, and GAs play a role in the response of the plants to salinity and other abiotic stresses, the phytohormone more broadly studied in relation to water and salinity stress is ABA, since this hormone is over-produced as a consequence of both stresses. Thus, genes related to ABA synthesis and accumulation are up-regulated by NaCl application, and in turn, ABA is the main hormone that activates salt responsive genes [37]. Our data reflects an increase in ABA concentration under salinity, which was especially strong in the BraA.cax1a-4 mutant (Table 2). ABA triggers stress responses, such as water balance and osmotic stress regulation, and leads to stomatal closure to avoid excessive water loss [38]. This fact could be important in BraA.cax1a-4 plants where the high ABA levels provoke the closure of the stomata, thus enhancing water use efficiency (WUE) (data not shown). This is in agreement with previous studies in maize and tomato in which salinity-tolerant genotypes presented greater WUE and stomatal regulation, and lower Na+ accumulation than the sensitive ones, associated with higher ABA concentrations [39,40]. Furthermore, Iqbal et al. [10] proved that Ca2+ induces ABA accumulation, thus reducing Na+ and Cl content and increasing K+ content. Therefore, ABA could contribute to better ion homeostasis via Na+/K+ reduction, as observed in BraA.cax1a-4 plants (Table 1), maintain growth in plants grown under salinity conditions. This is further supported by the linkage among ABA, K+, and leaf FW shown in the PCA plot (Figure 3b).
Another hormone traditionally associated with stress responses is ethylene, especially in relation to leaf senescence and abscission. Salinity stress triggers the accumulation of the ethylene precursor ACC, leading to de-novo synthesis of ethylene, which induces cell death and leaf senescence, and reduces plant growth [9]. In our study, ACC concentration was higher in plants subjected to salinity which could contribute to biomass reduction (Table 2, Figure 1). Likewise, de la Torre-González et al. [31] observed that a salinity-tolerant tomato genotype presented much lower ACC concentration than the sensitive one under saline conditions. However, some studies proved that plants supplied with ACC or that overexpress ethylene-responsive factors presented tolerance to salinity stress [36,41]. Thus, all mutants evaluated in the present study showed a significant increase in ACC concentrations, and importantly, the BraA.cax1a-4 mutant presented the highest concentrations (Table 2) which may be associated with its improved growth-response due to better regulation of Ca2+ homeostasis under salinity. This conclusion is additionally endorsed by the link of ACC with leaf FW and K+ (Figure 3b). Indeed, the increased growth of BraA.cax1a-4 mutant under salinity stress could be partially associated with improved ethylene regulation of the high-affinity K+ transporters, which increase K+ tissue accumulation [41], as observed in this mutant (Table 1).
SA and JA regulate biotic stress responses but also are involved in regulating abiotic stresses, such as salinity, in cooperation with other hormones [12,42]. JA appears to provide tolerance to salt stress via plant signal transduction [7], whereas SA induces antioxidant defenses, protects photosynthesis, and reduces membrane damage [10,43]. Iqbal et al. [10] observed that JA reduces membrane depolarization and, thereby, K+ loss. Hence, the highest JA concentrations of BraA.cax1a-4 and BraA.cax1a-12 (Table 2) could prevent K+ leakage and contribute to the higher K+ concentrations detected in these two mutants (Table 1). Additionally, this also may be explained by the lower lipid peroxidation levels previously observed in BraA.cax1a-4 and BraA.cax1a-12 plants [28]. Regarding SA, we observed a significant increment in SA concentration in all mutant plants grown under salinity in comparison to the parental R-o-18 plants (Table 2). Ku et al. [7] proved that increments in cytosolic Ca2+ are a necessary step in SA accumulation in response to salinity. Thus, BraA.cax1a mutations could induce a higher SA accumulation through a greater cytosolic Ca2+ response.

5. Conclusions

The present study demonstrates that the control of Ca2+ homeostasis through BraA.cax1a mutants modifies the phytohormone balance of B. rapa plants controlling growth responses under salinity stress conditions. Specifically, the growth improvement of BraA.cax1a-4 mutant plants under salinity can be primarily associated with higher GA, IAA, and CK concentrations. Besides, ABA accumulation activates signaling stress responses under saline conditions, leading to better control of Na+/K+ homeostasis. This study confirms the key role of the CAX1 transporter in phytohormone regulation and as a potential target for improving growth under salinity stress. However, further research is still necessary to mechanistically demonstrate the relationship between Ca2+ fluxes and phytohormone accumulation in the control of the growth and productivity under salinity conditions.

Author Contributions

Conceptualization, J.M.R. and B.B.; Methodology, F.J.L.-M., S.A.-C., A.A. and E.N.-L.; Validation, A.A., J.M.R. and B.B.; Formal analysis, B.B. and E.N.-L.; Data curation, E.N.-L.; Writing—original draft preparation, E.N.-L.; Writing—review and editing, J.M.R., B.B. and A.A. All authors have read and agreed to the published version of the manuscript.

Funding

This research was funded by the PAI program (Plan Andaluz de Investigación, Grupo de Investigación AGR282) and by a Grant from the FPU of the Ministerio de Educación y Ciencia awarded to ENL grant number [FPU14/01858].

Acknowledgments

We thank Martin R. Broadley and Neil Graham from Nottingham University for providing us the seeds utilized in this experiment. We also thank María del Puerto Sánchez-Iglesias for technical support with hormone analyses.

Conflicts of Interest

The authors declare no conflict of interest. The funders had no role in the design of the study; in the collection, analyses, or interpretation of data; in the writing of the manuscript, or in the decision to publish the results.

References

  1. Wu, H. Plant salt tolerance and Na+ sensing and transport. Crop J. 2018, 6, 215–225. [Google Scholar] [CrossRef]
  2. Acosta-Motos, J.; Ortuño, M.; Bernal-Vicente, A.; Diaz-Vivancos, P.; Sanchez-Blanco, M.; Hernandez, J. Plant responses to salt stress: Adaptive mechanisms. Agronomy 2017, 7, 18. [Google Scholar] [CrossRef] [Green Version]
  3. Pavlović, I.; Pěnčík, A.; Novák, O.; Vujčić, V.; Radić Brkanac, S.; Lepeduš, H.; Strnad, M.; Salopek-Sondi, B. Short-term salt stress in Brassica rapa seedlings causes alterations in auxin metabolism. Plant Physiol. Biochem. 2018, 125, 74–84. [Google Scholar] [CrossRef]
  4. Köster, P.; Wallrad, L.; Edel, K.H.; Faisal, M.; Alatar, A.A.; Kudla, J. The battle of two ions: Ca2+ signalling against Na+ stress. Plant Biol. 2018, 21, 39–48. [Google Scholar] [CrossRef] [PubMed]
  5. Shoresh, M.; Spivak, M.; Bernstein, N. Involvement of calcium-mediated effects on ROS metabolism in the regulation of growth improvement under salinity. Free Radic. Biol. Med. 2011, 51, 1221–1234. [Google Scholar] [CrossRef] [PubMed]
  6. Kravchik, M.; Bernstein, N. Effects of salinity on the transcriptome of growing maize leaf cells point at cell-age specificity in the involvement of the antioxidative response in cell growth restriction. BMC Genom. 2013, 14, 24. [Google Scholar] [CrossRef] [Green Version]
  7. Ku, Y.-S.; Sintaha, M.; Cheung, M.-Y.; Lam, H.-M. Plant hormone signaling crosstalks between biotic and abiotic stress responses. Int. J. Mol. Sci. 2018, 19, 3206. [Google Scholar] [CrossRef] [Green Version]
  8. Sharma, A.; Shahzad, B.; Kumar, V.; Kohli, S.K.; Sidhu, G.P.S.; Bali, A.S.; Handa, N.; Kapoor, D.; Bhardwaj, R.; Zheng, B. Phytohormones regulate accumulation of osmolytes under abiotic stress. Biomolecules 2019, 9, 285. [Google Scholar] [CrossRef] [Green Version]
  9. Fahad, S.; Hussain, S.; Matloob, A.; Khan, F.A.; Khaliq, A.; Saud, S.; Hassan, S.; Shan, D.; Khan, F.; Ullah, N.; et al. Phytohormones and plant responses to salinity stress: A review. Plant Growth Regul. 2015, 75, 391–404. [Google Scholar] [CrossRef]
  10. Iqbal, N.; Umar, S.; Khan, N.A.; Khan, M.I.R. A new perspective of phytohormones in salinity tolerance: Regulation of proline metabolism. Environ. Exp. Bot. 2014, 100, 34–42. [Google Scholar] [CrossRef]
  11. Khan, M.N.; Siddiqui, M.H.; Mohammad, F.; Naeem, M.; Khan, M.M.A. Calcium chloride and gibberellic acid protect linseed (Linum usitatissimum L.) from NaCl stress by inducing antioxidative defence system and osmoprotectant accumulation. Acta Physiol. Plant. 2010, 32, 121–132. [Google Scholar] [CrossRef]
  12. Dar, T.A.; Uddin, M.; Khan, M.M.A.; Hakeem, K.R.; Jaleel, H. Jasmonates counter plant stress: A Review. Environ. Exp. Bot. 2015, 115, 49–57. [Google Scholar] [CrossRef]
  13. White, P.J.; Broadley, M.R. Calcium in plants. Ann. Bot. 2003, 92, 487–511. [Google Scholar] [CrossRef] [PubMed]
  14. Manishankar, P.; Wang, N.; Köster, P.; Alatar, A.A.; Kudla, J. Calcium signaling during salt stress and in the regulation of ion homeostasis. J. Exp. Bot. 2018, 69, 4215–4226. [Google Scholar] [CrossRef] [Green Version]
  15. Yousuf, P.Y.; Ahmad, A.; Hemant, M.; Ganie, A.H.; Aref, I.M.; Iqbal, M. Potassium and calcium application ameliorates growth and oxidative homeostasis in salt-stressed indian mustard (Brassica Juncea) plants. Pak. J. Bot. 2015, 47, 1629–1639. [Google Scholar]
  16. Latef, A.; Hamed, A.A. Ameliorative effect of calcium chloride on growth, antioxidant enzymes, protein patterns and some metabolic activities of canola (Brassica napus L.) under seawater stress. J. Plant Nutr. 2011, 34, 1303–1320. [Google Scholar] [CrossRef]
  17. Iqbal, M.; Ashraf, M.; Jamil, A.; Ur-Rehman, S. Does seed priming induce changes in the levels of some endogenous plant hormones in hexaploid wheat plants under salt stress? J. Integr. Plant Biol. 2006, 48, 181–189. [Google Scholar] [CrossRef]
  18. Pittman, J.K.; Hirschi, K.D. CAX-ing a wide net: Cation/H+ transporters in metal remediation and abiotic stress signaling. Plant Biol. 2016, 18, 741–749. [Google Scholar] [CrossRef]
  19. Pokotylo, I.V.; Kretinin, S.V.; Kravets, V.S. Role of phospholipase D in metabolic reactions of transgenic tobacco cax1 cells under the influence of salt stress. Cytol. Genet. 2012, 46, 131–135. [Google Scholar] [CrossRef] [Green Version]
  20. Han, N.; Shao, Q.; Bao, H.; Wang, B. Cloning and characterization of a Ca2+/H+ antiporter from halophyte Suaeda salsa L. Plant Mol. Biol. Rep. 2011, 29, 449–457. [Google Scholar] [CrossRef]
  21. Till, B.J.; Reynolds, S.H.; Greene, E.A.; Codomo, C.A.; Enns, L.C.; Johnson, J.E.; Burtner, C.; Odden, A.R.; Young, K.; Taylor, N.E.; et al. Large-scale discovery of induced point mutations with high-throughput TILLING. Genome Res. 2003, 13, 524–530. [Google Scholar] [CrossRef] [Green Version]
  22. Lochlainn, S.Ó.; Amoah, S.; Graham, N.S.; Alamer, K.; Rios, J.J.; Kurup, S.; Stoute, A.; Hammond, J.P.; Østergaard, L.; King, G.J.; et al. High Resolution Melt (HRM) analysis is an efficient tool to genotype EMS mutants in complex crop genomes. Plant Methods 2011, 7, 43. [Google Scholar] [CrossRef] [PubMed] [Green Version]
  23. Graham, N.S.; Hammond, J.P.; Lysenko, A.; Mayes, S.; Lochlainn, S.O.; Blasco, B.; Bowen, H.C.; Rawlings, C.J.; Rios, J.J.; Welham, S.; et al. Genetical and comparative genomics of Brassica under altered Ca supply identifies Arabidopsis Ca-transporter orthologs. Plant Cell 2014, 26, 2818–2830. [Google Scholar] [CrossRef] [Green Version]
  24. Navarro-León, E.; Ruiz, J.M.; Albacete, A.; Blasco, B. Effect of CAX1a TILLING mutations and calcium concentration on some primary metabolism processes in Brassica rapa plants. J. Plant Physiol. 2019, 237, 51–60. [Google Scholar] [CrossRef] [PubMed]
  25. Wolf, B. A comprehensive system of leaf analyses and its use for diagnosing crop nutrient status. Commun. Soil Sci. Plant Anal. 1982, 13, 1035–1059. [Google Scholar] [CrossRef]
  26. Albacete, A.; Ghanem, M.E.; Martinez-Andujar, C.; Acosta, M.; Sanchez-Bravo, J.; Martinez, V.; Lutts, S.; Dodd, I.C.; Perez-Alfocea, F. Hormonal changes in relation to biomass partitioning and shoot growth impairment in salinized tomato (Solanum lycopersicum L.) plants. J. Exp. Bot. 2008, 59, 4119–4131. [Google Scholar] [CrossRef]
  27. Wan, H.; Chen, L.; Guo, J.; Li, Q.; Wen, J.; Yi, B.; Ma, C.; Tu, J.; Fu, T.; Shen, J. Genome-wide association study reveals the genetic architecture underlying salt tolerance-related traits in rapeseed (Brassica napus L.). Front. Plant Sci. 2017, 8, 593. [Google Scholar] [CrossRef]
  28. Navarro-León, E.; López-Moreno, F.J.; de la Torre-González, A.; Ruiz, J.M.; Esposito, S.; Blasco, B. Study of salt-stress tolerance and defensive mechanisms in Brassica rapa CAX1a TILLING mutants. Environ. Exp. Bot. 2020, 175, 104061. [Google Scholar] [CrossRef]
  29. Mei, H.; Zhao, J.; Pittman, J.K.; Lachmansingh, J.; Park, S.; Hirschi, K.D. In planta regulation of the Arabidopsis Ca2+/H+ antiporter CAX1. J. Exp. Bot. 2007, 58, 3419–3427. [Google Scholar] [CrossRef]
  30. Ghanem, M.E.; Albacete, A.; Martínez-Andújar, C.; Acosta, M.; Romero-Aranda, R.; Dodd, I.C.; Lutts, S.; Pérez-Alfocea, F. Hormonal changes during salinity-induced leaf senescence in tomato (Solanum lycopersicum L.). J. Exp. Bot. 2008, 59, 3039–3050. [Google Scholar] [CrossRef] [Green Version]
  31. de la Torre-González, A.; Navarro-León, E.; Albacete, A.; Blasco, B.; Ruiz, J.M. Study of phytohormone profile and oxidative metabolism as key process to identification of salinity response in tomato commercial genotypes. J. Plant Physiol. 2017, 216, 164–173. [Google Scholar] [CrossRef]
  32. Ma, X.; Zhang, J.; Huang, B. Cytokinin-mitigation of salt-induced leaf senescence in perennial ryegrass involving the activation of antioxidant systems and ionic balance. Environ. Exp. Bot. 2016, 125, 1–11. [Google Scholar] [CrossRef]
  33. Pavlů, J.; Novák, J.; Koukalová, V.; Luklová, M.; Brzobohatý, B.; Černý, M. Cytokinin at the crossroads of abiotic stress signalling pathways. Int. J. Mol. Sci. 2018, 19, 2450. [Google Scholar] [CrossRef] [Green Version]
  34. Wu, X.; He, J.; Chen, J.; Yang, S.; Zha, D. Alleviation of exogenous 6-benzyladenine on two genotypes of eggplant (Solanum melongena Mill.) growth under salt stress. Protoplasma 2014, 251, 169–176. [Google Scholar] [CrossRef]
  35. Ghanem, M.E.; Albacete, A.; Smigocki, A.C.; Frébort, I.; Pospíšilová, H.; Martínez-Andújar, C.; Acosta, M.; Sánchez-Bravo, J.; Lutts, S.; Dodd, I.C.; et al. Root-synthesized cytokinins improve shoot growth and fruit yield in salinized tomato (Solanum lycopersicum L.) plants. J. Exp. Bot. 2011, 62, 125–140. [Google Scholar] [CrossRef]
  36. Park, H.J.; Kim, W.-Y.; Yun, D.-J. A new insight of salt stress signaling in plant. Mol. Cells 2016, 39, 447–459. [Google Scholar] [CrossRef]
  37. Parida, A.K.; Das, A.B. Salt tolerance and salinity effects on plants: A review. Ecotoxicol. Environ. Saf. 2005, 60, 324–349. [Google Scholar] [CrossRef]
  38. Zörb, C.; Geilfus, C.-M.; Dietz, K.-J. Salinity and crop yield. Plant Biol. 2019, 21, 31–38. [Google Scholar] [CrossRef]
  39. Zörb, C.; Geilfus, C.-M.; Mühling, K.H.; Ludwig-Müller, J. The influence of salt stress on ABA and auxin concentrations in two maize cultivars differing in salt resistance. J. Plant Physiol. 2013, 170, 220–224. [Google Scholar] [CrossRef] [PubMed]
  40. Amjad, M.; Akhtar, J.; Anwar-ul-Haq, M.; Yang, A.; Akhtar, S.S.; Jacobsen, S.-E. Integrating role of ethylene and ABA in tomato plants adaptation to salt stress. Sci. Hortic. (Amsterdam) 2014, 172, 109–116. [Google Scholar] [CrossRef]
  41. Trivellini, A.; Lucchesini, M.; Ferrante, A.; Carmassi, G.; Scatena, G.; Vernieri, P.; Mensuali-Sodi, A. Survive or die? A molecular insight into salt-dependant signaling network. Environ. Exp. Bot. 2016, 132, 140–153. [Google Scholar] [CrossRef]
  42. Arif, Y.; Sami, F.; Siddiqui, H.; Bajguz, A.; Hayat, S. Salicylic acid in relation to other phytohormones in plant: A study towards physiology and signal transduction under challenging environment. Environ. Exp. Bot. 2020, 175, 104040. [Google Scholar] [CrossRef]
  43. Farhangi-Abriz, S.; Ghassemi-Golezani, K. How can salicylic acid and jasmonic acid mitigate salt toxicity in soybean plants? Ecotoxicol. Environ. Saf. 2018, 147, 1010–1016. [Google Scholar] [CrossRef]
Figure 1. Effect of BraA.cax1a mutations and salinity on leaf dry weight (DW) (a) and root DW (b). Values are expressed as means ± standard error (n = 9). Bars marked with different letters indicate significant differences among genotypes based on the LSD test (p < 0.05). Asterisk (*) indicates significant differences between control and 150 mM NaCl treatments.
Agronomy 10 01699 g001
Figure 2. Effect of BraA.cax1a mutations and salinity on total GA (a) and CK (b) concentrations in the leaves. Values are expressed as means ± standard error (n = 9). Bars marked with different letters indicate significant differences among genotypes based on the LSD test (p < 0.05). Asterisk (*) indicates significant differences between control and 150 mM NaCl treatments.
Agronomy 10 01699 g002
Figure 3. Scores (a) and corresponding loadings plot (b) of principal component analysis (PCA) using all parameters analyzed in R-o-18 (R), BraA.cax1a-4 (4), BraA.cax1a-7 (7), and BraA.cax1a-12 (12) plants grown under salinity conditions.
Agronomy 10 01699 g003
Table 1. Effect of BraA.cax1a mutations and salinity on analyzed cation concentration and Na+/K+ ratio in leaves.
Ca2+Na+K+Na+/K+
ControlR-o-1815.09 b3.29 a39.24 ab0.08 a
BraA.cax1a-417.61 a3.64 a38.81 ab0.09 a
BraA.cax1a-717.85 a3.23 a36.69 b0.09 a
BraA.cax1a-1218.51 a3.76 a41.14 a0.09 a
p-value*NS*NS
LSD0.052.221.054.110.02
150 mM NaClR-o-189.50 a36.74 a22.17 b1.65 ab
BraA.cax1a-48.54 a26.65 b28.15 a0.96 c
BraA.cax1a-79.57 a41.07 a22.15 b1.85 a
BraA.cax1a-1210.19 a40.68 a25.85 a1.57 b
p-valueNS******
LSD0.052.229.812.550.26
Analysis of variance
Salinity (S) ************
Mutation (M) *******
S × M NS*****
LSD0.05 1.444.542.220.12
Values are expressed as mg g−1 DW and differences between means (n = 9) were compared by Fisher’s least-significance test (LSD; p = 0.05). Values with different letters indicate significant differences among genotypes. The levels of significance were represented by p > 0.05: NS (not significant), p < 0.05 (*), p < 0.01 (**), and p < 0.001 (***).
Table 2. Effect of BraA.cax1a mutations and salinity on leaf phytohormone concentrations.
IAAGA1GA3GA4iPtZABAACCSAJA
ControlR-o-182.40 bc0.05 bnd0.02 b6.83 a180.47 a6.43 a489.79 c282.53 a131.42 b
BraA.cax1a-43.43 b 0.10 a0.080.05 a4.55 b129.43 ab4.38 ab848.95 a283.45 a68.98 c
BraA.cax1a-71.62 c0.07 bnd0.01 b2.94 b119.26 b4.13 b343.59 d317.96 a102.67 bc
BraA.cax1a-125.42 a0.06 b0.050.04 a8.54 a176.00 a6.49 a623.31 b306.47 a190.93 a
p-value**** *********NS**
LSD0.051.550.02 0.031.2956.092.1259.33165.1854.96
150 mM NaClR-o-182.03 b0.08 c0.03 c0.04 b5.10 b231.93 b13.93 b515.55 c611.82 c125.07 c
BraA.cax1a-43.14 a0.16 ab0.18 a0.11 a2.91 c355.02 a21.86 a1234.98 a942.16 ab201.57 ab
BraA.cax1a-72.95 ab0.18 a0.05 bc0.03 b7.82 a382.54 a16.86 ab695.43 b1035.42 a168.46 bc
BraA.cax1a-122.79 ab0.09 bc0.07 b0.04 b2.94 c255.38 b15.01 b722.12 b795.16 bc224.16 a
p-value*******************
LSD0.051.040.070.040.0 42.0563.885.62164.17206.8550.51
Analysis of variance
Salinity (S) NS*** ******************
Mutation (M) ****** *****NSNS********
S × M **NS NS**************
LSD0.05 0.860.03 0.021.1139.072.7680.24121.6734.31
Values are expressed as ng g−1 DW and differences between means (n = 9) were compared by Fisher’s least-significance test (LSD; p = 0.05). Values with different letters indicate significant differences among genotypes. The levels of significance were represented by p > 0.05: NS (not significant), p < 0.05 (*), p < 0.01 (**), and p < 0.001 (***).
Publisher’s Note: MDPI stays neutral with regard to jurisdictional claims in published maps and institutional affiliations.

