Foliar Micronutrient Application for High-Yield Maize
by
 , and
, and
Zachary P. Stewart
1,2,3,4,* ,
,
Ellen T. Paparozzi
2,
Charles S. Wortmann
2,
Prakash Kumar Jha
1 and
and
Charles A. Shapiro
2,5 1
Feed the Future Innovation Lab for Collaborative Research on Sustainable Intensification, Kansas State University, Manhattan, KS 66506-4004, USA
2
Department of Agronomy and Horticulture, University of Nebraska, Lincoln, NE 68583-0915, USA
3
Department of Agronomy, Kansas State University, Manhattan, KS 66506, USA
4
United States Agency for International Development, Bureau for Resilience and Food Security, Center for Agriculture-Led Growth, 1300 Pennsylvania Ave NW, Washington, DC 20004, USA
5
Haskell Agriculture Laboratory, 57905 866 Road, Concord, NE 68728-2828, USA
*
Author to whom correspondence should be addressed.
Agronomy 2020, 10(12), 1946; https://0-doi-org.brum.beds.ac.uk/10.3390/agronomy10121946
Submission received: 17 November 2020
/
Revised: 2 December 2020
/
Accepted: 7 December 2020
/
Published: 11 December 2020
(This article belongs to the Special Issue Biostimulants and Micronutrients: Innovative Tools to Increase Crop Quality and Abiotic Stress Tolerance in Plants)
Abstract
:Nebraska soils are generally micronutrient sufficient. However, critical levels for current yields have not been validated. From 2013 to 2015, 26 on-farm paired comparison strip-trials were conducted across Nebraska to test the effect of foliar-applied micronutrients on maize (Zea mays L.) yield and foliar nutrient concentrations. Treatments were applied from V6 to V14 at sites with 10.9 to 16.4 Mg ha−1 yield. Soils ranged from silty clays to fine sands. Soil micronutrient availability and tissue concentrations were all above critical levels for deficiency. Significant grain yield increases were few. Micronutrient concentrations for leaf growth that occurred after foliar applications were increased 4 to 9 mg Zn kg−1 at 5 of 17 sites with application of 87 to 119 g Zn ha−1, 12 to 16 mg kg−1 Mn at 2 of 17 sites with application of 87 to 89 g Mn ha−1, and an average of 8.1 mg kg−1 Fe across 10 sites showing signs of Fe deficiency with application of 123 g foliar Fe ha−1. Foliar B concentration was not affected by B application. Increases in nutrient concentrations were not related to grain yield responses except for Mn (r = 0.54). The mean, significant grain yield response to 123 g foliar Fe ha−1 was 0.4 Mg ha−1 for the 10 sites with Fe deficiency symptoms. On average, maize yield response to foliar Fe application can be profitable if Fe deficiency symptoms are observed. Response to other foliar micronutrient applications is not likely to be profitable without solid evidence of a nutrient deficiency.
1. Introduction
Nebraska soils are generally micronutrient sufficient with few sites with soil and/or plant tissue samples below critical values for maize production. However, critical levels have not been validated for current yield levels. Production of 12.0 Mg ha−1 of maize grain requires 1.4 kg Fe, 0.5 kg Mn, 0.5 kg Zn, and 0.08 kg B ha−1 [1]. For most Nebraska soils, agronomic crops are most likely constrained from reaching their genetic and environmental potential by insufficient N and water availability [2] but other growth factors become more likely to be limiting as these factors are exceedingly met according to Julius von Liebig and Carl Sprengel’s “Law of the Minimum” [3]. Thus, the likelihood of a micronutrient deficiency being the yield limiting factor then increases [4]. Maize, especially when high yielding, has high rates of nutrient uptake during the V4 to VT stage during which demand may exceed supply. Foliar application of micronutrients during this period to complement soil nutrient supply is commonly practiced worldwide [5,6], and promoted by the fertilizer industry. Further, most foliar micronutrient supplements can be tank mixed with herbicides and pesticides, which adds to their convenience and appeal.
Plant leaves are specialized in capturing light and CO2, but their ability to absorb nutrients has long been recognized and used in nutrient management [7]. Foliar-applied micronutrients penetrate the leaf surface through the cuticle, cuticular cracks and imperfections, stomata, trichomes, and lenticels [4]. Boron (B), manganese (Mn), iron (Fe), and zinc (Zn) are essential micronutrients of general interest to maize producers and agronomists. These micronutrients were selected for inclusion in this study based on extensive discussions with Nebraska agronomists with reference to plant tissue analysis and as a result of a soil and plant tissue survey [8].
The effectiveness of foliar micronutrient applications varies significantly in relation to their solubility and ingredients such as salts, surfactants, complexes, or chelates. When evaluating micronutrient effects, it is likely not adequate to evaluate a singular micronutrient formulation [8,9,10,11]. In an attempt to avoid this pitfall, the goal of this study is to evaluate commercial formulations, which included a variety of micronutrient mixes with a variety of additives. Past research of micronutrient foliar application on maize has had mixed results. In one study, maize grain yield was increased by nearly 18% over three years with the application of 1.0 to 1.5 kg foliar Zn ha−1 [12], while many others reported no significant increase in yield [13,14,15].
Nutrient concentrations in plant tissue are widely used for determining the nutritional status of maize during the growing season. Deficiency of any one of the 14 essential plant nutrients can limit plant growth. Plant analysis uses this foundational concept by comparing the nutrient concentration of a particular plant part with established species-specific critical values or sufficiency ranges. A nutrient concentration below the sufficiency range or critical value implies deficiency and potential for yield response to application of the nutrient [16]. We also theorize that plants that have received micronutrient application will have greater nutrient concentrations of the applied micronutrient in new tissues, which has been demonstrated with soybeans under similar field conditions in Iowa [17].
The objective of this study is to evaluate the effect of foliar-applied micronutrients on grain yield and plant tissue nutrient concentrations under current management practices using commercially available foliar micronutrient products as guided by soil and plant tissue testing. Our hypotheses, based on responding to that approach from the field, are that (1) higher yielding sites will have a greater likelihood of yield response to micronutrient application, (2) yield response to micronutrient application will occur where foliar and soil concentrations are below critical levels or displaying deficiency symptoms of the corresponding micronutrient, and (3) applied micronutrients will increase their corresponding foliar concentration. Though we acknowledge the importance of nutrient ratios being important to yield response, this hypothesis was not investigated.
2. Materials and Methods
2.1. Field Sites
During 2013 to 2015, 26 paired comparison strip trials were performed across Nebraska (Table 1 and Figure 1) in order to test the effect of commercial foliar micronutrient products on grain yield. Sites were selected to be representative of Nebraska soils and encompassed 23 soil series (Table 1). The selected sites had no history of micronutrient or manure applications in the previous 10 years. Nebraska soils are generally micronutrient fertile so finding micronutrient deficient sites proved to be relatively unobtainable [18] as confirmed by a state-wide survey of soil and plant tissue samples and data obtained from Nebraska agronomic testing laboratories [8]. Preseason N applications varied by source, application time, and rate but all sites applied N at a rate sufficient for at least 12.0 Mg ha−1 maize grain production [19].
2.2. Treatments
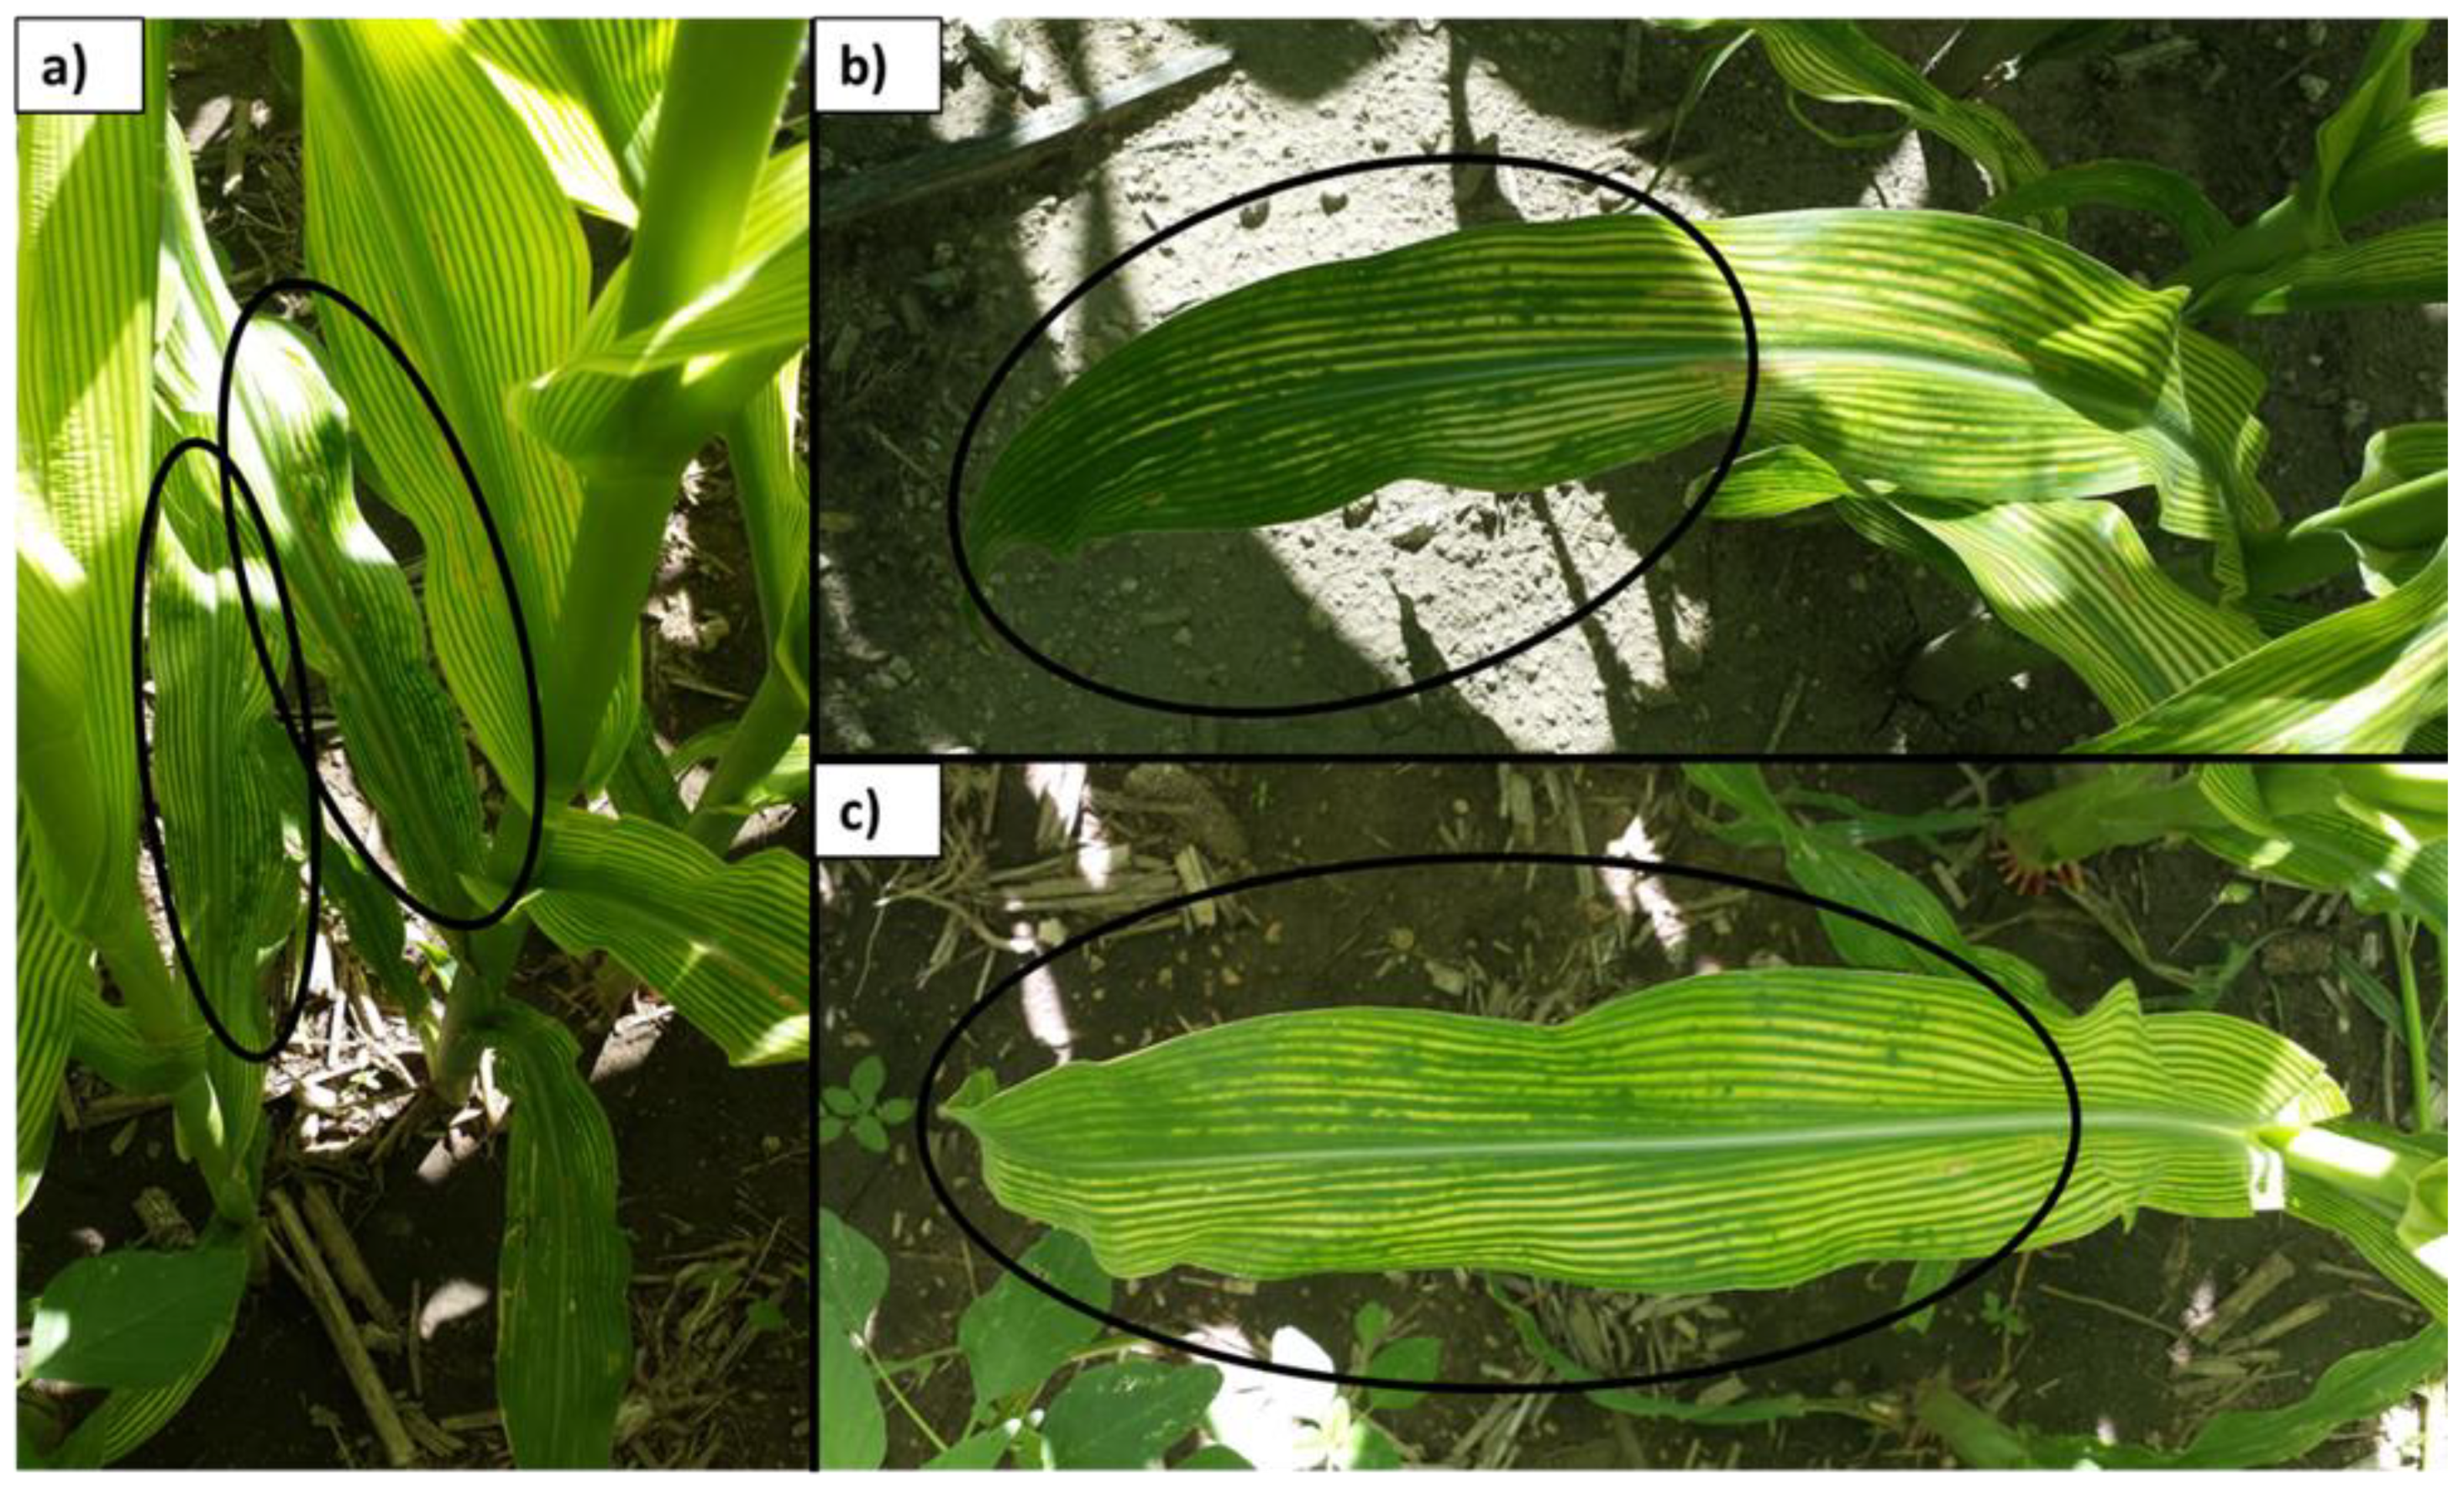
Sites had between three and 20 replications (i.e., strips) depending on farmer equipment and willingness (Table 2). Two of the 26 trials were on popcorn (Zea mays everta) (Table 1). Each of the foliar micronutrient applications were selected by the producer and their local agronomist as to best fit the micronutrient needs of each field and based on prior soil and plant tissue recommendations from commercial laboratories. No initial soil micronutrient levels were below critical levels (Ward, 2015) and no plant tissue micronutrient concentrations were below reported critical values for maize prior to tasseling [20]. Maize leaves at sites 20–24 had interveinal chlorosis (Figure 2), which can be an indication of micronutrient deficiency though plant tissue samples were above critical levels.
Products ranged in micronutrient application rate, method and time, adjuvant formulation, and crop growth stage (Table 2). Management practices varied according to the producers’ preferences (Table 1) and soil properties (Table 3). Applications were applied aerially or with a high-clearance applicator in strips with and without the foliar applications and split into adjacent pairs for analysis. Strips ranged in size from approximately 27 to 34 m wide × 715 m long. The high-clearance applicator did not pass through control strips.
2.3. Sampling and Laboratory Analyses
Plant tissue samples were collected once after application and were composed of 10 unsprayed upper most fully collared leaves [21] and a soil sample of 0–20 cm depth was collected and composed of 14 cores per strip. Grain yield was determined for each strip from 10 m2 strip−1 by hand harvest or with a weigh wagon or yield monitor for one combine pass. Grain weight was adjusted to 155 g kg−1 water content. Corresponding plant tissue, soil samples, and grain yield were all collected from the same strip.
Laboratory analysis of plant tissue P, K, S, Fe, Mn, Zn, and B were completed using microwave nitric acid digestion and concentrations determined using inductively-coupled plasma emission spectroscopy (ICP-ES) [22]. Tissue N concentration was determined using the Dumas Method with a Leco FP-428, St. Joseph, MI, USA [23]. Soil samples were dried at 40 °C and ground to pass through a 2-mm sieve prior to analysis. Extractions were with DPTA (diethylenetriaminepentaacetic acid) for B, Mn, and Zn and were extracted with 0.1 N HCl for Fe and Cu and measured with ICAP detection [24] or with sorbitol ICAP detection for B.
2.4. Statistical Design and Analysis
The experimental design was a paired comparison strip trial (26 paired comparisons). This design was chosen to allow maize producers to use conventional practices to apply (i.e., high clearance and aerial applicators) and select their foliar micronutrient applications based on their relationship with their local agronomist, the availability of foliar micronutrient formulations, and their knowledge of which micronutrient formulation best fits their field site’s demand. Site data was analyzed separately and data from sites with identical treatments (i.e., fertilizer source) and crop were combined and analyzed across sites and years. Yield and plant tissue nutrient concentration data were analyzed using the ANOVA procedure in Statistix 10.0 Analytical Software (Analytical Software Tallahassee, FL, USA) with the assumption of fixed treatment and site effects. A mean comparison test using Tukey’s HSD was used to compare treatment effects. Data were managed using Microsoft Excel (Microsoft Excel 2013, Microsoft Corp. Santa Rosa, CA, USA) and plotted to test correlations of plant tissue and soil properties with grain yield response using the scatterplot and Pearson correlation coefficient (r) function.
3. Results and Discussion
3.1. Field Sites
Soil test values for micronutrients were above published critical levels at all sites [25] (Table 3) though visual signs of Fe deficiency were observed at some locations. The soil B, Fe, Mn, and Zn concentrations (mg kg−1) ranged from 0.3 to 1.0 for B, 4.0 to 71.7 for Fe, 2.0 to 23.2 for Mn, and 1.0 to 6.7 for Zn. Soil organic matter ranged from 10 to 33 g kg−1 and pH ranged from 5.6 to 8.2. Sites included clays, loams, and sands (Table 3). Plant tissue micronutrient concentrations were also above published critical levels at all sites according to Bryson et al. (2014). Maize tissue B, Fe, Mn, and Zn concentrations (mg kg−1) ranged from 3.7 to 16 for B, 59 to 213 for Fe, 38 to 109 for Mn, and 18 to 57 for Zn in untreated plots prior to tassel. The only visual signs of deficiency were at sites 20–24. These sites had high soil pH and plant leaves showed interveinal chlorosis (Figure 2) in upper leaves indicating Fe deficiency although soil and foliar Fe analysis did not indicate deficiency.
3.2. Effects of Foliar Micronutrients on Grain Yield
The effect of foliar micronutrient application at sites 1–19 was not significant for leaf micronutrient concentrations and grain yield with grain yield effects ranging from −0.38 to 0.75 Mg ha−1 (Table 4). There were no significant yield increases for any micronutrient product when averaged over the three years (Table 5). In conditions with visual signs of deficiency, although above critical plant tissue levels, foliar Fe supplementation was effective at increasing grain yield by an average of 0.4 Mg ha−1 (Figure 3). There were several significant (p < 0.05) treatment*site interactions of the treatments on grain yield. These interactions were likely due to unique site conditions such as soil parameters or various hybrids varying in their micronutrient responsiveness.
Overall, there was no significant yield difference across all sites receiving micronutrient application. In conditions without confirmed micronutrient deficiency, yield responses were unpredictable (i.e., as based on prior soil and plant nutrient concentrations) with significant yield increases for sites 1, 14, and 23 and significant decreases for sites 10 and 13 (Table 4). These sites had some combination of foliar B, Mn, Zn, and Fe applied. Site 23 received foliar Fe only (Table 1). The soil pH for the responsive sites ranges from 5.6 to 7.8 and likely affected micronutrient availability and the likelihood of response. Overall, maize grain yield was 0.69 Mg ha−1 greater when micronutrients were applied though not significant. The average of significant yield decreases was −0.38 Mg ha−1, which was also not significant. The negative responses only occurred with high-clearance application at V8 and V11 and not by aerial application, which contributed to the uncontrolled variability related to on-farm field trials. This suggests that the yield reduction may be associated with damage incurred during treatment application, as the high-clearance applicator did not pass through the control strips. Additionally, none of the applied micronutrients from the blends led to toxic levels in plant tissue.
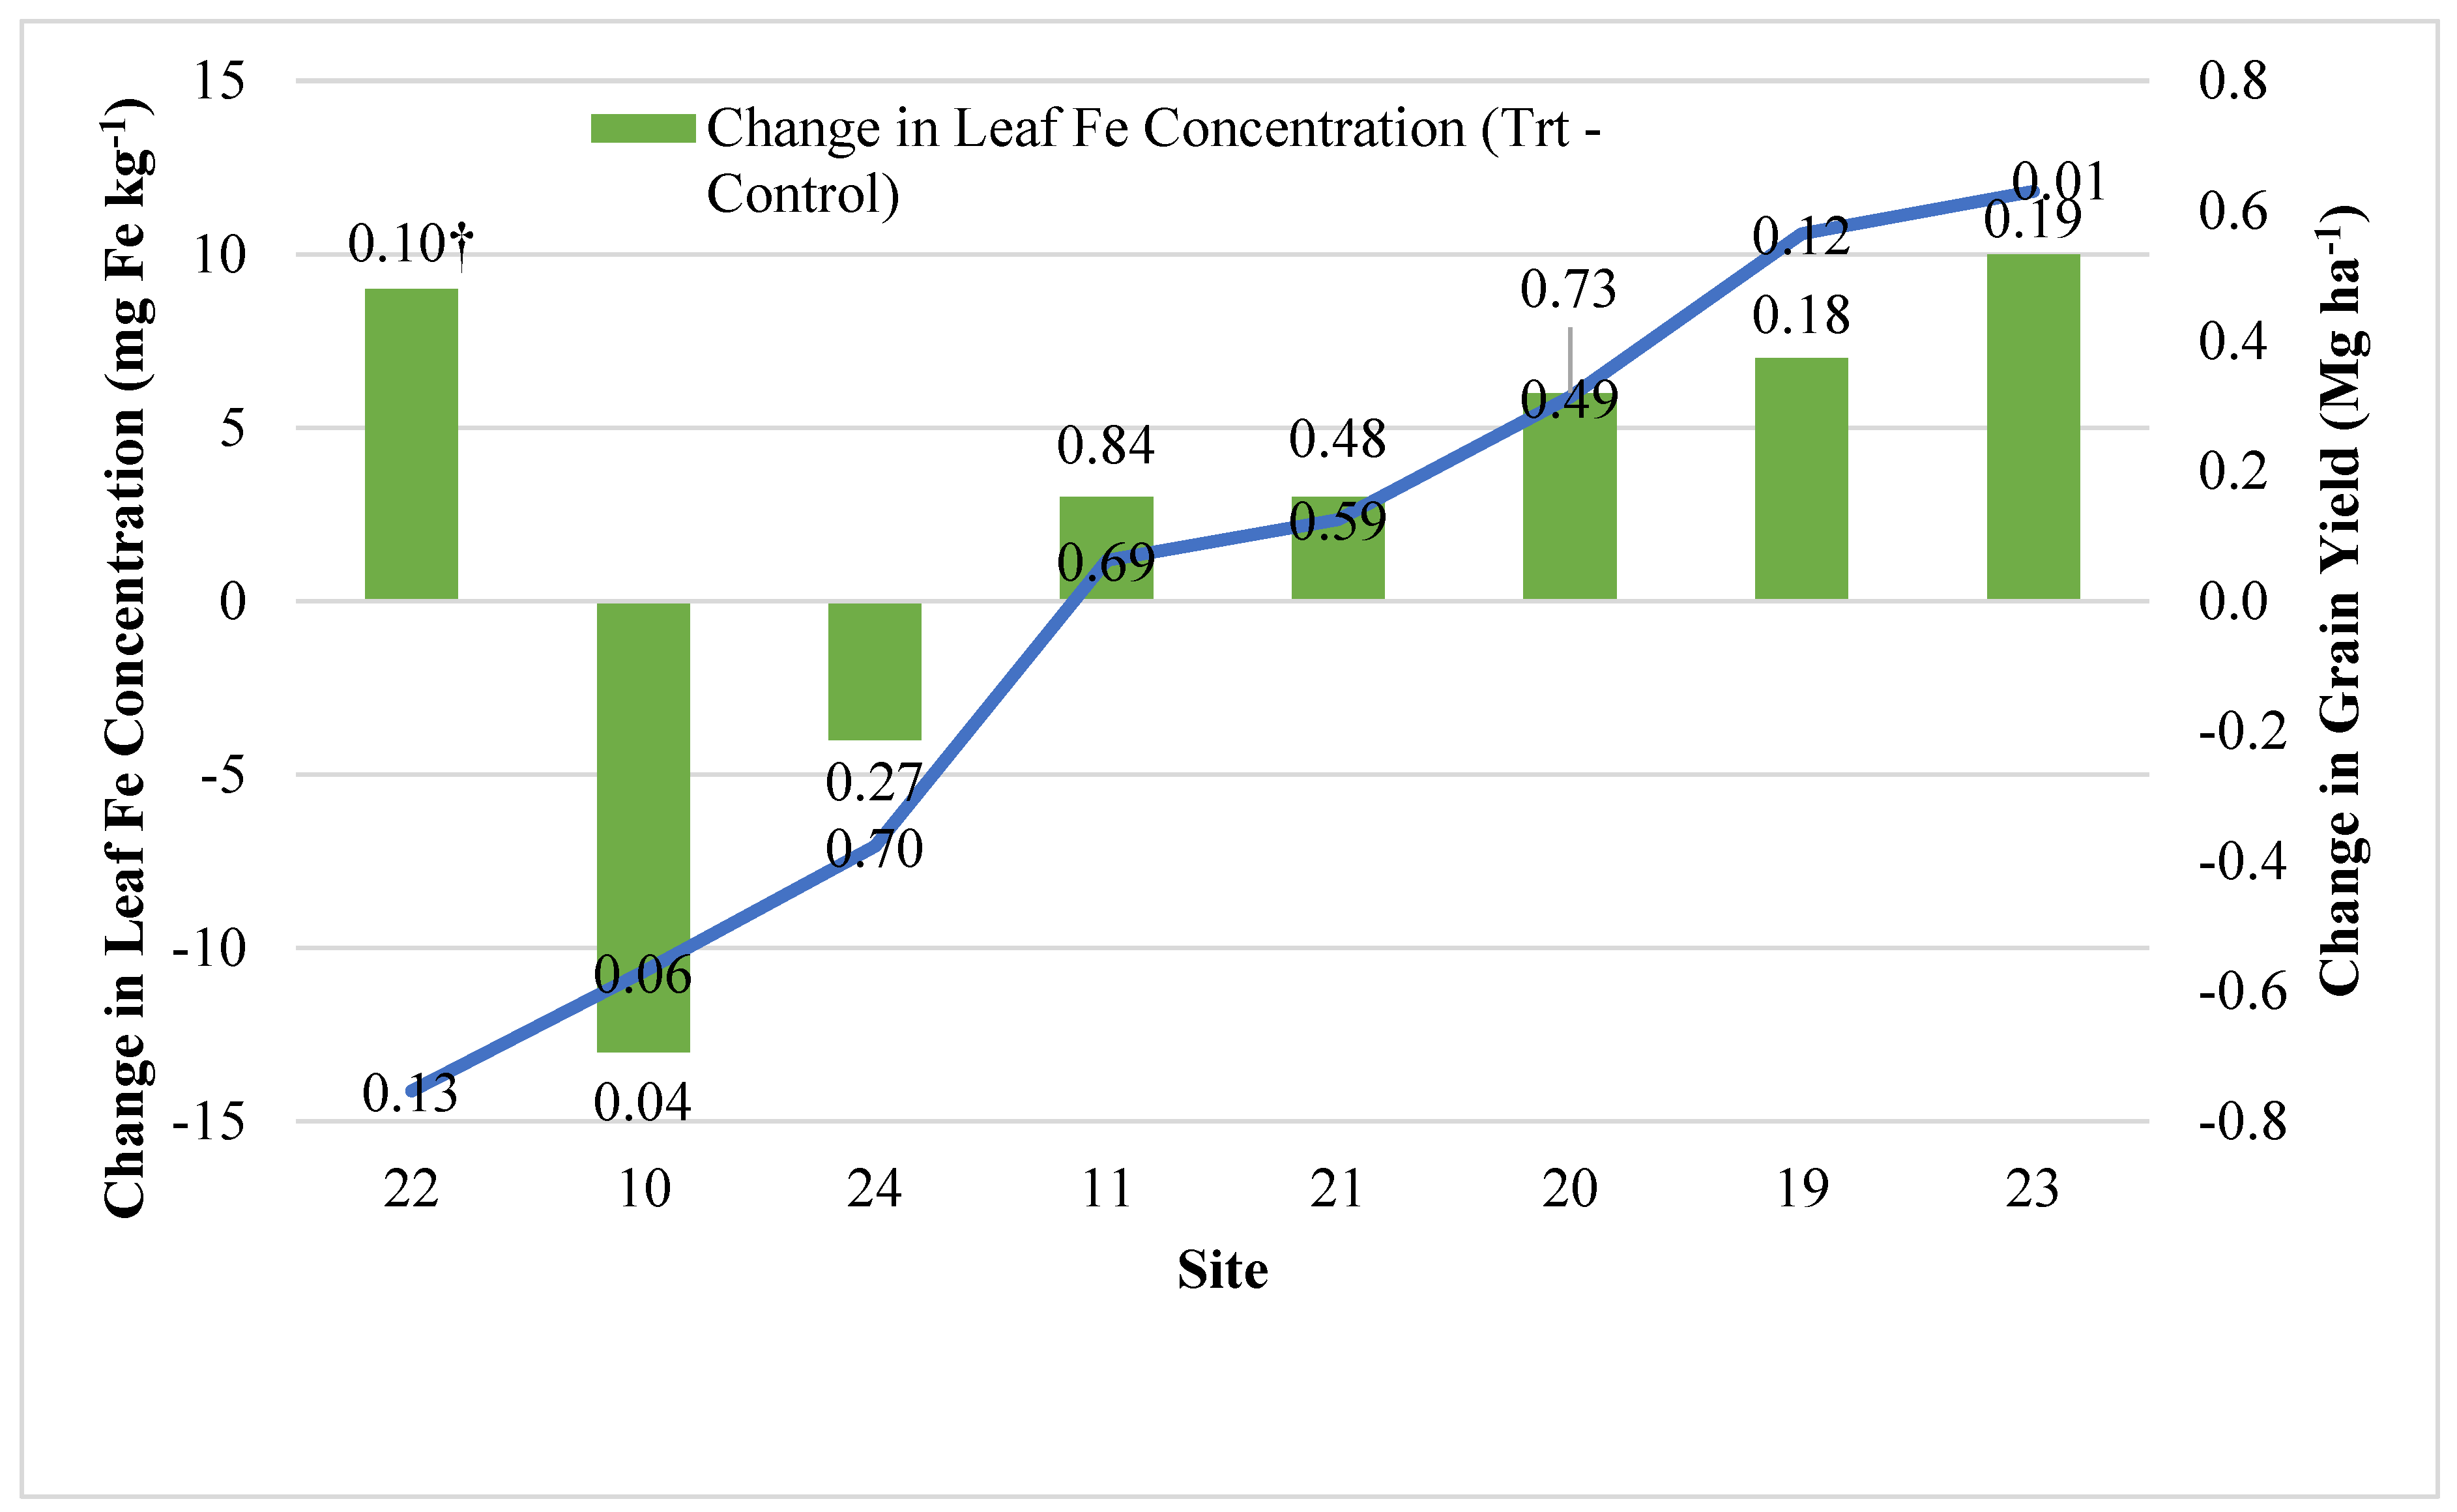
Inversely, the combined analysis of variance for identical treatments at four different sites in 2015 indicates that an aerial foliar application of 123 g Fe ha−1 increased grain yield (p = 0.04) by an average of 0.4 Mg ha−1 with soil pH of 7.2 to 8.0, soil test Fe of 8.0 to 13.0 mg kg−1, tissue Fe concentration prior to tassel of 68 to 86 mg kg−1, and visual signs of Fe deficiency (Figure 2) (Table 5). Additionally, visual observations of treated strips showed small regreening patterns where foliar Fe droplets contacted the leaf surface on the V5−6 leaf (Figure 2). No regreening appeared in upper untreated leaves (Figure 2a). Iron and most micronutrients are considered relatively immobile within plant tissue (Bryson et al., 2014). Thus, no regreening in upper untreated new growth leaves was expected nor observed, confirming previously described deficiency correction theory [20]. However, plant and soil Fe concentrations alone were not predictive indicators of grain yield response to foliar Fe. This is consistent with the findings from a hydroponics study evaluating foliar Fe [26]. Micronutrient supplementation must be both predictable for grain yield response and lead to an increase that is great enough to cover the added cost, which is not evident in these trials. It is of note that the lack of significant yield differences may also be due to high levels of variability as in the case of on-farm field trials (i.e., type ll error).
3.3. Effects of Foliar Micronutrients on Leaf Tissue Concentrations
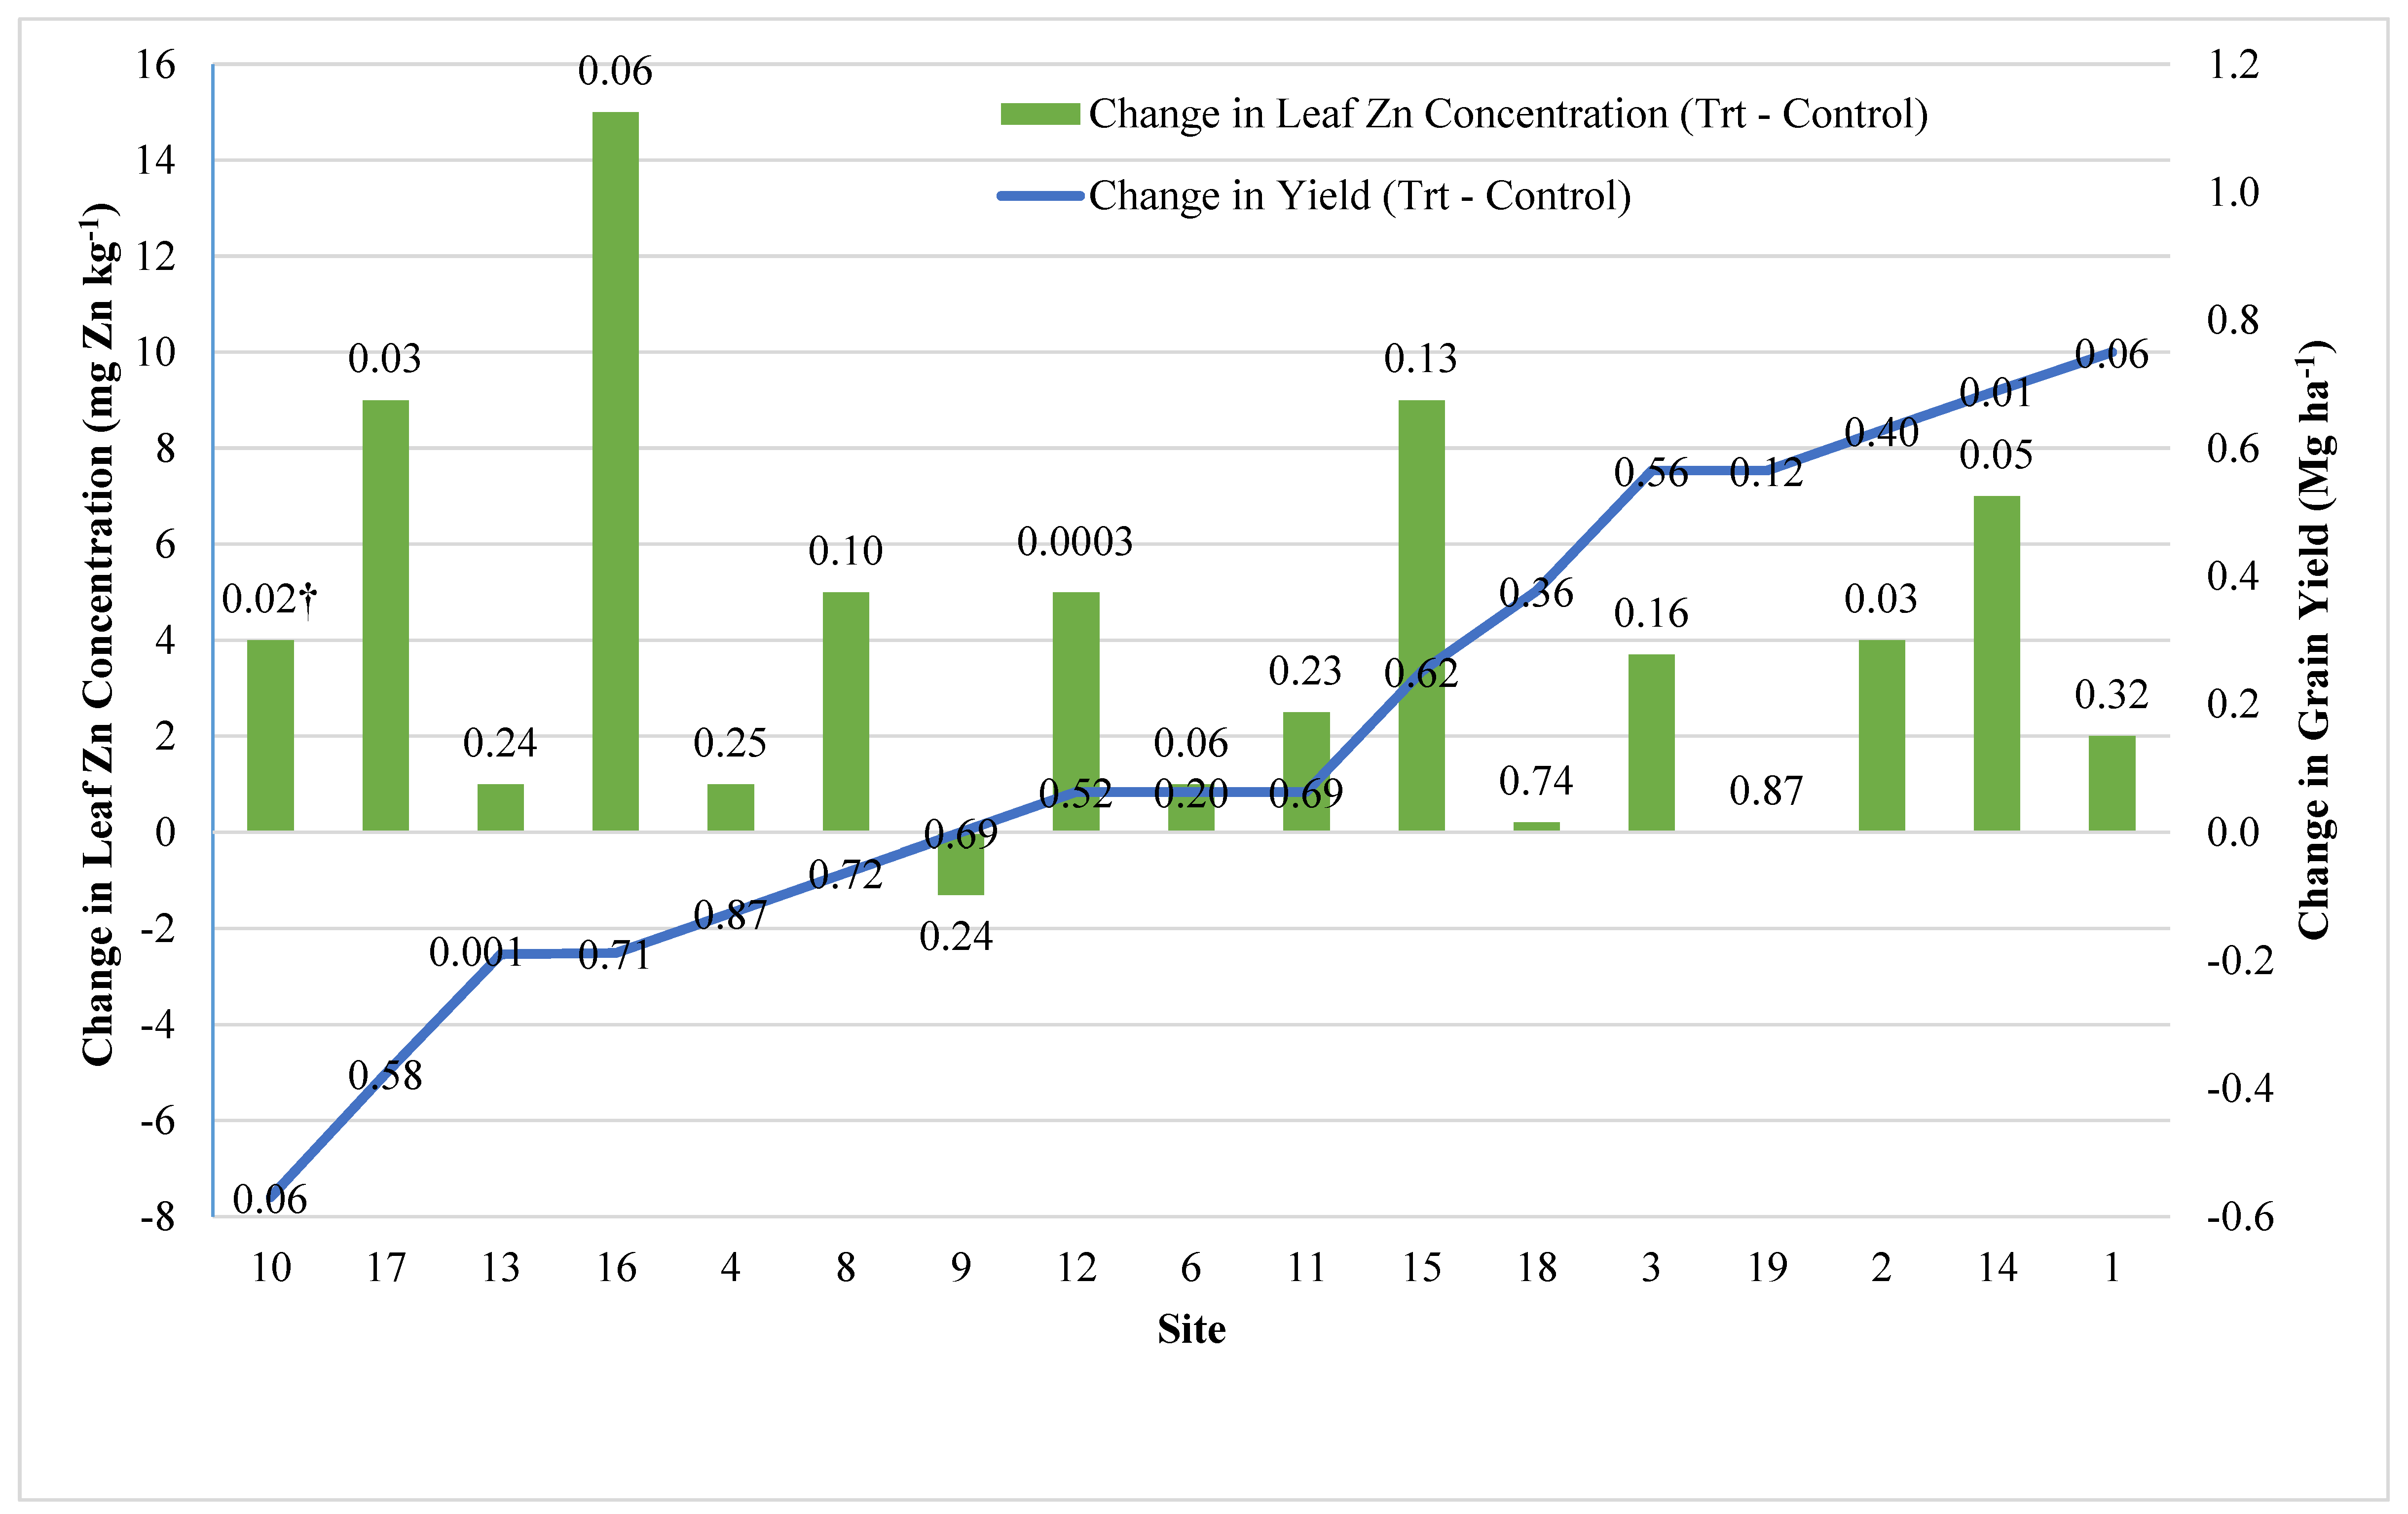
Foliar micronutrient applications were more consistent in increasing their respective micronutrient concentrations in leaf tissue than in increasing grain yield, especially in the case of Zn (Figure 3, Figure 4, Figure 5 and Figure 6) (Table 4). Of the sites that received foliar Zn, 47% had a nearly significant increase (p < 0.10) of an average of 4 mg Zn kg−1 in the leaf tissue (Figure 4) (Table 5) which is consistent with other results from a hydroponic greenhouse study (Stewart et al., 2019). In general, the primary nexus for deciding to apply Zn was high, yielding maize locations aiming to boost yields with low plant or soil Zn concentrations but otherwise not below critical levels. Foliar application also affected plant N and P concentrations. The combined analysis of sites 1, 2, and 3 which received 116, 87, 87, 87, and 7 g of N, S, Mn, Zn, and B ha−1, respectively, increased plant N by 1.3 g kg−1 and plant P by 0.2 g kg−1 (p < 0.05) (Table 5). The increase in N would be expected with the addition of foliar N, and sulphur application also has synergistic impact on N uptake in plant [27]. The increase in P may have been due to the interaction of P with Fe, Mn, or Zn [28].
For the combined year and site analysis, foliar applications of 87 to 119 g Zn ha−1 at 17 sites, regardless of product formulation, significantly increased Zn concentration (p < 0.05) in plant tissue by 2.9 to 6.1 mg kg−1; however, these increases were not consistently associated with an increase in grain yield (Table 4). Foliar applications of 87 to 89 g Mn ha−1 at 17 sites also had increased plant tissue Mn concentrations by 9.3 (p < 0.05) to 4.2 (p < 0.10) mg kg−1, with a positive correlation with increased grain yield r = 0.54 but without a significant three-year average yield increase in any product formulation (Figure 5; Table 5). One site (i.e., site 10) had a significant decrease in Mn and Fe due to their application from 109 to 96 g Mn ha−1 and 141 to 128 g Fe ha−1., which corresponded with a decrease in grain yield by 0.57 kg ha−1 (p = 0.06). Foliar applications of B at a rate of 3 to 235 g B ha−1 did not affect plant tissue B concentrations nor grain yield at any of the 15 sites receiving foliar B (Table 4; Figure 6). Though there was a direct linkage between the application of a micronutrient blend and the increase in the corresponding nutrient in the plant tissue, we cannot establish a direct relationship between any singular nutrient and the lack of grain yield response.
Application of 123 g foliar Fe ha−1 at four sites increased plant tissue Fe concentration (p = 0.1) with correlated yield increases that averaged 0.4 Mg ha−1 (p = 0.04) (Table 5). This response of plant tissue concentrations and grain yield to the foliar Fe application was consistent with the deficiency correction theory in that there were visual signs of Fe deficiency identified at sites 20–23 prior to foliar Fe application and thus, there was an increase in grain yield due to the application of Fe. However, neither the soil nor the plant tissue concentrations were below reported critical values for Fe and thus were not predictive of the associated increase in grain yield. This may also suggest that the critical levels for plant tissue and soil Fe may need to be updated and that precision agriculture technologies may be valuable to match deficiency symptoms with application [29]. Additionally, sites receiving foliar B, Mn, and Zn applications under conditions with no respective deficiency identified by plant tissue samples, soil samples, or visual symptoms, did not have a yield increase for a three-year average.
3.4. Relationship between Higher Grain Yield and Response to Foliar Micronutrients
Due to increased micronutrient demand of higher yielding sites, we hypothesized that sites with higher yields and lower micronutrient plant or soil concentrations but not necessarily below critical levels, may be more likely to have increased yield response due to foliar micronutrient supplementation. The combined analysis for maize production sites showed no relationship (r = 0.03) between yield level and yield response to foliar micronutrient supplementation (Figure 7). Additionally, sites with micronutrient concentrations in soil or plant tissue near critical levels but not below were not consistently associated with an increased likelihood of increased grain yield (r < 0.1). Neither soil organic matter, pH, nor soil/plant P was correlated (r < 0.01) with a positive increase in grain yield.
4. Conclusions
The objective of these on-farm strip-trials was to evaluate the effect of foliar-applied micronutrients on grain yield and plant tissue nutrient status under current management practices using commercially available foliar micronutrients. This research was conducted across a wide range of irrigated maize production conditions, and the results are widely applicable to high yield maize production with similar soil and plant micronutrient status. These data are largely supportive of the deficiency correction theory and refute the use of foliar micronutrient applications for high-yield situations. Higher yielding locations were not associated with an increased likelihood of response to foliar micronutrients, thus rejecting the first hypothesis.
Soil test results and plant tissue nutrient concentrations were found to not be predictive of yield response under high-yielding conditions. However, no sites reported soil or plant tissue micronutrient concentrations below critical levels [20]. Nonetheless, there were some significant yield increases indicating a need for better means of predicting yield response to foliar micronutrient application if such treatments are to be profitable. These results are not sufficient to revise previously established critical values but do suggest that sites with plant tissue concentration or soil availability for Fe near to critical levels may still be candidates for foliar Fe application, especially if associated deficiency symptoms and calcareous soil. The mean grain yield response to 123 g foliar Fe ha−1 was 0.4 Mg ha−1 for the four sites with Fe deficiency symptoms. Without visual signs of deficiency or other confirmation of a micronutrient deficiency, yield response to foliar applications of micronutrients remains elusive, thus accepting the second hypothesis for visual signs of deficiency being associated with an increased likelihood of response but rejecting the hypothesis for critical levels being associated with an increased likelihood of response.
Though the use of foliar micronutrient blends made it challenging to decipher which nutrient had the causal relationship with changes in grain yield, the causal linkage of the applied micronutrient to changes in leaf tissue concentration were clearer. Micronutrient concentrations for leaf growth that occurred after foliar applications were significantly increased for Zn, Mn, and Fe but not for B. Thus, the third hypothesis is accepted that applied micronutrients will increase their corresponding foliar concentration for Zn, Mn, and Fe and reject for B.
Author Contributions
Conceptualization, Z.P.S., E.T.P., C.S.W., and C.A.S.; methodology, Z.P.S., E.T.P., C.S.W., and C.A.S.; formal analysis, Z.P.S.; data curation, Z.P.S.; writing—original draft preparation, Z.P.S.; writing—review and editing, Z.P.S., E.T.P., C.S.W., P.K.J., and C.A.S.; supervision, E.T.P., C.S.W., and C.A.S.; project administration, Z.P.S.; funding acquisition, C.A.S. All authors have read and agreed to the published version of the manuscript.
Funding
This research was funded by the Nebraska Corn Board and Winfield Solutions. Manuscript preparation was made possible with the support of the American People provided to the Feed the Future Innovation Lab for Sustainable Intensification through the United States Agency for International Development (USAID). The contents are the sole responsibility of the authors and do not necessarily reflect the views of USAID or the United States Government. Program activities are funded by the United States Agency for International Development (USAID) under Cooperative Agreement No. AID-OAA-L-14-00006.
Acknowledgments
The authors would like to thank the University of Nebraska’s Institute of Agriculture and Natural Resources, Nebraska Corn Board, and Winfield Solutions for providing partial funding for this research as well as the Feed the Future Innovation Lab for Sustainable Intensification for supporting the manuscript preparations. Collaboration of the Nebraska On-Farm Research Network and collaborating farmers was valuable.
Conflicts of Interest
The authors declare no conflict of interest. The funders had no role in the design of the study; in the collection, analyses, or interpretation of data; in the writing of the manuscript, or in the decision to publish the results.
References
- Bender, R.R.; Haegele, J.W.; Ruffo, M.L.; Below, F.E. Nutrient uptake, partitioning, and remobilization in modern, transgenic insect-protected maize hybrids. Agron. J. 2013, 105, 161–170. [Google Scholar] [CrossRef] [Green Version]
- Dobermann, A.; Shapiro, C.A. Setting a Realistic Corn Yield Goal; Cooperative Extension, Institute of Agriculture and Natural Resources, University of Nebraska-Lincoln: Lincoln, NE, USA, 2004. [Google Scholar]
- van der Ploeg, R.R.; Kirkham, M. On the origin of the theory of mineral nutrition of plants and the law of the minimum. Soil Sci. Soc. Am. J. 1999, 63, 1055–1062. [Google Scholar] [CrossRef] [Green Version]
- Marschner, P. Marschner’s Mineral Nutrition of Higher Plants; Academic Press: New York, NY, USA, 2012. [Google Scholar]
- Fageria, N.; Filho, M.B.; Moreira, A.; Guimaraes, C. Foliar fertilization of crop plants. J. Plant Nutr. 2019, 32, 1044–1064. [Google Scholar] [CrossRef]
- Kannan, S. Foliar Fertilization for Sustainable Crop Production. Genetic Engineering, Biofertilisation, Soil Quality and Organic Farming; Springer: Amsterdam, The Netherlands, 2010; pp. 371–402. [Google Scholar]
- Fernández, V.; Eichert, T. Uptake of hydrophilic solutes through plant leaves: Current state of knowledge and perspectives of foliar fertilization. Crit. Rev. Plant Sci. 2009, 28, 36–68. [Google Scholar] [CrossRef] [Green Version]
- Stewart, Z.P. Micronutrient Foliar Analysis and Supplementation in Nutrient Management for High Yield Maize (Zea mays L.). Doctoral Dissertation, University of Nebraska-Lincoln, Lincoln, NE, USA, 2016. [Google Scholar]
- Fernández, V.; Ebert, G. Foliar iron fertilization: A critical review. J. Plant Nutr. 2005, 28, 2113–2124. [Google Scholar] [CrossRef] [Green Version]
- Wojcik, P. Uptake of mineral nutrients from foliar fertilization. J. Fruit Ornam. Plant Res. 2004, 12, 201–218. [Google Scholar]
- Zhang, Q.; Brown, P.H. The mechanism of foliar zinc absorption in pistachio and walnut. J. Am. Soc. Hortic. Sci. 1999, 24, 312–317. [Google Scholar] [CrossRef]
- Potarzycki, J.; Grzebisz, W. Effect of zinc foliar application on grain yield of maize and its yielding components. Plant Soil Environ. 2009, 55, 519–527. [Google Scholar] [CrossRef] [Green Version]
- Heckman, J.R. Foliar applied boron for high yield corn: Research update. Mid Atl. Grain Forage J. 2002, 8, 24–25. [Google Scholar]
- Mueller, N.D.; Diaz, D.A.R. Improving corn and soybean yields with starter and foliar fluid fertilizers. Proc. 2011 Fluid Forum 2011, 28, 108. [Google Scholar]
- Nelson, K.A.; Meinhardt, C. Foliar boron and pyraclostrobin effects on corn yield. Agron. J. 2011, 103, 1352–1358. [Google Scholar] [CrossRef]
- Mundorf, T.; Wortmann, C.; Shapiro, C.; Paparozzi, E. Time of day effect on foliar nutrient concentrations in corn and soybean. J. Plant Nutr. 2015, 38, 2312–2325. [Google Scholar] [CrossRef]
- Enderson, J.T.; Mallarino, A.P.; Haq, M.U. Soybean yield response to foliar-applied micronutrients and relationships among soil and tissue tests. Agron. J. 2015, 107, 2143–2161. [Google Scholar] [CrossRef]
- Maharjan, B.; Shaver, T.M.; Wortmann, C.S.; Shapiro, C.A.; Ferguson, R.B.; Krienke, B.T.; Stewart, Z.P. Micronutrient management in Nebraska. 2018. Nebraska Extension. NebGuide G1830MR. Available online: https://cropwatch.unl.edu/2018/new-nebguide-micronutrient-management-nebraska (accessed on 24 April 2018).
- Shapiro, C.A.; Ferguson, R.B.; Hergert, G.W.; Dobermann, A.; Wortmann, C. Fertilizer Suggestions for Corn; Cooperative Extension, Institute of Agriculture and Natural Resources, University of Nebraska-Lincoln: Lincoln, NE, USA, 2003. [Google Scholar]
- Bryson, G.M.; Mills, H.A.; Sasseville, D.N.; Jones, J.B., Jr.; Barker, A.V. Plant Analysis Handbook III: A Guide to Sampling, Preparation, Analysis, and Interpretation for Agronomic and Horticultural Crops; Micro-Macro Publishing Inc.: Athens, GA, USA, 2014. [Google Scholar]
- Abendroth, L.; Elmore, R.; Boyer, M.; Marlay, S. Corn Growth and Development PMR 1009; Iowa State University Extension: Ames, IA, USA, 2011. [Google Scholar]
- Miller, R.O.; Gavlak, R.; Horneck, D. Soil, Plant and Water Reference Methods for the Western Region (WREP-125), 4th ed.; Colorado State University: Fort Collins, CO, USA, 2013. [Google Scholar]
- Horwitz, W.; Latimer, G.W., Jr. Official Methods of Analysis; Association of Official Analytical Chemists: Washington, DC, USA, 1920. [Google Scholar]
- Brown, J.R. Recommended Chemical Soil Test Procedures for the North Central Region; Missouri Agricultural Experiment Station, University of Missouri-Columbia: Missouri, DC, USA, 1998. [Google Scholar]
- Ward, R.C. WARDguide, 2015. Ward Laboratories, Inc. Kearney, Nebraska. Available online: www.wardlab.com (accessed on 1 January 2016).
- Stewart, Z.P.; Paparozzi, E.T.; Djanaguiraman, M.; Shapiro, C.A. Lipid-based Fe-and Zn-nanoformulation is more effective in alleviating Fe-and Zn-deficiency in maize. J. Plant Nutr. 2019, 42, 1693–1708. [Google Scholar] [CrossRef]
- Li, N.; Yang, Y.; Wang, L.; Zhou, C.; Jing, J.; Sun, X.; Tian, X. Combined effects of nitrogen and sulfur fertilization on maize growth, physiological traits, N and S uptake, and their diagnosis. Field Crops Res. 2019, 242, 107593. [Google Scholar] [CrossRef]
- Warnock, R. Micronutrient uptake and mobility within corn plants (Zea mays L.) in relation to phosphorus-induced zinc deficiency. Soil Sci. Soc. Am. J. 1970, 34, 765–769. [Google Scholar] [CrossRef]
- Stewart, Z.P.; Stepanovic, S.; Shapiro, C. Iron management in high pH soils: A strong candidate for precision farming technologies. In Proceedings of the Great Plains Soil Fertility Conference, IPNI, Denver, CO, USA, 1–2 March 2016. [Google Scholar]
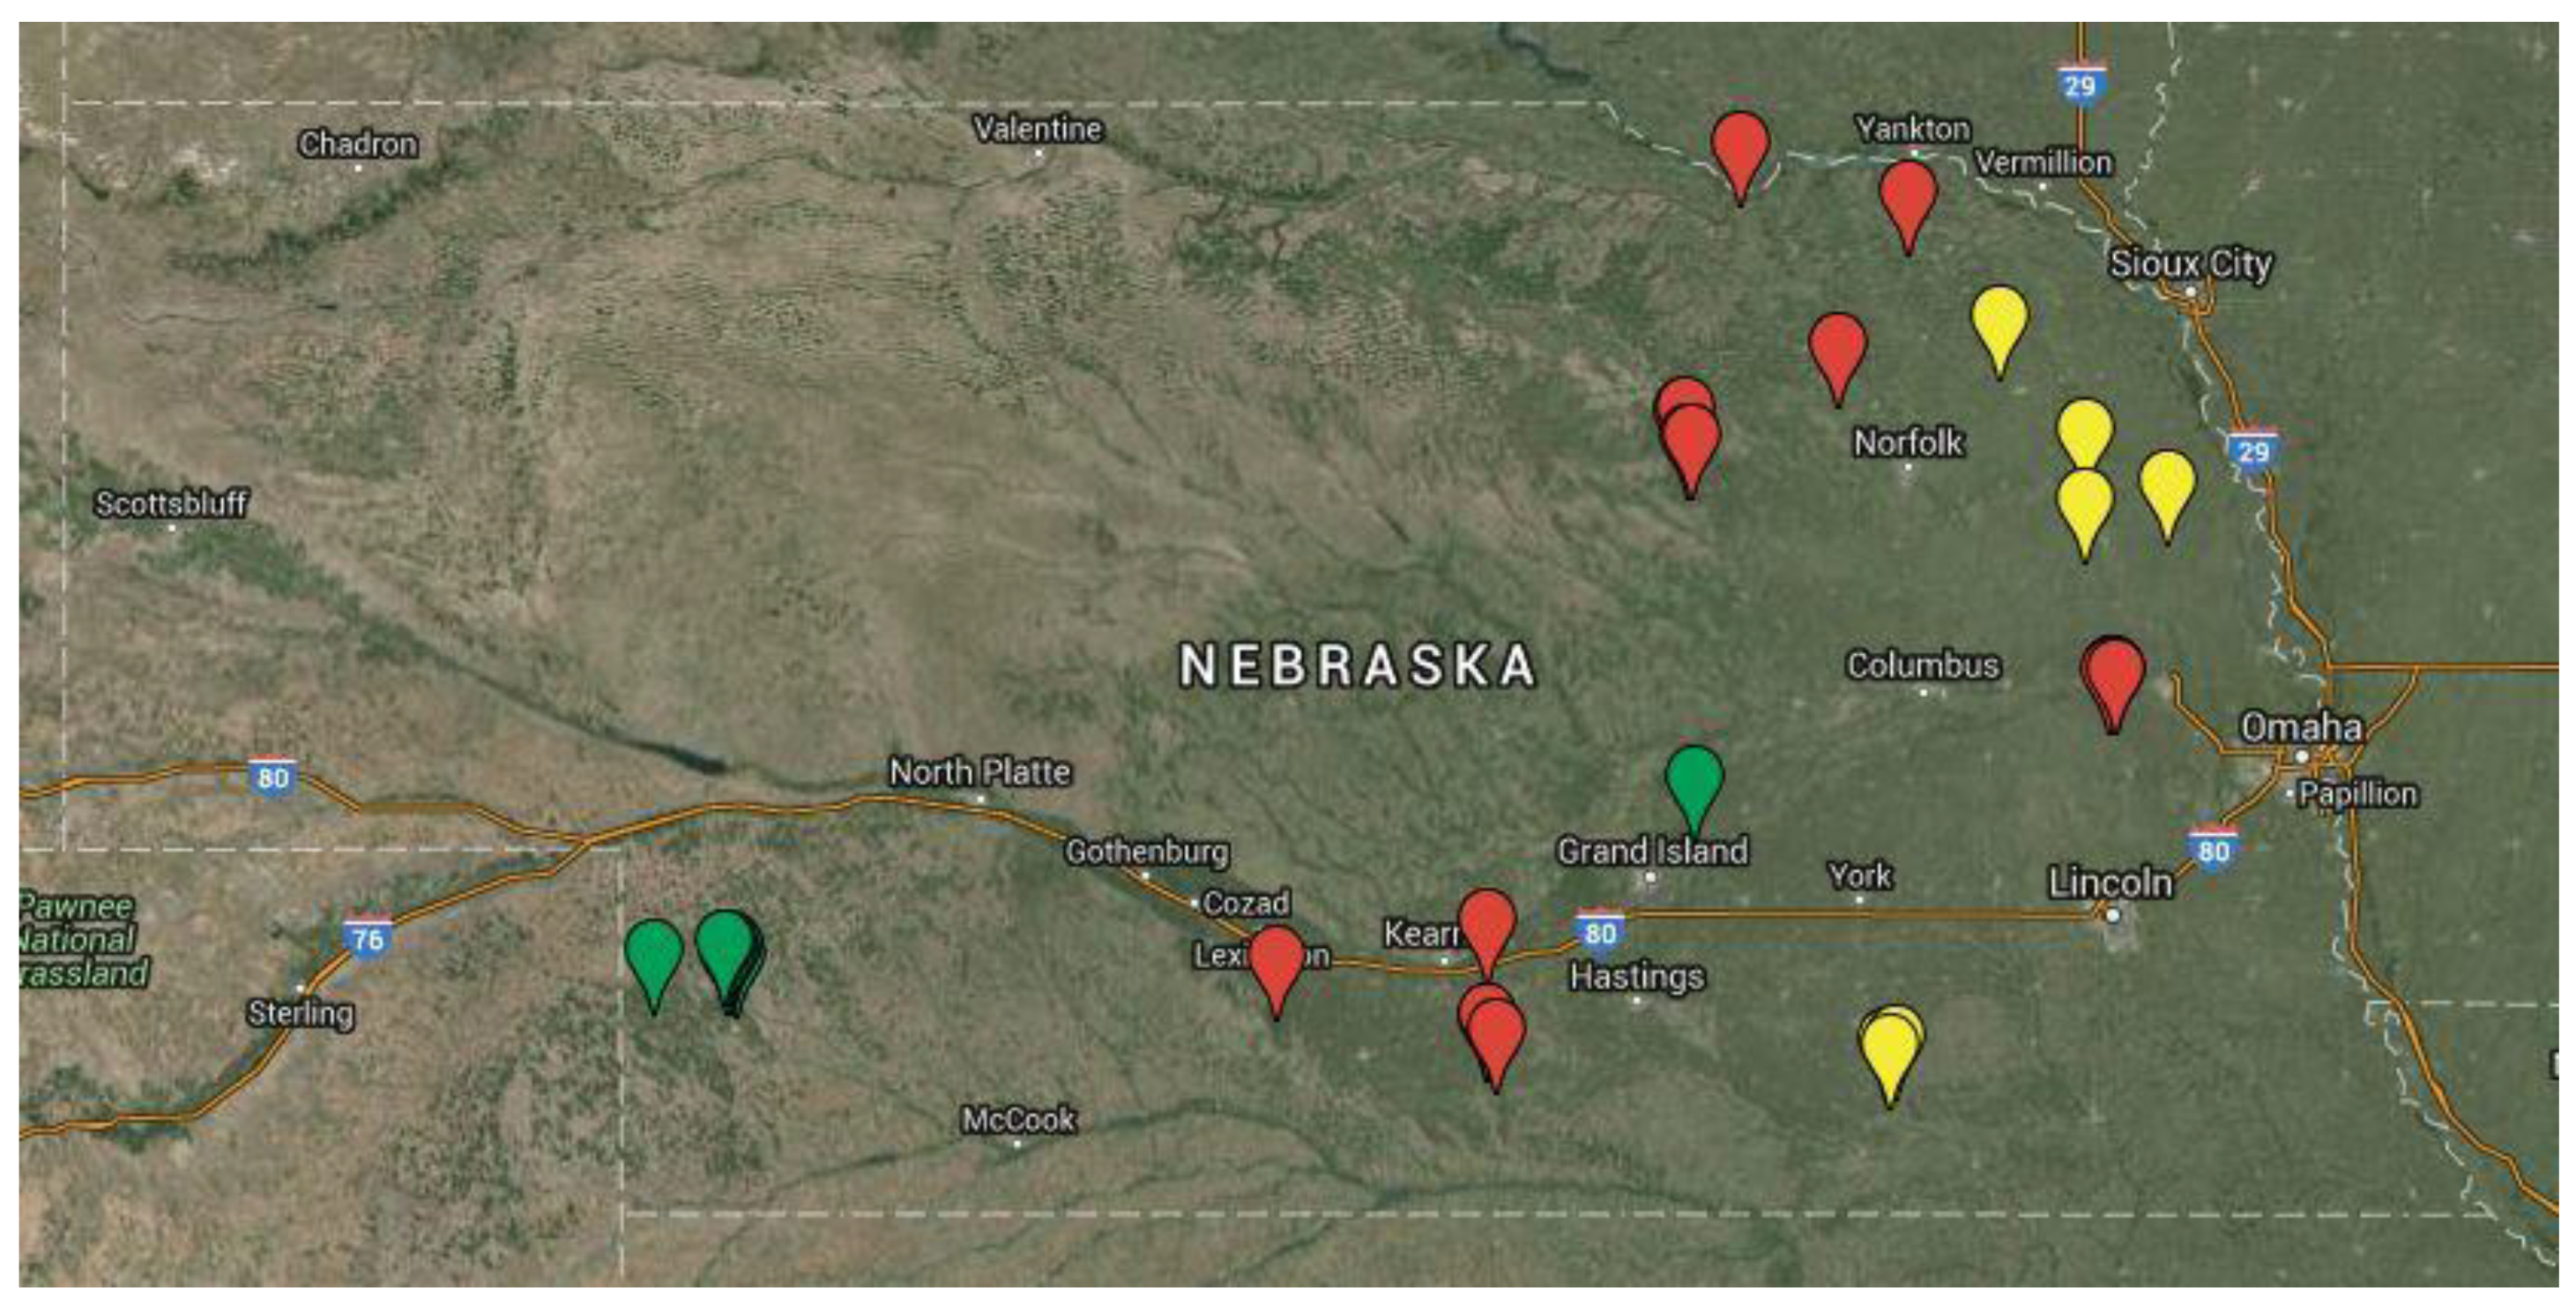
Figure 1.
Sites of the 26 on-farm strip trials color coded by year. (2013: yellow, 2014: red, 2015: green) for the study of maize response to foliar application of micronutrients.
Figure 1.
Sites of the 26 on-farm strip trials color coded by year. (2013: yellow, 2014: red, 2015: green) for the study of maize response to foliar application of micronutrients.

Figure 2.
Images from foliar Fe treated maize plants showing regreening patterns where foliar Fe droplets contacted the leaf surface on the V5 leaf (b,c). No regreening appears in upper untreated leaves (a).
Figure 2.
Images from foliar Fe treated maize plants showing regreening patterns where foliar Fe droplets contacted the leaf surface on the V5 leaf (b,c). No regreening appears in upper untreated leaves (a).

Figure 3.
Leaf Fe concentration (bars) and maize grain yield (line) responses to foliar Fe application for eight sites. Data labels on both the line and bar graphs indicate p-values † for mean comparison differences. The correlation coefficient (r) for the relationship of changes in tissue Fe concentration and grain yield due to foliar Fe application is 0.54. These sites were the only sites with visual signs of micronutrient deficiency.

Figure 4.
Leaf Zn concentration (bars) and maize grain yield (line) responses to foliar Zn application for 17 sites. Data labels on both the line and bar graphs indicate p-values † for mean comparison differences. The correlation coefficient (r) for the relationship of changes in tissue Zn concentration and grain yield due to foliar Zn application is 0.2.

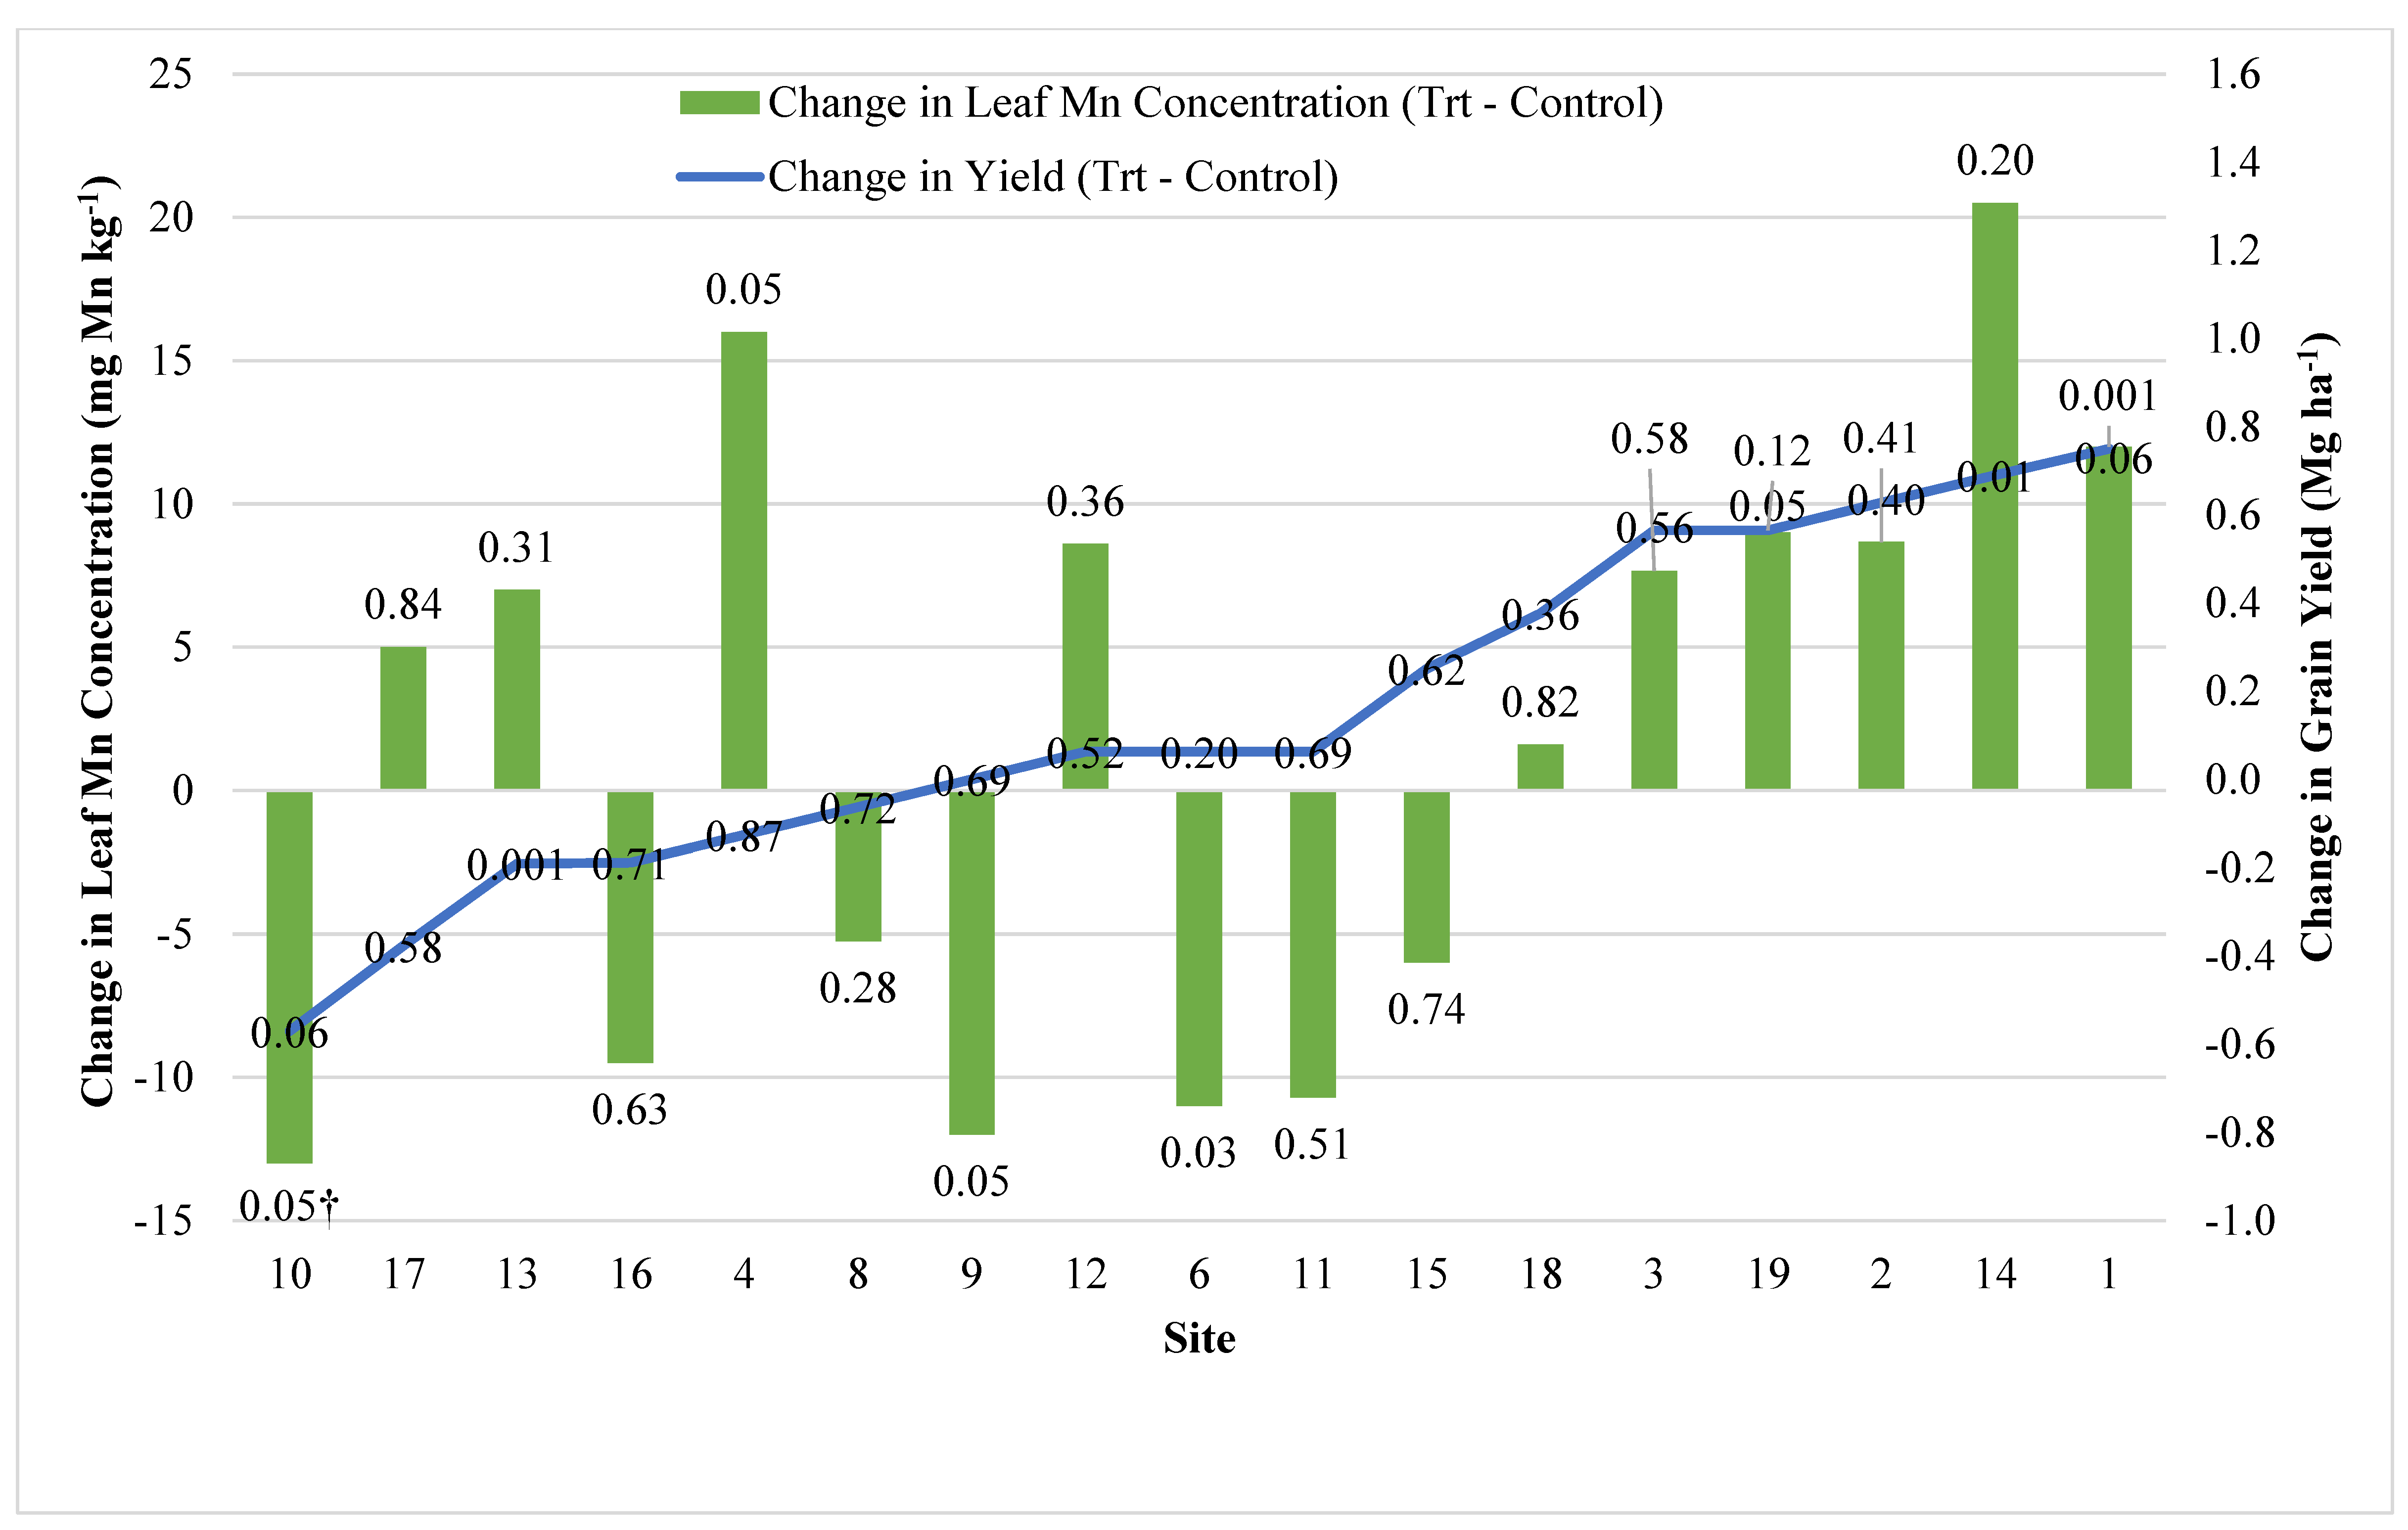
Figure 5.
Leaf Mn concentration (bars) and maize grain yield (line) responses to foliar Mn application for 17 sites. Data labels on both the line and bar graphs indicate p-values † for mean comparison differences. The correlation coefficient (r) for the relationship of changes in tissue Mn concentration and grain yield due to foliar Mn application is 0.54.

Figure 6.
Leaf B concentration (bars) and maize grain yield (line) responses to foliar B application for 15 sites. Data labels on both the line and bar graphs indicate p-values † for mean comparison differences. The correlation coefficient (r) for the relationship of changes in tissue B concentration and grain yield due to foliar B application is 0.2.

Figure 7.
Relationship between the control maize grain yield and the grain yield response to foliar micronutrient application for 26 sites. Our hypothesis was that higher yielding sites would have a greater yield response but this relationship did not occur (r = 0.03).
Figure 7.
Relationship between the control maize grain yield and the grain yield response to foliar micronutrient application for 26 sites. Our hypothesis was that higher yielding sites would have a greater yield response but this relationship did not occur (r = 0.03).


Table 1.
Site background information and cultural practices for 26 field strip trials testing foliar micronutrient application for irrigated maize but for popcorn at site 25 and 26.
Table 1.
Site background information and cultural practices for 26 field strip trials testing foliar micronutrient application for irrigated maize but for popcorn at site 25 and 26.
| Site | Year | County | Soil Series | Rainfall † | Till ‡ | Previous Crop | Hybrid | Plant Date | Harvest Date |
|---|---|---|---|---|---|---|---|---|---|
| mm | |||||||||
| 1 | 2013 | Thayer | Crete | 724 | NT | Soybean | Pioneer P1690HR | 13-May | 26-Oct |
| 2 | 2013 | Thayer | Crete | 724 | NT | Soybean | Pioneer 33D47 | 6-May | 26-Oct |
| 3 | 2013 | Thayer | Crete | 724 | NT | Soybean | Pioneer P1690HR | 7-May | 26-Oct |
| 4 | 2013 | Wayne | Nora | 902 | NT | Soybean | Pioneer 1625 HR | 5-May | 26-Oct |
| 5 | 2013 | Cuming | Belfore | 864 | CT | Maize | Dekalb DKC61-06RIB | 5-May | 26-Oct |
| 6 | 2013 | Cuming | Belfore | 953 | NT | Soybean | Dekalb DK62 98 VT pro | 13-May | 26-Oct |
| 7 | 2013 | Burt | Zook | 889 | CT | Maize | Golden Harvest GH14R38 | 15-April | 27-Oct |
| 8 | 2014 | Thurman | Thurman | 673 | NT | Soybean | Pioneer 1266 | 29-April | 21-Oct |
| 9 | 2014 | Kearney | Boel + Valentine | 711 | CT | Maize | Pioneer 33D47 | 10-May | 18-Oct |
| 10 | 2014 | Kearney | Holdrege + Detroit | 762 | CT | Maize | Pioneer 33D53 AMI | 9-May | 18-Oct |
| 11 | 2014 | Kearney | Holdrege + Detroit | 762 | CT | Maize | Pioneer 1469 AMI | 9-May | 13-Nov |
| 12 | 2014 | Saunders | Yutan | 1016 | NT | Soybean | Pioneer 1690 HR | 16-May | 13-Nov |
| 13 | 2014 | Saunders | Yutan | 1016 | NT | Soybean | Pioneer 1690 HR | 27-April | 3-Nov |
| 14 | 2014 | Antelope | Thurman + Nora | 597 | CT | Maize | Pioneer 1625 HR | 15-May | 19-Nov |
| 15 | 2014 | Antelope | Thurman + Doger | 648 | CT | Maize | Channel 209-53 STX RIB | 27-April | 26-Oct |
| 16 | 2014 | Antelope | Thurman + Nora | 584 | CT | Maize | Channel 213-40 VT3 | 15-May | 24-Oct |
| 17 | 2014 | Antelope | Thurman + Doger | 648 | CT | Maize | Channel 213-40 VT3 | 25-May | 26-Oct |
| 18 | 2014 | Cedar | Crofton + Nora | 914 | NT | Maize | Pioneer 1197-AM | 27-April | 5-Nov |
| 19 | 2015 | Merrick | Cozad + Alda | 940 | CT | Maize | Pioneer 1311-AM | 25-April | 9-Nov |
| 20 | 2015 | Chase | Blanche + Tassel-Duda | 554 | NT | Maize | Channel 209-69 VT3PRIB | 28-April | 28-Oct |
| 21 | 2015 | Chase | Blanche + Tassel-Duda | 554 | NT | Soybean | Channel 209-69 VT3PRIB | 8-May | 28-Oct |
| 22 | 2015 | Chase | Rosebud Complex | 526 | CT | Maize | Pioneer 1151 | 25-April | 21-Nov |
| 23 | 2015 | Chase | Rosebud-Canyon | 526 | CT | Maize | Pioneer 1151 | 25-April | 21-Nov |
| 24 | 2015 | Chase | Rosebud Complex | 516 | CT | Maize | Prairie Brand 5825 | 18-May | 9-Nov |
| 25 | 2015 | Chase | Valent Complex | 572 | NT | Maize | R-98114 | 28-April | 9-Nov |
| 26 | 2015 | Chase | Jayem Complex | 561 | NT | Wheat | R-427 | 2-May | 20-Oct |
† Observed rainfall during growing season; Rodebud complex: Rosebud-Canyon, Blanche, Duda-Tassel; Valent complex: Valent, Duda-Tassel and Jayem; ‡ Till = tillage system including conventional tillage consisting of disk or chisel plow tillage (CT) or no-till (NT); Jayem Complex: Jayem, Ascalon and Valent. Note: Row spacing was 76.2 cm except for 50.8 cm at site 5 and 18, 91.4 cm at site 19, and 38.1 cm” at site 26.
Table 2.
Treatment micronutrient formulation and application background information for each of the 26 sites.
Table 2.
Treatment micronutrient formulation and application background information for each of the 26 sites.
| Site | Product † | Applied Nutrients | Rate | Elemental Rate | AM ‡ | AD ‡ | AD ‡ | Reps |
|---|---|---|---|---|---|---|---|---|
| g kg−1 | L ha−1 | g element ha−1 | ||||||
| 1 | Brandt | 40 N, 30 S, 30 Mn, 30 Zn, 2.5 B | 2.3 | 116 N, 87 S, 87 Mn, 87 Zn, 7 B | HCA § | 2-July | V10 | 3 |
| 2 | Brandt | 40 N, 30 S, 30 Mn, 30 Zn, 2.5 B | 2.3 | 116 N, 87 S, 87 Mn, 87 Zn, 7 B | HCA | 2-July | V12 | 3 |
| 3 | Brandt | 40 N, 30 S, 30 Mn, 30 Zn, 2.5 B | 2.3 | 116 N, 87 S, 87 Mn, 87 Zn, 7 B | HCA | 2-July | V12 | 3 |
| 4 | MAX-IN UZMB | 36 S, 10 B, 30 Mn, 40 Zn | 2.3 | 107 S, 89 Mn, 119 Zn, 3 B | HCA | 18-June | V6 | 4 |
| 5 | MAX-IN B | 80 B | 2.3 | 235 B | HCA | 17-June | V6 | 6 |
| 6 | MAX-IN ZMB | 36 S, 10 B, 30 Mn, 40 Zn | 2.3 | 107 S, 89 Mn, 119 Zn, 3 B | HCA | 18-June | V5 | 6 |
| 7 | MAX-IN Boron | 80 B | 1.2 | 123 B | HCA | 13-June | V5 | 6 |
| 8 | MAX-IN ZMB + MAX-IN | 36 S, 10 B, 30 Mn, 40 Zn + 80 B | 2.3 | 107 S, 89 Mn, 119 Zn, 3 B + 235 B | HCA | 26-June | V8 | 4 |
| 9 | FullTec Zn | 300 P2O5, 80 Mn, 30 Zn | 0.4 | 206 P2O5, 55 Mn, 21 Zn | HCA | 12-June | V5 | 4 |
| 10 | Attain + MAX-IN B | 80 N, 30 S, 20 Mn, 30 Zn, 10 Fe + 80 B | 2.3 | 238 N, 89 S, 56 Mn, 89 Zn, 30 Fe | HCA | 26-June | V8 | 8 |
| 11 | Attain + MAX-IN B | 80 N, 30 S, 20 Mn, 30 Zn, 10 Fe + 80 B | 2.3 | 238 N, 89 S, 56 Mn, 89 Zn, 30 Fe | HCA | 26-June | V9 | 8 |
| 12 | MAX-IN ZMB + MAX-IN B | 36 S, 10 B, 30 Mn, 40 Zn + 80 B | 2.3 | 107 S, 89 Mn, 119 Zn, 3 B + 235 B | HCA | 3-July | V11 | 20 |
| 13 | MAX-IN ZMB + MAX-IN B | 36 S, 10 B, 30 Mn, 40 Zn + 80 B | 2.3 | 107 S, 89 Mn, 119 Zn, 3 B + 235 B | HCA | 3-July | V11 | 20 |
| 14 | MAX-IN ZMB | 36 S, 10 B, 30 Mn, 40 Zn | 2.3 | 107 S, 89 Mn, 119 Zn, 3 B | Aerial | 10-July | V13 | 4 |
| 15 | MAX-IN ZMB | 36 S, 10 B, 30 Mn, 40 Zn | 2.3 | 107 S, 89 Mn, 119 Zn, 3 B | Aerial | 10-July | V14 | 4 |
| 16 | MAX-IN ZMB | 36 S, 10 B, 30 Mn, 40 Zn | 4.7 | 218 S, 182 Mn, 242 Zn, 6 B | Aerial | 10-July | V13 | 4 |
| 17 | MAX-IN ZMB | 36 S, 10 B, 30 Mn, 40 Zn | 2.3 | 107 S, 89 Mn, 119 Zn, 3 B | Aerial | 10-July | V13 | 2 |
| 18 | MAX-IN ZMB + MAX-IN B | 36 S, 10 B, 30 Mn, 40 Zn + 80 B | 2.3 | 107 S, 89 Mn, 119 Zn, 3 B + 235 B | HCA | 3-July | V11 | 10 |
| 19 | Attain + N-Cline | 80 N, 30 S, 30 Zn, 20 Mn, 10 Fe + 280 N | 2.3 and 9.4 | 238 N, 89 S, 56 Mn, 89 Zn, 30 Fe + 3343 N | HCA | 23-June | V7 | 6 |
| 20 | Versa Fe + LS | 180 Fe-EDDHA | 5.8 L ha−1 and 0.3 kg ha−1 | 123 Fe | Aerial | 26-June | V6 | 4 |
| 21 | Versa Fe + LS | 180 Fe-EDDHA | 5.8 L ha−1 and 0.3 kg ha−1 | 123 Fe | Aerial | 26-June | V6 | 4 |
| 22 | Versa Fe + LS | 180 Fe-EDDHA | 5.8 L ha−1 and 0.3 kg ha−1 | 123 Fe | Aerial | 26-June | V6 | 4 |
| 23 | Versa Fe + LS | 180 Fe-EDDHA | 5.8 L ha−1 and 0.3 kg ha−1 | 123 Fe | Aerial | 26-June | V6 | 4 |
| 24 | Pro Iron 5 | 60 N, 30 S, 50 Fe-EDTA | 2.3 | 175 N, 88 S 146 Fe | HCA | 25-June | V6 | 6 |
| 25 | Versa Fe + LS | 180 Fe-EDDHA | 5.8 L ha−1 and 0.3 kg ha−1 | 123 Fe | Aerial | 26-June | V6 | 4 |
| 26 | Versa Fe + LS | 180 Fe-EDDHA | 5.8 L ha−1 and 0.3 kg ha−1 | 123 Fe | Aerial | 26-June | V6 | 4 |
† Brandt-Brandt Smart Trio (Zn, Mn, B); ZMB- Zn, Mn and B; LS-Lockdown Surfactant. ‡ AM-Application Method; AD-Application Date; AS-Application Stage. § HCA-High Clearance Applicator.
Table 3.
Soil properties for the 0–20 cm depth at study sites for determining the effects of foliar micronutrient application on maize. No soil micronutrient availability level was below the critical level for deficiency ¶.
Table 3.
Soil properties for the 0–20 cm depth at study sites for determining the effects of foliar micronutrient application on maize. No soil micronutrient availability level was below the critical level for deficiency ¶.
| Site | Soil Analysis (0–20 cm) | |||||||||||||||
|---|---|---|---|---|---|---|---|---|---|---|---|---|---|---|---|---|
| Texture † | SOM ‡ | CEC § | pH | NO3–N | P Bray 1 | P Bray 2 | K | Mg | S | Ca | Mn ¶ | B ¶ | Zn ¶ | Fe ¶ | Cu | |
| g kg−1 | meq./100 g | −log(H+) | kg ha−1 | (mg kg−1) | ||||||||||||
| 1 | siL | 23.9 | 18.7 | 5.6 | 7.6 | 7.1 | 12.3 | 285 | 374 | 10.4 | 2102 | 15.3 | 0.4 | 2.4 | 66.6 | 1.0 |
| 2 | siL | 23.2 | 17.8 | 6.2 | 6.6 | 20.8 | 33.0 | 304 | 407 | 11.9 | 2364 | 9.5 | 0.5 | 1.1 | 63.3 | 1.1 |
| 3 | siL | 26.6 | 18.7 | 6.0 | 6.3 | 5.7 | 13.0 | 344 | 476 | 9.6 | 2177 | 11.0 | 0.5 | 1.0 | 64.2 | 1.3 |
| 4 | siL | 28.7 | 26.0 | 7.1 | 27.6 | 29.4 | 70.5 | 302 | 601 | 10.6 | 3821 | 8.3 | 0.9 | 3.6 | 26.6 | 0.8 |
| 5 | siCL | 26.1 | 23.9 | 6.2 | 17.7 | 68.3 | 95.4 | 354 | 558 | 11.9 | 3015 | 23.2 | 0.8 | 5.9 | 71.7 | 1.2 |
| 6 | siCL | 24.2 | 19.7 | 6.4 | 11.9 | 14.3 | 23.3 | 266 | 468 | 10.6 | 2662 | 11.8 | 0.7 | 1.9 | 51.7 | 1.5 |
| 7 | siC | 29.8 | 32.2 | 6.5 | 48.9 | 35.2 | 107.3 | 273 | 793 | 18.3 | 4402 | 15.1 | 0.8 | 1.9 | 53.5 | 2.8 |
| 8 | lS | 26.0 | 12.6 | 6.3 | 17.9 | 28.0 | 53.0 | 301 | 206 | 15.0 | 1765 | 7.0 | 0.4 | 2.1 | 37.0 | 0.9 |
| 9 | saL and lfS | 14.0 | 12.1 | 7.6 | 12.3 | 74.0 | 175.0 | 220 | 151 | 13.0 | 2063 | 3.0 | 0.6 | 5.2 | 20.0 | 0.9 |
| 10 | siL | 22.0 | 22.4 | 5.6 | 87.4 | 68.0 | 136.0 | 446 | 415 | 17.0 | 2498 | 17.0 | 0.6 | 1.9 | 42.0 | 1.5 |
| 11 | siL | 27.0 | 20.7 | 6.0 | 20.2 | 110.0 | 135.0 | 591 | 377 | 14.0 | 2591 | 18.0 | 0.7 | 3.3 | 60.0 | 1.7 |
| 12 | siCL | 21.0 | 16.1 | 6.1 | 9.5 | 26.0 | 48.0 | 224 | 331 | 11.0 | 2116 | 21.0 | 0.5 | 2.1 | 51.0 | 1.2 |
| 13 | siCL | 23.0 | 16.2 | 6.0 | 9.0 | 24.0 | 43.0 | 219 | 336 | 12.0 | 2082 | 22.0 | 0.5 | 1.9 | 49.0 | 1.1 |
| 14 | lS | 14.0 | 5.6 | 6.2 | 9.0 | 18.0 | 22.0 | 83 | 96 | 10.0 | 771 | 6.0 | 0.3 | 4.6 | 21.0 | 0.6 |
| 15 | lS | 13.0 | 5.6 | 6.3 | 8.1 | 17.0 | 21.0 | 81.0 | 101 | 11.0 | 786 | 6.0 | 0.3 | 4.7 | 23.0 | 0.5 |
| 16 | lS | 13.0 | 5.8 | 6.1 | 7.8 | 19.0 | 26.0 | 74 | 98 | 10.0 | 799 | 5.0 | 0.3 | 5.9 | 25.0 | 0.5 |
| 17 | lS | 12.0 | 5.9 | 6.0 | 7.9 | 18.0 | 24.0 | 76.0 | 97.0 | 10.0 | 773 | 6.0 | 0.4 | 4.9 | 22.0 | 0.6 |
| 18 | siCL | 33.0 | 24.6 | 7.9 | 13.5 | 26.0 | 84.0 | 274 | 342 | 13.0 | 4206 | 5.0 | 0.9 | 2.0 | 18.0 | 1.9 |
| 19 | L | 27.4 | 14.1 | 7.1 | 53.1 | 45.0 | 99.4 | 595 | 301 | 36.6 | 1983 | 6.8 | 0.9 | 4.1 | 14.3 | 0.4 |
| 20 | lS | 17.0 | 16.9 | 7.2 | 78.5 | 44.0 | 140.0 | 332 | 148 | 13.0 | 2956 | 2.0 | 0.6 | 5.6 | 13.0 | 0.6 |
| 21 | vfSL and lS | 18.0 | 17.7 | 7.5 | 94.2 | 13.0 | 130.0 | 390 | 146 | 13.0 | 3087 | 2.0 | 0.6 | 5.9 | 8.0 | 0.7 |
| 22 | vfSL and lS | 25.0 | 21.4 | 8.0 | 46.0 | 39.0 | 118.0 | 528 | 192 | 15.0 | 3695 | 2.0 | 1.0 | 5.2 | 10.0 | 0.7 |
| 23 | L | 23.0 | 18.8 | 7.8 | 59.4 | 51.0 | 144.0 | 495 | 175 | 17.0 | 3216 | 2.0 | 1.0 | 6.7 | 10.0 | 0.6 |
| 24 | L and siL | 17.0 | 22.5 | 8.2 | 78.5 | 4.0 | 99.0 | 612 | 236 | 26.0 | 3799 | 3.0 | 0.9 | 3.3 | 4.0 | 0.4 |
| 25 | lS and fS | 18.0 | 13.9 | 6.3 | 38.1 | 66.0 | 120.0 | 502 | 241 | 14.0 | 1815 | 6.0 | 0.5 | 2.8 | 26.0 | 1.2 |
| 26 | lS and saL | 10.0 | 7.8 | 6.1 | 22.4 | 43.0 | 52.0 | 210 | 170 | 10.0 | 957 | 6.0 | 0.4 | 2.7 | 48.0 | 1.3 |
† Soil texture classes: silt loam (siL), silty clay loam (siCL), silty clay (siC), loamy sand (lS), sandy loam (saL), loamy fine sand (lfS), loam (L), very fine sandy loam (vfSL), and fine sand (fS). ‡ SOM = soil organic matter. § CEC = cation exchange capacity. ¶ Soil critical levels for B, Mn, Fe, and Zn: 0.1, 0.5, 1.0, 0.25 mg kg−1, respectively.
Table 4.
Maize yield and leaf tissue nutrient concentration without foliar micronutrient application and the response to application.
Table 4.
Maize yield and leaf tissue nutrient concentration without foliar micronutrient application and the response to application.
| Yield | Plant Tissue Concentration | ||||||||||||||
|---|---|---|---|---|---|---|---|---|---|---|---|---|---|---|---|
| Site | Trt | Control | Statistic | N | Control N | Statistic | P | Control P | Statistic | K | Control K | Statistic | S | Control S | Statistic |
| Mg ha−1 | P > F | g kg−1 | P > F | g kg−1 | P > F | g kg−1 | P>F | g kg−1 | P > F | ||||||
| 1 | 16.19 +† | 15.44+ | 0.06 | 31.0 | 30.4 | 0.27 § | 3.0 | 2.8 | 0.12 | 22.8 | 22.8 | 1.00 | 1.8 | 1.8 | 0.59 § |
| 2 | 15.75 | 15.13 | 0.40 | 31.2 | 30.3 | 0.61 § | 3.1+ | 2.9+ | 0.07 | 24.7 | 25.3 | 0.67 | 2.0 | 2.1 | 0.21 § |
| 3 | 14.62 | 14.06 | 0.56 | 31.0 | 29.1 | 0.22 § | 2.9 | 2.7 | 0.27 | 22.6 | 23.6 | 0.21 | 1.7 | 1.7 | 0.68 § |
| 4 | 15.57 | 15.69 | 0.87 | 35.1 | 34.8 | 0.81 | 3.7+ | 3.6+ | 0.09 | 20.5 | 21.0 | 0.43 | 1.9 | 1.9 | 0.73 § |
| 5 | 15.94 | 16.38 | 0.42 | 32.5 | 33.7 | 0.46 | 4.3* | 4.6* | 0.03 | 19.3 | 20.7 | 0.19 | 2.3 | 2.1 | 0.19 |
| 6 | 15.25 | 15.19 | 0.20 | 28.2 | 30.2 | 0.41 | 3.7+ | 4.4+ | 0.08 | 22.4 | 21.9 | 0.30 | 2.7 | 2.6 | 0.13 § |
| 7 | 15.44 | 15.44 | 0.98 | 32.5 | 34.2 | 0.13 | 3.6 | 3.6 | 0.92 | 24.6 | 23.1 | 0.30 | 2.5 | 2.5 | 0.35 |
| 8 | 12.74 | 12.80 | 0.72 | 28.6 | 27.3 | 0.17 | 3.4 | 3.4 | 0.94 | 25.3 | 25.8 | 0.60 | 1.6 | 1.7 | 0.32 § |
| 9 | 16.19 | 16.19 | 0.69 | 33.7 | 33.4 | 0.28 | 2.9 | 2.7 | 0.50§ | 22.1 | 22.7 | 0.54 | 1.9 | 1.9 | 0.64 |
| 10 | 14.62+ | 15.19+ | 0.06 | 28.5 | 28.4 | 0.23 § | 2.8 | 2.8 | 1.00 | 29.4 | 29.3 | 0.92 | 2.2 *** | 2.3 *** | 0.001 § |
| 11 | 15.13 | 15.06 | 0.69 | 29.7 | 29.5 | 0.93 § | 3.1 | 3.0 | 0.43 | 30.0 | 30.0 | 0.89 | 2.3 | 2.3 | 0.81 § |
| 12 | 15.69 | 15.63 | 0.52 | 24.5 | 24.9 | 0.58 | 2.3 | 2.3 | 0.65 | 22.3 | 21.0 | 0.15 | 1.8 | 1.8 | 0.17 § |
| 13 | 15.38 *** | 15.57 *** | 0.001 | 25.9 | 26.1 | 0.71 | 2.6 | 2.7 | 0.43 | 22.3 | 22.7 | 0.28 | 1.9 | 1.9 | 0.62 § |
| 14 | 13.37 ** | 12.68 ** | 0.01 | 20.0 | 22.0 | 0.48 | 2.3 | 2.6 | 0.13 | 19 | 21.0 | 0.54 | 1.6 | 1.6 | 0.52 § |
| 15 | 13.62 | 13.37 | 0.62 | 22.5 | 22.7 | 0.67 | 3.1 | 3.0 | 0.59 | 20.7 | 20.9 | 0.73 | 1.9 | 1.8 | 0.33 § |
| 16 | 12.49 | 12.68 | 0.71 | 26.3 * | 23.5* | 0.05 | 3.2 | 3.1 | 0.83 | 15.9 | 14.7 | 0.13 | 2.1 | 1.8 | 0.13 § |
| 17 | 11.42 | 11.80 | 0.58 | 31.9 | 30.9 | 0.34 | 3.2 | 3.4 | 0.35 | 23.9 | 24.2 | 0.42 | 2.1 | 2.1 | 0.47 § |
| 18 | 13.06 | 12.68 | 0.36 | 31.2 | 30.4 | 0.25 | 3.7 | 3.7 | 0.83 | 25.8 | 26.2 | 0.83 | 1.9 | 1.9 | 0.79 § |
| 19 | 14.25 | 13.68 | 0.12 | 31.4 | 29.7 | 0.21§ | 3.1+ | 2.9+ | 0.08 | 26.8 | 26.3 | 0.74 | 1.8 | 1.9 | 0.84 § |
| 20 | 12.30 | 11.99 | 0.49 | 34.5 | 32.7 | 0.27 | 3.9 | 3.6 | 0.17 | 30.5* | 26.3* | 0.04 | 2.3 | 2.2 | 0.44 |
| 21 | 13.18 | 13.06 | 0.59 | 33.1 | 31.1 | 0.25 | 4.0 | 3.9 | 0.62 | 32.3 | 33.3 | 0.70 | 2.3 | 2.2 | 0.14 |
| 22 | 12.37 | 13.12 | 0.13 | 33.8 | 31.2 | 0.27 | 5.3 | 4.7 | 0.13 | 34.7 | 34.9 | 0.91 | 2.2 + | 2.1+ | 0.06 |
| 23 | 13.87 ** | 13.24 ** | 0.01 | 30.3 | 31.7 | 0.35 | 4.5* | 5.0* | 0.02 | 33.3 | 32.3 | 0.72 | 2.0 | 2.1 | 0.41 |
| 24 | 10.92 | 11.30 | 0.70 | 32.7 | 32.7 | 0.29§ | 3.9 | 3.6 | 0.41 | 31.2 | 29.4 | 0.81 | 2.9 | 3.0 | 0.36 |
| 25 | 4.90 | 4.90 | 0.97 | 32.0 | 31.5 | 0.84 | 3.9* | 3.6* | 0.05 | 36.2 | 34.5 | 0.46 | 2.1 | 2.0 | 0.39 |
| 26 | 7.59 | 7.47 | 0.28 | 37.5 | 38.1 | 0.71 | 4.2 | 4.4 | 0.44 | 29.8 | 28.9 | 0.46 | 2.6 | 2.8 | 0.25 |
| Yield | Plant Tissue Concentration | ||||||||||||||
| Site | Trt | Control | Statistic | Zn | Control Zn | Statistic | Mn | Control Mn | Statistic | B | Control B | Statistic | Fe | Control Fe | Statistic |
| Mg ha−1 | P > F | g kg−1 | P > F | g kg−1 | P > F | g kg−1 | P > F | g kg−1 | P > F | ||||||
| 1 | 16.19 +† | 15.44 + | 0.06 | 32 | 30 | 0.32 § | 87 *** | 75 *** | 0.001 § | 6.3 | 5.0 | 0.27 § | 189 | 181 | 0.47 |
| 2 | 15.75 | 15.13 | 0.40 | 35 * | 31 * | 0.03 § | 80 | 71 | 0.41 § | 5.0 | 5.0 | 1.00 § | 124 | 122 | 0.75 |
| 3 | 14.62 | 14.06 | 0.56 | 31 | 27 | 0.16 § | 84 | 77 | 0.58 § | 7.0 | 6.3 | 0.53 § | 158 | 153 | 0.63 |
| 4 | 15.57 | 15.69 | 0.87 | 34 | 33 | 0.25 § | 73 * | 57* | 0.05 § | 5.5 | 5.0 | 0.18 § | 197 | 213 | 0.14 |
| 5 | 15.94 | 16.38 | 0.42 | 20 | 21 | 0.87 | 80 | 98 | 0.32 | 5.5 | 5.8 | 0.53 § | 137 | 136 | 0.91 |
| 6 | 15.25 | 15.19 | 0.20 | 23 + | 22 + | 0.06 § | 46 * | 57* | 0.03 § | 4.2 | 3.7 | 0.58 § | 138 | 140 | 0.87 |
| 7 | 15.44 | 15.44 | 0.98 | 29 | 27 | 0.13 | 67 | 64 | 0.76 | 5.0 | 8.0 | 0.16 § | 176 | 171 | 0.19 |
| 8 | 12.74 | 12.80 | 0.72 | 23 | 18 | 0.10 § | 54 | 59 | 0.28 § | 6.5 | 7.8 | 0.19 § | 118 | 124 | 0.27 |
| 9 | 16.19 | 16.19 | 0.69 | 17 | 18 | 0.24 § | 50 * | 62* | 0.05 § | 6.4 | 6.7 | 0.15 | 103 | 107 | 0.22 |
| 10 | 14.62 + | 15.19 + | 0.06 | 27 * | 23* | 0.02 § | 96 * | 109 * | 0.05 § | 8.5+ | 9.3+ | 0.08 | 128 * | 141 * | 0.04 § |
| 11 | 15.13 | 15.06 | 0.69 | 22 | 19 | 0.23 § | 67 | 78 | 0.51 § | 9.2 | 9.7 | 0.66 | 125 | 122 | 0.84 § |
| 12 | 15.69 | 15.63 | 0.52 | 23 ** | 18** | 0.0003 § | 90 | 82 | 0.36 § | 4.9 | 4.6 | 0.71 § | 131 | 134 | 0.32 |
| 13 | 15.38 *** | 15.57 *** | 0.001 | 19 | 18 | 0.24 § | 48 | 41 | 0.31 § | 4.7 | 4.3 | 0.43 § | 164 | 161 | 0.83 |
| 14 | 13.37 ** | 12.68 ** | 0.01 | 26 * | 19* | 0.05 § | 59 | 38 | 0.20 § | 5.5 | 6.5 | 0.70 § | 117 | 112 | 0.25 |
| 15 | 13.62 | 13.37 | 0.62 | 29 | 20 | 0.13 § | 57 | 63 | 0.74 § | 6.4 | 6.1 | 0.61 § | 113 | 109 | 0.64 |
| 16 | 12.49 | 12.68 | 0.71 | 41 + | 26+ | 0.06 § | 48 | 58 | 0.63 § | 5.5 | 6.5 | 0.70 § | 152 | 146 | 0.45 |
| 17 | 11.42 | 11.80 | 0.58 | 31 * | 22* | 0.03 § | 59 | 54 | 0.84 § | 6.2 | 5.9 | 0.48 § | 150 | 146 | 0.33 |
| 18 | 13.06 | 12.68 | 0.36 | 18 | 18 | 0.74 § | 68 | 67 | 0.82 § | 5.5 | 6.0 | 0.71 § | 163 | 154 | 0.32 |
| 19 | 14.25 | 13.68 | 0.12 | 21 | 21 | 0.87 § | 69* | 60* | 0.05 § | 7.0 | 6.0 | 0.50 | 79 | 72 | 0.18 § |
| 20 | 12.30 | 11.99 | 0.49 | 33 | 27 | 0.13 | 66 | 48 | 0.35 | 17.0 | 16.0 | 0.96 | 86 | 80 | 0.73 § |
| 21 | 13.18 | 13.06 | 0.59 | 30 | 30 | 0.87 | 57 | 58 | 0.59 | 16.0 | 12.0 | 0.36 | 72 | 69 | 0.48 § |
| 22 | 12.37 | 13.12 | 0.13 | 41 | 42 | 0.91 | 71 | 72 | 0.90 | 12.0 | 11.0 | 0.52 | 68+ | 59+ | 0.10 § |
| 23 | 13.87 ** | 13.24 ** | 0.01 | 40 | 43 | 0.54 | 67 | 69 | 0.75 | 11.0 | 12.0 | 0.60 | 70 | 60 | 0.19 § |
| 24 | 10.92 | 11.30 | 0.70 | 54 | 57 | 0.19 | 98 | 97 | 0.41 | 11.0 | 12.0 | 0.72 | 68 | 72 | 0.27 § |
| 25 | 4.90 | 4.90 | 0.97 | 32 | 30 | 0.46 | 48 | 51 | 0.51 | 8.0 | 8.0 | 1.00 | 94 | 92 | 0.73 § |
| 26 | 7.59 | 7.47 | 0.28 | 45 | 47 | 0.42 | 67 | 71 | 0.40 | 21.0 | 21.0 | 0.87 | 116 | 124 | 0.33 § |
† Means followed by mean comparison significant F test: Not Significant > 0.10; +> 0.05; *> 0.01; ** >0.001; *** <0.001. § Plant parameter received a foliar application of the corresponding analyzed elemental concentration.
Table 5.
The mean response across ≥2 sites for identical foliar micronutrient application compared to no application on grain yield and leaf tissue nutrient concentrations.
Table 5.
The mean response across ≥2 sites for identical foliar micronutrient application compared to no application on grain yield and leaf tissue nutrient concentrations.
| Product † | Sites | Total Reps | Yield | N | P | ||||||
|---|---|---|---|---|---|---|---|---|---|---|---|
| Trt ‡ | Site § | Trt*Site § | Trt | Site | Trt*Site | Trt | Site | Trt*Site | |||
| Mg ha−1 | P > F | P > F | g kg−1 | P > F | P > F | g kg−1 | P > F | P > F | |||
| Brandt | 1, 2, 3 | 9 | 0.7 +¶ | 0.03 * | 0.97 | 0.13 *# | 0.59 # | 0.62 # | 0.2 ** | 0.13 | 0.68 |
| MAX-IN B | 5, 7 | 12 | −0.2 | 0.06 + | 0.56 | −1.5 + | 0.77 | 0.74 | −0.1 | <0.001 *** | 0.13 |
| MAX-IN ZMB | 4, 6, 14, 15, 16, 17 | 25 | 0.1 | <0.001 *** | 0.63 | −0.1 | <0.001 *** | 0.29 | −0.2 | <0.001 *** | 0.17 |
| MAX-IN ZMB + MAX-IN B | 8, 12, 13, 18 | 54 | 0.1 | <0.001 *** | 0.17 | 0.60 | <0.001 *** | 0.22 | 0.010 | <0.001 *** | 0.94 |
| Attain (Zn, Mn, Fe, B) + MAX-IN B | 10, 11 | 16 | −0.3 | 0.35 | 0.05 * | −0.4 # | 0.08 +# | 0.55# | 0.07 | 0.10 + | 0.38 |
| Versa Fe + LS (corn) | 20, 21, 22, 23 | 16 | 0.4** | 0.04 * | 0.03 * | 1.20 | 0.44 | 0.28 | 0.20 | <0.001 *** | 0.02 * |
| Versa Fe + LS (popcorn) | 25, 26 | 8 | 0.1 | <0.001 *** | 0.56 | −0.06 | 0.002 ** | 0.63 | 0.06 | 0.02 * | 0.07 + |
| Product † | Sites | Total Reps | K | S | Zn | ||||||
| Trt | Site | Trt*Site | Tr | Site | Trt*Site | Trt | Site | Trt*Site | |||
| g kg−1 | P > F | P > F | g kg−1 | P > F | P > F | mg kg−1 | P>F | P > F | |||
| Brandt | 1, 2, 3 | 9 | −0.5 | 0.01 ** | 0.68 | −0.03 # | 0.03 *# | 0.24 # | 3.4 **# | 0.34 # | 0.45 |
| MAX-IN B | 5, 7 | 12 | 0.04 | 0.004 ** | 0.10+ | 0.10 | 0.14 | 0.43 | 1.2 | <0.001 ***# | 0.14 |
| MAX-IN ZMB | 4, 6, 14, 15, 16, 17 | 25 | −0.2 | <0.001 *** | 0.26 | 0.02 # | 0.006 **# | 0.01 *# | 6.1 ***# | <0.001 ***# | <0.001 ***# |
| MAX-IN ZMB + MAX-IN B | 8, 12, 13, 18 | 54 | 0.10 | <0.001 *** | 0.45 | −0.003 # | 0.02 *# | 0.48 # | 3.3 ***# | 0.30 # | 0.01 **# |
| Attain (Zn, Mn, Fe, B) + MAX-IN B | 10, 11 | 16 | −0.02 | 0.45 | 0.87 | −0.07 # | 0.36 # | 0.58 # | 2.9 **# | 0.009 **# | 0.68 # |
| Versa Fe + LS (corn) | 20, 21, 22, 23 | 16 | 1.00 | 0.02 * | 0.33 | 0.040 | 0.21 | 0.22 | 0.8 | 0.007 ** | 0.50 |
| Versa Fe + LS (popcorn) | 25, 26 | 8 | 1.30 | <0.001 *** | 0.72 | −0.04 | <0.0001 *** | 0.11 | 0.3 | 0.02 * | 0.26 |
| Product † | Sites | Total Reps | MN | B | Fe | ||||||
| Trt | Site | Trt*Site | Trt | Site | Trt*Site | Trt | Site | Trt*Site | |||
| mg kg−1 | P > F | P > F | mg kg−1 | P > F | P > F | mg kg−1 | P > F | P > F | |||
| Brandt | 1, 2, 3 | 9 | 9.3 *# | 0.44 # | 0.91 # | 0.7 # | 0.05 *# | 0.47# | 5.0 | 0.17 | 0.25 |
| MAX-IN B | 5, 7 | 12 | −7.2 | 0.03 * | 0.28 | −1.7 +# | 0.35 # | 0.15# | 3.0 | 0.09 + | 0.16 |
| MAX-IN ZMB | 4, 6, 14, 15, 16, 17 | 25 | 4.2 +# | 0.10 +# | 0.005 **# | −0.3 # | 0.004 **# | 0.34# | −2.0 | 0.34 | 0.13 |
| MAX-IN ZMB + MAX-IN B | 8, 12, 13, 18 | 54 | 1.7 # | 0.04 *# | 0.53 # | −0.5 # | 0.01 **# | 0.53# | −2.3 | 0.01 ** | 0.33 |
| Attain (Zn, Mn, Fe, B) + MAX-IN B | 10, 11 | 16 | −11.5 # | 0.01 **# | 0.91 # | −0.6 # | 0.60 # | 0.81# | −5.0 # | 0.10 +# | 0.22 # |
| Versa Fe + LS (corn) | 20, 21, 22, 23 | 16 | 3.4 | 0.06 + | 0.35 | 1.1 | 0.29 | 0.91 | 8.1 +# | 0.04 *# | 0.91 # |
| Versa Fe + LS (popcorn) | 25, 26 | 8 | −3.8 | 0.02 * | 0.88 | 0.1 | <0.001 *** | 0.89 | −3.6 # | 0.005 **# | 0.27 # |
† Brandt- Brandt Smart Trio (Zn, Mn, B); ZMB-Zn, Mn and B; LS-Lockdown Surfactant. ‡ Mean difference between control and treatment. Negative values indicate the control is greater than the treatment mean. § P statistic for site effect and trt*site interactions. ¶ Significant F test: Not Significant > 0.10; + > 0.05; * > 0.01; ** > 0.001; *** < 0.001. # Plant parameter received a foliar application of the corresponding analyzed elemental concentration.
Publisher’s Note: MDPI stays neutral with regard to jurisdictional claims in published maps and institutional affiliations. |
© 2020 by the authors. Licensee MDPI, Basel, Switzerland. This article is an open access article distributed under the terms and conditions of the Creative Commons Attribution (CC BY) license (http://creativecommons.org/licenses/by/4.0/).
Share and Cite
MDPI and ACS Style
Stewart, Z.P.; Paparozzi, E.T.; Wortmann, C.S.; Jha, P.K.; Shapiro, C.A. Foliar Micronutrient Application for High-Yield Maize. Agronomy 2020, 10, 1946. https://0-doi-org.brum.beds.ac.uk/10.3390/agronomy10121946
AMA Style
Stewart ZP, Paparozzi ET, Wortmann CS, Jha PK, Shapiro CA. Foliar Micronutrient Application for High-Yield Maize. Agronomy. 2020; 10(12):1946. https://0-doi-org.brum.beds.ac.uk/10.3390/agronomy10121946
Chicago/Turabian StyleStewart, Zachary P., Ellen T. Paparozzi, Charles S. Wortmann, Prakash Kumar Jha, and Charles A. Shapiro. 2020. "Foliar Micronutrient Application for High-Yield Maize" Agronomy 10, no. 12: 1946. https://0-doi-org.brum.beds.ac.uk/10.3390/agronomy10121946
Note that from the first issue of 2016, this journal uses article numbers instead of page numbers. See further details here.