Article

Fungal Diseases in Two North-West Spain Vineyards: Relationship with Meteorological Conditions and Predictive Aerobiological Model

by
Jose A. Cortiñas Rodríguez
1,
Estefanía González-Fernández
1,
María Fernández-González
1,2,*,
Rosa A. Vázquez-Ruiz
3 and
María Jesús Aira
4
1
Department of Plant Biology and Soil Sciences, Sciences Faculty of Ourense, University of Vigo, As Lagoas s/n, 32004 Ourense, Spain
2
Earth Sciences Institute (ICT), Pole of the Faculty of Sciences University of Porto, 4169-007 Porto, Portugal
3
Department of Botany, Higher Polytechnic School, University of Santiago of Compostela, 27002 Lugo, Spain
4
Department of Botany, Biology Faculty, University of Santiago of Compostela, 15782 Santiago of Compostela, Spain
*
Author to whom correspondence should be addressed.
Submission received: 19 December 2019 / Revised: 21 January 2020 / Accepted: 28 January 2020 / Published: 3 February 2020
(This article belongs to the Special Issue Disease Control Strategies in Fruit Crops)

Abstract

:
Grey mould, powdery mildew, and downy mildew are the most frequent fungal diseases among vineyards worldwide. In the present study, we analysed the influence of the fungi causing these diseases (Botrytis, Erysiphe, and Plasmopara, respectively) on two viticulture areas from North-western (NW) Spain during three growth seasons (2016, 2017, and 2018). The obtained results showed the predominant concentration of the Botrytis airborne spores, mainly from the beginning of the Inflorescence emerge phenological stage (S-5) until the end of the Flowering phenological stage (S-6). Erysiphe and Plasmopara airborne spore peak concentrations were more localised around Flowering (S-6) and Development of fruits (S-7) phenological stages. We applied a Spearman’s correlation test and a Principal Component Analysis to determine the influence of the meteorological parameters on the concentration of airborne spores. Taking into account the variables with the highest correlation coefficient, we developed multiple regression models to forecast the phytopathogenic fungal spore concentrations. The Botrytis model regression equation explained between 59.4–70.9% of spore concentration variability. The Erysiphe equation explained between 57.6–61% and the Plasmopara explained between 39.9–55.8%. In general, we found better prediction results for mean daily concentrations than sporadic spore peaks.

Graphical Abstract

1. Introduction

Among the cryptogamic diseases, the fungal grey mould, powdery mildew, and downy mildew epidemics have the highest incidence in European vineyards [1,2,3,4]. Grey mould caused by Botrytis spp. Pers.: Fr. (teleomorph: Botryotinia fuckeliana (de Bary) Whetzel) affects more than 200 plants, mainly dicot plants, and it can cause serious economic damage, especially in grapevines [5,6,7]. In addition to an important crop yield loss, this disease can also reduce the wine quality by providing an unstable colour, oxidative damages, premature aging, unpleasant flavours, and clarification difficulties [8]. The Botrytis infections, due to the fungal laccase enzyme oxidation, can compromise both the grapes and wine quality [9]. This fungus overwinters as sclerotia and mycelium in buds or trunk cracks, infecting plants again in the following spring mainly through wounds caused by hailstones, mechanical injuries or insects [10,11,12].
Powdery mildew caused by Erysiphe necator Schwein.: (anamorph: Oidium tuckeri Berk) came from the United States to Europe through England in 1845, spreading to the entire Mediterranean region and other geographical areas [13]. The American native grapevine has a high resistance level against this pathogen, while the European species Vitis vinifera is susceptible as it can present severe disease symptoms in different plant parts [14]. This fungus notably decreases the grape yield and quality, altering the must and wine organoleptic characteristics as it reduces the soluble solids and increases the total acidity [15]. In red wines, infected fruits at the beginning of ripening reach a lower phenolic compounds content, which also has an impact on their sensory properties [16].
Finally, Plasmopara viticola (Berk. & Curtis) Berl. & De Toni, responsible for downy mildew, is an obligate oomycete that overwinters as oospores in soil leaves and vegetal debris. These propagules mature as a function of temperature and precipitation, causing subsequent secondary infections. Plasmopara is native to North America and was first detected in Spain in 1878. Since then, it has been considered as one of the worst grapevine diseases that occur during favourable weather conditions [17]. The fungus bears fruit only on the host plant surface, as such, it can be only diagnosed by observing sporulation or fruiting on the plant [18]. It causes direct inflorescence and bunch losses or indirect decreases of photosynthetic activity on affected leaves. In severe attacks, the plants suffer partial desiccation resulting in the premature falling of leaves, and the withering of branches [19].
The incidence of these three vine pathogens was widely studied, as well as considering the analysis of cultural control practices. Different measures, such as drainage improvement, green pruning near to flowering, defoliation near to veraison for the improvement of ventilation for bunches, and the use of a training system to achieve appropriate air circulation, can reduce the pathology severity caused by any of these fungi [20,21,22]. The plant vigour can be controlled by avoiding excessive growth and vegetative development is also beneficial to reduce the incidence of phytopathogens [23]. Regarding chemical control, contact products, such as copper in the form of wettable powder and applied in a foliar spray or sulphur as a powder for dusting, should be used as infection prevention systems, although their use should be avoided during flowering as it can affect fruit set [24]. However, when diseases are evident it is necessary to apply penetrating and systemic treatments with curative effects, regulating their frequency according to the pathogen’s intensity [25].
The main goals of this research work are to analyse the incidence of these three fungal grapevine diseases (grey mould, powdery mildew, and downy mildew) in North-western (NW) Spain vineyards and to develop prediction models to detect the airborne spore presence that fungi produce. Besides cost reduction in grape production, this kind of study also impacts environmental protection and quality since it allows a phytosanitary treatment application when a real infection is detected [26,27].

2. Materials and Methods

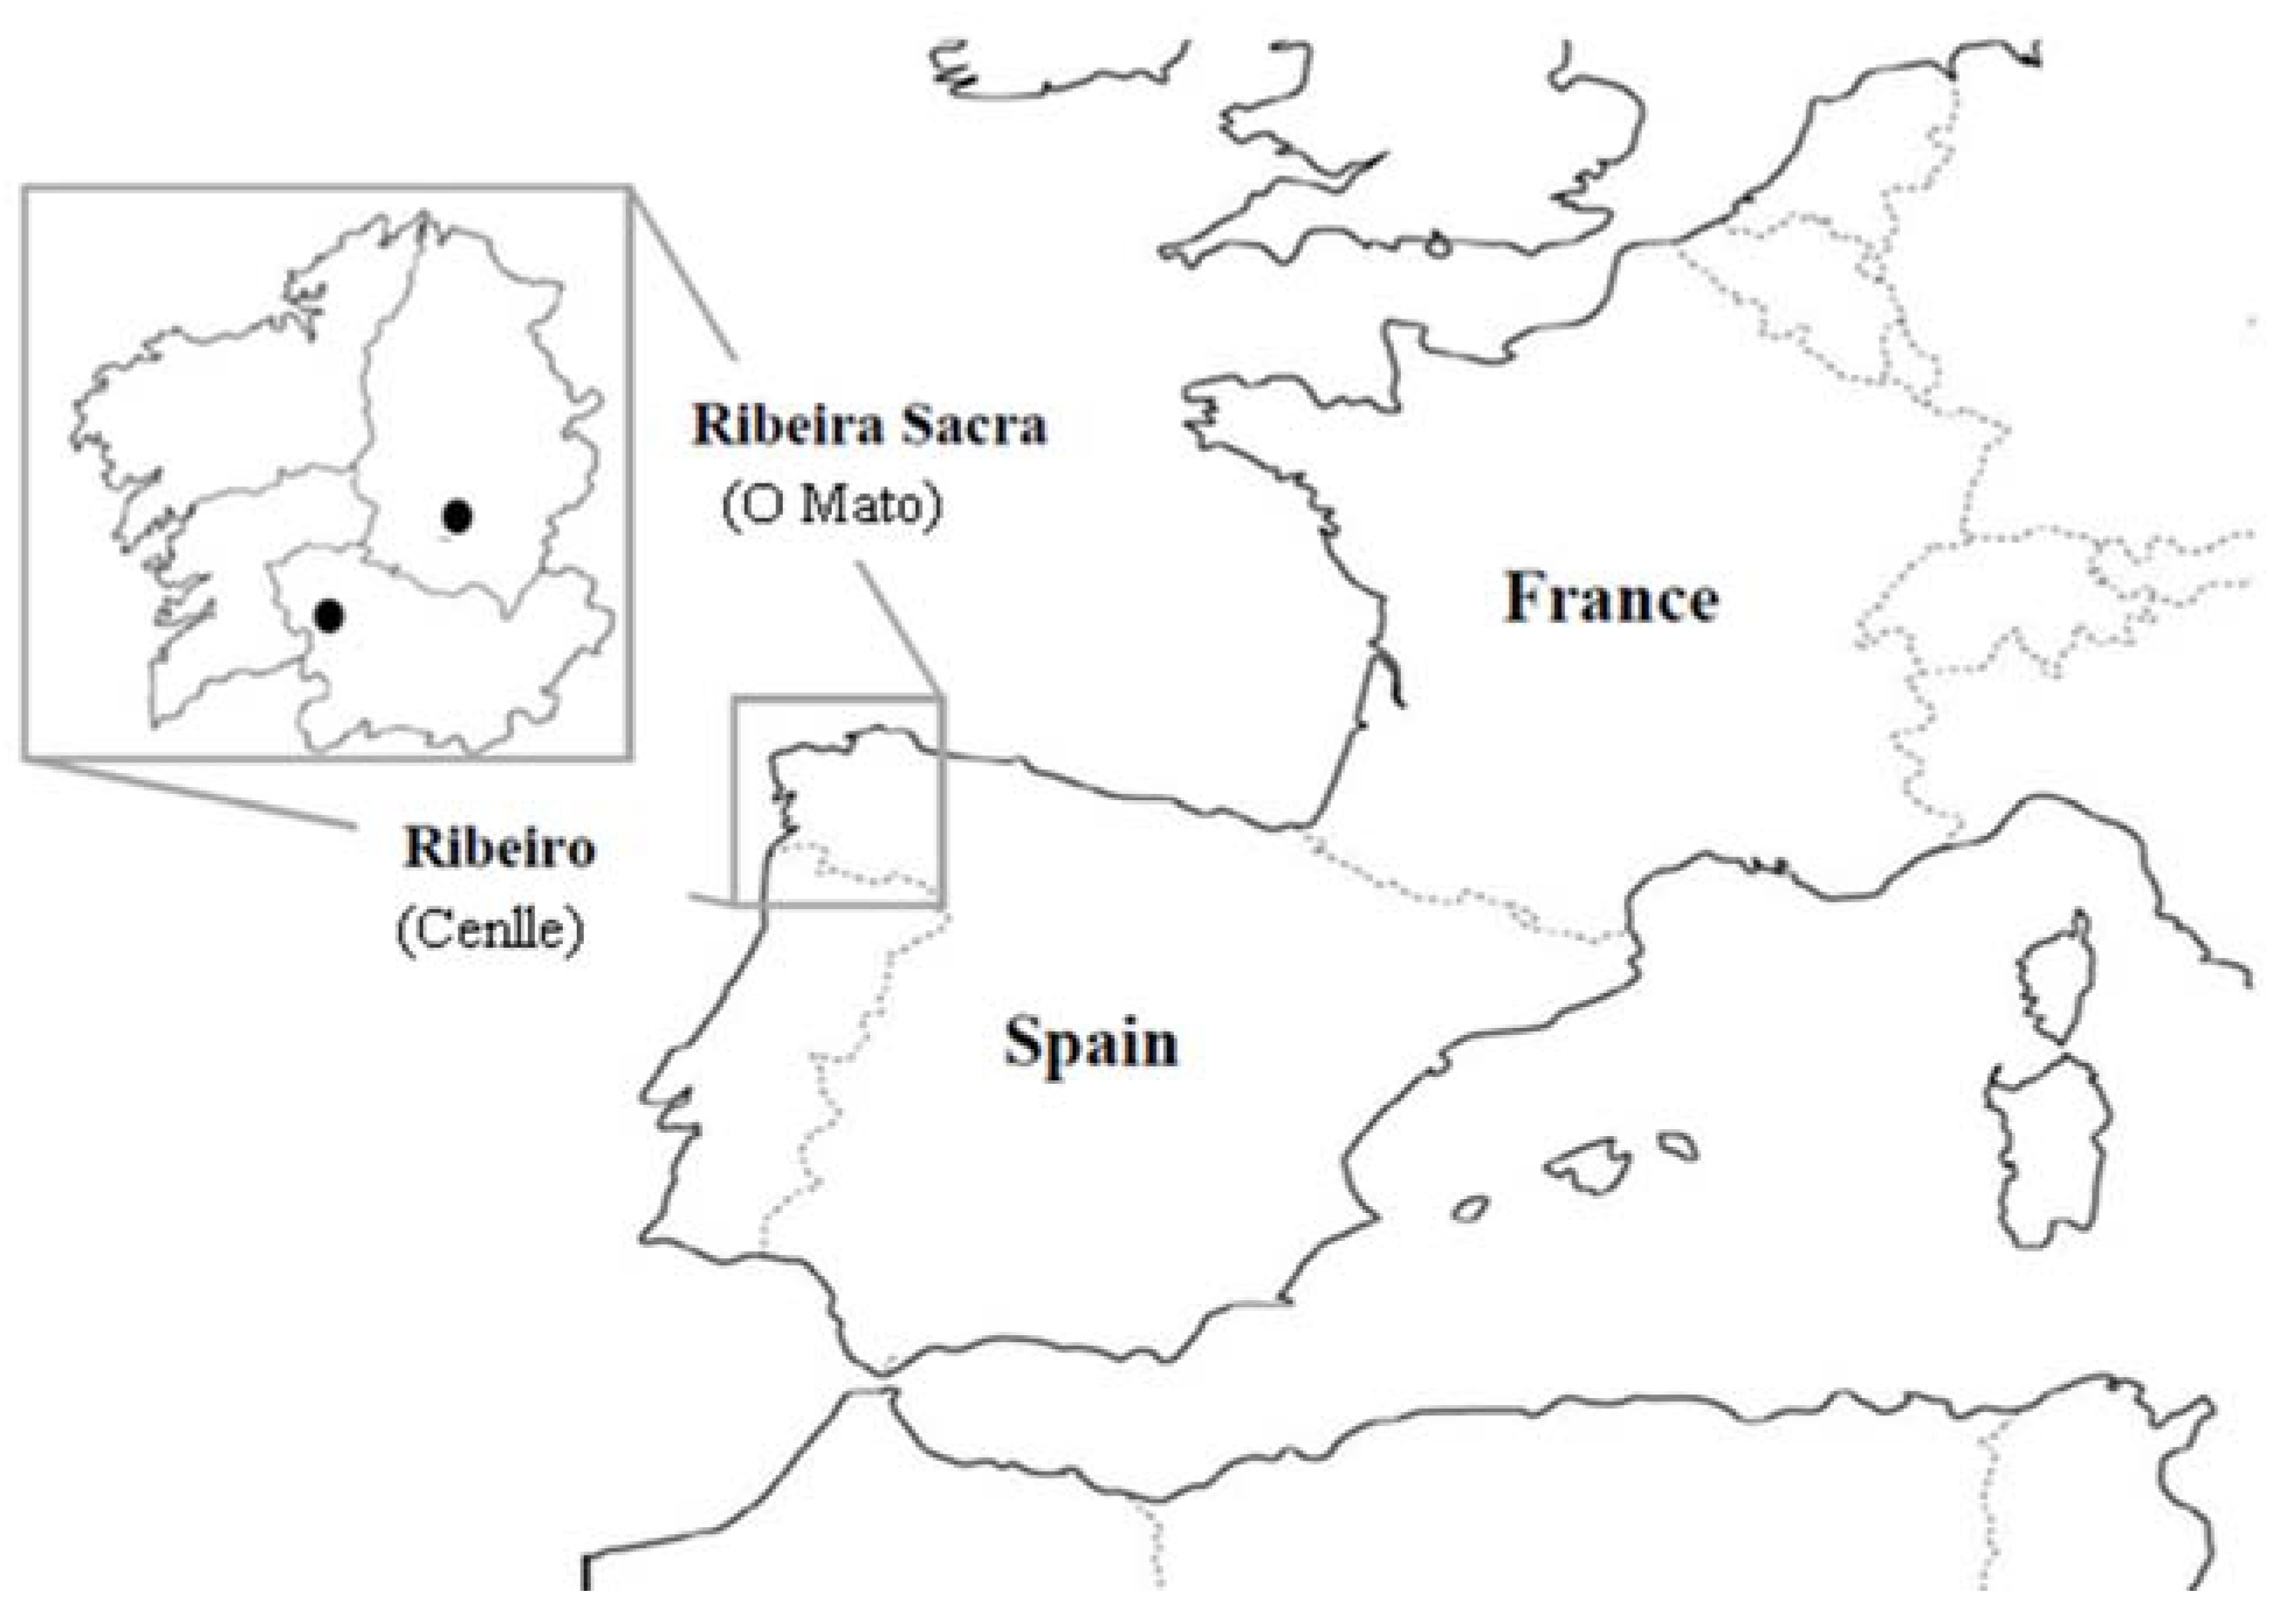
2.1. Location and Climatic Characteristics of the Study Area

The present study was conducted in two wine-making regions, Ribeiro and Ribeira Sacra, in the Cenlle (117 m a. s.l. 42°18′55.7″ N; 8°6′2.54″ W) and O Mato (332 m a. s.l. 42°30′32.3″ N; 7°30′3.02″ W) vineyards, respective ly (Figure 1) during 2016, 2017 and 2018.
The prevailing cultivar in the Cenlle vineyard is Godello, and in O Mato vineyard it is Mencía, both included in the preferential category according to the Designation of Origin Ribeiro (DOG N° 149, 2009) and Ribeira Sacra (DOG N° 194, 2009) regulations. The Godello cultivar has a high vigour and an erect bearing (tending to grow more vertically than horizontally) with an early sprout and maturation. Considering the pathogen susceptibility of the plant according to the three categories established in the classification of the Godello cultivar is classified as having low sensitivity to Botrytis, medium sensitivity to Plasmopara, and sensitivity to Erysiphe. The Mencía cultivar has a medium vigour with early sprouting and semi-late maturation. This cultivar is sensitive to the three considered fungal pathogens [28].
For climatic characterization, we considered the meteorological data of the maximum, minimum and mean temperature, relative humidity, daylight (sunshine) hours, rainfall and wind-speed variables (Table 1), provided by two stations located very close to the studied vineyards, the Leiro and Monforte stations belonging to the weather service Meteogalicia https://www.meteogalicia.gal (accessed on 21/06/2019).

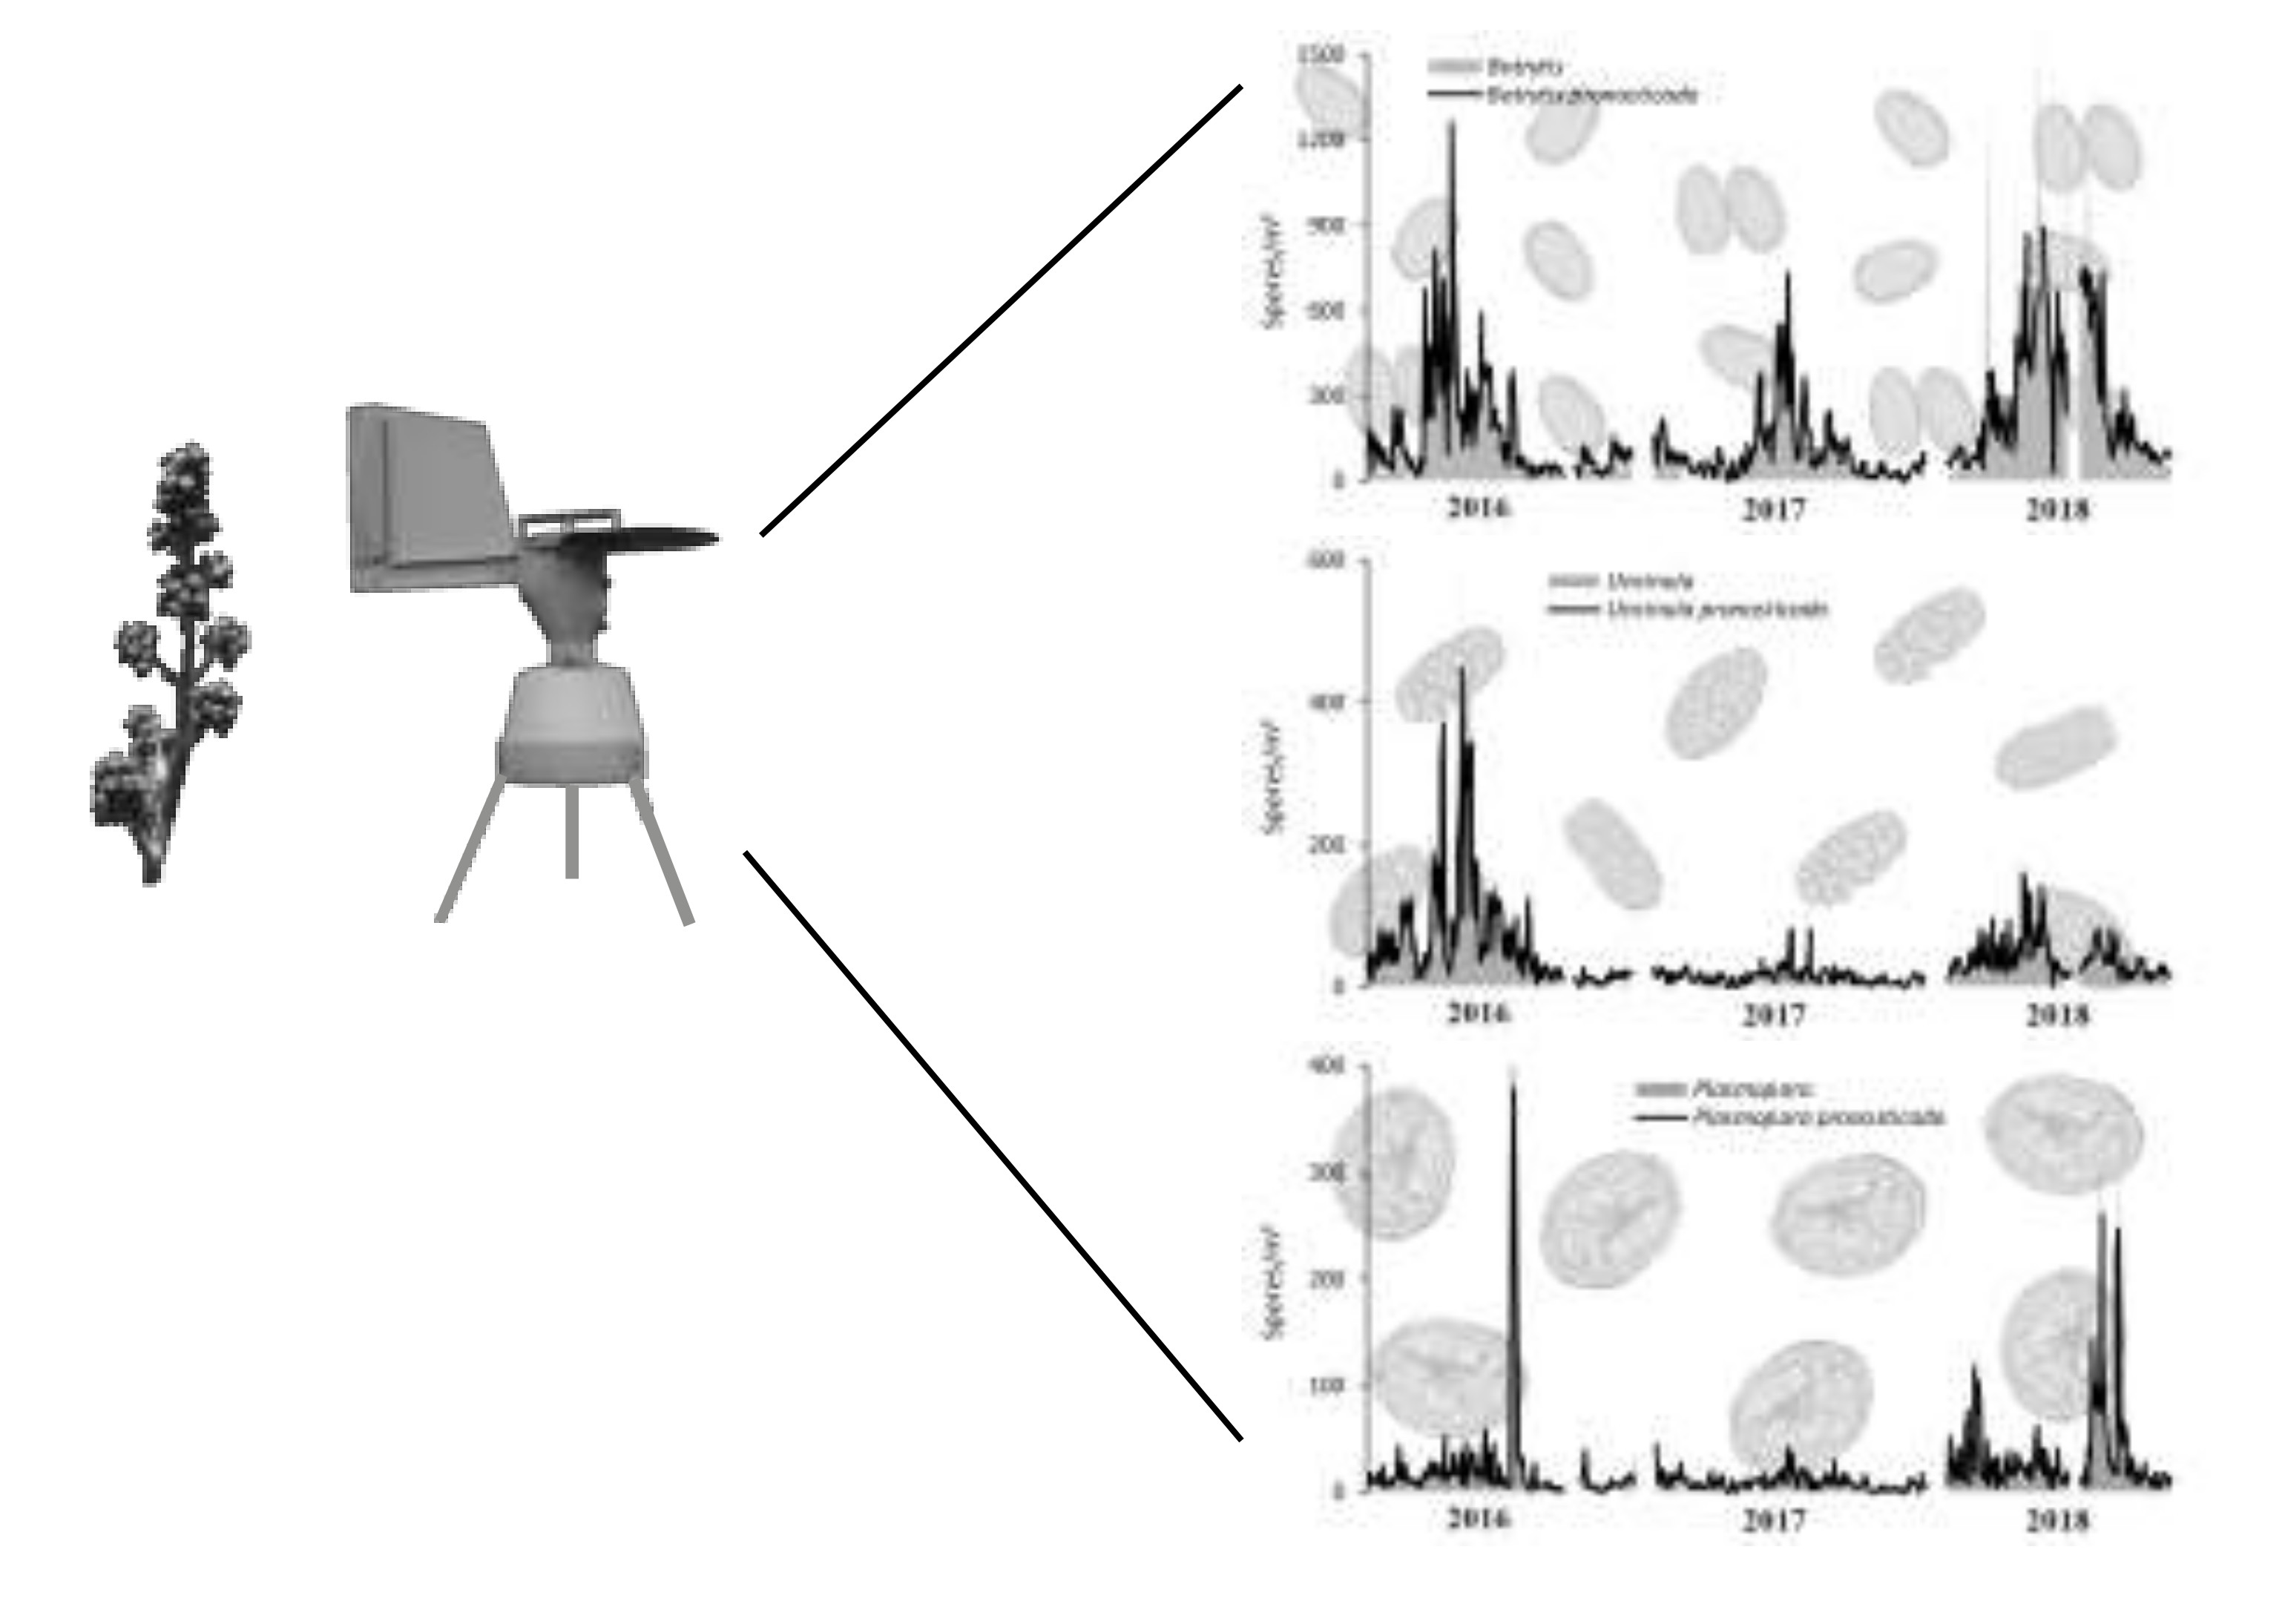
2.2. Fieldwork and Laboratory Analysis

We studied the phenological stages for both grapevine cultivars following the [29] scale adopted by the BBCH (Biologische Bundesanstalt, Bundessortenamt and Chemical industry) as a standardized scale. Phenological observations were applied on 10 vines of each cultivar and this information was correlated with atmospheric spore (or sporangia for Plasmopara) concentrations.
The study was carried out during the active grapevine cycle, from the 1st of March to the grape harvest date in the month of September. We used a volumetric method by means of a Hirst type Lanzoni VPPS-2000® (Lanzoni s.r.l., Bologna, Italy) pollen-spore trap [30] for the sampling of airborne reproductive structures. The volumetric traps were placed at a height of two meters, according to the vine’s foliar arrangement on each studied vineyard. We identified and quantified the three considered pathogens spores/sporangia (Botrytis, Erysiphe and Plasmopara) in the collected samples. We followed the Spanish Aerobiology Network (REA) proposed protocol [31] for spore count and sample preparation. Slide counts were performed on two longitudinal transects along the slides and the airborne fungal spore concentrations were expressed as a daily average of fungal spores/m3 of air recommended terms were used for the aerobiological terminology [32].
Table 2 shows the phytochemical treatments applied in the plots of the study. In the Ribeiro D.O: (Cenlle), a mean of three treatments/year against Botrytis was applied from stage 6 (flowering), six treatments/year against Mildew + Oidium mainly from stage 5 (inflorescence emerges), and two specific treatments/year against Mildew in the 7th and 8th stages (development of fruits and ripening of berries). In the Ribeira Sacra D.O. (O Mato), no treatments against Botrytis were applied, four treatments/year (none in 2017) against Mildew + Oidium, mainly in stage 5 (Inflorescence emerge) and four specific treatments/year against Mildew (none in 2017). For all cases, the fungicides used until Flowering (E6) are of the systemic type in years that had a high incidence of fungi, and from this moment of contact (mainly sulphur-based powder products until Fruit set, and copper in wet dust until Softening of berries).

2.3. Statistical Analysis

In order to determine the influence of the main meteorological variables on airborne spore concentrations, we applied Spearman’s correlation test, as the considered variables didn’t show a normal distribution. We considered the correlations for the same day and the previous 1–7 days as spore production can be directly affected by meteorological conditions or indirectly through its effect on the colonised substrates [26]. Moreover, we applied a Principal Component Analysis (PCA) to complement the analysis of these variables, considering the meteorological influence of all variables as a whole. For this analysis we considered for both vineyards the maximum, mean, and minimum temperatures; relative humidity; rainfall; and wind-speed meteorological parameters, independent of the vineyard location.
With the obtained results, we developed models based on Lineal Regressions using the meteorological variables with the highest correlation coefficients as estimators of the fungal spore concentrations. For model validation, we carried out an internal validation and we studied the residual scores as they show the differences between observed and predicted data for each analysed year.

3. Results

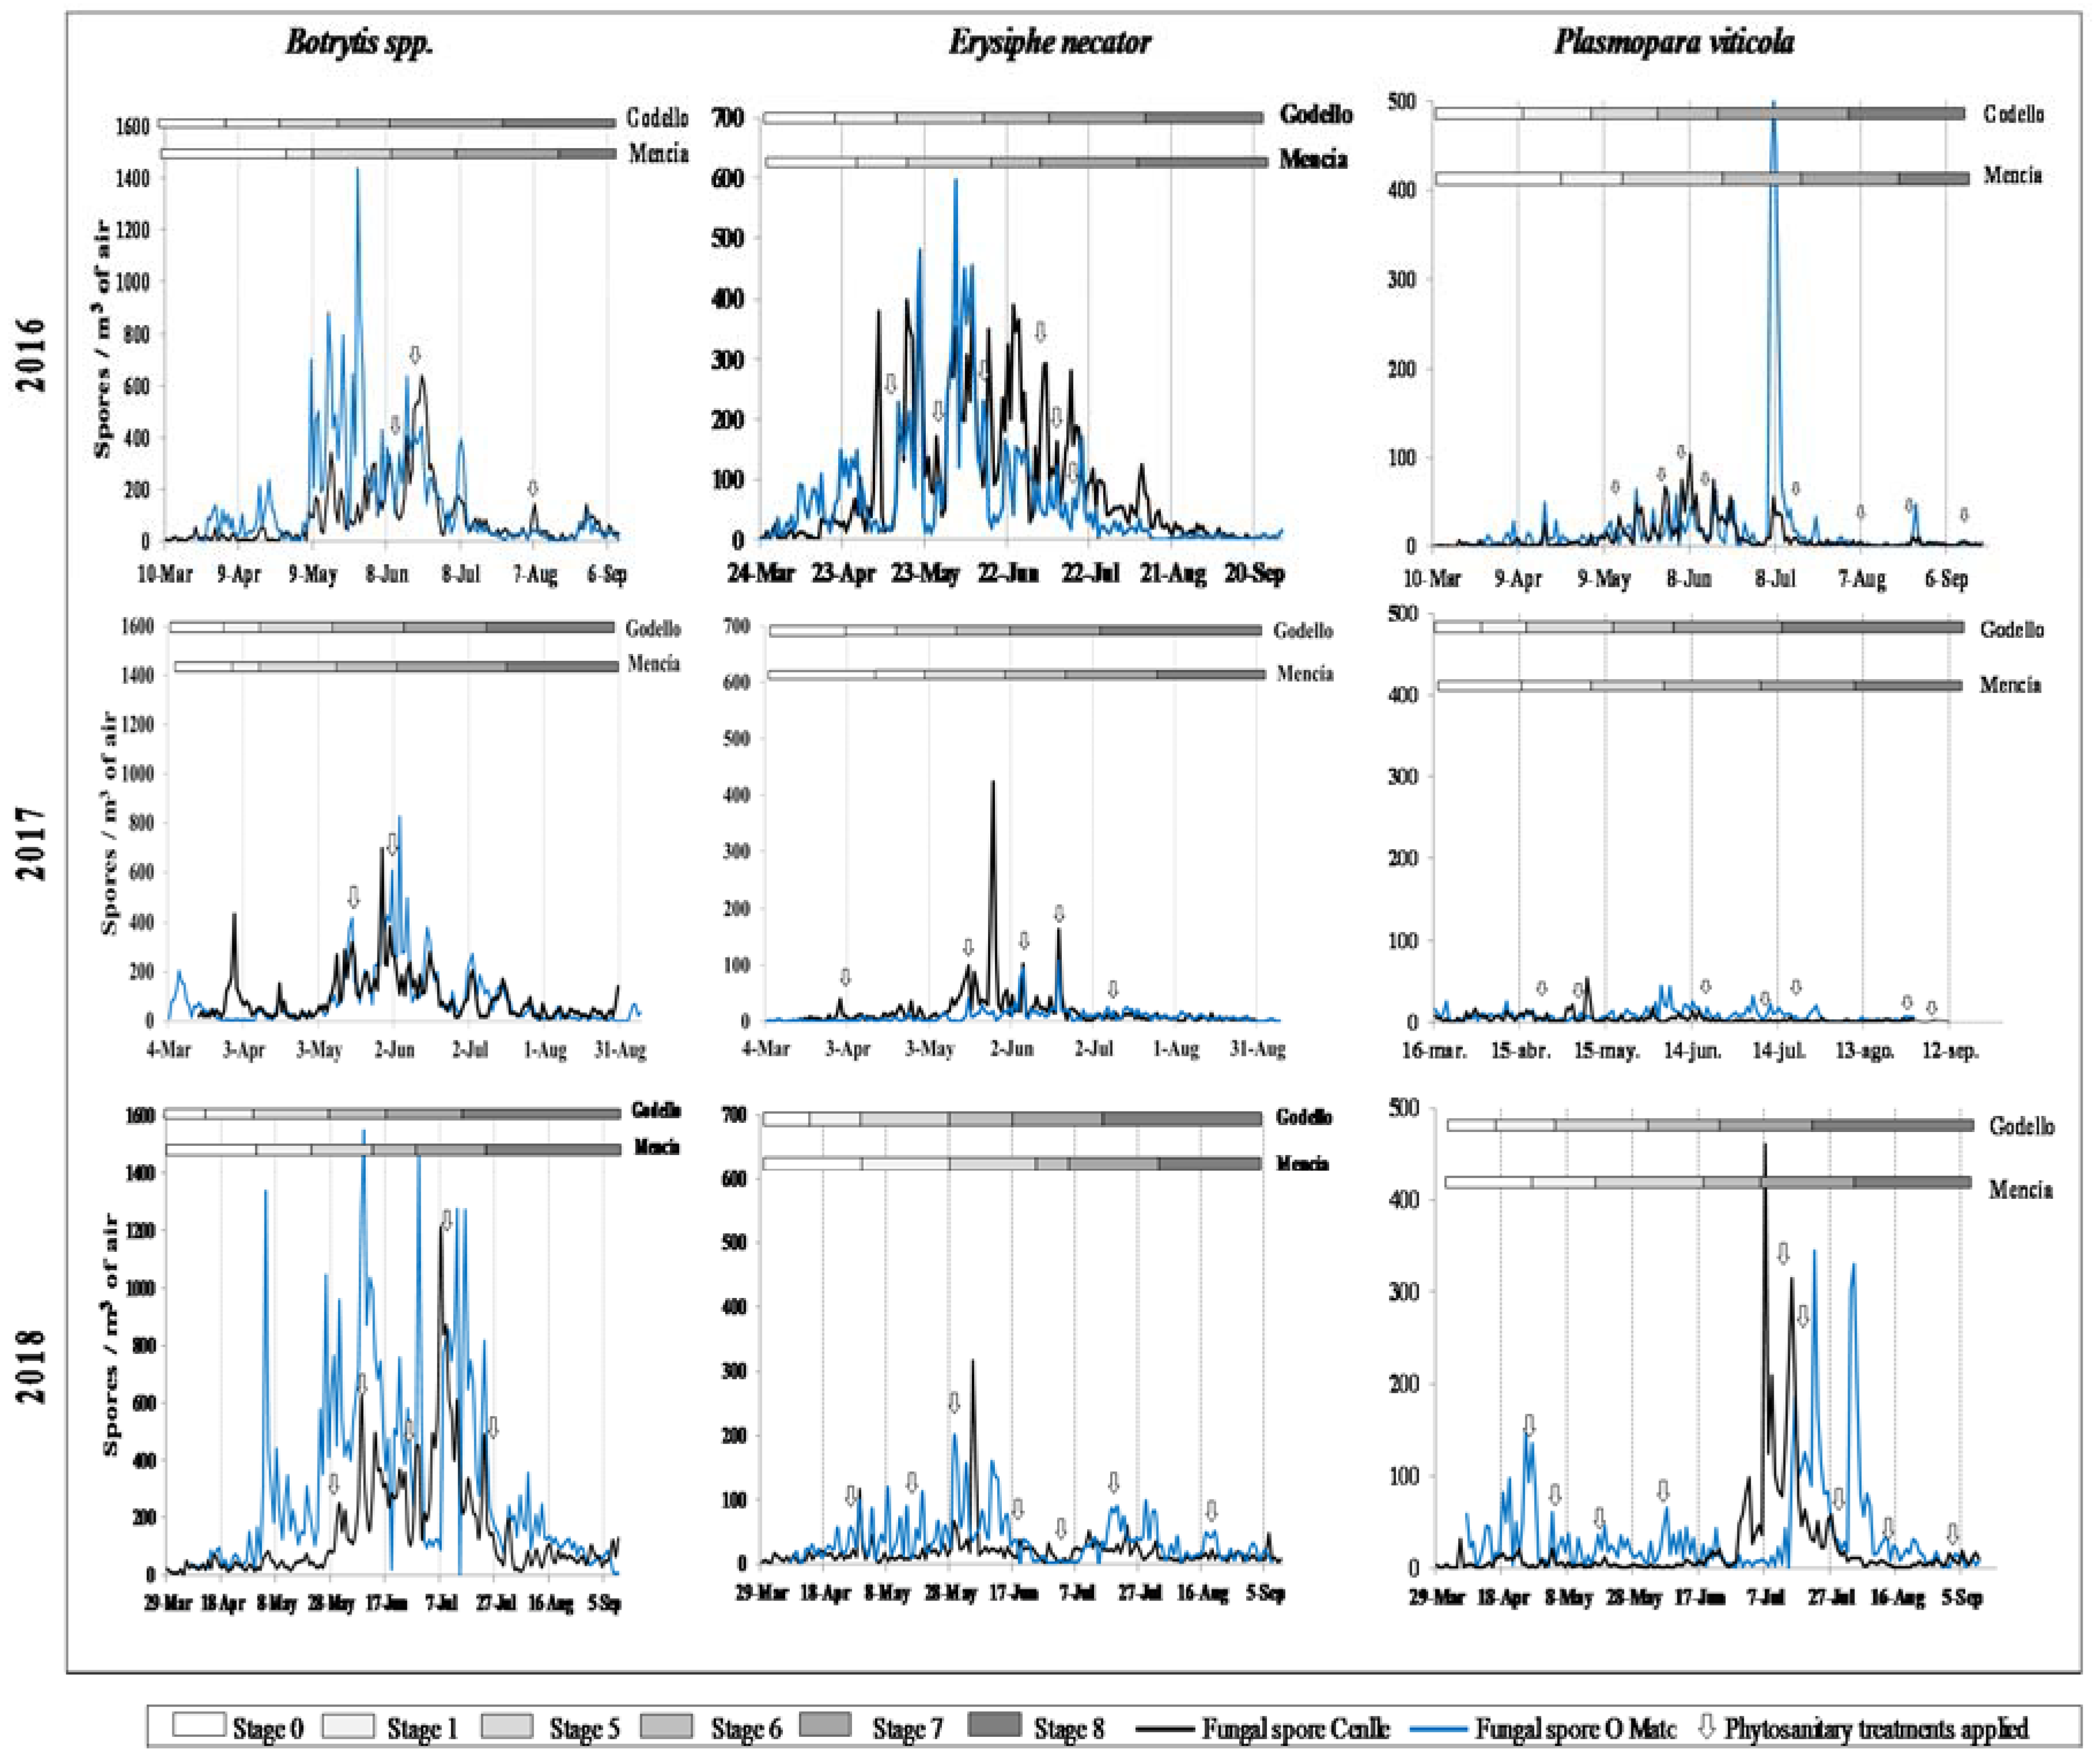
3.1. Total Spore Concentrations and Spatial Distribution

The active grapevine period slightly varied according to the vineyard location and the considered year. The sprouting phenological phase (S-0) began between mid-March to the beginning of April, while the harvest date occurred between the end of August to mid-September. Within these dates, the collection of aerobiological samples was carried out and the fungal spores were counted.
The Botrytis Seasonal Spore Integral (SSIn) was markedly higher than for the other considered pathogens, with a maximum of 49,620 spores in the O Mato vineyard in 2018 and SSIn values of 27,656 and 17,240 spores for the 2016 and 2017 years, respectively. The Erysiphe SSIn noted a record in 2016 for both studied vineyards of 17,269 spores in Cenlle and 12,946 spores in O Mato. Plasmopara was the pathogen with the lowest atmospheric presence. The highest SSIn value was recorded in 2018 at the O Mato vineyard with 5656 spores, varying between 1363 for 2017 and 3618 for 2016 SSIn, and from 679 for 2017 to 3605 for 2018 SSIn values in Cenlle (Table 3).
Taking into account the maximum daily values we also found a clear Botrytis spore’s dominance with a maximum of 1547 spores/m3 in O Mato on 9 June 2018. The highest daily peaks of Erysiphe and Plasmopara were recorded during the 2016 season in the O Mato vineyard, with 597 Erysiphe spores/m3 on 3 June 2016 and 502 Plasmopara spores/m3 on 7 July 2016.
Considering the pathogen relation with the different grapevine phenological phases, we found a considerable variability depending on the pathogen, season, and vineyard location. The Botrytis and Erysiphe airborne spore presence were almost constantly along the grapevine growth cycle, while the Plasmopara sporangia did not show a continuous daily record. For the considered 2016–2018 period, we found 29 days/season average of Plasmopara 0-record in Cenlle, and 20 days/season in O Mato.
The highest Botrytis incidence was detected from the inflorescence emergence (S-5) phenological stage until the end of flowering (S-6). At the Cenlle plot, the maximum atmospheric Botrytis spore peak was recorded in mid-June in 2016, the end of May in 2017, and several spore peaks were detected between the beginnings of June and the end of July in 2018, with a maximum peak on 7 July. At the O Mato plot, the Botrytis spore peaks occurred within the May–July period, with the maximum peaks on 27 May 2016, on 4 June 2017, and 9 June 2018. We also found early infections during the leaf development (S-1) phenological stage at the Cenlle vineyard in 2017, and at the O Mato vineyard in 2016 and 2017 (Figure 2).
Most of the Erysiphe and Plasmopara infections coincided with the end of flowering (S-6) and development of fruits (S-7) phenological stages. At the Cenlle vineyard, there were several Erysiphe and Plasmopara spore peaks detected in the May–July period in 2016, while the maximum Erysiphe spore peak was on 26 May 2017 and 4 June 2018, and the maximum Plasmopara sporangia peaks were registered at the beginning of May in 2017, and during July in 2018. At the O Mato vineyard, the highest Erysiphe spore peaks were also detected in the May–July period in 2016 with a maximum spore peak on 3 June. In 2017 and 2018, the highest daily spore peaks were lower than in 2016, registered on 19 June and 29 May, respectively. The Plasmopara highest sporangia peaks occurred at the beginning of July in 2016 and the end of July in 2018, while in 2017 the peak was detected at the beginning of June, with a markedly lower value (Figure 2).

3.2. Analysis of Meteorological Parameters

Taking into account the annual average maximum temperature value, it was higher in Ribeiro (Cenlle) with a 2 °C difference over Ribeira Sacra (O Mato) for the same considered years. The same occurred with minimum and mean temperatures but with the lowest difference in this case, around 1 °C. For both vineyards, Cenlle and O Mato, 2017 was warmer than the other two considered years with a maximum temperature of 23.9 °C and 21.9 °C respectively. Mean and minimum temperatures were higher in 2018, with 15.2 °C and 13.7 °C mean temperatures, and 8.2 °C and 7.3 °C minimum temperatures, respectively. The average relative humidity was higher in Ribeira Sacra than in Ribeiro, reaching its maximum in 2016 with 80.9%. The same happened with the sunshine hours, with the maximum values for Ribeira Sacra found in 2017 and 2018. The rainiest year was 2016 for both Ribeiro (with 1211.8 mm) and Ribeira Sacra (940.4 mm) areas. Nevertheless, the rainiest day was 10 December 2017 for both vineyards (Table 1).

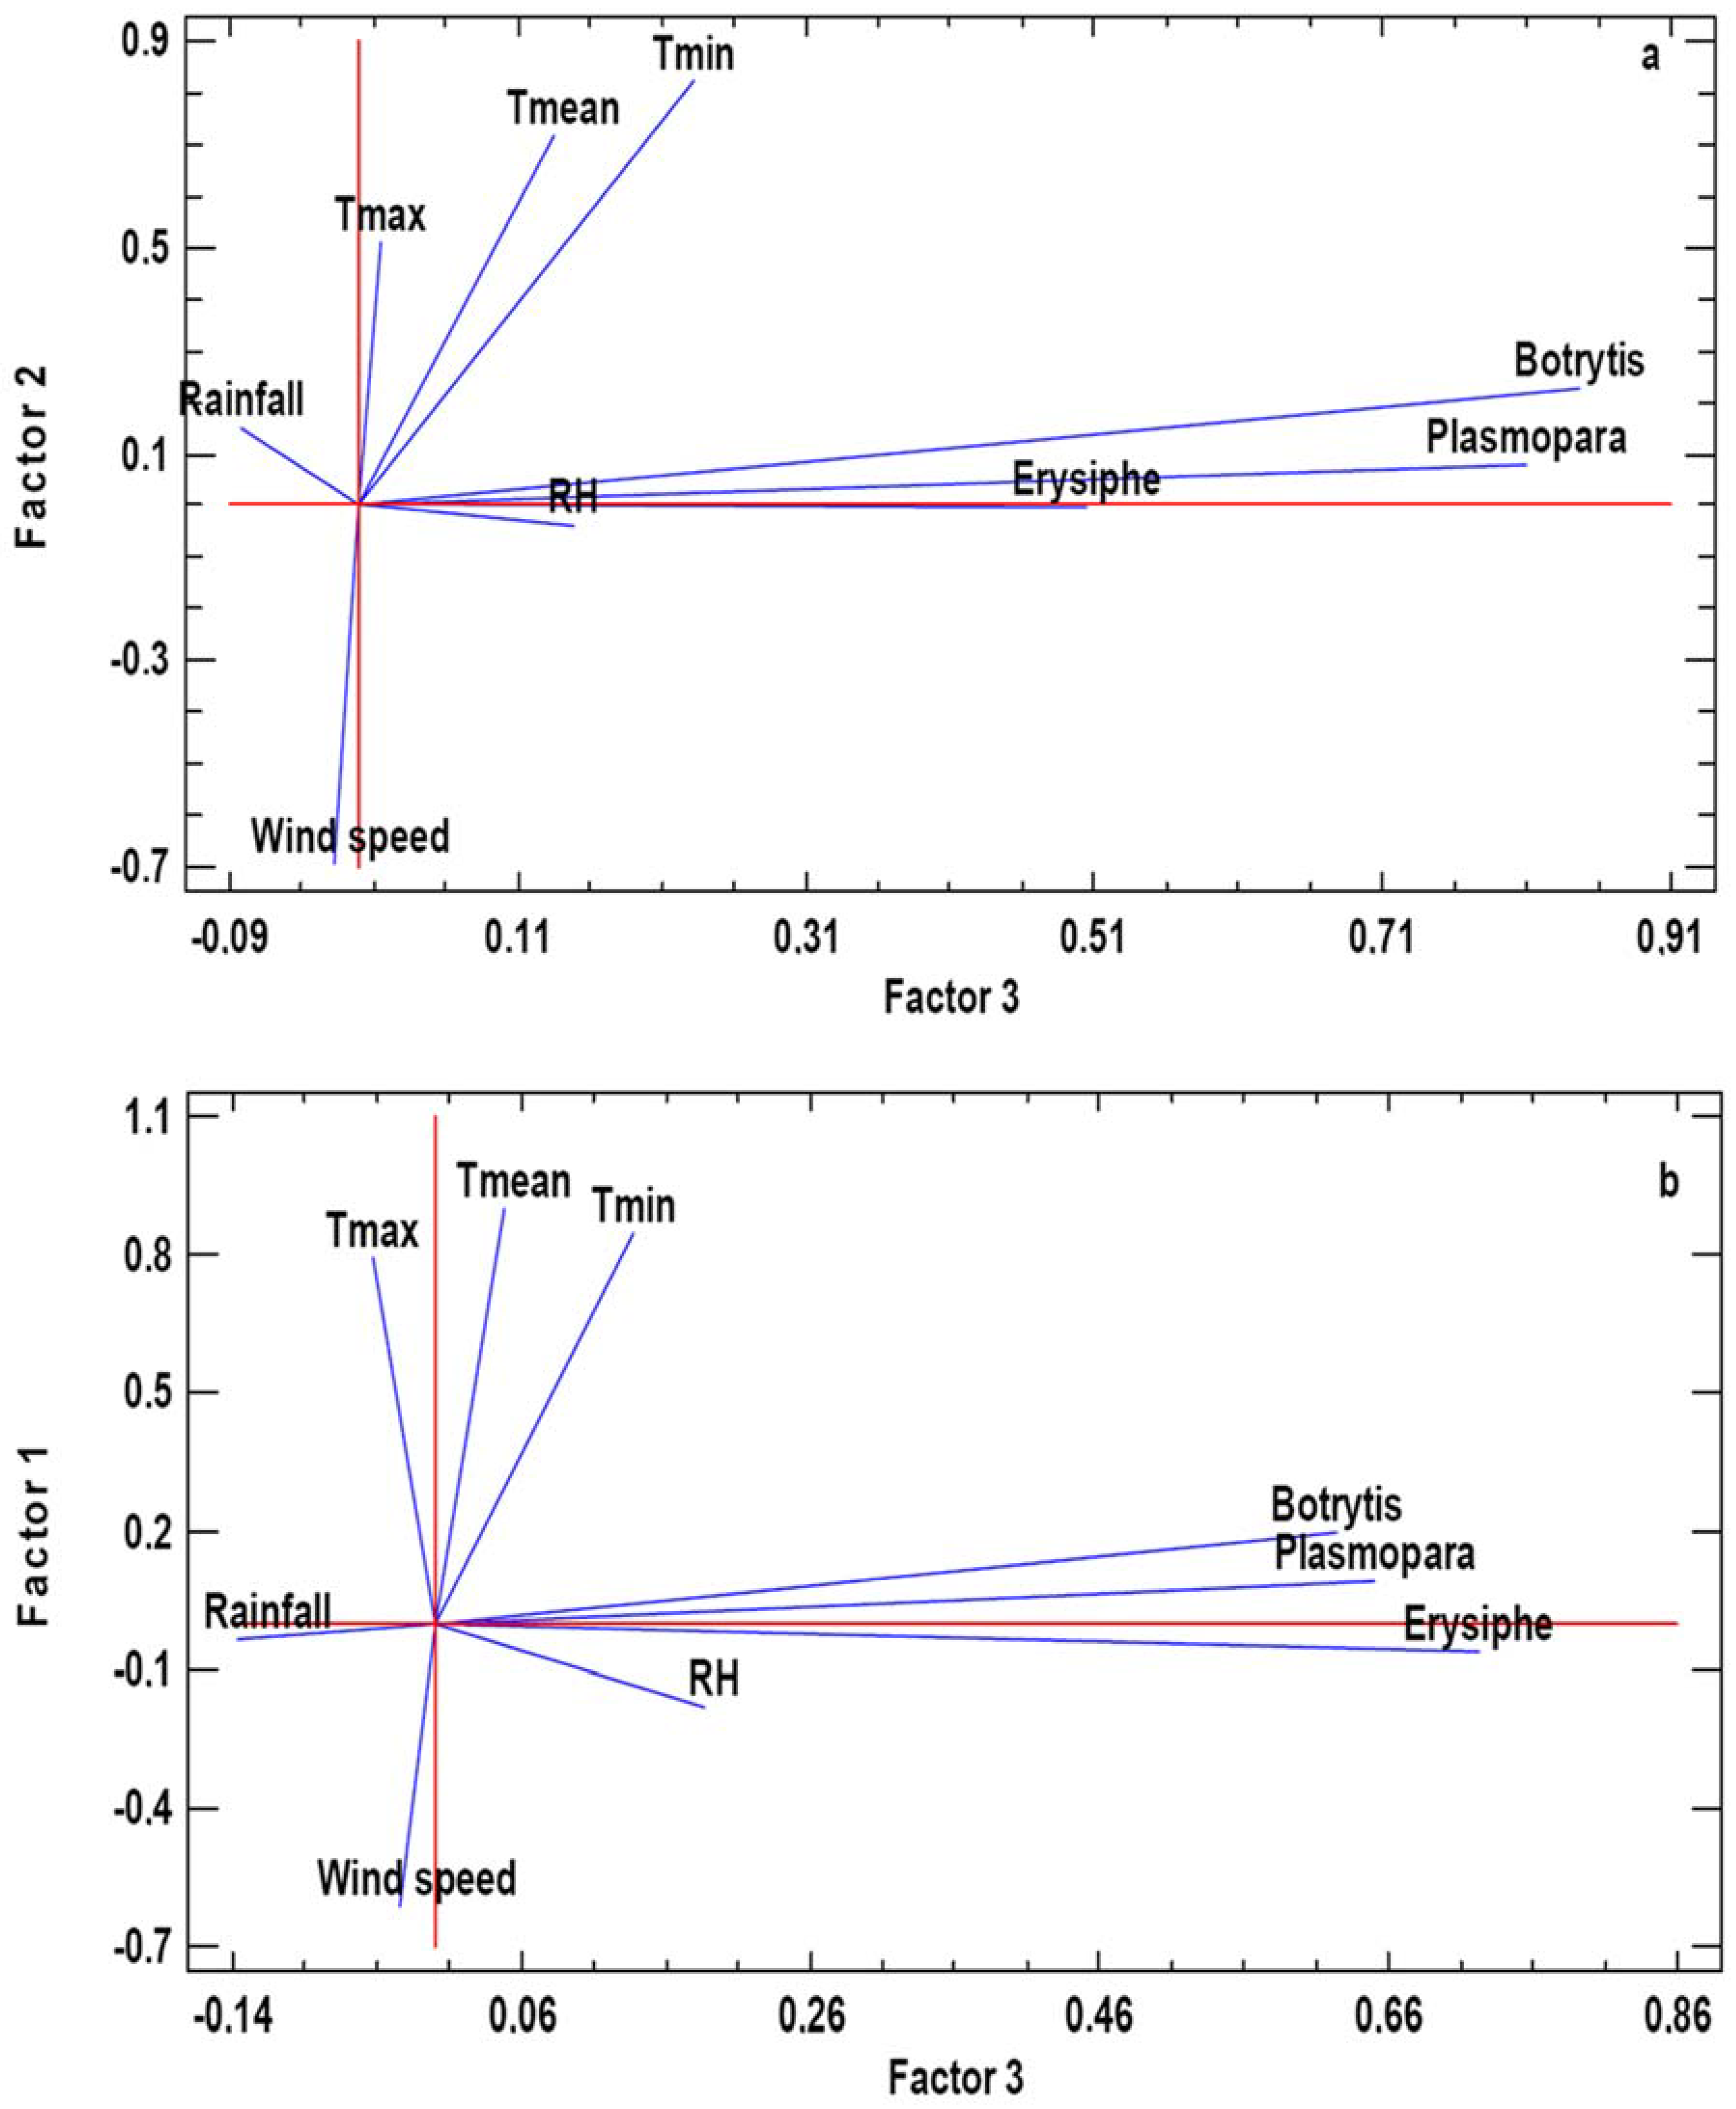
3.3. Statistical Results

The statistical analysis between the spore daily concentrations and the daily values of the main meteorological variables along the grapevine reproductive cycle was conducted, while also considering the daily values of the meteorological variables during the previous 7 days in regards to the presence of spores in the atmosphere of the vineyard. The statistical analysis between the spore concentrations and the main meteorological variables showed that rainfall and relative humidity had a statistically significant influence in most cases. Nevertheless, the influence sign was not so clear for temperature, as we found the same number of positive and negative correlations for maximum and mean temperature. The parameters with the highest influence on each pathogen varied depending on the vineyard location and the study year.
Within the significant Botrytis correlations, we found the highest Spearman’s r positive coefficients for the Botrytis spores obtained four days before (Botrytis-4) vs. rainfall, and Botrytis-4 vs. relative humidity correlations for Cenlle in 2017. In the same Cenlle vineyard in 2018, we found the Botrytis-1 vs. minimum temperature, and Botrytis vs. mean temperature correlations. We also found a high Spearman’s r positive coefficient for the Botrytis-2 vs. relative humidity correlation at the O Mato vineyard in 2016. For the Erysiphe airborne spores we found that the highest Spearman’s r significant coefficient was negative, corresponding to Erysiphe-2 vs. minimum temperature, and Erysiphe-2 vs. mean temperature correlations at Cenlle vineyard in 2016. At the O Mato vineyard, we found also high correlations, positive in this case, between Erysiphe vs. minimum temperature, and Erysiphe vs. mean temperature in 2017. The strongest correlations found for Plasmopara airborne sporangia corresponded to Plasmopara vs. minimum temperature, Plasmopara vs. mean temperature positive correlations at the Cenlle vineyard in 2017, and Plasmopara-6 vs. rainfall, Plasmopara-2 vs. relative humidity positive correlations at the O Mato vineyard in 2016. However, we also found considerable negative correlations for Plasmopara-7 vs. maximum temperature and Plasmopara-7 vs. mean temperature at the O Mato vineyard in 2016 (Table 4).
In both analyzed areas, the Principal Components PC1 and PC2 included meteorological variables and the PC3 grouped the three phytopathogenic fungi spore concentrations. For Cenlle, PC1 includes the maximum and mean temperatures, humidity, and rainfall and PC2 includes the minimum temperature and wind speed. In the case of O Mato, PC1 include the temperatures and the wind speed, whereas PC2 includes the water-related parameters. Most of the variables had significant positive loads, except wind speed (PC2 in Cenlle and PC1 in O Mato). For graphic representation, we selected PC2 versus PC3 for the Cenlle vineyard, and PC1 versus PC3 for the O Mato vineyard (Figure 3). In the obtained charts we showed in detail the relation between fungal airborne spores and the main meteorological variables. In both vineyards we observed a high positive association degree between meteorology and fungal spores counts.

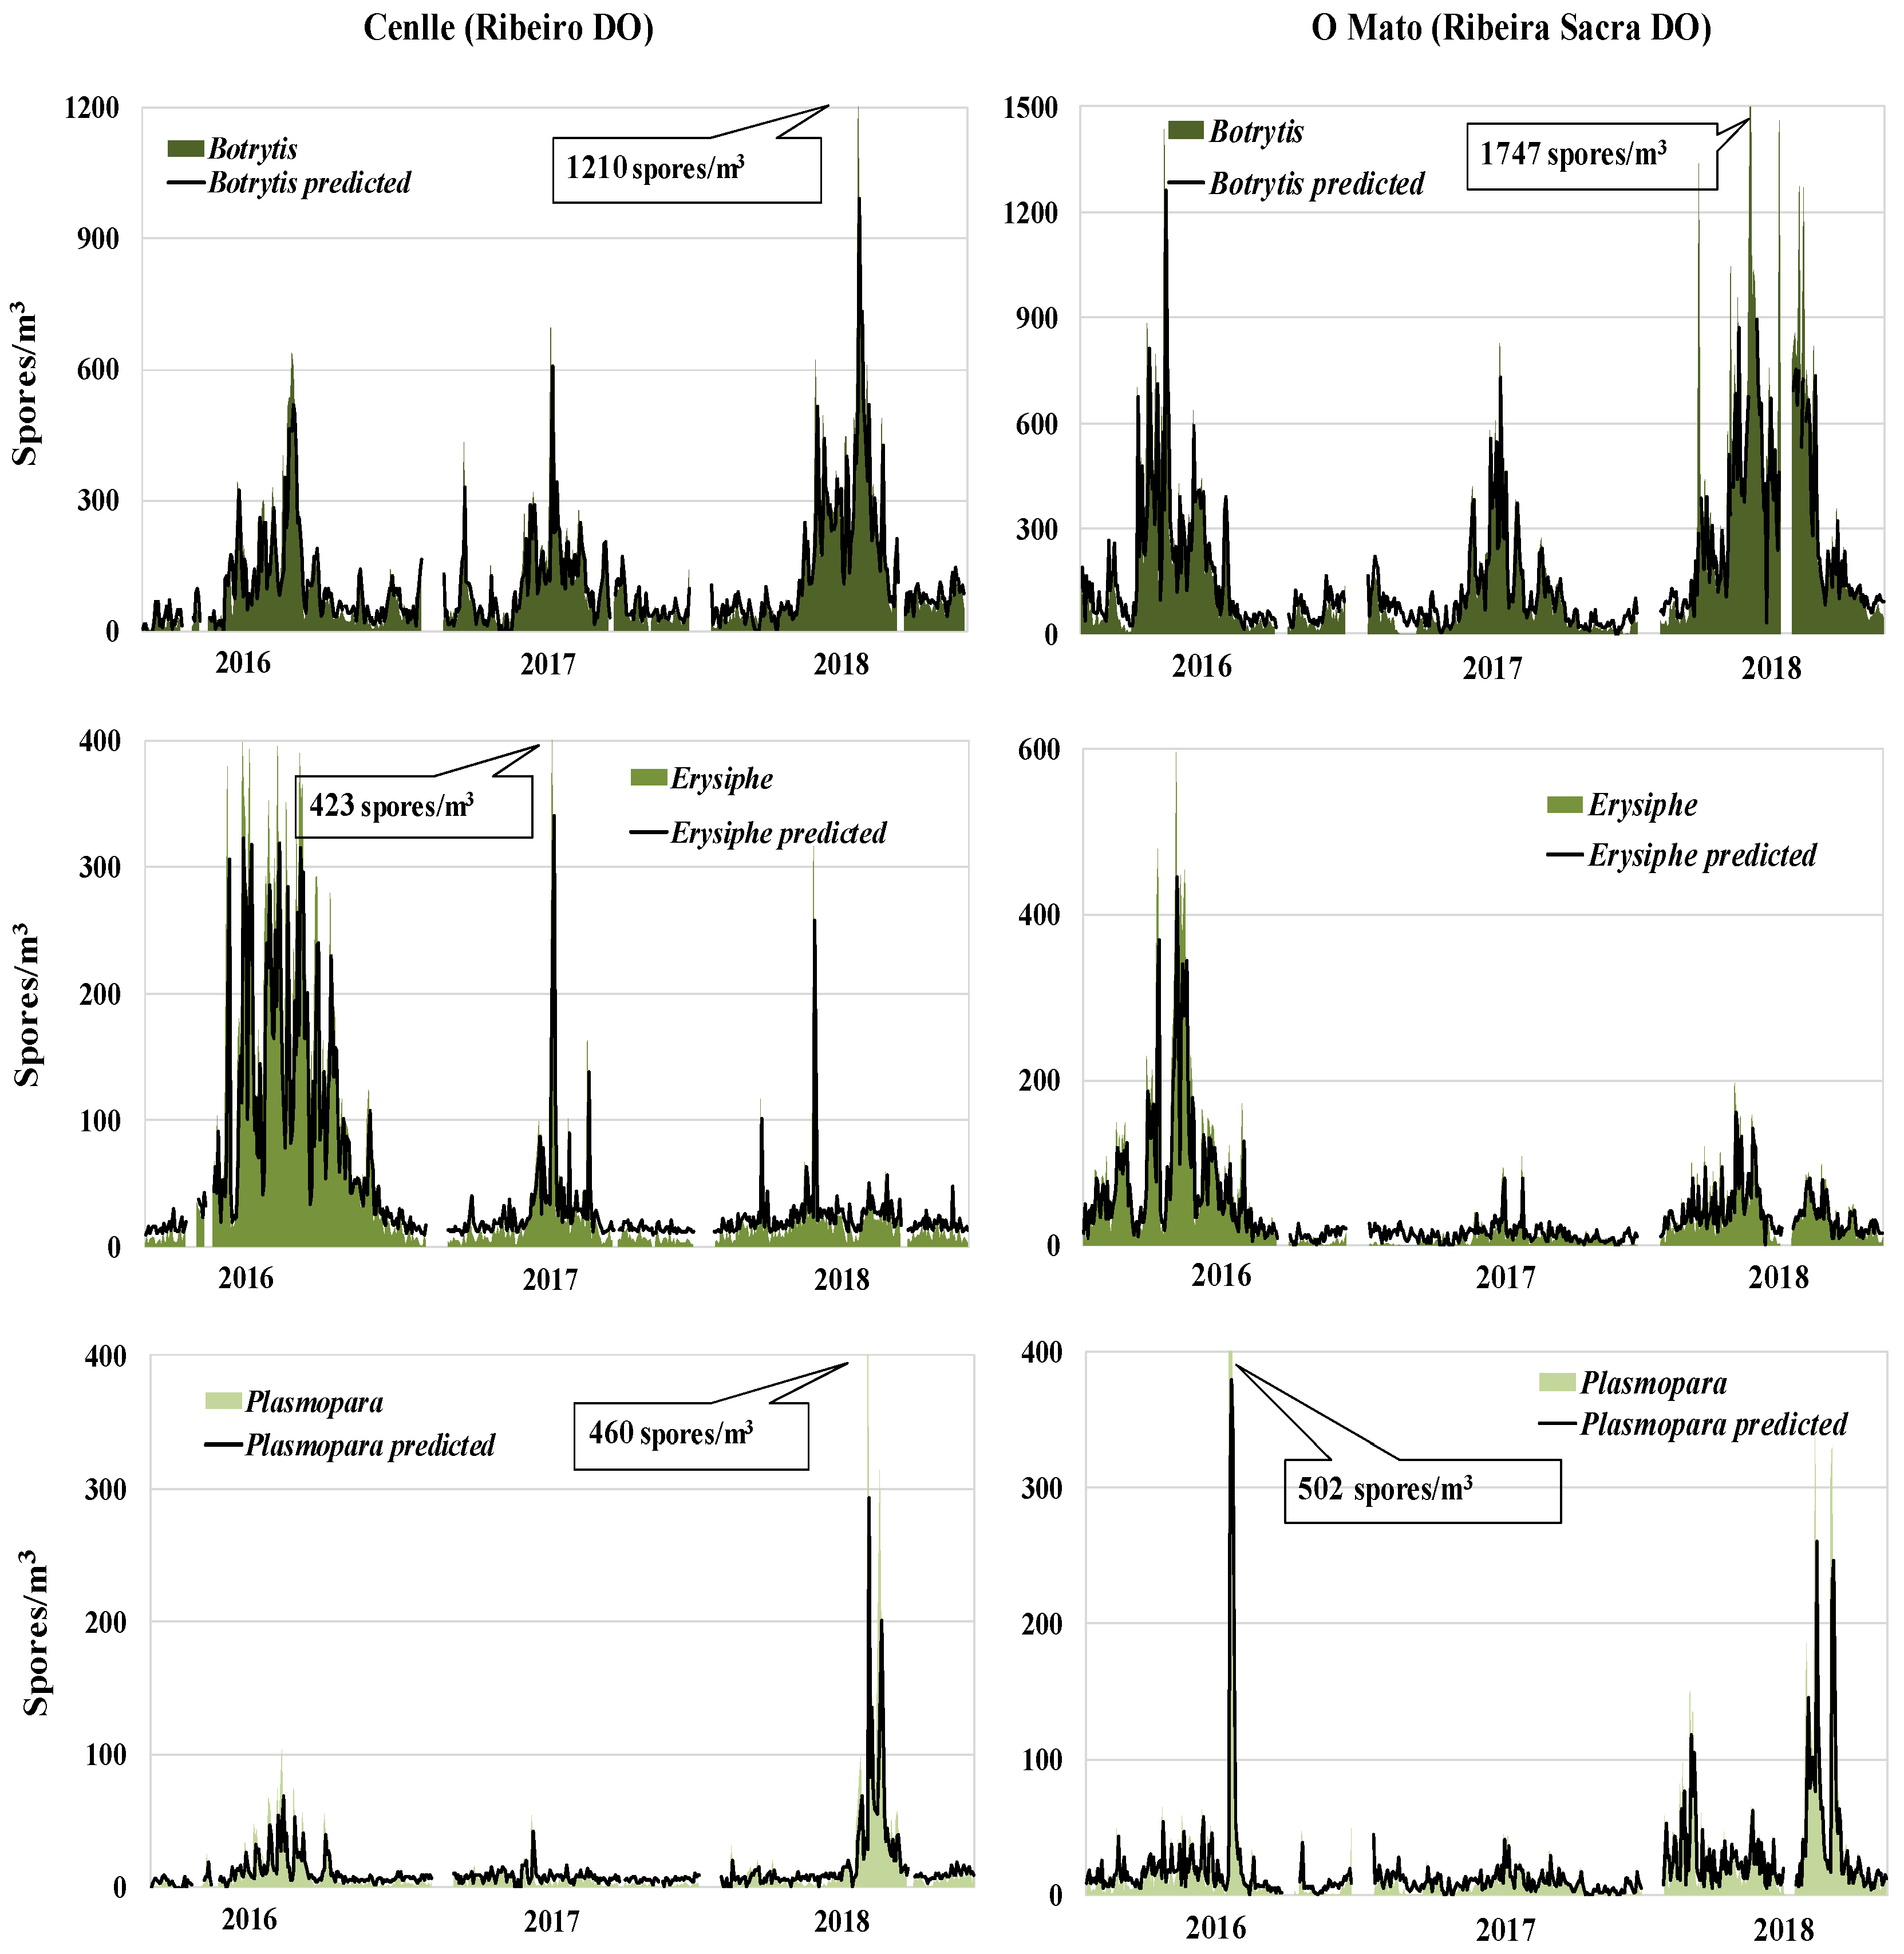
3.4. Predictive Models

The selected variables for the Botrytis, Erysiphe and Plasmopara spore concentration predictive models development carried out in this study were different for each fungal type, although mean temperature of the same day, relative humidity of the same day and three days before, and spore concentration of the previous day were the most used variables. The Botrytis model linear regression equations explained the spore concentration variability of 59.4% in O Mato and 70.9% in Cenlle. For the Erysiphe model, the regression equations explained the data variability of 57.6% in O Mato and 61% in Cenlle, and, for the Plasmopara model, they explained the data variability of 39.9% in Cenlle and 55.8% in O Mato (Table 6).
In order to select the meteorological variables for model development we took into account the statistical results. The relative humidity of three days before and the spore concentration of the previous day for each fungal type were the highest significant parameters. For most cases, we obtained a good fit between real and forecast values (Figure 4). The greatest predictive difficulty was focused on the maximum spore peaks, such as Botrytis in 2018 at both vineyards, Erysiphe in 2017 at Cenlle vineyard, and Plasmopara in 2016 at O Mato vineyard, since the models failed to reach the exact real values.

4. Discussion

The chemical fungicide application following preset treatment schedules is a widely used control strategy among wine growers to reduce the fungal disease impact on the crop, which has several environmental repercussions [33]. Pathogens have a great impact on global agriculture, especially in viticulture as climate change can aggravate this situation [34]. Aerobiological models associated with climatic variables and the use of local cultivars, adapted to the specific area conditions, would enhance the control of grey mould, powdery mildew, and downy mildew [35,36]. Furthermore, these models are useful optimization tools for wine growers to achieve more effective pest management and crop protection as they can predict, in advance, the inoculum concentration of these pathogens [37].
For predictive model’s development, we carried out atmospheric monitoring of the Botrytis, Erysiphe, and Plasmopara reproductive airborne structures in two NW Spain vineyards from 2016 to 2018. We simultaneously applied a phenological study on the Godello and Mencía cultivars grown there and we registered the main meteorological parameters values during the study period.

4.1. Relationship with Phenological Stage and Meteorological Influence

Botrytis spore counts in aerobiological samples were markedly higher than Erysiphe and Plasmopara ones, which coincide with previous studies carried out at nearby vineyards [38], although in this case the airborne Plasmopara sporangia atmospheric content (a SSIn of 747 sporangia) was higher than the Erysiphe records (a SSIn of 578 spores). In other Southern Spain viticulture areas, the Erysiphe spore concentrations exceeded the Botrytis concentrations [4], which is related to the much warmer and drier climate and the different cultivars grown there (Pedro Ximénez, Verdejo, Muscat Blanc à Petits Grains and Chardonnay).
Besides the meteorological factors, other aspects influence fungal development, such as the vegetative canopy structure that determines the leaf spatial distribution. Thus, shaded areas are favourable for pathogens development, while those exposed to solar radiation, which results in higher temperatures, inhibit them [39]. Other appropriate management techniques for fungal control for this type of crops include sprouting spacing and length reduction, reducing plant vigour techniques establishing other crops for resource competition, or nutrient intake control especially for nitrogen [14].
The highest Botrytis airborne spore abundance that was have found does not mean a higher grey mould incidence for our area’s crops, as it depends on other factors such as the grapevine phenological stage at the moments of peak infection (the considered critical period for infection encompasses flowering–maturation) or the applied chemical treatments [14,40]. As we had confirmed, the phytopathological state of the vineyards in the studied wine regions indicates a higher prevalence and damage caused by downy mildew, as it is one of the worst vine diseases occurring alongside favourable climatic conditions [17]. The characteristic high relative humidity values and moderate temperatures of the considered areas favour the survival of Plasmopara sporangia [41]. The susceptibility of Vitis vinifera to cryptogamic diseases also depends on cultivar and even on the clones used in the crop [42,43].
Several authors had pointed out a constant Botrytis spore presence in the atmosphere of the vineyards [44,45,46,47]. However, total airborne concentrations vary depending on the vineyard location and the study period. Close to our study area, ref [26] found SSIn Botrytis levels between 1700−37,299 spores depending on the year. In a Portuguese vineyard located at Amares, [48] found an SSIn level of 800−1858 Botrytis fungal spores, also varying according to the considered study year. In any case, the concentrations were much lower than those recorded in the present study, mainly in the O Mato vineyard during 2018 with an SSIn of 49,620 Botrytis. For this year, we also found the highest Plasmopara incidence at both vineyards, with a mean value of 4631 sporangia for 2018 against a mean value of 1893 sporangia for the rest of the studied years. On the contrary, the Erysiphe airborne spore levels stood out in 2016, with a mean SSIn value of 15,108 for both vineyards regarding the other two analysed periods that had a mean SSIn of 3445.
The vineyard soil management is another influential factor. The pruning remains and the surrounding herbaceous vegetation have an impact on the released spore amount, mainly for Botrytis [23,49,50]. This could be one of the explanatory causes for the high Botrytis spore concentrations at the O Mato vineyard in 2018, which had a dense vegetation cover throughout the active vine period in that season.
On the other hand, Botrytis sporulation has a wider temperature and humidity tolerance range than the other two studied pathogens. Moreover, this fungus can survive in the previous year’s dried leaves and mummified bunch grapes [23], which would explain the early infections detected during the leaf development (S-1) phenological stage.
[49] pointed out that grey mould occurs at the beginning of spring and in a more variable way in harvest time (autumn) at different NW Spain wine making regions. Powdery mildew thrives during fruit set, principally during the June and July months, while downy mildew outbreaks are irregular during spring, coinciding with Flowering but also occurring in autumn, when the grape harvest takes place.
Our results placed the highest Botrytis airborne spore concentration since the beginning of inflorescence emergence (S-5) until flowering (S-6), which agrees with other studies conducted at vineyards close by [26]. Despite this, the Botrytis incidence may endanger the fruit ripening as inoculum introduction can occur prior to these phenological stages [51]. Grey mould is able to infect vines at any stage [52], but flowering (S-6) may be more vulnerable since pollen release processes and sugary exudates present in flowers enhance the fungal colonization of vegetal tissues [53,54]. Some authors indicated that Botrytis conidia germination could occur at 13 °C [10], which explains the early infections that we detected during leaf development (S-1) at both vineyards in 2017. However, we detected that the highest Botrytis spore concentrations coincided with higher temperatures, around 20 °C and slightly rainy days, therefore within the optimal temperature range for infection development [45,55,56].
In our study area, the Erysiphe and Plasmopara infections were later than the Botrytis, between the end of flowering (S-6) and development of fruits (S-7). These results agree with findings by other authors [57,58,59]. Generally, powdery mildew requires relatively dry conditions and moderate temperatures, while downy mildew is greatly affected by wet conditions, either the presence of dew or rainfall [60]. According to [16], temperatures above 15 °C favour Erysiphe development and spread, with an optimal temperature of 20–27 °C. A certain humidity degree is enough for spore germination and excessive rainfall has an inhibitory effect [61,62,63]. This explains the higher Erysiphe incidence in dry seasons. We found lower Erysiphe airborne spore concentrations in the rainiest days, which is possibly related to the leaves surface free water detrimental effect on the fungus development [64]. Temperature also determines the Plasmopara maturation period duration, with an optimal temperature of 20–25 °C [17]. In our studied vineyards, we registered an important temperature increase that coincided with high relative humidity at the beginning of July in 2017 and 2018, which could explain the development of several primary and secondary Plasmopara infection cycles. For the analysed vineyards with the maximum downy mildew record levels (Cenlle and O Mato in 2018, and O Mato 2016) we observed that the Hydrothermal Index, which relates the mean temperature and rainfall (Tm.mm), ranged between 4151 Tm.mm and 4376 Tm.mm in Cenlle, approximated to high Plasmopara infection risk cited values [65].

4.2. Predictive Models

Models are powerful tools that can be applied to agricultural pest management and prevention by analyzing an organism’s reply to environmental conditions and by improving epidemiological studies to achieve considerable crop protection optimization [37]. Several predictive models that consider the environmental conditions influence on the spore release process have been developed for many important viticulture regions, but they cannot be applied to areas with different climatic characteristics [66]. The obtained models for the prediction of Botrytis, Erysiphe, and Plasmopara spore concentration showed accurate results, explaining high spore concentration variability.
Knowledge advancement concerning phytopathological fungi epidemiology has led to vineyard disease control improvement [67]. From this point of view, the local monitoring of airborne spores is a valuable element for the predictive model development of fungal propagation. This allows the application of the phytosanitary treatments when real infection risk is detected, which increases environmental protection, and provides added value for wine growers and food safety for consumers.

5. Conclusions

The combination of meteorological and aerobiological parameters is a useful forecast tool for fungal spore concentrations, therefore, for the identification of infection risk moments, providing a strategy that can be integrated into the management of these fungal vine diseases. The total Botrytis spore concentration was much higher than the other fungi; however, this was not the most problematic fungus in the considered wine-growing areas. Downy mildew, caused by Plasmopara, had a higher prevalence and crop damages, since the high humidity and moderate temperatures in the studied viticulture areas favour its development and high incidence; it is considered as one of the worst vine diseases for the considered wine-growing regions.

Author Contributions

Investigation, J.A.C.R.; Methodology, E.G.-F.; Writing-original draft, R.A.V.-R.; Writing–review & editing, M.F.-G. and M.J.A. All authors have read and agreed to the published version of the manuscript.

Funding

This research received no external funding.

Acknowledgments

The authors thank to the Xunta de Galicia (Consellería de Educación, Universidade e Formación Profesional) the financial support for the recognition as Grupo de Referencia Competitivo de Investigación (GRC GI–1809 BIOAPLIC, ED431C 2019/07), the Agrupación Estratégica de Investigación BioReDes (ED431E 2018/09), the CITACA Strategic Partnership ED431E 2018/07 (Xunta de Galicia, Spain) and the grant number AGL2014-60412-R of the Economy and Competence Ministry of Spain Government. González–Fernández E. is supported by the FPU Formación de Profesorado Universitario grant from Ministerio de Ciencia, Innovación y Universidades.

Conflicts of Interest

The authors declare no conflict of interest.

References

  1. Ciliberti, N.; Fermaud, M.; Roudet, J.; Languasco, L.; Rossi, V. Environmental effects on the production of Botrytis cinerea conidia on different media, grape bunch trash, and mature berries. Aust. J. Grape Wine Res. 2016, 22, 262–270. [Google Scholar] [CrossRef]
  2. Bois, B.; Zito, S.; Calonnec, A. Climate vs. grapevine pests and diseases worldwide: The first results of a global survey. OENO One 2017, 51, 133–139. [Google Scholar] [CrossRef]
  3. Boso, S.; Gago, P.; Santiago, J.L.; de la Fuente, M.; Martínez, M.C. Factors Affecting the Vineyard Populational Diversity of Plasmopara viticola. Plant Pathol. J. 2019, 35, 125–136. [Google Scholar]
  4. Martínez-Bracero, M.; Alcázar, P.; Velasco-Jiménez, M.J.; Galán, C. Fungal spores affecting vineyards in Montilla-Moriles southern Spain. Eur. J. Plant Pathol. 2019, 153, 1–13. [Google Scholar] [CrossRef]
  5. Hidalgo, L. Tratado de Viticultura General, 3rd ed.; Mundi–Prensa: Madrid, Spain, 2002; p. 983. [Google Scholar]
  6. Williamson, B.; Tudzynski, B.; Tudzynski, P.; Kan, J.A.L.V. Botrytis cinerea: The cause of grey mould disease. Mol. Plant Pathol. 2007, 8, 561–580. [Google Scholar] [CrossRef]
  7. Kassemeyer, H.H.; Berkelmann-Löhnertz, B. Fungi of grapes. In Biology of Microorganisms on Grapes, in Must and in Wine; Springer: Berlin/Heidelberg, Germany, 2009; pp. 61–87. [Google Scholar]
  8. Pszczolkowski, P.; Latorre, B.A.; Ceppi Di Lecco, C. Efectos de los mohos presentes en uvas cosechadas tardíamente sobre la calidad de los mostos y vinos Cabernet Sauvignon. Cienc. Investig. Agrar. 2001, 28, 157–163. [Google Scholar]
  9. Aleixandre, J.L.; Giner, J.F.; Aleixandre-Tudó, J.L. Evaluación del efecto terroir sobre la calidad de la uva y el vino (I). Enovinicultura 2013, 20, 1–11. [Google Scholar]
  10. Coertze, S.; Holz, G.; Sadie, A. Germination and establishment of infection on grape berries by single airborne conidia of Botrytis cinerea. Plant Dis. 2001, 85, 668–677. [Google Scholar] [CrossRef] [Green Version]
  11. Elmer, P.; Michailides, T. Epidemiology of Botrytis cinerea in Orchard and Vine Crops. In Botrytis: Biology, Pathology and Control; Springer: Dordrecht, The Netherlands, 2007; pp. 243–272. [Google Scholar]
  12. Evans, K.J. Overview of R&D for managing botrytis bunch rot in Australia. In Proceedings of the Australian Society of Viticulture and Oenology Seminar on Grapevine Pests and Disease “Breaking the mould—A Pest and Disease Update”, Mildura, Victoria, Australia, 22–25 July 2008; pp. 4–15. [Google Scholar]
  13. Dufour, M.C.; Lambert, C.; Bouscaut, J.; Mérillon, J.M.; Corio–Costet, M.F. Benzothiadiazole–primed defence responses and enhanced differential expression of defence genes in Vitis vinifera infected with biotrophic pathogens Erysiphe necator and Plasmopara viticola. Plant Pathol. 2013, 62, 370–382. [Google Scholar] [CrossRef]
  14. Grove, G.G.; Moyer, M. Podredumbre por Botrytis en la uva para Producción Comercial en Washington: Biología y Manejo de la Enfermedad; Washington State University FS046ES; Washington State University: Washington, DC, USA, 2015; pp. 1–5. [Google Scholar]
  15. Gadoury, D.; Seem, R.; Wilcox, W.; Henick-Kling, T.; Conterno, L.; Day, A.; Ficke, A. Effects of diffuse colonization of grape berries by Uncinula necator on bunch rots, berry microflora and juice and wine quality. Phytopathology 2007, 97, 1356–1365. [Google Scholar] [CrossRef] [Green Version]
  16. Oriolani, E.J.A.; Moschini, R.C.; Salas, S.; Martínez, M.I.; Banchero, S. Weather–based models for predicting grape powdery mildew (Uncinula necator (Schwein) Burrill) epidemics. Revista de la Facultad de Ciencias Agrarias Universidad Nacional de Cuyo 2015, 47, 197–211. [Google Scholar]
  17. Barrios, G.; Reyes, J. Modelización del mildiu en la vid. Phytoma 2004, 164, 1–9. [Google Scholar]
  18. Cambra, M.; Bernal, I. Plasmopara Viticola (Berk. y Curtis) Berl. & de Toni. Mildiu de la vid. Fichas de Diagnóstico en Laboratorio de Organismos Nocivos de los Vegetales. Ficha 64, 2nd ed.; MAPA: Madrid, Spain, 2006. [Google Scholar]
  19. Rossi, V.; Caffi, T. Effect of water on germination of Plasmopara viticola oospores. Plant Pathol. 2007, 56, 957–966. [Google Scholar] [CrossRef]
  20. Díaz, T.; Riquelme, A. Control Integrado en el cultivo de uva de mesa en la Región de Murcia. Phytoma 2012, 239, 48–54. [Google Scholar]
  21. Lucas, A. Control integrado de plagas y enfermedades en el viñedo. Dossier gestión integrada. Vida Rural, 4 December 2012, pp. 46–51.
  22. Merlet, H.; Navarro, A.; Rosales, J. Manual Técnico Productivo y Económico Vid. 2016, (Pub. CIREN N° 193). Available online: http://www.bibliotecadigital.ciren.cl/handle/123456789/26087 (accessed on 3 February 2020).
  23. González-Domínguez, E.; Caffi, T.; Ciliberti, N.; Rossi, V. A mechanistic model of Botrytis cinerea on grapevines that includes weather, vine growth stage, and the main infection pathways. PLoS ONE 2015, 10, e0140444. [Google Scholar]
  24. Porras, A. Mejora de la Tecnología de la Pulverización de Productos Fitosanitarios sobre Plantaciones de vid en Espaldera. Ph.D. Thesis, Universidad de Córdoba, Córdoba, Spain, 2006. [Google Scholar]
  25. Rojas, V.; Dennis, M. Nuevas Alternativas de Control Para el oídio de la vid (Uncinula Necator Schw.); Universidad de Chile, Fac. de CC. Agronomicas: Santiago, Chile, 2003; p. 58. [Google Scholar]
  26. Rodríguez-Rajo, F.J.; Jato, V.; Fernández-González, M.; Aira, M.J. The use of aerobiological methods for forecasting Botrytis spore concentrations in a vineyard. Grana 2010, 49, 56–65. [Google Scholar] [CrossRef] [Green Version]
  27. Arafat, K.H. Application of statistical model for forecasting powdery mildew of grapes under Egyptian conditions based on meteorological data. Int. J. Plant Pathol. 2015, 6, 48–57. [Google Scholar] [CrossRef] [Green Version]
  28. MAPAMA. Ministerio de Agricultura y Pesca, Alimentación y Medio Ambiente, Registro de Variedades Comerciales. 2017. Available online: www.mapama.gob.es (accessed on 3 February 2020).
  29. Lorenz, D.H.; Eichorn, K.W.; Bleiholder, H.; Klose, R.; Meier, U.; Weber, E. Phänologische Entwicklungsstadien der Weinrebe (Vitis vinifera L. ssp. vinifera). Codierung und Beschreibung nach der erweiterten BBCH–Skala. Vitic. Enol. Sci. 1994, 49, 66–70. [Google Scholar]
  30. Hirst, J.M. An automatic volumetric spore–trap. Ann. Appl. Biol. 1952, 36, 257–265. [Google Scholar] [CrossRef]
  31. Galán, C.; Cariñanos, P.; Alcázar, P.; Domínguez, E. Manual de Calidad y Gestión de la Red Española de Aerobiología; Servicio de Publicaciones, Universidad de Córdoba: Córdoba, Spain, 2007; p. 61. [Google Scholar]
  32. Galán, C.; Ariatti, A.; Bonini, M.; Clot, B.; Crouzy, B.; Dahl, A.; Fernandez-González, D.; Frenguelli, G.; Gehrig, R.; Isard, S.; et al. Recommended terminology for aerobiological studies. Aerobiologia 2017, 33, 293–295. [Google Scholar] [CrossRef]
  33. Gargallo, P.; García-Casarejos, N. Impactos ambientales y medidas de mitigación en el sector vitivinícola español. E3S Web of Conferences 50, 01029. In Proceedings of the XII Congreso Internacional Terroir, Zaragoza, Spain, 18–22 June 2018. [Google Scholar]
  34. Gautam, H.R.; Bhardwaj, M.L.; Robitash, K. Climate change and its impact on plant diseases. Curr. Sci. 2013, 105, 1685–1691. [Google Scholar]
  35. Casanova, J. Situación actual de la Viticultura Ecológica: Técnicas de producción de la uva y productos autorizados. Vida Rural 2003, 171, 41–45. [Google Scholar]
  36. Pérez-Sanz, R.; Manzano, Y.; Santiago, L.; de La Iglesia, G.; Campillo, C.; Alberte, L.; Miranda, J.S.; Juárez, I. Metodología para la Validación de Modelos de Desarrollo asociados al clima para el seguimiento del Mildiu, Oidio y Podredumbre Gris en Viñedos de Castilla y León. In Proceedings of the XXVIII Jornadas de Viticultura y Enología de la Tierra de Barros: Cultural Santa Ana, Centro Universitario, Almendralejo, Spain, 8–12 May 2006. [Google Scholar]
  37. Orlandini, S.; Magarey, R.D.; Park, E.W.; Sporleder, M.; Kroschel, J. Methods of agroclimatology: Modeling approaches for pests and diseases. In Agroclimatology: Linking Agriculture to Climate; Hatfield, J.L., Sivakumar, M.V.K., Prueger, J.H., Eds.; Agron. Monogr. 60; ASA, CSSA, and SSSA: Madison, WI, USA, 2017. [Google Scholar]
  38. Fernández-González, M.; Rodríguez-Rajo, F.J.; Jato, V.; Aira, M.J. Incidence of fungals in a vineyard of the denomination of origin Ribeiro (Ourense NW Spain). Ann. Agric. Environ. Med. 2009, 16, 263–271. [Google Scholar]
  39. Calonnec, A.; Cartolaro, P.; Naulin, J.M.; Bailey, D.; Langlais, M. A host–pathogen simulation model: Powdery mildew of grapevine. Plant Pathol. 2008, 57, 493–508. [Google Scholar] [CrossRef]
  40. Dugan, F.M.; Lupien, S.L.; Grove, G.G. Incidence, aggressiveness and in planta interactions of Botrytis cinerea and other filamentous fungi quiescent in grape berries and dormant buds in central Washington State. Phytopathology 2002, 150, 375–381. [Google Scholar] [CrossRef]
  41. Gessler, C.; Pertot, I.; Perazzolli, M. Plasmopara viticola: A review of knowledge on downy mildew of grapevine and effective disease management. Phytopathol. Mediterr. 2011, 50, 3–44. [Google Scholar]
  42. Galet, P. Précis de Viticulture, 7th ed.; Imp. JF: Montpellier, France, 2000. [Google Scholar]
  43. Boso, S.; Santiago, J.L.; Villaverde-Alonso, V.; Gago, P.; Martínez, M.C.; Rodríguez, E. Evaluación de la incidencia a enfermedades fúngicas en diferentes clones del cv. Albariño (Vitis vinifera L.). Phytoma 2009, 210, 1–5. [Google Scholar]
  44. Díaz, M.R.; Iglesias, I.; Jato, M.V. Airborne concentrations of Botrytis, Uncinula and Plasmopara spores in a vineyard in Leiro-Ourense (N.W. Spain). Aerobiologia 1997, 13, 31–35. [Google Scholar] [CrossRef]
  45. Díaz, M.R.; Iglesias, I.; Jato, M.V. Seasonal variation of airborne fungal spore concentrations in a vineyard of North-West Spain. Aerobiologia 1998, 14, 221–227. [Google Scholar] [CrossRef]
  46. Oliveira, M.; Guerner-Moreira, J.; Mesquita, M.M.; Abreu, I. Important phytopathogenic airborne fungal spores in a rural area: Incidence of Botrytis cinerea and Oidium spp. Ann. Agric. Environ. Med. 2009, 16, 197–204. [Google Scholar]
  47. Rodríguez-Rajo, F.J.; Seijo Coello, M.C.; Jato, V. Estudio de los niveles de los principales fitopatógenos para la optimización de cosechas de Vitis vinifera en Valdeorras Ourense (1998). Botanica Complutensis 2002, 26, 121–135. [Google Scholar]
  48. Fernández-González, M.; Rodríguez Rajo, F.J.; Jato, V.; Aira, M.J.; Ribeiro, H.; Oliveira, M.; Abreu, I. Forecasting ARIMA models for atmospheric vineyard pathogens in Galicia and Northern Portugal: Botrytis cinerea spores. Ann. Agric. Environ. Med. 2012, 19, 255–262. [Google Scholar] [PubMed]
  49. Martínez, C.; Boso, S. Evaluación de la Virulencia de Distintas Poblaciones de Hongos Responsables del Mildiu, oídio y Botrytis en Distintas Denominaciones de Origen Gallegas; Grupo de Viticultura de la MBG–CSIC: Pontevedra, Spain, 2015. [Google Scholar]
  50. Cortiñas, J.A.; Aira, M.J.; Fernández–González, M.; Rodríguez-Rajo, F.J.; Vázquez–Ruiz, R.A. Potential sustainable wine–growing model in the Ribeira Sacra D.O. (NW Spain). Cienc. Tec. Vitivinic. 2018, 33, 114–145. [Google Scholar]
  51. Latorre, B.A.; Rioja, M.E. Efecto de la temperatura y humedad relativa sobre la germinación de conidias de Botrytis cinerea. Cien. Inv. Agric. 2001, 29, 67–72. [Google Scholar]
  52. Molitor, D.; Baus, O.; Hoffmann, L.; Beyer, M. Meteorological conditions determine the thermal-temporal position of the annual Botrytis bunch rot epidemic on Vitis vinifera L. cv. Riesling grapes. OENO One 2016, 50, 231–234. [Google Scholar] [CrossRef] [Green Version]
  53. Keller, M.; Viret, O.; Cole, M. Botrytis cinerea infection in grape flowers: Defense reaction, latency and disease expression. Phytopathology 2003, 93, 316–322. [Google Scholar] [CrossRef] [Green Version]
  54. Viret, O.; Keller, M.; Jaudzems, V.G.; Cole, F.M. Botrytis cinerea infection of grape flowers: Light and electron microscopical studies of infection sites. Phytopathology 2004, 94, 850–857. [Google Scholar] [CrossRef] [Green Version]
  55. Latorre, B.A.; Rioja, M.E.; Lillo, C. Efecto de la temperatura en el desarrollo de la infección producida por Botrytis cinerea en flores y bayas de uva de mesa. Cien. Inv. Agric. 2002, 29, 145–151. [Google Scholar] [CrossRef]
  56. Ciliberti, N.; Fermaud, M.; Languasco, L.; Rossi, V. Influence of fungal strain, temperature, and wetness duration on infection of grapevine inflorescences and young berry clusters by Botrytis cinerea. Phytopathology 2015, 105, 325–333. [Google Scholar] [CrossRef]
  57. Calonnec, A.; Cartolaro, P.; Poupot, C.; Dubourdieu, D.; Darriet, P. Effects of Uncinula necator on the yield and quality of grapes (Vitis vinifera) and wine. Plant Pathol. 2004, 53, 434–445. [Google Scholar] [CrossRef]
  58. Campbell, P.; Bendek, C.; Latorre, B.A. Risk of powdery mildew (Erysiphe necator) outbreaks on grapevines in relation to cluster development. Cien. Inv. Agric. 2007, 34, 5–11. [Google Scholar] [CrossRef]
  59. Fernández-González, M.; Piña–Rey, A.; González–Fernández, E.; Aira, M.J.; Rodríguez-Rajo, F.J. First assessment of Goidanich Index and aerobiological data for Plasmopara viticola infection risk management in north-west Spain. J. Agric. Sci. 2019, 157, 129–139. [Google Scholar] [CrossRef]
  60. Thind, T.S.; Arora, J.K.; Mohan, C.; Raj, P. Epidemiology of powdery mildew, downy mildew and anthracnose diseases of grapevine. In Diseases of Fruits and Vegetables Volume I; Springer: Dordrecht, The Netherlands, 2004; pp. 621–638. [Google Scholar]
  61. Chellemi, D.O.; Marois, J.J. Effect of fungicides and water on sporulation of Uncinula necator. Plant Dis. 1991, 75, 455–457. [Google Scholar] [CrossRef]
  62. Sivapalan, A. Effects of impacting rain drops on the growth and development of powdery mildew fungi. Plant Pathol. 1993, 42, 256–263. [Google Scholar] [CrossRef]
  63. Jarvis, W.R.; Gubler, W.D.; Grove, G.G. Epidemiology of Powdery Mildews in Agricultural Pathosystems. In The Powdery Mildews: A Comprehensive Treatise; Bélanger, R.R., Bushnell, W.R., Dik, A.J., Carver, T.L.W., Eds.; American Phytopathological Society, APS Press: St. Paul, MN, USA, 2002; pp. 169–199. [Google Scholar]
  64. Campbell, P. Efecto de Factores Ambientales y Métodos de Control Sobre la Germinación y Desarrollo de Uncinula necator en Vitis vinifera. Master’s Thesis, Facultad de Agronomía e Ingeniería Forestal, Universidad Católica de Chile, Santiago, Chile, 2003. [Google Scholar]
  65. Almendro, J.P. Índices climáticos propios de la vid en el sector central de tierra de barros. In Actas de las IV Jornadas de Historia de Almendralejo y Tierra de Barros; Asociación Histórica de Almendralejo: Almendralejo, Spain, 2013; pp. 121–131. [Google Scholar]
  66. Thiessen, L.D.; Thiessen, L.; Neill, T.M.; Mahaffee, W.F. Assessment of Erysiphe necator ascospore release models for use in the Mediterranean climate of Western Oregon. Plant Dis. 2018, 102, 1500–1508. [Google Scholar] [CrossRef] [Green Version]
  67. Magarey, P.A.; Magarey, R.D.; Emmett, R.W. Principles for managing the foliage diseases of grapevine with low input of pesticides. In Proceedings of the 6th International Congress on Organic Viticulture, Basel, Switzerland, 25–26 August 2000; p. 140. [Google Scholar]
Figure 1. Location of the Ribeiro (Cenlle) and Ribeira Sacra (O Mato) Designation Origin areas in the Northwestern Spain.
Agronomy 10 00219 g001
Figure 2. Phenology, spore concentrations, and phytosanitary treatments applied in the three study years for Ribeiro (Cenlle) and Ribeira Sacra (O Mato) vineyards.
Agronomy 10 00219 g002
Figure 3. Graphical representation of the Principal Components Analysis (PCA). a: PC2 vs. PC3 in Cenlle, b: PC1 vs. PC3 in o Mato.
Agronomy 10 00219 g003
Figure 4. Observed and predicted Botrytis, Erysiphe, and Plasmopara spore concentrations during the 2016−2018 period, in both vineyards (Cenlle and O Mato).
Agronomy 10 00219 g004
Table 1. Meteorological parameters, maximum temperature, minimum temperature, average temperature, average relative humidity, sunshine, wind speed and rainfall, in the study area (2016–2018).
RibeiroRibeira Sacra
Year201620172018201620172018
Annual Average Meteorological DataMax T (°C)22.823.923.720.621.921.4
Min T (°C)7.36.48.26.76.17.3
Mean T (°C)13.813.915.212.813.113.7
Mean RH (%)78.475.875.980.976.978.6
Sunshine (hours)5.35.94.98.18.48.4
Wind-Speed (Km/h)2.11.82.22.11.82.5
Annual TotalRainfall (L/m2)1211.8814.5775.2940.4616.2660.5
MaximumDaily rainfall (l/m2)49.0100.839.442.877.525.7
Date10 Jan10 Dec28 Feb10 Jan10 Dec11 Mar
Maximum temperature (Max T), minimum temperature (Min T), average temperature (Mean T), average relative humidity (Mean RH).
Table 2. Number of phytosanitary treatments applied in the studied plots.
Against S0S1S5S6S7S8
BotrytisCenlle 2016 12
Cenlle 2017 11
Cenlle 2018 221
O Mato 2016
O Mato 2017
O Mato 2018
Mildew + OidiumCenlle 2016 222
Cenlle 2017 2131
Cenlle 2018 11112
O Mato 2016 121
O Mato 2017
O Mato 2018 212
MildewCenlle 2016 1
Cenlle 2017 2
Cenlle 2018 22
O Mato 2016 2 2
O Mato 2017
O Mato 201811 2
Phenological stages: Bud development (S0), Leaf development(S1), Inflorescence emerge (S5), Flowering (S6), Development of fruits (S7) and Ripening of berries (S8).
Table 3. SSIn data, daily maximum spore concentration and maximum date for Botrytis, Erysiphe, and Plasmopara in Ribeiro (Cenlle) and Ribeira Sacra (O Mato) DOs during the study period (spores/m3 of air).
CenlleBotrytisErysiphePlasmopara
Study Period19 September 2016 to 18 September 2016
SSIn16,80617,2691910
Daily Maximum637399104
Maximum Date22 June16 May8 June
Study Period16 March 2017 to 30 August 2017
SSIn15,3783344679
Daily Maximum69642354
Maximum Date28 May 201726 May 20178 May 2017
Study Period29 March 2018 to 10 September 2018
SSIn24,21431163605
Daily maximum1210316460
Maximum date7 July 20184 June 20187 July 2018
O Mato
Study period24 March 2016 to 30 September 2016
SSIn27,65612,9463618
Daily Maximum1435597502
Maximum Date27 May 20163 June 20167 July 2016
Study Period04 March 2017 to 08 September 2017
SSIn17,24016861363
Daily Maximum82610845
Maximum Date4 June 201719 June 20173 June 2017
Study Period07 April 2018 to 07 September 2018
SSIn49,62056325656
Daily Maximum1547197345
Maximum date9 June 201829 May 201822 July 2018
SSIn—Seasonal Spore Integral.
Table 4. Spearman’s rank correlation of different parameters for the studied cultivars. Spore concentrations (Botrytis, Erysiphe and Plasmopara) and the main meteorological parameters. (plevel: * < 0.05; ** < 0.01; N.S.: not significative).
201620172018
CenlleBotrytisErysiphePlasmoparaBotrytisErysiphePlasmoparaBotrytisErysiphePlasmopara
Rainfall−0.167 *
Botrytis
−0.365 *
Erysiphe-7
0.355 *
Plasmopara-2
0.401 **
Botrytis-4
0.196 *
Erysiphe-7
0.172 *
Plasmopara-4
−0.190 *
Botrytis-1
N.S.−0.255 **
Plasmopara
RH0.382 *
Botrytis-2
−0.321 *
Erysiphe-2
0.342 *
Plamopara-2
0.507 **
Botrytis-4
0.248 **
Erysiphe-5
N.S.0.263 **
Botrytis-5
0.203 **
Erysiphe−7
N.S.
T max0.288 **
Botrytis
0.440 **
Erysiphe-2
−0.335 *
Plasmopara-2
−0.228 **
Botrytis-4
−0.180 *
Erysiphe-7
−0.300**
Plasmopara-6
0.387 **
Botrytis
N.S.0.387 **
Plasmopara
T min0.323 **
Botrytis
−0.674 *
Erysiphe-2
0.346 *
Plasmopara-2
N.S.N.S.−0.411 **
Plasmopara-7
0.634 **
Botrytis-1
0.197 *
Erysiphe
0.489 **
Plasmopara
T mean0.307 **
Botrytis
−0.666 **
Erysiphe-2
N.S.−0.188 *
Botrytis-4
−0.154 *
Erysiphe-5
−0.362 **
Plasmopara-6
0.556 **
Botrytis
N.S.0.480 **
Plasmopara
O Mato
Rainfall0.365 **
Botrytis-5
0.394 **
Erysiphe-6
0.227 **
Plasmopara-6
N.S.−0.272 **
Erysiphe-2
N.S.0.224 **
Botrytis-6
0.231 **
Erysiphe-7
N.S.
RH0.593 **
Botrytis-2
0.491**
Erysiphe-6
0.377**
Plamopara-2
0.224 **
Botrytis-3
−0.354 **
Erysiphe-2
0.163 *
Plasmopara-4
0.373 **
B otrytis-7
0.359 **
Erysiphe-6
N.S.
T max−0.386 **
Botrytis-7
−0.476 **
Erysiphe-7
−0.309 **
Plasmopara-7
N.S.0.483 **
Erysiphe
0.186 *
Plasmopara
N.S.−0.297 **
Erysiphe-6
N.S.
T min−0.153 *
Botrytis-7
−0.231 **
Erysiphe-6
−0.177*
Plasmopara-7
0.248 **
Botrytis
0.509 **
Erysiphe
0.209 **
Plasmopara
0.331 **
Botrytis
N.S.N.S.
T mean−0.367 **
Botrytis-7
−0.439 **
Erysiphe-7
−0.332 **
Plasmopara-7
0.224 **
Botrytis
0.582 **
Erysiphe
0.218 **
Plasmopara
0.169 *
Botrytis
−0.251 **
Erysiphe-6
N.S.
The Principal Component Analysis (PCA) resulted in the extraction of three Principal Components (PC) for both Cenlle and O Mato vineyards. The accumulated explained variance of the original data in Cenlle was 70.9% and 67.6% in O Mato (Table 5).
Table 5. Principal Component Analysis, principal component one, principal component two and principal component three. Confidence interval 95% (p < 0.05).
CENLLEO MATO
Principal ComponentsPC1PC2PC3PC1PC2PC3
Self-value3.2981.9561.1353.1841.8071.098
Variance (%)36.64021.72912.61035.37620.08712.207
Accumulated percentage36.64058.36970.98035.37655.46367.671
Botrytis−0.0030.2270.8460.1960.4140.624
Erysiphe0.012−0.0010.504−0.0650.0110.723
Plasmopara−0.0080.0760.8090.088−0.1090.650
Max T−0.8000.5120.0150.796−0.518−0.043
Min T−0.1580.8260.2320.8480.0470.137
Mean T−0.6430.7190.1350.901−0.3810.047
RH0.937−0.0370.149−0.1850.8810.186
Rainfall0.8050.152−0.082−0.0370.817−0.137
Wind speed−0.132−0.697−0.018−0.612−0.075−0.024
Principal Component Analysis (PCA), principal component one (PC1), principal component two (PC2) and principal component three (PC3).
Table 6. Botrytis, Erysiphe, and Plasmopara spore concentrations regression models.
CenlleBetaBStd. Error Btp <
BotrytisR = 0.843R2 = 0.710Adjusted R2 = 0.709
Intercepted −197.80042.778−4.6240.000
Botrytis-10.7680.7680.02728.0680.000
T mean0.1243.6500.8884.1110.000
RH-30.1442.2470.4684.8000.000
ErysipheR = 0.782R2 = 0.611Adjusted R2 = 0.610
Intercepted 10.0382.5283.9710.000
Erysiphe-10.7820.7820.02828.1990.000
PlasmoparaR = 0.633R2 = 0.401Adjusted R2 = 0.399
Intercepted 12.0163.8713.1050.000
Plasmopara-10.6200.6200.03517.8510.000
Wind Speed-1−0.071−3.2781.609−2.0370.042
O Mato
BotrytisR = 0.722R2 = 0.596Adjusted R2 = 0.594
Intercepted −136.19963.573−2.1420.033
Botrytis-10.7340.8270.03523.5870.009
RH-30.0822.3610.8952.6370.000
ErysipheR = 0.760R2 = 0.578Adjusted R2 = 0.576
Intercepted −54.39117.578−3.0940.002
Erysiphe-10.7370.7370.02925.3460.000
RH-30.1070.8850.2403.6800.000
PlasmoparaR = 0.480R2 = 0.560Adjusted R2 = 0.558
Intercepted −24.08512.483−1.9290.054
Plasmopara-10.7420.7420.02925.2820.000
RH-10.0700.4020.1702.3700.018
The Beta coefficient is the standardized regression coefficient (all variables standardized to a mean of 0 and a standard deviation of 10). The B coefficient is the unstandardized regression coefficient and S.E. B is its standard error, t value measures the relationship between the coefficient and its standard error, and p value is a probability that measures the evidence against the null hypothesis.

