Article

Investigating the Proper Application Rate of Nitrogen under Mulched Drip Irrigation to Improve the Yield and Quality of Tomato in Saline Soil

1
College of Water Resources and Architectural Engineering, Shihezi University, Shihezi 832000, China
2
Key Laboratory of Modern Water-Saving Irrigation of Xinjiang Production and Construction Corps, Shihezi University, Shihezi 832000, China
3
State Key Laboratory of Hydraulics and Mountain River Engineering, College of Water Resource and Hydropower, Sichuan University, Chengdu 610065, China
*
Authors to whom correspondence should be addressed.
Submission received: 17 January 2020 / Revised: 13 February 2020 / Accepted: 15 February 2020 / Published: 19 February 2020
(This article belongs to the Section Water Use and Irrigation)

Abstract

:
Xinjiang is one of the most prolific tomato-planting areas in China. Here, we carried out a two-year (2017–2018) field experiment in Xinjiang to study the effects of different nitrogen (N) application rates on the spatial distribution of water and salt in the root zone, as well as their impacts on the yield and quality of tomatoes under mulched drip irrigation. The ideal ranges of N application rates for tomato yield and quality were examined under different salinity levels. Results indicated that soil water content and salinity increased with soil depth. Soil water content was closely related to soil salinity but not to N. Among the tested application rates, tomato yield was highest under the medium-high N (225–300 kg/ha) and low salt (4 g/kg) treatment. Under the highest salt level (10 g/kg), the low nitrogen treatment (150 kg/ha) was better than the high N treatment (300 kg/ha) at boosting tomato yield. Moreover, we found that salinity had a stronger effect on tomato quality than N. Based on these results, we were able to recommend ideal ranges for N (155–201 kg/ha) and salt (3.56–5.59 g/kg) while both are present in the soil.

1. Introduction

China has become one of the world’s largest producers and exporters of processing tomatoes. The commercial-scale processing tomato industry has become an important means for Chinese farmers to increase their incomes, and, thus, its promotion is a priority [1]. Due to its abundant sunshine, small amounts of rainfall and considerable evaporation, large daily temperature range, and high effective accumulated temperature, Xinjiang has a favorable climate for the accumulation of nutrients and dry matter in processing tomatoes. As a result, it has become China’s largest processing tomato production area.
However, one-third of the irrigated land in Xinjiang is affected by salinization [2]. Xinjiang has 1.1 × 10⁷ ha of saline-alkali wasteland, including 7.27 × 10⁶ ha of excessively salinized saline-alkali wasteland [3], since its arid climate aggravates the formation of land salinization [4]. Salinization seriously threatens food security in regions around the world, and it has hindered the development of sustainable agriculture in Xinjiang [5]. Salt-alkali stress can cause extravasation of plant cell contents, resulting in osmotic stress, while harmful ion accumulation can trigger ion toxicity, inhibit the absorption of nutrients by crops, and causes nutrient imbalance and oxidative damage [6]. For salt-tolerant crops, salt-alkali stress also causes chlorophyll degradation, nucleic acid fragmentation, and protein denaturation in plants, all of which can cause cell death [7]. Many studies have shown that, although saline soils are traditionally defined as unsuitable soils for crop growth, effective measures such as furrow irrigation, selection of salt-tolerant crops, and artificial discharge of groundwater can successfully mitigate the harm to crop growth caused by saline soils [8,9,10,11,12]. However, these measures are challenging to implement effectively in Xinjiang due to the water scarcity in the region.
The technique of drip irrigation under mulch has emerged as a promising method to evenly distribute irrigation water in the soil, accurately control the amount of water delivered to plants, reduce water evaporation and deep leakage, and effectively minimize the impact of salinization [13,14,15]. The area in Xinjiang that uses this approach has expanded from 50,000 ha in the early 20th century to 2 million ha in 2014 [16]. Under drip irrigation, tomatoes can grow well on salinized land [17,18], and the yield can be elevated to 120–135 t/ha, which is ~50% higher than under furrow irrigations [10].
Nitrogen availability has a significant impact on crop growth, yield, and quality [19,20]. However, the absorption of nitrogen by crops is heavily influenced by site-specific conditions. Drip irrigation has a leaching effect on the salt present in the root zone, which can create a good water and salt environment for the root system [21]. Previous studies have examined salt and nitrogen, but most of them have focused on water-salt movement [22] or water-nitrogen coupling.
Many researchers have studied the quality of tomatoes and emphasized the importance of fruit flavor in determining tomato quality [23,24,25,26,27]. The soluble solids metric includes multiple quality indicators of fruit, such as soluble sugars, organic acids, and pectin. It has been established as an important indicator of the flavor of tomato fruit [28,29], with flavor improved by increasing the content of soluble solids [30]. The ratio of sugar to acid (SAR) is a fruit flavor index that reflects the proportions of soluble sugar and titratable acid. However, little research has been published with regard to the coupled effects of salinity and nitrogen on the yield and quality of tomatoes.
Therefore, the objectives of this study are to (1) explore the distribution characteristics of soil water and salt in the root zone of tomatoes for processing under different combinations of salt and nitrogen levels; (2) examine the influence of different levels of salt and nitrogen on the yield and quality of tomatoes; and (3) provide the proper range of nitrogen application under different soil salinity levels to improve tomato yield and quality under mulched drip irrigation in the saline soil in Xinjiang.

2. Materials and Methods

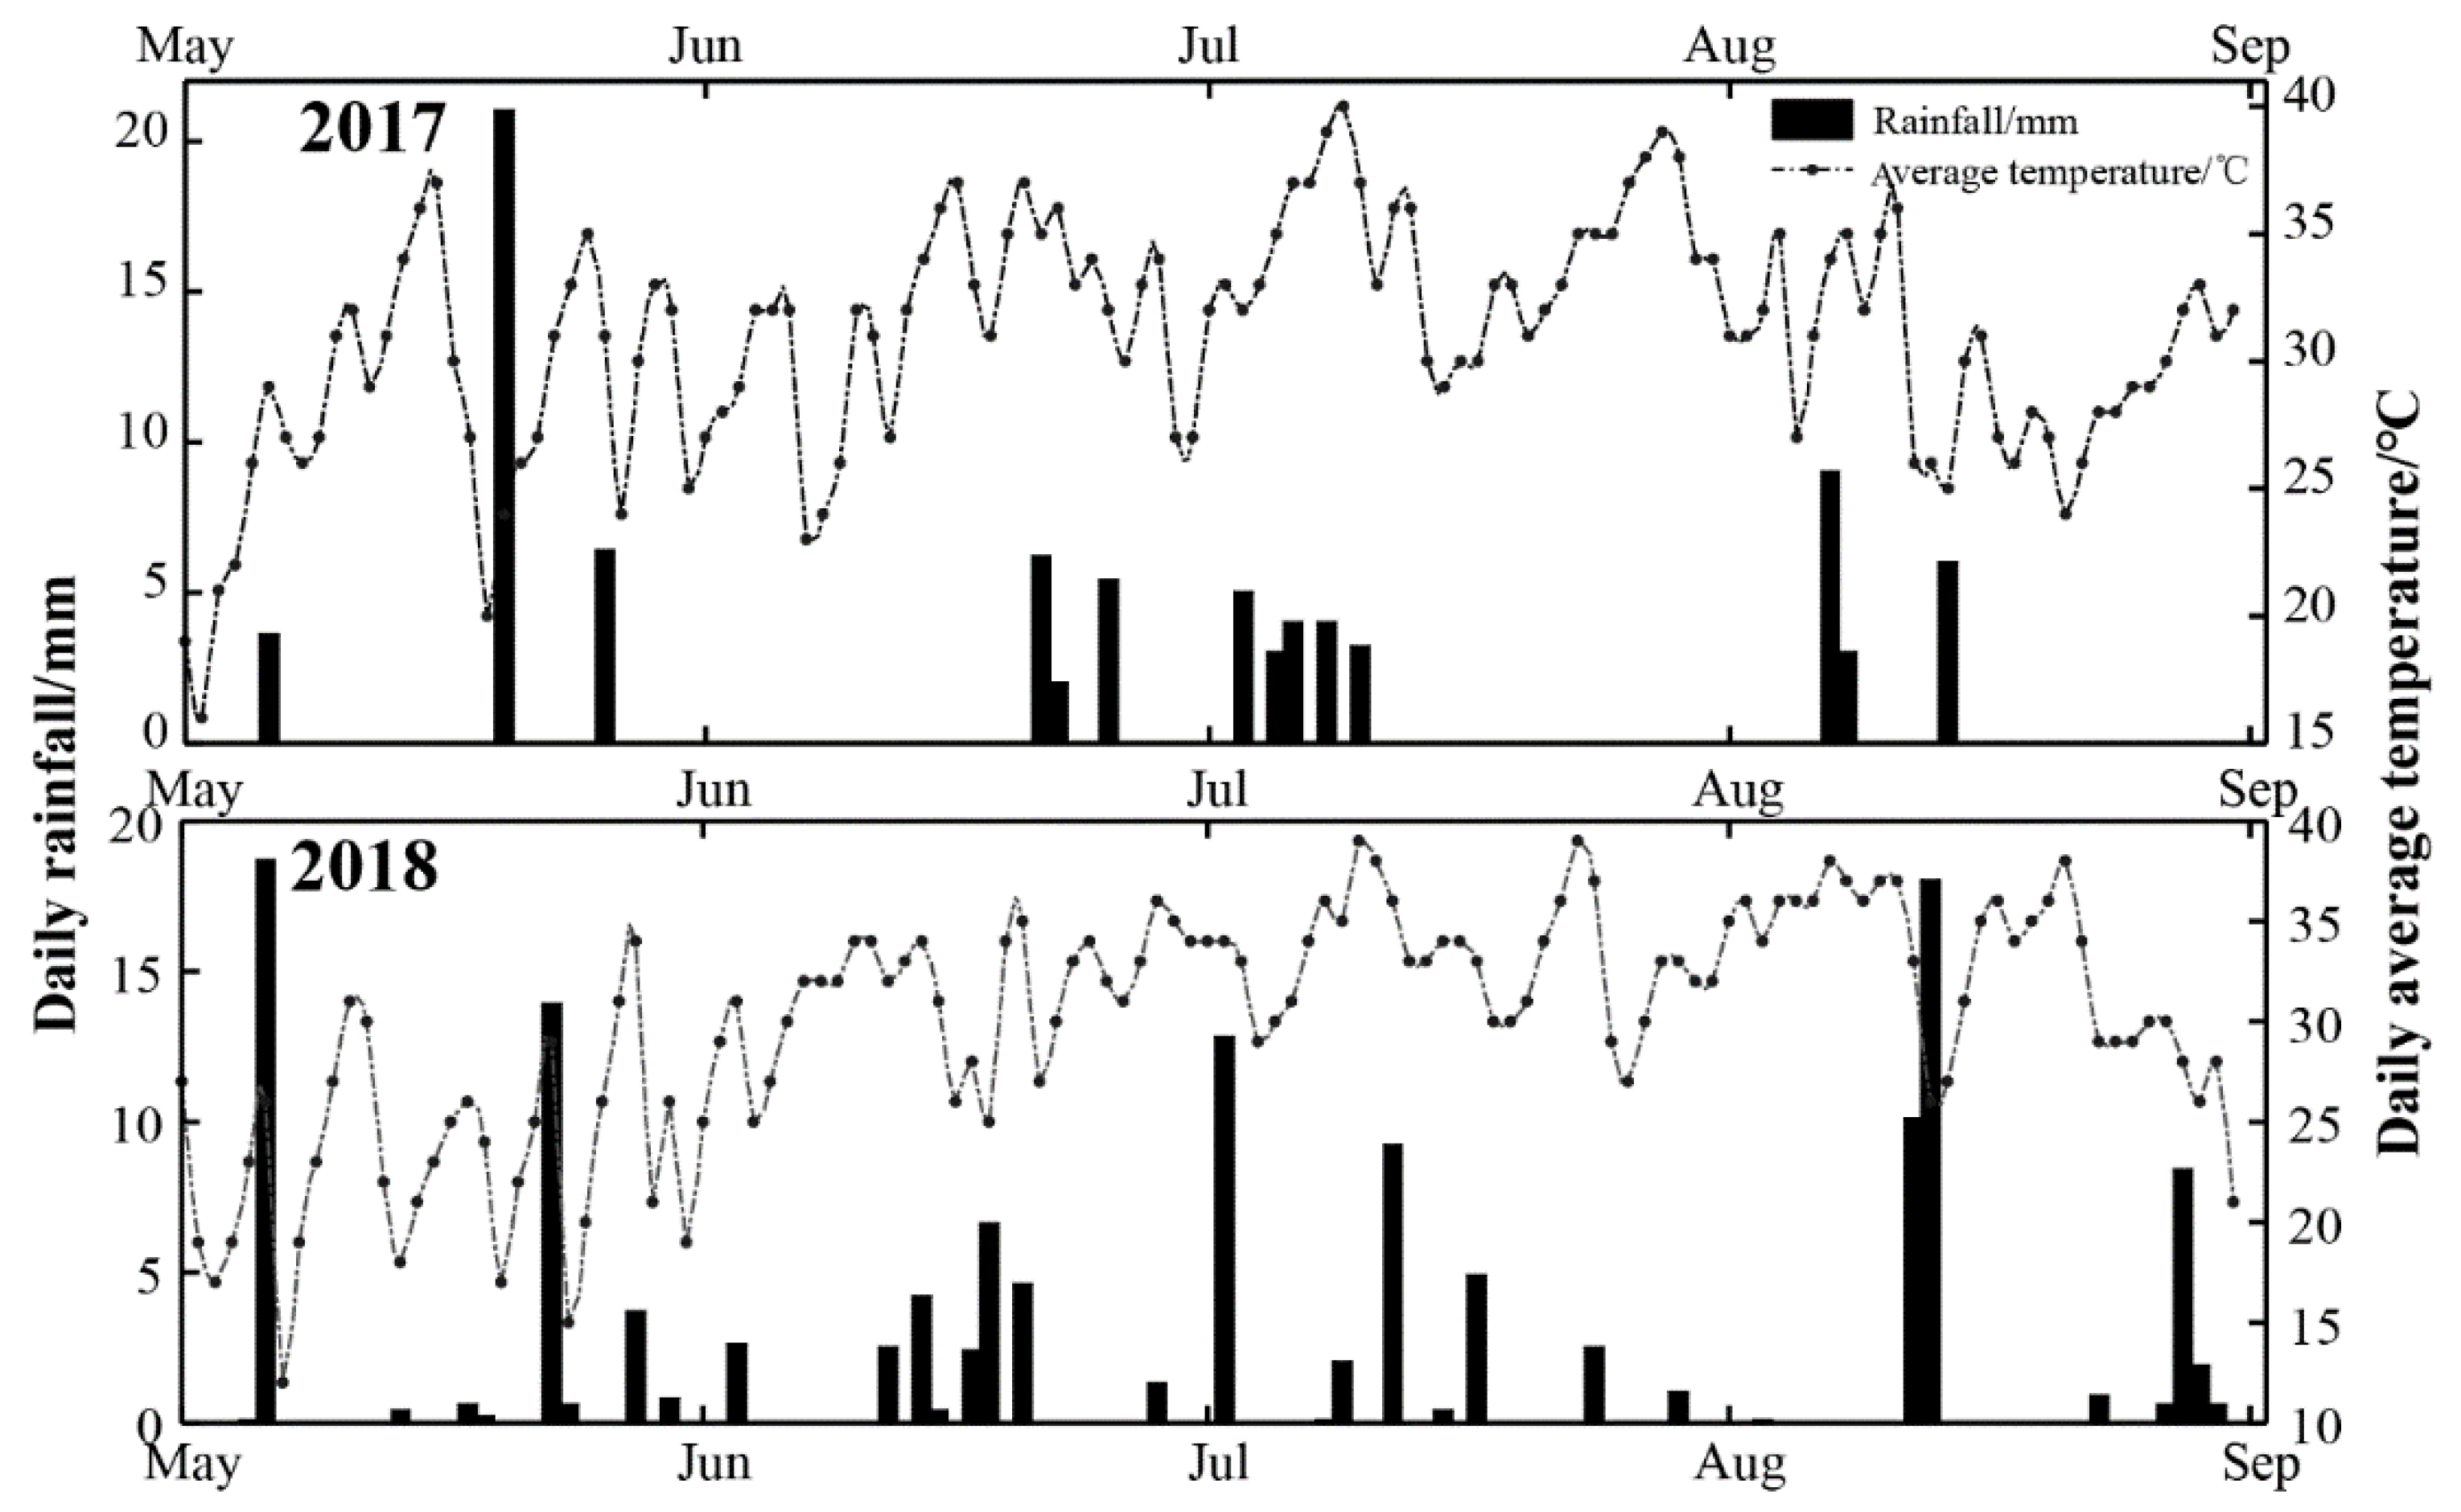
2.1. Experimental Site

This experiment was conducted in April to September of 2017 and 2018 at the Key Laboratory of Modern Water-Saving Irrigation of the Xinjiang Production and Construction Corps, which is located in the northern foothills of the Tianshan Mountains in northwest China (44°18′ N, 85°56′ E, 412 m a.s.l.). The study region has an arid continental climate with an average annual sunshine duration of 2865 h. The total rainfall and average temperature during the crop-growing season (May–August) were, respectively, 81.8 mm and 30.9 °C in 2017 and 137.1 mm and 30.0 °C in 2018 (Figure 1).

2.2. Experimental Design

This study focused on the main variety of processing tomato in Shihezi, Xinjiang, called “Jinfan 3166” (Xinjiang Jinzhong Nongle Agricultural Technology Development Co., Ltd., Shihezi, China), one type of determinate cultivars. Tomato plants were grown in test pots, each of which was 0.60 × 0.55 × 0.45 m (depth × top inner diameter × bottom inner diameter). Three plants were planted in each pot, with a plant spacing of 30 cm, and each pot was covered with plastic film. The bottom of each pot was perforated. Each pot was placed in a 50 cm deep excavated test pit. The distance between neighboring pots was 0.20 m.
Saline soil samples were taken from the saline-alkali land of the 121st regiment in Shihezi, Xinjiang, i.e., the local farmland for cultivating processing tomato. The average salt content of this soil was 24.84 g/kg, and the soil salinity was categorized as saline soil, rich in chloride sulfate. Another set of samples was collected from the Key Laboratory of Modern Water-Saving Irrigation of the Xinjiang Production and Construction Corps, which had an average salt content of 1.15 g/kg, a normal soil salinity, and loamy texture. The dry bulk density of the soil was determined by the cutting ring method. Selected physical and chemical properties are shown in Table 1.
To represent different salinity levels of the saline soil in Xinjiang, the two sets of soil were mixed in proportion to cresate four salt gradients in 2017: 1.5, 4, 7, and 10 g/kg, which represented normal soil (CK), light (S1), medium (S2), and severe saline-alkali soil (S3), respectively. In 2018, the four salt gradients were modified slightly to 1.5, 4, 5, and 7 g/kg (CK, S1, SS2, and SS3, respectively). Each pot was filled with the mixed soil and compacted to approximate the local farmland soil condition as much as possible.
To explore the proper range of nitrogen application in saline soils to promote the yield and quality of processing tomato, in 2017, four treatments were selected for nitrogen: 375 kg/ha (N1), 300 kg/ha (N2), 225 kg/ha (N3), and 150 kg/ha (N4). In order to facilitate the analysis and calculation, and improve the accuracy of the results, in the following analysis, the amount of nitrogen applied is converted into a single pot of nitrogen application: N1: 8.92 g/pot, N2: 7.12 g/pot, N3: 5.35 g/pot, N4: 3.57 g/pot. A zero-nitrogen control treatment (N0) was added to the test design in 2018.
The fertilizer treatments were based on [31] and the agronomic recommendations of the local seed-breeding institution: 225 kg/ha of nitrogen during the growth period, and 225 kg/ha of monoammonium phosphate and potassium chloride. An irrigation total of 450 mm per year was delivered to each pot, which was based on [11] and the local production practices of Shihezi. Medical infusion tubing was used to simulate drip-irrigation lines, and the irrigation volume delivered to each pot was precisely controlled. The dripper flow rate was 1.8 L/h, and the irrigation water salinity was 0.78 g/L (i.e., a typical value of that used in local farming practice). The whole growth period included nine irrigations and eight applications of fertilizer (delivered with water). Specific experimental design parameters are shown in Table 2.

2.3. Field Measurements

2.3.1. Soil Water Storage

A soil drill (JC-802B; manufactured by Juchuang Co., Ltd., Qingdao, China) was used to collect soil samples from which soil moisture content was determined at depths of 0, 10, 20, 30, and 40 cm at two and seven days after each irrigation.

2.3.2. Soil Salinity

After the soil moisture content was measured, each soil sample was air-dried and passed through a 1 mm sieve. Exactly 20 g were transferred into the Erlenmeyer flask, 100 mL of distilled water were added, and the flask was shaken for 10 min using an agitator. The flask was rest for 15 min and then filtered. The conductivity of the solution, which had a water:soil mass ratio of 5:1, was measured with a digital conductivity meter (DDS11-A; manufactured by Shengci Co., Ltd., Shanghai, China), and the calibration relationship between soil salinity and conductivity was determined by the dry residue method:
S = 0.0019 E C 0.344 ( R 2 = 0.9 )
where S is the soil salt content (g/kg), and EC is the electrical conductivity value (µS/cm).
The change in soil salinity (ΔS; g/kg) and the rate of change of soil salinity (Rate; %) were calculated according to the salt balance principle:
Δ S = S b S a
R a t e = Δ S / S a × 100 %
where Sa is the soil salinity before the growth period (g/kg), and Sb is the soil salinity at the end of the growth period (g/kg).

2.3.3. Fresh Fruit Yield and Quality

After reaching maturity, the processing tomatoes were harvested by hand, and the total yield of a single pot and the average weight of a single fruit were determined.
For this study, measurements of soluble solids and SAR were used as quality indicators. Because fresh fruit yield, soluble solids, and SAR are difficult to maximize at the same time, have different units, and cannot be directly analyzed and compared, these data were first normalized and then analyzed to determine their relationship with nitrogen application and soil salt content. The optimal nitrogen application and soil salinity range were extrapolated for tomato fresh fruit yield and quality.
The quality of the fruit was quantified with five indicators: total soluble solids (TSS), vitamin C content, total soluble sugar content (SSC), titratable acid (TA), and SAR. The TSS values were measured with a hand-held refractometer (RHBO-90; manufactured by LINK Co., Ltd., Taiwan), and vitamin C content was determined by spectrophotometry (manufactured by Thermo Fisher Scientific Inc., Waltham, MA, USA) according to [32]. The TA amount was determined by acid-base titration. The SAR was obtained by dividing soluble sugar by titratable acid. The SSC was calculated from direct titration (Lane–Eynon method) by the formula:
S S C = T × V 1 × V 2 W × V 3 × N × 100 %
where T is the equivalent amount of reducing sugar of the Fehling’s solution (mg/mL); V1 is the volume of the Fehling’s solution mixture of A and B (mL); V2 is the volume of the leaching solution (mL); and V3 is volume of the sugar liquid used for the titration (mL); and W is the total mass of the sample (mg), N is dilution multiple during conversion.

2.4. Statistics

The IBM SPSS Statistics software (IBM Co., Armonk, NY, USA) was used to perform the two-way analysis of variance (ANOVA). Post-hoc multiple comparisons were performed using the Duncan test to determine the significance of differences between treatments (α = 0.05). The yield and quality measurements were normalized to a range of 0 to 1 according to:
x * = x m i n m a x m i n
where x* is the normalized value, x is the value to be normalized, min is the minimum value of the sample data, and max is the maximum value of the sample data.

3. Results and Discussion

After the first year of experimental study (2017), it was found that 10 g/kg of soil salt content seriously inhibited the growth physiological index, yield, and quality of the processing tomatoes. In order to determine the manageable range of soil salt content for processing tomato cultivation, the 10 g/kg treatment was removed from the experimental design of 2018, and a 5 g/kg treatment was added. At the same time, it was concluded that 4 g/kg of soil salt content had no significant difference compared with the control group, but this treatment was maintained in 2018.

3.1. Dynamic Characteristics of Soil Moisture

Figure 2 illustrates the dynamic changes of soil moisture at different depths in 2017 and 2018, as measured seven days after irrigation. Unified analysis of soil moisture content seven days after irrigation showed that the soil moisture content of the 0–10 cm topsoil was the lowest and that of 30–40 cm topsoil was the highest. Before the flowering and fruit setting period (21 June 2017), the water content of the 0–20 cm shallow soil was generally lower than that of the 30–40 cm soil in each treatment, presumably due to root activity during this stage. After entering the swelling period (28 June 2017), processing tomatoes emphasized nutrient accumulation, and their root systems grew rapidly. At this stage, 20–40 cm was the main activity depth for the crop root system, so soil moisture content decreased until the end of the swelling period (20 July 2017), at which point it rebounded. The dynamic changes in water content at 0–40 cm followed a similar pattern in 2018.
Figure 2 reveals that the effect of the N treatment on the soil moisture content was not significant compared with the salt (S) treatment, and that the soil moisture content at each depth increased with higher soil salinity. Regardless of the level of nitrogen, the soil moisture contents of S2 and S3 treatments (as well as SS2 and SS3) were different from the other treatments. While this difference was not significant in the early stages of fertility, the water content was generally higher than other treatments over time, especially during the expansion period (p < 0.01; [33]). Excessive soil salinity absorbed a large amount of effective water of the soil, resulting in reduced effective water absorption by crop roots and aggravated salt stress, none of which was conducive to tomato root system growth or function. The low nitrogen and high salt treatment (N4) had slightly lower soil moisture contents than the high nitrogen and high salt treatment, indicating that a reduction in the rate of nitrogen application can reduce the degree of salt stress in highly saline soils and improve the water absorption capacity of processing tomato roots. Soil water contents under the S2, SS2, and SS3 treatments were generally higher than under other treatments with the same nitrogen levels, suggesting that soil salinities of 5 and 7 g/kg inhibited the water absorption capacity of processing tomato roots. Similarly, the low application of nitrogen was moderately effective at improving the water absorption capacity of processing tomato roots under saline-alkali stress, but more effective under severe saline-alkali stress.

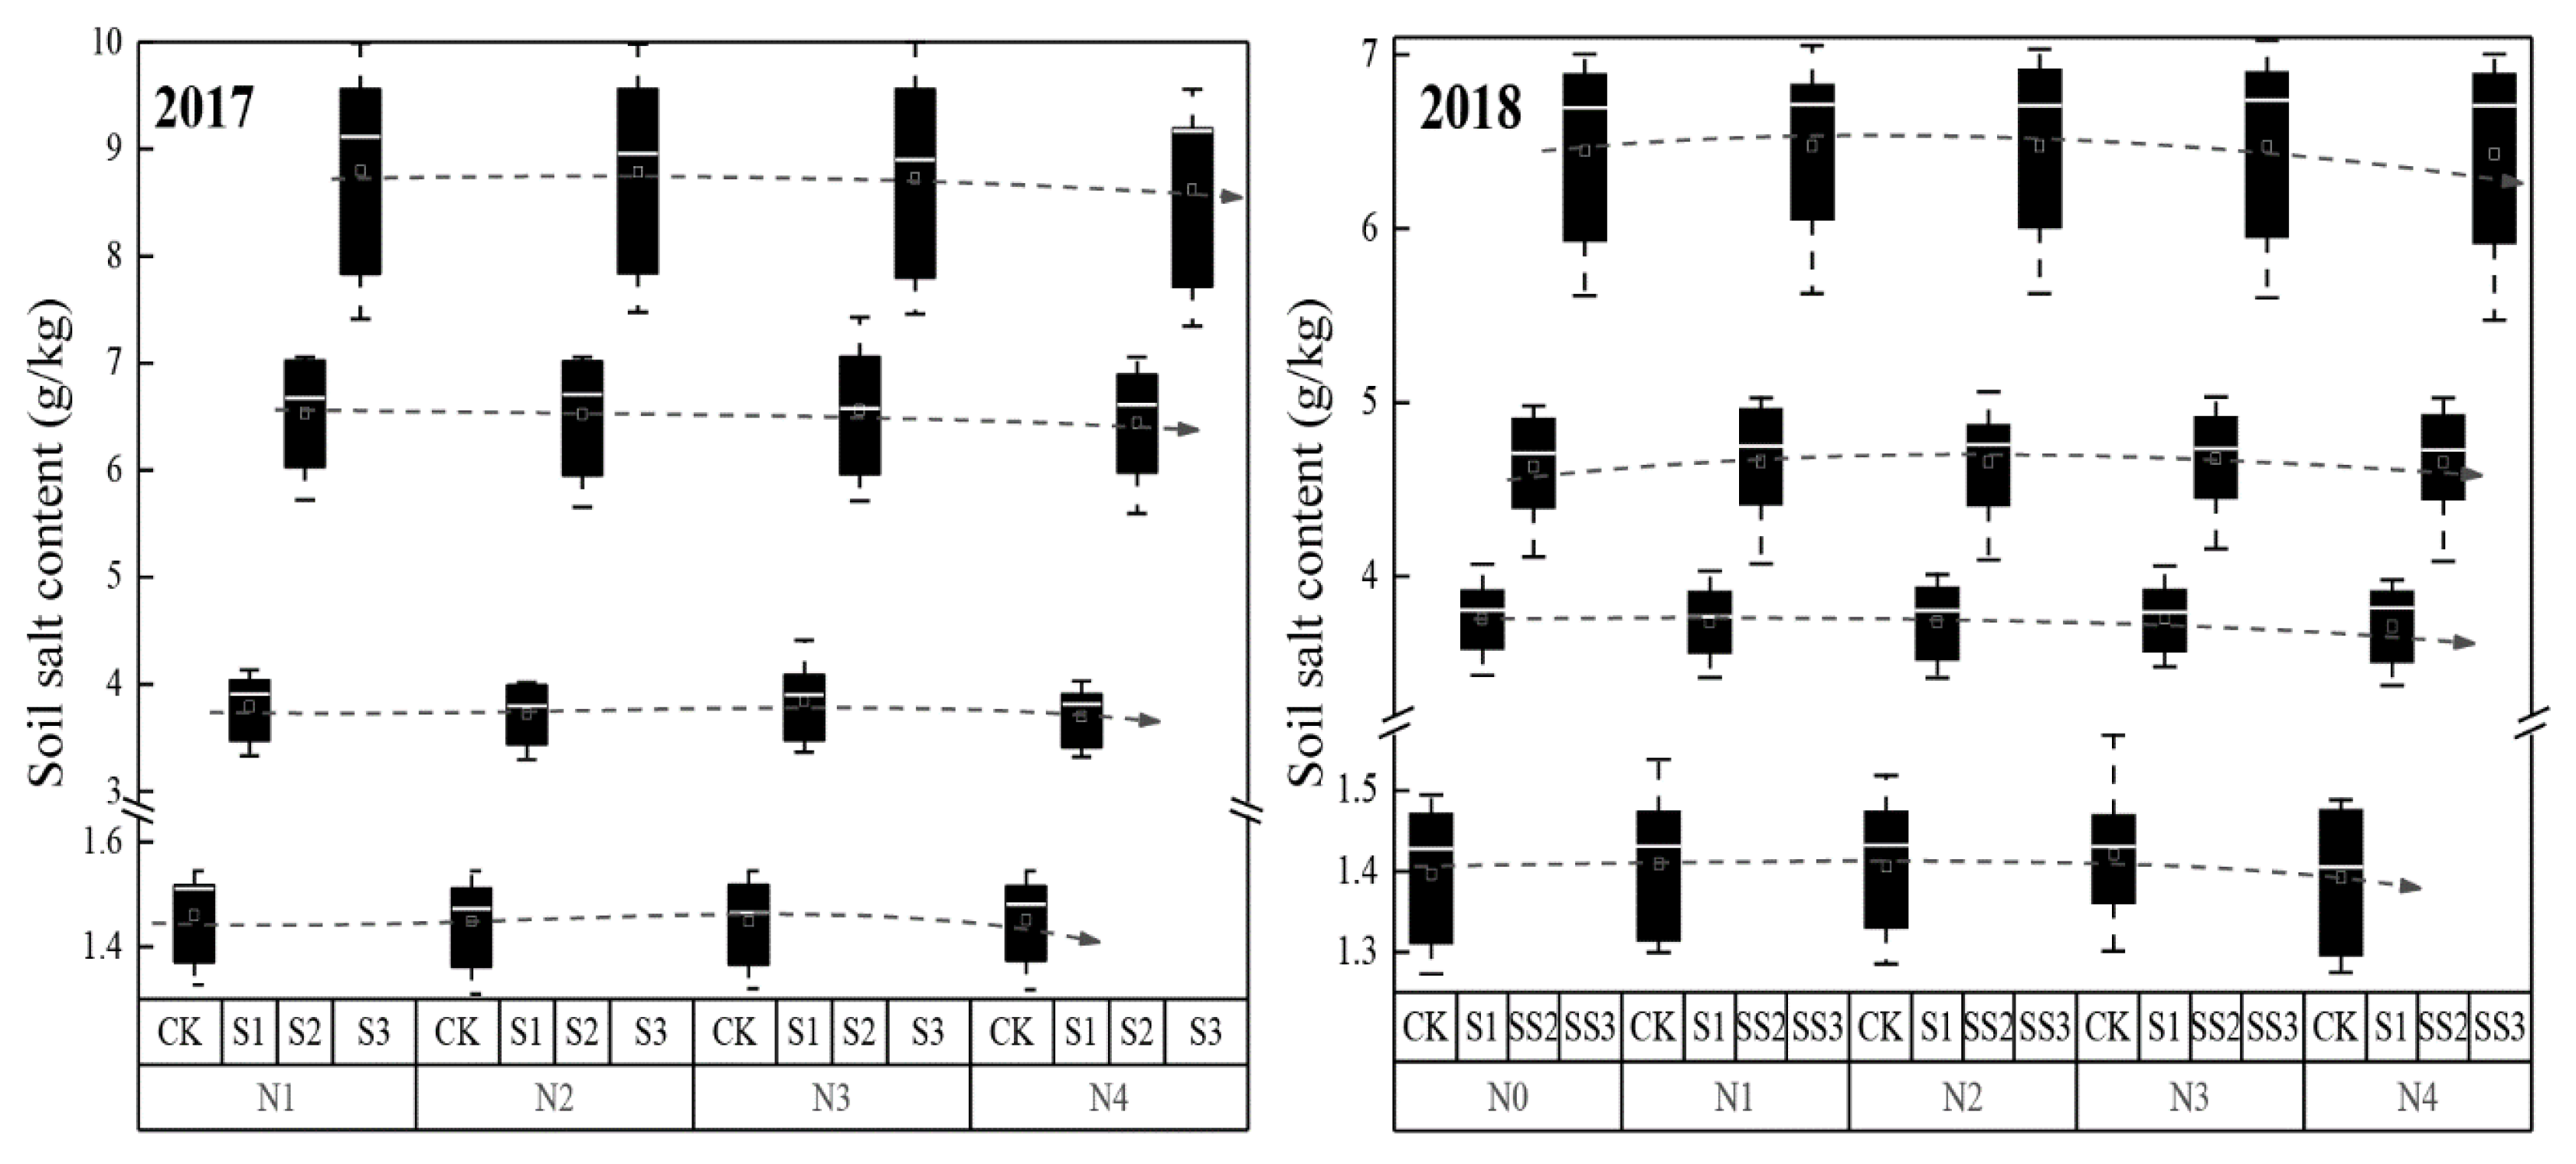
3.2. Soil Salt Distribution Characteristics

Figure 3 and Figure 4 reflect the dynamic characteristics of the soil salinity profiles under different treatments. In order to ensure vigorous root growth, the processing tomatoes were irrigated once during the seedling stage, followed by a non-irrigation period that lasted nearly one month, until the next growth stage. This led to an upward gradient driven by evaporation of soil water, and the salt accumulated in the shallow soil. As the plants developed, the salt contents of the shallow layer decreased gradually under all treatments until the middle-to-late stage of expansion (70–90 days after planting). Due perhaps to the leaching effects of drip irrigation, the salt content of the soil increased gradually with increasing depth. A large amount of salt gathered at 20–40 cm, peaking at 40 cm. This was mainly due to the inhibition of salt accumulation in the surface layer of the soil by mulching [34]. Because the leaching time of the drip irrigation was not long, only the surface salinity decreased, and the soil salinity gathered between 20 and 40 cm. By comparing the different nitrogen application levels for similar soil salt contents in 2017 and 2018, the results reveal that nitrogen amendments had a limited impact on soil salt content.
The average salt contents of the entire soil layer decreased over the course of the tomato growth stages in both 2017 and 2018. For example, 92 days after sowing in 2017, the soil salt content of N2CK, N2S1, N2S2, and N2S3 were reduced by 4.97%, 5.08%, 7.34%, and 7.91%, respectively, compared to the same treatments at 69 days. In 2018, the 88-day measurements from N2CK, N2S1, N2SS2, and N2SS3 showed decreases of 5.21%, 3.94%, 5.49%, and 4.66%, respectively, compared with the 72 day soil salt content. Both years showed that the soil was in the desalting state during the entire growth stage of the processing tomato.
A comparative analysis of soil salinity across the total growth period under different treatments is shown in Figure 5, which illustrates the significantly different (p < 0.01) median and mean soil salt contents across the timespan of this study. The trend line reveals that a decrease of N was associated with a slight decrease in soil salt content, but there was no significant difference between N treatments (p > 0.05). The soil was slowly desalting throughout the growth period. The application of N did not significantly increase soil salinity.
Figure 5 also indicates that the lower the soil salinity was at any given time, the slower the soil desalination was. This confirms that the leaching effect of drip irrigation was more pronounced on soil with high starting salinity [35].

3.3. Fresh Fruit Yield and Quality

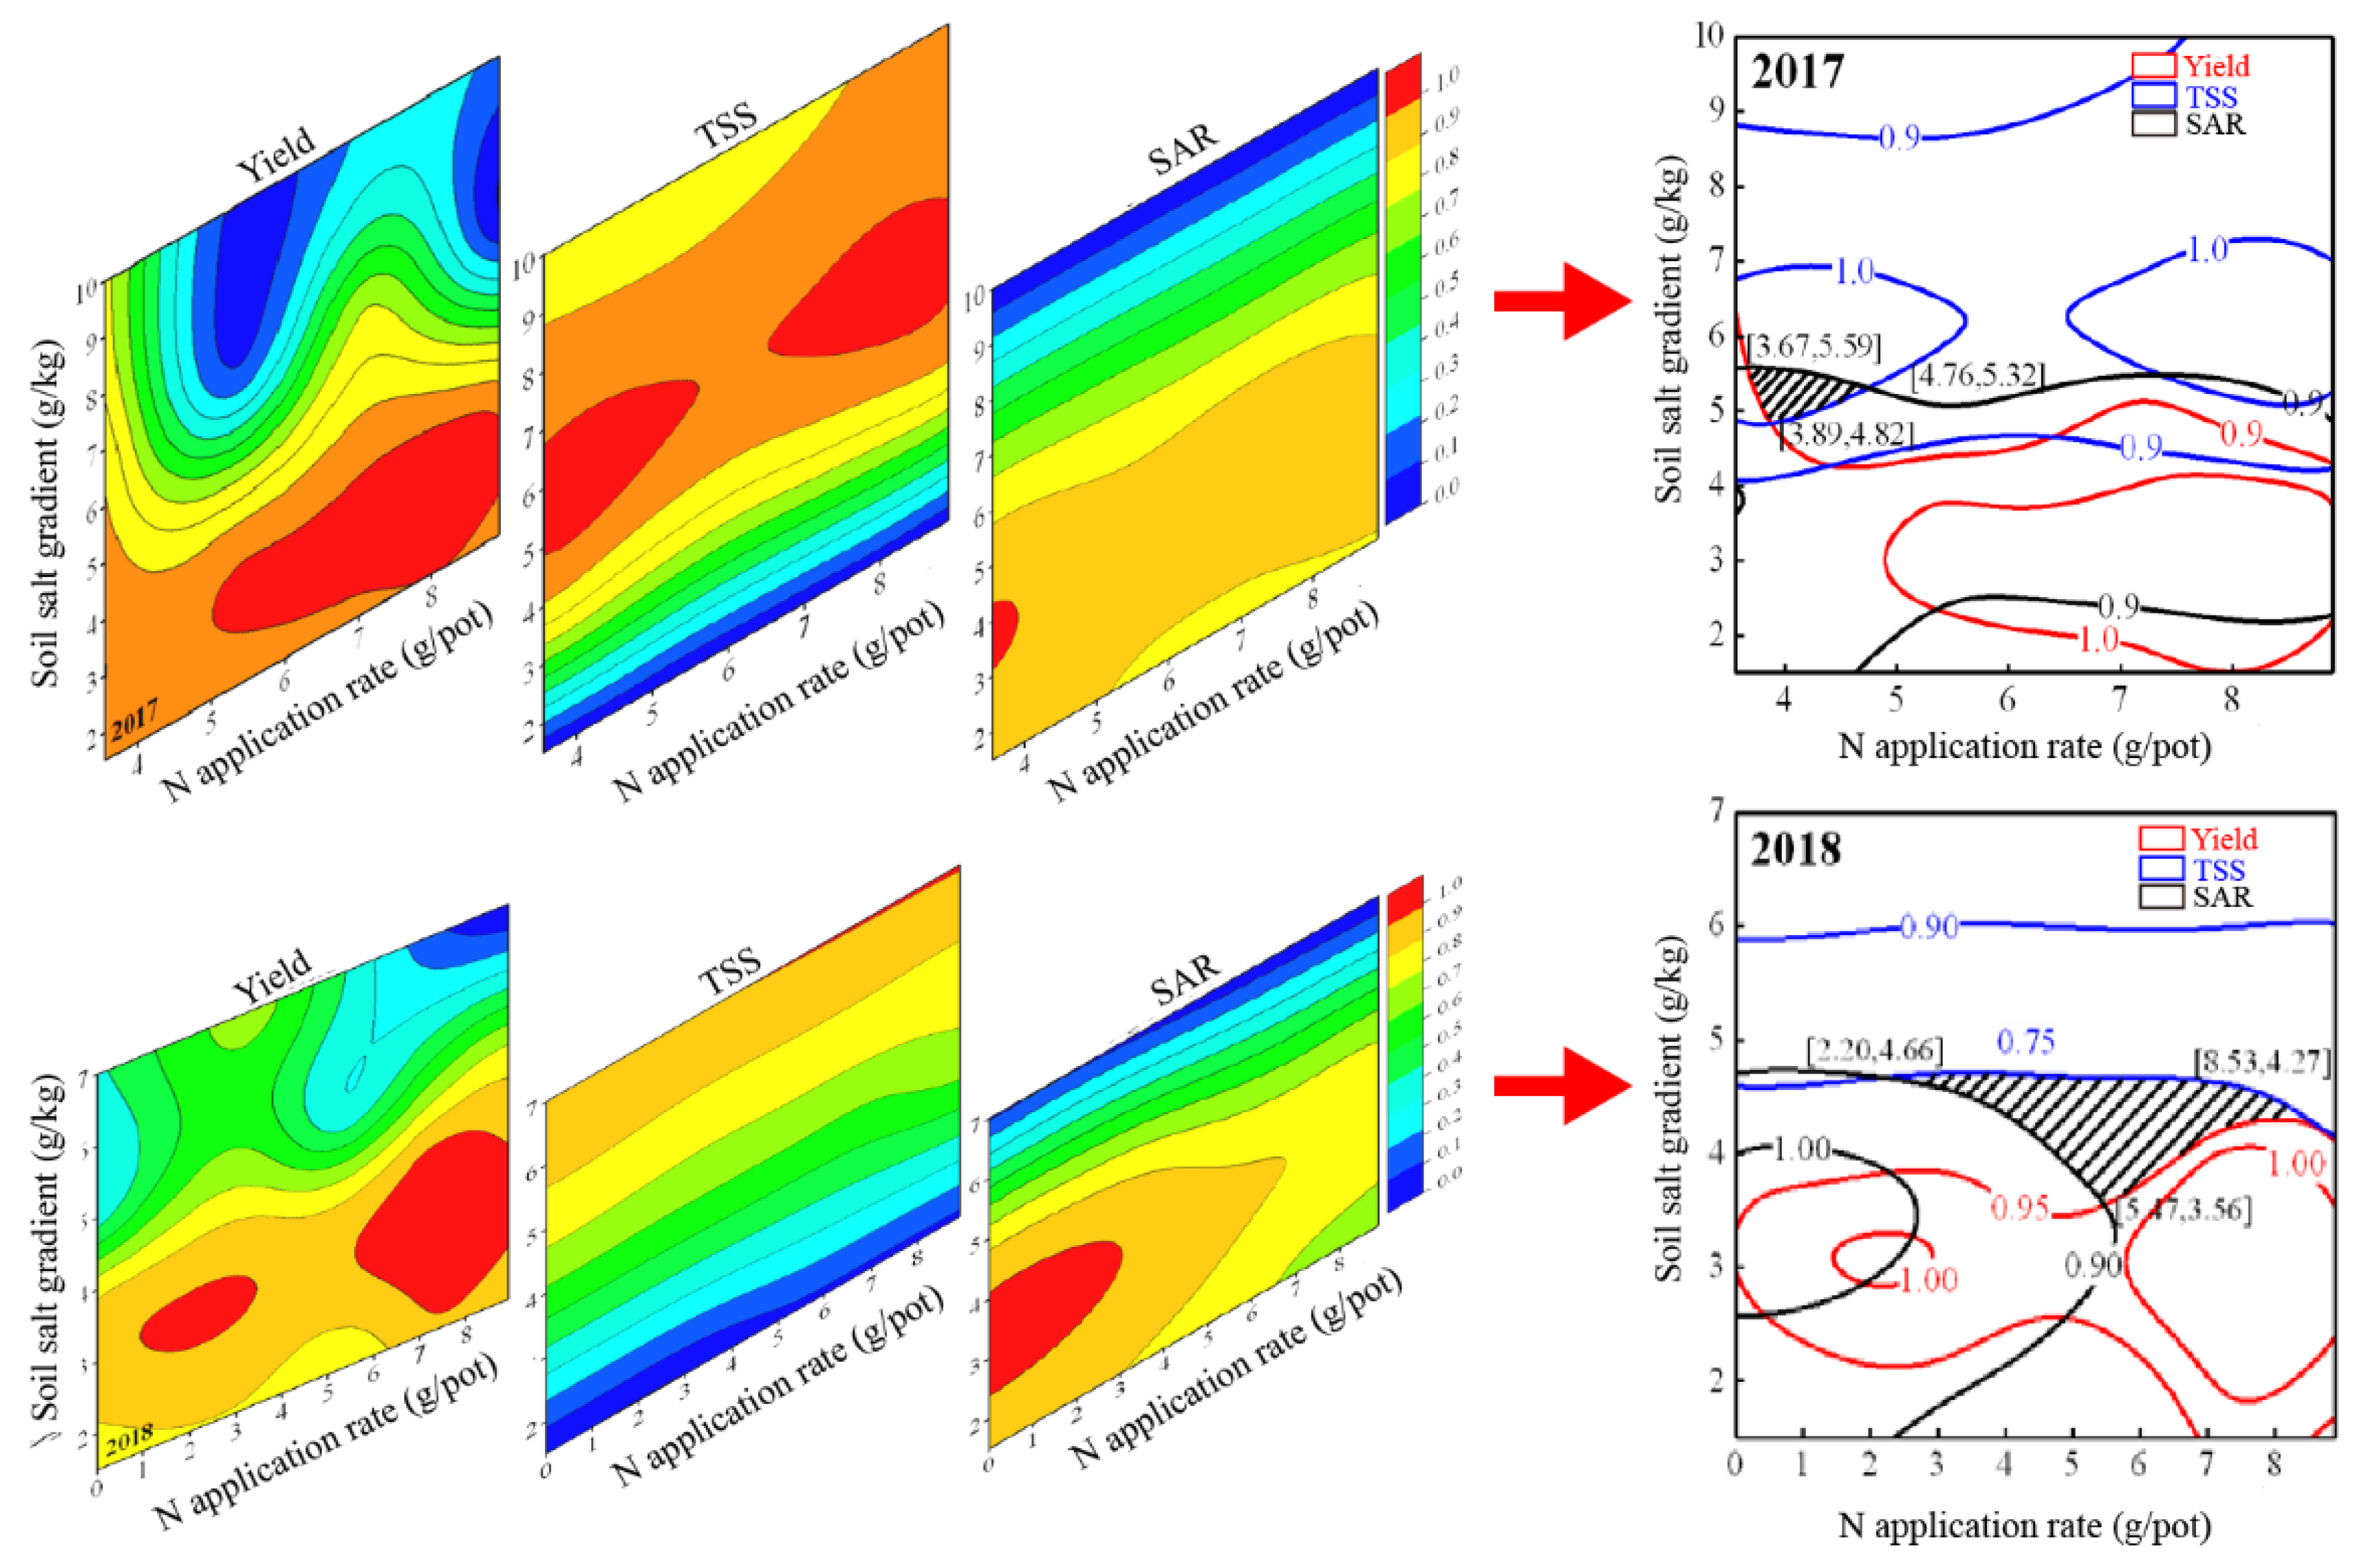
3.3.1. Responses of Yield and Quality of Processing Tomato Fresh Fruit to Nitrogen and Soil Salinity

The yield and tomato quality data are presented in Table 3. In general, fresh fruit yield decreased with an increase in soil salt content. The higher the salt content, the more serious the yield reduction was [36]. Taking normal nitrogen application (N3) as an example, the fresh fruit yield of S2, and S3 decreased by 60.17% and 61.90%, respectively, compared with the CK control in 2017, and the yields of SS2, and SS3 decreased by 18.04%, and 14.51%, respectively, compared with CK in 2018. The difference of yield between S1 and CK in 2017 and 2018 was not significant. Due to its interaction with nitrogen, the rule that a high salinity leads to low yield is not universally true for processing tomatoes. According to the results in Table 3, in the low salt treatments (CK and S1), the N2 treatment reached its highest yield during both years, yet there was no significant difference between N0, N1, N3, and N4 (p > 0.05). Clearly, higher nitrogen levels did not inherently improve the yield of processing tomatoes. Compared with the low-salt treatments, the high-salt treatments (S2, SS2, S3, and SS3) were more responsive to different nitrogen levels i.e., that under high-salt conditions, the yield of processing tomatoes was most improved by low-level nitrogen application, and the yield of N4 treatment was higher than the other nitrogen treatments. The N4S3 treatment in 2017 was increased by 87.62%, 74.34%, and 123.86% relative to the production of N1S3, N2S3, and N3S3, respectively. Yield analysis in 2018 showed similar patterns to 2017. The tomato yield was not reduced under low nitrogen conditions, though excessive soil salinity may have had a certain effect on nitrogen deficiency in processing tomato growth. Insufficient nitrogen application did not enable higher yields than applying a certain amount of nitrogen, which shows that the application of nitrogen was essential to improving the yield of processing tomatoes.
Table 3 also indicates that there was no significant difference in the TSS, VC, SSC, TA, and SAR at different nitrogen levels and the same soil salt content (p > 0.05). However, these indicators were greatly affected by salt, i.e., that TSS, VC, SSC, and TA increased when soil salt was more abundant, confirming the results of other studies [37,38,39,40]. Whereas SAR was elevated under low salt conditions at different N levels, and the maximum value was in the S1 treatment. The 2017 results for moderate N application rates (N2) illustrate this trend. For example, N2S1 had SAR values that were 6.19%, 17.04%, and 101.11% higher than N2CK, N2S2, and N2S3, respectively. The higher the salt content in the soil, the lower the SAR. The two-way ANOVA shows that N had significant effects on the quality of processing tomatoes, even without soil salinity (Table 4). The interaction of N and S had no significant effect on the quality of processing tomatoes (p > 0.05). Thus, soil salinity played a dominant role in processing tomato quality in a soil environment composed of soil salinity and nitrogen.

3.3.2. Determination of the Optimal Range for Processing Tomato Yield and Quality

Figure 6 is a contour map of the normalized yield, TSS, and SAR metrics. It highlights the relationship between these indicators and both nitrogen application and soil salt content. By overlapping three maps for each year, the range of nitrogen application and soil salinity for optimal yield and quality of processing tomatoes was revealed. The optimal ranges for 2017 are: N, 3.67–4.76; S, 3.89–5.59 (g/pot, g/kg). The optimal ranges for 2018 are: N, 2.20–8.53; S, 3.56–4.66 (g/pot, g/kg). The recommended ranges for nitrogen application and soil salt content are: N, 2.20–4.76; S 3.56–5.59 (g/pot, g/kg). This nitrogen application rate is equivalent to 154.63–200.55 kg/ha.

4. Conclusions

In this study, the distribution characteristics of soil water and salt dynamics were monitored under a range of combinations of nitrogen and soil salt levels. The responses of tomato fresh fruit yield and quality to soil salt content and nitrogen application were measured. After two years of field experiments and analysis, our results showed that the soil moisture content of processing tomatoes increased gradually with an increase of soil salt content and soil depth. The maximum water content was reached at 40 cm depth at seven days after irrigation. The combination of low nitrogen and high salt was found to improve the water absorption capacity of processing tomato roots and promote the growth of processing tomatoes. Nitrogen had no significant effect on soil water content compared with salinity. Seven days after irrigation, the soil salt content was mainly concentrated in the soil layer 30–40 cm deep. The soil in which the processing tomato plants were raised was experiencing gradual desalination throughout the growth period. The fresh fruit yield of the processing tomatoes generally complied with the rule of “high salinity leads to low yield,” but because of the interaction between salt and nitrogen, the yield of processing tomatoes under low nitrogen and high salt conditions was higher than that under high nitrogen levels. However, the maximum yield of processing tomatoes was evident from the middle-to-high nitrogen and low salt treatment, which indicates that ensuring medium-to-high nitrogen application rate in low salt areas could make tomato production for processing feasible. If the local soil salinity is too high and cannot be remediated, the normal growth of processing tomatoes can be guaranteed by reducing the amount of nitrogen application, which should achieve near-normal yields. TSS, VC, SSC, and TA (fruit quality indicators) all increased gradually with the increase of soil salt content. The highest SAR values appeared at low salt content (4 g/kg). After comprehensive consideration of the results from the two-year experiment, the most reasonable ranges of nitrogen application for the optimal yield and quality of processing tomatoes were determined to be 154.63–200.55 kg/ha when soil salt varied at 3.56–5.59 g/kg.

Author Contributions

Z.W. and B.F. conceived and designed the research; J.Z. and Z.W. performed the experiments; J.Z., Z.W., B.F., and Y.H. completed the writing of the article; Y.D., Z.R., and X.C. assisted in the completion of the experiments and refined the manuscript. All authors have read and agreed to the published version of the manuscript.

Funding

This study was funded by the National Key R&D Program “Research and Application of Economic Crop Water and Fertilizer Integration Technology Model” of China (2017YFD0201506) and the Shihezi University International Science and Technology Cooperation Promotion Plan Project (GJHZ201803).

Conflicts of Interest

The authors declare no conflict of interest.

References

  1. Ren, Z.; Li, Y.; Fang, W.; Yan, D.; Huang, B.; Zhu, J.; Wang, X.; Wang, X.; Wang, Q.; Guo, M.; et al. Evaluation of allyl isothiocyanate as a soil fumigant against soil-borne diseases in commercial tomato (Lycopersicon esculentum Mill.) production in China. Pest. Manag. Sci. 2018, 74, 2146–2155. [Google Scholar] [CrossRef] [PubMed]
  2. Chen, W.; Hou, Z.; Wu, L.; Liang, Y.; Wei, C. Evaluating salinity distribution in soil irrigated with saline water in arid regions of northwest China. Agric. Water Manag. 2010, 97, 2001–2008. [Google Scholar] [CrossRef]
  3. Xi, J.; Zhang, F.; Mao, D.; Tian, C.; Song, Y.; Liu, D. Saline-soil distribution and halophyte resources in Xinjiang. Chin. J. Soil Sci. 2005, 36, 299–303. [Google Scholar]
  4. Liu, H.; Wang, X.; Xian, Z.; Zhang, L.; Yan, L.; Huang, G. Evaluation on the responses of maize (Zea mays L.) growth, yield and water use efficiency to drip irrigation water under mulch condition in the Hetao irrigation District of China. Agric. Water Manag. 2017, 179, 144–157. [Google Scholar] [CrossRef]
  5. Yang, A.; Akhtar, S.S.; Iqbal, S.; Amjad, M.; Naveed, M.; Zahir, Z.A.; Jacobsen, S.E. Enhancing salt tolerance in quinoa by halotolerant bacterial inoculation. Funct. Plant Biol. 2016, 43, 632–642. [Google Scholar] [CrossRef]
  6. Razavizadeh, R.; Ehsanpour, A.A.; Ahsan, N.; Komatsu, S. Proteome analysis of tobacco leaves under salt stress. Peptides 2009, 30, 1651–1659. [Google Scholar] [CrossRef]
  7. Scandalios, J.G. Oxygen stress and superoxide dismutases. Plant Physiol. 1993, 101, 7–12. [Google Scholar] [CrossRef] [Green Version]
  8. Bassil, E.S.; Kaffka, S.R. Response of safflower (Carthamus tinctorius L.) to saline soils and irrigation: I. Consumptive water use. Agric. Water Manag. 2002, 54, 67–80. [Google Scholar] [CrossRef]
  9. Bassil, E.S.; Kaffka, S.R. Response of safflower (Carthamus tinctorius L.) to saline soils and irrigation: II. Crop response to salinity. Agric. Water Manag. 2002, 54, 81–92. [Google Scholar] [CrossRef]
  10. Hanson, B.R.; May, D.M. Crop coefficients for drip-irrigated processing tomato. Agric. Water Manag. 2006, 81, 381–399. [Google Scholar] [CrossRef]
  11. Hanson, B.; May, D. Effect of subsurface drip irrigation on processing tomato yield, water table depth, soil salinity, and profitability. Agric. Water Manag. 2007, 68, 1–17. [Google Scholar] [CrossRef]
  12. Roberts, T.L.; White, S.A.; Warrick, A.W.; Thompson, T.L. Tape depth and germination method influence patterns of salt accumulation with subsurface drip irrigation. Agric. Water Manag. 2008, 95, 669–677. [Google Scholar] [CrossRef]
  13. Ayars, J.E.; Phene, C.J.; Hutmacher, R.B.; Davis, K.R.; Schoneman, R.A.; Vail, S.S.; Mead, R.M. Subsurface drip irrigation of row crops: A review of 15 years of research at the Water Management Research Laboratory. Agric. Water Manag. 1999, 42, 1–27. [Google Scholar] [CrossRef]
  14. Batchelor, C.; Lovell, C.; Murata, M. Simple microirrigation techniques for improving irrigation efficiency on vegetable gardens. Agric. Water Manag. 1996, 32, 37–48. [Google Scholar] [CrossRef]
  15. Karlberg, L.; Vries, F.W.P. Exploring potentials and constraints of low-cost drip irrigation with saline water in sub-Saharan Africa. Phys. Chem. Earth 2004, 29, 1035–1042. [Google Scholar] [CrossRef]
  16. National Bureau of Statistics. Xinjiang Statistical Yearbook; China Statistics Press: Beijing, China, 2015.
  17. Hanson, B.R.; Hutmacher, R.B.; May, D.M. Drip irrigation of tomato and cotton under shallow saline ground water conditions. Irrig. Drain. Syst. 2006, 20, 155–175. [Google Scholar] [CrossRef]
  18. Rajak, D.; Manjunatha, M.V.; Rajkumar, G.R.; Hebbara, M.; Minhas, P.S. Comparative effects of drip and furrow irrigation on the yield and water productivity of cotton (Gossypium hirsutum L.) in a saline and waterlogged vertisol. Agric. Water Manag. 2006, 83, 30–36. [Google Scholar] [CrossRef]
  19. Kashyap, P.S.; Panda, R.K. Effect of irrigation scheduling on potato crop parameters under water stressed conditions. Agric. Water Manag. 2003, 59, 49–66. [Google Scholar] [CrossRef]
  20. Kochsiek, A.; Ciganda, V.; Bryan, N.; Hite, L.; Awada, T. Ecophysiolgoical responses of schizachyrium scoparium to water and nitrogen manipulations. Great Plains Res. 2006, 16, 29–36. [Google Scholar]
  21. Wang, Z.; Fan, B.; Guo, L. Soil salinization after long-term mulched drip irrigation poses a potential risk to agricultural sustainability. Euro. J. Soil Sci. 2019, 70, 20–24. [Google Scholar] [CrossRef] [Green Version]
  22. Tan, J.L.; Kang, Y.H. Changes in soil properties under the influences of cropping and drip irrigation during the reclamation of severe salt-affected soils. Agric. Sci. China 2009, 8, 1228–1237. [Google Scholar] [CrossRef]
  23. Buttery, R.G.; Teranishi, R.; Flath, R.A.; Ling, L.C. Identification of additional tomato paste volatiles. J. Agric. Food Chem. 1990, 38, 792–795. [Google Scholar] [CrossRef]
  24. Chung, T.Y.; Hayase, F.; Kato, H. Volatile Components of Ripe Tomatoes and Their Juices, Purées and Pastes. J. Agric. Chem. Soc. Jpn. 2006, 47, 9. [Google Scholar]
  25. Kazeniac, S.J.; Hall, R.M. Flavor chemistry of tomato volatiles. J. Food Sci. 2010, 35, 519–530. [Google Scholar] [CrossRef]
  26. Miki, N. Effects of chemical components on the browning of tomato juice. J. Agric. Chem. Soc. Jpn. 1974, 38, 499–506. [Google Scholar]
  27. Min, S.; Zhang, Q.H. Effects of commercial-scale pulsed electric field processing on flavor and color of tomato juice. J. Food Sci. 2010, 68, 1600–1606. [Google Scholar] [CrossRef]
  28. Huang, Y.; Lu, R.; Dong, H.; Chen, K. Quality assessment of tomato fruit by optical absorption and scattering properties. Postharvest Biol. Technol. 2018, 143, 78–85. [Google Scholar] [CrossRef]
  29. Johnstone, P.R.; Hartz, T.K.; Lestrange, M.; Nunez, J.J.; Miyao, E.M.; Hartz, T.K.; Lestrange, M.; Nunez, J.J.; Miyao, E.M. Managing fruit soluble solids with late-season deficit irrigation in drip-irrigated processing tomato production. Hortsci 2005, 40, 1857–1861. [Google Scholar] [CrossRef] [Green Version]
  30. Gierson, D.; Kader, A.A. Fruit Ripening and Quality; Chapman & Hall: London, UK, 1986. [Google Scholar]
  31. Zhang, T.Q.; Tan, C.S.; Liu, K.; Drury, C.F.; Papadopoulos, A.P.; Warner, J. Yield and economic assessments of fertilizer nitrogen and phosphorus for processing tomato with drip fertigation. Agric. J. 2010, 102, 774–780. [Google Scholar] [CrossRef]
  32. Khan, M.M.R.; Rahman, M.M.; Islam, M.S.; Begum, S.A. A simple UV-spectrophotometric method for the determination of vitamin c content in various fruits and vegetables at Sylhet area in Bangladesh. J. Biol. Sci. 2006, 6, 388–392. [Google Scholar] [CrossRef] [Green Version]
  33. Akhtar, S.S.; Andersen, M.N.; Liu, F. Residual effects of biochar on improving growth, physiology and yield of wheat under salt stress. Agric. Water Manag. 2015, 158, 61–68. [Google Scholar] [CrossRef]
  34. Qi, Z.; Hao, F.; Ying, Z.; Zhang, T.; Yang, A.; Zhang, Z. Spatial distribution and simulation of soil moisture and salinity under mulched drip irrigation combined with tillage in an arid saline irrigation district, northwest China. Agric. Water Manag. 2018, 201, 219–231. [Google Scholar] [CrossRef]
  35. Wenhao, L.Z.W.; Xurong, Z. Effects of freezing and thawing on soil salinity in cotton fields by long-term drip irrigation of saline-alkaline soil in North Xinjiang. Agric. Res. Arid Areas 2015, 33, 40–46. [Google Scholar]
  36. Sobhani, G.; Golchin, A.; Shekari, F. Effects of different levels of nitrogen and induced-NaCl stress on yield and growth indices of tomato. J. Sci. Technol. Greenh. Cult. 2014, 5, 49–63. [Google Scholar]
  37. Cuartero, J.; Fernández-Muñoz, R. Tomato and salinity. Sci. Hortic. 1998, 78, 83–125. [Google Scholar] [CrossRef]
  38. Eltez, R.Z.; Tüzel, Y.; Gül, A.; Tüzel, I.H.; Duyar, H. Effects of different Ec levels of nutrient solution on greenhouse tomato growing. Acta Hortic. 2002, 573, 443–448. [Google Scholar] [CrossRef]
  39. Keutgen, A.J.; Pawelzik, E. Contribution of amino acids to strawberry fruit quality and their relevance as stress indicators under NaCl salinity. Food Chem. 2008, 111, 642–647. [Google Scholar] [CrossRef]
  40. Yurtseven, E.; Kesmez, G.D.; Ünlükara, A. The effects of water salinity and potassium levels on yield, fruit quality and water consumption of a native central Anatolian tomato species (Lycopersicon esculantum). Agric. Water Manag. 2005, 78, 128–135. [Google Scholar] [CrossRef]
Figure 1. Daily rainfall (mm; black bars) and daily average air temperature (°C; dotted curves) at the study site during the experimental period in 2017 (upper panel) and 2018 (lower panel).
Agronomy 10 00293 g001
Figure 2. Distribution characteristics of soil moisture at different soil depths (0–10, 10–20, 20–30, and 30–40 cm) in 2017 (ad) and 2018 (eh).
Agronomy 10 00293 g002
Figure 3. Dynamic distribution characteristics of salinity along the soil profile on different days after sowing in each treatment in 2017. From left to right, the application rate of salt increases. From up to down, the application rate of nitrogen increases.
Agronomy 10 00293 g003
Figure 4. Dynamic distribution characteristics of salinity along the soil profile on different days after sowing in each treatment in 2018. From left to right, the application rate of salt increases. From up to down, the application rate of nitrogen increases.
Agronomy 10 00293 g004
Figure 5. Changes in soil salt content during different growth stages for the different treatments. The upper and lower ends of the black boxes represent the 25th and 75th percentiles, respectively, while the white lines inside the box represent the median values, and the small open squares in the middle represent the mean values.
Agronomy 10 00293 g005
Figure 6. Data maps obtained after the normalization of yield, total soluble solids (TSS), and sugar: acid ratio (SAR), along with N application ranges and soil salinity ranges for optimum yield and quality of processing tomatoes obtained by overlapping the three distributions for each of the two years (the right most subplots). For the graphs of yield, TSS, and SAR, a value of 0 represents the conditions the most inappropriate for tomato growth while 1 represents the most suitable conditions. These three normalized figures are stacked one on another, hiding the filling area and leaving only the line of relative optimization. The triangular area surrounded by the intersection of the data lines of these three indicators is the range of N application and soil salinity under the conditions of optimal yield, TSS, and SAR.
Agronomy 10 00293 g006
Table 1. Soil (0–40 cm) properties at the study site.
YearsSoil Salt TreatmentsDry Bulk Density (g/cm3)Total Nitrogen (g/kg)Total Phosphorus (g/kg)Total Potassium (g/kg)Available Phosphorus (mg/kg)Available Potassium (g/kg)Field Water Holding Capacity (%)pHEC (ms/cm)
2017CK1.320.620.877.530.87420.5728.617.730.63
S11.270.560.837.431.05416.8530.887.842.25
S21.300.610.766.628.68419.2133.148.113.89
S31.270.530.826.926.36417.7329.978.425.41
2018CK1.350.650.788.331.30415.2728.407.670.60
S11.330.610.807.931.18415.3528.457.882.28
SS21.310.630.748.131.23415.3328.417.962.87
SS31.290.640.777.731.10415.2928.468.193.82
Table 2. Irrigation and fertilizer supply in 2017 and 2018.
YearsGrowth StageDateWater TreatmentFertilizer Treatment
Irrigation Amount (mm)Irrigation FrequencyUrea (kg/ha) *Monoammonium Phosphate (kg/ha)Potassium Chloride (kg/ha)Potassium Chloride (kg/ha)
N1N2N3N4
2017Seedling stageMay 3 to 315014738281928281
Flowering stageJune 1 to 211503141112845684843
Expansion stageJune 22 to July 312004187150113751131134
Mature stageAugust 1 to 20501-------
Total growth stage-45093753002251502252258
2018Seedling stageApril 30 to May 275014738281928281
Flowering stageMay 28 to June 221503141112845684843
Expansion stageJune 23 to July 262004187150113751131134
Mature stageJuly 27 to August 15501-------
total growth stage-45093753002251502252258
*: N1–N4 indicate the selected four nitrogen application rates for testing.
Table 3. Yield and quality of tomato in different treatments, showing mean ± standard deviation, with different letters indicating significant differences between treatments (p < 0.05). TSS stands for total soluble solids, VC for vitamin C content, SSC for total soluble sugar content, TA for titratable acid, and SAR for the ratio of sugar to acid.
TreatmentFresh Fruit Yield (kg/pot)Fruit Mean Weight (g)TSS (%)VC (mg/100g)SSC (%)TA (%)SAR (%)
2017
N1CK2.31 ± 0.12ab33.60 ± 0.28d7.34 ± 0.07h15.74 ± 0.08i7.05 ± 0.11j0.42 ± 0.02j16.64 ± 0.01g
N1S12.33 ± 0.04a35.05 ± 0.14c13.86 ± 0.08g18.55 ± 0.09ef10.91 ± 0.09g0.61 ± 0.01g17.78 ± 0.08d
N1S20.77 ± 0.08g23.31 ± 0.17i18.32 ± 0.06a21.89 ± 0.15a13.79 ± 0.06a0.90 ± 0.03d15.26 ± 0.01j
N1S31.05 ± 0.10de25.62 ± 0.16g18.04 ± 0.04c19.74 ± 0.11cd11.89 ± 0.13d1.33 ± 0.01a8.92 ± 0.07k
N2CK2.35 ± 0.13a35.51 ± 0.02b7.35 ± 7.00h15.76 ± 0.07i7.01 ± 0.14j0.41 ± 0.02jk16.95 ± 0.11f
N2S12.38 ± 0.11a35.07 ± 0.13c13.85 ± 0.11g18.53 ± 0.09ef10.86 ± 0.15gh0.60 ± 0.04gh18.00 ± 0.06c
N2S21.90 ± 0.07c27.85 ± 0.06f18.26 ± 0.07ab21.84 ± 0.11a13.74 ± 0.04ab0.89 ± 0.01de15.38 ± 0.07ij
N2S31.13 ± 0.09d24.74 ± 0.13h17.94 ± 0.06d19.69 ± 0.03d11.84 ± 0.06de1.32 ± 0.03ab8.95 ± 0.05k
N3CK2.31 ± 0.12ab34.97 ± 0.11c7.22 ± 0.12i16.17 ± 0.05h6.96 ± 0.07jk0.40 ± 0.01k17.25 ± 0.13e
N3S12.34 ± 0.17a35.08 ± 0.04c13.85 ± 0.11g18.35 ± 0.11fg10.81 ± 0.06hi0.59 ± 0.02hi18.21 ± 0.07b
N3S20.92 ± 0.05ef22.28 ± 0.10k18.26 ± 0.09ab20.95 ± 0.13b13.69 ± 0.04bc0.88 ± 0.04ef15.50 ± 0.05hi
N3S30.88 ± 0.08fg22.54 ± 0.22j17.76 ± 0.12e19.45 ± 0.14d11.79 ± 0.03ef1.31 ± 0.06bc8.98 ± 0.07k
N4CK2.34 ± 0.12a35.72 ± 0.11ab7.24 ± 0.14i15.66 ± 0.13i6.91 ± 0.15k0.38 ± 0.01l18.02 ± 0.13c
N4S12.36 ± 0.09a36.24 ± 0.25a13.84 ± 0.11g18.00 ± 0.07g10.76 ± 0.10i0.58 ± 0.01i18.44 ± 0.11a
N4S22.18 ± 0.13b33.35 ± 0.09e18.19 ± 0.07b20.12 ± 0.09c13.64 ± 0.07c0.87 ± 0.02f15.62 ± 0.05h
N4S31.97 ± 0.05c27.83 ± 0.02f17.55 ± 0.08f18.92 ± 0.14e11.74 ± 0.08f1.30 ± 0.03c9.01 ± 0.06k
2018
N0CK2.57 ± 0.09cdef37.77 ± 0.04h6.09 ± 0.0.7i15.80 ± 0.16i7.68 ± 0.06m0.48 ± 0.01l16.17 ± 0.05b
N0S12.62 ± 0.03abcd38.64 ± 0.05g14.47 ± 0.08g18.56 ± 0.05h11.25 ± 0.02j0.68 ± 0.02i16.45 ± 0.03a
N0SS22.12 ± 0.04i32.45 ± 0.08k16.90 ± 0.06e19.08 ± 0.09g13.06 ± 0.20h0.83 ± 0.02f15.66 ± 0.04cd
N0SS32.15 ± 0.08i33.52 ± 0.16j19.04 ± 0.09c21.91 ± 0.14b13.69 ± 0.21d1.12 ± 0.01c12.18 ± 0.07g
N1CK2.71 ± 0.07abcd40.72 ± 0.14c7.11 ± 0.11h15.86 ± 0.21i7.78 ± 0.05k0.52 ± 0.03j15.11 ± 0.08ef
N1S12.74 ± 0.07abc41.04 ± 0.11b14.60 ± 0.12f19.24 ± 0.07e11.36 ± 0.04i0.73 ± 0.04g15.48 ± 0.09d
N1SS22.25 ± 0.09hi34.35 ± 0.04i17.04 ± 0.14d20.36 ± 0.08c13.17 ± 0.11e0.88 ± 0.04d14.89 ± 0.11f
N1SS31.69 ± 0.50k26.71 ± 0.08n19.25 ± 0.07a21.97 ± 0.17ab13.79 ± 0.13a1.17 ± 0.05a11.74 ± 0.12i
N2CK2.75 ± 0.10ab41.51 ± 0.09a7.08 ± 0.06h15.85 ± 0.16i7.75 ± 0.11kl0.51 ± 0.04j15.18 ± 0.07e
N2S12.79 ± 0.11a41.61 ± 0.15a14.55 ± 0.08fg19.20 ± 0.04ef11.33 ± 0.15i0.72 ± 0.03gh15.65 ± 0.04cd
N2SS22.38 ± 0.08gh34.75 ± 0.14i17.00 ± 0.11d20.32 ± 0.11cd13.13 ± 0.05ef0.87 ± 0.04de15.02 ± 0.05ef
N2SS31.87 ± 0.07j27.48 ± 0.1m19.20 ± 0.08ab22.02 ± 0.18a13.77 ± 0.06ab1.16 ± 0.06ab11.83 ± 0.06hi
N3CK2.55 ± 0.01def40.34 ± 0.11d7.04 ± 0.07h15.83 ± 0.14i7.73 ± 0.12lm0.50 ± 0.01k15.61 ± 0.12cd
N3S12.59 ± 0.03bcde39.38 ± 0.11f14.51 ± 0.03fg19.17 ± 0.08ef11.27 ± 0.13j0.71 ± 0.02hi15.78 ± 0.10c
N3SS22.09 ± 0.11i29.97 ± 0.18l16.97 ± 0.07de20.28 ± 0.07cd13.11 ± 0.08fg0.86 ± 0.03e15.17 ± 0.07e
N3SS32.18 ± 0.08i34.50 ± 0.10i19.16 ± 0.09ab21.98 ± 0.14ab13.74 ± 0.04bc1.15 ± 0.03b11.90 ± 0.03hi
N4CK2.63 ± 0.06abcd39.61 ± 0.28e6.11 ± 0.08i15.82 ± 0.06i7.69 ± 0.12m0.49 ± 0.01kl15.82 ± 0.09c
N4S12.68 ± 0.07abcd39.64 ± 0.17e14.47 ± 0.01g19.12 ± 0.18fg11.27 ± 0.16j0.69 ± 0.03i16.24 ± 0.01ab
N4SS22.41 ± 0.04fgh38.76 ± 0.11g16.95 ± 0.05de20.24 ± 0.14d13.08 ± 0.14gh0.84 ± 0.02f15.49 ± 0.04d
N4SS32.45 ± 0.12efg39.74 ± 0.11e19.11 ± 0.11bc21.94 ± 0.16ab13.70 ± 0.11cd1.13 ± 0.01c12.08 ± 0.07gh
Table 4. Results of the two-way ANOVA for each analysis index of processing tomatoes.
Indices20172018
NSN*SNSN*S
Fresh fruit yield179.40 **705.67 **69.96 **9.99 **160.28 **11.13 **
Fruit mean weight1423.71 *10,683.32475.11 **1256.70 *9468.99 *1280.21 *
TSS28.91 **1.12 × 10⁵ **10.00 **136.18 **1.61 × 10⁵ **63.56 **
VC30.25 **1092.12 *7.29 **215.35 **3.65 × 104 *69.48 **
SSC18.57 **3.75 × 10⁴ **0.02 n.s.31.48 **1.56 × 10⁵ **0.37 n.s.
TA63.10 **5.14 × 10⁴ **0.51 n.s.83.36 **2.03 × 10⁴ **0.37 n.s.
SAR101.82 **2.48 × 10⁴ **21.24 **64.35 **2405.46 **2.28 n.s.
n.s. indicates non-significant differences according to variance analysis; * indicates a significant difference at α = 0.05; ** indicates a significant difference at α = 0.01.

