Article

Factors Controlling Soil Organic Carbon Sequestration of Highland Agricultural Areas in the Mae Chaem Basin, Northern Thailand

by
Noppol Arunrat
1,
Nathsuda Pumijumnong
1,*,
Sukanya Sereenonchai
1 and
Uthai Chareonwong
2
1
Faculty of Environment and Resource Studies, Mahidol University, Nakhon Pathom 73170, Thailand
2
Thai Telecommunication Relay Service, Bangkok Noi, Bangkok 10700, Thailand
*
Author to whom correspondence should be addressed.
Submission received: 3 February 2020 / Revised: 14 February 2020 / Accepted: 19 February 2020 / Published: 21 February 2020
(This article belongs to the Special Issue Conservation Tillage in Sustainable Agro-Ecosystems)

Abstract

:
Understanding the effect of the environment, crop types, and land management practices on the organic carbon sequestration of top soil is crucial for adopting management strategies in highland agricultural areas. The objectives of this study are: (1) to estimate top soil organic carbon density (SOCD) of different crop types and (2) to analyze the factors controlling top SOCD in highland agricultural areas. The top soil layers from 0 to 30 cm depths were collected from the Mae Chaem basin, Northern Thailand. The results showed that the highest top SOCD was found soil used for growing upland rice, which contained an average of 58.71 Mg C ha−1. A significant difference between the top SOCD was detected between areas where minimum tillage and conventional tillage of various crops, with average of values 59.17 and 41.33 Mg C ha−1, respectively, for areas growing strawberries; 61.14 and 37.58 Mg C ha−1, respectively, for cabbage, and 71.15 and 39.55 Mg C ha−1, respectively, for maize. At higher elevation, the top SOCD was high, which may be due to high clay content and low temperature. Increased use of chemical fertilizers lead to increases in top SOCD, resulting in increased crop yields. Elevation, bulk density, N and K2O fertilizers were the main factors controlling the top SOCD at all sites.

1. Introduction

Land degradation problems are mainly related to land use changes [1], which result in reduced crop yields and declining soil quality [2]. Soil organic carbon (SOC) can play a crucial role in increasing crop yields, enhancing soil fertility [3,4,5] and mitigating greenhouse gas emissions [6] by serving as potential carbon sinks, and providing improvements in soil structure and soil water storage [7]. Low levels of SOC is caused by having a poor ability to store nutrients in the soil and may result in decreased crop yields, significantly affecting soil fertility and causing nutrient loss [8]. Several studies have examined the potential of SOC on decelerating climate change and encouraging plantation crops. For example, a report claimed that an increase of SOC in the upper soil layer (0–20 cm) may result in increased grain yields of 430 kg per hectare and 3.5% reductions in crop instability [9]. However, other studies argued that the potential to increase SOC is often variable, depending on climatic conditions and soil types [10,11,12]. As a result, it is necessary to identify the relationships between carbon input, SOC accumulation, and crop yields.
In highland areas, geographical factors play a crucial role in determining the distribution of heat, water, clay minerals, and nutrients, all of which affect both the decomposition and accumulation of SOC [13]. Several studies have pointed out that the amount of SOC found in a given area has positively correlated with elevation [14]. The accumulation of SOC in highland areas varies greatly due to diverse environmental conditions such as altitude, slope, and location [15]. Climatic conditions and soil properties that vary greatly depending on elevation play crucial roles in determining SOC dynamics [16], provided that temperature falls at high altitude and soil moisture rises. In addition, human activities such as tillage and land management may also play a crucial role in determining levels of SOC after land has been converted for agricultural purposes and may lead to soil erosion and loss of soil carbon [17]. For example, Biddoccu et al. [18] evaluated the long-term soil erosion under inter-row soil management practice in a mountain vineyard, Aosta valley (NW Italy), which found that average soil loss was 15.7 Mg ha−1 year−1. Cultivation of Alpine grassland soils in China caused decreased SOC by 25, 39, and 55% for 8, 16, and 41 years of cultivation, respectively, which caused more sensitive to erosion and chemical changes of phosphorus dynamics [19]. In the sub-humid Ethiopian highlands, Dagnew et al. [20] suggested that lower soil disturbance and increase ground could reduce runoff and soil loss in this area.
In the Mae Chaem basin, Chiang Mai Province, in the northern part of Thailand, most of the agricultural areas are used to grow maize and are used in the practice diversified farming. Over the past several years, forests have been converted for agriculture and intensive farming; processes characterized by the heavy use of chemical fertilizers, burning of crop residues, lack of crop rotation, intensive tillage, and low organic amendment added, leading to high land degradation, and a drop in crop yields [21]. Conversion from forest to maize cultivation in eastern Thailand reduced SOC stocks at a rate of 6.97 Mg C ha−1 year−1, which was most pronounced in the top 10 cm soil layer [22]. This is because the SOC content in cropland is strongly dependent on soil management practices, such as tillage methods, the addition of fertilizer, crop species, and organic amendments [23,24]. According to previous studies, researchers have confirmed that the accumulation of SOC will result in nutrient level increase in the soil as well as improvements to crop yields [25,26,27,28]. As a result, the focus must be placed on how to manage agricultural land to improve SOC in topsoil (0–30 cm) under different types of management practices and for different crop types. This is because topsoil layer is crucial for soil carbon storage and crop yield [29] and is more labile, more sensitive to land use changes [30], and directly interacts with the atmosphere [31]. Jobbágy and Jackson [14] also concluded that 0–20 cm soil layer could be used to estimate soil carbon sequestration in the 0–100 cm soil.
Therefore, the objectives of this study are: (1) to estimate top SOCD of different crop types; (2) analyze the factors controlling top SOCD in highland agricultural areas. To achieve these objectives, top soil layers were collected from nine crop types (cabbage, upland rice, lowland rice, tomato, strawberry, potato, Japanese pumpkin, cape gooseberry, and maize) in the Mae Chaem basin, Chiang Mai Province, Thailand. This study is the first to detail of top SOCD in agricultural highland areas, which will serve as an important resource for the design of land management strategies aiming to prevent carbon deterioration in highland agricultural areas.

2. Materials and Methods
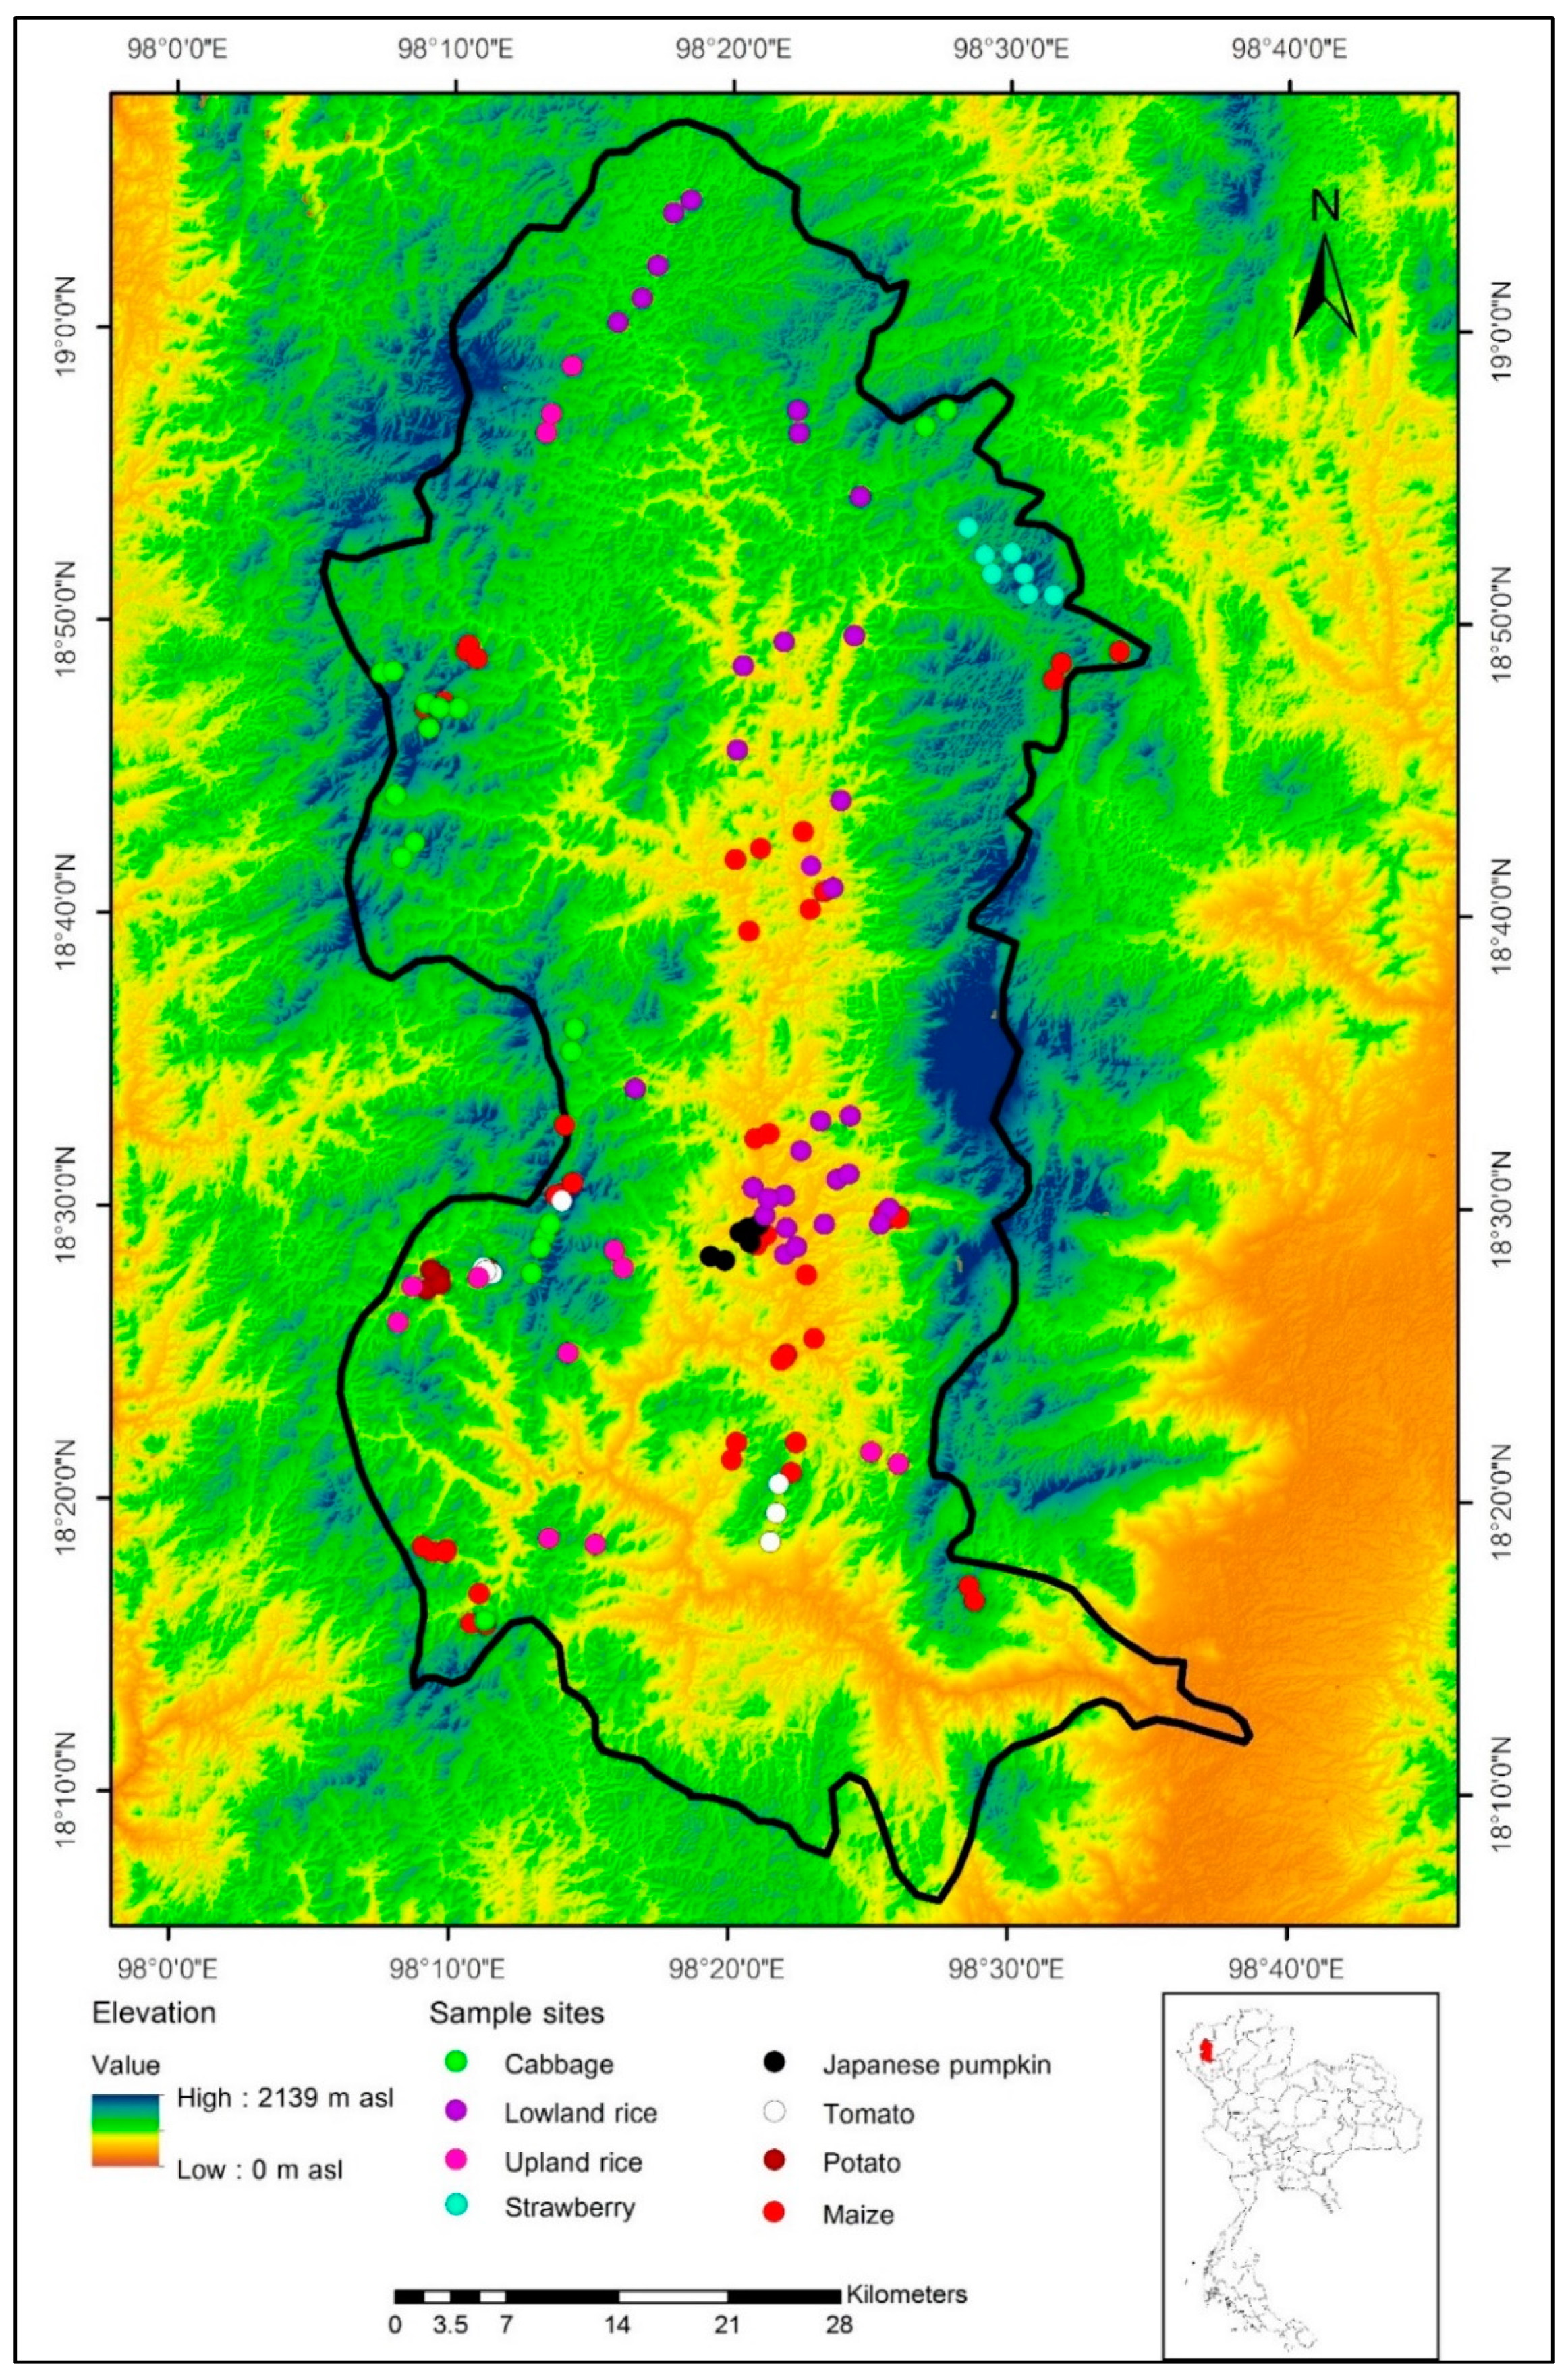
2.1. Study Area

The location of the Mae Chaem basin studied is 18°6′0′′ and 19°10′0′′ N between 98°4′0′′ and 98°34′0′′ E, covering an area of 3,853 km2. This area is in the Chiang Mai Province in the Northern part of Thailand. The highest point is the Doi Inthanon (Mount Inthanon), 2,535 m above sea level (a.s.l.), which is the highest peak of Thailand. The lowest elevation considered is 282 m a.s.l., which will allow researchers to compare various climates of different elevations [32]. These geographic parameters result in a wide spatial distribution of precipitation [33]; the annual precipitation was 1,145 mm (wet season from about May to September) and the average temperature was 27.5 °C in 2010 [34].
Vegetation types are varied following different elevations. Hill evergreen forest occurs above 2,500 m a.s.l. Tropical mixed pine forest ranges 900 to 1,500 m a.s.l., while dry dipterocarp and mixed deciduous forests are found below 1,000 m a.s.l. [35].
Based on World Reference Base for Soil Resources (WRB), the dominant soil is Acrisols [36]. Soil from the area is reddish-brown lateritic, and the soil texture being mostly sandy loam and clay. A high clay content is at the deeper soil layer. The soil bulk density range is 1.16–1.41 Mg m−3 and the maximum water holding capacity is 41.42%–56.78%. The soil is generally acidic, with pH ranging between 5.0 and 5.8. The organic matter range is 2.60–3.86% [37].

2.2. Soil Sampling and Analysis

Soil from a total of 138 sites were collected from the Mae Chaem basin within the study area at elevations of 400–1,500 m a.s.l.. The elevation was measured in each site because it was used as a parameter for controlling temperature and precipitation. At each site, soil samples from 0- to 30-cm depth were identified the color and texture. Then, three soil samples of each site were collected by using soil auger. Soil samples from nine crop types; cabbage (18 sites), upland rice (13 sites), lowland rice (31 sites), tomato (7 sites), strawberry (7 sites), potato (7 sites), Japanese pumpkin (6 sites), cape gooseberry (5 sites), and maize (44 sites) were collected during January 2017–June 2019 (Figure 1) and compared. However, the number of each crop sites were different because some crop types were grown by a small number of farmers.
A soil moisture meter was used to measure soil moisture in the field. The physical and chemical properties of whole soils were determined using the procedures described by the United States Department of Agriculture (USDA), National Soil Survey Center [38]. Soil bulk density was determined as the dry weight per unit volume of the soil core after a 24-hr drying period in an oven at 105°C [39]. Soil texture was measured by a hydrometer, and soil pH was determined in a 1:2.5 soil to water mixture using a pH meter. Organic carbon was determined by the method of Walkley and Black [40].

2.3. Estimating Soil Organic Carbon Density (SOCD)

SOCD was calculated using the following equation [41]:
SOCD h = i = 1 n D i × S O C i × B D i × ( 1 S i / 100 ) × 10 1 ,
where SOCD h is the total amount of SOC at depth h per unit area (Mg C ha−1); n is the number of layers considered; i represents the ith layer; D i is thickness (cm); S O C i is SOC content (g kg−1); B D i is bulk density (Mg m−3); and S i is the proportion (%) of coarse (> 2 mm) fragments in the ith layer.

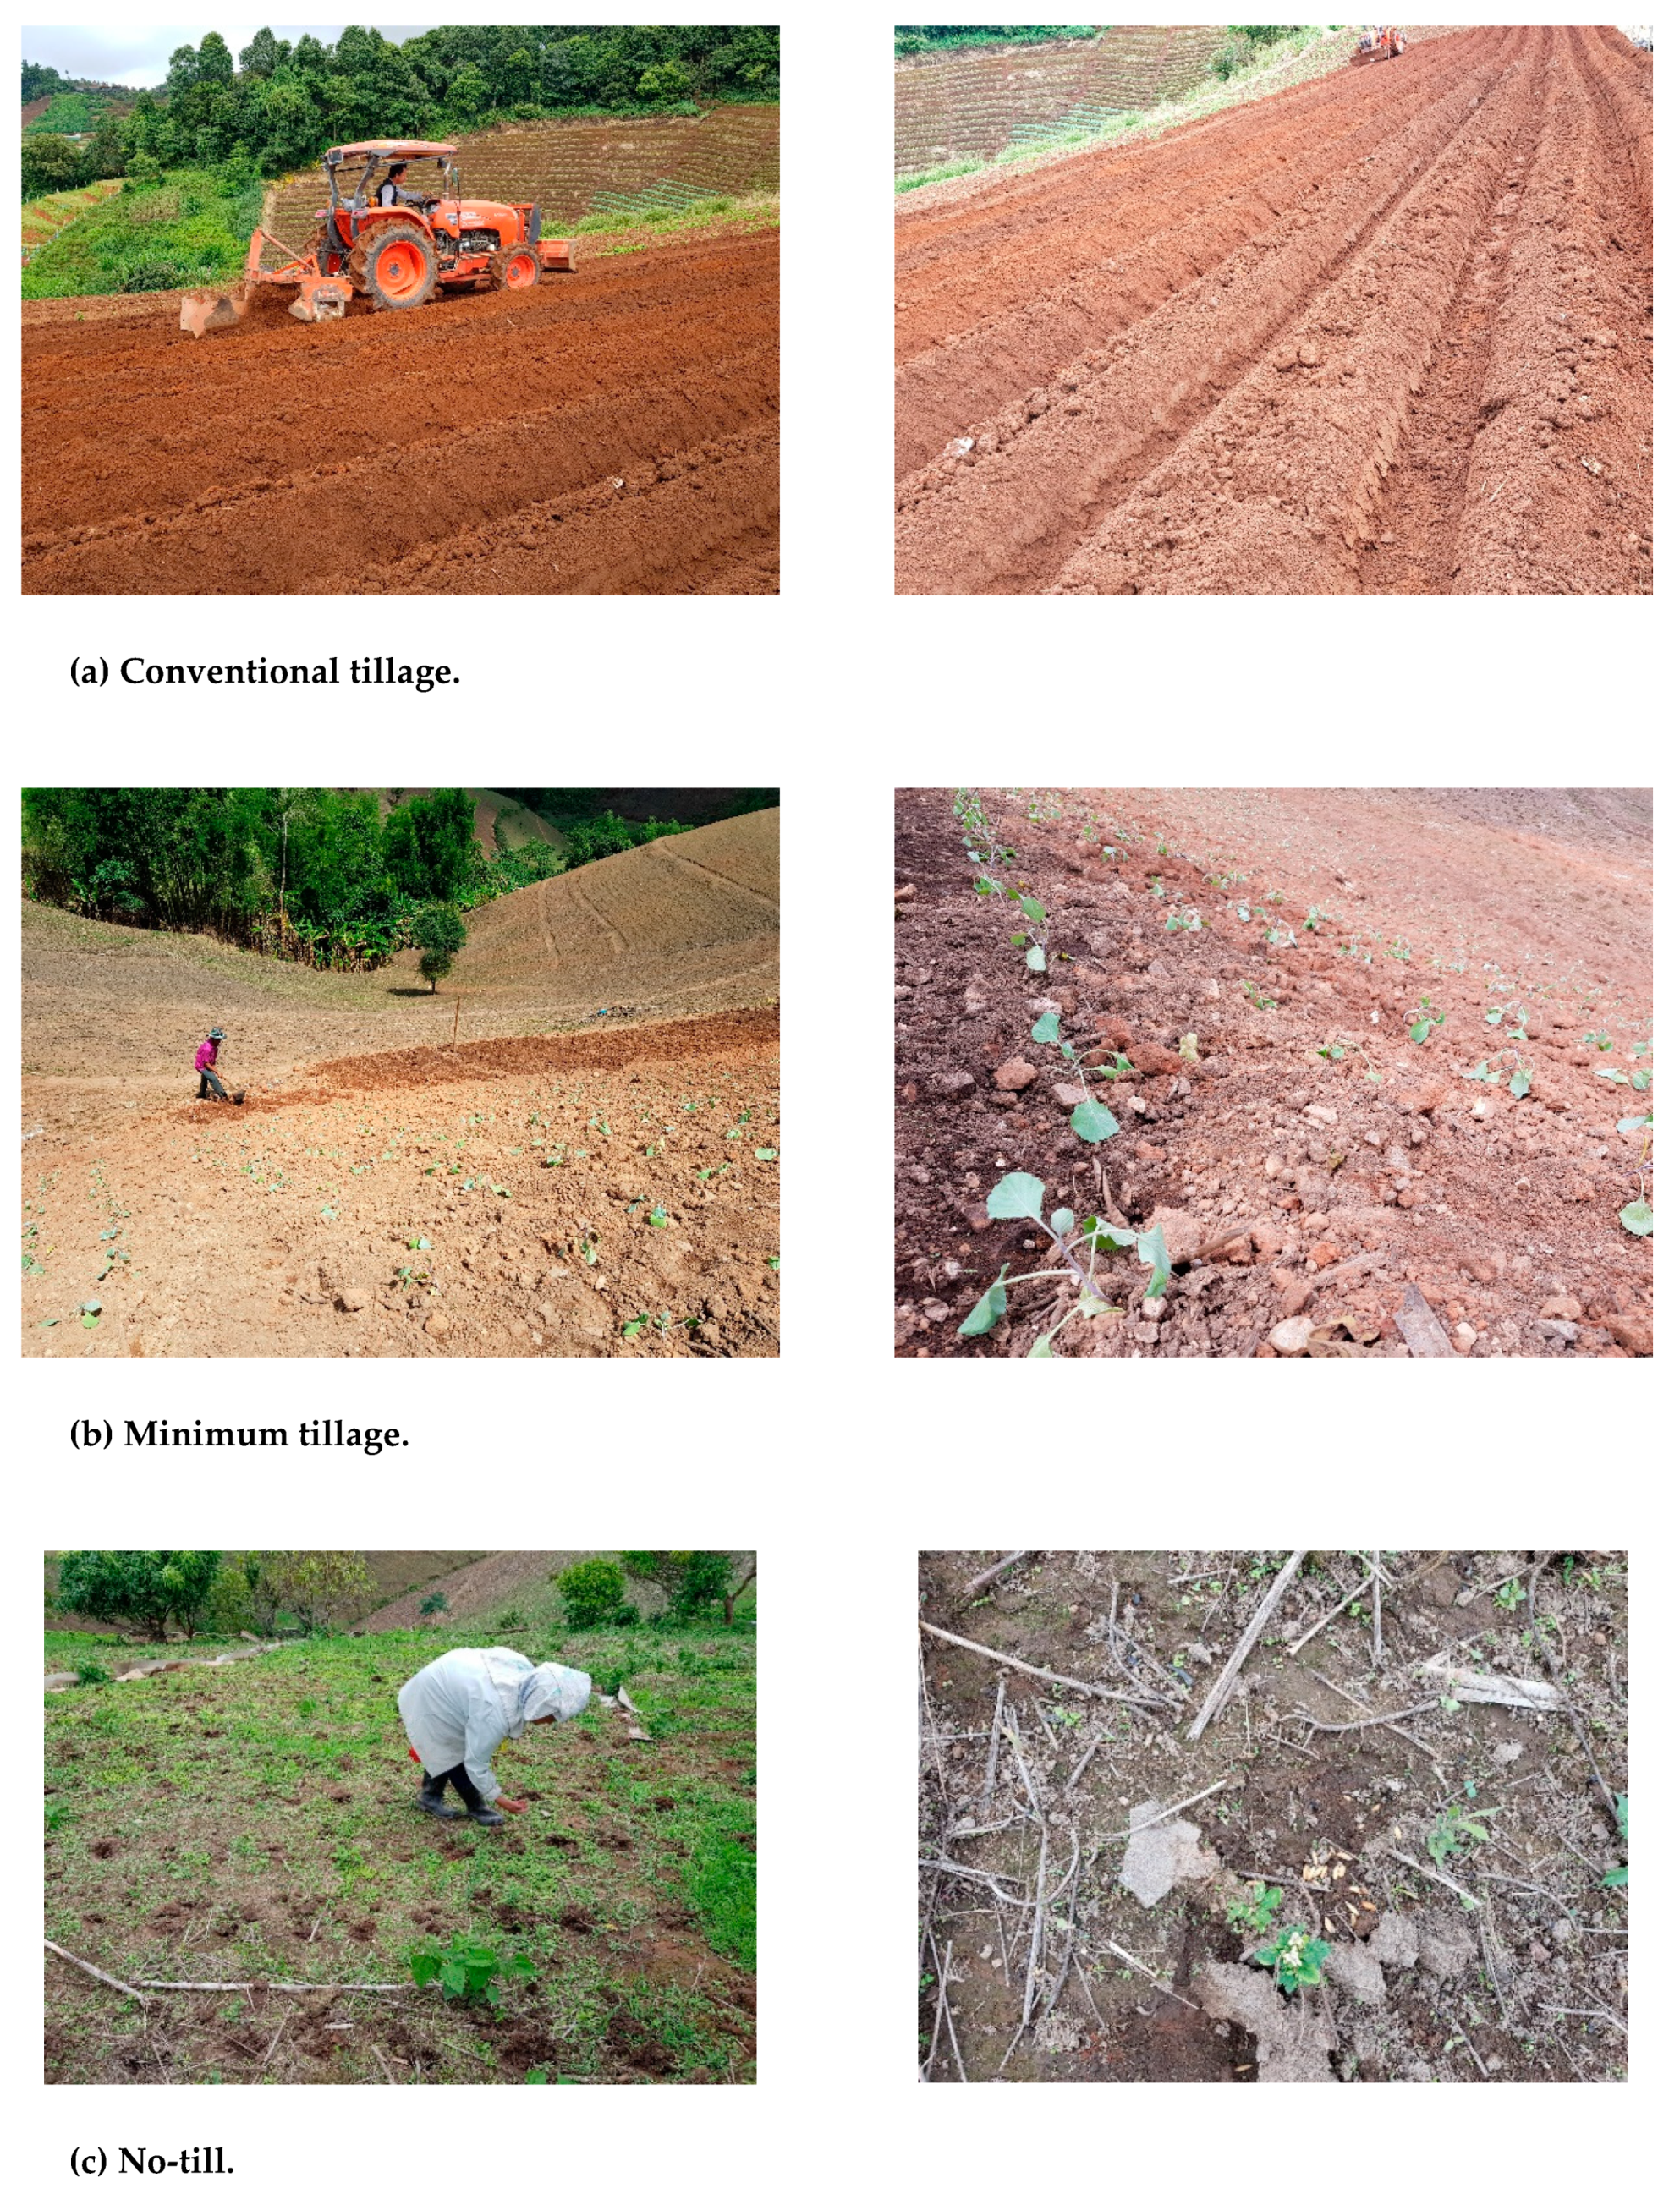
2.4. Management Practices

Management practice data were obtained from the farm owners at each sampling site. At each site, the farmer was asked about crop type, tillage methods, rates and types of application of fertilizers, manure, crop residues management, and crop yields.

2.5. Statistical Analysis

SPSS Version 20.0 (Chicago, IL, USA) was employed to analyze statistics including mean and standard deviation, while the Kolmogorov–Smirnov (K–S) test was run to determine whether the distribution of quantitative data was normal. The t-test was conducted to identify differences in top SOCD across all tillage methods. The variance inflation factor (VIF) and tolerance (TOL) indices were used for testing the collinearity diagnostics between independent variables. A clear signal of multicollinearity was considered if VIF < 10 and TOL > 0.10 [42]. Pearson’s correlation was used to identify the relationship between two variables by fitting a linear equation. If the correlation value of any variable > 0.8, it was not considered due to avoiding the multicollinearity among variables. Stepwise multiple regression analysis was conducted to investigate the relationship between top SOCD and environment (elevation), fertilization, and crop yields.

3. Results

3.1. Soil Properties, Management Practices, and Top SOCD in Agricultural Highland Areas

In general, the bulk density range was 1.10–1.55 Mg m−3; the soil moisture range was 6.23–30.21%; sand accounts for 40.42–58.0% of soil content; silt accounts for 15.54–20.80% of soil content. Clay accounts for 21.48–39.51% of soil content, so the majority of the soil content studied here was sandy clay loam. However, the soil texture of Japanese pumpkin and maize areas were clay loam, while the upland rice area was predominantly sandy clay. Fine particles (clay plus silt) accounts for 45.57–62.39% of the soil content; and the pH range was 5.40–5.97 (Table 1).
Elevation, bulk density, and clay content were significantly positively correlated with top SOCD (r = 0.522 **, 0.210 * and 0.367 **, respectively), whereas sand content was significantly negatively correlated with top SOCD (r = −0.351 **). Elevation was significantly negatively correlated with bulk density and sand content (r = −0.176 *, and −0.213 *, respectively) and a significantly positively correlated with clay content (r = 0.203 *) (Table 2).
Three types of soil tillage used for land preparation were identified in our study: (1) conventional tillage (Figure 2a); the practice in which farmers use machines such as the tractor and discs to turn over and loosen the soil before planting cabbage, lowland rice, strawberry, potato, and maize (Table 3); (2) minimum tillage (Figure 2b); the practice that minimizes the disruption of soil by using special equipment (e.g., hoe) to plant cabbage, tomato, strawberry, and maize (Table 3); and (3) no-till (Figure 2c); the practice that causes even less disturbance to the soil in which as little soil as possible is disturbed in the process of sowing seeds. The no-till method was used for planting upland rice, tomato, Japanese pumpkin, and cape gooseberry. The strawberry plantation applied the highest average amount of N, P2O5, and K2O fertilizers, which were 567.7, 363.27, and 957.04 kg ha−1, respectively. In contrast, the lowest average levels of N (15.12 kg ha−1), P2O5 (7.66 kg ha−1), and K2O (4.34 kg ha−1) fertilizers were used in upland rice plantations. Maize residue was burnt after harvesting, while other crop areas were left in the fields (Table 3).
The highest top SOCD was found in upland rice area with the average of 58.71 Mg C ha−1. This might be due to no-tillage practices combined with the fact that the practice of burning of rice residue was not employed, these characteristics, taken together, cause minimal disturbance to the soil and crop residues were not removed from the field. The amount of top SOCD in areas used to grow maize were the second, after upland rice, followed by strawberry, cabbage, tomato, lowland rice, Japanese pumpkin, potato, and cape gooseberry, with average top SOCD values of 52.48, 49.0, 48.05, 42.14, 35.21, 34.0, 29.45, and 19.56 Mg C ha−1, respectively (Table 3).

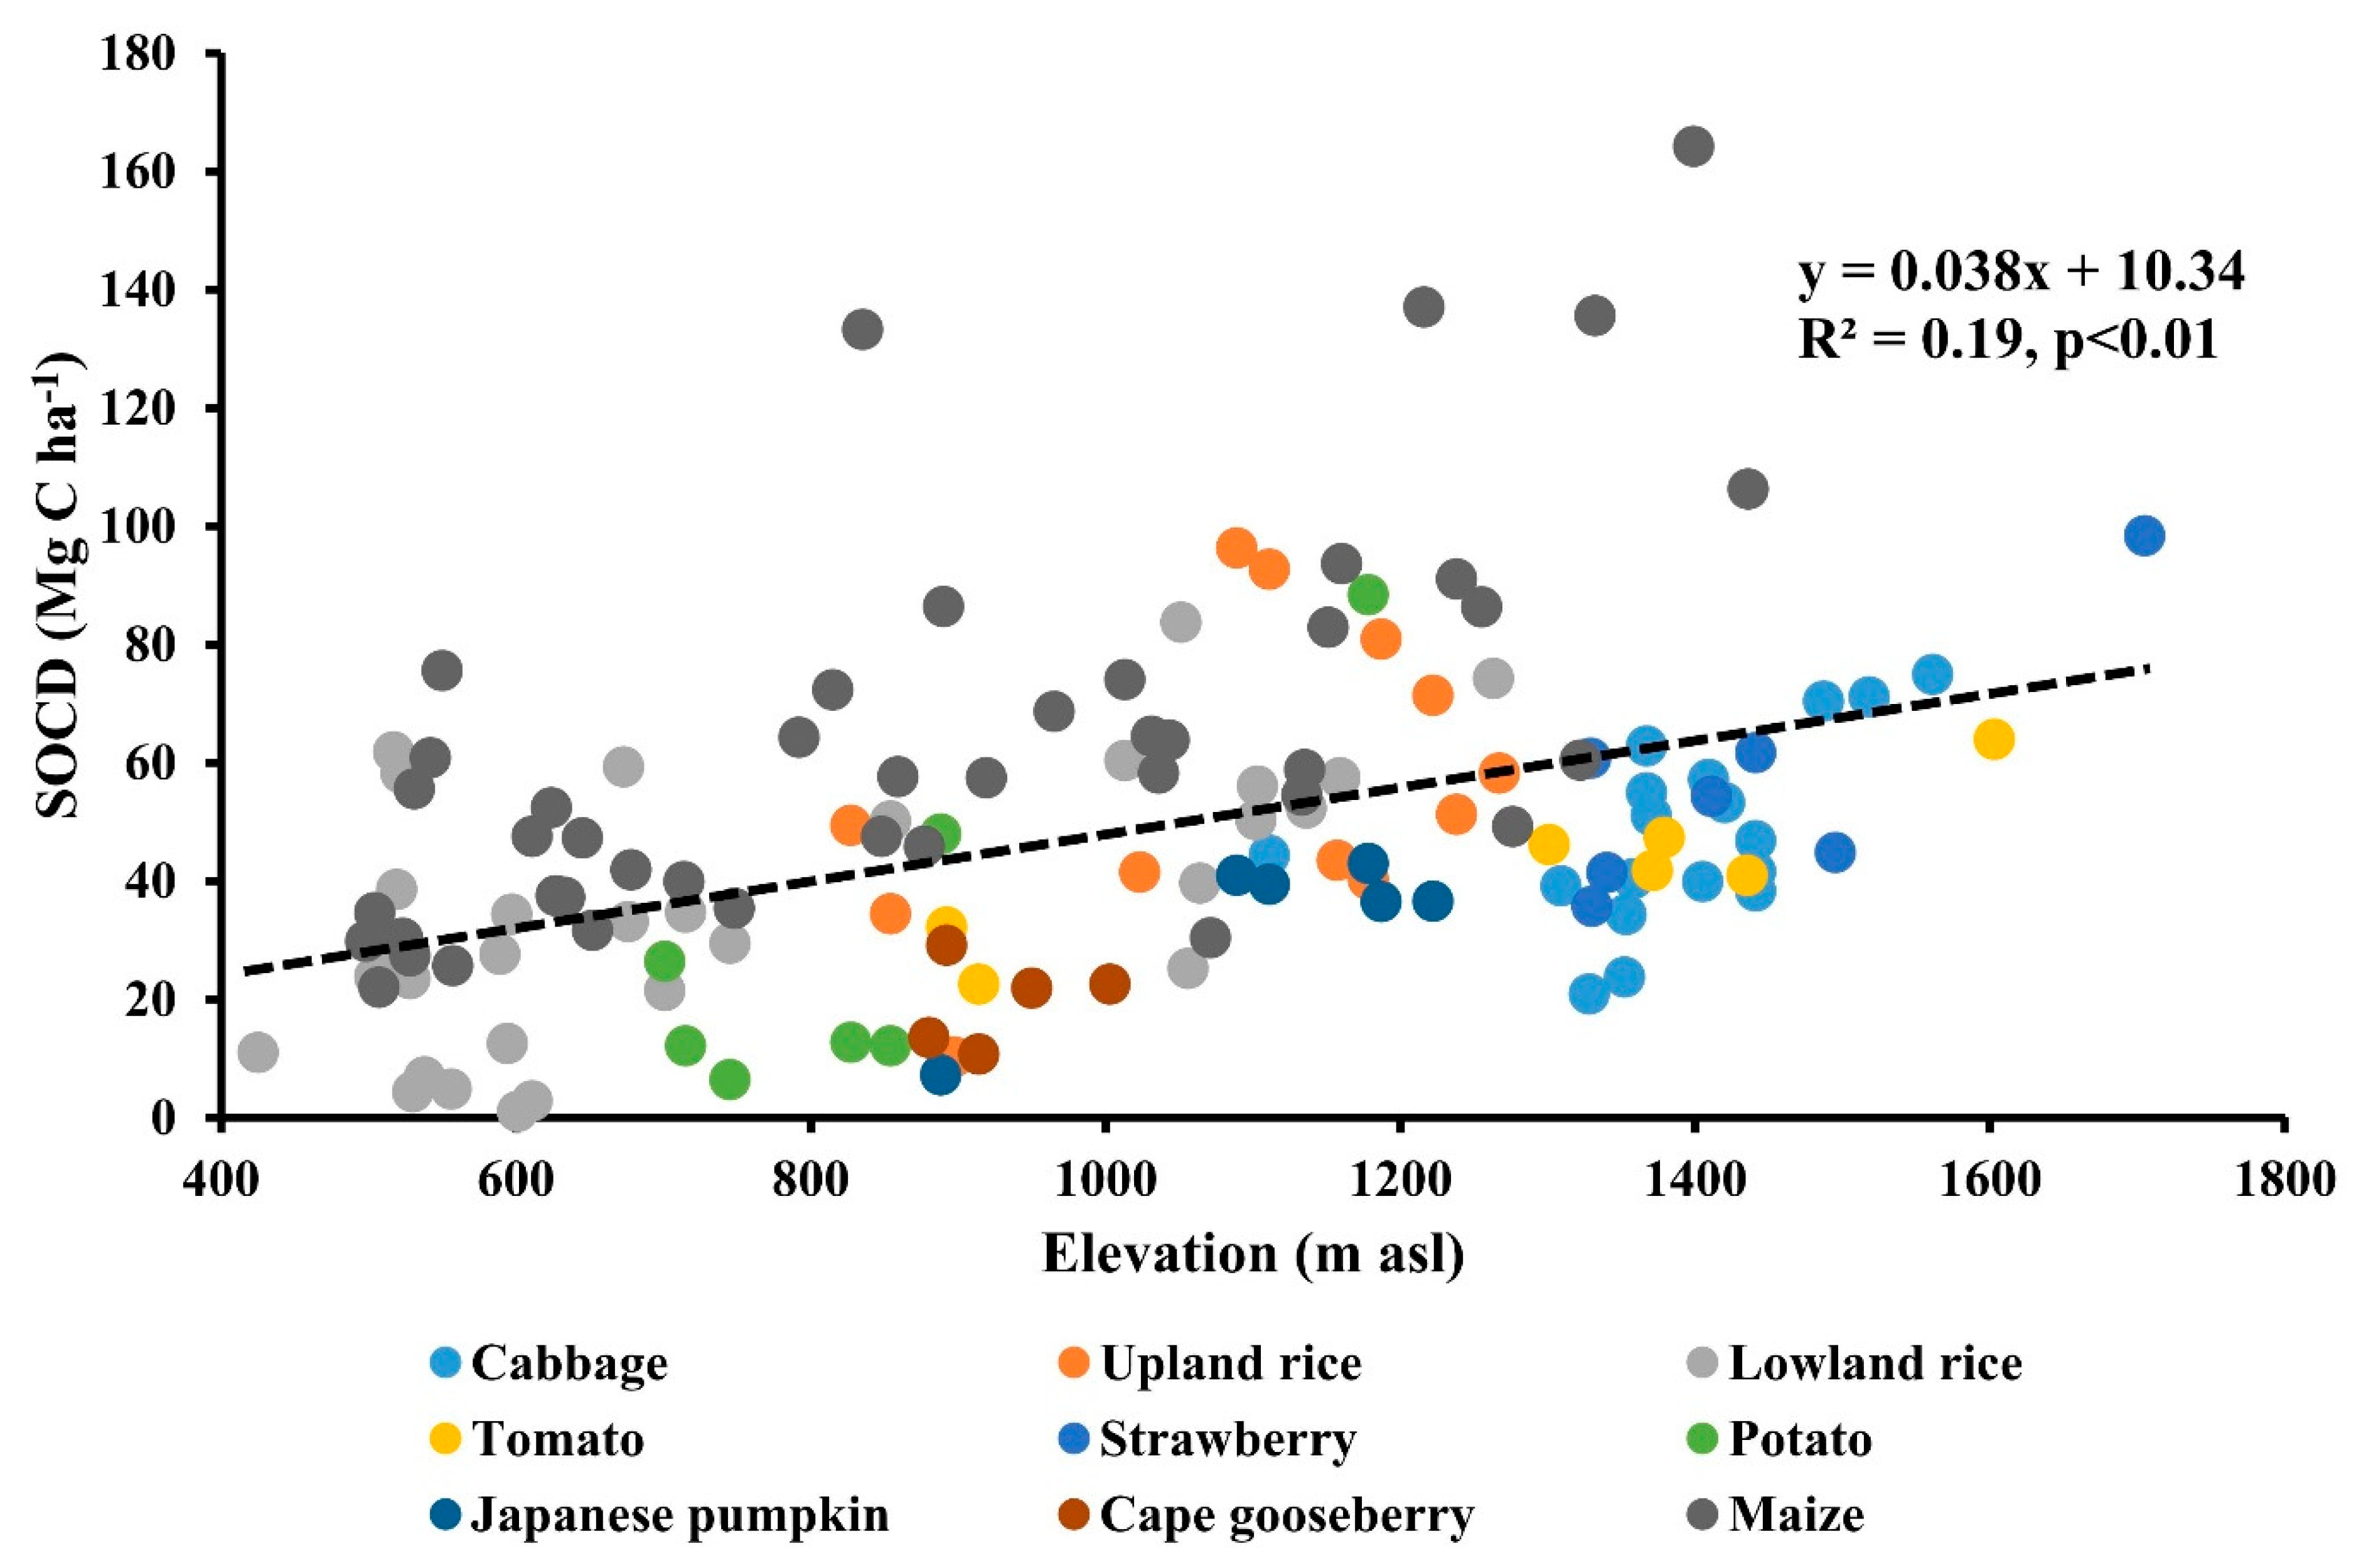
3.2. Relationships Between Top SOCD and Elevation

The results showed that the top SOCD had a positive relationship with elevation at all sites (R2 = 0.19; p < 0.01; Figure 3), explaining the observation that at high elevations, levels of top SOCD were also high. However, altitude is not a variable directly influencing top SOCD, but a variety of climatic functions associated with different aspects of altitude do affect SOC budget.

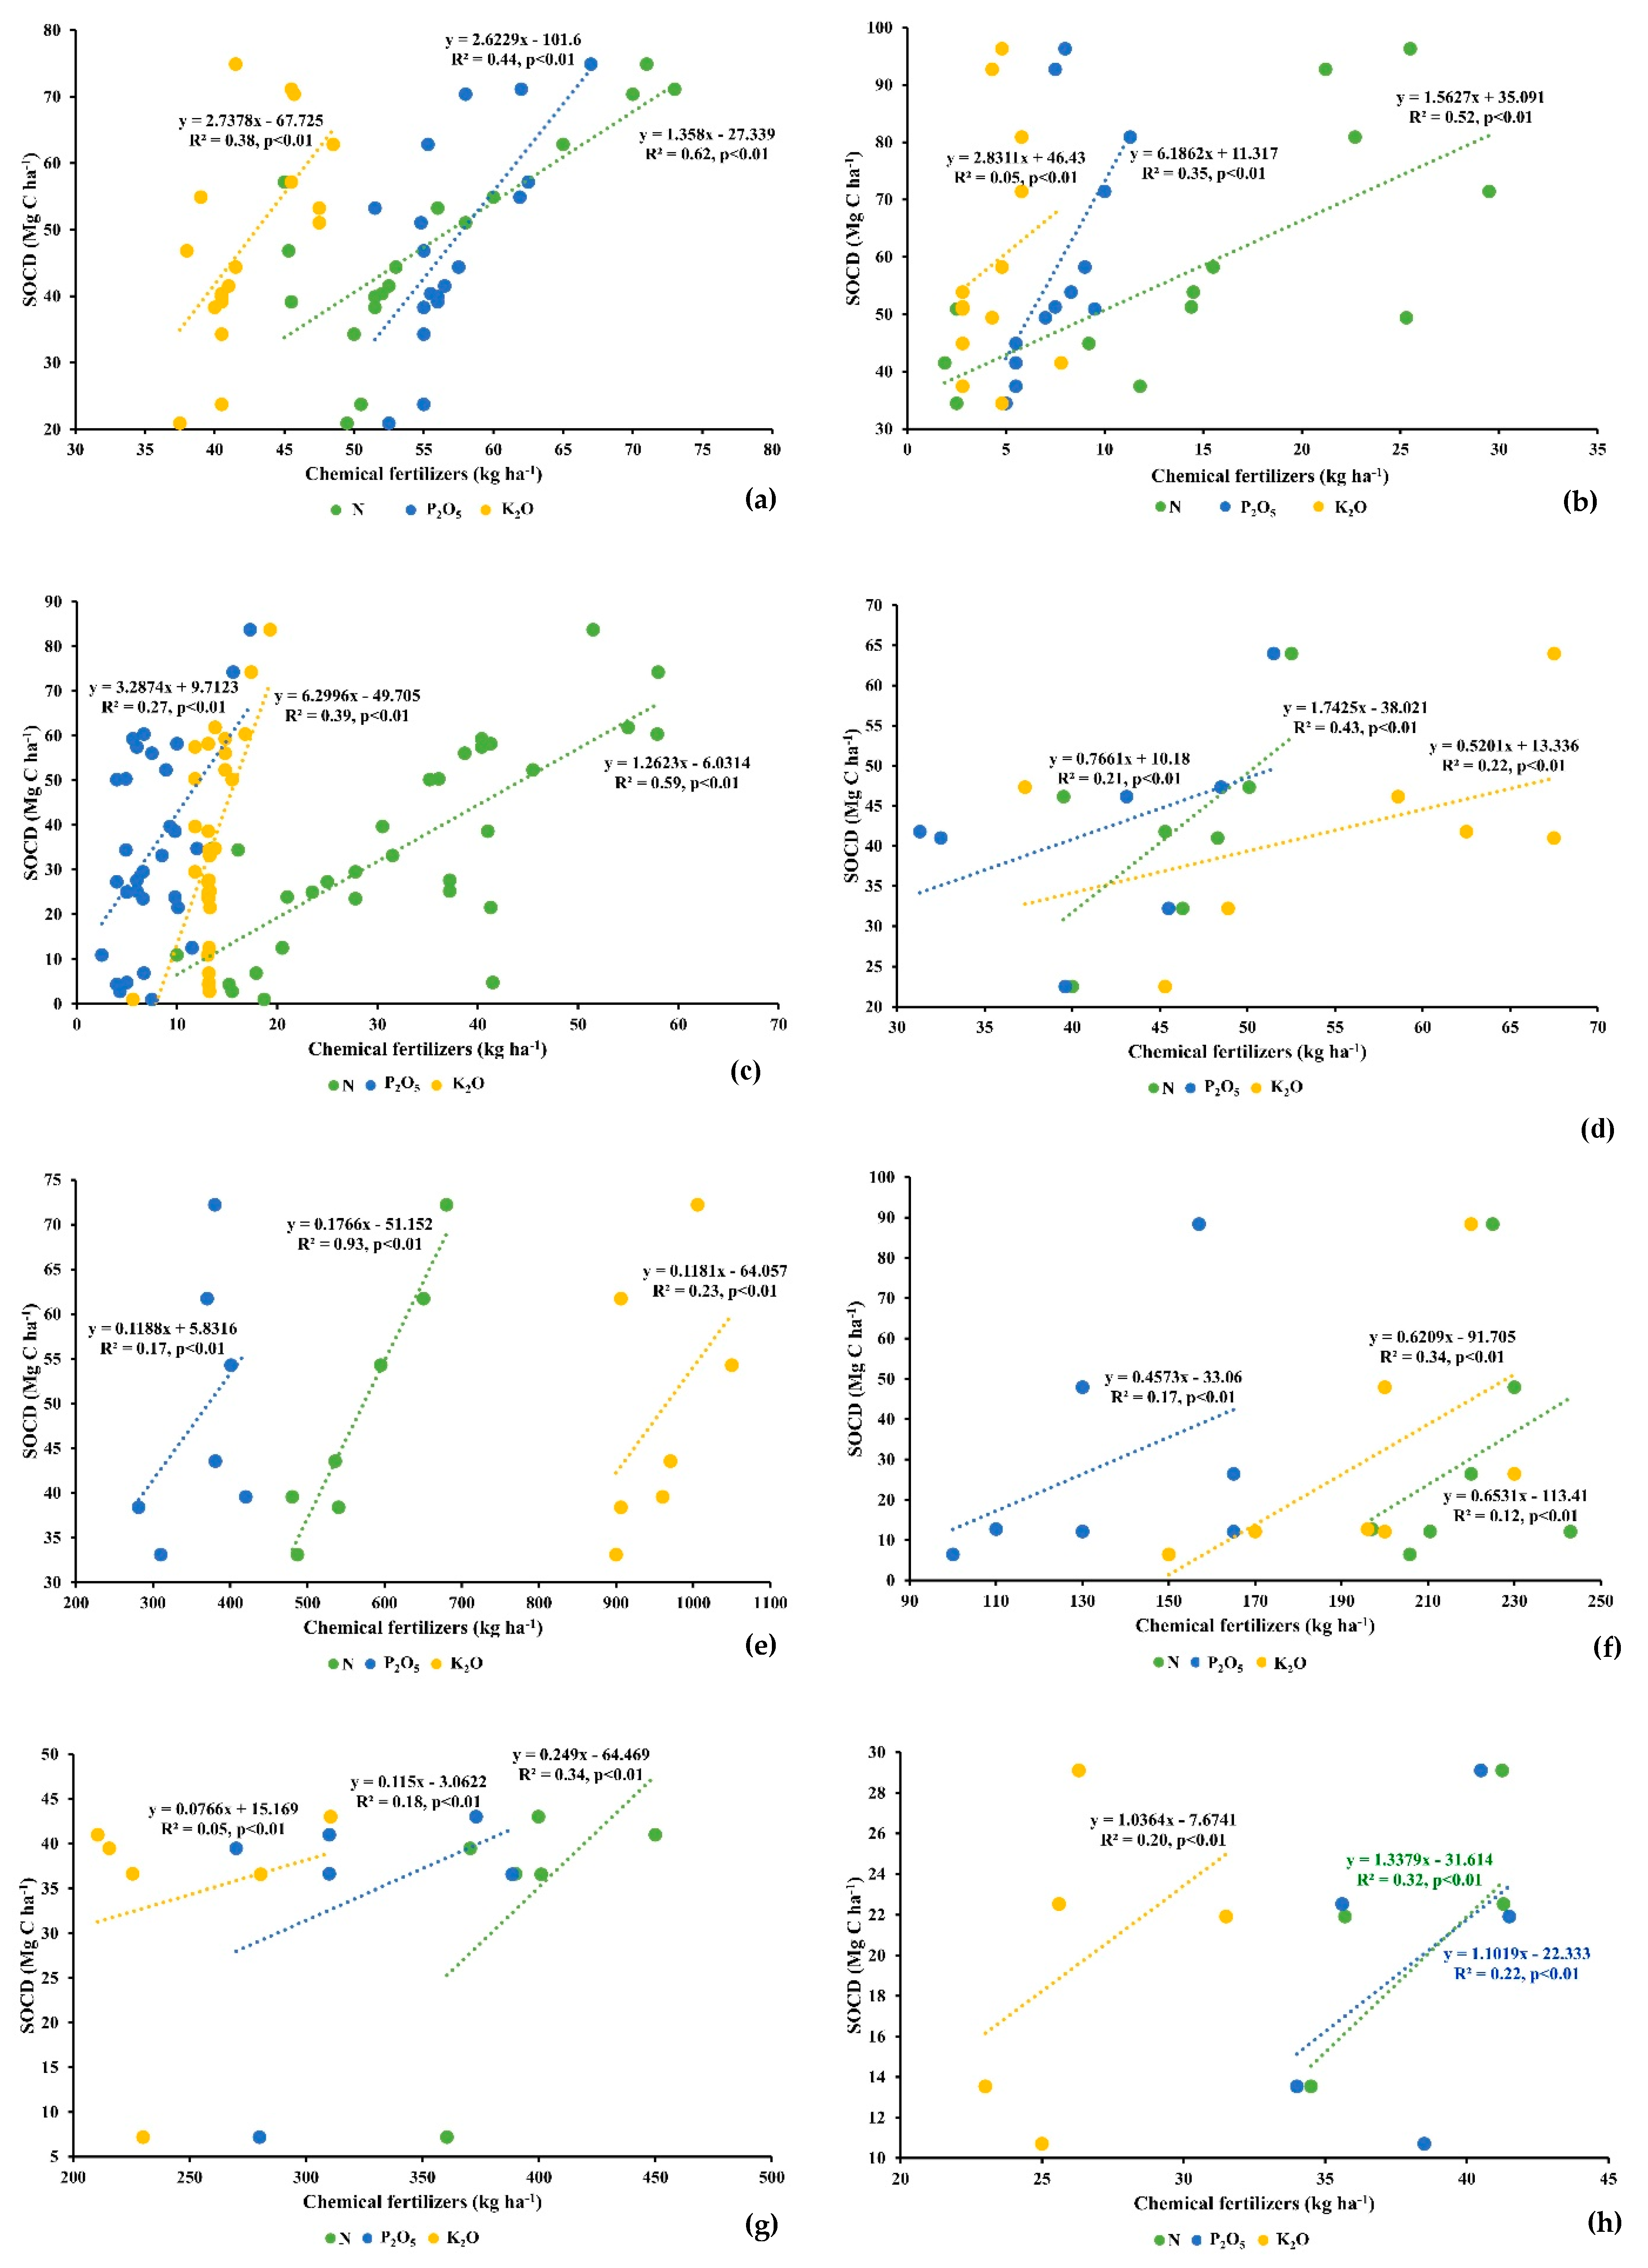
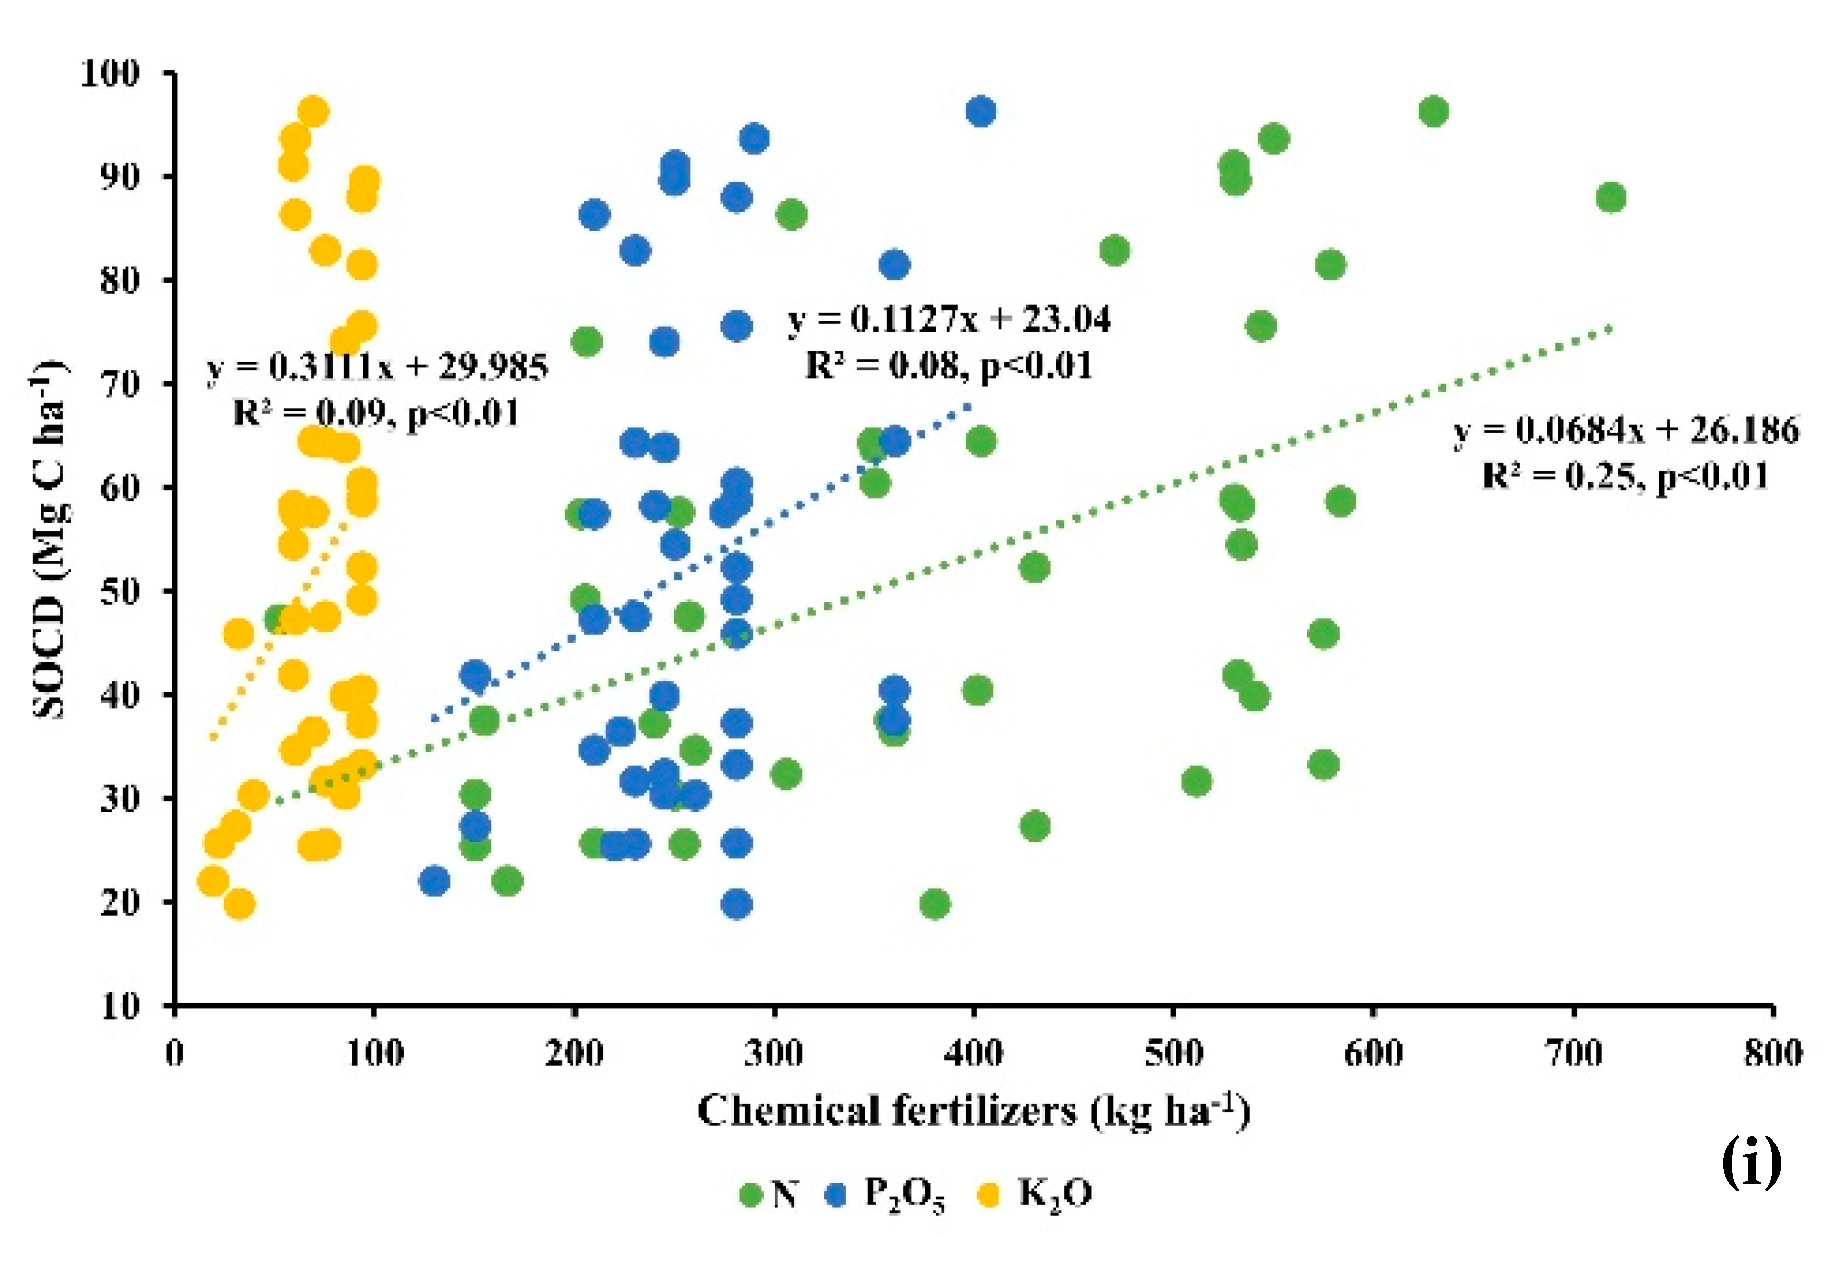
3.3. Relationships Between Top SOCD and Chemical Fertilizers

Application rates of N, P2O5, and K2O fertilizers had a positive relationship with top SOCD (Figure 4), indicating that increasing of chemical fertilizer application can lead to increases in top SOCD. N fertilizer use here had the highest positive relationship with top SOCD in the strawberry, cabbage, lowland rice, and upland rice areas, with the R2 values of 0.93 (Figure 4e), 0.62 (Figure 4a), 0.59 (Figure 4c), and 0.52 (Figure 4b) (p < 0.01), respectively. The P2O5 fertilizer could explain 44% and 35% of the changes of top SOCD observed in the areas growing cabbage and upland rice, respectively (Figure 4a,b), while the 39% and 38% could be explained by the amount of K2O fertilizer used to grow in areas planted with lowland rice (Figure 4c), and cabbage (Figure 4a), respectively.
We found that only areas planted with upland rice, tomato and potato applied cattle manure, with average levels applied being 0.98, 0.87, and 1.02 Mg ha−1, respectively (Table 3). As for manure application, however, this study did not detect any significant relationships between manure and any of the tested soil or geographic attributes. This may be because fewer farmers applied the cattle manure than other fertilizers here.

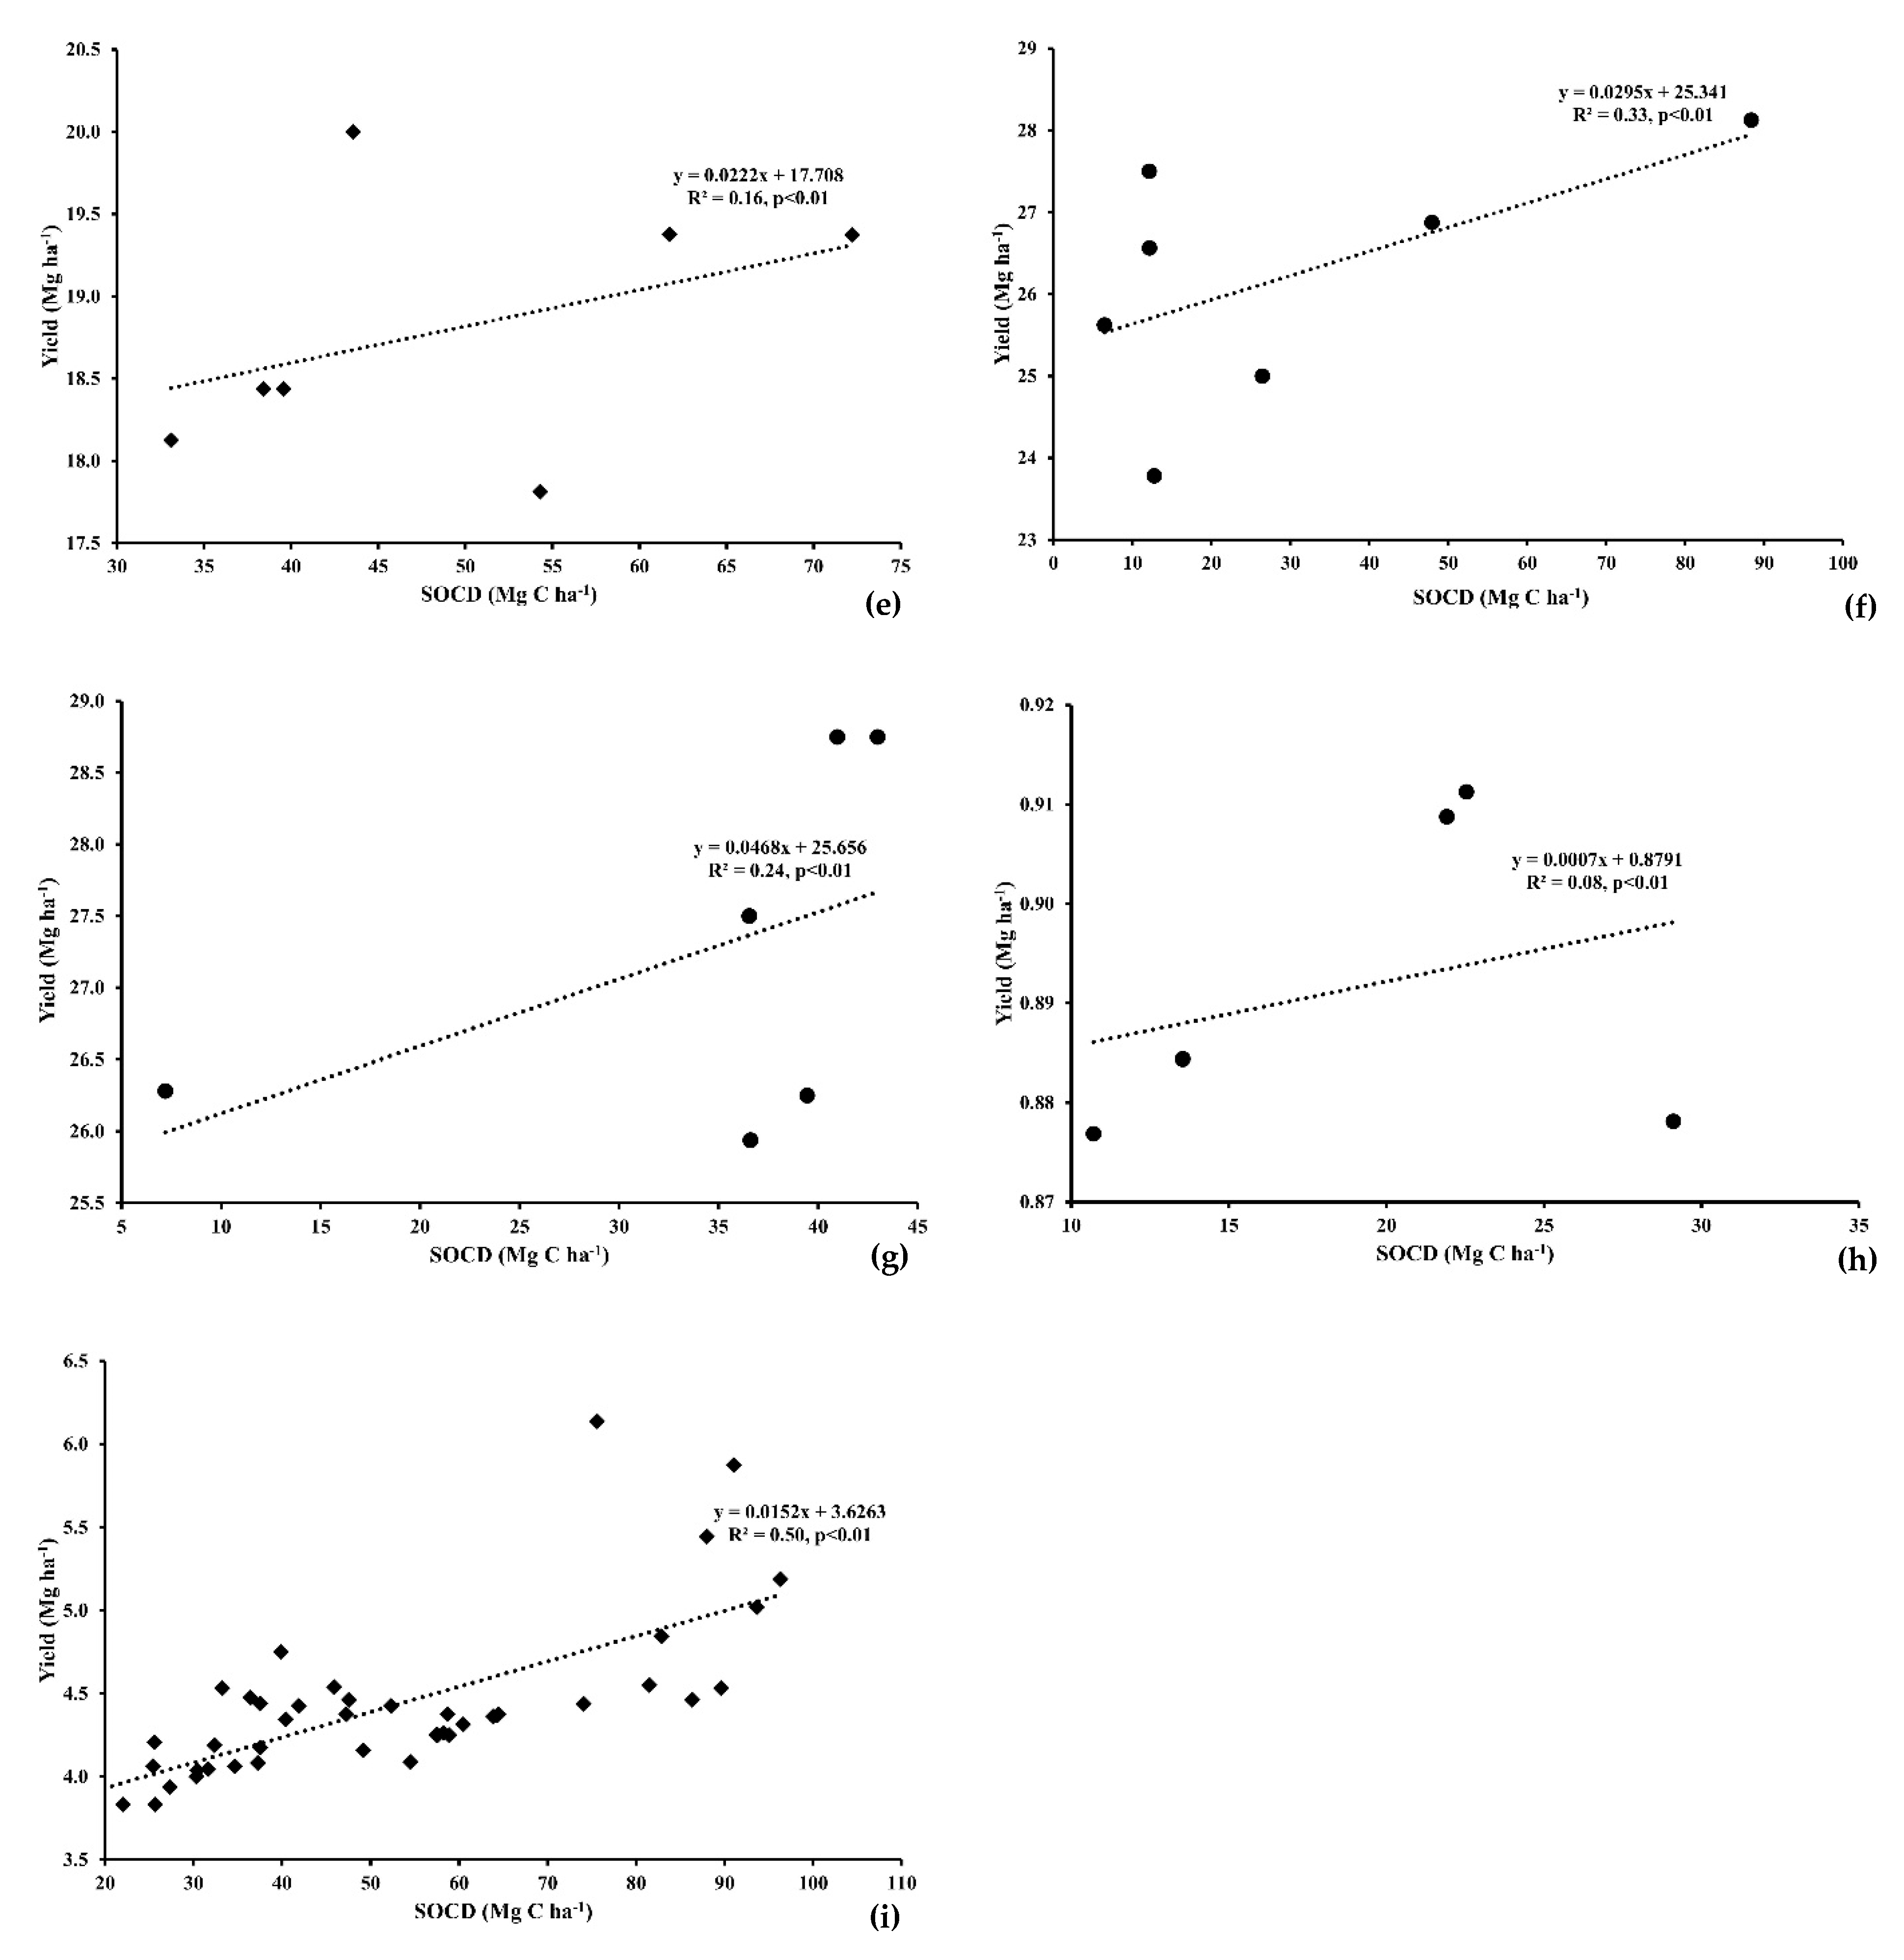
3.4. Relationships Between Top SOCD and Crop Yields

As shown in Figure 5, crop yields were positively correlated with increasing levels of top SOCD. This finding could explain the observation that cabbage yield increases 53% (Figure 5a), followed lowland rice, upland rice, and maize yields, at 52% (Figure 5c), 51% (Figure 5b), and 50% (Figure 5i), respectively. These results indicate that increasing of top SOCD can increase crop yields.

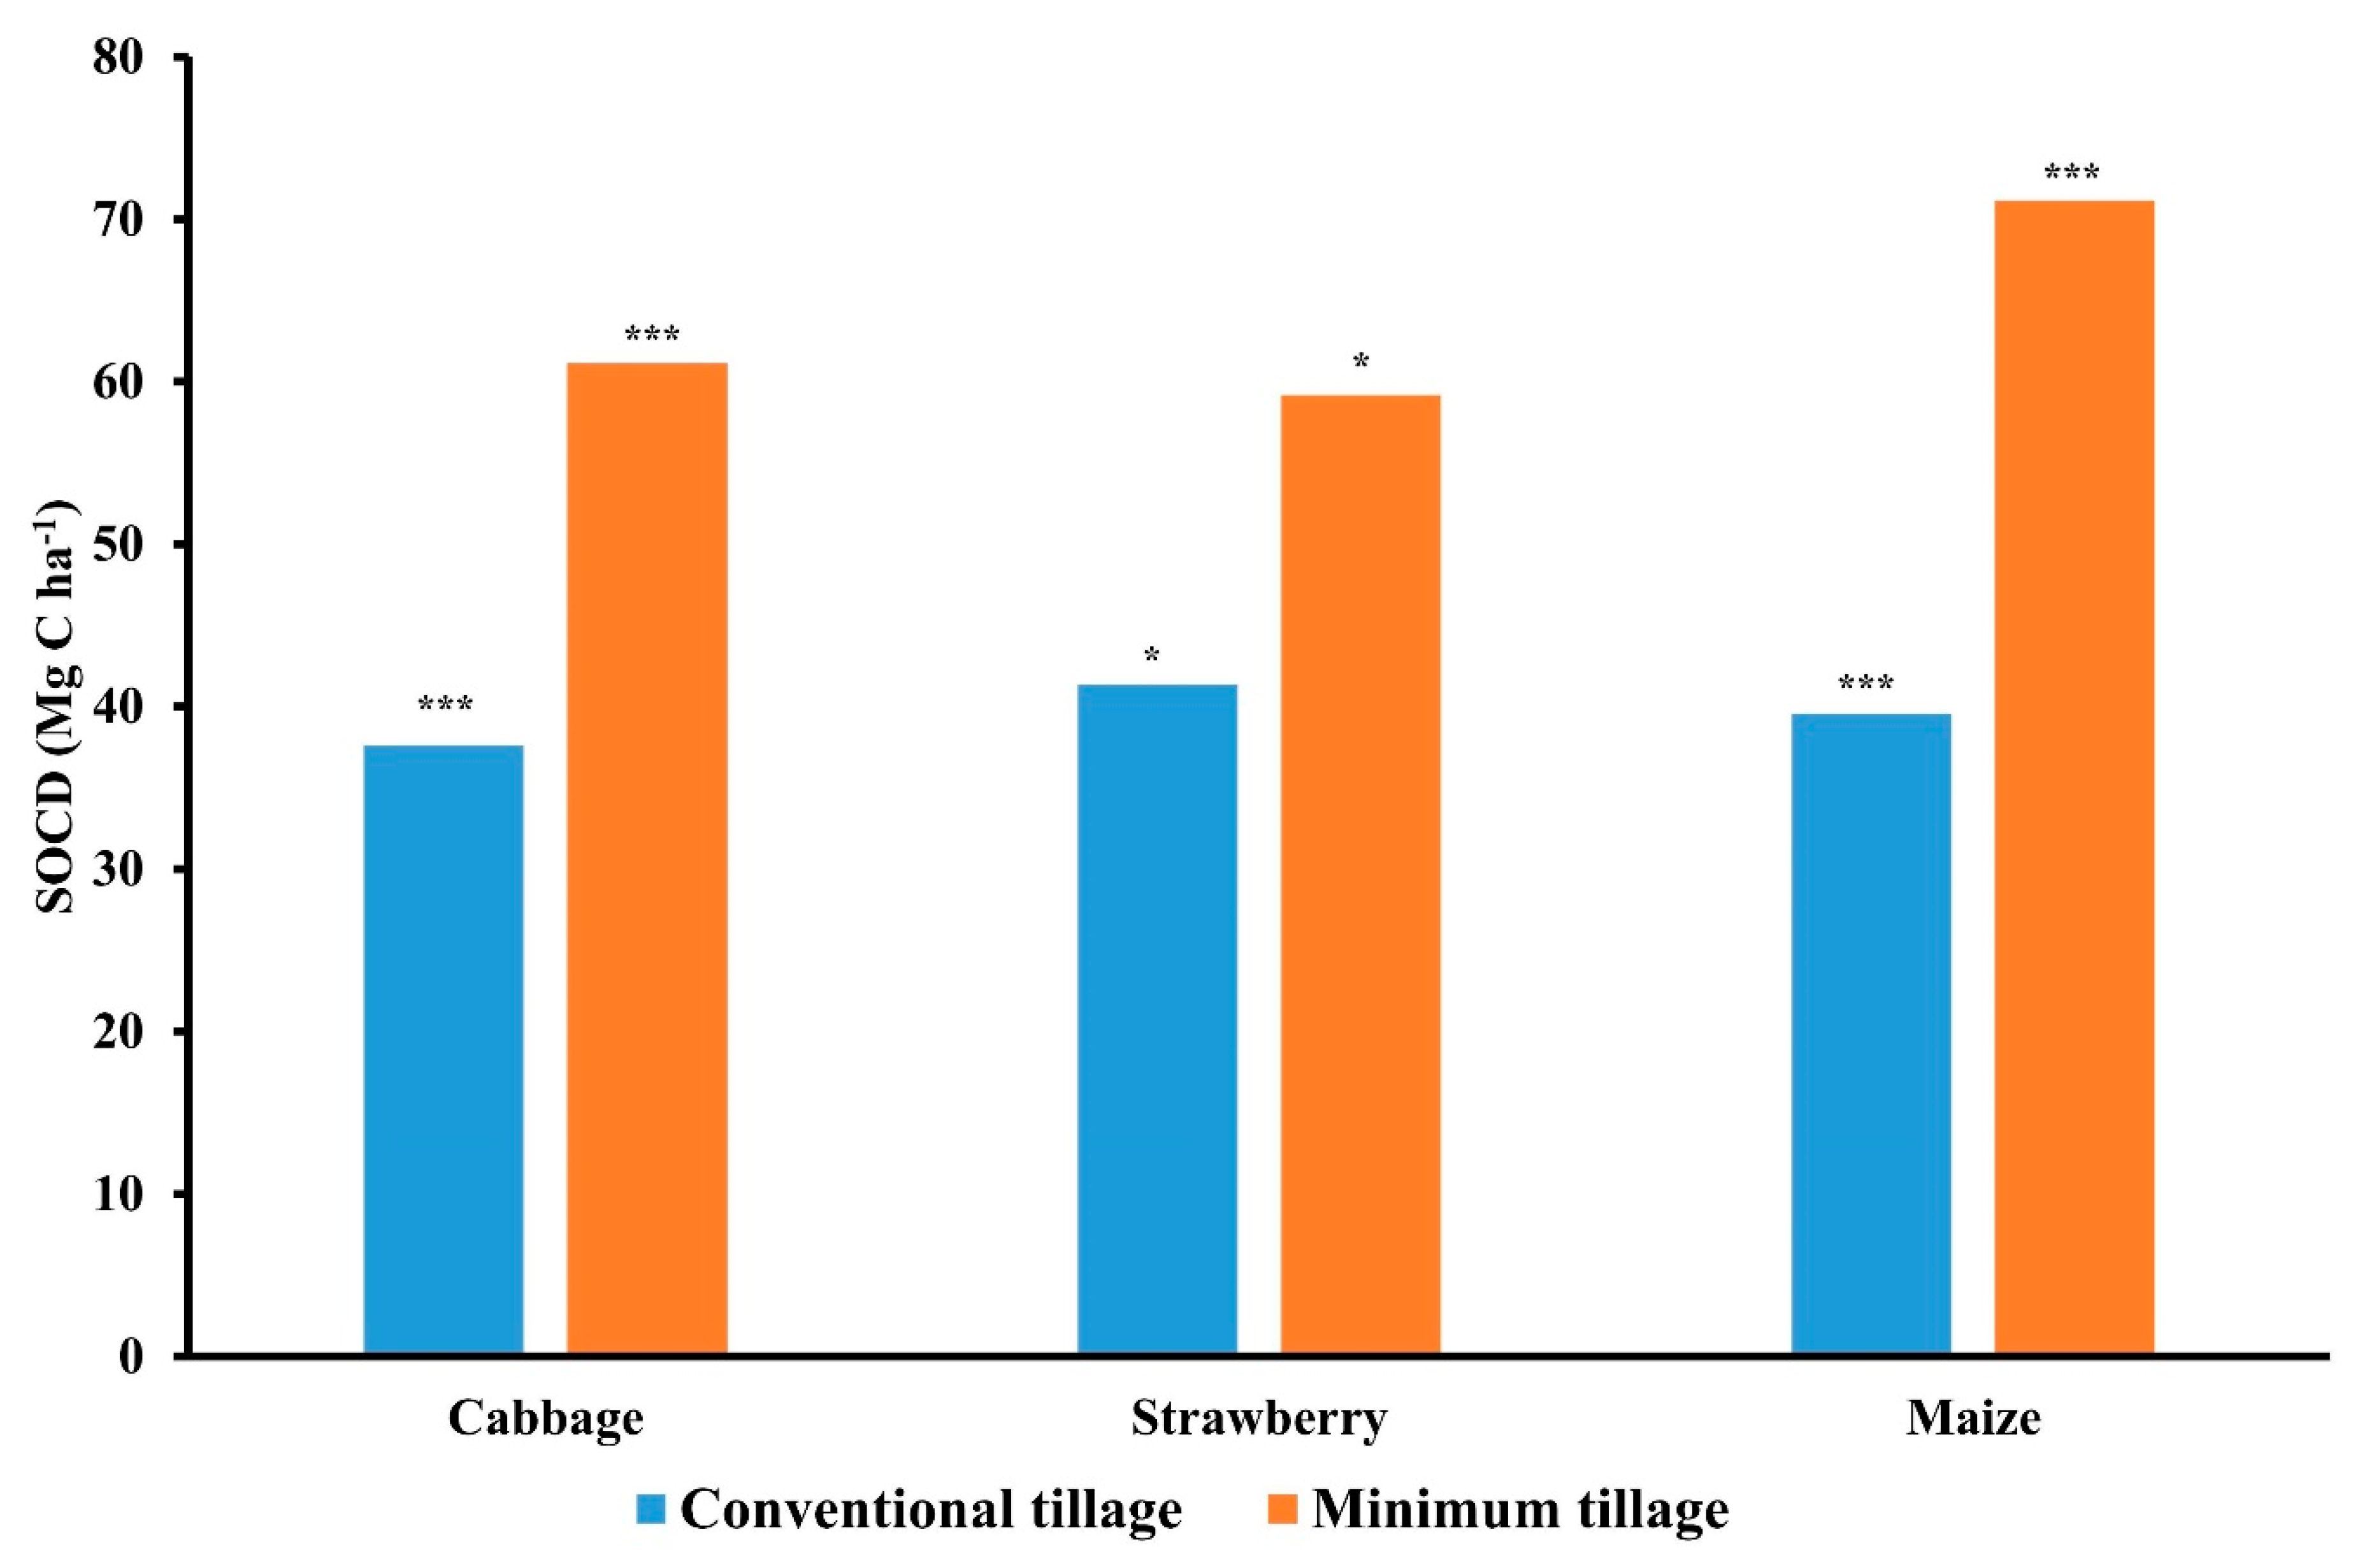
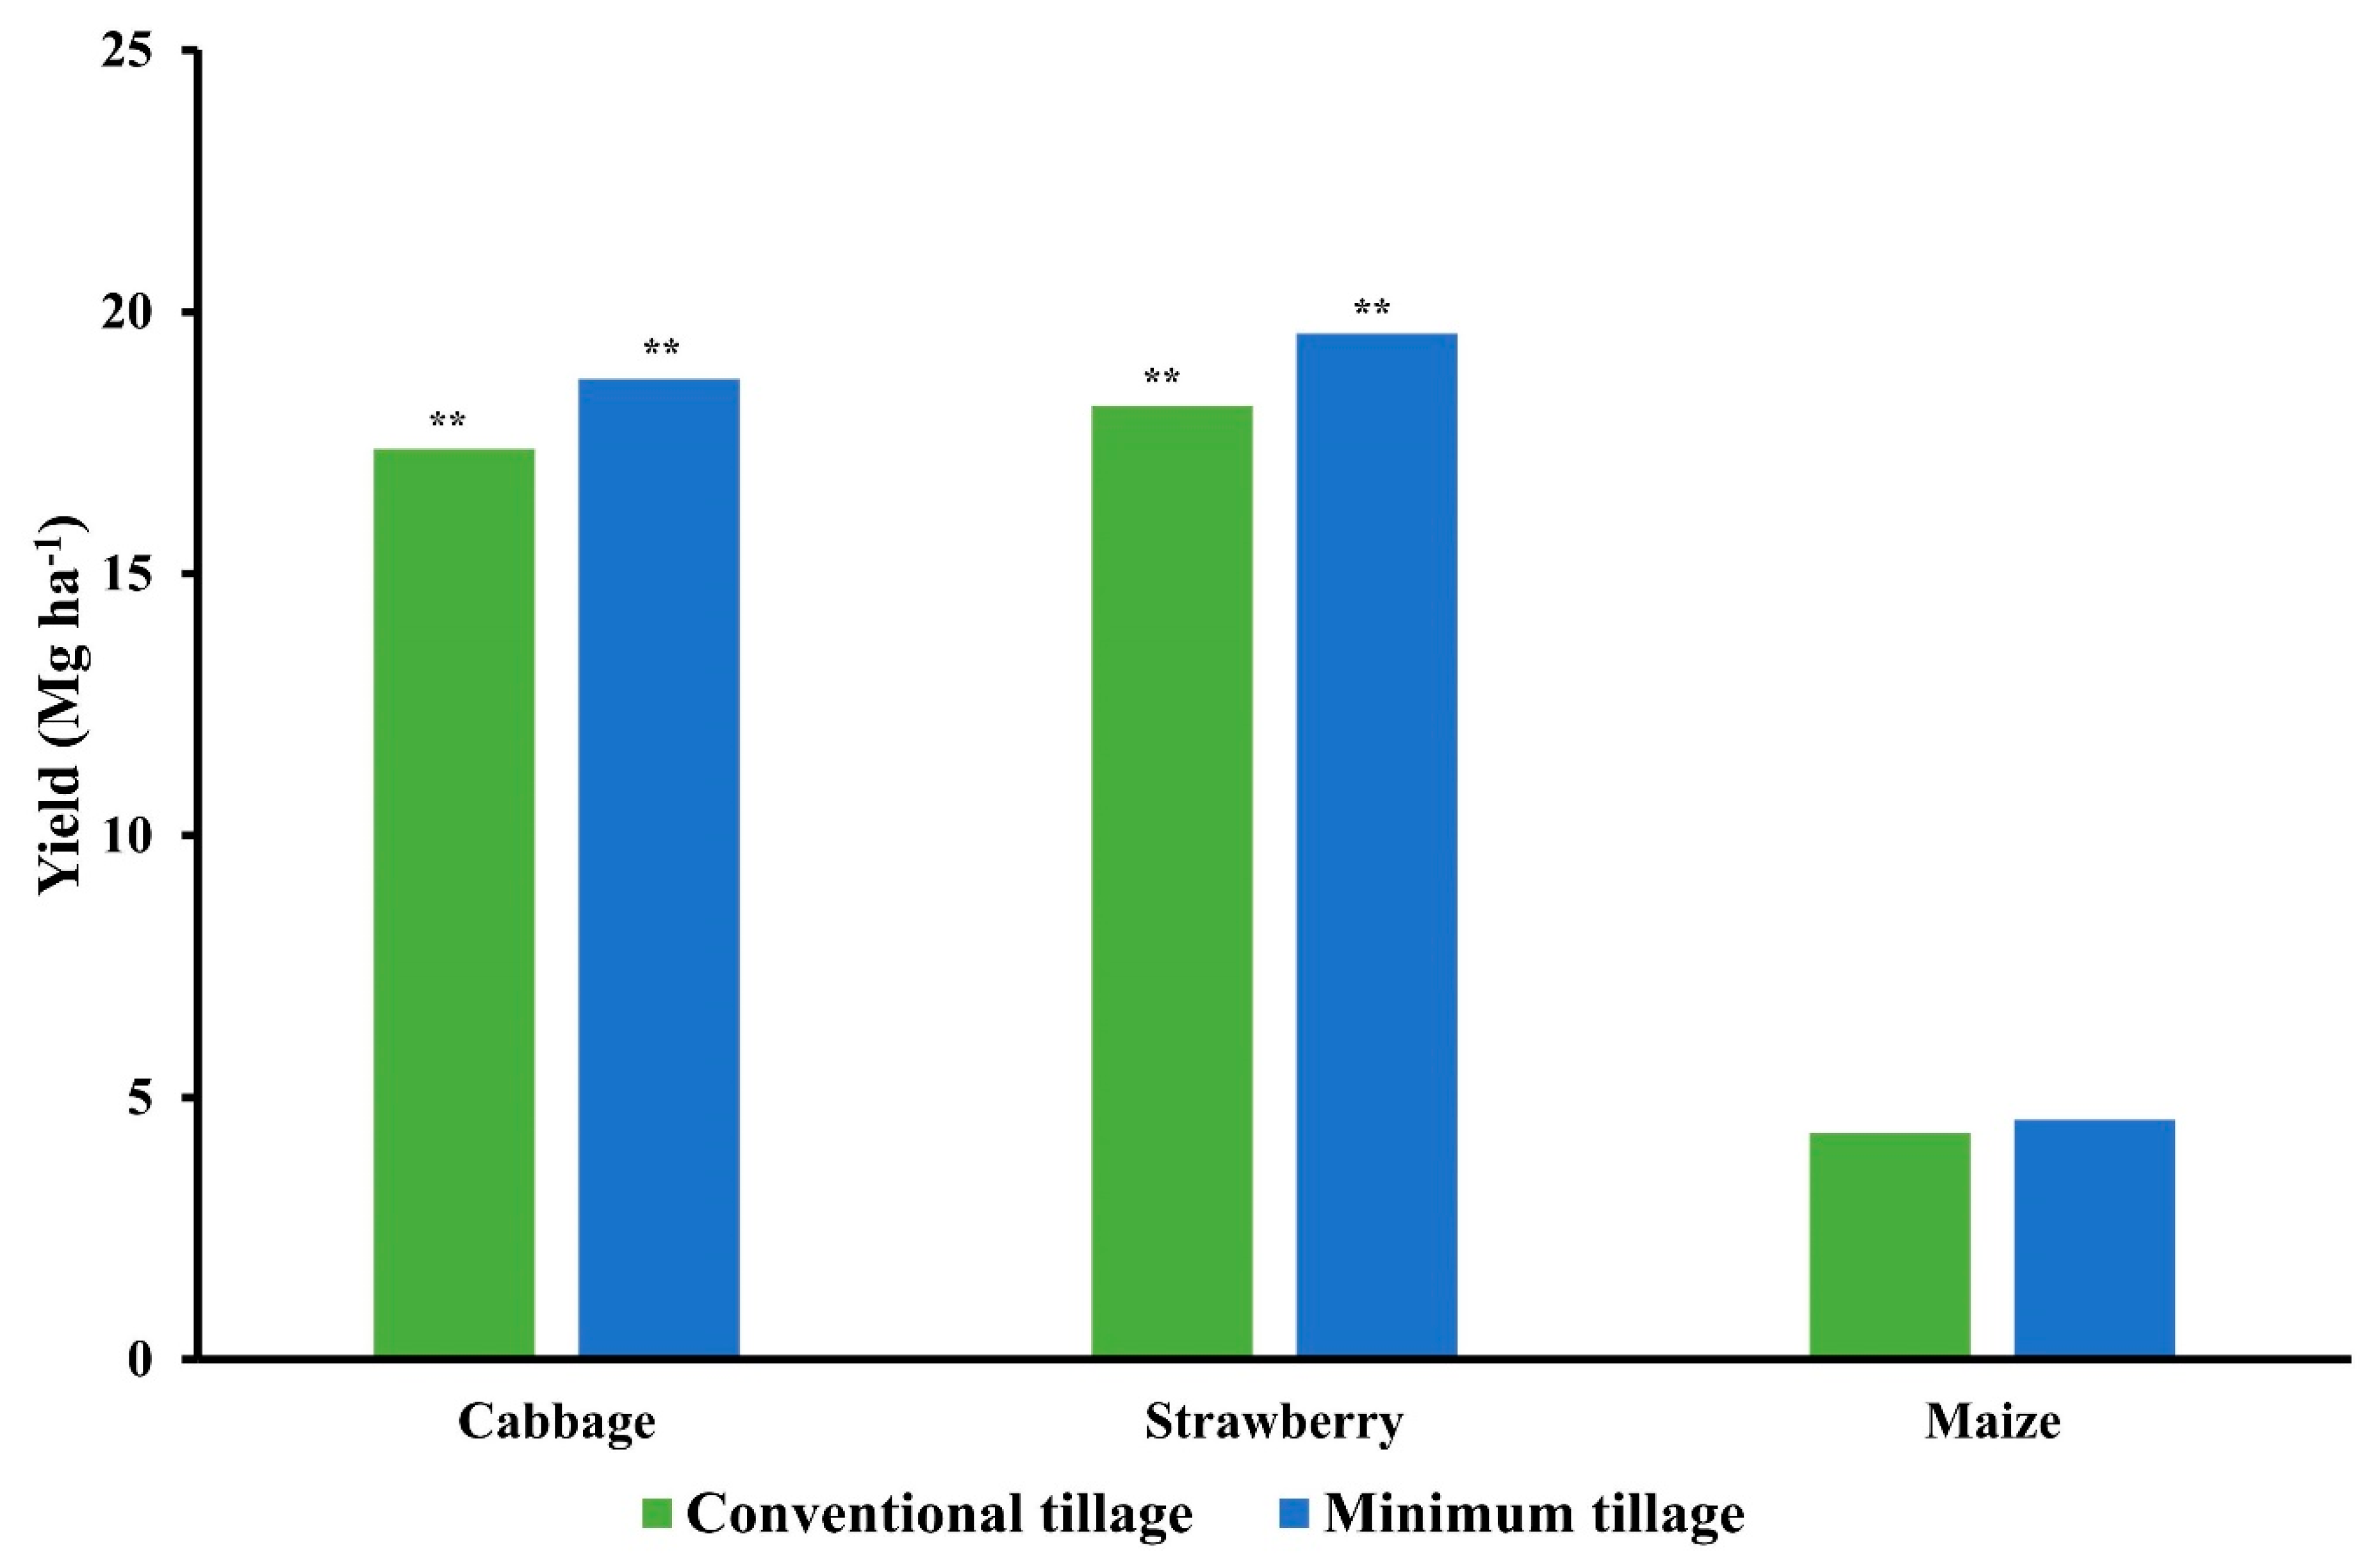
3.5. Top SOCD and Crop Yields Under Different Tillage Methods

Based on our survey, conventional tillage and minimum tillage methods were used to maintain cabbage, strawberry, and maize plantations for land preparation. Results here revealed that there was significant difference between top SOCD maintained by conventional tillage and minimum tillage methods (p < 0.01) in areas growing cabbage and maize (Figure 6). The top SCOD was 37.58 and 61.14 Mg C ha−1 under conventional tillage and minimum tillage methods in areas growing cabbage, respectively, while levels were 39.55 and 71.15 Mg C ha−1 were found using conventional tillage and minimum tillage methods, respectively, in areas growing maize. The top SCOD in strawberry areas, moreover, contained 41.33 and 59.17 Mg C ha−1 under conventional tillage and minimum tillage methods, respectively, which also produced a significant difference when compared to conventional tillage and minimum tillage methods (p < 0.1) (Figure 6).
Differences in cabbage and strawberry yields, when compare to the use of either conventional tillage or minimum tillage methods, were highly significantly different (p < 0.05) (Figure 7). The average cabbage yield was 17.38 and 18.71 Mg ha−1, while strawberry yield was 18.20 and 19.58 Mg ha−1 under conventional tillage and minimum tillage methods, respectively. However, no significant differences were observed when comparing conventional tillage and minimum tillage methods used to grow maize, with yield values of 4.32 and 4.58 Mg ha−1, respectively (Figure 7).

3.6. Factors Controlling Top SOCD and Crop Yield in Highland Agricultural Areas

The TOL and VIF values were detected, with ranges of 0.556 to 0.905 and 1.074 to 1.798, respectively, when SOCD was assigned as the dependent variable. Ranges of 0.630 to 0.980 and 1.030 to 1.587 were found for TOL and VIF values, respectively, when yield was assigned as the dependent variable. These indicated that there was no signal of multicollinearity in this study.
Multiple regression analysis produced the following regression equation for all sites: SOCD0-30 cm = −42.846 + 0.044(Elevation) + 28.104(Bulk density) - 0.039(K2O fertilizer) + 0.039(N fertilizer) (R2 = 0.478; p < 0.01) (Table 4). It confirms that elevation, crop yields, bulk density, N and K2O fertilizers were the main factors controlling the top SOCD at all sites. As for factors influencing changes in yields for all crop types, the multiple regression analysis indicated that elevation, top SOCD, soil moisture, and K2O fertilizer were four major factors influencing changes in crop yield in highland agricultural areas according to the following regression equations: Yield All crop types = 2.108 + 0.016(Elevation) – 0.127(SOCD) – 0.0187(Soil moisture) + 0.009(K2O fertilizer) (R2 = 0.473; p < 0.01) (Table 4).
In areas where cabbage is grown, chemical fertilizers (N, P2O5, and K2O fertilizers) largely governed level of top SOCD, while top SOCD was the main factor influencing cabbage yield. Top SOCD in upland rice was controlled by bulk density, clay content, soil moisture and sand content, while top SOCD and bulk density were two major factors controlling upland rice yield. For lowland rice, N fertilizer, soil moisture and K2O fertilizer played important roles in explaining top SOCD, while elevation and SOCD control lowland rice yield. In addition, elevation and P2O5 fertilizer were two key factors controlling top SOCD in areas used to grow tomatoes, but there was no factor that could predict changes in tomato yield.
Changes in top SOCD of areas growing strawberries were largely related to N and P2O5 fertilizers, while soil moisture, clay content and P2O5 fertilizer were largely responsible for changes in strawberry yield. In areas where potatoes are grown, top SOCD and yield were controlled by elevation and N fertilizer, respectively. Silt content was main factor controlling top SOCD in Japanese pumpkin agricultural areas, while soil moisture, clay plus silt content, and P2O5 fertilizer levels were the main factors influencing Japanese pumpkin yield. Changing of top SOCD in areas growing maize was mainly controlled by elevation and N fertilizer, while top SOCD, elevation, N fertilizer, and clay plus silt governed maize yield. However, no factors were detected influencing top SOCD and yield changes for cape gooseberry in this study (Table 4). This might be due to the relatively low number of cape gooseberry areas growing that were sampled.

4. Discussion

4.1. Environmental Factors Affecting Top SOCD in Highland Agricultural Areas

SOC stocks can differ significantly due to the influence of local factors such as topography, soil properties, or land use and management [43,44,45]. Previous studies reported that elevation is significantly correlated with SOC content [46,47,48,49], which is consistent with the results of the present study in which top SOCD increased with increasing altitude (Figure 3). This is because the accumulation of SOC at a higher altitude may potentially result from decreases in temperature and increasing levels of soil moisture [50,51,52]. Pabst et al. [53] confirmed that elevation can be used as a parameter to control temperature and precipitation, which are probably the major factors influencing SOC stocks along the investigated elevation gradient. Increasing soil temperature accelerates the rate of SOC decomposition [54,55], improve the level of soil respiration [56], and lead to a significant decrease in SOC content [57,58,59]. On the other hand, SOC content is positively correlated with annual mean precipitation, which increases soil moisture [58,60]. Moreover, Florinsky [61] reported that topography influenced SOC content more than climate and parent material in the A horizon because of gravity-driven lateral migration, the accumulation of water and differences in the temperature of different slopes. However, carbon loss through erosion is mainly related to topography [62]. With increasing slope, infiltration decreases because increasing slope area and the velocity of water flow leads to decreasing soil moisture content in the deeper layers through increasing runoff and evaporation rate [61]. However, our results showed a low positive relationship between top SOCD and elevation at all sites (R2 = 0.19; p < 0.01) (Figure 3), indicating that top SOCD in agricultural areas may be influenced by management measures (tillage methods and chemical fertilizers) than elevation did. Unlike forests that have less human interference, agricultural land is often disturbed by land management. Interestingly, we found that the elevation was included in the regression models of tomato, potato, and maize areas, accounting for 42% of the total sampling sites of this study (Table 4). This can be explained by the high values of standard deviation of elevation as shown in Table 3, which indicated the soil samples of these areas were investigated from the wide range of elevation (892 to 1603 m a.s.l. for tomato areas, 701 to 1178 m a.s.l. for potato areas, and 498 to 1436 m a.s.l. for maize areas). The results found that at the high elevation, the value of SOCD was high in tomato, potato, and maize areas. Therefore, our results demonstrated that the elevation acted as the main factor controlling SOCD in these areas even the same crop type is grown, which is in line with Tsui et al. [63] who concluded that elevation is a simple and effective predictor of SOC stock.

4.2. Effect of Burning Crop Residues on Top SOCD

Fire has been used as a tool to fertilize soils and control plant growth, but it can accelerate soil erosion and cause desertification [64]. This is similar to the Mae Chaem basin, where farmers usually choose to burn maize residue and leave the land fallow for 2–3 months before preparing the land for the next crop. However, the average values of top SOCD in areas growing maize was the second highest after upland rice (52.48 Mg C ha−1) (Table 3), compared to the other areas in this study, which is due to highest clay content (39.51%) was detected in maize plantation (Table 1). Moreover, it may be due to elevation (climate factors), and burning maize residue (Table 3) may increase the top SOCD in this area. The possible reasons to explain why burning maize residue increases the top SOCD. Firstly, fire can increase SOC [65,66] by transformation the labile compounds into recalcitrant organic forms [67], which are components of long-term carbon sequestration [68]. Secondly, fires increased the microbial metabolism after burning [69], increased degradation of soil organic matter and mortality of microbes, resulting in increased carbon mineralization, ammonium nitrogen (NH4-N), available phosphorus (P), and exchangeable potassium (K) and calcium (Ca) into the soil [70]. Notwithstanding, frequent burning of crop residues in highland can cause soil degradation [71], resulting in the loss of top SOCD due to surface runoff, water erosion [72], and sedimentation processes [73] as well as fires increase CO2, oxides of nitrogen, and black carbon into the atmosphere [74].

4.3. Effects of Physical and Chemical Soil Properties on Top SOCD in Highland Agricultural Areas

Top SOCD had a positive correlations with elevation, bulk density, and clay content (Table 2), which is in line with other studies [75,76,77] that reported the positive effects associated with higher proportions of clay on top SOCD levels, which are likely due to the ability of clay particle to absorb organic matter and protect it from microbial decomposition [78]. Moreover, clay content and iron (Fe) oxides affect carbon turnover in soil [79,80], which is dependent on regional climate and varies with topographic positions [80], thus may affect soil properties, plant biomass, and SOC stocks [81]. Therefore, soil texture must be considered for preservation and sequestration of SOC in cropland.
We also found higher soil bulk densities at lower altitude sites due to the negative correlation detected between bulk density and elevation (Table 2), indicating that the soils with high SOCD contain high organic matter accumulation and high percent pore space, resulting in lower soil bulk density. The study of Kumar et al. [82] supported our finding that at high elevations with low bulk density indicate high coarse structure of organic matter in which increase the spaces for SOC accumulation. Also, at high elevation, clay content was high, but sand content decreased (Table 2), which may be due to the availability and movement of water that moved the sand particles to the lower areas, resulting in the larger proportion of clay particles that remained. These factors contribute to increasing top SOCD with increasing altitude.

4.4. Effects of Fertilizers on Top SOCD

As shown in Figure 4, we found greater top SOCD when increasing amounts of chemical fertilizers were applied, particularly with respect to increasing the use of N and K2O fertilizers, confirming findings of previous studies which showed that not only chemical fertilizer, but also manure, could increase soil organic matter [83]. Unfortunately, a few areas in this study were identified in which famers applied manure, but we were able to observe that applying cattle manure could lead to high top SOCD, especially in areas where upland rice is grown (Table 3). Although chemical fertilizers alone may accelerate microbial activity and decomposition of soil organic matter, manure plus chemical fertilizers had greater effects on soil organic matter [84].
However, chemical fertilizers did not directly increase organic matter in the soil. They only enhanced carbon input by increasing root and stubble biomass retention (enhanced net primary productivity, above ground biomass and underground roots) [85]; as a result, SOC increased when crop residues remained in the fields.

4.5. Effects of Tillage on Top SOCD

Tillage is practiced to aerate and incorporate the soil, crop residue, manure, and fertilizer into the root zone [86]. It increases aeration and breaks up aggregates, exposing organic matter to microbial attacks that accelerate soil organic matter decomposition rates of the top soil [87]. In our study, we found the top SOCD under minimum tillage conditions was higher than top SOCD when conventional tillage was used in areas growing cabbage, strawberry, and maize (Figure 6), which is consistent with the previous studies reporting that minimum tillage/no-tillage can greatly increase SOC stock, particularly in the top soil layer (0–30 cm) compared with conventional tillage because it disturbs the soil physical aggregate structure less [88,89,90]. When conventional tillage in highland agricultural areas is used, soil erosion and nutrient losses are major problems due to low vegetation cover during heavy rainfall [91,92]. Biddoccu et al. [93] found that conventional tillage and reduced tillage caused the soil losses about 111.5 and 207.7 Mg ha−1, respectively, while only 25.6 Mg ha−1 was observed in controlled grass cover plot in a hilly vineyard (Piedmont, NW Italy) that can reduce runoff and soil losses by 68% and 61%, respectively [94].

4.6. Effects of Top SOCD and Crop Yields

Crop yield stability is an essential indicator of agricultural sustainability [12], where increasing SOC stocks can reduce yield variation [9,95]. In this study, all crop yields had a positive relationship with top SOCD (Figure 5). This is also consistent with other studies who reported that increased SOC can increase crop yields through inputs of organic materials (manures, crop residues) [96,97,98,99], and reducing the practice of intensive tillage and crop residue burning [100]. Top SOCD and crop yield may also vary depending on other factors such as altitude, rainfall, and agricultural practices, which is in agreement with a study by Lal [101] who reported that increasing top SOCD 1 Mg C ha−1 in the root zone can increase annual food production by 30–50 million Mg in developing countries. Qiu et al. [102] predicted increases in grain yield of 454 kg ha−1 in Huantai country because of increases of 1 g C kg -1 SOC.
Differences in crop types and crop production affect SOC storage due to differences in the amount of crop residues that are left in the fields, and belowground biomass (roots) that remains in the soil. Eghball et al. [103] found that greater SOC storage could be observed under continuous corn than corn-soybean rotations because corn left behind more residues in the production process.
Upland rice areas showed the highest amounts of top SOCD compared with other crops evaluated (Table 3). This is because rice residues left in the fields after harvest can cause carbon and nitrogen increased in the soil, thus enhancing the entire ecosystem [104,105]. Studies have claimed that SOC stocks in the upper 20 cm of soil have globally increased by 0.24–0.46 Mg C ha−1 year−1 due to the levels of compost applied in the last 10 years [106]. Another report added that in the southern part of China, SOC stocks in the upper soil layer (0–20 cm) have increased by 3.8 Mg C ha−1 with a 22-year-long application of compost, in comparison with soil that only received chemical fertilizers [98]. In addition, it was estimated that SOC stocks will increased by 3.8 Tg C year−1 in soil that is incorporated with post-harvest rice straw [104]. Another feature of the Mae Chaem basin is that upland rice is often grown only once per year, leaving farmers in no rush to clear their rice fields for the next crop by burning or removing rice residues, thus allowing organic matter is allowed to accumulate in the soil and make soil carbon densities higher in upland rice farms than in farms of other crops. This finding agrees with the study of Stan et al. [107], which shows that crop residues that are not burned or removed from the field will contribute to the maintenance of SOC, enhance soil fertility and biological activity.

5. Conclusion

The highest top SOCD was found in areas growing upland rice with the average of levels reaching 58.71 Mg C ha−1. Areas growing maize were the second highest levels of top SOCD, after upland rice, followed by strawberry, cabbage, tomato, lowland rice, Japanese pumpkin, potato, and cape gooseberry, with an average top SOCD level of 52.48, 49.0, 48.05, 42.14, 35.21, 34.0, 29.45, and 19.56 Mg C ha−1, respectively. Higher elevation and application rates of N, P2O5, and K2O fertilizers could lead to increases in top SOCD. A positive relationship between all crop yields and top SOCD was detected, indicating the increasing of top SOCD can increase crop yields. We conformed that minimum tillage methods can preserve top SOCD and enhance crop yields. Multiple regression analysis indicated that elevation, bulk density, N and K2O fertilizers the main factors influencing changes in top SOCD. Practicing minimum tillage, applying N and K2O fertilizers could be beneficial for SOC sequestration, which is technically applicable for highland agricultural areas.

Author Contributions

Conceptualization, N.A., N.P., S.S.; Methodology, N.A., N.P., S.S.; Investigation, N.A., N.P., S.S.; Writing—Original Draft Preparation, N.A.; Writing—Review & Editing, N.A; Supervision, N.P and U.C. All authors have read and agreed to the published version of the manuscript.

Funding

This research was funded by The Thailand Research Fund (TRF) and Knowledge Network Institute of Thailand (RDG6020014), Thailand Research Fund (TRF) and Office of Higher Education Commission (OHEC) Thailand (MRG6280146), and National Research Council of Thailand (NRCT) (WO-CHO(KO)(KO-PO-JO)/94/2562).

Acknowledgments

We express great thank to Mae Chaem District Office, and all Subdistrict Administration Organizations in Mae Chaem District for recommending the data collection. We would also like to thank Mr. Chaya Suwannapoom, Ms. Saranya Bhaktiwut and Mr. Wirot Kharmmongkhon for helping collect the data in the study sites.

Conflicts of Interest

The authors declare no conflict of interest.

References

  1. Girmay, G.; Singh, B.R.; Mitiku, H.; Borresen, T.; Lal, R. Carbon stocks in Ethiopian soils in relation to land use and soil management. Land Degrad. Dev. 2008, 19, 351–367. [Google Scholar] [CrossRef]
  2. Sonneveld, B.G.J.S.; Keyzer, M.A.; Ndiaye, D. Quantifying the impact of land degradation on crop production: The case of Senegal. Solid Earth. 2016, 7, 93–103. [Google Scholar] [CrossRef] [Green Version]
  3. Tiessen, H.; Cuevas, E.; Chacon, P. The role of soil organic matter in sustaining soil fertility. Nature 1994, 371, 783–785. [Google Scholar] [CrossRef]
  4. Gami, S.K.; Lauren, J.G.; Duxbury, J.M. Soil organic carbon and nitrogen stocks in Nepal long-term soil fertility experiments. Soil Tillage Res. 2009, 106, 95–103. [Google Scholar] [CrossRef]
  5. Quijano, L.; Oost, K.V.; Nadeu, E.; Gaspar, L.; Navas, A. Modelling the effect of land management changes on soil organic carbon stocks in a Mediterranean cultivated field. Land Degrad. Dev. 2017, 28, 515–523. [Google Scholar] [CrossRef] [Green Version]
  6. Lal, R. Soil carbon sequestration impacts on global climate change and food security. Science 2004, 304, 1623–1627. [Google Scholar] [CrossRef] [PubMed] [Green Version]
  7. Fan, M.; Cao, J.; Wei, W.; Zhang, F.; Su, Y. Managing soil organic carbon for advancing food security and strengthening ecosystem services in China. In Ecosystem Services and Carbon Sequestration in the Biosphere; Springer: Dordrecht, The Netherland, 2013; pp. 419–429. [Google Scholar] [CrossRef]
  8. Bationo, A.; Kihara, J.; Vanlauwe, B.; Waswa, B.; Kimetu, J. Soil organic carbon dynamics functions, and management in West African agro-ecosystems. Agric. Syst. 2007, 94, 13–25. [Google Scholar] [CrossRef] [Green Version]
  9. Pan, G.X.; Smith, P.; Pan, W.N. The role of soil organic matter in maintaining the productivity and yield stability of cereals in China. Agric. Ecosyst. Environ. 2009, 129, 344–348. [Google Scholar] [CrossRef]
  10. Manlay, R.J.; Feller, C.; Swift, M.J. Historical evolution of soil organic matter concepts and their relationships with the fertility and sustainability of cropping systems. Agric. Ecosyst. Environ. 2007, 119, 217–233. [Google Scholar] [CrossRef]
  11. Brock, C.; Fliessbach, A.; Oberholzer, H.R.; Schulz, F.; Wiesinger, K.; Reinicke, F.; Koch, W.; Pallutt, B.; Dittman, B.; Zimmer, J.; et al. Relation between soil organic matter and yield levels of nonlegume crops in organic and conventional farming systems. J. Plant Nutr. Soil Sci. 2011, 174, 568–575. [Google Scholar] [CrossRef]
  12. Seremesic, S.; Milosev, D.; Djalovic, I.; Zeremski, T.; Ninkov, J. Management of soil organic carbon in maintaining soil productivity and yield stability of winter wheat. Plant Soil Environ. 2011, 57, 216–221. [Google Scholar] [CrossRef] [Green Version]
  13. Lybrand, R.A.; Rasmussen, C. Quantifying climate and landscape position controls on soil development in semiarid ecosystems. Soil Sci. Soc. Am. J. Abstr. Pedol. 2015, 79, 104–116. [Google Scholar] [CrossRef] [Green Version]
  14. Jobbágy, E.G.; Jackson, R.B. The vertical distribution of soil organic carbon and its relation to climate and vegetation. Ecol. Appl. 2000, 10, 423–436. [Google Scholar] [CrossRef]
  15. Griffiths, R.P.; Madritch, M.D.; Swanson, A.K. The effects of topography on forest soil characteristics in the Oregon Cascade Mountains (USA): Implications for the effects of climate change on soil properties. Ecol. Manag. 2009, 257, 1–7. [Google Scholar] [CrossRef]
  16. Longbottom, T.L.; Townsend-Small, A.; Owen, L.A.; Murari, M.K. Climatic and topographic controls on soil organic matter storage and dynamics in the Indian Himalaya: Potential carbon cycle–climate change feedbacks. CATENA 2014, 119, 125–135. [Google Scholar] [CrossRef]
  17. Nayak, A.; Gangwar, B.; Shukla, A.K.; Mazumdar, S.P.; Kumar, A.J.; Raja, R.; Kumar, A.; Kumar, V.; Mohan, U. Long-term effect of different integrated nutrient management on soil organic carbon and its fractions and sustainability of rice–wheat system in indo Gangetic Plains of India. Field Crop. Res. 2012, 127, 129–139. [Google Scholar] [CrossRef]
  18. Biddoccu, M.; Zecca, O.; Audisio, C.; Godone, F.; Barmaz, A.; Cavallo, E. Assessment of long-term soil erosion in a mountain vineyard, Aosta Valley (NW Italy). Land Degrad. Dev. 2018, 29, 617–629. [Google Scholar] [CrossRef]
  19. Wu, R.; Tiessen, H. Effect of land use on soil degradation in Alpine grassland soil, China. Soil Sci. Soc. Am. J. 2002, 66, 1648–1655. [Google Scholar] [CrossRef]
  20. Dagnew, D.C.; Guzman, C.D.; Akal, A.T.; Tebebu, T.Y.; Zegeye, A.D.; Mekuria, W.; Tilahun, S.A.; Steenhuis, T.S. Effects of land use on catchment run off and soil loss in the sub-humid Ethiopian highlands. Ecohydrol. Hydrobiol 2017, 17, 274–282. [Google Scholar]
  21. Arunrat, N.; Pumijumnong, N.; Sereenonchai, S. Air-Pollutant Emissions from Agricultural Burning in Mae Chaem Basin, Chiang Mai Province, Thailand. Atmosphere 2018, 9, 145. [Google Scholar] [CrossRef] [Green Version]
  22. Jaiarree, S.; Chidthaisong, A.; Tangtham, N.; Polprasert, C.; Sarobol, E.; Tyler, S.C. Soil Organic Carbon Loss and Turnover Resulting from Forest Conversion to Maize Fields in Eastern Thailand. Pedosphere 2011, 21, 581–590. [Google Scholar] [CrossRef]
  23. Bergstrom, D.W.; Monreal, C.M.; St Jacques, E. Influence of tillage practice on carbon sequestration is scale-dependent. Can. J. Soil Sci. 2001, 81, 63–70. [Google Scholar] [CrossRef] [Green Version]
  24. Heenan, D.P.; Chan, K.Y.; Knight, P.G. Long-term impact of rotation, tillage and stubble management on the loss of soil organic carbon and nitrogen from a Chromic Luvisol. Soil Tillage Res. 2004, 76, 59–68. [Google Scholar] [CrossRef]
  25. Lal, R. Enhancing crop yields in the developing countries through restoration of the soil organic carbon pool in agricultural lands. Land Degrad. Dev. 2006, 17, 197–209. [Google Scholar] [CrossRef]
  26. Bi, L.D.; Zhang, B.; Liu, G.R.; Li, Z.H.; Liu, Y.R.; Ye, C.; Yu, X.C.; Lai, T.; Zhang, J.G.; Yin, J.M.; et al. Long-term effects of organic amendments on the rice yields for double rice cropping systems in subtropical China. Agric. Ecosyst. Environ. 2009, 129, 534–541. [Google Scholar] [CrossRef]
  27. Yan, X.; Zhou, H.; Zhu, Q.H.; Wang, X.F.; Zhang, Y.Z.; Yu, X.C.; Peng, X. Carbon sequestration efficiency in paddy soil and upland soil under long-term fertilization in southern China. Soil Tillage Res. 2013, 130, 42–51. [Google Scholar] [CrossRef]
  28. Arunrat, N.; Pumijumnong, N.; Hatano, R. Practices sustaining soil organic matter and rice yield in a tropical monsoon region. Soil Sci. Plant Nutr. 2017, 63, 274–287. [Google Scholar] [CrossRef] [Green Version]
  29. Sun, W.J.; Huang, Y.; Zhang, W.; Yu, Y.Q. Carbon sequestration and its potential in agricultural soils of China, Global Biogeochem. Cycles 2010, 24, GB3001. [Google Scholar] [CrossRef]
  30. Veldkamp, E.; Becker, A.; Schwendenmann, L.; Clark, D.A.; Schulte-Bisping, H. Substantial labile carbon stocks and microbial activity in deep weathered soils below a tropical wet forest. Glob. Chang. Biol. 2003, 9, 1171–1184. [Google Scholar] [CrossRef]
  31. Gao, J.F.; Pan, G.X.; Jiang, X.S.; Pan, J.J.; Zhuang, D.F. Land-use induced changes in topsoil organic carbon stock of paddy fields using MODIS and TM/ETM analysis: A case study of Wujiang County, China. J. Environ. Sci. 2008, 20, 852–858. [Google Scholar] [CrossRef]
  32. Wangpakapattanawong, P. Ecological studies of reduced forest-fallow shifting cultivation of Karen people in Mae Chaem watershed, Northern Thailand. In Proceedings of the Symposium on 17th WCSS, Chiang Mai, Thailand, 14–17 August 2002. [Google Scholar]
  33. Kuraji, K.; Punyatrong, K.; Suzuki, M. Altitudinal increase in rainfall in the Mae Chaem watershed, Thailand. J. Meteorol. Soc. Jpn. Ser. 2001, 79, 353–363. [Google Scholar] [CrossRef] [Green Version]
  34. Larpkerna, P.; Eriksen, M.; Waiboonya, P. Diversity and Uses of Tree Species in the Deciduous Dipterocarp Forest, Mae Chaem District, Chiang Mai Province, Northern Thailand. Naresuan Univ. J. Sci. Technol. 2017, 25, 43–55. [Google Scholar]
  35. Dairaku, K.; Kuraji, K.; Suzuki, M.; Tangtham, N.; Jirasuktaveekul, W.; Punyatrong, K. The effect of rainfall duration and intensity on orographic rainfall enhancement in a mountainous area: A case study in the Mae Chaem watershed, Thailand. J. Jpn. Soc. Hydrol. Water Resour. 2000, 13, 57–68. [Google Scholar] [CrossRef] [Green Version]
  36. Pholinta, M.; Panomtoranichagul, M.; Stahr, K. Increasing Fertilizer Use Efficiency, Availability of Phosphorus and Crop yield in Furrow Cultivation for Sustainable Agriculture on Sloping Land. Natural Resource Management and Rural Development. In Proceedings of the Conference on International Research on Food Security, Bonn, Germany, 5–7 October 2011. [Google Scholar]
  37. Mae Chaem Watershed Research Station. Mae Chaem Watershed. 2010. Available online: http://www.dnp.go.th/watershed/research/mj_station.htm (accessed on 25 June 2018).
  38. United States Department of Agriculture (USDA) National Soil Survey Center. 2004. Available online: https://www.nrcs.usda.gov/Internet/FSE_DOCUMENTS/nrcseprd1026807.pdf (accessed on 10 May 2018).
  39. Spinelli, R.; Magagnotti, N.; Cavallo, E.; Giorgio Capello, G.; Biddoccu, M. Reducing soil compaction after thinning work in agroforestry plantations. Agroforest Syst. 2019, 93, 1765–1779. [Google Scholar] [CrossRef]
  40. Walkley, A.; Black, J.A. An examination of the dichormate method for determining. Soil organic matter and a proposed modification of the chromic acid titration method. Soil Science 1934, 37, 29–38. [Google Scholar] [CrossRef]
  41. Zhang, Y.; Zhao, Y.C.; Shi, X.Z.; Lu, X.X.; Yu, D.S.; Wang, H.J.; Sun, W.X.; Darilek, J.L. Variation of soil organic carbon estimates in mountain regions: A case study from Southwest China. Geoderma 2008, 146, 449–456. [Google Scholar] [CrossRef]
  42. Bai, S.B.; Wang, J.; Lu, G.N.; Zhou, P.G.; Hou, S.S.; Xu, S.N. GIS-based logistic regression for land slide susceptibility mapping of the Zhongxian segment in the three Gorges area China. Geomorphology 2010, 115, 23–31. [Google Scholar] [CrossRef]
  43. Muñoz-Rojas, M.; Jordán, A.; Zavala, L.M.; La Rosa, D.D.; Abd-Elmabod, S.K.; Anaya- Romero, M. Impact of land use and land cover changes on organic carbon stocks in Mediterranean soils (1956–2007). Land Degrad. Dev. 2012, 26, 168–179. [Google Scholar] [CrossRef]
  44. Ferreira, A.C.C.; Leite, L.F.C.; Araújo, A.S.F.; Eisenhauer, N. Land-use type effects on soil organic carbon and microbial properties in a semi-arid region of northeast Brazil. Land Degrad. Dev. 2014, 27, 171–178. [Google Scholar] [CrossRef] [Green Version]
  45. Bruun, T.B.; Elberling, B.; Neergaard, A.; Magid, J. Organic carbon dynamics in different soil types after conversion of forest to agriculture. Land Degrad. Dev. 2015, 26, 272–283. [Google Scholar] [CrossRef]
  46. Leifeld, J.; Bassin, S.; Fuhrer, J. Carbon stocks in Swiss agricultural soils predicted by land-use, soil characteristics, and altitude. Agric. Ecosyst. Environ. 2005, 105, 255–266. [Google Scholar] [CrossRef]
  47. Neufeldt, H. Carbon stocks and sequestration potentials of agricultural soils in the federal state of Baden-Württemberg, SW Germany. J. Plant Nutr. Soil Sci. 2005, 168, 202–211. [Google Scholar] [CrossRef]
  48. Wiesmeier, M.; Hübner, R.; Barthold, F.; Spörlein, P.; Geuß, U.; Hangen, E.; Reischl, A.; Schilling, B.; Lützow, M.; Kögel-Knabnerad, I. Amount, distribution and driving factors of soil organic carbon and nitrogen in cropland and grassland soils of southeast Germany (Bavaria). Agric. Ecosyst. Environ. 2013, 176, 39–52. [Google Scholar] [CrossRef]
  49. Zhao, B.H.; Li, Z.B.; Li, P.; Xu, G.; Gao, H.; Cheng, Y.; Chang, E.; Yuan, S.; Zhang, Y.; Feng, Z. Spatial distribution of soil organic carbon and its influencing factors under the condition of ecological construction in a hilly-gully watershed of the Loess Plateau, China. Geoderma 2017, 296, 10–17. [Google Scholar] [CrossRef]
  50. Kirschbaum, M.U.F. The temperature dependence of soil organic matter decomposition, and the effect of global warming on soil organic C storage. Soil Biol. Biochem. 1995, 27, 753–760. [Google Scholar] [CrossRef]
  51. Raich, J.W.; Russell, A.E.; Kitayama, K.; Parton, W.J.; Vitousek, P.M. Temperature influences carbon accumulation in moist tropical forests. Ecology 2006, 87, 76–87. [Google Scholar] [CrossRef] [Green Version]
  52. Liu, Z.; Shao Ma Wang, Y. Effect of environmental factors on regional soil organic carbon stocks across the Loess Plateau region, China. Agric. Ecosyst. Environ. 2011, 142, 184–194. [Google Scholar] [CrossRef]
  53. Pabst, H.; Gerschlauer, F.; Kiese, R.; Kuzyakov, Y. Land Use and Precipitation Affect Organic and Microbial Carbon Stocks and the Specific Metabolic Quotient in Soils of Eleven Ecosystems of Mt. Kilimanjaro, Tanzania. Land Degrad. Dev. 2016, 27, 592–602. [Google Scholar] [CrossRef]
  54. Cinzia, F.; Christianp, G.; Randallk, K.; Carl, T.; Gary, K.; Martin, J.; Christopher, B.; Douglas, M. Temperature and vegetation effects on soil organic carbon quality along a forested mean annual temperature gradient in North America. Glob. Chang. Biol. 2010, 14, 193–205. [Google Scholar] [CrossRef] [Green Version]
  55. Xu, X.; Luo, Y.Q.; Zhou, J.Z. Carbon quality and the temperature sensitivity of soil organic carbon decomposition in a tallgrass prairie. Soil Biol. Biochem. 2012, 50, 142–148. [Google Scholar] [CrossRef]
  56. Wu, Z.; Dijkstra, P.; Koch, G.W.; Peñuelas, J.; Hungate, B.A. Responses of terrestrial ecosystems to temperature and precipitation change: A meta - analysis of experimental manipulation. Glob. Chang. Biol. 2011, 17, 927–942. [Google Scholar] [CrossRef] [Green Version]
  57. Fang, C.; Smith, P.; Moncrieff, J.B.; Smith, J.U. Similar response of labile and resistant soil organic matter pools to changes in temperature. Nat. Int. J. Sci. 2005, 433, 57–59. [Google Scholar] [CrossRef]
  58. Hobley, E.; Wilson, B.; Wilkie, A.; Gray, J.; Koen, T. Drivers of soil organic Carbon storage and vertical distribution in Eastern Australia. Plant Soil 2015, 390, 111–127. [Google Scholar] [CrossRef]
  59. Qi, R.; Li, J.; Lin, Z.; Li, Z.; Li, Y.; Yang, X.; Zhao, B. Temperature effects on soil organic carbon, soil labile organic carbon fractions, and soil enzyme activities under long-term fertilization regimes. Appl. Soil Ecol. 2016, 102, 36–45. [Google Scholar] [CrossRef]
  60. Yang, Y.H.; Fang, J.Y.; Guo, D.L.; Ji, C.J.; Ma, W.H. Vertical patterns of soil carbon, nitrogen and carbon: Nitrogen stoichiometry in Tibetan grasslands. Biogeosci. Discuss 2010, 7, 1–24. [Google Scholar] [CrossRef]
  61. Florinsky, I. Digital Terrain Analysis in Soil Science and Geology; Academic Press: Cambridge, MA, USA, 2012. [Google Scholar] [CrossRef]
  62. Moorman, T.B.; Cambardella, C.A.; James, D.E.; Karlen, D.L.; Kramer, L.A. Quantification of tillage and landscape effects on soil carbon in small Iowa watersheds. Soil Tillage Res. 2004, 78, 225–236. [Google Scholar] [CrossRef]
  63. Tsui, C.C.; Tsai, C.C.; Chen, Z.S. Soil organic carbon stocks in relation to elevation gradients in volcanic ash soils of Taiwan. Geoderma 2013, 209, 119–127. [Google Scholar] [CrossRef]
  64. Santín, C.; Doerr, S.H. Fire effects on soils: The human dimension. Phil. Trans. R. Soc. B 2016, 371, 20150171. [Google Scholar] [CrossRef] [PubMed] [Green Version]
  65. Knicker, H. How does fire affect the nature and stability of soil organic nitrogen and carbon? A review. Biogeochemistry 2007, 85, 91–118. [Google Scholar] [CrossRef]
  66. Santín, C.; Doerr, S.H.; Kane, E.S.; Masiello, C.A.; Ohlson, M.; de la Rosa, J.M.; Preston, C.M.; Dittmar, T. Towards a global assessment of pyrogenic carbon from vegetation fires. Glob. Chang. Biol. 2016, 22, 76–91. [Google Scholar] [CrossRef] [PubMed]
  67. Gonzalez-Perez, J.A.; Gonzalez-Vila, F.J.; Almendros, G.; Knicker, H. The effect of fire on soil organic matter—A review. Environ. Int. 2004, 30, 855–870. [Google Scholar] [CrossRef] [PubMed]
  68. Schmidt, M.W.I.; Noack, A.G. Black carbon in soils and sediments: Analysis, distribution, implications, and current challenges. Glob. Biogeochem. Cycles 2000, 14, 777–793. [Google Scholar] [CrossRef]
  69. Zhao, H.M.; Tong, D.Q.; Lin, Q.X.; Lu, X.G.; Wang, G.P. Effect of fires on soil organic carbon pool and mineralization in a Northeastern China wetland. Geoderma 2012, 189, 532–539. [Google Scholar] [CrossRef] [Green Version]
  70. Ando, K.; Shinjo, H.; Noro, Y.; Takenaka, S.; Miura, R.; Sokotela, S.B.; Funakawa, S. Short-term effects of fire intensity on soil organic matter and nutrient release after slash-and-burn in Eastern Province, Zambia. Soil Sci. Plant Nutr. 2014, 60, 173–182. [Google Scholar] [CrossRef]
  71. Duarte, R.M.; Wozniak, E.; Recondo, C.; Cabo, C.; Marquinez, J.; Fernandez, S. Estimation of surface roughness and stone cover in burnt soils using SAR images. CATENA 2008, 74, 264–272. [Google Scholar] [CrossRef]
  72. Pereira, P.; Cerdà, A.; Úbeda, X.; Mataix-Solera, J.; Martin, D.; Jordán, A.; Burguet, M. Spatial models for monitoring the spatio-temporal evolution of ashes after fire—A case study of a burnt grassland in Lithuania. Solid Earth 2013, 4, 153–165. [Google Scholar] [CrossRef] [Green Version]
  73. Martínez-Mena, M.; López, J.; Almagro, M.; Boix-Fayos, C.; Albaladejo, J. Effect of water erosion and cultivation on the soil carbon stock in a semiarid area of south-east Spain. Soil Tillage Res. 2008, 99, 119–129. [Google Scholar] [CrossRef]
  74. Wiedinymer, C.; Quayle, B.; Geron, C.; Belote, A.; Mckenzie, D.; Zhang, X.; O’Neill, S.; Wynne, K.K. Estimating emissions from fires in North America for air quality modeling. Atmos. Environ. 2006, 40, 3419–3432. [Google Scholar] [CrossRef]
  75. Hassink, J. Preservation of plant residues in soils differing in unsaturated protective capacity. Soil Sci. Soc. Am. J. Abstr. 1996, 60, 487–491. [Google Scholar] [CrossRef]
  76. Chen, H.; Li, X.; Hu, F.; Shi, W. Soil nitrous oxide emissions following crop residue addition: A meta-analysis. Glob. Chang. Biol. 2013, 19, 2956–2964. [Google Scholar] [CrossRef]
  77. Willaarts, B.A.; Oyonarte, C.; Muñoz-Rojas, M.; José Ibáñez, J.; Aguilera, P.A. Environmental factors controlling soil organic carbon stocks in two contrasting Mediterranean climatic areas of southern Spain. Land Degrad. Dev. 2016, 27, 603–611. [Google Scholar] [CrossRef]
  78. Zhao, L.P.; Sun, Y.J.; Zhang, X.P.; Yang, X.M.; Drury, C.F. Soil organic carbon in clay and silt sized particles in Chinese mollisols: Relationship to the predicted capacity. Geoderma 2006, 132, 315–323. [Google Scholar] [CrossRef]
  79. Masiello, C.A.; Chadwick, O.A.; Southon, J.; Torn, M.S.; Harden, J.W. Weathering controls on mechanisms of carbon storage in grassland soils. Global Biogeochemical Cycles 2004, 18, GB4023. [Google Scholar] [CrossRef]
  80. Doetterl, S.; Cornelis, J.T.; Six, J.; Bodé, S.; Opfergelt, S.; Boeckx, P.; Van Oost, K. Soil redistribution and weathering controlling the fate of geochemical and physical carbon stabilization mechanisms in soils of an eroding landscape. Biogeosciences 2015, 12, 1357–1371. [Google Scholar] [CrossRef] [Green Version]
  81. Yoo, K.; Amundson, R.; Heimsath, A.M.; Dietrich, W.E. Spatial patterns of soil organic carbon on hillslopes: Integrating geomorphic processes and the biological C cycle. Geoderma 2006, 130, 47–65. [Google Scholar] [CrossRef]
  82. Kumar, S.; Kumar, M.; Sheikh, M.A. Effect of Altitudes on Soil and Vegetation Characteristics of Pinus roxburghii Forest in Garhwal Himalaya. J. Adv. Lab. Res. Biol. 2010, 1, 130–133. [Google Scholar]
  83. Shimizu, M.; Limin, A.; Desyatkin, A.R.; Jin, T.; Mano, M.; Ono, K.; Miyata, A.; Hata, H.; Hatano, R. Effect of manure application on seasonal carbon fluxes in a temperate managed grassland in Southern Hokkaido, Japan. CATENA 2015, 133, 474–485. [Google Scholar] [CrossRef]
  84. Rasool, R.; Kukal, S.S.; Hira, G.S. Soil physical fertility and crop performance as affected by long term application of FYM and inorganic fertilizers in rice-wheat system. Soil Tillage Res. 2007, 96, 64–72. [Google Scholar] [CrossRef]
  85. Han, P.F.; Zhang, W.; Wang, G.C.; Sun, W.J.; Huang, Y. Changes in soil organic carbon in croplands subjected to fertilizer management: A global meta-analysis. Sci. Rep. 2016, 6, 27199. [Google Scholar] [CrossRef] [Green Version]
  86. Acquaah, G. Principles of Crop Production: Theory, Techniques, and Technology; Pearson Education, Inc.: Upper Saddle River, NJ, USA, 2002. [Google Scholar]
  87. Balesdent, J.; Chenu, C.; Balabane, M. Relationship of soil organic matter dynamics to physical protection and tillage. Soil Tillage Res. 2000, 53, 215–230. [Google Scholar] [CrossRef]
  88. Zibilske, L.M.; Bradford, J.M.; Smart, J.R. Conservation tillage induced changes in organic carbon, total nitrogen and available phosphorus in a semi-arid alkaline subtropical soil. Soil Till. Res. 2002, 66, 153–163. [Google Scholar] [CrossRef]
  89. Ogle, S.M.; Breidt, F.J.; Paustian, K. Agricultural management impacts on soil organic carbon storage under moist and dry climatic conditions of temperate and tropical regions. Biogeochemistry 2005, 72, 87–121. [Google Scholar] [CrossRef]
  90. Ogle, S.M.; Swan, A.; Paustian, K. No-till management impacts on crop productivity, carbon input and soil carbon sequestration. Agric. Ecosyst. Environ. 2012, 149, 37–49. [Google Scholar] [CrossRef]
  91. Cerdà, A.; Lavee, H.; Romero-Díaz, A.; Hooke, J.; Montanarella, L. Soil erosion and degradation on Mediterranean type ecosystems. Land Degrad. Dev. 2010, 21, 71–74. [Google Scholar] [CrossRef]
  92. Ziadat, F.M.; Taimeh, A.Y. Effect of rainfall intensity, slope and land use and antecedent soil moisture on soil erosion in an arid environment. Land Degrad. Dev. 2013, 24, 582–590. [Google Scholar] [CrossRef]
  93. Biddoccu, M.; Opsi, F.; Cavallo, E. Relationship between runoff and soil losses with rainfall characteristics and long-term soil management practices in a hilly vineyard (Piedmont, NW Italy). Soil Sci. Plant Nutr. 2014, 60, 92–99. [Google Scholar] [CrossRef] [Green Version]
  94. Bagagiolo, G.; Biddoccu, M.; Rabino, D.; Cavallo, E. Effects of rows arrangement, soil management, and rainfall characteristics on water and soil losses in Italian sloping vineyards. Environ. Res. 2018, 166, 690–704. [Google Scholar] [CrossRef]
  95. Yan, X.Y.; Gong, W. The role of chemical and organic fertilizers on yield, yield variability and carbon sequestration-results of a 19-year experiment. Plant Soil 2010, 331, 471–480. [Google Scholar] [CrossRef]
  96. Franzluebbers, A.J. Soil organic carbon sequestration and agricultural greenhouse gas emissions in the southeastern USA. Soil Tillage Res. 2005, 83, 120–147. [Google Scholar] [CrossRef]
  97. Shisanya, C.A.; Mucheru, M.W.; Mugendi, D.N.; Kung’U, J.B. Effect of organic and inorganic nutrient sources on soil mineral nitrogen and maize yields in central highlands of Kenya. Soil Tillage Res. 2009, 103, 239–246. [Google Scholar] [CrossRef]
  98. Huang, S.; Peng, X.; Huang, Q.; Zhang, W. Soil aggregation and organic carbon fractions affected by long-term fertilization in a red soil of subtropical China. Geoderma 2010, 154, 364–369. [Google Scholar] [CrossRef]
  99. Zhang, W.J.; Wang, X.J.; Xu, M.G.; Huang, S.M.; Liu, H.; Peng, C. Soil organic carbon dynamics under long-term fertilizations in arable land of northern China. Biogeosciences 2010, 7, 409–425. [Google Scholar] [CrossRef] [Green Version]
  100. Nyamadzawo, G.; Wuta, M.; Nyamangara, J.; Nyamugafata, P.; Tendayi, T. Burning, biomass removal and tillage effects on soil organic carbon and nutrients in seasonal wetlands (Dambos) of Chiota smallholder farming area, Zimbabwe. Arch. Agron. Soil Sci. 2014, 60, 1411–1427. [Google Scholar] [CrossRef]
  101. Lal, R. Climate-resilient agriculture and soil organic carbon. Indian J. Agron. 2013, 58, 440–450. [Google Scholar]
  102. Qiu, J.; Wang, L.; Li, H.; Tang, H.; Li, C.; Ranst, E. Modeling the impacts of soil organic carbon content of croplands on crop yields in China. Sci. Agric. Sin. 2009, 42, 154–161. [Google Scholar] [CrossRef]
  103. Eghball, B.; Mielke, L.N.; McCallister, D.L.; Doran, J.W. Distribution of organic carbon and inorganic nitrogen in a soil under various tillage and crop sequences. J. Soil Water. Cons. 1994, 49, 201–205. [Google Scholar]
  104. Lu, F.; Wang, X.; Han, B.; Ouyang, Z.; Duan, X.; Zheng, H.; Miao, H. Soil carbon sequestrations by nitrogen fertilizer application, straw return and no-tillage in China’s cropland. Glob. Chang. Biol. 2009, 15, 281–305. [Google Scholar] [CrossRef]
  105. Tian, K.; Zhao, Y.; Xu, X.; Hai, N.; Huang, B.; Deng, W. Effects of long-term fertilization and residue management on soil organic carbon changes in paddy soils of China: A meta-analysis. Agric. Ecosyst. Environ. 2015, 204, 40–50. [Google Scholar] [CrossRef]
  106. Gattinger, A.; Muller, A.; Haeni, M.; Skinner, C.; Fliessbach, A.; Buchmann, N.; Mader, P.; Stolze, M.; Smith, P.; Scialabba, N.E.H.; et al. Enhanced top soil carbon stocks under organic farming. Proc. Natl. Acad. Sci. USA 2012, 109, 18226–18231. [Google Scholar] [CrossRef] [Green Version]
  107. Stan, V.; Fîntîneru, G.; Mihalache, M. Multicriteria analysis of the effects of field burning crop residues. Not. Boanicae Hort. Agrobot. Cluj-Napoca 2014, 42, 255–262. [Google Scholar] [CrossRef] [Green Version]
Figure 1. Study area.
Agronomy 10 00305 g001
Figure 2. Tillage methods in highland agricultural areas: (a) Conventional tillage; (b) Minimum tillage; (c) No-till.
Agronomy 10 00305 g002
Figure 3. Relationship between SOCD and elevation at all sites.
Agronomy 10 00305 g003
Figure 4. Relationship between SOCD and chemical fertilizers: (a) cabbage; (b) upland rice; (c) lowland rice; (d) tomato; (e) strawberry; (f) potato; (g) Japanese pumpkin; (h) cape gooseberry; (i) maize.
Agronomy 10 00305 g004aAgronomy 10 00305 g004b
Figure 5. Relationship between SOCD and crop yields: (a) cabbage; (b) upland rice; (c) lowland rice; (d) tomato; (e) strawberry; (f) potato; (g) Japanese pumpkin; (h) cape gooseberry; (i) maize.
Agronomy 10 00305 g005aAgronomy 10 00305 g005b
Figure 6. Comparison of top SOCD between conventional tillage and minimum tillage of cabbage, strawberry, and maize areas. *, **, *** Significant difference at 10%, 5%, and 1% level, respectively.
Agronomy 10 00305 g006
Figure 7. Comparison of yield between conventional tillage and minimum tillage of cabbage, strawberry, and maize areas. *, **, *** Significant difference at 10%, 5%, and 1% level, respectively
Agronomy 10 00305 g007
Table 1. Soil physical and chemical properties of nine crop types at topsoil (0–30 cm) (mean ± SD).
Crop TypeBulk Density
(Mg m−3)
Sand
(%)
Silt
(%)
Clay
(%)
Clay Plus Silt
(%)
pHSoil Moisture
(%)
Soil Texture
Cabbage1.43 ± 0.1847.0 ± 15.0120.56 ± 5.5632.44 ± 12.0453.72 ± 14.015.54 ± 0.8121.72 ± 11.68Sandy Clay Loam
Upland rice1.41 ± 0.2049.0 ± 17.5715.54 ± 7.4035.46 ± 16.3257.46 ± 20.235.42 ± 0.7730.21 ± 10.01Sandy Clay
Lowland rice1.38 ± 0.1658.0 ± 10.4420.52 ± 7.2821.48 ± 82.2862.39 ± 15.535.40 ± 0.8720.62 ± 11.36Sandy Clay Loam
Tomato1.35 ± 0.0254.43 ± 12.0720.57 ± 5.6225.00 ± 82.3145.57 ± 12.315.97 ± 0.828.64 ± 4.88Sandy Clay Loam
Strawberry1.39 ± 0.0149.14 ± 12.5420.29 ± 4.8230.57 ± 82.6450.86 ± 12.755.41 ± 0.7919.26 ± 9.33Sandy Clay Loam
Potato1.54 ± 0.1354.43 ± 14.8920.57 ± 5.6225.0 ± 79.4945.57 ± 12.315.97 ± 0.828.64 ± 4.88Sandy Clay Loam
Japanese pumpkin1.26 ± 0.1042.33 ± 11.1520.0 ± 7.8037.67 ± 81.0657.67 ± 16.695.65 ± 0.786.23 ± 2.90Clay Loam
Cape gooseberry1.10 ± 1.0852.8 ± 10.6420.80 ± 5.4026.40 ± 8.8847.20 ± 10.645.58 ± 0.7515.94 ± 8.57Sandy Clay Loam
Maize1.55 ± 0.1640.42 ± 14.9320.1 ± 6.4139.51 ± 13.3959.58 ± 14.935.42 ± 0.7218.01 ± 11.39Clay Loam
Table 2. Correlation matrix of soil properties, elevation and top soil organic carbon density (SOCD) at all sites (n = 138).
ElevationBulk DensitySandSiltClayClay Plus SiltpHSoil Moisture
SOCD0.522 **0.210 *−0.351 **0.0020.367 **0.0420.0030.139
Elevation1−0.176 *−0.213 *0.0430.203 *−0.1370.0770.047
*, ** Significant at 10% and 5% level, respectively.
Table 3. Means and standard deviations of elevation, SOCD, crop yields, and management practices.
Crop TypeElevation
(m a.s.l.)
SOCD
(Mg C ha−1)
Yield
(Mg ha−1)
N Fertilizer
(kg ha−1)
P2O5 Fertilizer
(kg ha−1)
K2O Fertilizer
(kg ha−1)
Cattle Manure
(Mg ha−1)
TillageCrop Residue Burning
ConventionalMinimumNo-TillBurnNo Burn
Cabbage1391 ± 9648.05 ± 15.418.0 ± 0.1855.52 ± 8.957.1 ± 3.942.3 ± 3.4-
Upland rice1072 ± 15758.71 ± 20.43.24 ± 0.515.12 ± 9.47.66 ± 2.04.34 ± 1.50.98 ± 0.5
Lowland rice741 ± 25435.21 ± 22.23.56 ± 0.432.67 ± 13.57.75 ± 3.513.5 ± 2.2-
Tomato1271 ± 26842.14 ± 12.921.29 ± 3.046.0 ± 4.941.71 ± 7.755.37 ± 11.70.87 ± 0.3
Strawberry1436 ± 13449.0 ± 14.218.8 ± 0.8567.7 ± 77.6363.27 ± 49.7957.04 ± 57.2-
Potato844 ± 16429.45 ± 29.526.21 ± 1.5218.75 ± 15.6136.71 ± 26.3195.14 ± 27.51.02 ± 0.6
Japanese pumpkin1113 ± 12134.0 ± 13.327.24 ± 1.3395.3 ± 31.3321.92 ± 48.5245.42 ± 40.5-
Cape gooseberry927.8 ± 5019.56 ± 7.40.89 ± 0.138.25 ± 3.138.0 ± 3.226.28 ± 3.2-
Maize880 ± 28752.48 ± 22.14.43 ± 0.5384.39 ± 161.8261.16 ± 56.572.32 ± 21.6-
Table 4. Multi-factor regression models used to predict top SOCD and crop yields using N fertilizer, P2O5 fertilizer, K2O fertilizer, Elevation, Bulk density, Sand, Silt, Clay, Clay plus Silt, pH, and Soil moisture; where Y1 is yield and Y2 is top SOCD.
Crop TypeYieldSOCD
All sites (n = 138)Y1 = 2.108 + 0.016(Elevation) − 0.127(SOCD) − 0.0187(Soil moisture) + 0.009(K2O fertilizer); R2 = 0.473 ***Y2 = −42.846 + 0.044(Elevation) + 28.104(Bulk density) − 0.039(K2O fertilizer) + 0.039(N fertilizer); R2 = 0.478 ***
Cabbage (n = 18)Y1 = 14.901 + 0.064(SOCD); R2 = 0.528 ***Y2 = −171.999 + 0.582(N fertilizer) + 1.887(P2O5 fertilizer) + 1.894(K2O fertilizer); R2 = 0.844 ***
Upland rice (n = 13)Y1 = 4.313 + 0.037(SOCD) − 2.290(Bulk density); R2 = 0.787 ***Y2 = −134.638 + 56.173(Bulk density) +1.554(Clay) + 0.796(Soil moisture) + 0.713(Sand); R2 = 0.950 ***
Lowland rice (n = 31)Y1 = 3.387 + 0.016(SOCD) − 0.001(Elevation); R2 = 0.600 ***Y2 = −20.620 + 0.923(N fertilizer) − 0.529(Soil moisture) + 2.713(K2O fertilizer); R2 = 0.720 ***
Tomato (n = 7)-Y2 = −38.880 + 0.042(Elevation) + 0.674(P2O5 fertilizer); R2 = 0.949 ***
Strawberry (n = 7)Y1 = 21.147 − 0.124(Soil moisture) − 0.051(Clay) + 0.04(P2O5 fertilizer); R2 = 0.998 ***Y2 = −70.960 + 0.168(N fertilizer) + 0.068(P2O5 fertilizer); R2 = 0.982 ***
Potato (n = 7)Y1 = 10.265 + 0.073(N fertilizer); R2 = 0.572 ***Y2 = −104.677 + 0.159(Elevation); R2 = 0.776 ***
Japanese pumpkin (n = 6)Y1 = 29.330 − 0.311(Soil moisture) − 0.027(Clay plus Silt) + 0.004(P2O5 fertilizer); R2 = 0.904 ***Y2 = 65.858 − 1.595(Silt); R2 = 0.868 ***
Maize (n = 44)Y1 = 4.080 + 0.021(SOCD) − 0.001(Elevation) + 0.001(N fertilizer) − 0.007(Clay plus Silt); R2 = 0.680 ***Y2 = −6.447 + 0.054(Elevation) + 0.030(N fertilizer); R2 = 0.659 ***
*, **, *** Significant at 10%, 5%, and 1% level, respectively.

