Article

Transcriptomic Analysis of Female Panicles Reveals Gene Expression Responses to Drought Stress in Maize (Zea mays L.)

1
The Collaborative Center Innovation of Henan Food Crops, National Key Laboratory of Wheat and Maize Crop Science, Henan Agricultural University, Zhengzhou 450046, China
2
Farmland Irrigation Research Institute, CAAS/National Agro-ecological System Observation and Research Station of Shangqiu, Xinxiang 453002, China
*
Authors to whom correspondence should be addressed.
These authors are equal contribution to this study.
Submission received: 8 January 2020 / Revised: 12 February 2020 / Accepted: 14 February 2020 / Published: 24 February 2020

Abstract

:
Female panicles (FPs) play an important role in the formation of yields in maize. From 40 days after sowing to the tasseling stage for summer maize, FPs are developing and sensitive to drought. However, it remains unclear how FPs respond to drought stress during FP development. In this study, FP differentiation was observed at 20 and 30 days after drought (DAD) and agronomic trait changes of maize ears were determined across three treatments, including well-watered (CK), light drought (LD), and moderate drought (MD) treatments at 20, 25, and 30 DAD. RNA-sequencing was then used to identify differentially expressed genes (DEGs) in FPs at 30 DAD. Spikelets and florets were suppressed in LD and MD treatments, suggesting that drought slows FP development and thus decreases yields. Transcriptome analysis indicated that 40, 876, and 887 DEGs were detected in LD/CK, MD/CK, and MD/LD comparisons. KEGG pathway analysis showed that ‘biosynthesis of other secondary metabolites’ and ‘carbohydrate metabolism’ were involved in the LD response, whereas ‘starch and sucrose metabolism’ and ‘plant hormone signal transduction’ played important roles in the MD response. In addition, a series of molecular cues related to development and growth were screened for their drought stress responses.

1. Introduction

Under the influence of global warming, changes in climatic conditions are creating unusual weather phenomena worldwide, often imposing drought stress on crops [1,2]. From the agricultural perspective, drought often results in decreased crop productivity and growth [3,4,5], especially for cereal crops. Maize (Zea mays L.) is one of the most important cereal crops and has the most extensive planting area globally [6,7]. One of the most important factors limiting maize growth and development around the world is a lack of water [8,9,10,11]. Accordingly, improving tolerance of maize to drought stress is essential for achieving high and stable yields in cereal crops.
As a multidimensional stress, water limitation triggers a wide variety of plant responses; these range from responses at the physiological and biochemical levels to the molecular level [12,13,14,15,16]. When external drought stimuli are perceived and captured by sensors on cell membranes, the signals are transmitted through multiple signal transduction pathways. Then, plant can regulate the expression of drought-responsive genes to protect themselves from the harmful effects of external stimuli [17,18]. The expressed products of drought-responsive genes are mainly proteins involved in signaling cascades and transcriptional regulation (such as protein kinase, protein phosphatase, and transcription factors) and functional proteins [19]. With the rapid development of high-throughput sequencing technologies, transcriptome analyses have been conducted to identify stress-mediated differences at the level of gene expression. Previous research has shown that many significantly differentially regulated genes that were associated with drought tolerance are induced in different organs of maize plants [20,21,22,23,24,25,26]. For example, 249 and 3000 differentially expressed genes (DEGs) were involved in root tissues after 6 h of light and severe drought stress, respectively [23]. In leaves, a total of 619 DEGs and 126 transcripts had their expression levels altered by drought stress at flowering time [24]. In tassels, 1902 DEGs were found after 5–7 days of drought stress [25]. In young ears, a total of 1825 DEGs were identified on the 5th day of drought stress at the V9 stage [26].
The panicle stage (from jointing to flowering) is the key stage for panicle differentiation and development in maize, the number of rows per ear and the number of grains per row are dependent on spikelet and floret differentiation at this time [27]. Therefore, the growth and development of female panicles (FPs) play an important role in the formation of maize yields. Although great advances in understanding differentiation of FPs and how drought stress affects genes transcription in FPs have been achieved in the past few decades [26,28,29,30,31], so far, progress in understanding the general molecular basis of FP development in response to long-term drought stress across the panicle stage has not been reported.
Accordingly, in this study, maize inbred line PH6WC (6WC) was used as drought-sensitive experimental material [32], soil water was controlled by means of drip irrigation for 30 days, and the gene expression dynamics of developing FPs at 30 days after drought (DAD) were investigated using transcriptomic analysis. The DEGs were identified and assigned to functional categories to reveal the various metabolic pathways in FPs that are involved in responses to long-term drought stress at different levels. Furthermore, differences in transcription factors between treatments were also analyzed. Overall, the exploration and function prediction of drought-response genes in maize FPs represent an efficient approach to improving the molecular breeding of drought-resistance maize cultivars.

2. Materials and Methods

2.1. Plant Material and Growth Conditions

Field experiments were conducted at field experiment stations (34°31′ N, 115°35′ E, 50.7 m above sea level) during the maize growing season (June–October, 2018) in Shangqiu (Henan, China). The maize inbred line 6WC was grown in 9 experimental plots (each plot was 2 m wide, 3.3 m long, 1.8 m deep) which were under a movable awning and filled with luvo-aquic soils, with a 20 cm sand filter layer at the bottom. Maize were planted into four rows, with 40 cm between rows in each plot. Two to three seeds were sown at each acupoint, with subsequent thinning to one seedling conducted at the trifoliate stage (V3). The final stand density was 8 plants m−2. During the jointing and tasseling stages, topdressing fertilizer was applied, and weeds, insects, and diseases were controlled throughout the experiment. The top soil (0–40 cm layer) had a pH (water) of 7.3, mean mineral P content of 3.24 g/kg, and inorganic N at sowing of 3.60 g/kg. The average daily maximum and minimum temperatures of the field experiment during the trial were 32.98 °C and 20.71 °C, respectively.

2.2. Drought Stress Treatments

During FP development, soil moisture was controlled by means of drip irrigation at 80 ± 5% of the field water capacity (FWC) (well-watered, CK), 60 ± 5% of FWC (light drought, LD), and 45 ± 5% of FWC (moderate drought, MD). The meter was checked every morning and evening throughout the growth period to guide adjustments of the soil moisture. When the treated soil moisture dropped towards its lower limit, moderate drip irrigation was carried out until the upper limit level was reached, and the irrigation volume was measured by a water meter. After 30 DAD, the drought treatment plots were rehydrated to the CK level. Other field management measures reflected standard field management practices.

2.3. Measurement of Morphology and Microscopic Observation of Female Panicles

Plant height was measured from the ground to the top of the leaves in their natural growth state at 20, 25, and 30 DAD. The length and width of all the green leaves were measured by ruler in order to calculate leaf area, and the leaf area index (LAI) was determined according to this method [33]. Dry matter accumulation in stalks, leaves, tassels and ears of maize plants were measured at 20, 25, and 30 DAD. After 30 min of defoliation at 105 °C, dry weight was determined after being dried at 75 °C until a constant weight was reached. The percentage of drought limitation was calculated as (T2−T1)/T1. Here, T2 was shoot dry matter under the MD or LD treatment, while T1 was shoot dry matter under the control or LD treatment [34]. FPs were dissected with a dissecting needle at 20 and 27 DAD and analyzed under a stereomicroscope (Guanpujia, SMZ-B2, Beijing, China) to observe the differentiation of developing female inflorescences. There were three biological replicates in each group.

2.4. RNA Isolation and Illumina Sequencing

Three plants with consistent growth were selected from each treatment at 30 DAD, FP bracts were sampled, and the upper, middle, and lower parts of the ears were mixed evenly and then frozen at −80 °C prior to RNA-sequencing (RNA-seq) analysis. Total RNA was extracted using the mirVana miRNA Isolation Kit (Ambion, Inc., Austin, TX, USA). RNA integrity was evaluated using the Agilent 2100 Bioanalyzer (Agilent Technologies, Santa Clara, CA, USA). Shanghai OE Biotech (Shanghai, China) conducted RNA-Seq library construction and high-throughput sequencing based on total RNA from the female inflorescence. The libraries were sequenced on the Illumina sequencing platform (HiSeq 2500l, Illumina, San Diego, CA, USA) with 125 bp paired-end reads. The raw RNA-seq data have been uploaded to NCBI SRA (BioProject ID: PRJNA604094).

2.5. Read Mapping and Differential Expression Analysis

Base calling was conducted using the raw image data generated by sequencing to obtain sequence data, and the called raw data (raw reads) were stored in fastq format. Raw data (raw reads) were processed using Trimmomatic [35]. The reads containing poly-N runs and low-quality reads were removed to obtain the clean reads. Then, the clean reads were mapped to the reference (NCBI_B73_v4) genome [36] using HISAT2 (version 2.2.1.0) [37]. The Fragments Per kb Per Million Reads (FPKM) values were calculated using cufflinks (version 2.2.1) [38,39], followed by differential expression analysis using DESeq (version1.18.0) [40]. Genes with |fold change| > 2 and p < 0.05 were identified as differentially expressed genes with p presented as raw p-values rather than FDR adjusted p-values.

2.6. GO and KEGG Enrichment Analysis

The significantly expressed Gene Ontology (GO) terms were selected by GO enrichment analysis according to the GO database (http://geneontology.org/). The differences in the frequency of assignment of GO terms in the DEG set were compared with the expressed genes in the CK, LD, and MD samples (p < 0.05). Functional groups encompassing DEGs were identified based on GO analysis, and pathway analysis was conducted according to the Kyoto Encyclopedia of Genes and Genomes (KEGG) database (http://www.genome.jp/kegg/), with manual reannotation based on several databases and a literature search.

2.7. Differential Expression Verification by Quantitative Real-Time PCR (qRT-PCR)

Transcriptome sequencing data were validated by qRT-PCR. Total RNA was reverse transcribed using EasyScript One-Step gDNA Removal and cDNA Synthesis SuperMix (TRANS, Beijing, China). The qRT-PCR experimental methods used HiScript Q RT SuperMix for qPCR (Vazyme, Nanjing, China). The primer sequences were designed using Primer 5 and are listed in Supplementary Materials Table S1. The relative quantification 2−∆∆Ct method was used to calculate the expression level of target genes in different treatments.

2.8. Statistical Analysis

Data collation and graphic rendering were conducted with SIGMAPLOT 14.0 (Systat Software Inc., San Jose, CA, USA), Microsoft Excel, and Microsoft PowerPoint 2016 software (Microsoft Corp., Redmond, WA, USA). All data are expressed as the mean ± SD value from three independent experiments unless otherwise stated. Data were analyzed by one-way ANOVA using Duncan’s multiple range test at a p < 0.05 significance threshold in SPSS (IBM Corp., Armonk, NY, USA).

3. Results

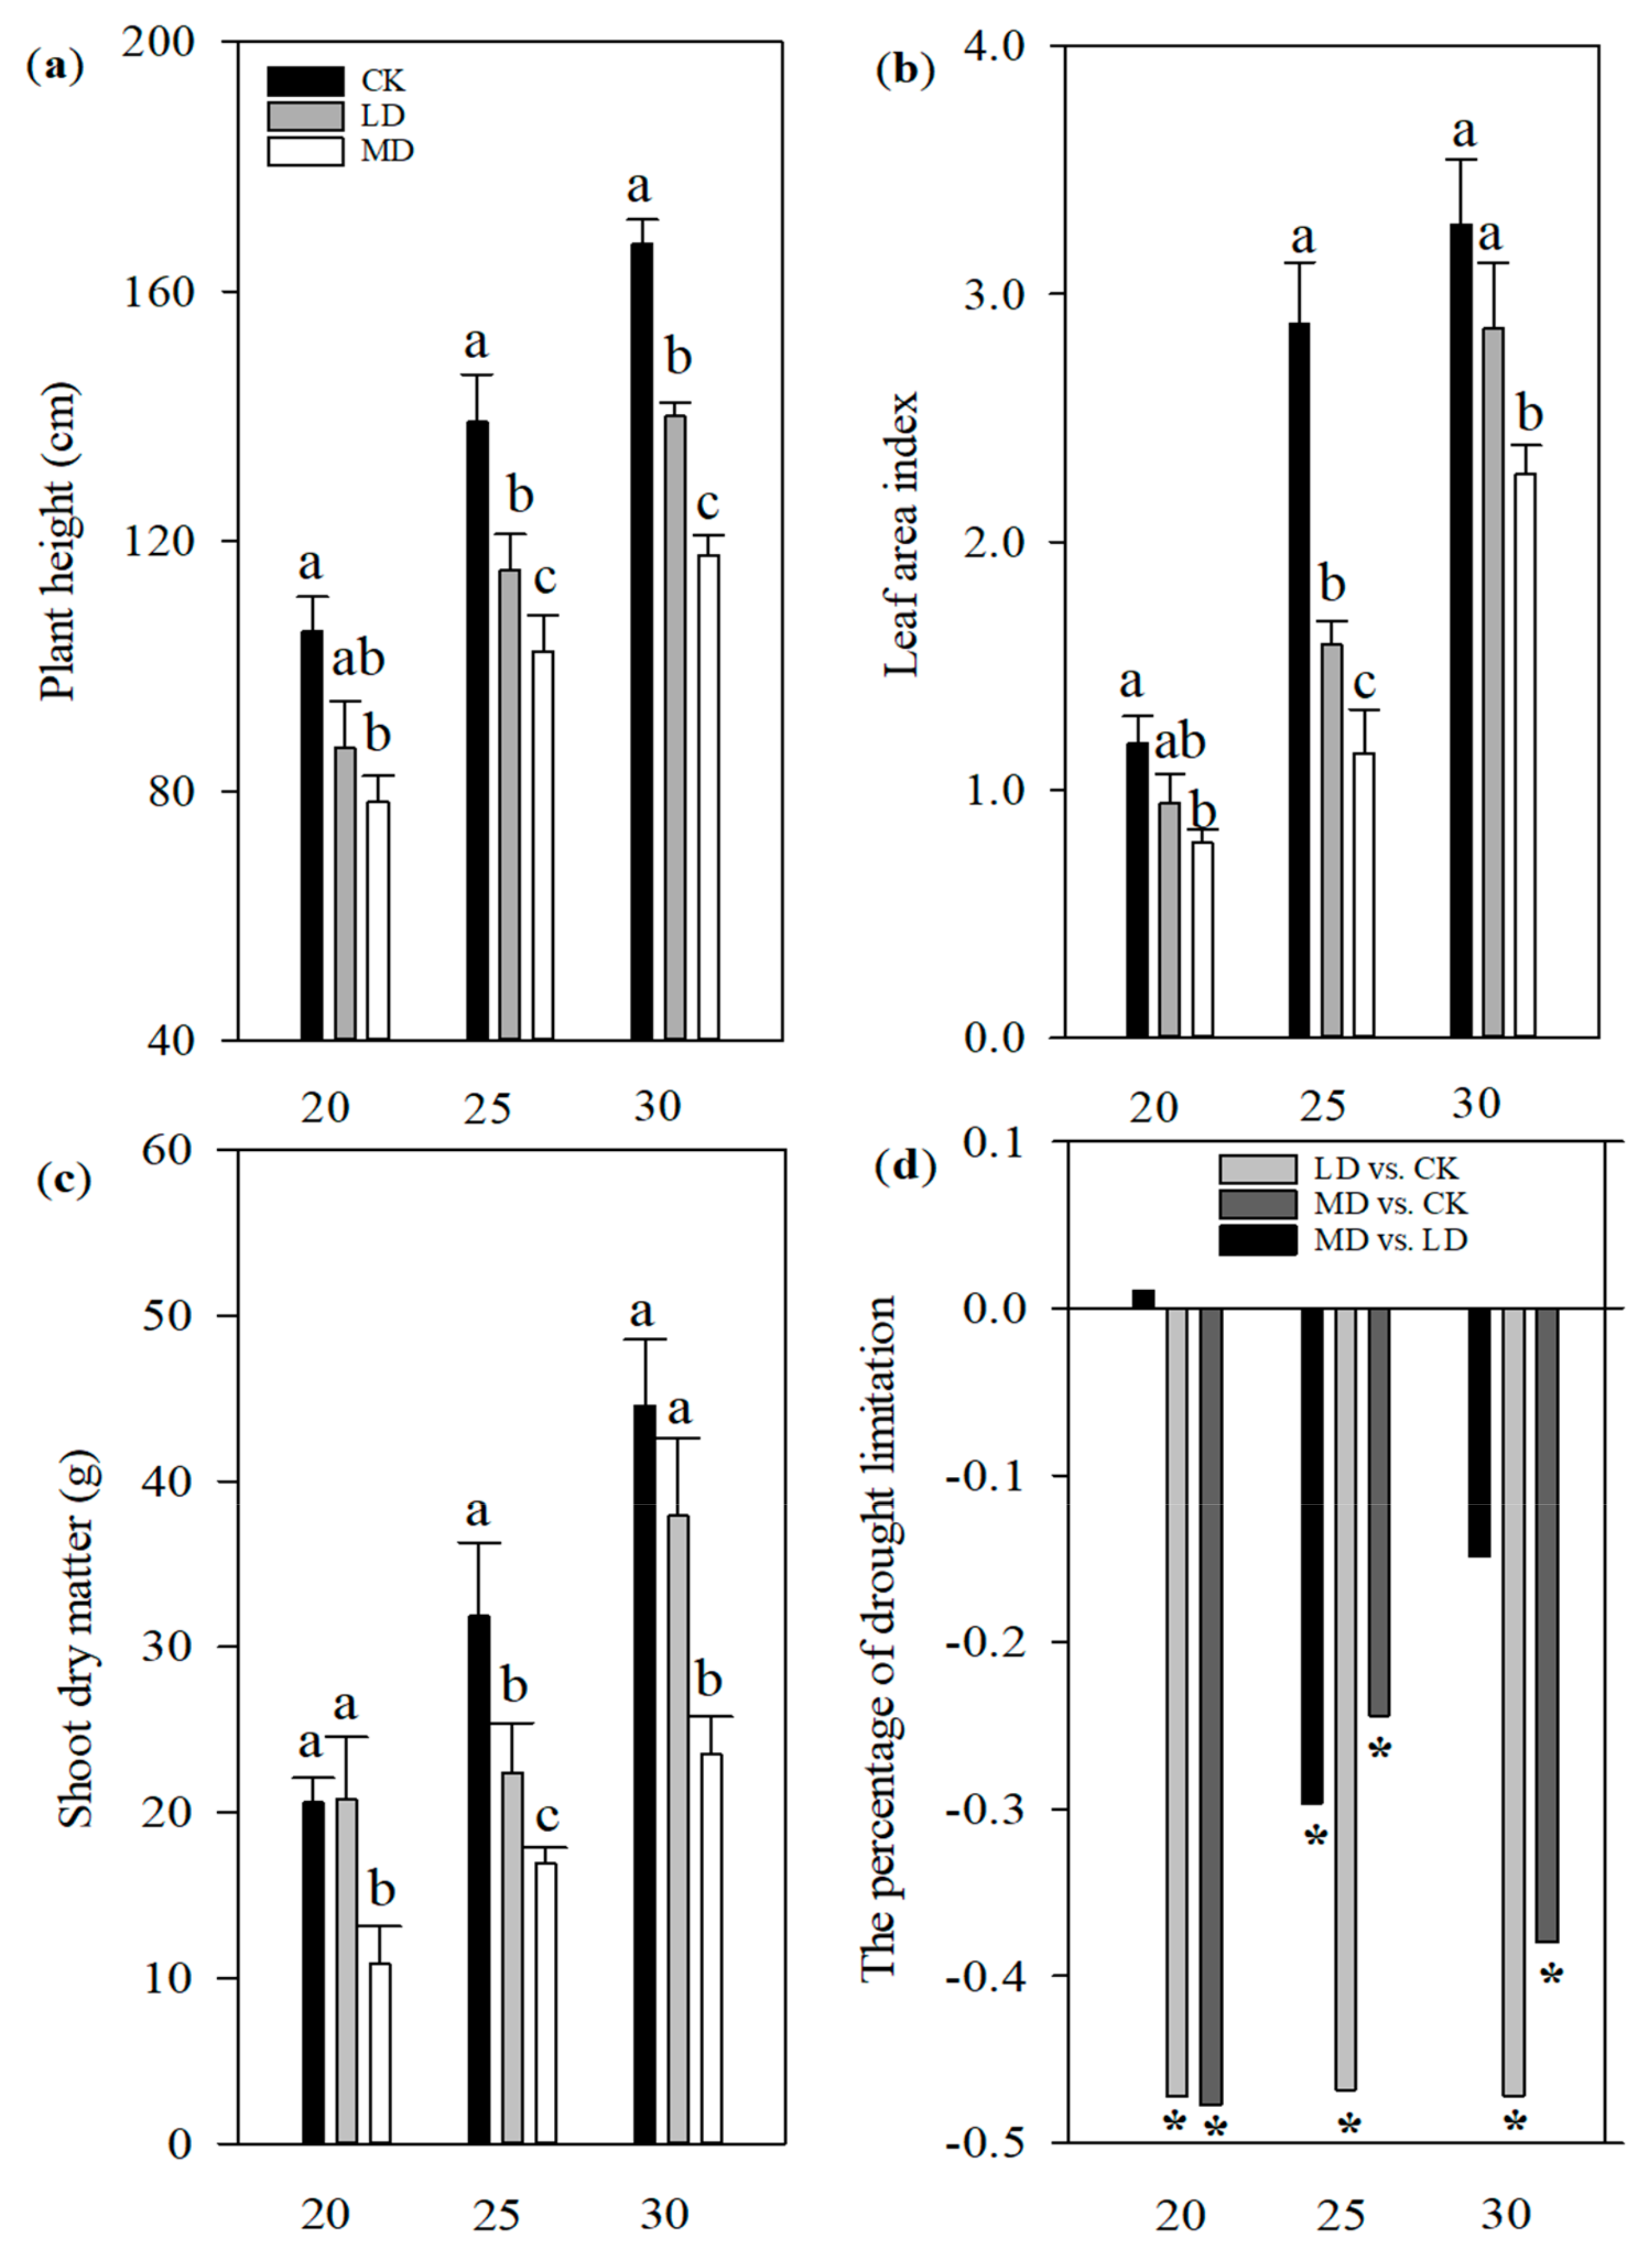
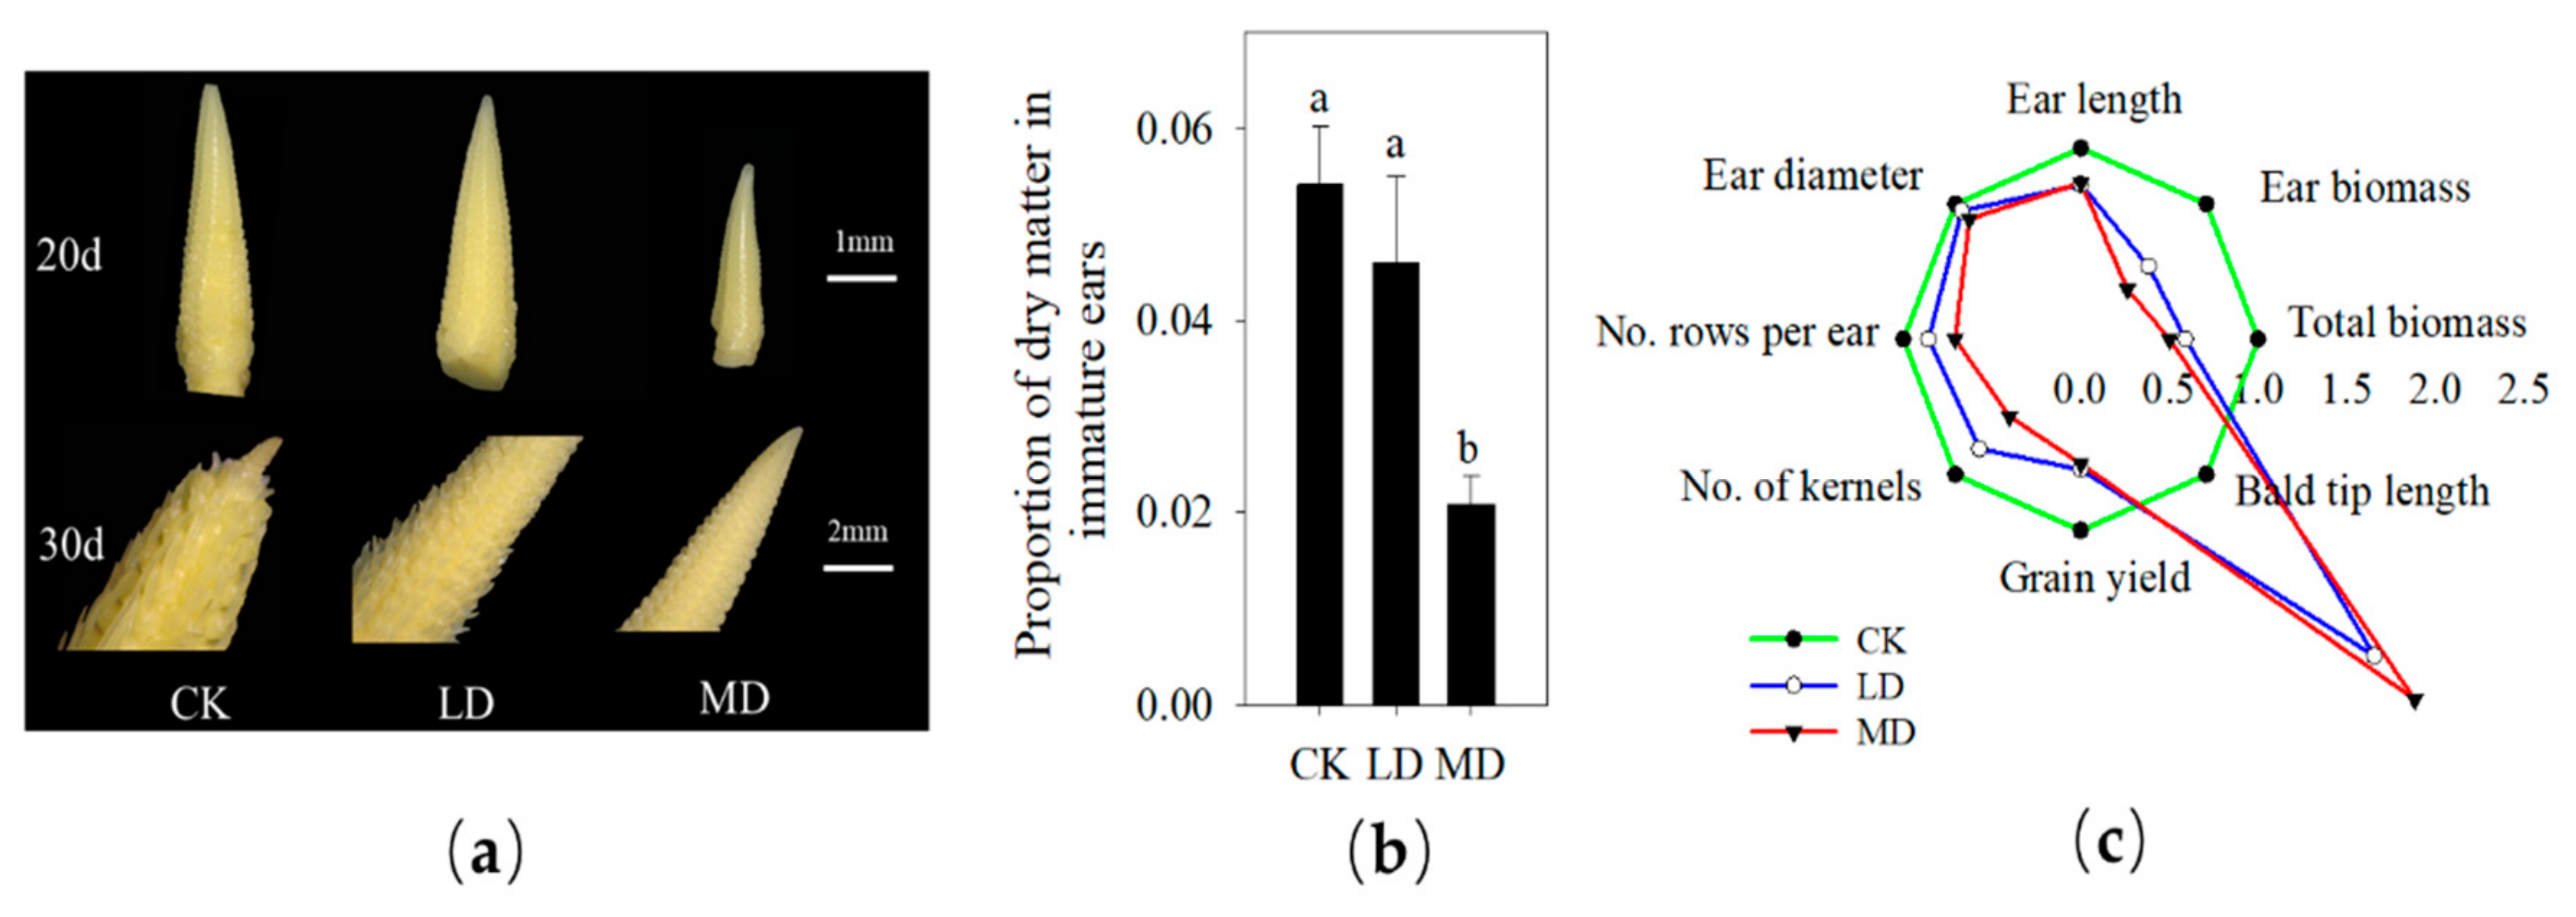
3.1. Female Panicle Development, Phenotypic Change and Yield Components

Plant height, LAI, dry matter accumulation, and the percentage of drought limitation were measured at 20, 25, and 30 DAD. For example, plant height was reduced by 17.63%, 17.01%, and 16.44% under the LD treatment compared with CK, respectively; furthermore, MD significantly decreased plant height by 25.86%, 26.34%, and 29.73% (Figure 1a), respectively. Leaf area index was significantly decreased under MD at 20, 25, and 30 DAD compared with CK plants, but was not significantly changed at 20 and 30 DAD under LD (Figure 1b). For dry matter accumulation, MD significantly decreased the shoot dry matter at 20, 25, and 30 DAD compared with CK plants, but it was not significantly reduced in the LD vs. CK comparison at 20 and 30 DAD (Figure 1c). In addition, the percentage of drought limitation had the highest absolute values at 20, 25, and 30 DAD after MD treatment. However, the percentage of drought limitation was not significantly affected by LD treatment at 20 and 30 DAD compared with CK (Figure 1d).
From 20 to 30 DAD, according to the book Corn Growth and Development [41], FPs may be in the process of differentiation. To explore the responses of FPs to drought stress, maize plants were dissected. The length and diameter of FPs were significantly decreased under the MD treatment at 20 and at 30 DAD; silk was seen in CK and LD plants, but there was no floral differentiation MD plants (Figure 2a). Proportion of dry matter in FP was decreased under LD and MD treatments (Figure 2b). To investigate the effect of drought stress on development and number of mature ears, ear size, and dry matter, yield components were determined (Figure 2c, Supplementary Materials Table S2), which showed that LD and MD treatments significantly decreased ear size and increased the bald tip length. For this reason, the numbers of rows and kernels were reduced by 14.00% and 29.00% under the LD treatment and 19.00% and 43.00%, respectively, under the MD treatment. Therefore, drought resulted in great losses in grain yield of 32.00% and 35.00% under the LD and MD treatments, respectively (Figure 2c, Supplementary Materials Table S2).

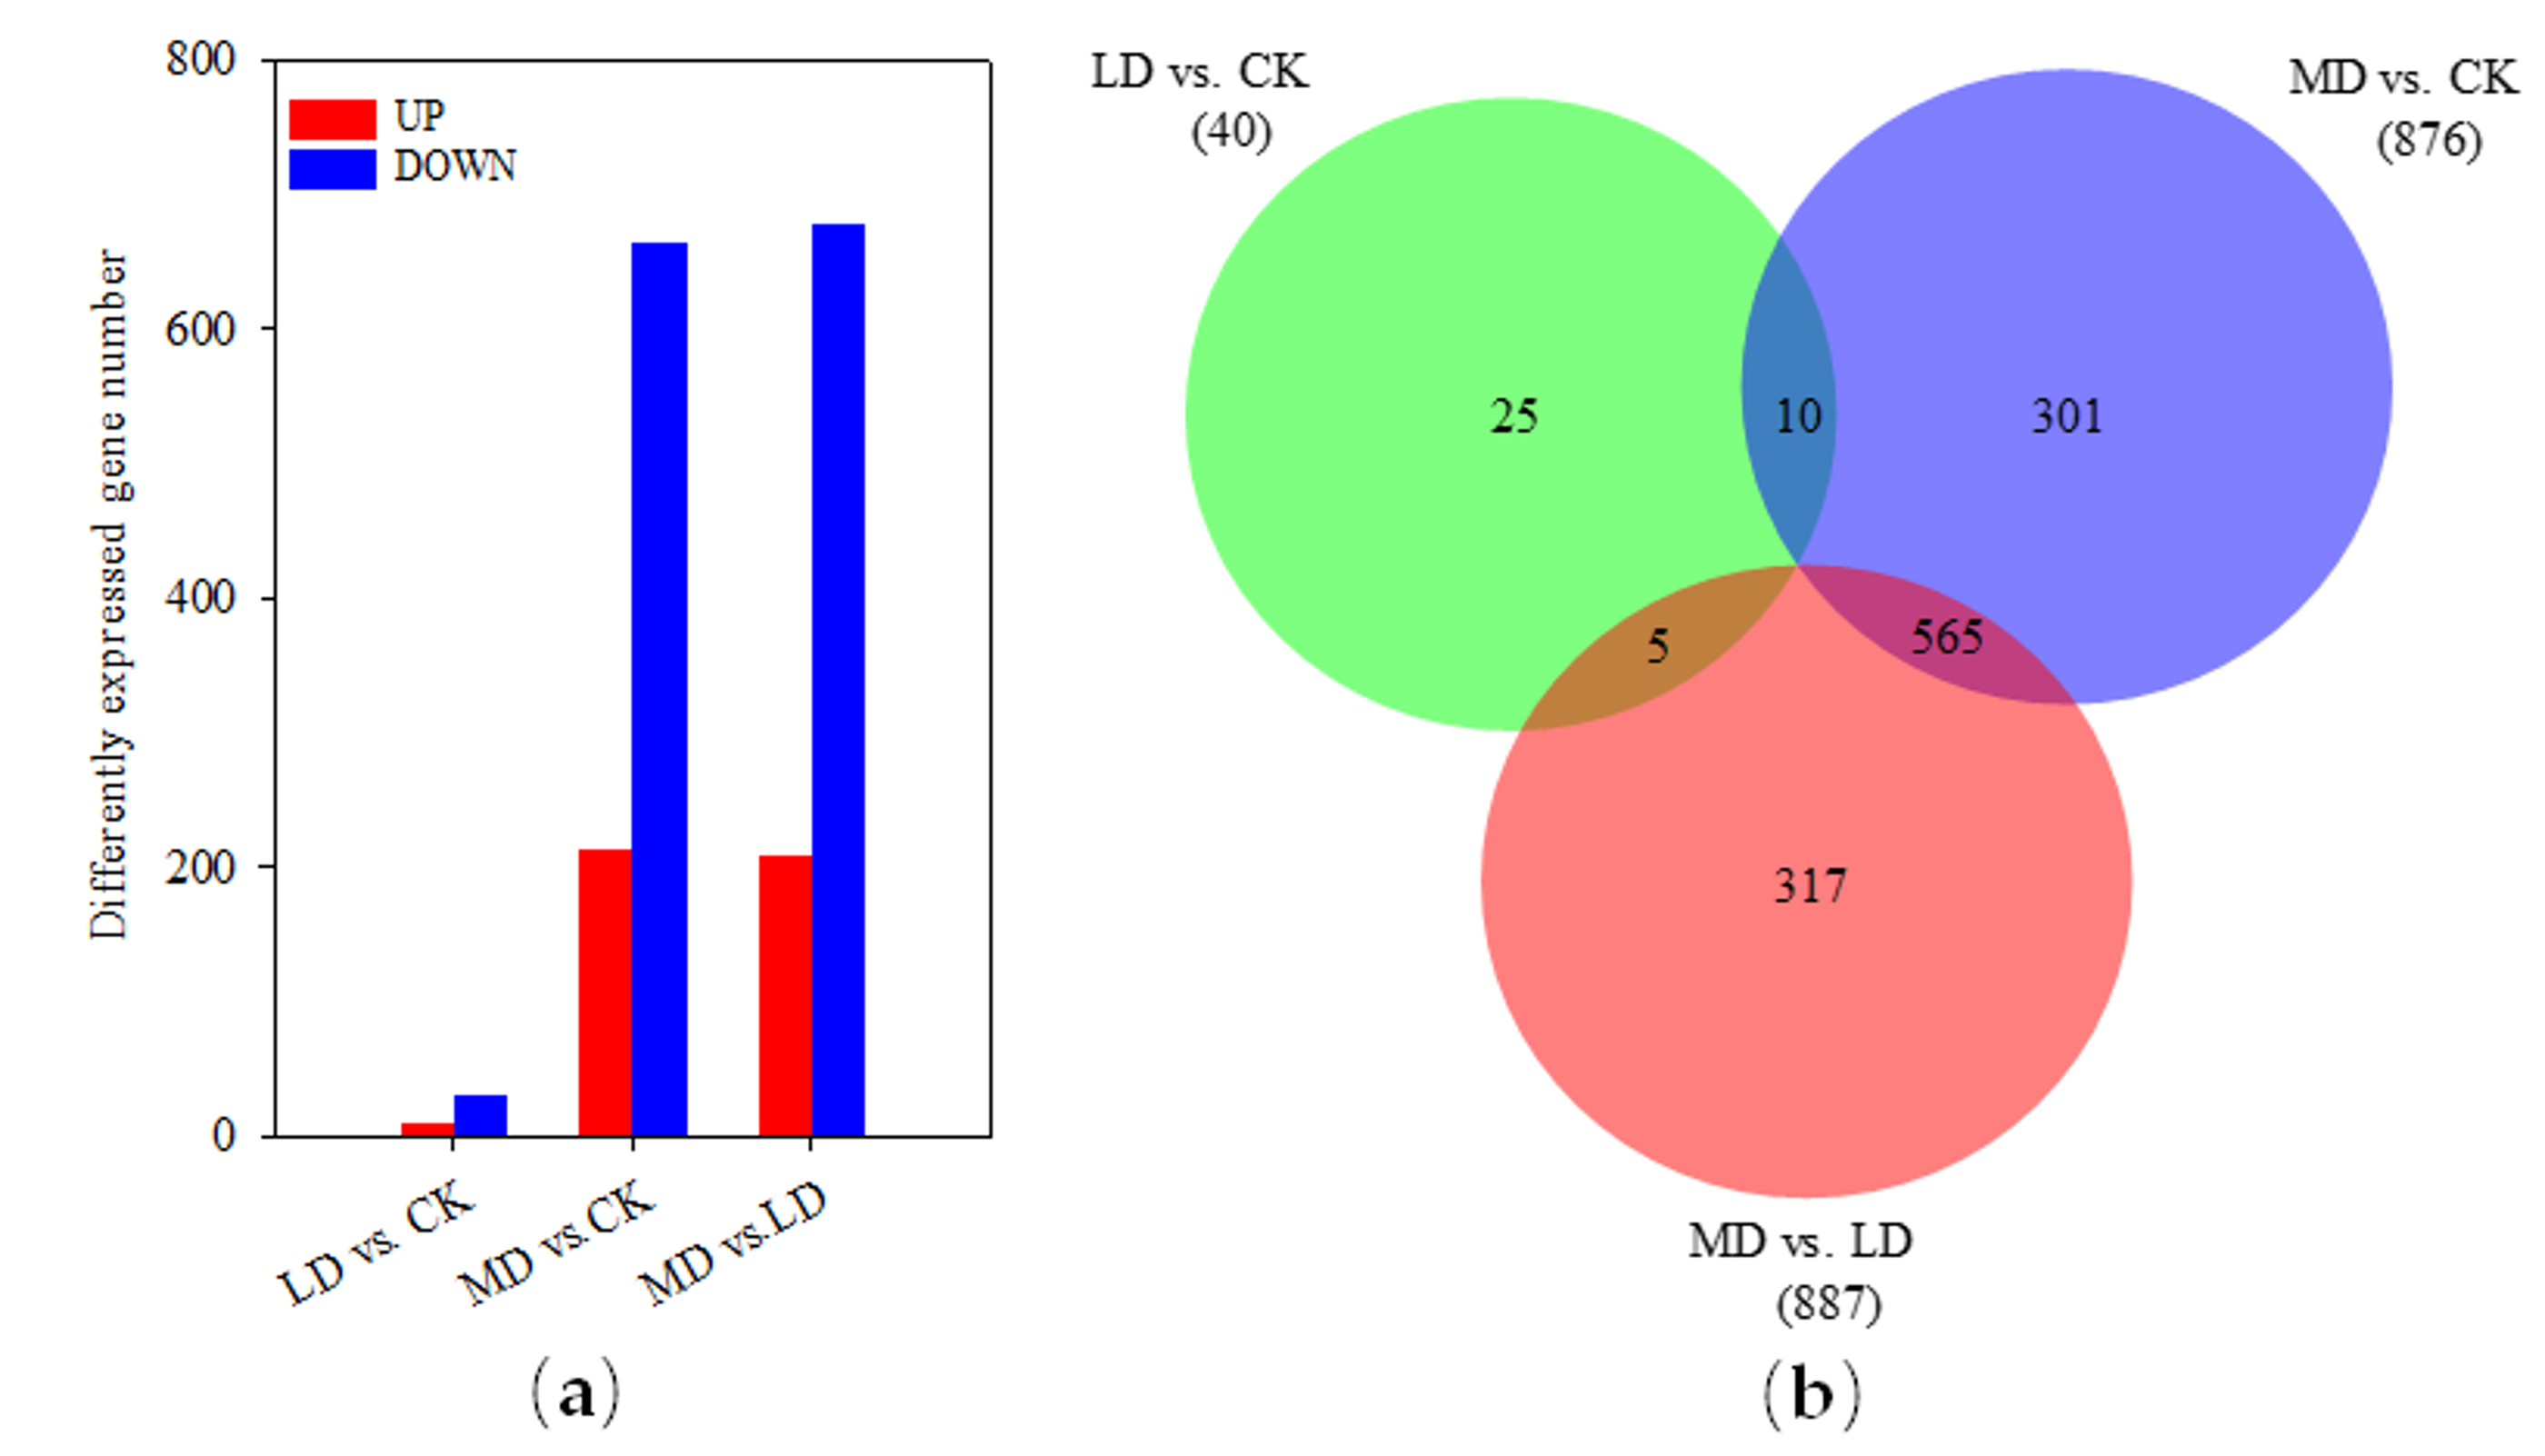
3.2. Overview of RNA Sequencing and Mapping

A total of 49.42 million raw reads were obtained from PH6WC transcriptome libraries (Supplementary Materials Table S3). More than 96.72% of them (47.80 million clean reads) remained after discarding low-quality reads and reads containing adaptor sequences, which were then used for downstream analyses. The clean reads were mapped to the B73 reference genome (ZmB73_RefGen_v4). Overall, 94.34–94.52% of clean reads from nine samples were mapped onto the reference genome (Supplementary Materials Table S3). On average, approximately 43.93 (91.29%), 43.73 (91.13%), and 43.70 (91.17%) million reads from the CK, LD, and MD treatments, respectively, were uniquely mapped onto the reference genome.
Compared with the CK treatment, only 40 genes (log2 foldchange > 1 and p < 0.05), including nine up-regulated and 31 down-regulated genes, showed significantly differential expression in the LD treatment, and a total of 212 up-regulated and 664 down-regulated genes were identified in the MD treatment. A total of 887 DEGs, including 208 up-regulated and 679 down-regulated genes, were identified in the MD versus LD comparison (Figure 3a). A Venn diagram of the DEGs illustrated that there were 10 common genes that appeared in the LD vs. CK and MD vs. CK comparisons, five genes shared between the LD vs. CK and MD vs. LD comparisons, and 565 genes shared between the MD vs. LD and MD vs. CK comparisons. However, there were no DEGs commonly expressed in all three comparisons (Figure 3b).

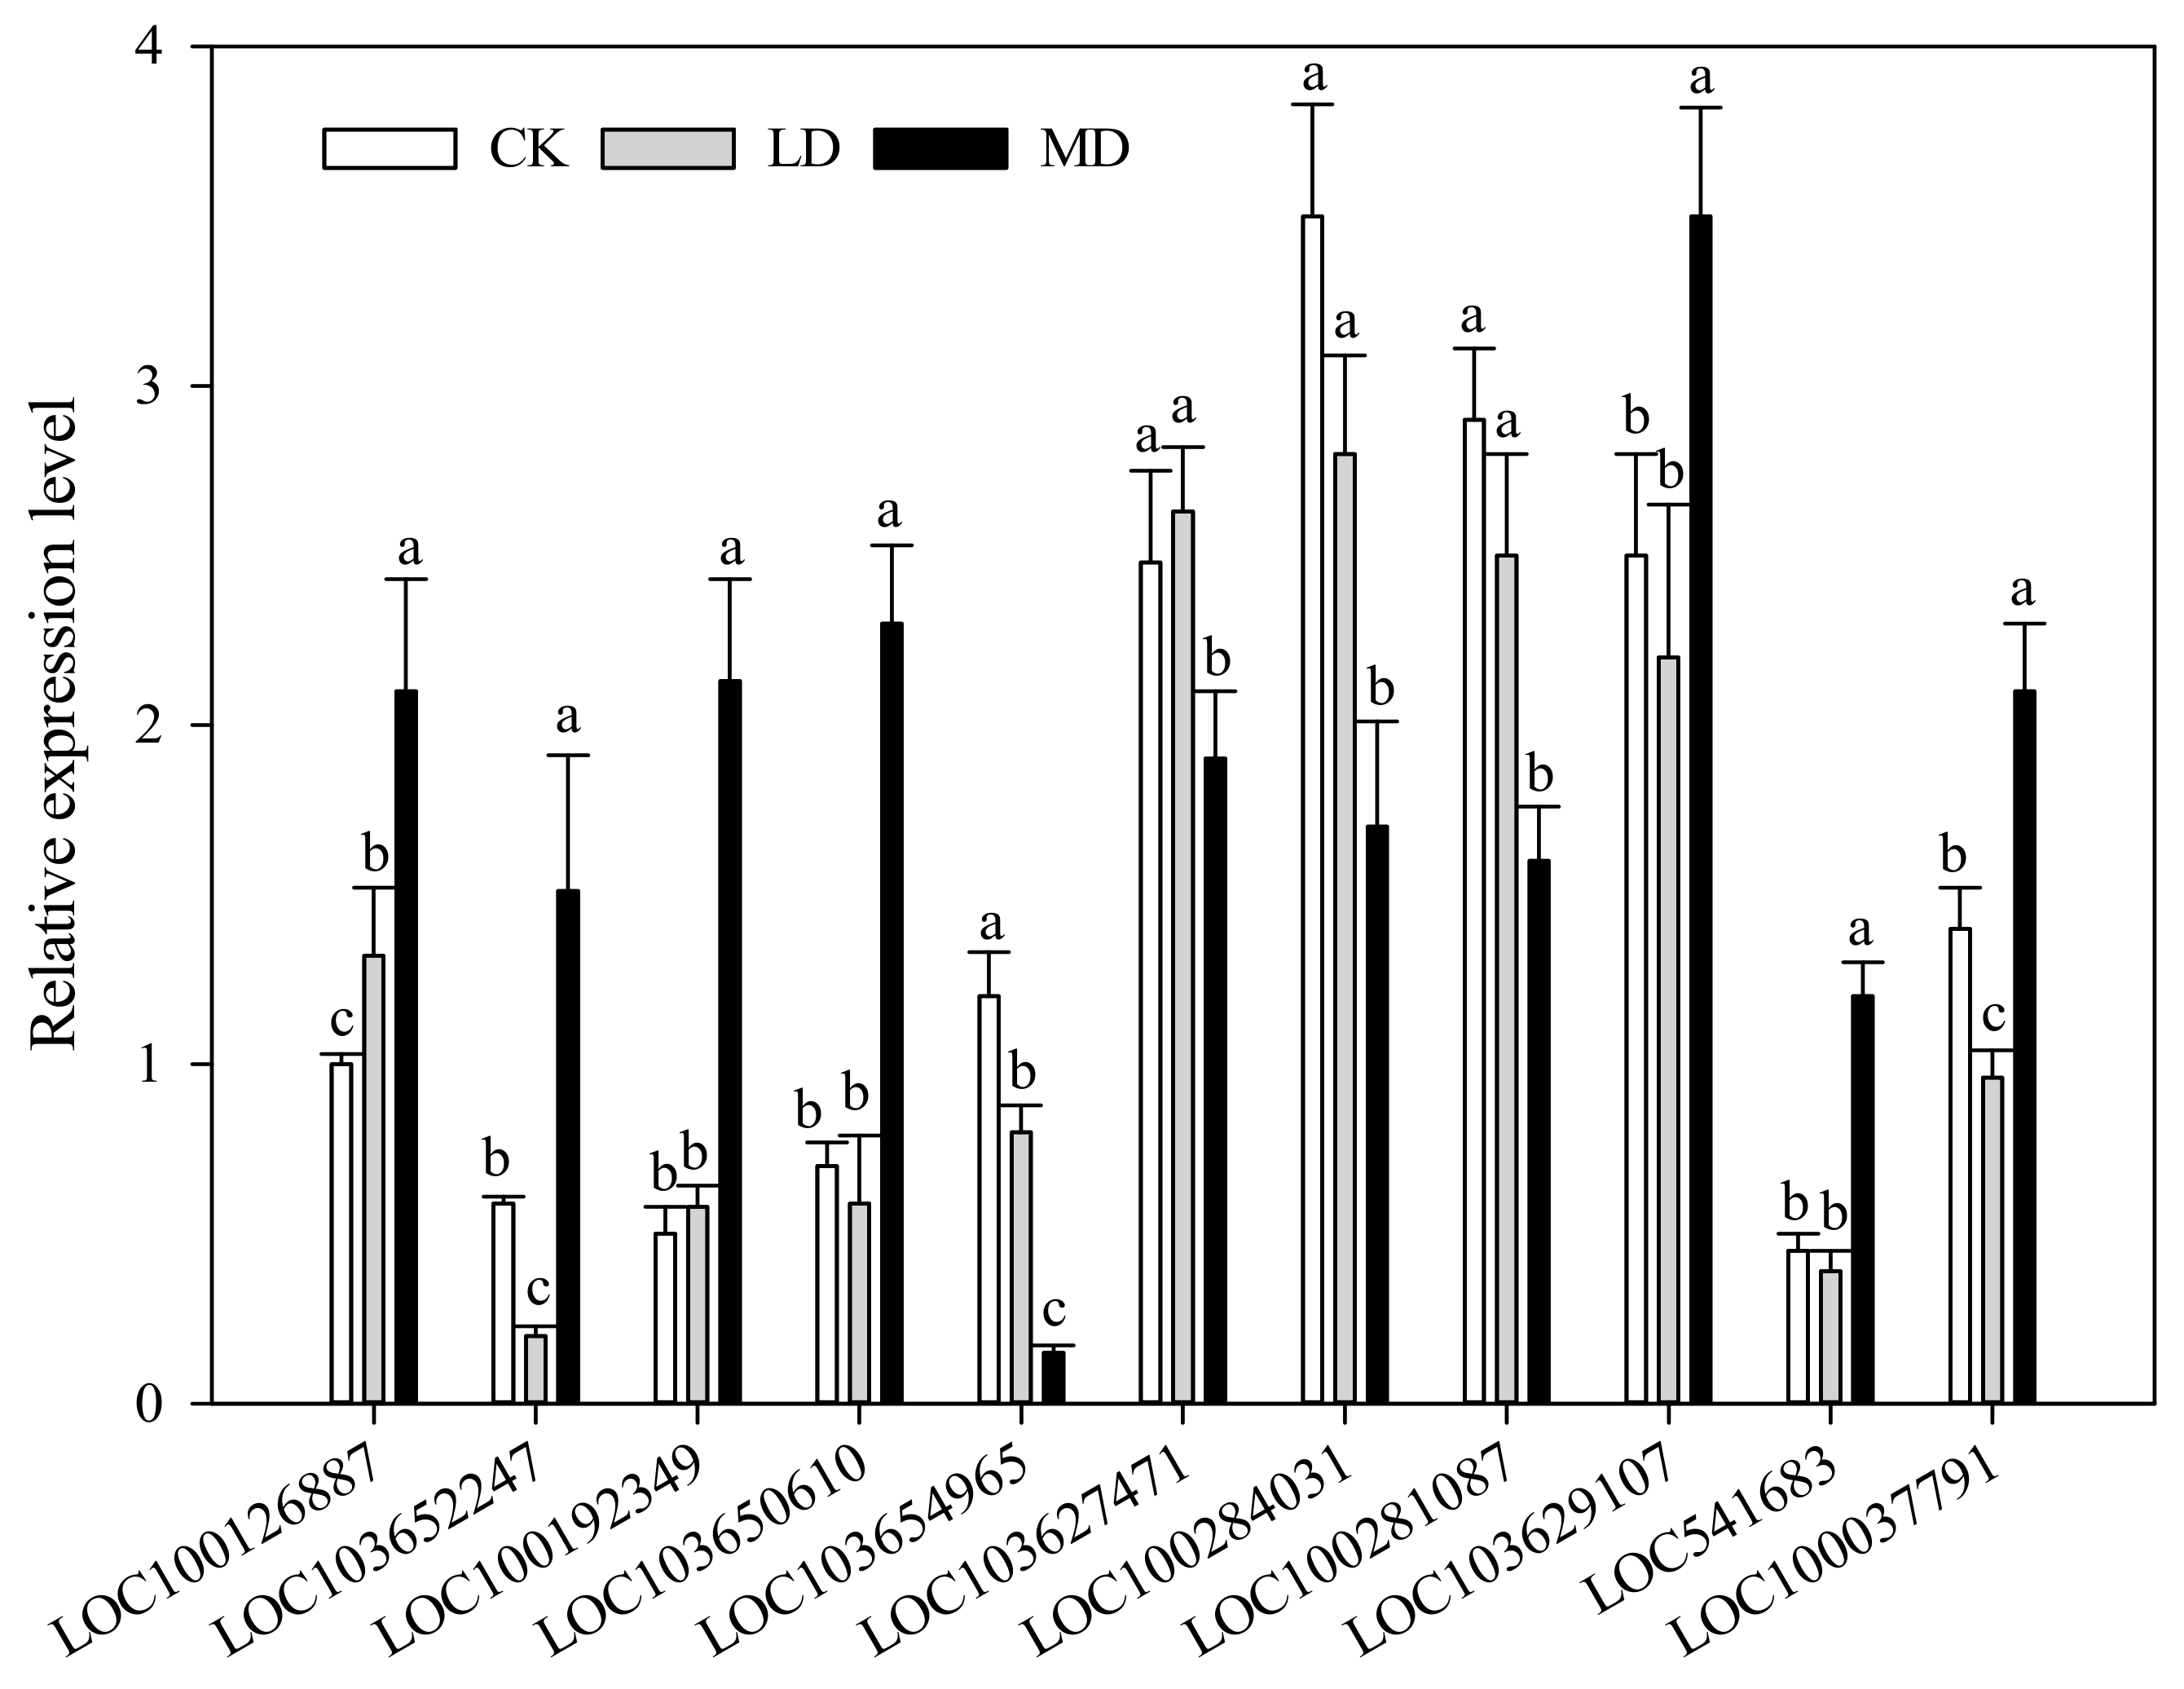
3.3. Gene Expression Validation by qRT-PCR

To investigate the changes in gene expression at the mRNA level, eight randomly selected genes and three specific genes cuc2 (LOC103629107), TE1 (LOC541683), DLF1 (LOC100037791) were analyzed using quantitative real-time RT-PCR for validation of RNA-seq. The level of expression of the genes amplified is shown in Figure 4.
Raw data were compared to transcriptomics data (Supplementary Materials Table S4), which closely resembled each other, validating the differential expression of the genes identified as being under drought stress.

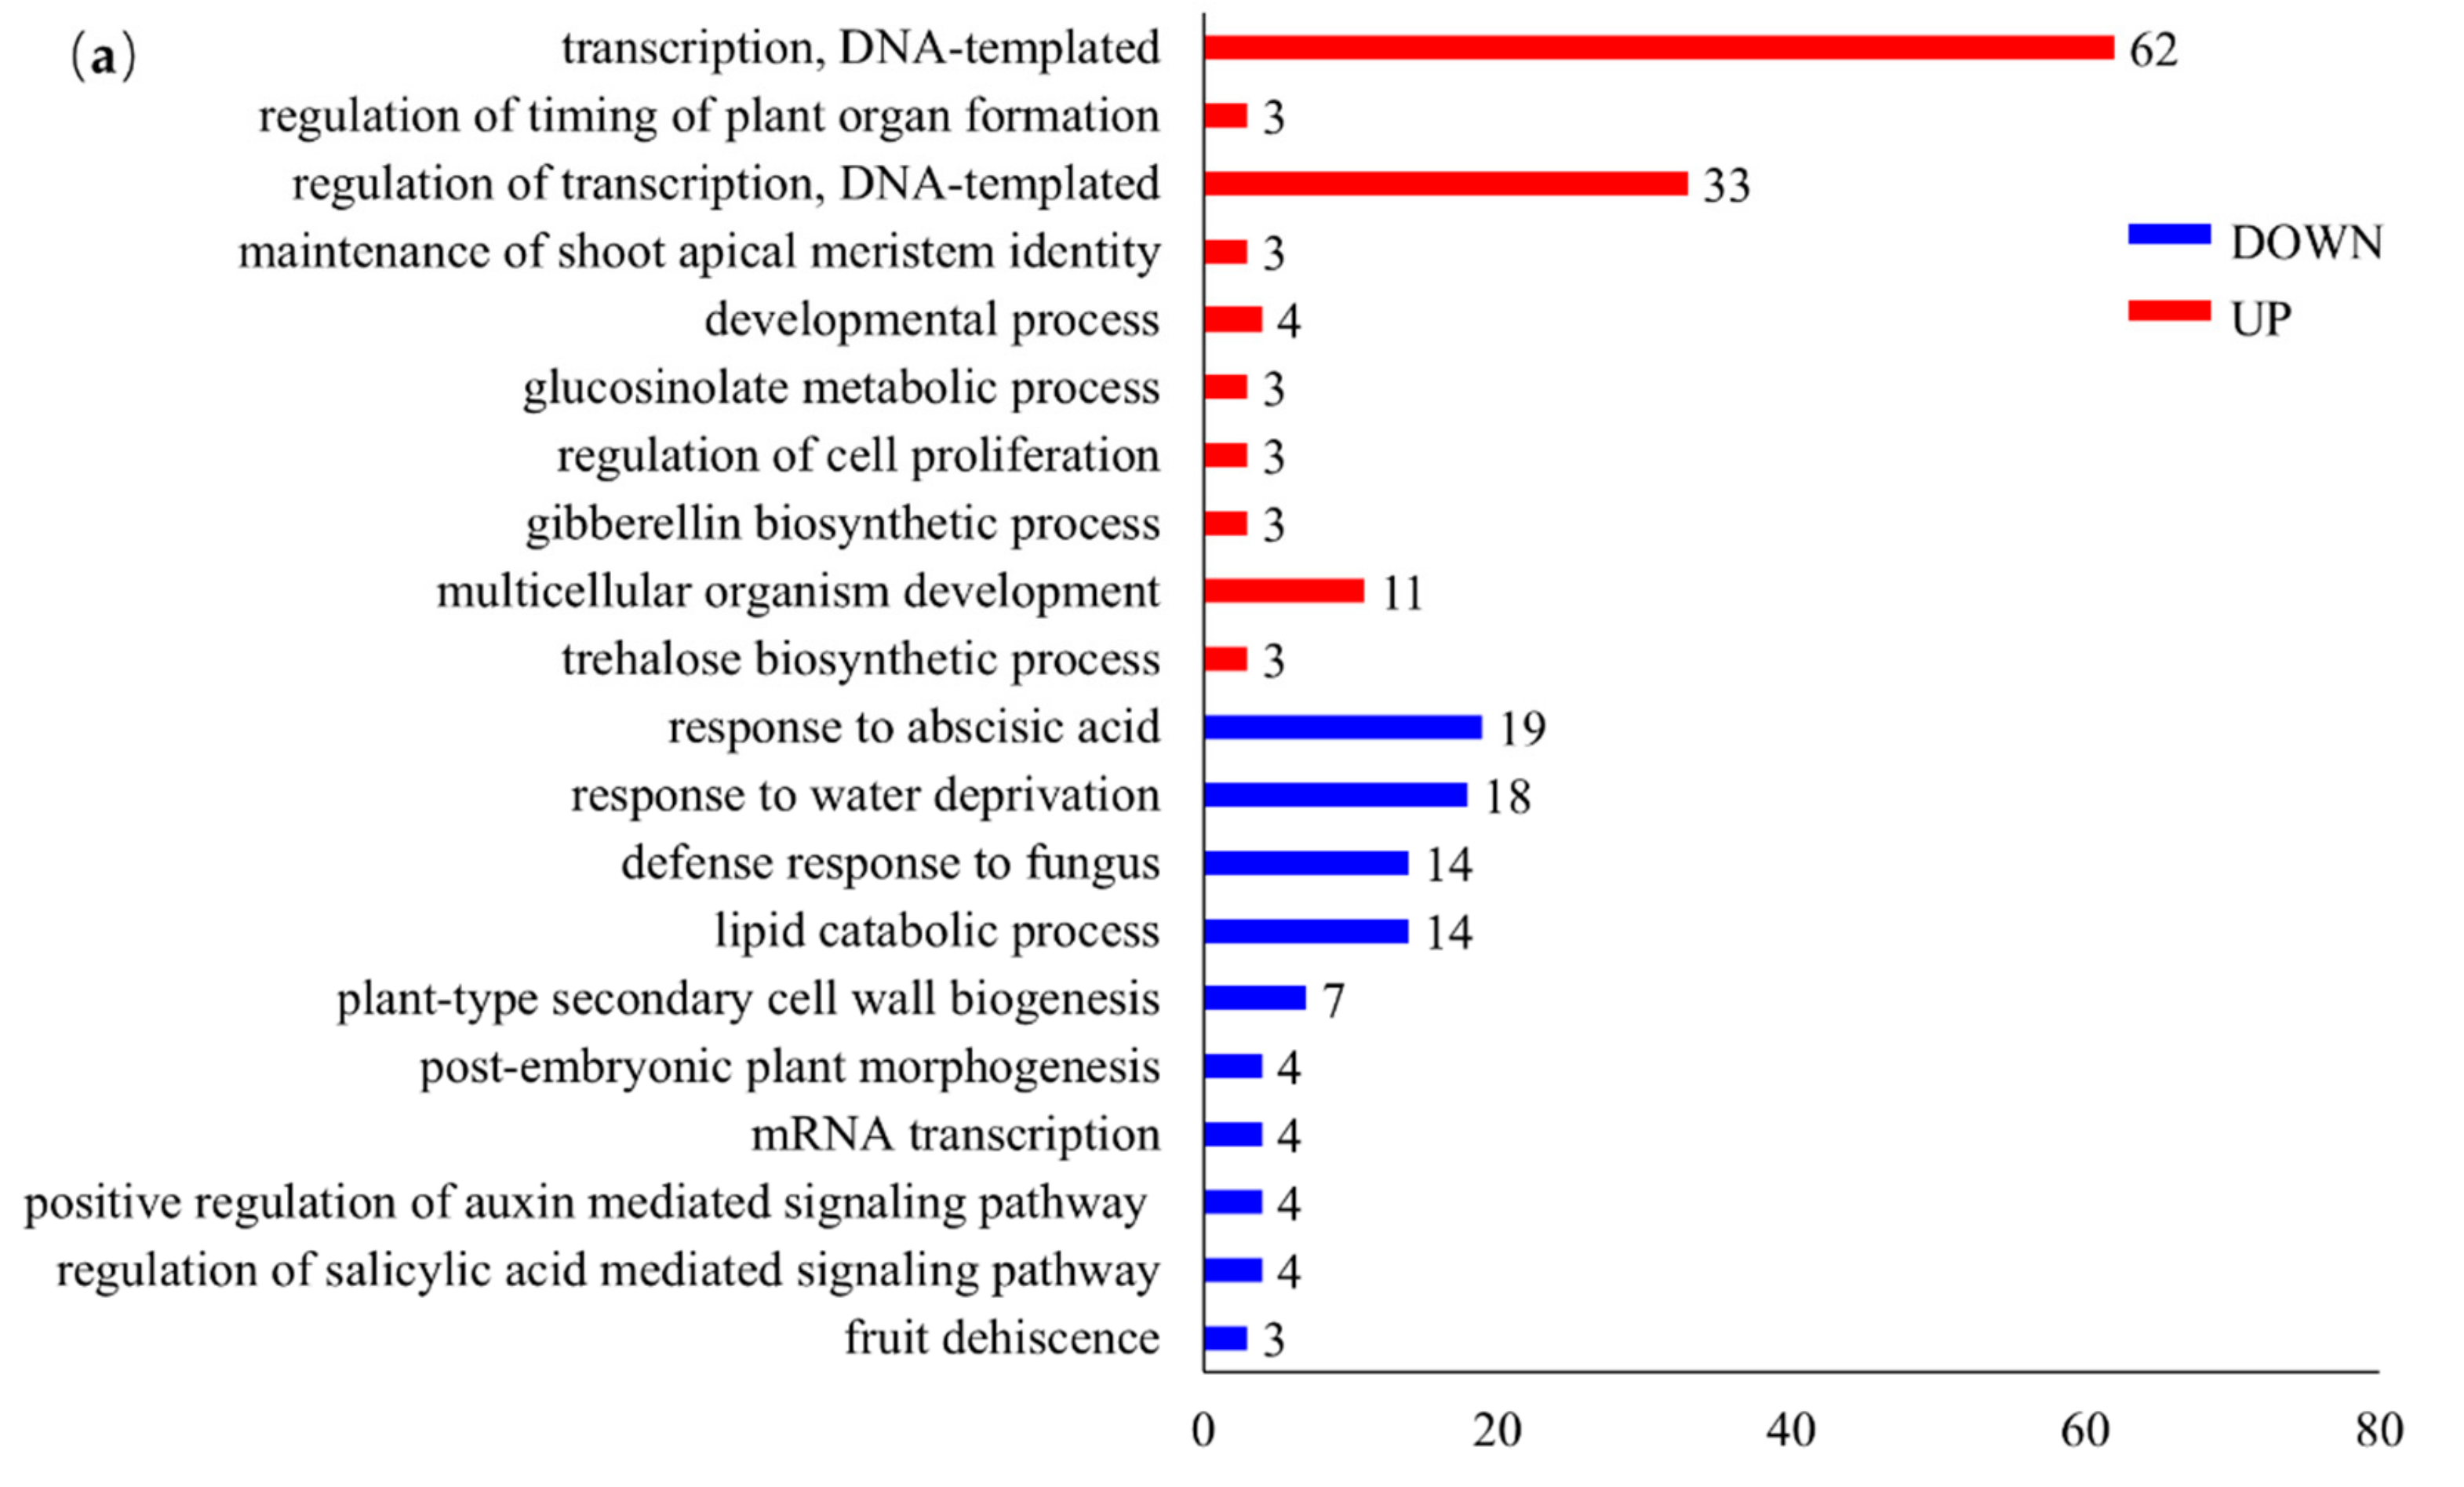
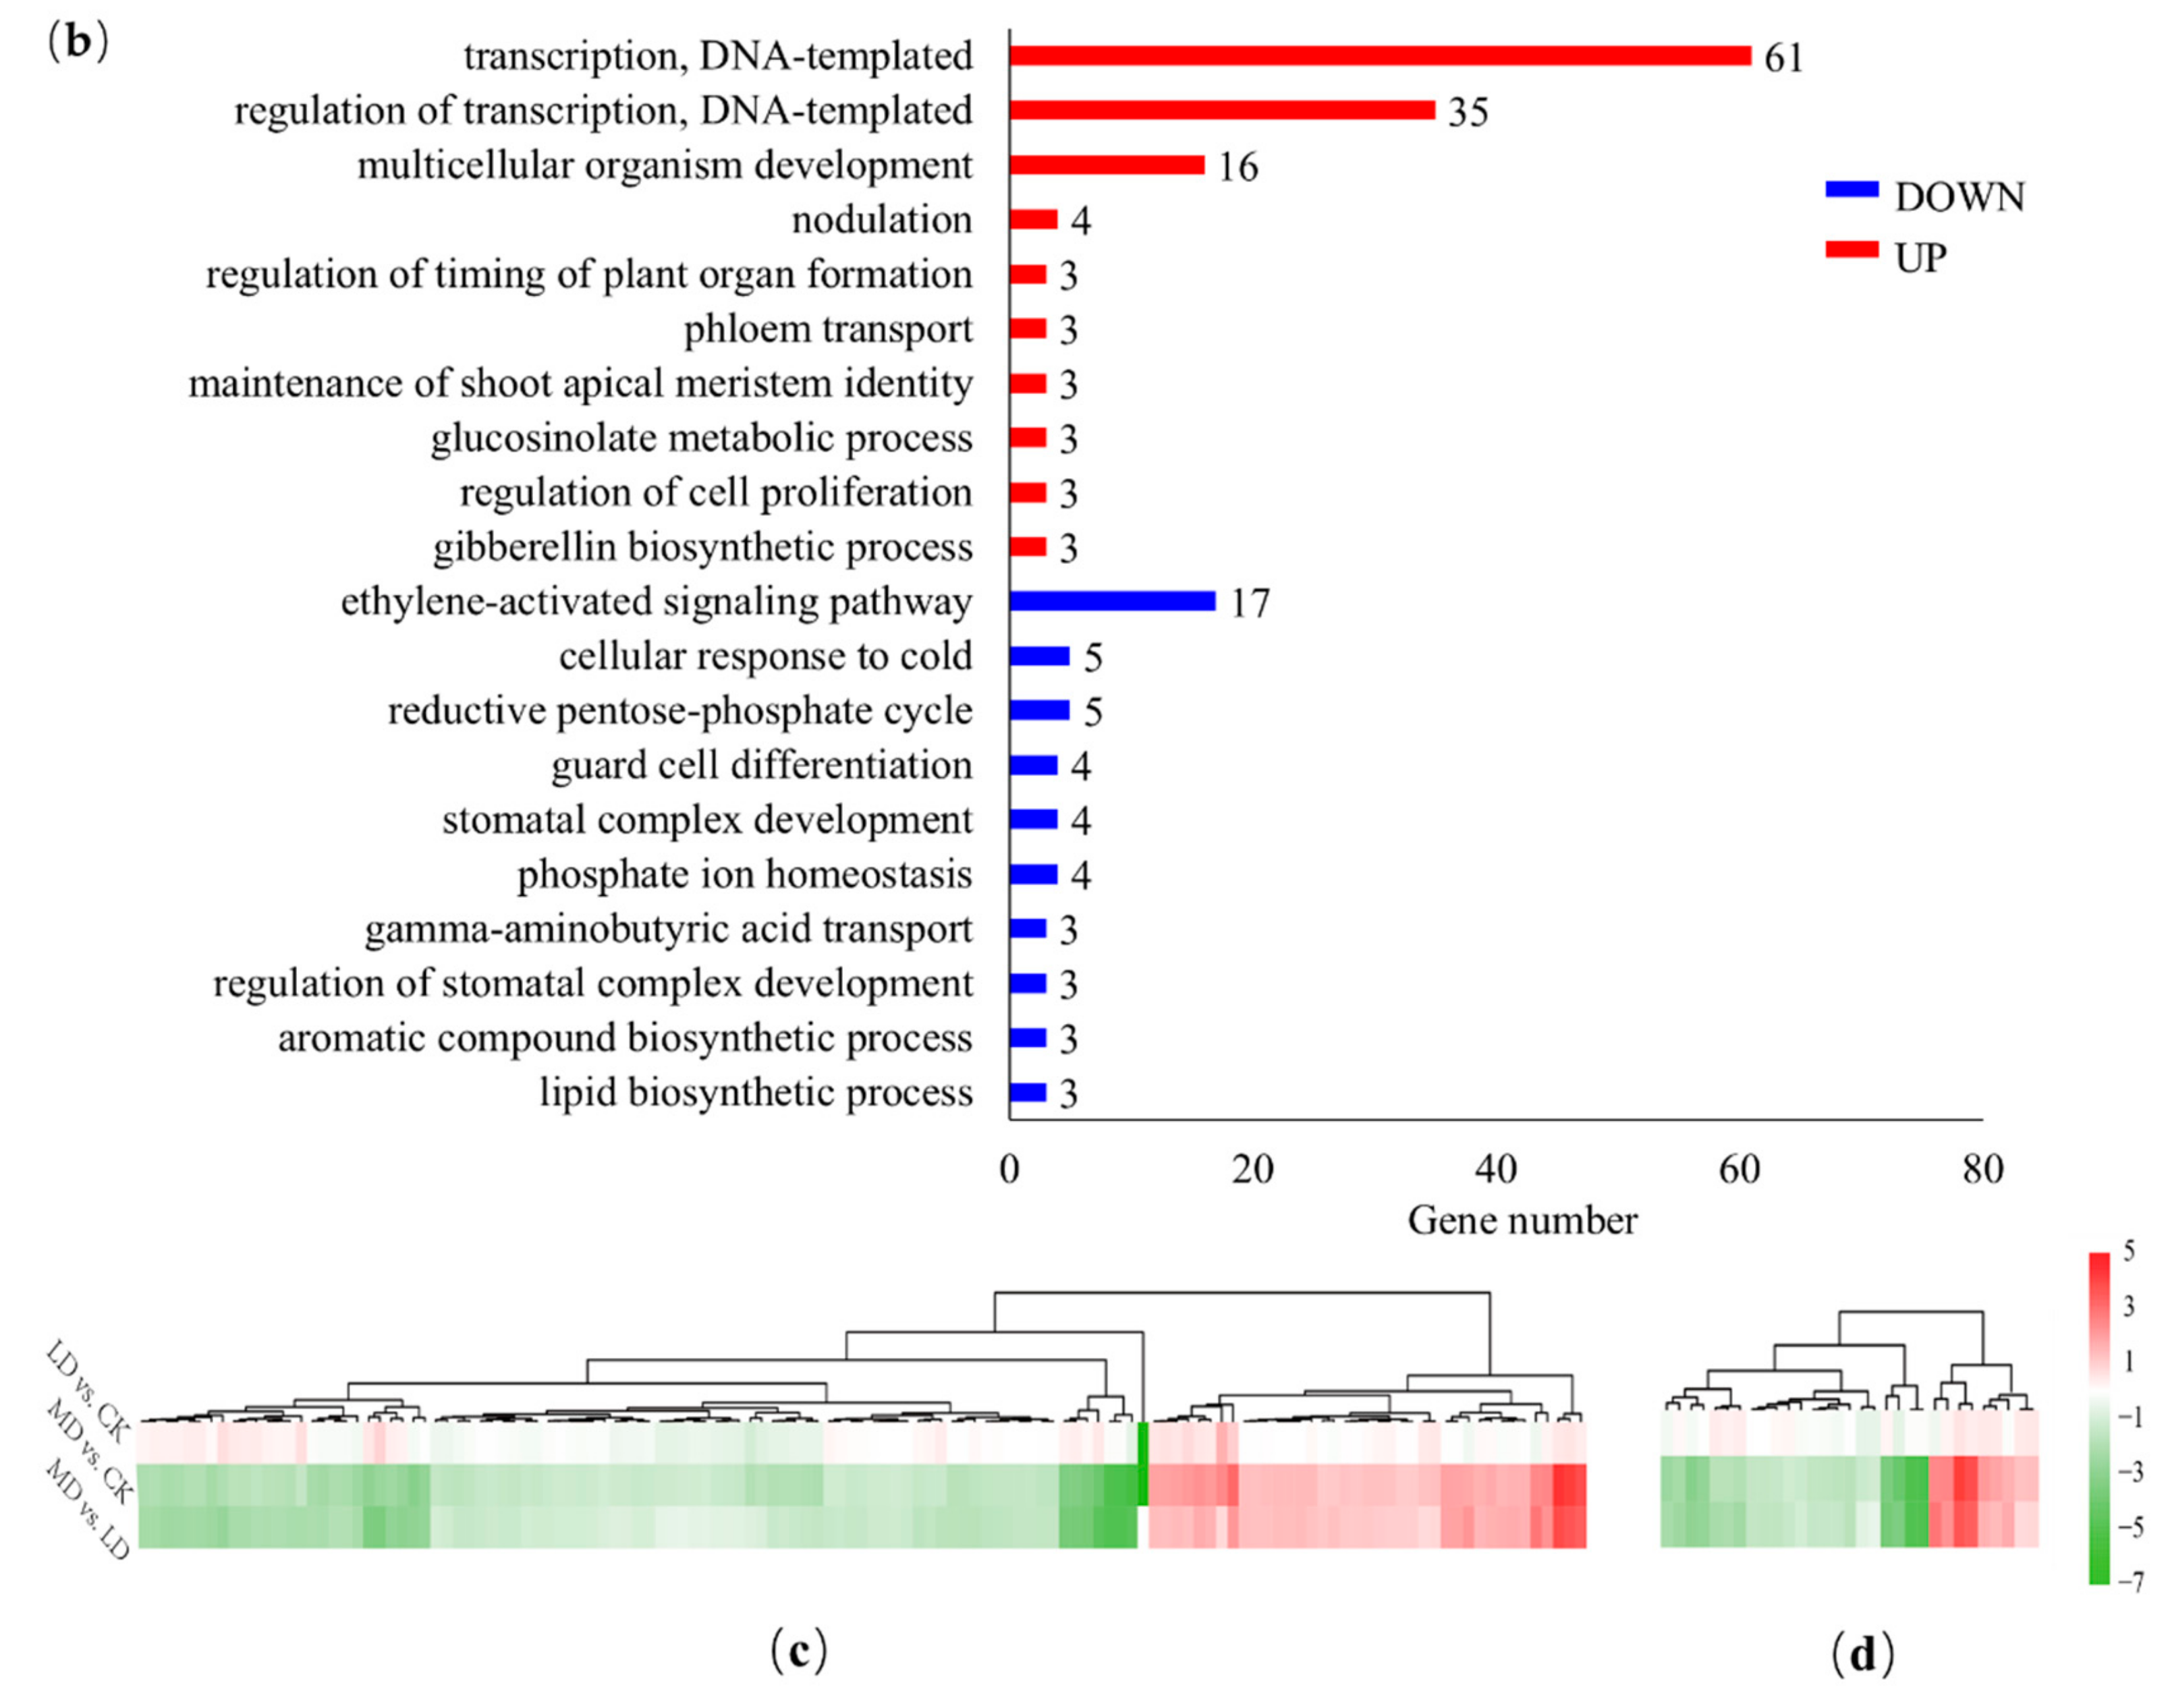
3.4. GO Annotation and Enrichment

A total of 26, 629, and 630 DEGs were assigned by GO analysis conducted based on the genes from the LD vs. CK, MD vs. LD, and MD vs. LD comparisons, respectively. The most significantly regulated 20 terms among biological processes from the MD vs. CK and MD vs. LD comparison genes are shown in Figure 5a,b, but there were no significant terms (i.e., terms with gene number > 2 and p < 0.05) resulting from the LD vs. CK comparison. The up-regulated terms from the MD vs. CK comparison are involved in “regulation of timing of plant organ formation,” “developmental process,” and “regulation of cell proliferation.” The down-regulated terms “response to water deprivation” and “post-embryonic plant morphogenesis” were also enriched. The up-regulated terms from the MD vs. LD comparison are “regulation of timing of plant organ formation,” “regulation of cell proliferation,” and “gibberellin biosynthetic process.” The down-regulated terms “reductive pentose-phosphate cycle,” “phosphate ion homeostasis,” and “ethylene-activated signaling pathway” were enriched among genes from the MD vs. LD comparison. The genes associated with GO terms related to development, growth, and responses to stimulus were also significantly different among the three comparisons. These genes that changed in their levels of transcriptional expression were basically the same in the MD vs. CK and MD vs. LD comparison groups, but lower in expression differences in the LD vs. CK comparison group (Figure 5c,d, Supplementary Materials Table S5).

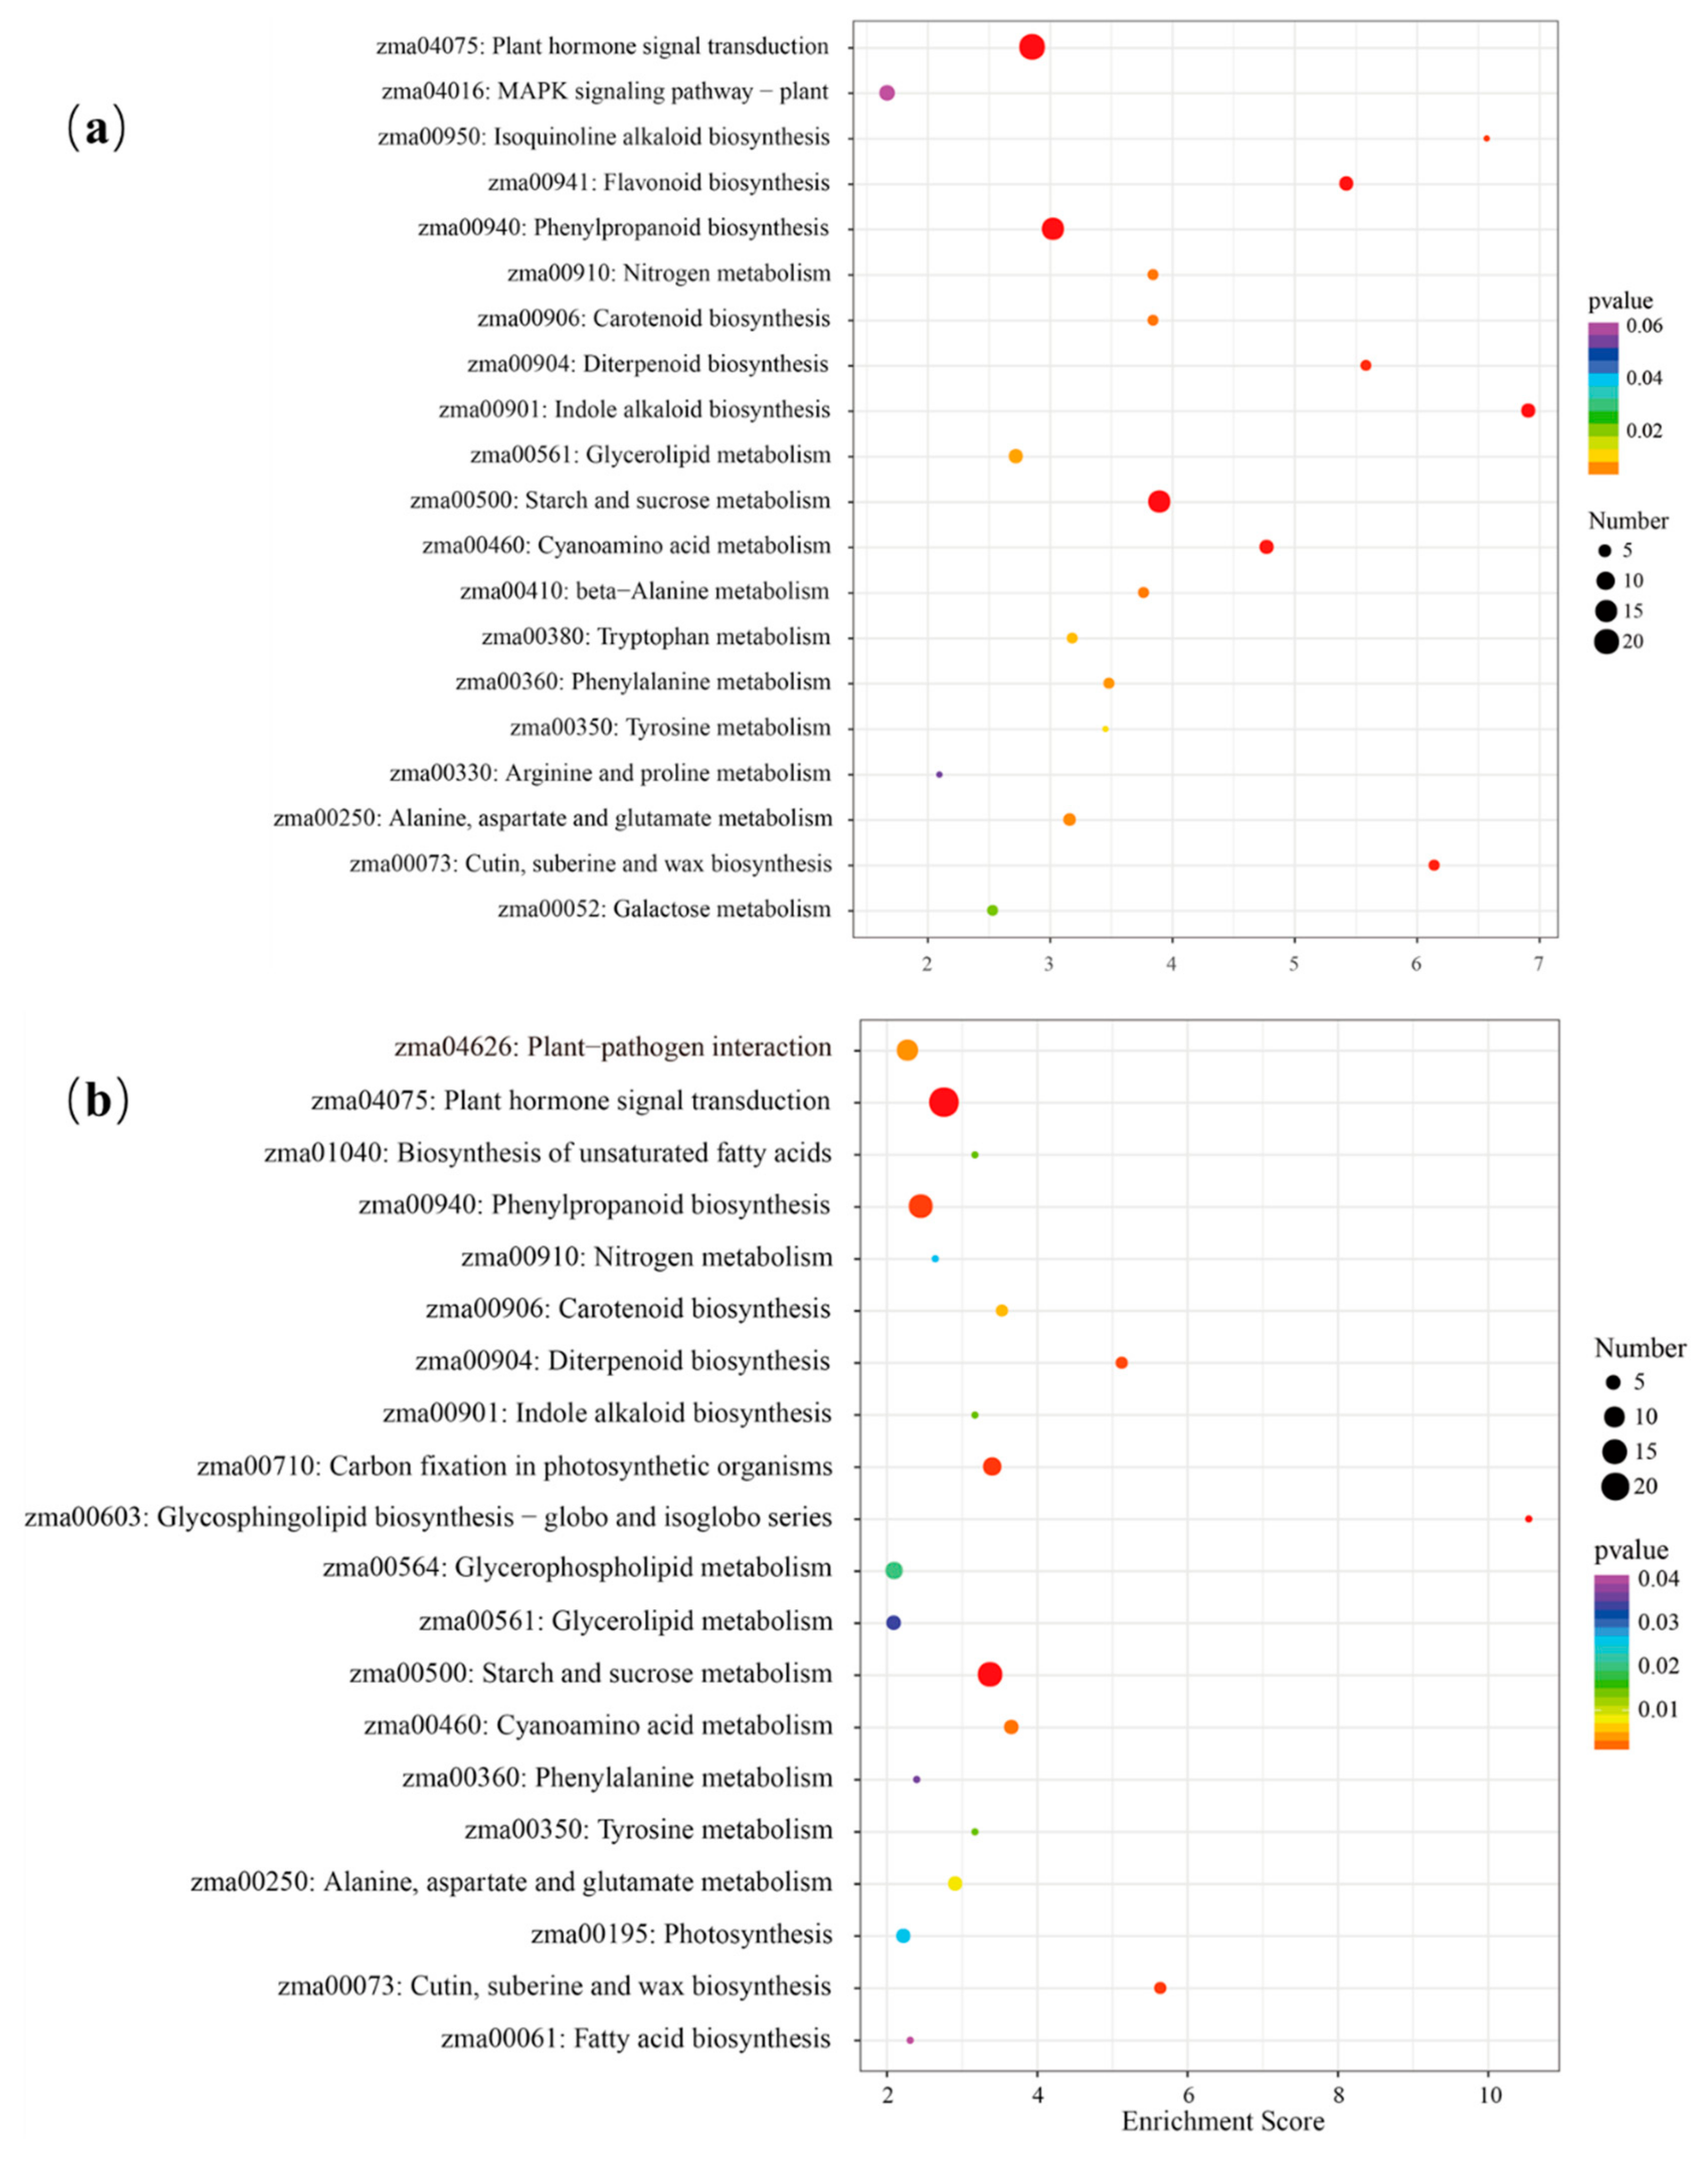
3.5. Metabolic Pathways Related to Soil Drought Stress

To further characterize genes affected by drought stress, we performed a KEGG pathway classification analysis to identify functional enrichment of DEGs. Thus, 8, 72, and 74 terms were significantly enriched in the transcriptome profile comparisons of LD vs. CK, MD vs. CK, and MD vs. LD groups (Supplementary Materials Table S6). The significant differences in the top 20 enriched KEGG pathways in the MD vs. CK and MD vs. LD comparisons are shown in Figure 6. In the MD vs. CK comparison, genes associated with the pathway “Starch and sucrose metabolism” were most enriched followed by those associated with “plant hormone signal transduction” (Figure 6a, Supplementary Materials Table S7). In the MD vs. LD group, “Plant hormone signal transduction,” “Starch and sucrose metabolism,” and “Glycosphingolipid biosynthesis” were the three most enriched terms (Figure 6a, Supplementary Materials Table S7).

4. Discussion

4.1. Responses of Plant Growth and Female Panicle Differentiation to Soil Drought Stress

The panicle stage is the most important productive stage in corn development, and soil drought stress in this stage can affect the plant growth rate, prolong the growth processes of the panicle stage, hinder the normal differentiation and development of ears, and ultimately lead to decreased crop seed setting rates and yields [42,43,44,45,46]. Further, the drought response depends on the time and intensity of water loss as well as the developmental stage [47,48]. In this study, LD and MD treatments compared with the CK treatment decreased green leaf area and significantly suppressed shoot dry matter accumulation over the prolonged drought treatment, and relative to the LD treatment, the MD treatment affected plant growth much more (Figure 1), which is consistent with previous research by Boonjung et al. [49].
FPs are the precursor to maize ears, and the differentiation and development of FPs mainly occurs from the V9 to VT stages, which include growth cone extension (V9), spikelet differentiation (V11), floret differentiation (V12), and formation of the sexual organs (VT). Developing organs are sensitive to drought, especially during their early phases [50]. When drought occurs between the V9 and VT stages, how does the degree of drought affect the formation of ears? In our study, spikelet and floral differentiation, as observed under stereomicroscope, were significantly inhibited and thus delayed by soil drought (Figure 2). Some studies have shown that the number of kernel rows is determined at the spikelet differentiation stage, and the floret differentiation period is the key period that affects grain number [51,52,53]. Here, mature ears in the MD and LD treatments were much shorter and thinner than those in the CK treatment; in addition, the bald tip length and number of unfilled grains were both increased under drought treatments. As indicated above, drought affected grain yields as well (Figure 2c).

4.2. Genes Involved in Development and Growth in Response to Soil Drought Stress

Drought treatments affected the expression of genes associated with development and growth of the inflorescence (Figure 4). Terminal ear 1 (te1) maize mutants have shortened internodes, abnormal phyllotaxy, leaf pattern defects, and partial feminization of tassels [54]. Similarly, cup-shaped cotyledon 2 (cuc2) mutants have been reported to have abnormalities in the regulation of the shoot meristem boundary and formation and subsequent development [55,56]. Here, cuc2 were up-regulated under moderate drought stress (Figure 4, Supplementary Table S5), combined with developmental change (Figure 2a), implying that the differential expression of the gene under MD treatments may be related to the mature delay of the FPs tissue. DLF1 was also up-regulated under MD stress (Figure 4, Supplementary Materials Table S5), suggesting that the trans-activator protein encoded by, this gene plays an important role in the signal transduction pathway and the regulation of plant growth at the FP development stage [57].

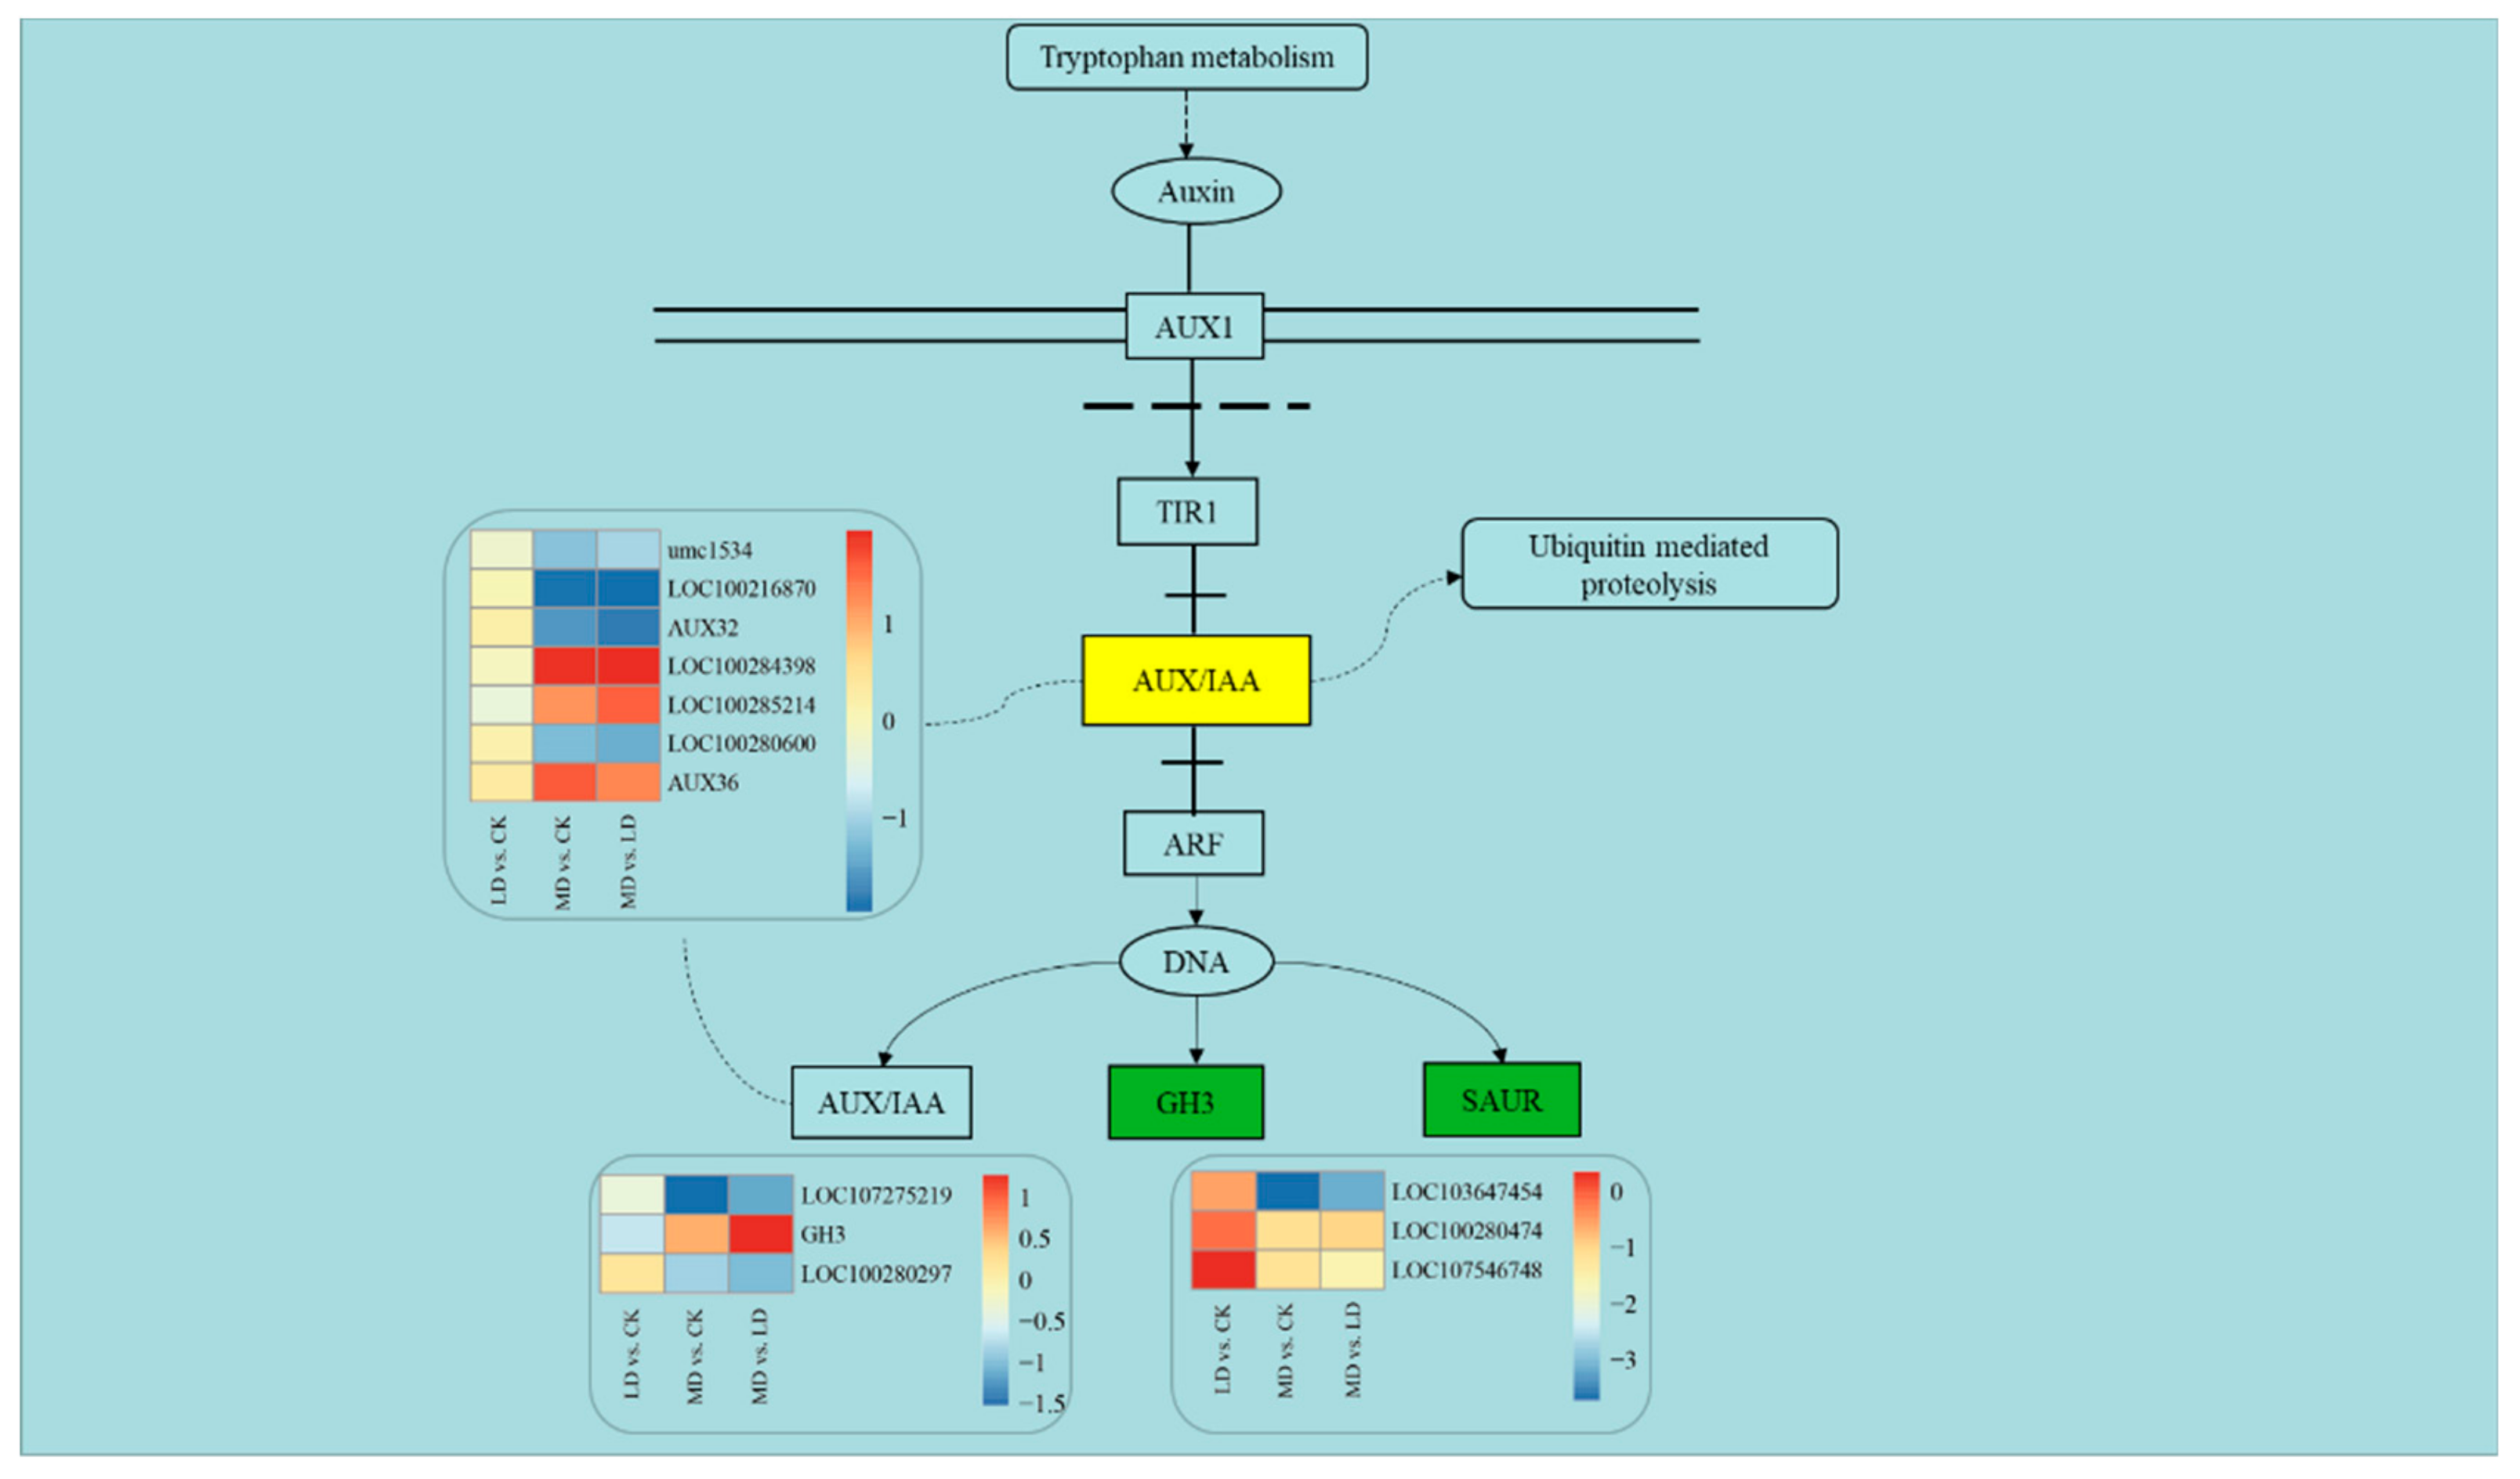
4.3. Genes Involved in Auxin Signaling in Response to Soil Drought Stress

Auxin is an important phytohormone that is closely related to plant resistance to adverse environmental conditions, and it can induce rapid and transient expression of some genes, including auxin response factor genes (ARF) and primary auxin response genes (Aux/IAA, GH3, SAUR and LBD); the protein products of these genes can specifically bind to ARFs to activate or inhibit downstream gene expression under drought [58,59,60,61]. In the current study, auxin signaling genes were involved in the response to drought, as the expression of IAA-conjugating genes (GH3) was up-regulated, and the expression levels of auxin biosynthesis genes were down-regulated after MD stress (Figure 7), leading to the reduction of auxin levels (Supplementary Materials Figure S1a). This implies that drought improves GH3 transcription to help maintain endogenous auxin at an appropriate level in maize [62,63]. However, when the concentration of auxin increases, auxin combines with transport inhibitor response 1 (TIR1), causing Aux/IAA ubiquitination and degradation; then, ARF is released, which further activates the expression of small auxin-up RNA (SAUR) genes [64]. SAUR genes are early auxin-responsive genes involved in plant growth, and the SAUR family regulates a series of cellular, physiological, and developmental processes in response to environmental signals [65,66,67]. In our study, three SAUR genes were down-regulated under the MD treatment (Figure 7), which may explain MD-induced inhibition of maize growth.

4.4. Reactive Oxygen Scavenging System and Ion Channel in Response to Soil Drought Stress

Limited water supply enhances the production of reactive oxygen species (ROS) [68,69], and plants are protected by glutathione S-transferase (GST) and other antioxidant enzymes scavenging excessive ROS from the damage caused by ROS [70]. This is because GST comprises a large superfamily of multifunctional protein and participates in ascorbic acid (AsA)/glutathione (GSH) cycling pathways [68]. Here, probable glutathione S-transferase GST12 was significantly down-regulated under the MD treatment compared with the CK treatment. However, GSTU6 (LOC103637303) and GST activity was up-regulated under MD stress (Supplementary Materials Table S8 and Figure S1b), which may scavenge ROS and protect both plant cell membrane structure and protein activity [71,72], implying that GST is involved in responding to drought stress [73,74].

Supplementary Materials

The following are available online at https://0-www-mdpi-com.brum.beds.ac.uk/2073-4395/10/2/313/s1, Table S1: The primer sequences for qRT-PCR, Table S2: Ear and grain yield traits at harvest time under CK, LD and MD treatments, Table S3: Number of reads based on RNA-Seq data of CK, LD and MD treatments, Table S4: RNA-Seq expression levels of the eight genes for qRT-PCR, Table S5: Expression pattern of the differently expressed genes about development progress (A) and growth (B) under CK, LD and MD treatments, Table S6: Number of enriched KEGG pathways terms and DEGs in three comparisons (LD vs.CK, MD vs. CK; MD vs. LD), Table S7: Differentially expressed genes (DEGs) in the top 20 enriched KEGG pathways in two comparisons (MD vs. CK; MD vs. LD), Table S8: Genes significantly enriched in Glutathione metabolism in three comparisons (LD vs.CK, MD vs. CK; MD vs. LD), Figure S1: Effect of drought stress treatments on the content of IAA (a) and the activities of GST (b) in female panicles. CK, well-watered; LD, light drought; MD, moderate drought, five biological replicates were sampled for each treatment.

Author Contributions

S.J. did the experiment and wrote the manuscript. H.L. analyzed the data. Y.J., Y.T., G.Z. and Y.Z. did a part of experiment. S.Y., H.Q., Y.W. and J.G. gave some good suggestions on the manuscript. Q.Y. revised the manuscript. R.S. designed this experiment, revised the manuscript and provided the funding. All authors have read and agreed to the published version of the manuscript.

Funding

This research was funded by Open Foundation of CAAS/Key Laboratory of Crop Water Use and Regulation, Ministry of Agriculture (FIRI2019-02-0103), Open Foundation of State Key Laboratory of Crop Biology (2019KF03), Scientific and Technological Innovation Talents in Colleges and Universities in Henan (20HASTIT036) and Central Public-interest Scientific Institution Basal Research Fund (Farmland Irrigation Research Institute, CAAS) (FIRI2017-19).

Conflicts of Interest

The authors declare no conflict of interest.

References

  1. Lisar, S.Y.S.; Motafakkerazad, R.; Hossain, M.M.; Rahman, I.M.M. Water Stress in Plants: Causes, Effects and Responses. In Water Stress; Rahman, M.M., Hasegawa, H., Eds.; Intech: Rijeka, Croatia, 2012; pp. 1–14. ISBN 978-953-307-963-9. [Google Scholar]
  2. Dai, A. Drought under global warming: A review. WIREs Clim. Chang. 2011, 2, 45–65. [Google Scholar] [CrossRef] [Green Version]
  3. Rollins, J.A.; Habte, E.; Templer, S.E.; Colby, T.; Schmidt, J.; Von Korff, M. Leaf proteome alterations in the context of physiological and morphological responses to drought and heat stress in barley (Hordeum vulgare L.). J. Exp. Bot. 2013, 64, 3201–3212. [Google Scholar] [CrossRef] [PubMed] [Green Version]
  4. Potopová, V.; Boroneanţ, C.; Boincean, B.; Soukup, J. Impact of agricultural drought on main crop yields in the Republic of Moldova. Int. J. Climatol. 2016, 36, 2063–2082. [Google Scholar] [CrossRef] [Green Version]
  5. Daryanto, S.; Wang, L.X.; Jacinthe, P.A. Global synthesis of drought effects on food legume production. PLoS ONE 2015, 10, e0127401. [Google Scholar] [CrossRef] [PubMed] [Green Version]
  6. Cao, L.R.; Lu, X.M.; Zhang, P.Y.; Wang, G.R.; Wei, L.; Wang, T.C. Systematic Analysis of Differentially Expressed Maize ZmbZIP Genes between Drought and Rewatering Transcriptome Reveals bZIP Family Members Involved in Abiotic Stress Responses. Int. J. Mol. Sci. 2019, 20, 4103. [Google Scholar] [CrossRef] [Green Version]
  7. Hussain, S.; Rao, M.J.; Anjum, M.A.; Ejaz, S.; Zakir, I.; Ali, M.A.; Ahmad, N.; Ahmad, S. Oxidative stress and antioxidant defense in plants under drought conditions. In Plant Abiotic Stress Tolerance; Hasanuzzaman, M., Hakeem, K.R., Nahar, K., Alharby, H.F., Eds.; Springer: Cham, Switzerland, 2019; pp. 207–219. ISBN 978-3-030-06117-3. [Google Scholar]
  8. Meeks, M.; Murray, S.; Hague, S.; Hays, D. Measuring maize seedling drought response in search of tolerant germplasm. Agronomy 2013, 3, 135–147. [Google Scholar] [CrossRef]
  9. Vaughan, M.M.; Block, A.; Christensen, S.A.; Allen, L.H.; Schmelz, E.A. The effects of climate change associated abiotic stresses on maize phytochemical defenses. Phytochem. Rev. 2018, 17, 37–49. [Google Scholar] [CrossRef]
  10. Calanca, P.P. Effects of abiotic stress in crop production. In Quantification of Climate Variability, Adaptation and Mitigation for Agricultural Sustainability; Ahmed, M., Stockle, C.O., Eds.; Springer: Cham, Switzerland, 2017; pp. 165–180. ISBN 978-3-319-32057-1. [Google Scholar]
  11. EL Sabagh, A.; Hossain, A.; Islam, M.S.; Barutcular, S.; Fahad, S.; Ratnasekera, D.; Kumar, N.; Meena, R.S.; Vera, P.; Saneoka, H. Role of osmoprotectants and soil amendments for sustainable soybean (Glycine max L.) production under drought condition: A review. J. Exp. Biol. Agric. Sci. 2018, 6, 32–41. [Google Scholar] [CrossRef]
  12. Yang, M.; Geng, M.Y.; Shen, P.F.; Chen, X.H.; Li, Y.J.; Wen, X.X. Effect of post-silking drought stress on the expression profiles of genes involved in carbon and nitrogen metabolism during leaf senescence in maize (Zea mays L.). Plant Physiol. Biochem. 2019, 135, 304–309. [Google Scholar] [CrossRef]
  13. Chiuta, N.; Mutengwa, C. Response of yellow quality protein maize inbred lines to drought stress at seedling stage. Agronomy 2018, 8, 287. [Google Scholar] [CrossRef] [Green Version]
  14. Zhan, J.P.; Li, G.S.; Ryu, C.H.; Ma, C.; Zhang, S.S.; Lloyd, A.; Hunter, B.G.; Larkins, B.A.; Drews, G.N.; Wang, X.F.; et al. Opaque-2 regulates a complex gene network associated with cell differentiation and storage functions of maize endosperm. Plant Cell 2018, 30, 2425–2446. [Google Scholar] [CrossRef] [PubMed] [Green Version]
  15. Jain, D.; Ashraf, N.; Khurana, J.P.; Kameshwari, M.N. The ‘Omics’ Approach for Crop Improvement Against Drought Stress. In Genetic Enhancement of Crops for Tolerance to Abiotic Stress: Mechanisms and Approaches; Rajpal, V.R., Sehgal, D., Kumar, A., Raina, S.N., Eds.; Springer: Cham, Switzerland, 2019; pp. 183–204. ISBN 978-3-319-91955-3. [Google Scholar]
  16. Dastogeer, K.M.G.; Li, H.; Sivasithamparam, K.; Jones, M.G.K.; Wylie, S.J. Fungal endophytes and a virus confer drought tolerance to Nicotiana benthamiana plants through modulating osmolytes, antioxidant enzymes and expression of host drought responsive genes. Environ. Exp. Bot. 2018, 149, 95–108. [Google Scholar] [CrossRef] [Green Version]
  17. Kaur, G.; Asthir, B. Molecular responses to drought stress in plants. Biol. Plant 2017, 61, 201–209. [Google Scholar] [CrossRef]
  18. Fang, Y.J.; Xiong, L.Z. General mechanisms of drought response and their application in drought resistance improvement in plants. Cell. Mol. Life Sci. 2015, 72, 673–689. [Google Scholar] [CrossRef] [PubMed]
  19. Nakashima, K.; Yamaguchi-Shinozaki, K.; Shinozaki, K. The transcriptional regulatory network in the drought response and its crosstalk in abiotic stress responses including drought, cold, and heat. Front. Plant Sci. 2014, 5, 170. [Google Scholar] [CrossRef] [PubMed] [Green Version]
  20. Feng, F.; Qi, W.W.; Lv, Y.D.; Yan, S.M.; Xu, L.M.; Yang, W.Y.; Yuan, Y.; Chen, Y.H.; Zhao, H.; Song, R.T. OPAQUE11 is a central hub of the regulatory network for maize endosperm development and nutrient metabolism. Plant Cell 2018, 30, 375–396. [Google Scholar] [CrossRef] [Green Version]
  21. An, Y.X.; Chen, L.; Li, Y.X.; Li, C.H.; Shi, Y.S.; Song, Y.C.; Zhang, D.F.; Li, Y.; Wang, T.Y. Candidate loci for the kernel row number in maize revealed by a combination of transcriptome analysis and regional association mapping. BMC Plant Biol. 2019, 19, 201. [Google Scholar] [CrossRef]
  22. Wilson, J. Control of Maize Development by MicroRNA and Auxin Regulated Pathways; East Carolina University: Greenville, NC, USA, 2018. [Google Scholar]
  23. Opitz, N.; Paschold, A.; Marcon, C.; Malik, W.A.; Lanz, C.; Piepho, H.P.; Hochholdinger, F. Transcriptomic complexity in young maize primary roots in response to low water potentials. BMC Genomics 2014, 15, 741. [Google Scholar] [CrossRef] [Green Version]
  24. Song, K.; Kim, H.C.; Shin, S.; Kim, K.H.; Moon, J.C.; Kim, J.Y.; Lee, B.M. Transcriptome analysis of flowering time genes under drought stress in maize leaves. Front. Plant Sci. 2017, 8, 267. [Google Scholar] [CrossRef] [Green Version]
  25. Li, L. The Major Metabolic Pathways at Maize Developing Young Tassel in Response to Drought Stress and Identification of Drought-Tolerant Candidate SNAC Genes; Xinjiang Agricultural University: Wulumuqi, Xinjiang, China, 2015. [Google Scholar]
  26. Wang, B.M.; Liu, C.; Zhang, D.F.; He, C.M.; Zhang, J.R.; Li, Z.X. Effects of maize organ-specific drought stress response on yields from transcriptome analysis. BMC Plant Biol. 2019, 19, 335. [Google Scholar] [CrossRef] [Green Version]
  27. Zhao, M.; Wang, Q.X.; Wang, K.J.; Li, C.H.; Hao, J.P. Maize. In Crop Cultivation Science: North; Yu, Z.W., Ed.; China Agriculture Press: Beijing, China, 2003; pp. 69–111. ISBN 9787109179363. [Google Scholar]
  28. Chen, D.Q.; Wang, S.W.; Cao, B.B.; Cao, D.; Leng, G.H.; Li, H.B.; Yin, L.N.; Shan, L.; Deng, X.P. Genotypic variation in growth and physiological response to drought stress and re-watering reveals the critical role of recovery in drought adaptation in maize seedlings. Front. Plant Sci. 2016, 6, 1241. [Google Scholar] [CrossRef] [PubMed] [Green Version]
  29. Oury, V.; Caldeira, C.F.; Prodhomme, D.; Pichon, J.P.; Gibon, Y.; Turc, O. Is change in ovary carbon status a cause or a consequence of maize ovary abortion in water deficit during flowering? Plant Physiol. 2016, 171, 997–1008. [Google Scholar] [CrossRef] [PubMed] [Green Version]
  30. Khandagale, S.G.; Dubey, R.B.; Sharma, V.; Khan, R. Response of physiological traits of maize to moisture stress induced at different developmental stages. Int. J. Chem. Stud. 2018, 6, 2757–2761. [Google Scholar]
  31. Ma, C.Y.; Li, B.; Wang, L.N.; Xu, M.L.; Zhu, L.E.; Jin, H.Y.; Wang, Z.C.; Ye, J.R. Characterization of phytohormone and transcriptome reprogramming profiles during maize early kernel development. BMC Plant Biol. 2019, 19, 197. [Google Scholar] [CrossRef] [Green Version]
  32. Jia, S.J.; Li, H.W.; Jiang, Y.P.; Zhao, G.Q.; Wang, H.Z.; Yang, S.J.; Yang, Q.H.; Guo, J.M.; Shao, R.X. Effects of drought on photosynthesis and ear development characteristics of maize. Acta Ecol. Sin. 2020, 3, 1–9. [Google Scholar]
  33. Li, Y.B.; Song, H.; Zhou, L.; Xu, Z.Z.; Zhou, G.S. Tracking chlorophyll fluorescence as an indicator of drought and rewatering across the entire leaf lifespan in a maize field. Agric. Water Manag. 2019, 211, 190–201. [Google Scholar] [CrossRef]
  34. Xu, Z.Z.; Zhou, G.S.; Shimizu, H. Are plant growth and photosynthesis limited by pre-drought following rewatering in grass? J. Exp. Bot. 2009, 60, 3737–3749. [Google Scholar] [CrossRef] [Green Version]
  35. Bolger, A.M.; Lohse, M.; Usadel, B. Trimmomatic: A flexible trimmer for Illumina sequence data. Bioinformatics 2014, 30, 2114–2120. [Google Scholar] [CrossRef] [Green Version]
  36. Jiao, Y.P.; Peluso, P.; Shi, J.H.; Liang, T.; Stitzer, M.C.; Wang, B.; Campbell, M.S.; Stein, J.C.; Wei, X.H.; Chin, C.S.; et al. Improved maize reference genome with single-molecule technologies. Nature 2017, 546, 524–527. [Google Scholar] [CrossRef]
  37. Kim, D.; Langmead, B.; Salzberg, S.L. HISAT: A fast spliced aligner with low memory requirements. Nat. Methods 2015, 12, 357–360. [Google Scholar] [CrossRef] [Green Version]
  38. Roberts, A.; Pimentel, H.; Trapnell, C.; Pachter, L. Identification of novel transcripts in annotated genomes using RNA-Seq. Bioinformatics 2011, 27, 2325–2329. [Google Scholar] [CrossRef] [PubMed]
  39. Roberts, A.; Trapnell, C.; Donaghey, J.; Rinn, J.L.; Pachter, L. Improving RNA-Seq expression estimates by correcting for fragment bias. Genome Biol. 2011, 12, R22. [Google Scholar] [CrossRef] [PubMed] [Green Version]
  40. Anders, S.; Huber, W. Differential Expression of RNA-Seq Data at the Gene Level–the DESeq Package; European Molecular Biology Laboratory: Heidelberg, Germany, 2012. [Google Scholar]
  41. Abendroth, L.J.; Elmore, R.W.; Boyer, M.J.; Marlay, S.K. Vegetative Stages (VE to VT). In Corn Growth and Development; Iowa State University: Ames, IA, USA, 2011; pp. 13–27. [Google Scholar]
  42. Mueller, N.D.; Gerber, J.S.; Johnston, M.; Ray, D.K.; Ramankutty, N.; Foley, J.A. Closing yield gaps through nutrient and water management. Nature 2012, 490, 254–257. [Google Scholar] [CrossRef]
  43. Zhang, X.B.; Lei, L.; Lai, J.S.; Zhao, H.M.; Song, W.B. Effects of drought stress and water recovery on physiological responses and gene expression in maize seedlings. BMC Plant Biol. 2018, 18, 68. [Google Scholar] [CrossRef] [PubMed]
  44. Hayano-Kanashiro, C.; Calderón-Vázquez, C.; Ibarra-Laclette, E.; Herrera-Estrella, L.; Simpson, J. Analysis of gene expression and physiological responses in three Mexican maize landraces under drought stress and recovery irrigation. PLoS ONE 2009, 4, e7531. [Google Scholar] [CrossRef] [PubMed]
  45. Huo, Y.J.; Wang, M.P.; Wei, Y.Y.; Xia, Z.L. Overexpression of the maize psbA gene enhances drought tolerance through regulating antioxidant system, photosynthetic capability, and stress defense gene expression in tobacco. Front. Plant Sci. 2016, 6, 1223. [Google Scholar] [CrossRef] [PubMed] [Green Version]
  46. Avramova, V.; AbdElgawad, H.; Vasileva, I.; Petrova, A.S.; Holek, A.; Mariën, J.; Asard, H.; Beemster, G.T.S. High antioxidant activity facilitates maintenance of cell division in leaves of drought tolerant maize hybrids. Front. Plant Sci. 2017, 8, 84. [Google Scholar] [CrossRef] [Green Version]
  47. Witt, S.; Galicia, L.; Lisec, J.; Cairns, J.; Tiessen, A.; Araus, J.L.; Palacios-Rojas, N.; Fernie, A.R. Metabolic and phenotypic responses of greenhouse-grown maize hybrids to experimentally controlled drought stress. Mol. Plant 2012, 5, 401–417. [Google Scholar] [CrossRef] [Green Version]
  48. Bartels, D.; Souer, E. Molecular responses of higher plants to dehydration. In Plant Responses to Abiotic Stress; Hirt, H., Shinozaki, K., Eds.; Springer: Berlin/Heidelberg, Germany, 2004; pp. 9–38. ISBN 9783-540-20037-6. [Google Scholar]
  49. Boonjung, H.; Fukai, S. Effects of soil water deficit at different growth stages on rice growth and yield under upland conditions. 2. Phenology, biomass production and yield. Field Crops Res. 1996, 48, 47–55. [Google Scholar] [CrossRef]
  50. Su, Z.; Ma, X.; Guo, H.H.; Sukiran, N.L.; Guo, B.; Assmann, S.M.; Ma, H. Flower development under drought stress: Morphological and transcriptomic analyses reveal acute responses and long-term acclimation in Arabidopsis. Plant Cell 2013, 25, 3785–3807. [Google Scholar] [CrossRef] [Green Version]
  51. Gonzalez, V.H.; Lee, E.A.; Lukens, L.L.; Swanton, C.J. The relationship between floret number and plant dry matter accumulation varies with early season stress in maize (Zea mays L.). Field Crops Res. 2019, 238, 129–138. [Google Scholar] [CrossRef]
  52. Nielsen, R.L. Ear Size Determination in Corn; Corny News Network Articles; Purdue University: West Lafayette, IN, USA, 2007. [Google Scholar]
  53. Hu, X.J.; Wang, H.W.; Diao, X.Z.; Liu, Z.F.; Li, K.; Wu, Y.J.; Liang, Q.J.; Wang, H.; Huang, C.L. Transcriptome profiling and comparison of maize ear heterosis during the spikelet and floret differentiation stages. BMC Genomics 2016, 17, 959. [Google Scholar] [CrossRef] [Green Version]
  54. Jeffares, D.C. Molecular Genetic Analysis of the Maize Terminal Ear1 Gene and in Silico Analysis of Related Genes; Massey University: Palmerston North, New Zealand, 2001. [Google Scholar]
  55. Vroemen, C.W.; Mordhorst, A.P.; Albrecht, C.; Kwaaitaal, M.A.C.J.; Vries, S.C. The CUP-SHAPED COTYLEDON3 gene is required for boundary and shoot meristem formation in Arabidopsis. Plant Cell 2003, 15, 1563–1577. [Google Scholar] [CrossRef]
  56. Hibara, K.; Karim, M.R.; Takada, S.; Taoka, K.; Furutani, M.; Aida, M.; Tasaka, M. Arabidopsis CUP-SHAPED COTYLEDON3 regulates postembryonic shoot meristem and organ boundary formation. Plant Cell 2006, 18, 2946–2957. [Google Scholar] [CrossRef] [Green Version]
  57. Cai, Y.H.; Chen, X.J.; Xie, K.; Xing, Q.K.; Wu, Y.W.; Li, J.; Du, C.H.; Sun, Z.X.; Guo, Z.J. Dlf1, a WRKY transcription factor, is involved in the control of flowering time and plant height in rice. PLoS ONE 2014, 9, e102529. [Google Scholar] [CrossRef] [Green Version]
  58. Chen, Z.H.; Yuan, Y.; Fu, D.; Shen, C.J.; Yang, Y.J. Identification and expression profiling of the auxin response factors in Dendrobium officinale under abiotic stresses. Int. J. Mol. Sci. 2017, 18, 927. [Google Scholar] [CrossRef] [PubMed] [Green Version]
  59. Porco, S.; Larrieu, A.; Du, Y.J.; Gaudinier, A.; Goh, T.; Swarup, K.; Swarup, R.; Kuempers, B.; Bishopp, A.; Lavenus, J.; et al. Lateral root emergence in Arabidopsis is dependent on transcription factor LBD29 regulation of auxin influx carrier LAX3. Development 2016, 143, 3340–3349. [Google Scholar] [CrossRef] [PubMed] [Green Version]
  60. Dinesh, D.C.; Villalobos, L.I.A.C.; Abel, S. Structural biology of nuclear auxin action. Trends Plant Sci. 2016, 21, 302–316. [Google Scholar] [CrossRef] [PubMed]
  61. Jung, H.R.; Lee, D.K.; Do Choi, Y.; Kim, J.K. OsIAA6, a member of the rice Aux/IAA gene family, is involved in drought tolerance and tiller outgrowth. Plant Sci. 2015, 236, 304–312. [Google Scholar] [CrossRef]
  62. Asghar, M.A.; Li, Y.; Jiang, H.K.; Sun, X.; Ahmad, B.; Imran, S.; Yu, L.; Liu, C.Y.; Yang, W.Y.; Du, J.B. Crosstalk between Abscisic Acid and Auxin under Osmotic Stress. Agron. J. 2019, 111, 2157–2162. [Google Scholar] [CrossRef]
  63. Kelley, K.B.; Riechers, D.E. Recent developments in auxin biology and new opportunities for auxinic herbicide research. Pestic. Biochem. Phys. 2007, 89, 1–11. [Google Scholar] [CrossRef]
  64. Han, S.; Hwang, I. Integration of multiple signaling pathways shapes the auxin response. J. Exp. Bot. 2017, 69, 189–200. [Google Scholar] [CrossRef] [PubMed] [Green Version]
  65. Luo, J.; Zhou, J.J.; Zhang, J.Z. Aux/IAA gene family in plants: Molecular structure, regulation, and function. Int. J. Mol. Sci. 2018, 19, 259. [Google Scholar] [CrossRef] [PubMed] [Green Version]
  66. Bai, Q.S.; Hou, D.; Li, L.; Cheng, Z.C.; Ge, W.; Liu, J.; Li, X.P.; Mu, S.H.; Gao, J. Genome-wide analysis and expression characteristics of small auxin-up RNA (SAUR) genes in moso bamboo (Phyllostachys edulis). Genome 2016, 60, 325–336. [Google Scholar] [CrossRef] [Green Version]
  67. Ren, H.; Gray, W.M. SAUR proteins as effectors of hormonal and environmental signals in plant growth. Mol. Plant 2015, 8, 1153–1164. [Google Scholar] [CrossRef] [Green Version]
  68. Han, D.G.; Zhang, Z.Y.; Ding, H.B.; Chai, L.J.; Liu, W.; Li, H.X.; Yang, G.H. Isolation and characterization of MbWRKY2 gene involved in enhanced drought tolerance in transgenic tobacco. J. Plant Interact. 2018, 13, 163–172. [Google Scholar] [CrossRef] [Green Version]
  69. Ahmad, N.; Malagoli, M.; Wirtz, M.; Hell, R. Drought Stress in Maize Causes Differential Acclimation Responses of Glutathione and Sulfur Metabolism in Leaves and Roots. BMC Plant Biol. 2016, 16, 247. [Google Scholar] [CrossRef]
  70. Zhang, X.; Tao, L.; Qiao, S.; Du, B.H.; Guo, C.H. Roles of Glutathione S-transferase in Plant Tolerance to Abiotic Stresses. J. Chin. Biotechnol. 2017, 37, 92–98. [Google Scholar]
  71. Kong, X.X.; Li, B.Z.; Yang, J.S. Research progress in microalgae resistance to cadmium stress. Microbiol. Chin. 2017, 44, 1980–1987. [Google Scholar]
  72. George, S.; Venkataraman, G.; Parida, A.A. chloroplast-localized and auxin-induced glutathione S-transferase from phreatophyte Prosopis juliflora confer drought tolerance on tobacco. J. Plant Physiol. 2010, 167, 311–318. [Google Scholar] [CrossRef]
  73. Nakamura, A.; Umemura, I.; Gomi, K.; Hasegawa, Y.; Kitano, H.; Sazuka, T.; Matsuoka, M. Production and characterization of auxin-insensitive rice by overexpression of a mutagenized rice IAA protein. Plant J. 2006, 46, 297–306. [Google Scholar] [CrossRef] [PubMed]
  74. Gu, H.H.; Yang, Y.; Xing, M.H.; Yue, C.P.; Wei, F.; Zhang, Y.J.; Zhao, W.E.; Huang, J.Y. Physiological and transcriptome analyses of Opisthopappus taihangensis in response to drought stress. Cell Biosci. 2019, 9, 56. [Google Scholar] [CrossRef] [PubMed] [Green Version]
Figure 1. Agronomic traits changes of maize plants in response to different drought stress. Effect of drought stress on (a) plant height; (b) leaf area index; (c) shoot dry matter; and (d) the percentage of drought limitation at 20, 25, and 30 days after drought (DAD). Values are the means of the replicates ± sd. Different lowercase letters and * symbols indicate statistical significance of differences at a p < 0.05 level. There were three treatments, including well-watered (CK), light drought (LD), and moderate drought (MD), and five biological replicates were sampled for each treatment.
Agronomy 10 00313 g001
Figure 2. Development of female inflorescence and agronomic traits changes of ears in response to drought stress. (a) Contrasting sizes and differentiation of the control and drought-treated plants at 20 and 30 DAD. (b) Proportion of dry matter in immature ears at 30 DAD. (c) Radar chart showing changes in yield traits for mature maize plants grown under well-watered (CK), light drought (LD), and moderate drought (MD) conditions. (b) and (c) were calculated with 15 and 10 biological replicates sampled for each treatment.
Agronomy 10 00313 g002
Figure 3. Identification and characterization of differentially expressed genes (DEGs) between the drought treatment and control plants. (a) The number of DEGs in three comparison groups. (b) A Venn diagram comparison summarizing overlaps in differentially expressed genes among the three comparisons.
Agronomy 10 00313 g003
Figure 4. The expression patterns of eleven genes in female panicle tissues under well-watered (CK), light drought (LD), and moderate drought (MD) conditions by qRT-PCR. Values are the mean ± SD of three independent experiments. Maize β-actin expression was used as a control.
Agronomy 10 00313 g004
Figure 5. Top 20 biological processes enriched by the up-and down-regulated genes in the (a) MD vs. CK and (b) MD vs. LD comparisons. Expression pattern of the differentially expressed genes associated with (c) development progress and (d) growth in the three comparisons. Colors indicate the log2 fold change values. Red indicates up-regulation, and green indicates down-regulation in that comparison.
Agronomy 10 00313 g005aAgronomy 10 00313 g005b
Figure 6. Top 20 enriched KEGG pathways in the (a) “MD vs. CK” and (b) “MD vs. LD” comparisons. Pathway entries with the corresponding number of genes (among those pathways with more than two genes) are shown, and the corresponding -log10 p-value of each entry is sorted in descending order. The number of DEGs in each pathway is positively related to the size of plot, and the p-values shown in red are more significant.
Agronomy 10 00313 g006
Figure 7. Genes involved in auxin plant hormone signal transduction pathway in the Kyoto Encyclopedia of Genes and Genomes (KEGG). Differentially expressed genes involved in AUX/IAA, GH3, and SAUR were shown by heat-maps, and the number was calculated with log2foldchange in three comparisons. Color of heat-maps represented different fold change. Yellow box means involved significantly differentially expressed genes were mainly up-regulated, and green box means down-regulated.
Agronomy 10 00313 g007

