Article

Nutrient Recycling, Wheat Straw Decomposition, and the Potential Effect of Straw Shear Strength on Soil Mechanical Properties

1
College of Engineering, Nanjing Agricultural University, Nanjing 210031, China
2
Institute of Agricultural Resources and Environment, Jiangsu Academy of Agricultural Sciences/Key Laboratory of Agricultural Environment in Lower Reaches of the Yangtze River, Ministry of Agriculture, Nanjing 210014, China
*
Author to whom correspondence should be addressed.
Submission received: 24 December 2019 / Revised: 16 February 2020 / Accepted: 19 February 2020 / Published: 24 February 2020

Abstract

:
This study aimed to explore the release rate (RR) of wheat straw nutrients during straw return to a paddy field and examined the possible relationship between wheat stalk shear strength and the content of the remaining components in wheat straw. We used the nylon mesh bag technique to study the decomposition of straw nutrients such as total organic carbon (TOC), total nitrogen (TN), total phosphorus (TP), total potassium (TK), lignin, and cellulose over time. During the time span of 0–90 days, results showed a rapid decomposition rate with a diverse trend under different tillage operations. Furthermore, the decomposition rate was higher under the plough (PRP) conditions than under dry conditions (RP) or water rotation (PR). Moreover, under PRP conditions, the RR of TOC, TK, lignin, and cellulose increased, while the RR of TK was higher than 95% initially and then increased slightly. However, the carbon to nitrogen ratio was first increased and then decreased; similarly the RR of TP first increased and then decreased; a fluctuating pattern was observed for TN. Additionally, we found a strong correlation between wheat stalk shear strength and the remaining contents of lignin, hemicellulose, and cellulose, with R2 ≥ 0.91, which was higher than 0.82 after computing adjustments. Furthermore, the changing trend of nutrients and components and the relationship between shear strength and the content of the remaining components in wheat straw were used to evaluate the release characteristics of nutrients under straw return. The potential effects of the straw shear strength on soil mechanical properties were determined, providing a remarkable opportunity for acquiring nutrients for sustainable application of soil.

1. Introduction

The significance of straw return in improving soil nutrients and physicochemical properties is shown in the study on the decomposition characteristics of straw return. Being the largest agricultural country, China produces almost one-third of the total straw production around the globe [1]. As an abundant co-product of agricultural outputs, with a low calorific value and tough collection modes, straw is not fully used in people’s daily life [2]. In the field, straw is either burned, removed, piled, spread, incorporated in the soil, or mulched for the following crop. Inconvenient agricultural production systems (double cropping) have caused its limited utilization in the field. Summer rice and winter wheat cropping systems are used in the middle–lower reaches of Huaihe River in China, where rice quickly needs to be transplanted after wheat due to the variation tendency towards a high temperature [3]. That limits the time for ploughing and straw return. Furthermore, there are two types of straw return, i.e., direct and indirect. Direct straw return can save much time owing to lower costs and fewer operations compared with indirect return, which involves straw collection, transport, fermentation, and then recycling, etc. [4]. However, direct straw return has shortcomings in dual cropping systems. In dual (rice-wheat) cropping systems, the degraded (wheat) straw of the first crop during the rice-growing season relies entirely on the soil, even after the rice is harvested, which negatively influences the tillage operations and straw (rice) return of the next crop. Therefore, it is imperative to study the decomposition characteristics of direct straw return.
A plethora of research has been found in the literature about straw decomposition, concluding that the degradation process of straw happens slowly in the open environment compared with greenhouse experiments due to different atmosphere, rainfall, and soil physicochemical properties, as well as tillage and microorganisms in the soil [5]. Yan explored the decomposition characteristics of rice straw in Northeast China and found that P and K showed better performance at the initial stage, while N and OC showed better effects in the middle to end stage [6]. Nakajima et al. [7] considered CO2 release and soil organic matter improvement as parameters and found that higher temperature and moisture could accelerate the degradation process of straw at the studied farm. Zhao et al. [8] found that straw return with proper chemical fertilization degraded more quickly as compared to the process without chemical fertilization, considering CO2 release and other microorganisms. Pimental et al. [9] found that the decomposition rate of the second year was 25% higher than that of the first year, and the loss of OC and N in the 2nd year was 2 times than in the 1st year. At the end of the experiment, the content of cellulose and hemicellulose decreased by 13% and 7%, respectively, and the relative proportion of lignin compared with the total components increased to 92%. Cai et al. [10] found that the main factors that influenced the long-term decomposition of straw from wheat, corn, rice, soybean, and rape, etc., were temperature and straw quality. Different from previous results, the process of straw degradation was stimulated by mixing straw with biochar, or fertilizer from organic fertilizer or fermentation, or bacteria such as white-rot fungi and wood-rotting fungi [11]. Wang et al. [12] found that the degradation speed of straw was increased by the addition of biochar [13] or biogas fertilizer [14]. Conclusively, higher temperature and moisture were the main accelerating parameters of straw decomposition; moreover, the mixing of straw with biochar, fertilizer, or bacteria was also effective. P and K in straw are released during short-term straw return, while OC and N are released during long-term straw return. However, under field conditions, temperature and moisture cannot be controlled artificially, while mixing of fertilizer or bacteria could adversely affect the field ecosystems. Furthermore, straw could not be chopped or crushed for a long time due to harvesting loss and decreased production efficiency. Therefore, it is imperative to study the release characteristics of nutrients and components in the straw under natural environmental and prevalent tillage conditions, such as ploughing and rotation.
Straw mainly includes lignin, cellulose, hemicellulose, N, P, and K, etc. [15]. After the straw is returned to the soil, some nutrients are easily transformed into CO2 by mineralization of microorganisms in the soil. However, straw OC, which remains in the straw lignin, cellulose, and hemicellulose, remains in the soil for a longer time because macro-molecules such as lignin are not easily assimilated and transformed by bacteria in the soil [16]. The actualities mentioned above confirmed that the rest of the straw might have unique surface morphology and mechanical properties that might have a continuous effect on the tillage and soil compaction [17]. The changing content of straw lignin, cellulose, and hemicellulose can explain the decomposition characteristics of straw and may have some potential influences on the changing trend of straw mechanical properties. Hence, exploring the relationship between straw mechanical properties and changing content of components such as lignin is essential to indicate the decomposition performance and potential effects of straw shear strength on soil tillage and compaction. Therefore, this study was specifically designed to explore the release characteristics of single-season straw return and the relationship between shear strength and the remaining components of the wheat straw in the middle–lower reaches of Huaihe River, China. According to the best of the authors’ knowledge, no study was found in literature about nutrient release from the perspective of the nutrient source (straw return). Furthermore, the necessity of nutrients in a short-term dual cropping system highlights the requirement to determine the rate of nutrient release, as in a short time period, straw is not completely decomposed, which could affect the growth of the following crop. Therefore, this study intended to a provide scientific reference for wheat straw return to the soil.

2. Materials and Methods

2.1. Site Description

This study was conducted at Sihong county experimental farm, located at 118°15′21.90" E~118°15′42.38" E; 33°21′47.50" N~33°22′04.53" N, Suqian district, Jiangsu Province, China, during the rice-growing season, dated, 2018-06-30 to 2018-09-30. The site is located in the middle reaches of Huaihe River, 11.6 meters above sea level.
The study area situated in the East Asian monsoon region has a typical climatic transition characteristic with an average annual temperature of 14.6 ℃ and average annual rainfall of 893.9 mm, moreover, the extreme changes in temperature and rainfall during the experimental time span has been further depicted in Figure 1. Summer rice (June–October) and winter wheat (November–June) are the core cropping systems in the study area.

2.2. Test Method and Order

The single-factor method was adopted in this study, and the following steps were carried out.
  • On the 10th of June, 2018, Qianmai 088, a wheat variety, was harvested with a Kubota 588Q, but stalks were not chopped.
  • The wheat stalks were collected and transported to the warehouse where the stalks were air-dried in the naturally cool and ventilated environment until their qualities were constant (as moisture from the stalks was evaporated, the weight became constant and uniform).
  • The stalks were then artificially chopped into 15 cm lengths.
  • The chopped stalks were weighed and placed in nylon mesh bags (55 × 35 cm, 0.425 mm mesh), 400 g each.
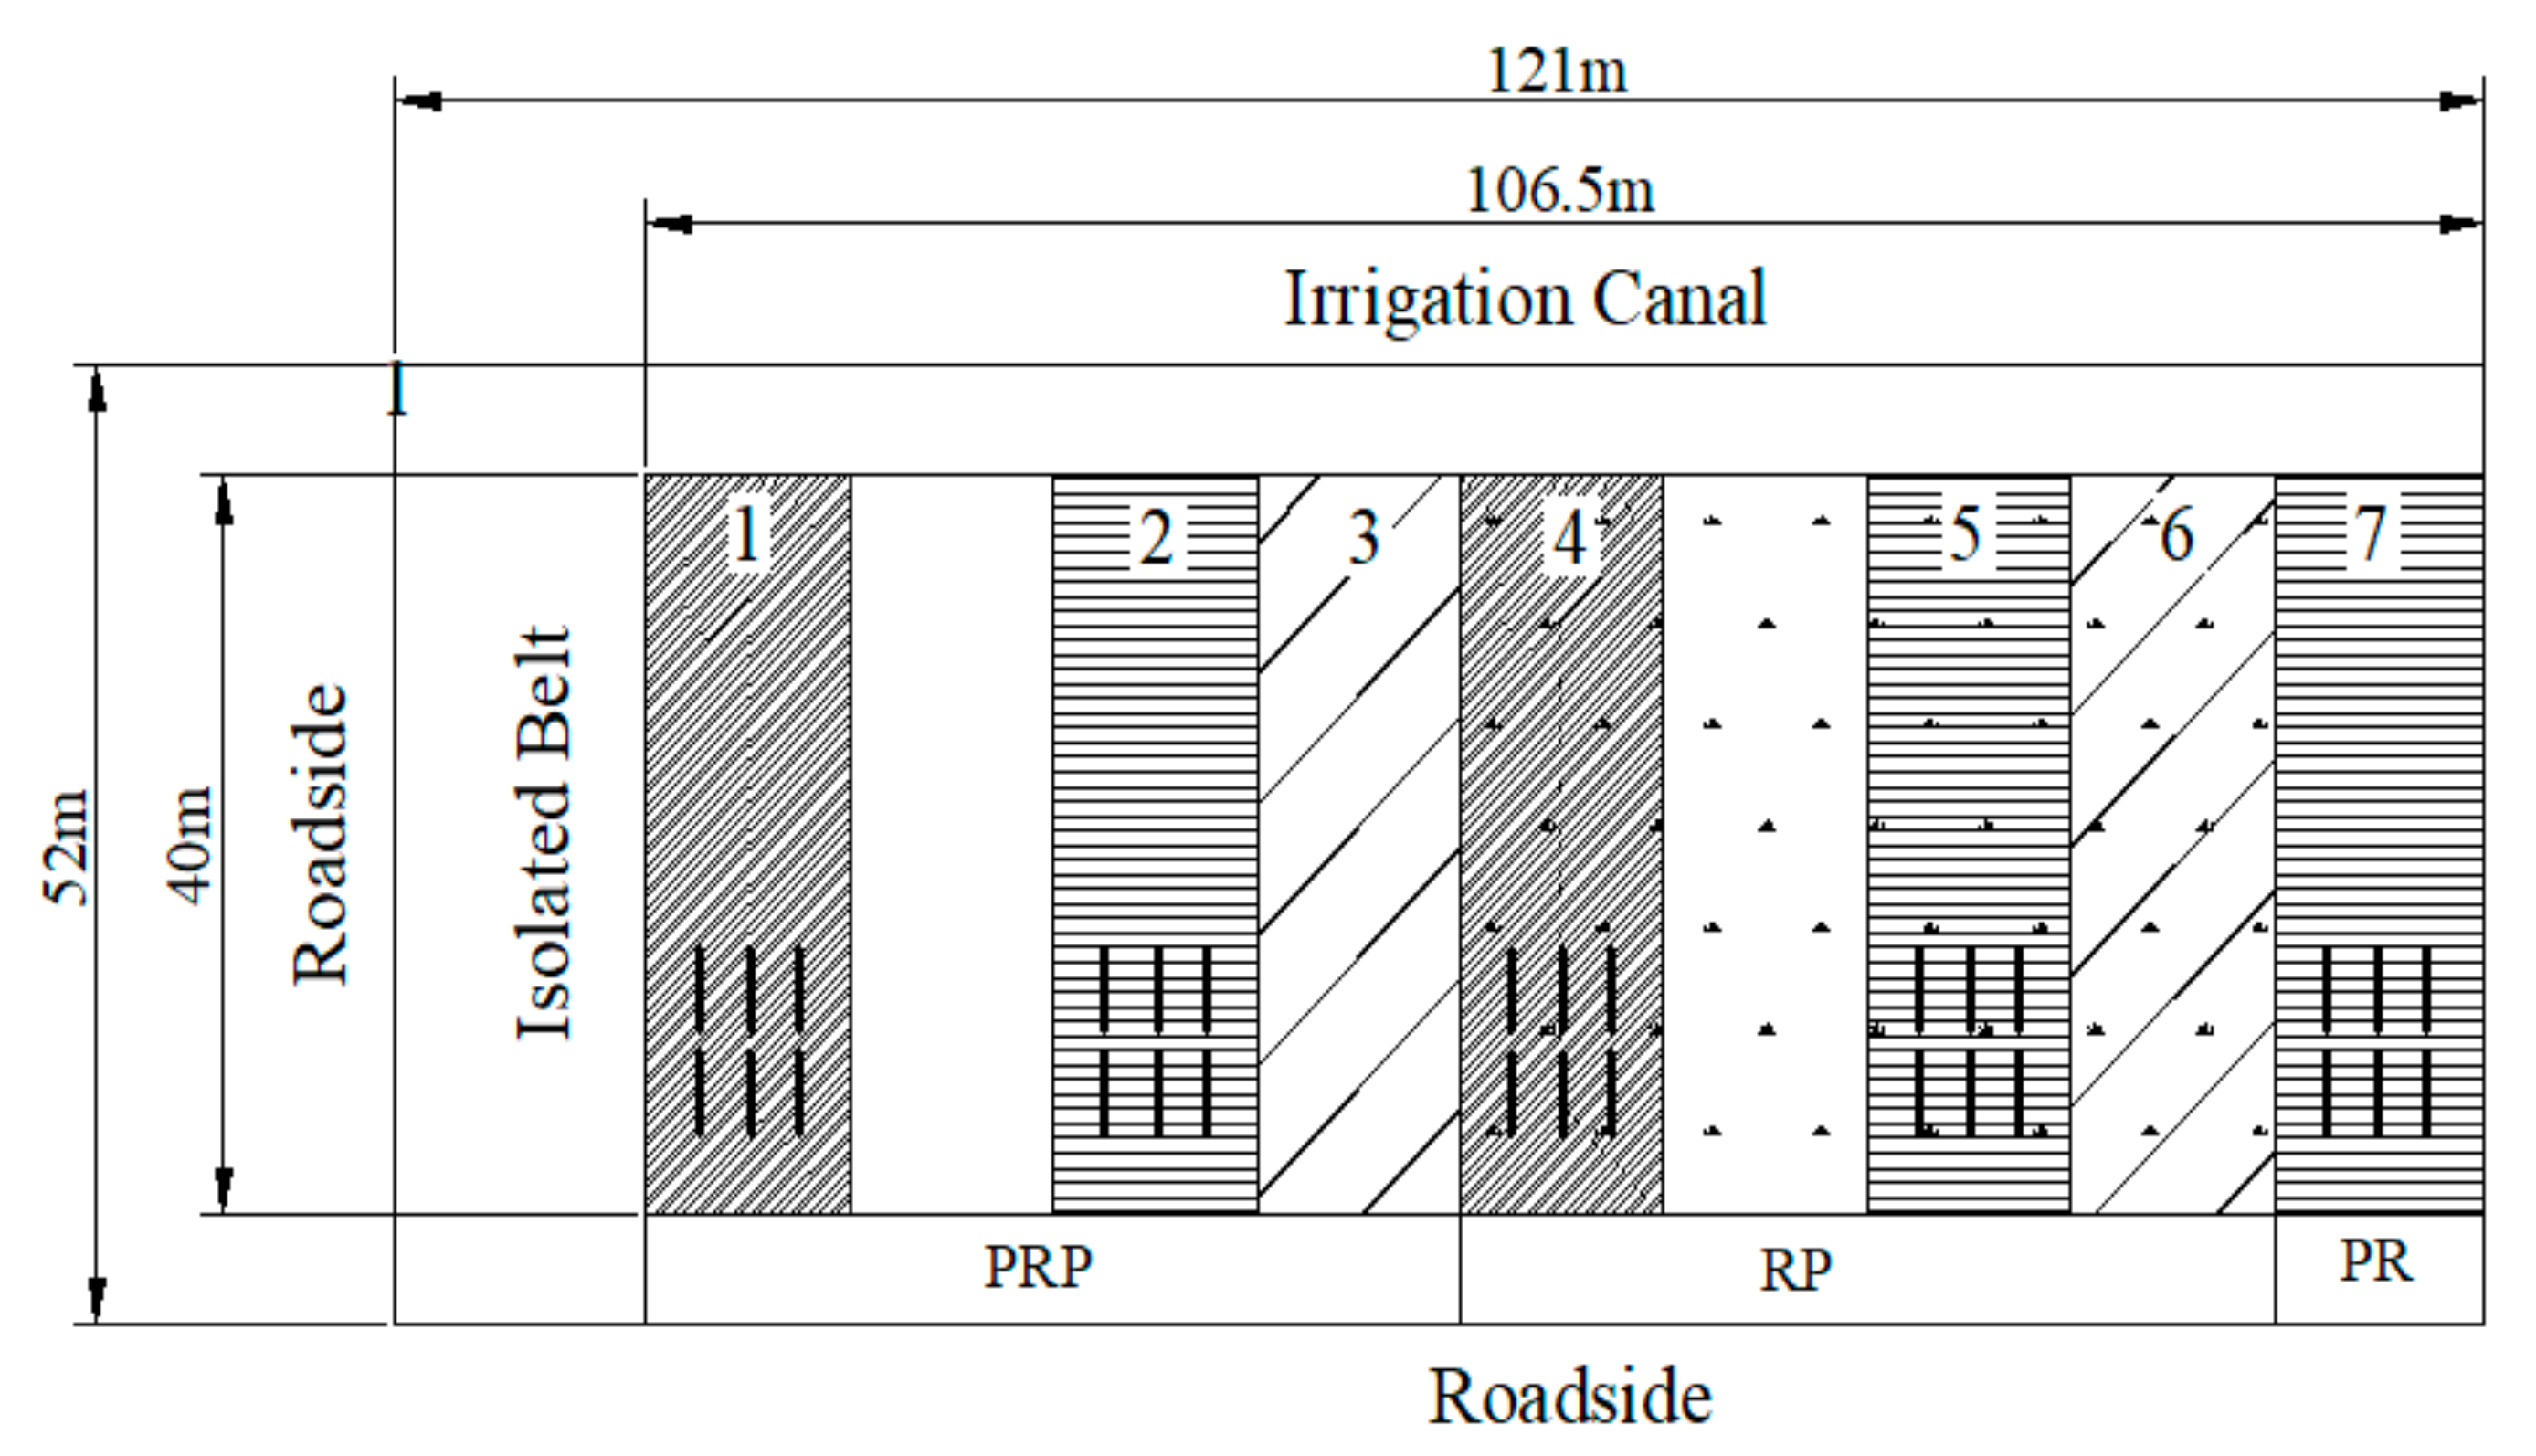
  • The experimental field was subdivided into 7 subfields (1–7) as shown in Figure 2; a field without a number was not selected for the experiment. After wheat harvesting, subfields 3 and 6 were cleared from wheat stalk and stubble, while stalks were homogeneously placed on the rest of the fields. Furthermore, three tillage treatments were carried out, i.e., PRP (subfields 1, 2, and 3 were ploughed first; then, we used a rotary tiller and later puddled the fields for more than 40 h), RP (4, 5, and 6 were rotary tilled first and then puddled for more than 40 h), and PR (field 7 was puddled first for more than 40 h and then rotary tilled). Moreover, 1 and 4 were only treated with wheat straw return, and there was no other rice straw return in the previous season before wheat straw return, while the rest (2, 5, and 7) had alternate wheat and rice straw return in every season.
  • Nylon mesh bags were buried in the topsoil layer (5–20 cm depth); 6 bags were placed in each subfield. Therefore, a total of 30 bags were placed in the whole field. The bold vertical lines represent the location of nylon bags in each subfield (1, 2, 4, 5, and 7).
  • Finally, rice nursery seedlings were transplanted into the field on the 20th of June, 2018.
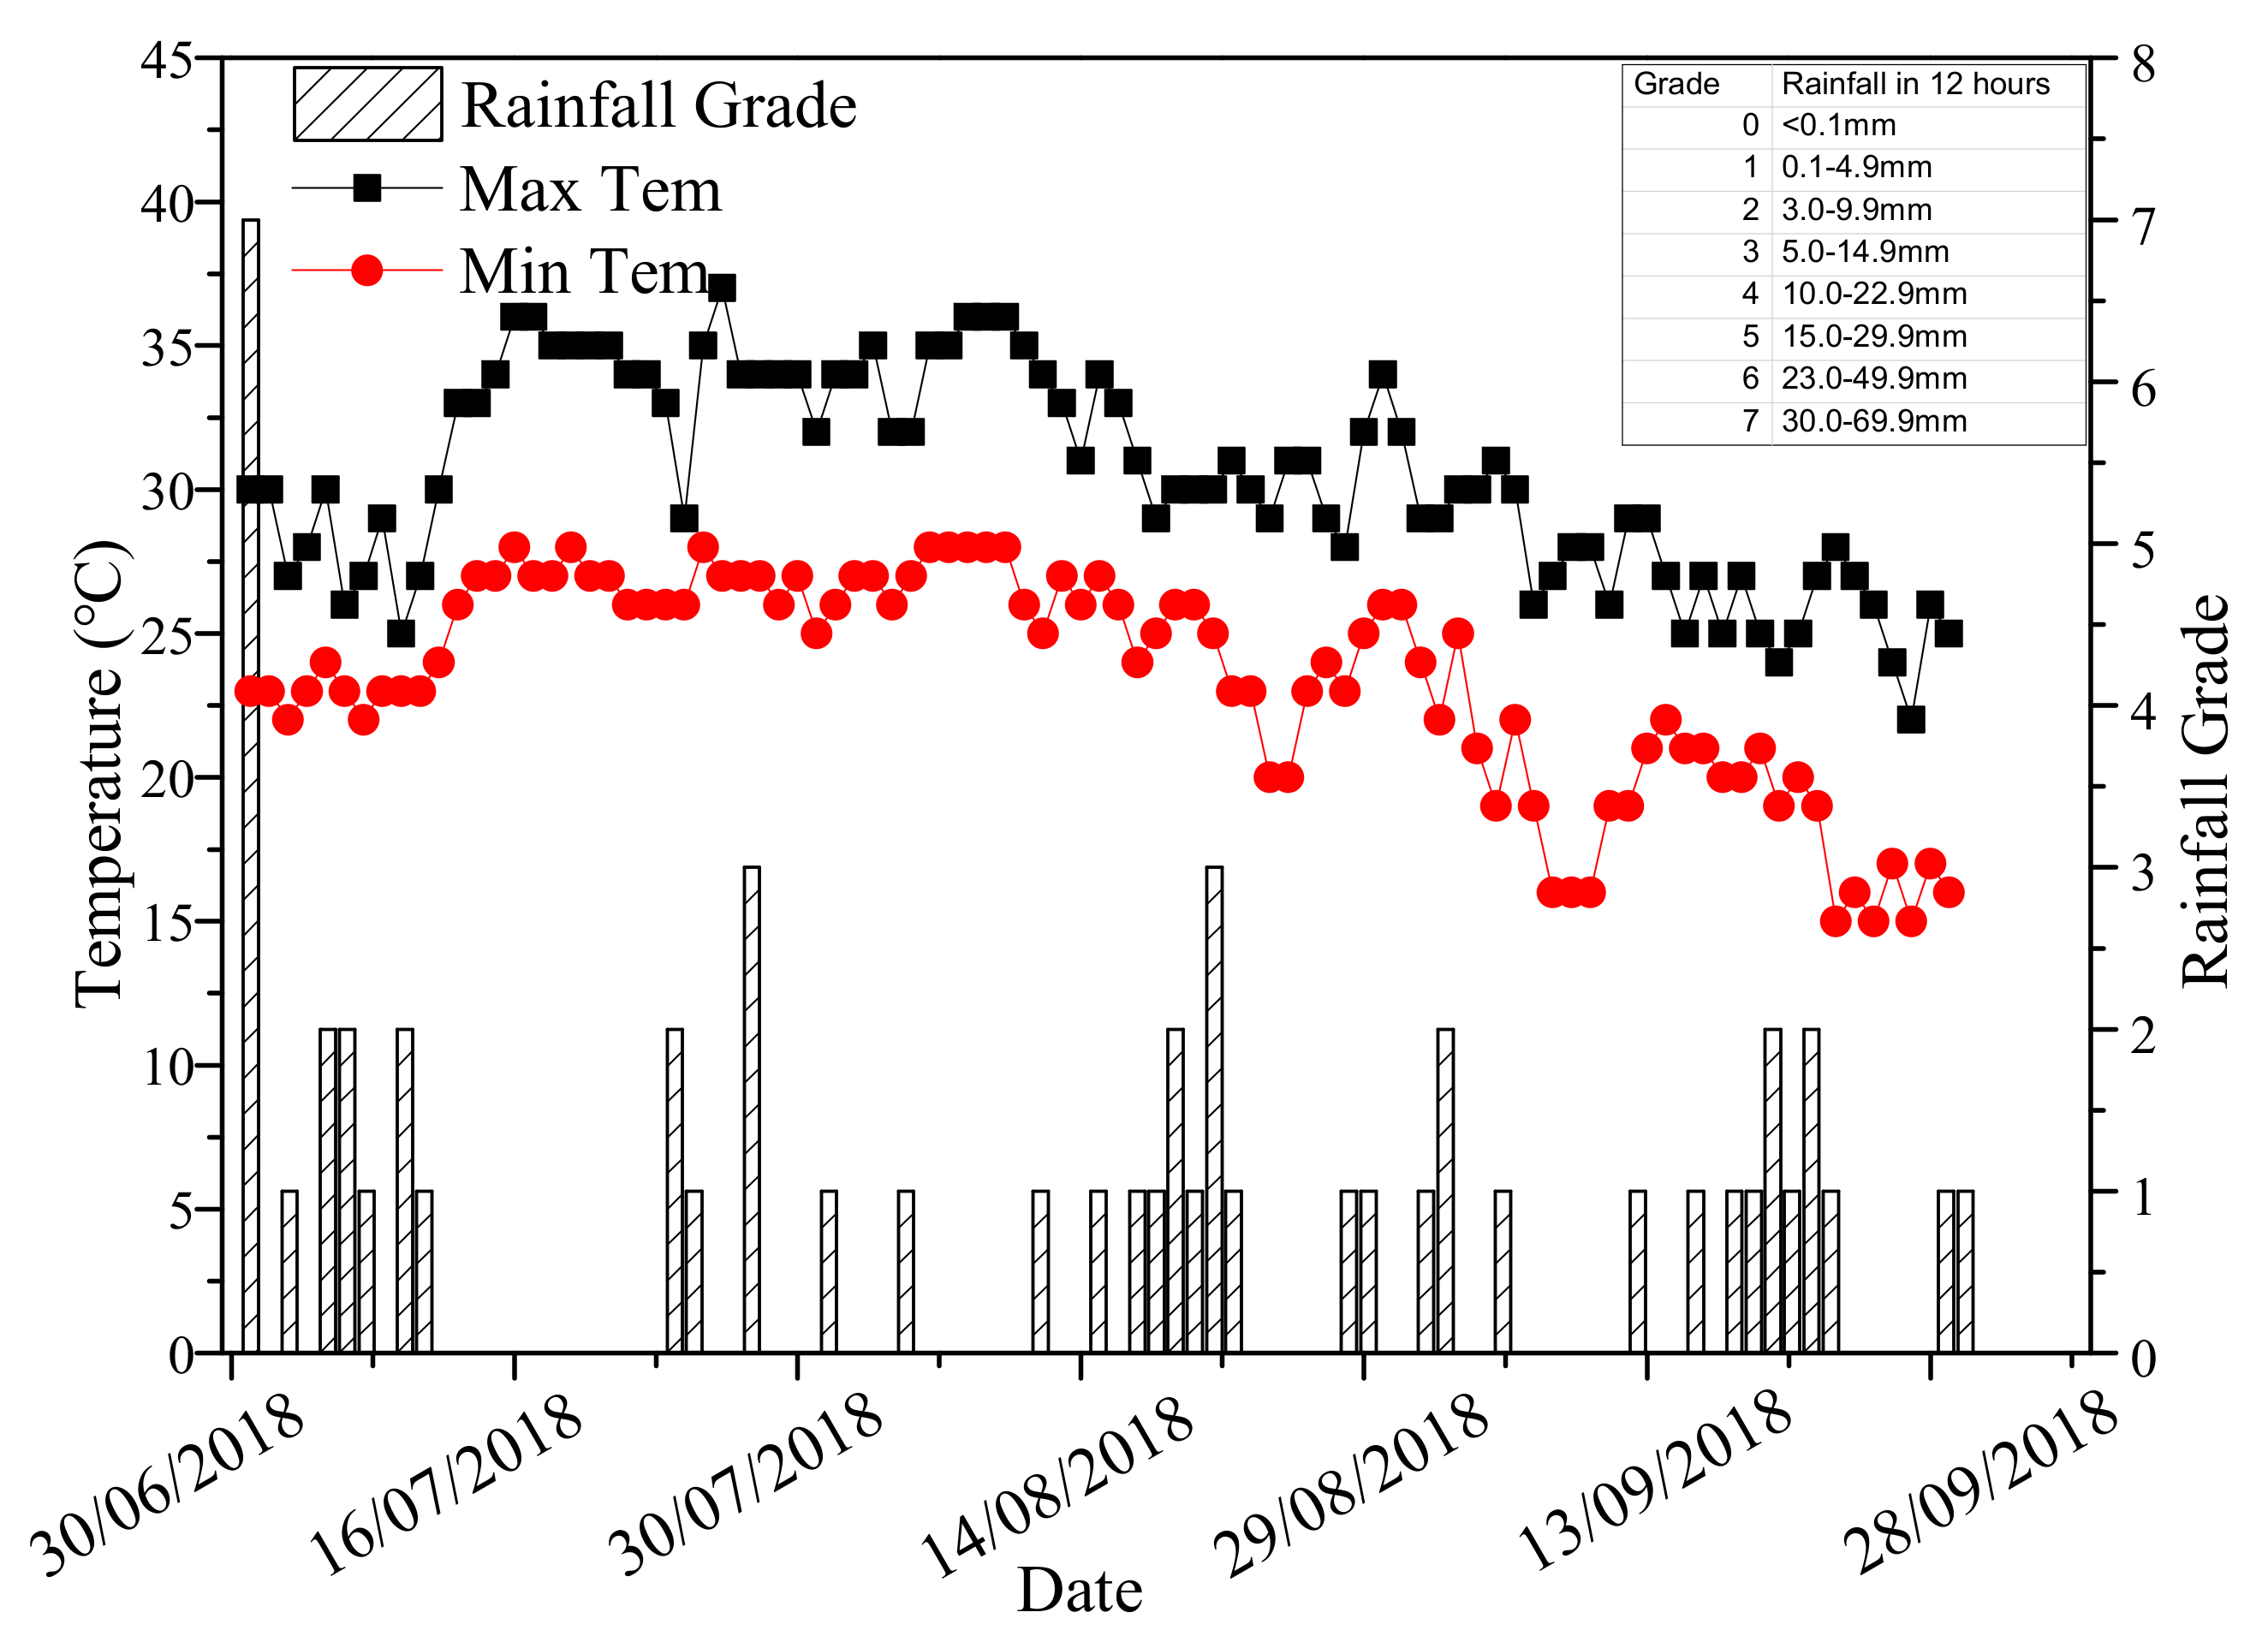
  • The buried straw samples were collected at different intervals of time as shown in Table 1. Only one bag was collected in every subfield at the sampling time and was used for the results presented for subfields (1, 2, 4, 5, and 7).

2.3. Test Parameters and Data Analysis

2.3.1. Test Parameters

Straw parameters included the physical and chemical index. The physical index is the straw shear strength force, calculated by using the following Equation (1):
τ = F τ max / A
where τ is shear strength (MPa); Fτmax is the maximum shear force of wheat stalks, (N); A is the cross-sectional area of the wheat stalk (mm). Fτmax was measured by using the Food Texture Analyzer of series TMS-PRO, from Food Technology Corporation. The length and width of wheat stalks were measured by digital vernier calipers from Shanghai Meinette Industrial Co., Ltd.
Chemical indexes were the cumulative release rate of nutrients (OC, N, P, and K) and components (lignin and cellulose) and the remaining contents of lignin, cellulose, and hemicellulose.
Total organic carbon (TOC) in straw was measured both by oxidation with potassium dichromate and by titration with ferrous ammonium sulfate. Nutrients, including N, P, and K, were first measured by digestion with H2SO4-H2O2, and then total nitrogen (TN), total phosphorus (TP), and total potassium (TK) were measured by the Kjeldahl method, the Mo-Sb Anti-spectralphotometer method, and the flame photometry method, respectively [6]. Except for C (measured twice), these indexes were measured three times for one sample, and average values were calculated.
Lignin in straw was measured by the sodium thiosulfate titration method. Cellulose was measured by the anthrone (60%) sulfuric acid colorimetry method. Hemicellulose in straw was measured both by using hydrochloric acid hydrolysis and by DNS colorimetry [18]. These indexes were measured once in one sample by the Yizhiyuan Company.
The following Equation, (2), was used to calculate the release rate of nutrients or components in wheat straw:
R R = ( m 0 m n ) / m 0 × 100 %
where RR is the release rate of nutrients or components in wheat straw (%), m0 is the initial content of nutrients or components in wheat straw, mn is the nth sample content of nutrients or components in wheat straw, n is the nth collected sample. C:N is the ratio of the straw residual TOC to TN [6]. Additionally, Abbreviation of parameters has been further depicted in Appendix A Table A1.

2.3.2. Data Analysis

WPS Excel 2019 software (Kingsoft Office Corporation, Beijing, China)was used to analyse the data for nutrients, components, and shear strength, while SPSS 24 (IBM, Armonk, New York, USA)was used for statistical analysis (ANOVA of a single factor), and Origin 9.0(OriginLab Corporation, Northampton, Massachusetts, USA) was used for fitting analysis and graphics. Moreover, in fitting analysis, Origin calculated R2 and showed 2 values; one was the original, the other was the adjusted R2 (the value after Origin auto-deleted irrational values).

3. Results

3.1. Release Rate of Nutrients and Components under PRP Conditions

Table 2 shows the changing trend in the RR of nutrients and components over time under PRP conditions. Additionally, for the subfield, during the whole-time span of 0–90 days, the RR of TOC increased from 31.76% to 57.78% and oscillated on days 46 and 60. The RR of TN showed a fluctuating trend during the whole time span and decreased slightly at the end. The C:N ratio decreased from 259 to 238, rose to 255, and then gradually decreased to 158. The RR of TP rose from 47.03% to 52.31% and then quickly decreased to 25.44%, but the value was higher than the expected rising trend on day 60. From day 0–90, the RR of TK was higher than 96% and slowly increased from 96.48% to 98.75% from day 16–90. From day 0–90, the RR of straw lignin increased from 1.74% to 4.76%, but the values were lower than the rising trend on days 46 and 60. The RR of straw cellulose continually rose from 50.59% to 71.52% from day 0–90.
For subfield 2 in Table 2, from day 0–90, the RR of TOC increased and ranged from 36.07% to 58.55%, but the number was lower than the expected trend on days 30 and 46. From day 0–90, the RR of TN first increased from 43.18% to 47.79% and then decreased to 37.42%. The C:N ratio initially increased from 241 to 328 and then decreased to 142. From day 0–90, the RR of TP decreased from 75.03% to 30.02%, but the value was lower than the expected declining trend on days 46 and 60. From day 0–90, the RR of TK exceeded 95% and slowly increased from 95.34% to 98.87% from day 16–90, but the value was lower than the expected rising trend on day 46. From day 0–90, the RR of straw lignin slowly increased from 2.73% to 4.85%, but the values were lower than the rising trend on days 30 and 60. From day 0–90, the RR of straw cellulose continually rose from 46.47% to 70.84%, but the value was lower than the rising trend on day 60.
Conclusively, for both subfields under PRP conditions, we could say that from 0–90 days, the RR of TOC, TK, lignin, and cellulose increased, the RR of TK exceeded 95%, the C:N ratio and the RR of TN first increased and then decreased, and the RR of TP in subfield 2 constantly decreased.

3.2. Release Rate of Nutrients and Components under RP Conditions

Table 3 shows the changing tendency of the RR of nutrients and components over time under RP conditions. From the data of subfield 4, from 0–90 days, the RR of TOC increased from 17.85% to 53.89% with a lower number than expected. The highest value of TOC was observed on day 60. From 0–90 days, the RR of TN followed a zigzag path. First, it increased from 40 to 58%, decreased to 39% on day 46, then increased again, and finally decreased to 17.99%. The C:N ratio decreased from 295 to 138, but the value was lower than the expected declining trend on day 46. The RR of TP rose from 32.29% to 64.35% initially and then decreased to 5.90% sharply, but the value of the declining trend was found lower on day 60. From 0–90 days, with a slight fluctuation, the RR of TK stayed higher than 95%. Throughout 0–90 days, the RR of straw lignin first increased from 0.91% to 3.85% and then decreased to 2.94%. The RR of straw cellulose consistently rose from 37.88% to 64.98%, but the value was lower than the rising trend on day 75.
Furthermore, for subfield 5 in Table 3, from 0–90 days, the RR of TOC increased from 28.09% to 70.53% and then decreased to 56.17%. The RR of TN first rose from 54.36% to 57.50% and then decreased to 41.17%. With the same trend, the C:N ratio first increased from 335 to 349 and then decreased to 160. Similarly, the TP first increased (from 72.69 to 75.48%) and then decreased. The RR of TK was over 95% and gradually increased from 96.52% to 98.38%. The RR of straw lignin first increased from 1.24% to 5.16% and then decreased to 3.85%. From day 0–90, the RR of straw cellulose continually rose from 33.59% to 70.75%, but the value was higher than the rising trend on day 60.
Succinctly, in both subfields 4 and 5 under RP conditions, the RR of TK and cellulose incessantly increased, and the RR of TK remained over 95%, and the C:N ratio and the RR of TOC, TN, TP, and lignin in subfield5 initially increased and then decreased.

3.3. Release Rate of Nutrients and Components under PR Conditions

As we can see from the data of subfield 7 in Table 4, the RR of TOC and TN showed almost the same trend and increased initially from 16 to 30 days, then decreased and rose again from 46 to 60 days; the RR of TOC then decreased on the 75th day and increased again and ended at 52.10%, while the RR of TN decreased gradually and ended at 24.19%. The C:N ratio first increased from 218 to 297 and then decreased to 135. The RR of TP first increased from 43.30% to 76.17% and then decreased to 45.95%, but the value was lower than the expected declining trend on days 46 and 60. The RR of TK was over 94% and slowly increased from 94.23% to 98 ± 0.5% from 0–90 days, but the value was higher than an expected rising trend on day 30. The RR of straw lignin slowly increased from 1.23% to 5.50% and then decreased to 4.33%, but the values were lower than the rising trend on days 46 and 75. From day 0–90, the RR of straw cellulose first rose from 60.87% to 81.35% and then decreased to 66.65%, but the value was lower than the declining trend on day 75.
Concisely, in subfield 7, under PR conditions, the RR of TK continually increased and stayed over 94%, and the C:N ratio and the RR of TOC, TN, TP, lignin, and cellulose first increased and then decreased.

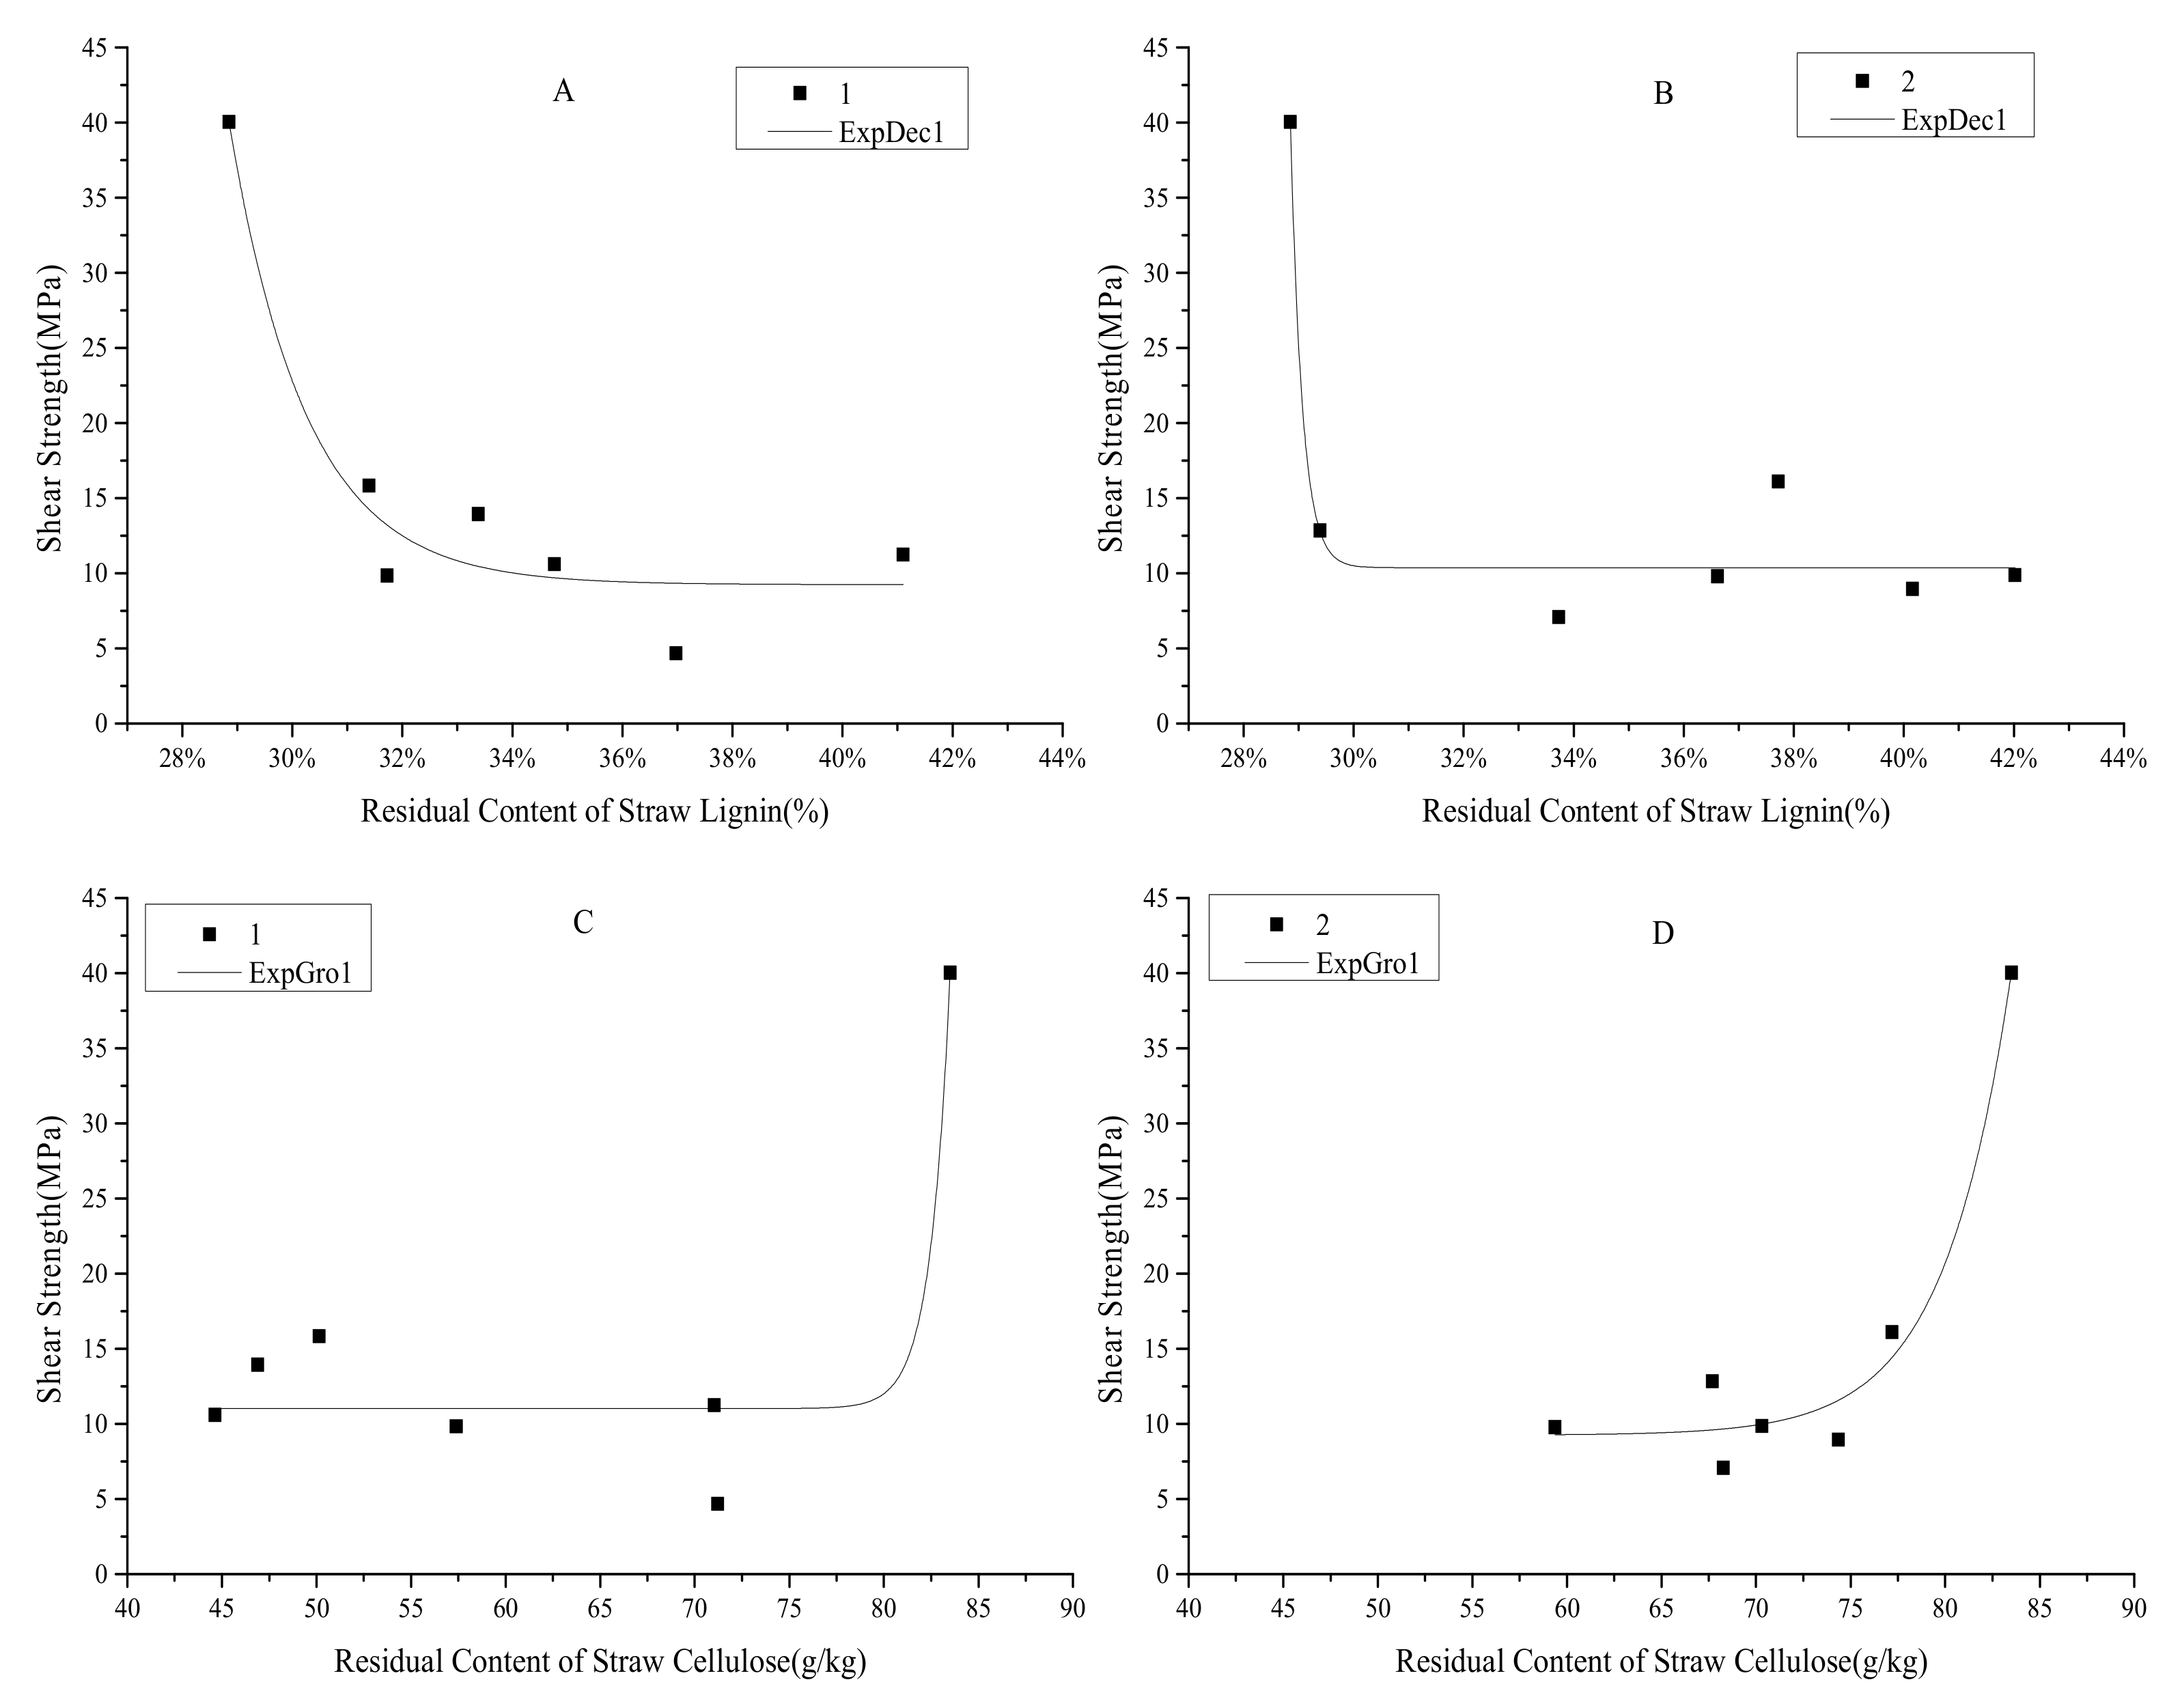
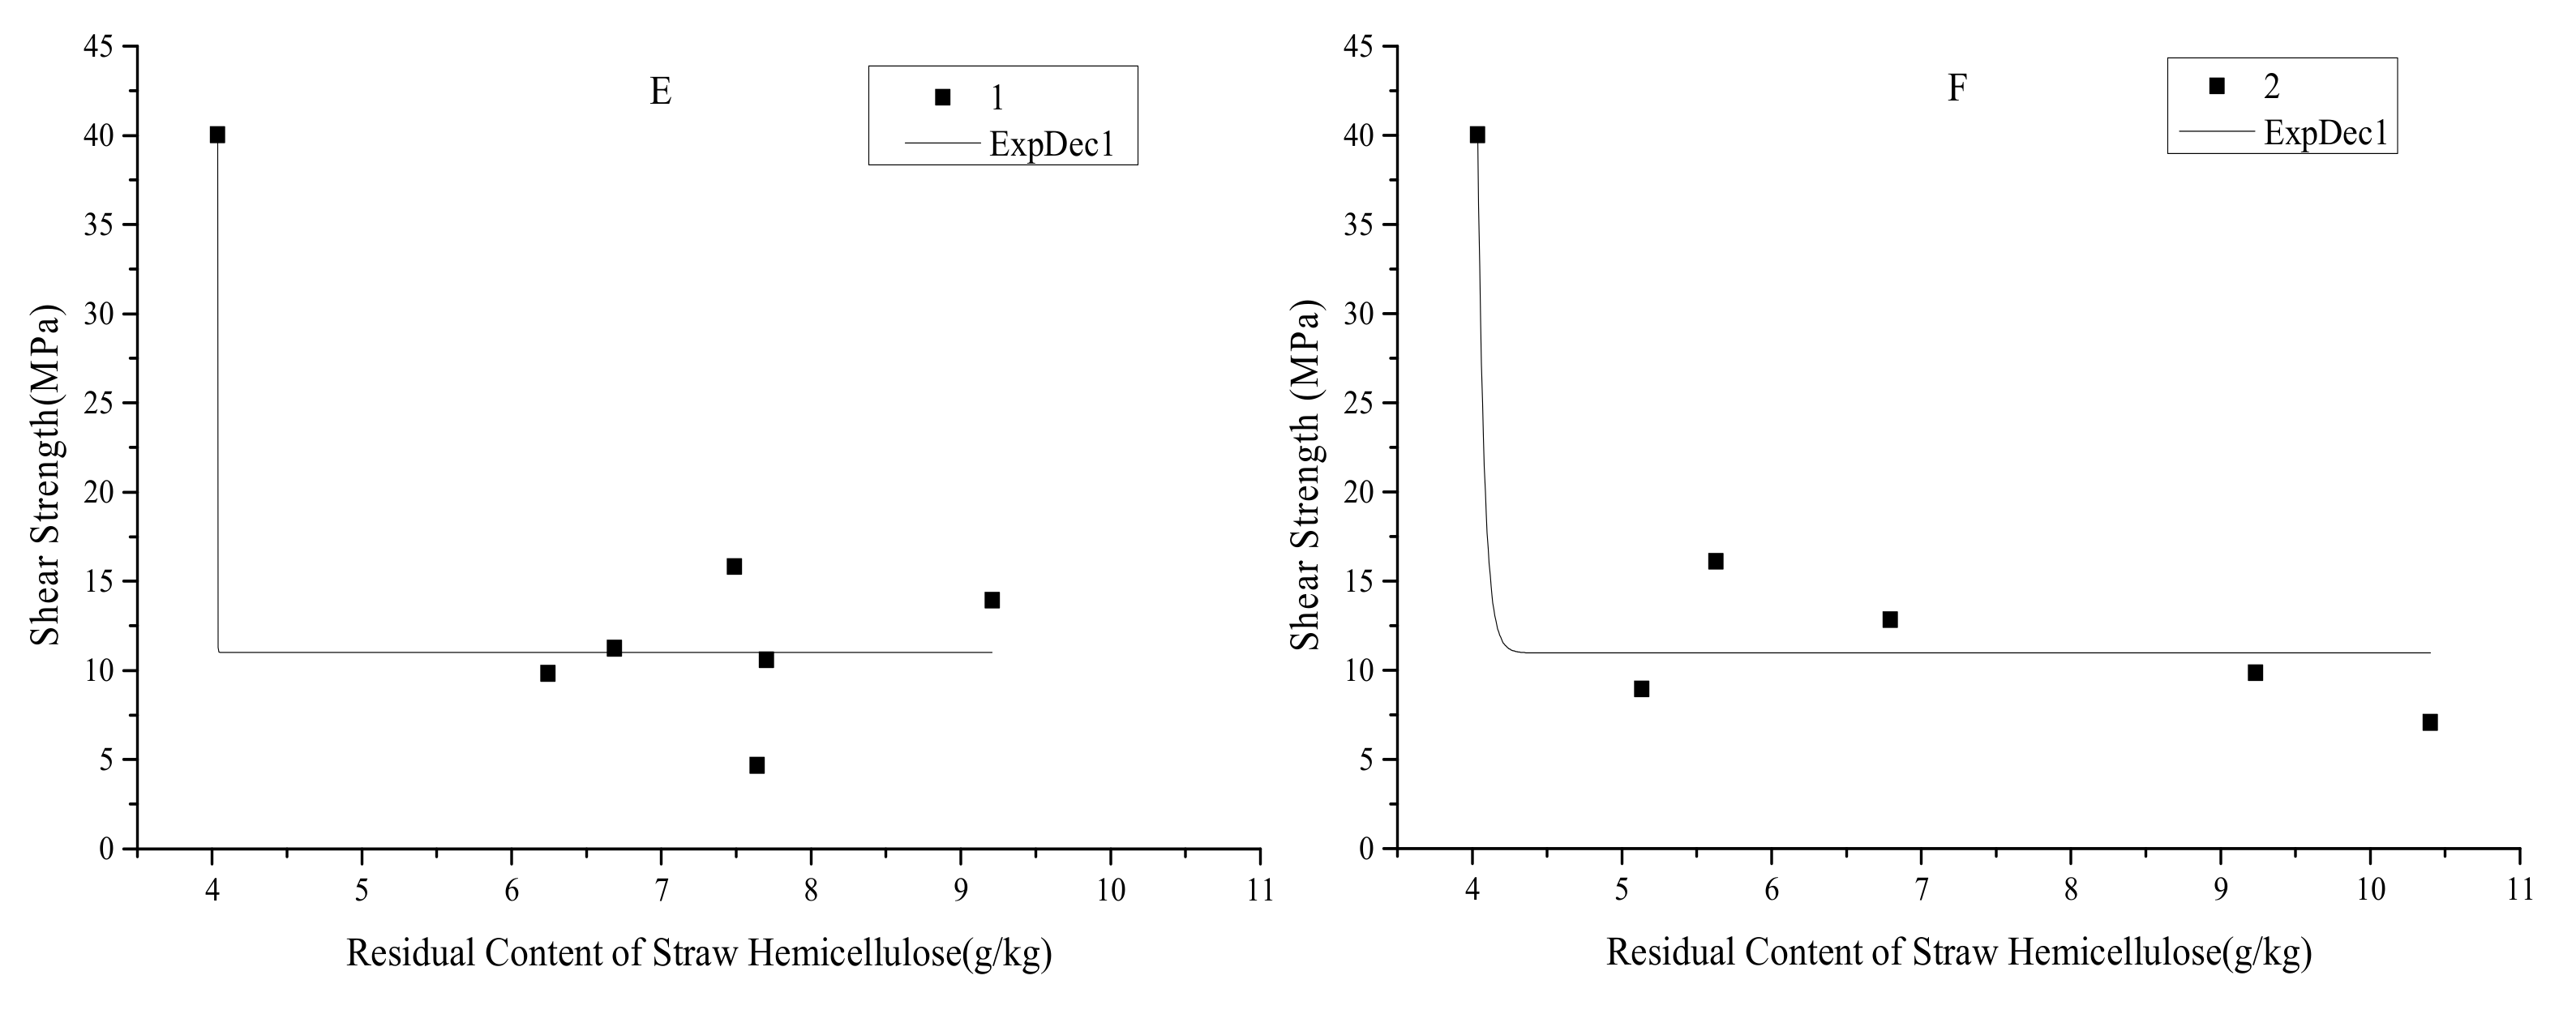
3.4. Relationship to Straw Shear Strength and Residual Content of Components under PRP Conditions

Figure 3 shows the relationship between straw shear strength and the residual content of components under the PRP condition. As depicted in Figure 3A,B, the relationship between straw shear strength and the residual content (RC) of lignin met the exponential decay (ExpDec1) fit (y = y0 + A1 × exp (-(x − x0)/t1)), and the coefficients of determination (R2) for subfields 1 and 2 were 0.93 and 0.94, respectively. After adjustment, the R2 of subfields 1 and 2 was 0.87 and 0.88, respectively. As presented in Figure 3C,D, the relationship between straw shear strength and the residual content (RC) of cellulose met the exponential growth (ExpGro1) fit (y = y0 + A1 × exp ((x − x0)/t1)), and the R2 of subfields 1 and 2 was 0.91 and 0.97, respectively. After adjustment, the R2 of 1 and 2 was 0.82 and 0.93, respectively. Figure 3E,F show the relationship between straw shear strength and the residual content (RC) of hemicellulose met the ExpDec1 fit (y = y0 + A1 × exp (− (x − x0)/t1)), and the R2 of subfields 1 and 2 was 0.91 and 0.93, respectively. After adjustment, the R2 of subfields 1 and 2 was 0.82 and 0.83, respectively.
Briefly, the relationship between straw shear strength and the RC of straw lignin and hemicellulose met the fit of ExpDec1, and the relationship between straw shear strength and the RC of straw cellulose met the fit of ExpGro1; their R2 was over 0.91, which showed a strong correlation. After adjustment, only the R2 of the relationship between straw shear strength and the RC of straw cellulose in subfield 2 was over 0.91.

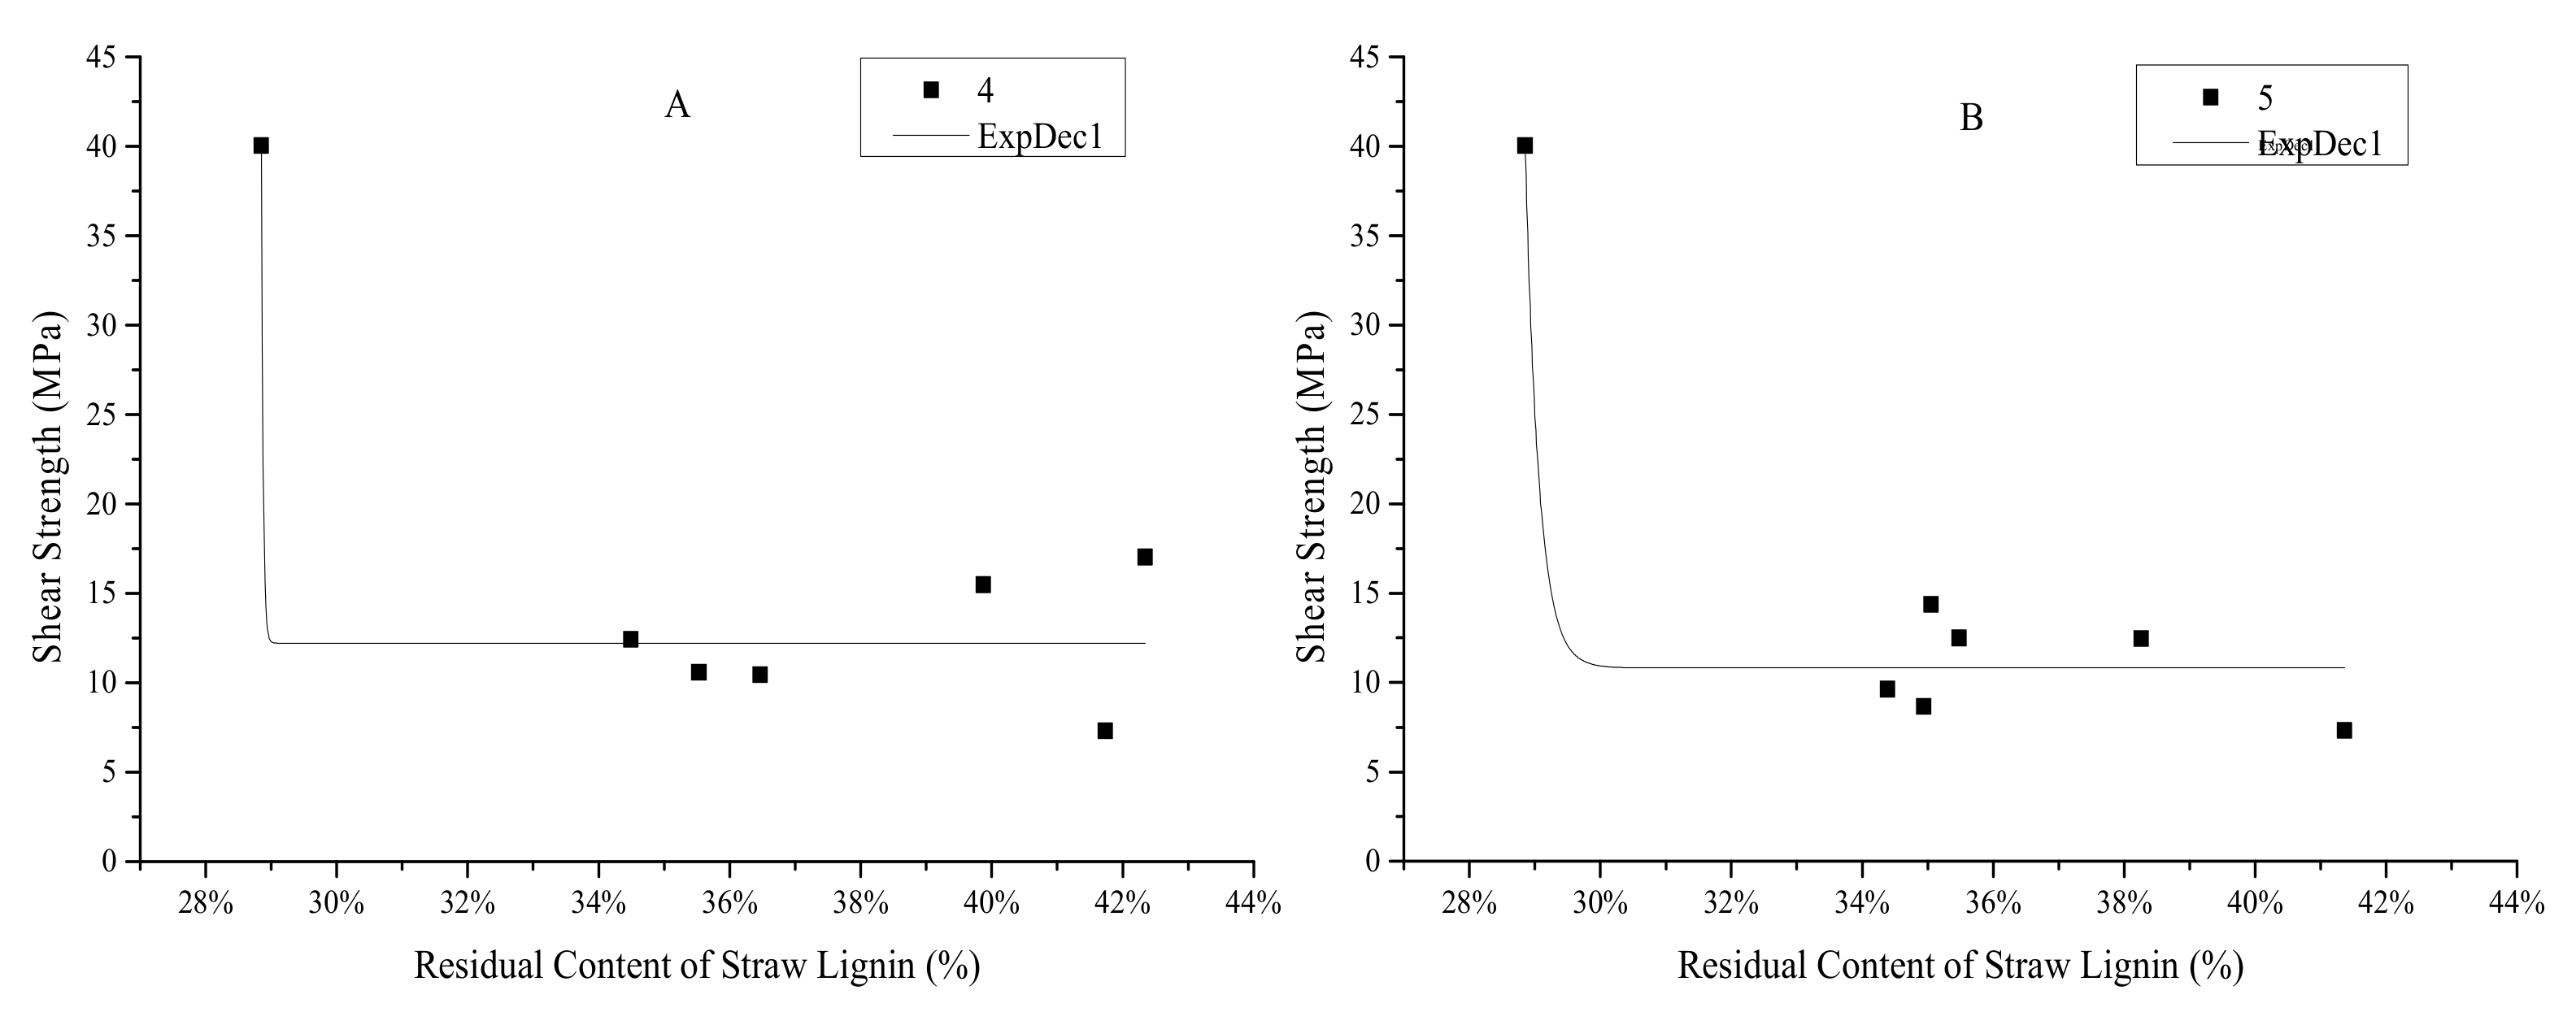
3.5. Relationship between the Straw Shear Strength and Residual Content of Components under RP Conditions

Figure 4 shows the relationship between the straw shear strength and residual content of components under RP conditions. As shown in Figure 4A,B, the relationship between straw shear strength and the RC of lignin met the exponential decay (ExpDec1) fit (y = y0 + A1 × exp (-(x - x0)/t1)), and the R2 of subfields 4 and 5 was 0.91 and 0.95, respectively. After adjustment, the R2 of subfields 1 and 2 was 0.82 and 0.91, respectively. As shown in Figure 4C,D, the relationship between straw shear strength and the RC of cellulose met the exponential growth (ExpGro1) fit (y = y0 + A1 × exp ((x - x0)/t1)), and the R2 of subfields 4 and 5 was 0.91 and 0.95, respectively. After adjustment, the R2 of subfields 4 and 5 was 0.87 and 0.94, respectively. As shown in Figure 4E,F, the relationship between straw shear strength and the RC of hemicellulose met the ExpDec1 fit (y = y0 + A1 × exp (−(x − x0)/t1)), and the R2 of subfields 4 and 5 was 0.93 and 0.98, respectively. After adjustment, the R2 of subfields 1 and 2 was 0.87 and 0.94, respectively.
Conclusively, the relationship between straw shear strength and the RC of straw lignin and hemicellulose met the fit of ExpDec1, and the relationship between straw shear strength and the RC of straw cellulose met the fit of ExpGro1; their R2 was over 0.91, which showed a strong correlation. After adjustment, only the R2 of the relationship between straw shear strength and the RC of straw lignin, cellulose, and hemicellulose in subfield 4 was over 0.91.

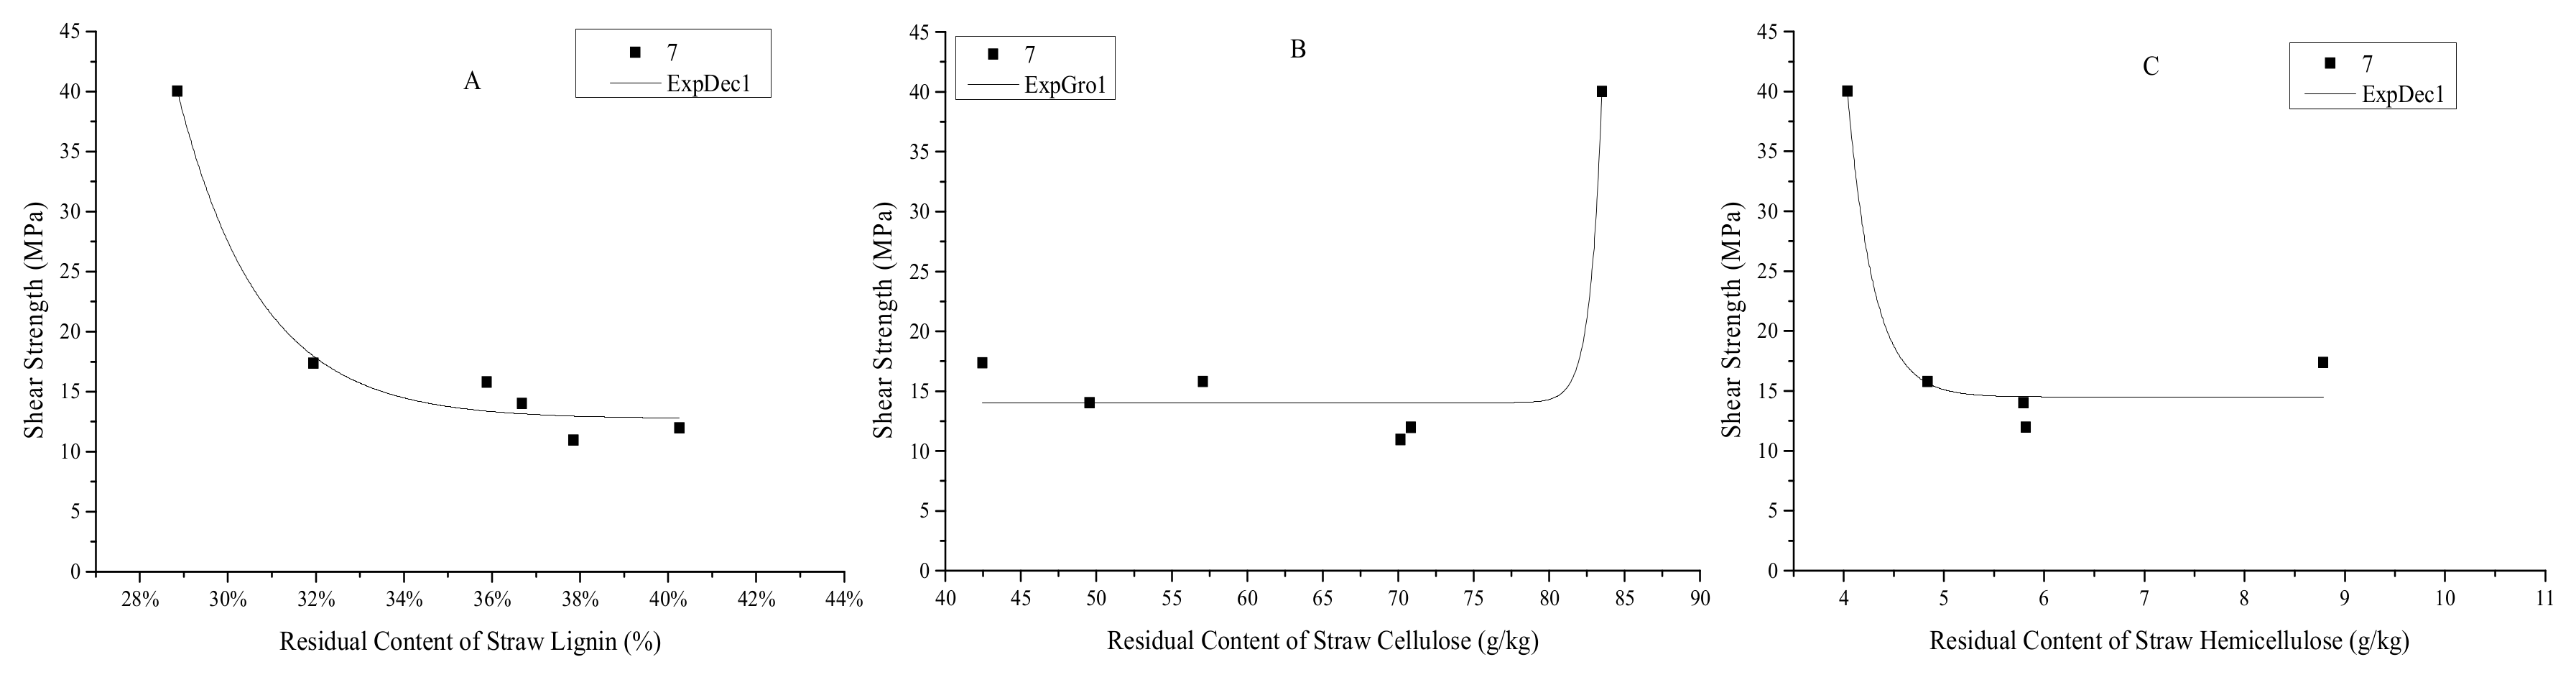
3.6. Relationship between the Straw Shear Strength and Residual Content of Components under PR Conditions

Figure 5 shows the relationship between the straw shear strength and the residual content of components under PR conditions. As shown in Figure 5A, the relationship between straw shear strength and the RC of lignin met the exponential decay (ExpDec1) fit (y = y0 + A1 × exp (−(x − x0)/t1)), and the R2 of subfield 7 was 0.98. After adjustment, the R2 of field 7 was 0.95. As shown in Figure 5B, the relationship between straw shear strength and the RC of cellulose met the exponential growth (ExpGro1) fit (y = y0 + A1 × exp ((x - x0)/t1)), and the R2 of subfield 7 was 0.95. After adjustment, the R2 of field 7 was 0.88. As shown in Figure 5C, the relationship between straw shear strength and the RC of hemicellulose met the ExpDec1 fit (y = y0 + A1 × exp (−(x − x0)/t1)), and the R2 of subfield 7 was 0.97. After adjustment, the R2 of subfield 7 was 0.89.
Briefly, the relationship of the straw shear strength and the RC of straw lignin and hemicellulose met the fit of ExpDec1, and the relationship of the straw shear strength and the RC of straw cellulose met the fit of ExpGro1; their R2 value was higher than 0.95, which showed a strong correlation. After adjustment, only the R2 of the relationship between the straw shear strength and the RC of straw lignin and cellulose in subfield 7 was higher than 0.95.

4. Discussion

4.1. Analysis of the Dynamics of Straw TOC

The results above showed that from 0–90 days, the RR of the straw TOC increased under PRP conditions, while the RR of the straw TOC first increased and then decreased under RP and PR conditions. Contradictory, in the literature, the RR of the straw TOC continually increased or the values increased to peak number and then changed [19]. The difference exists because of the variations in test groups and nutrients, and components in straw were released during the test stage due to the variation in microorganism activities and the components of straw; hence, the RR of straw could differ significantly. Different tillage operations influenced the RR of the straw TOC. From the perspective of soil and its microorganisms, the PRP conditions might have deeply disturbed the soil [20], which led to the more significant changes in soil, creating more space in soil particles that enhances microorganism activities [21], while under RP and PR conditions, these activities are weaker due to less space. Moreover, during the rice growing season, more dry situations led to temporal and space changes in the field temperature [22] that might deter the activities of the microorganisms in the soil [23], which resulted in different decomposition of straw as observed for the lower RR under different tillage operations. In addition, different stages had different influences on the RR of the straw TOC. In the initial stage of return to the field, soil carbon and nitrogen are relatively high, microbial growth is active, promoting the degradation of straw organic carbon, and the value rises; as time goes on, microbial growth reaches a stable state, producing more humic acids and even inhibiting the further reproduction of microorganisms per unit volume, leading to the decline of the straw organic carbon degradation rate. From the view of straw nutrients and components, some nutrients such as protein, monosaccharide, oligosaccharide, and fructose were quickly released, which might occur during the initial or all test stages. In this study, collected samples included wheat stems and a few leaves. The content of these nutrients is very different in straw stalk, and the straw was buried in the soil (5–20 cm), which led to different microorganism activities, and then the RR of the straw TOC differed, so the nonuniform distribution of nutrients in straw might result in lower RR of straw TOC.

4.2. Analysis of the Dynamics of Straw TN

In previous studies, the RR of the straw TN showed a continuously increasing or fluctuating trend. Our findings are inconsistent with literature, the RR of TN first increased and then decreased under PRP, while the values fluctuated under RP and PR conditions. The reasons are the short experimental time period, the release of straw TN might be from some easily degradable proteins in the straw, the distribution of easily degradable nutrients and activities of nitrifying and denitrifying bacteria were very different in the distribution of the spatial and temporal components of soil [24], and the content of the amino acids or proteins in straw and soil changed with time and space [25].
Therefore, we could hypothesize that at the initial stage, the activities of nitrifying bacteria increased because of plentiful nutrients from straw return and soil, and the RR of the straw TN showed a rising trend. During the middle–end stage, the content of the amino acids or proteins in straw and soil after the action of nitrifying and denitrifying bacteria decreased, which led to a slight rising trend of the RR of the straw TN, and the release of TN stopped. As an important structural material of plants, nitrogen is decomposed into ammonia nitrogen and nitrate nitrogen, which are soluble in water by microorganisms. Wheat straw becomes heavier after absorbing water, and there is no large-scale flow in the water environment, which results in a slow loss of nitrogen from straw after release and slow degradation of nitrogen in straw in the later stage. Therefore, the above explanation could be reasonable for the change in the RR of the straw TN.

4.3. Analysis of the Dynamics of Straw C:N

For all tillage treatments, from 0–90 days, the C:N ratio of the wheat straw first increased and then decreased, but the C:N ratio of the straw was different under different tillage operations. The main reasons were the release rate of straw TN and TOC. During the initial stage, the straw TN and TOC were released to some extent, but the release rate of straw TN was higher than that of straw TOC. Moreover, the content of straw TOC was much higher than that of straw TN, so the C:N ratio would increase first during the initial stage, while the RR of straw TN was very slow or stopped during the middle–end stage, and the RR of the straw TOC was higher than that of the straw TN; therefore, these changes may lead to the decrease in the straw C:N ratio. The reasons for different C:N ratios under different tillage operations were that there were comprehensive effects of different soil structures, the distribution of microorganisms in the soil, and the changing trend of the straw nutrients and components during the straw decomposition. Under different tillage operations, different soil structures lead to different distributions of water, temperature, wheat straw, and microorganisms in the soil. Therefore, different distributions influenced the decomposition of the straw nutrients and components, which resulted in different C:N ratios under different tillage operations.

4.4. Analysis of the Dynamics of Straw TP

From 0–90 days, the RR of the straw TP continually decreased under PRP conditions, but under RP and PR conditions, it first increased and then decreased. The main reasons are related to the existing form of wheat straw and content of TP. Generally, the content of TP ranged from 0.20–0.50%, comparatively lower than the straw TN and TK. Additionally, the existing form is an organic form such as nucleic acids and phospholipids, etc. [26]. However, the straw TP in leaves or easily degradable parts would decompose rapidly. Hence this resulted in a higher value or the peak value of the RR of straw TP. Further, as these easily degradable parts decomposed, the residual TP was not released because the content of straw TP is low. Therefore, the RR of the straw TP may stop or decrease slowly.

4.5. Analysis of the Dynamics of Straw TK

For all tillage treatments and straw return modes, during the test stage, the RR of the straw TK exceeded 94% on day 16, and the values were over 94% from 16–90 days. The main reasons might be related to the field environment and existing form of straw TK. One reason is that TK in an inorganic form exists in wheat straw; the other is that all samples were soaked in the water environment of the soil. Hence, the straw TK could be rapidly released, which is consistent with a previous study [27].

4.6. Analysis of the Dynamics of Straw Components

The RR of the straw lignin and cellulose increased under PRP conditions; the RR of the straw lignin first increased and then decreased, and the RR of the straw cellulose increased under RP conditions. The RR of the straw lignin and cellulose first increased and then decreased under PR conditions. Moreover, the RR of the straw cellulose was 33.59–81.35%, and that of lignin was below 5.50%. This demonstrated that the changing trend of the RR of the straw lignin and cellulose was different among different tillage treatments for 0–90 days, and the release of the straw cellulose was easier than that of lignin. The reason may be a comprehensive result of tillage, straw, soil, straw return time, and atmosphere. There were different structural changes of the soil under different tillage operations [28], so these actions distributed the soil, moisture in the soil, and microorganisms. Besides, irrigation or soil drying in the field can also influence the temperature in the day or growing season. This showed the different decomposition performance of microorganisms in the wheat straw in the soil, as polymer compounds from the straw lignin, cellulose, and hemicellulose were not easily degraded owing to a complicated structure. Even in proper environments such as a proper temperature, bacterial colonies such as wood-rotting fungi and white rot fungi, and proper living environment for bacteria in the soil, the straw lignin, cellulose, and hemicellulose were released slowly. However, in the open field with artificial management, the release of the straw components was lower than that in the greenhouse with a controlled environment [29]. Hence, the different treatments of tillage, straw, soil, and changing atmosphere resulted in different decomposition performances under different treatments. However, the main reason might be different structures of the straw lignin, cellulose, and hemicellulose because cellulose is macromolecular polysaccharide and is easily decomposed compared with the straw lignin, which is an aromatic polymer and has a complicated structure. The straw lignin released slowly because the structure of straw lignin and its existing form varies in different parts of the straw due to the different methods of collecting lignin [30]. Lignin is the most stable component in straw and the main limiting factor of straw degradation. Compared with hemicellulose and cellulose, lignin has a complex and irregular molecular structure and is resistant to enzymatic hydrolysis. At the early stage of return to the field, the dense epidermis and vascular bundles in straw were relatively complete, the cell wall was thick, and the internal structure was tight. The encapsulation of lignin restricted the degradation of hemicellulose and cellulose by microorganisms. As a whole, the content of lignocellulose and hemicellulose, which are easy to degrade, changed in the middle and later stages of the reaction. Therefore, the RR of the straw cellulose was higher than that of the straw lignin.

4.7. Relationship Analysis Between Straw Shear Strength and the Residual Components

For all tillage treatments, from 0–90 days, the relationship of the straw shear strength—RC of lignin, shear strength—RC of hemicellulose, and shear strength—RC of cellulose followed exponential decay, exponential decay, and exponential growth equations, respectively, and their coefficients of determination (R2 ≥ 0.91) indicated a strong correlation. After computing adjustment, the R2 was higher than 0.82, showing a relationship between the straw shear strength and the components of the straw. Following the theory of material mechanical properties, the material mechanical properties are always related to the structure and components of the material itself [31]. In general, straw contains lignin, cellulose, hemicellulose, and other components or nutrients. Lignin as a fibrous component of the straw can strengthen the fibrous nature of the straw, hemicellulose is a heteropolymer composed of xylose, arabinose, and other monosaccharides, while cellulose is a macromolecular polysaccharide composed of glucose. Due to the structure and components of straw lignin, cellulose, and hemicellulose, cellulose is more easily degraded than the straw lignin and hemicellulose [32]. Moreover, lignin is an energy inactive substance that is not easy to degrade. Cellulose and hemicellulose are energy active substances, which are easy to degrade. The content of each component affects the degradation and mechanical properties of straw. At the initial stage of the reaction, the content of monosaccharide and other substances is high, the relative content of lignocellulose is low; it is not easy to degrade, and the shear strength is high. As time goes on, the residual content of lignocellulose and hemicellulose decreases, and the cellulose rises, resulting in different degradation activities and different shear strengths of straw. Therefore, after a period of straw return, glucose and amino acids were released completely [33]. Lignin, cellulose, and hemicellulose are also the main forms of the straw fiber, and the relationship between the straw shear strength and the RC of straw lignin has been shown [34]. After computing adjustment, most R2 values exceeded 0.82, but the relationship was slightly stronger under the open field conditions with many uncontrollable factors.

5. Conclusions

Our findings revealed that under different tillage treatments, the straw components and nutrients released quickly in the natural environment from 0–90 days without any additives such as biochar, organic fertilizer, etc. Furthermore, during this time span (0–90 days), the changing trend of the RR of straw nutrients (TOC, TN, TP, and TK) was observed, and in the release of straw components, the decomposition of straw lignin and cellulose happened under certain circumstances. Moreover, the release trend of the nutrients and components under direct straw return was different under different tillage treatments. Rapid decomposition of straw TN, TP, TK, lignin, and cellulose was observed under all three tillage treatments at the initial stage, while no or slightly increased decomposition occurred at the middle–end stage. Furthermore, the relationship with straw shear strength and the RC of straw lignin and hemicellulose fitted the ExpDec1, with R2>0.91, and showed a strong correlation. The adjusted R2 of the relationship between straw shear strength and the RC of straw lignin, cellulose, and hemicellulose exceeded 0.82. Hence, a rapid decrease of mechanical properties showed a lower potential effect on the tillage operations of the next wheat sowing season. Future research could be on the relationship between straw mechanical strength and chemical components to optimize the evaluation method of straw return, keeping the straw mechanical properties as parameters, because the traditional evaluation method for straw return is more strongly based on the chemical index.

Author Contributions

Conceptualization, X.W., Q.D., S.Y., and Y.W.; methodology, X.W., Q.D., S.Y., and Y.W.; software, Y.W.; validation, X.W., Y.W., A.A., Y.S., S.Y., Q.D., and G.S.; formal analysis, A.A. and Y.W.; investigation, Y.W.; resources, Y.W.; data curation, X.W., Q.D., and Y.W.; writing—original draft preparation, Y.W.; writing—review and editing, A.A., and Y.S.; visualization, A.A.; supervision, X.W., Q.D., G.S., and Y.W.; project administration, X.W.; funding acquisition, X.W. All authors have read and agreed to the published version of the manuscript.

Funding

This research was funded by the Jiangsu Agricultural Science and Technology Innovation Fund of Jiangsu Provincial Department of Finance, grant number CX (17)1002.

Acknowledgments

We acknowledge all equipment supported by Jiangsu Academy of Agricultural Sciences. Teacher Gu Dongxiang was very friendly to me and helped me figure out problems during parameter measuring.

Conflicts of Interest

The authors declare no conflict of interest.

Appendix A

Table A1. Nomenclature.
No.AbbreviationDefinition
1TOCTotal organic carbon
2TNTotal nitrogen
3C:N ratioThe ratio of organic carbon and total nitrogen
4TPTotal phosphorus
5TKTotal potassium
6RRRelease rate
7RCResidual content
8RPRPloughing, rotary tiller, puddling
9RPRotary tiller, puddling
10PRPuddling, rotary tiller

References

  1. Li, H.; Dai, M.; Dai, S.; Dong, X. Current status and environment impact of direct straw return in China’s cropland—A review. Ecotoxicol. Environ. Saf. 2018, 159, 293–300. [Google Scholar] [CrossRef] [PubMed]
  2. Zeng, X.; Ma, Y.; Ma, L. Utilization of straw in biomass energy in China. Renew. Sustain. Energy Rev. 2007, 11, 976–987. [Google Scholar] [CrossRef]
  3. Chang, Z.Z.; Chen, X.H.; Yang, S.J.; Wang, D.J.; Shi, Z.L.; Zhang, S.M. A review on technique for rice and wheat straws returning and utilization. Jiangsu J. Agric. Sci. 2014, 30, 909–914. [Google Scholar]
  4. Wang, J.W.; Tang, H.; Wang, J.F. Comprehensive utilization status and development analysis of crop straw resource in northeast China. Trans. Chin. Soc. Agric. Mach. 2017, 48, 1–21. [Google Scholar]
  5. Nielsen, N.S.; Stubbs, T.L.; Garland-Campbell, K.A.; Carter, A.H. Rapid Estimation of Wheat Straw Decomposition Constituents Using Near-Infrared Spectroscopy. Agronomy 2019, 9, 462. [Google Scholar] [CrossRef] [Green Version]
  6. Yan, C.; Yan, S.S.; Jia, T.Y.; Dong, S.K.; Ma, C.M.; Gong, Z.P. Decomposition characteristics of rice straw returned to the soil in northeast China. Nutr. Cycl. Agroecosystems 2019, 114, 211–224. [Google Scholar] [CrossRef]
  7. Nakajima, M.; Cheng, W.G.; Tang, S.R.; Hori, Y.; Yaginuma, E.; Hattori, S.; Hanayama, S.; Tawaraya, K.; Xu, X.K. Modeling aerobic decomposition of rice straw during the off-rice season in an Andisol paddy soil in a cold temperate region of Japan: Effects of soil temperature and moisture. Soil Sci. Plant Nutr. 2016, 62, 90–98. [Google Scholar] [CrossRef] [Green Version]
  8. Zhao, S.; Qiu, S.; Xu, X.; Ciampitti, I.A.; Zhang, S.; He, P. Change in straw decomposition rate and soil microbial community composition after straw addition in different long-term fertilization soils. Appl. Soil Ecol. 2019, 138, 123–133. [Google Scholar] [CrossRef]
  9. Pimentel, L.G.; Cherubin, M.R.; Oliveira, D.M.S.; Cerri, C.E.P.; Cerri, C.C. Decomposition of sugarcane straw: Basis for management decisions for bioenergy production. Biomass Bioenergy 2019, 122, 133–144. [Google Scholar] [CrossRef]
  10. Cai, A.; Liang, G.; Zhang, X.; Zhang, W.; Li, L.; Rui, Y.; Xu, M.; Luo, Y. Long-term straw decomposition in agro-ecosystems described by a unified three-exponentiation equation with thermal time. Sci. Total Environ. 2018, 636, 699–708. [Google Scholar] [CrossRef]
  11. Fang, Z.C.; Liu, Y.T.; Ding, W.M.; Chen, Y.L.; Qin, K. Effect of microbial spraying on wheat and rice straw return to ditch. Trans. Chin. Soc. Agric. Eng. 2015, 31, 187–194. [Google Scholar]
  12. Thuriès, L.; Pansu, M.; Feller, C.; Herrmann, P.; Rémy, J.C. Kinetics of added organic matter decomposition in a Mediterranean sandy soil. Soil Biol. Biochem. 2001, 33, 997–1010. [Google Scholar] [CrossRef]
  13. Wang, Z.J.; Wang, Z.Y.; Si, A.L.; Zhang, Z.; Wu, J.; Wang, L.L. Effect of synchronously burying and straw return and biogas slurry to soil on straw decomposition. Chin. Soc. Agric. Mach. 2017, 48, 271–277. [Google Scholar]
  14. Wang, Z.J.; Wang, Z.Y.; Zhang, Z.; Lin, G.Y.; Liu, Z.; Cui, F. Effect of biochar on decomposition characteristics of corn stover presoaked with digestate in soil. Chin. Soc. Agric. Mach. 2018, 49, 279–285. [Google Scholar]
  15. Wang, D.; Zhu, Z.; Shahbaz, M.; Chen, L.; Liu, S.; Inubushi, K.; Wu, J.; Ge, T. Split N and P addition decreases straw mineralization and the priming effect of a paddy soil: A 100-day incubation experiment. Biol. Fertil. Soils 2019, 55, 701–712. [Google Scholar] [CrossRef]
  16. Yang, Y.H.; Su, Y.; He, Z.C.; Yu, M.; Chen, X.J.; Shen, A.L. Transformation and distribution of straw-derived carbon in soil and the effects on soil organic carbon pool: A review. Chin. J. Appl. Ecol. 2019, 30, 668–676. [Google Scholar]
  17. Holthusen, D.; Brandt, A.A.; Reichert, J.M.; Horn, R.; Fleige, H.; Zink, A. Soil functions and in situ stress distribution in subtropical soils as affected by land use, vehicle type, tire inflation pressure and plant residue removal. Soil Tillage Res. 2018, 184, 78–92. [Google Scholar] [CrossRef]
  18. Xiong, S.M.; Zuo, X.F.; Zhu, Y.Y. Determination of cellulose, hemicellulose and lignin in rice hull. Cereal Feed Ind. 2005, 8, 40–41. [Google Scholar]
  19. Memon, M.; Guo, J.; Tagar, A.; Perveen, N.; Ji, C.; Memon, S.; Memon, N. The Effects of Tillage and Straw Incorporation on Soil Organic Carbon Status, Rice Crop Productivity, and Sustainability in the Rice-Wheat Cropping System of Eastern China. Sustainability 2018, 10, 961. [Google Scholar] [CrossRef] [Green Version]
  20. Ding, Q.S.; Ge, S.Y.; Ren, J.; Li, Y.N.; He, R.Y. Characteristics of subsoiler traction and soil disturbance in paddy soil. Chin. Soc. Agric. Mach. 2017, 48, 47–56. [Google Scholar]
  21. Liu, X.; Zhou, F.; Hu, G.; Shao, S.; He, H.; Zhang, W.; Zhang, X.; Li, L. Dynamic contribution of microbial residues to soil organic matter accumulation influenced by maize straw mulching. Geoderma 2019, 333, 35–42. [Google Scholar] [CrossRef]
  22. Guo, N.; Shi, X.; Zhao, Y.; Xu, S.; Wang, M.; Zhang, G.; Wu, J.; Huang, B.; Kong, C. Environmental and Anthropogenic Factors Driving Changes in Paddy Soil Organic Matter: A Case Study in the Middle and Lower Yangtze River Plain of China. Pedosphere 2017, 27, 926–937. [Google Scholar] [CrossRef]
  23. Mayer, Z.; Sasvári, Z.; Szentpéteri, V.; Pethőné Rétháti, B.; Vajna, B.; Posta, K. Effect of Long-Term Cropping Systems on the Diversity of the Soil Bacterial Communities. Agronomy 2019, 9, 878. [Google Scholar] [CrossRef] [Green Version]
  24. Zhou, Y.; Zhang, Y.; Tian, D.; Mu, Y. The influence of straw return on N2O emissions from a maize-wheat field in the North China Plain. Sci. Total Environ. 2017, 584, 935–941. [Google Scholar] [CrossRef]
  25. Li, Y.-Y.; Pang, H.-C.; Han, X.-F.; Yan, S.-W.; Zhao, Y.-G.; Wang, J.; Zhai, Z.; Zhang, J.-L. Buried straw layer and plastic mulching increase microflora diversity in salinized soil. J. Integr. Agric. 2016, 15, 1602–1611. [Google Scholar] [CrossRef]
  26. Ajila, C.M.; Brar, S.K.; Verma, M.; Prasada Rao, U.J.S. Sustainable Solutions for Agro Processing Waste Management: An Overview. In Environmental Protection Strategies for Sustainable Development; Malik, A., Grohmann, E., Eds.; Springer: Dordrecht, The Netherlands, 2012; pp. 65–109. [Google Scholar]
  27. Gong, Z.P.; Deng, N.Z.; Song, Q.L.; Li, Z.T. Decomposing characteristics of maize straw return in Songnen Plain in long-time located experiment. Trans. Chin. Soc. Agric. Eng. 2018, 34, 139–145. [Google Scholar]
  28. Dossou-Yovo, E.R.; Brüggemann, N.; Ampofo, E.; Igue, A.M.; Jesse, N.; Huat, J.; Agbossou, E.K. Combining no-tillage, rice straw mulch and nitrogen fertilizer application to increase the soil carbon balance of upland rice field in northern Benin. Soil Tillage Res. 2016, 163, 152–159. [Google Scholar] [CrossRef]
  29. Ramezani, N.; Sain, M. Non-catalytic green solvent lignin isolation process from wheat straw and the structural analysis. Renew. Energy 2019, 140, 292–303. [Google Scholar] [CrossRef]
  30. Wang, J.; Zhang, L.; Pang, H.C.; Zhang, J.T. Returning granulated straw for accelerating decomposition rate and improving soil fertility. Trans. Chin. Soc. Agric. Eng. 2017, 33, 177–183. [Google Scholar]
  31. Li, X.; Wang, S.; Du, G.; Wu, Z.; Meng, Y. Variation in physical and mechanical properties of hemp stalk fibers along height of stem. Ind. Crop. Prod. 2013, 42, 344–348. [Google Scholar] [CrossRef]
  32. Huang, Y.; Liu, H.; Yuan, H.; Zhuang, X.; Yuan, S.; Yin, X.; Wu, C. Association of chemical structure and thermal degradation of lignins from crop straw and softwood. J. Anal. Appl. Pyrolysis 2018, 134, 25–34. [Google Scholar]
  33. De Conti, L.; Ceretta, C.A.; Ferreira, P.A.A.; Lourenzi, C.R.; Girotto, E.; Lorensini, F.; Tiecher, T.L.; Marchezan, C.; Anchieta, M.G.; Brunetto, G. Soil solution concentrations and chemical species of copper and zinc in a soil with a history of pig slurry application and plant cultivation. Agric. Ecosyst. Environ. 2016, 216, 374–386. [Google Scholar] [CrossRef]
  34. Mazian, B.; Bergeret, A.; Benezet, J.-C.; Malhautier, L. Influence of field retting duration on the biochemical, microstructural, thermal and mechanical properties of hemp fibres harvested at the beginning of flowering. Ind. Crop. Prod. 2018, 116, 170–181. [Google Scholar] [CrossRef]
Figure 1. Changes in maximum and minimum temperature and the rainfall grade during the experiment.
Agronomy 10 00314 g001
Figure 2. Schematic diagrams of the field.
Agronomy 10 00314 g002
Figure 3. Relationship between the straw shear strength and residual content of components under PRP conditions. Note: (A) subfiled1, fitting of Shear Strength and RC of Straw Lignin; (B) subfiled2, fitting of Shear Strength and RC of Straw Lignin ; (C) subfiled1, fitting of Shear Strength and RC of Straw Cellulose; (D) subfiled2, fitting of Shear Strength and RC of Straw Cellulose; (E) subfiled1, fitting of Shear Strength and RC of Straw Hemicellulose; (F) subfiled2, fitting of Shear Strength and RC of Straw Hemicellulose.
Agronomy 10 00314 g003aAgronomy 10 00314 g003b
Figure 4. Relationship between the straw shear strength and residual content of components under RP conditions. Note: (A) subfiled4, fitting of Shear Strength and RC of Straw Lignin; (B) subfiled5, fitting of Shear Strength and RC of Straw Lignin ; (C) subfiled4, fitting of Shear Strength and RC of Straw Cellulose; (D) subfiled5, fitting of Shear Strength and RC of Straw Cellulose; (E) subfiled4, fitting of Shear Strength and RC of Straw Hemicellulose; (F): subfiled5, fitting of Shear Strength and RC of Straw Hemicellulose.
Agronomy 10 00314 g004aAgronomy 10 00314 g004b
Figure 5. Relationships of straw shear strength and the residual content of components under PR conditions. Note: (A) subfiled7, fitting of Shear Strength and RC of Straw Lignin; (B) subfiled7, fitting of Shear Strength and RC of Straw Cellulose; (C) subfiled17, fitting of Shear Strength and RC of Straw Hemicellulose.
Agronomy 10 00314 g005
Table 1. Test stage and time.
Sampling NumberSampling TimeTest Stage
1Day 0 (2018/06/30)Initial stage
Initial stage
Initial stage
2Day 0–6 (2018/07/16)
3Day 16–30 (2018/07/30)
4Day 30–46 (2018/08/14)Middle stage
Middle stage
5Day 46–60 (2018/08/29)
6Day 60–75 (2018/09/13)End stage
End stage
7Day 75–90 (2018/09/28)
Table 2. Release of nutrients and components of returned straw under PRP.
Time/daySubfield 1
C/%N/%C:NP/%K/%L/%Ce/%
1631.76 ± 0.02e43.54 ± 8.89a259 ± 5ab47.03 ± 5.32a96.48 ± 0.10d1.7450.59
3045.27 ± 0.06c49.22 ± 15.34a238 ± 53b52.31 ± 25.46a96.22 ± 0.66d2.7863.22
4621.36 ± 0.09f34.02 ± 9.23a255 ± 8b38.95 ± 4.34a97.16 ± 0.05c2.1864.20
6039.81 ± 0.01d39.11 ± 7.75a211 ± 7c44.35 ± 19.31a97.36 ± 0.12c2.0166.35
7552.57 ± 0.07b44.91 ± 11.65a186 ± 23c38.18 ± 33.53a98.22 ± 0.17b3.8367.79
9057.78 ± 0.06a42.74 ± 10.51a158 ± 7c25.44 ± 22.03a98.75 ± 0.04a4.7671.52
Time/daySubfield 2
C/%N/%C:NP/%K/%L/%Ce/%
1636.07 ± 0.02d43.18 ± 8.12a241 ± 7b75.03 ± 11.30a95.34 ± 0.03d2.7346.47
3019.67 ± 0.19e47.49 ± 8.51a328 ± 4a42.82 ± 9.47a97.73 ± 0.07c2.3549.28
4635.11 ± 0.09f33.63 ± 10.49a210 ± 6c13.65 ± 31.30a96.63 ± 0.16d2.6661.86
6042.19 ± 0.04c31.95 ± 10.67a182 ± 9d19.91 ± 14.27a97.88 ± 0.14c2.3754.20
7556.91 ± 0.05b32.96 ± 7.91a138 ± 2f30.02 ± 31.90a98.67 ± 0.04b4.0170.07
9058.55 ± 0.04a37.42 ± 8.75a142 ± 3e-98.87 ± 0.04a4.8570.84
L—RR of straw lignin, Ce—RR of straw cellulose, - indicates data lost or scientifically deleted; values for the same parameter followed by different letters (a, b, c, d, e, f, etc.) are significantly different at p < 0.05.
Table 3. Release of nutrients and components of returned straw under RP conditions.
Time/daySubfield 4
C/%N/%C:NP/%K/%L/%Ce/%
1617.85 ± 0.07f40.05 ± 3.37b295 ± 28a32.29 ± 26.69b95.27 ± 0.23c0.9137.88
3050.26 ± 0.03b58.33 ± 8.02ab255 ± 2b64.35 ± 22.42a98.43 ± 0.01bc3.7757.21
4643.46 ± 0.07d39.60 ± 8.34b200 ± 5c33.99 ± 10.21ab97.40 ± 0.18c2.7761.55
6053.89 ± 0.04a53.46 ± 7.62ab212 ± 6c43.62 ± 11.61ab98.89 ± 0.09a3.8563.66
7536.42 ± 0.07e27.54 ± 7.27bc188 ± 6c32.91 ± 8.64b98.62 ± 0.05b2.2153.76
9047.06 ± 0.06c17.99 ± 8.18c138 ± 4d5.90 ± 0.37b98.32 ± 0.06c2.9464.98
Time/daySubfield 5
C/%N/%C:NP/%K/%L/%Ce/%
1628.90 ± 0.01e54.36 ± 5.11a335 ± 26a72.69 ± 16.18a96.52 ± 0.11d1.2433.59
3028.03 ± 0.12f55.82 ± 7.60a349 ± 3a75.48 ± 29.51a98.59 ± 0.17a2.7149.34
4652.41 ± 0.00d27.49 ± 10.81c141 ± 6c14.13 ± 13.29b96.59 ± 0.14cd3.2358.23
6070.53 ± 0.01a57.50 ± 8.62a149 ± 3bc57.97 ± 14.86ab98.88 ± 0.07a5.1673.34
7552.59 ± 0.02c33.78 ± 14.26bc155 ± 18bc8.48 ± 12.30b98.74 ± 0.01a3.4662.02
9056.17 ± 0.05b41.17 ± 6.15abc160 ± 8bc27.46 ± 29.17b98.38 ± 0.05b3.8570.75
L—RR of straw lignin, Ce—RR of straw cellulose, - indicates data loss or scientific deletion, values for the same parameter followed by different letters (a, b, c, d, e, f, etc.) are significantly different at p < 0.05.
Table 4. Release of nutrients and components of returned straw under PR conditions.
Time/daySubfield 7
C/%N/%C:NP/%K/%L/%Ce/%
1628.78 ± 0.05f29.84 ± 8.71b218 ± 4b43.30 ± 25.67ab94.23 ± 0.49d1.2360.87
3056.64 ± 0.12b68.75 ± 7.63a297 ± 3a76.17 ± 11.58a99.05 ± 0.02a5.5081.35
4648.07 ± 0.07d37.89 ± 8.28b179 ± 1b26.27 ± 21.37b97.61 ± 0.13c3.8674.97
6063.79 ± 0.01a42.71 ± 9.21b137 ± 20b37.97 ± 15.12ab98.44 ± 0.04b4.4970.53
7547.69 ± 0.03e28.74 ± 9.03b157 ± 1b45.95 ± 37.49ab98.43 ± 0.01b2.7058.89
9052.10 ± 0.07c24.19 ± 11.23c135 ± 4b-97.98 ± 0.06c4.3366.65
L—RR of straw lignin, Ce—RR of straw cellulose, - indicates data loss or scientific deletion, values for the same parameter followed by different letters (a, b, c, d, e, f, etc.) are significantly different at p < 0.05.

