Article

Effect of Salinity Stress on Phenylpropanoid Genes Expression and Related Gene Expression in Wheat Sprout

1
Department of Crop Science, Chungnam National University, 99 Daehak-ro, Yuseong-gu, Daejeon 34134, Korea
2
Korea Atomic Energy Research Institute, Advanced Radiation Technology Institute, 29 Geumgu-gil, Jeongeup-si 56212, Korea
3
Division of Life Sciences and Bio-Resource and Environmental Center, Incheon National University, Incheon 22012, Korea
*
Authors to whom correspondence should be addressed.
Do Manh Cuong and Soon-Jae Kwon contributed equally to this work.
Submission received: 4 February 2020 / Revised: 9 March 2020 / Accepted: 10 March 2020 / Published: 13 March 2020
(This article belongs to the Special Issue Sprouts, Microgreens and Edible Flowers as Novel Functional Foods)

Abstract

:
The effect of salinity (NaCl treatment) on the nutritive value of wheat sprouts was investigated by analyzing the expression of phenylpropanoid biosynthetic pathway genes and the levels of phenylpropanoid compounds. Treatment with various concentrations of NaCl (50, 100, and 200 mM) resulted in increased epicatechin levels but decreased accumulation of catechin hydrate, benzoic acid, and quercetin compounds in the sprouts compared with the control (0 mM). The trans-cinnamic acid, 4-hydroxybenzoic acid, ferulic acid, epicatechin, and total phenylpropanoid level in wheat sprout was the highest at 50 mM of NaCl treatment. Six-day-old wheat plantlets exposed to 50 mM NaCl for 6, 12, 24, 48, and 72 h, showed that the total phenylpropanoids accumulation was the highest at 48 h after the treatment and most of the treatments showed higher phenylpropanoid content than the control at the same time points. Although the shoot and root length and the fresh weight of wheat sprouts decreased with NaCl treatment, these results suggest that treatment of 50 mM NaCl improves the nutritional quality of wheat sprouts, due to increased phenylpropanoid concentrations.

1. Introduction

Wheat (Triticum aestivum L.) is an important cereal cultivated around the world. Wheat sprouts are rich in starch and other nutrients, including dietary fiber, minerals, vitamins, phytochemicals, and protein [1]. Wheat development, growth, and yield are affected by various environmental factors (especially drought and salinity). Salinity is one of the major obstacles to increasing the production of agricultural land throughout the world, and can severely limit crop production, especially in arid and semi-arid regions [2,3]. Salinity impairs seed germination, reduces nodule formation, delays plant development, and reduces crop yield [3]. Some studies have indicated that under high salt concentrations in irrigation water and soil, many plants are affected by osmotic stress, nutritional imbalance, oxidative stress, and water deficiency [4,5,6]. Moreover, changes in the levels of secondary metabolites, such as phenylpropanoid and terpenoids, leads to enhanced plant defense mechanisms against stress by causing high salinity [7,8,9].
Phenylpropanoids belong to the class of secondary metabolites are present in fruits, vegetables, nuts, and various parts of the medicinal herbs (seeds, root, leaves) [10,11,12]. They have been reported to have pharmacological effects that are beneficial to human health [13,14,15]. Phenylpropanoids are known to prevent carcinogenesis and decrease the risk of type 2 diabetes and heart attack [16,17]. Lignin is the component of plant cell walls [18], some phenylpropanoids have roles in plant defense, possess antimicrobial activity, can function as signal molecules in plant-microbe interactions [19]. Phenylalanine is the precursor of the phenylpropanoid biosynthetic pathway (Figure 1). Phenylalanine ammonia lyase (PAL), cinnamate 4-hydroxylase (C4H), and p-coumaroyl coenzyme A ligase (4CL) were catalyzed in the first, second, and third step, respectively. The synthesis of p-coumaroyl CoA from phenylalanine is known as the general phenylpropanoid biosynthetic pathway [20]. Ferulic acid is synthesized from p-coumaric acid by the action of 4-hydroxycinnamate 3-hydroxylase (CH3) and caffeic acid 3-O-methyltransferase (COMT). In the subsequent steps, dihydrokaempferol is synthesized from p-coumaroyl CoA through the action of chalcone synthase (CHS), chalcone isomerase (CHI), and flavone 3-hydroxylase (F3H). Then, flavonoid 3′-hydroxylase (F3′H) catalyzes the synthesize of dihydroquercetin. The enzyme favonol synthase (FLS) is helpful for the conversion of dihydroquercetin to quercetin. The dihydroflavonol-4 reductase (DFR) catalyzes the conversion of dihydroquercetin to leucocyanidin, and then further converts into epicatechin.
The effect of salinity on quality and nutritional value were reported in some plants such as Pisum sativum [21], Fagopyrum esculentum [22], Lactuca sativa [23], and Zea mays [24]; however, the effect of NaCl treatment on phenylpropanoid biosynthesis in wheat sprout has not been well studied. Therefore, in the present study, we investigated the genes expression related to phenylpropanoid biosynthesis pathways and their accumulation in wheat sprouting by using various concentrations of NaCl. This study will help to understand phenylpropanoid accumulation in sprouting wheat under specific environmental conditions and proposes methods to increase the accumulation of secondary metabolite in wheat sprouts.

2. Materials and Methods

2.1. Plant Materials

Seeds of wheat were provided by Asia Seed Co., Ltd. (Seoul, Korea). Five grams of wheat seeds were sowed in a plastic pot (size: 11 cm × 11 cm) and grown in a growth chamber under a 16 h light/8 h dark cycle at 25 °C. Treatment with varying NaCl concentrations (0, 50, 100, and 200 mM) was applied for finding the optimal concentration for phenylpropanoid accumulation in wheat sprouts. Whole seedlings were harvested 6 days after the treatment. For the time treatment experiment, 6-day-old wheat seedlings were treated with 50 mM NaCl and 0 mM NaCl as the control. Whole seedlings were harvested at different time intervals (0, 6, 12, 24, 48, and 72 h). All the experiment samples were prepared and analyzed in triplicates.

2.2. RNA Extraction and cDNA Synthesis

Total RNA was isolated using Easy BLUE Total RNA Kit (iNtRON, Seongnam, Korea). Agarose gel (1.2%) was used to determine the quality of RNA in the sample. Total RNA (1 ng) was used to synthesize cDNA for each sample using the ReverTra Ace kit (Toyobo Co., Ltd., Osaka, Japan).

2.3. Determination of Phenylpropanoid Biosynthetic Pathway Gene Expression

Primers for the phenylpropanoid pathway gene expression were designed using the online software Primer3 (http://bioinfo.ut.ee/primer3-0.4.0/primer3/) [25] (Table 1). Each quantitative real-time polymerase chain reaction (qRT-PCR) reaction mixture (20 µL) contained a 5 µL cDNA sample (which was diluted 20-fold), 10 µL of PCR mixture of 2 × SYBR Green buffer, 3 µL of water, and 2 µL primers (10 ppM). The RT-PCR reaction was repeated three times in the Bio-Rad CFX machine, using Bio-Rad CFX Manager 2.0 software for quantification under the following conditions: 95 °C (5 min), 38 cycles of 95 °C (20 s), 56 °C (20 s), 72 °C (20 s), and 72 °C (8 min) for final reaction. To quantify the expression of phenylpropanoid biosynthetic genes in wheat sprout, the reference gene actin (WpActin, accession number: GQ339780) was used.

2.4. Analysis of Phenylpropanoid Content by HPLC

In this study, a previously published compound extraction method was used [26] with some modifications. Phenylpropanoids were extracted by adding 2 mL MeOH (80%) to each sample (100 mg), vortexing and incubating for 1 h in a sonicator (Branson Ultrasonic Co., Danbury, CT, USA), then centrifuging (12,000 rpm at 4 °C) for 15 min. The supernatant was filtered using Whatman No. 42 filter paper. Phenylpropanoid compounds were quantified and analyzed using a slightly modified method of Cuong et al. (2018) [24] in the HPLC system with C18 column (250 mm × 4.6 mm, 5 μm), and performed in elution buffer that consisted of MeOH and H2O:CH3COOH (98.5:1.5 v/v) with 1000 μL min−1. Based on the calibration curve and the peak area of the standard compounds, phenylpropanoid content was calculated in each sample.

2.5. Statistical Analysis

All results in this study, including quantification and analysis of gene expression and phenylpropanoid compound content, are expressed as the mean ± SD of three independent replicates. The Statistical Analysis System software (SAS version 9.2, SAS Institute Inc., Cary, NC, USA, 2009) was used to analyze the differences between the treatments.

3. Results and Discussion

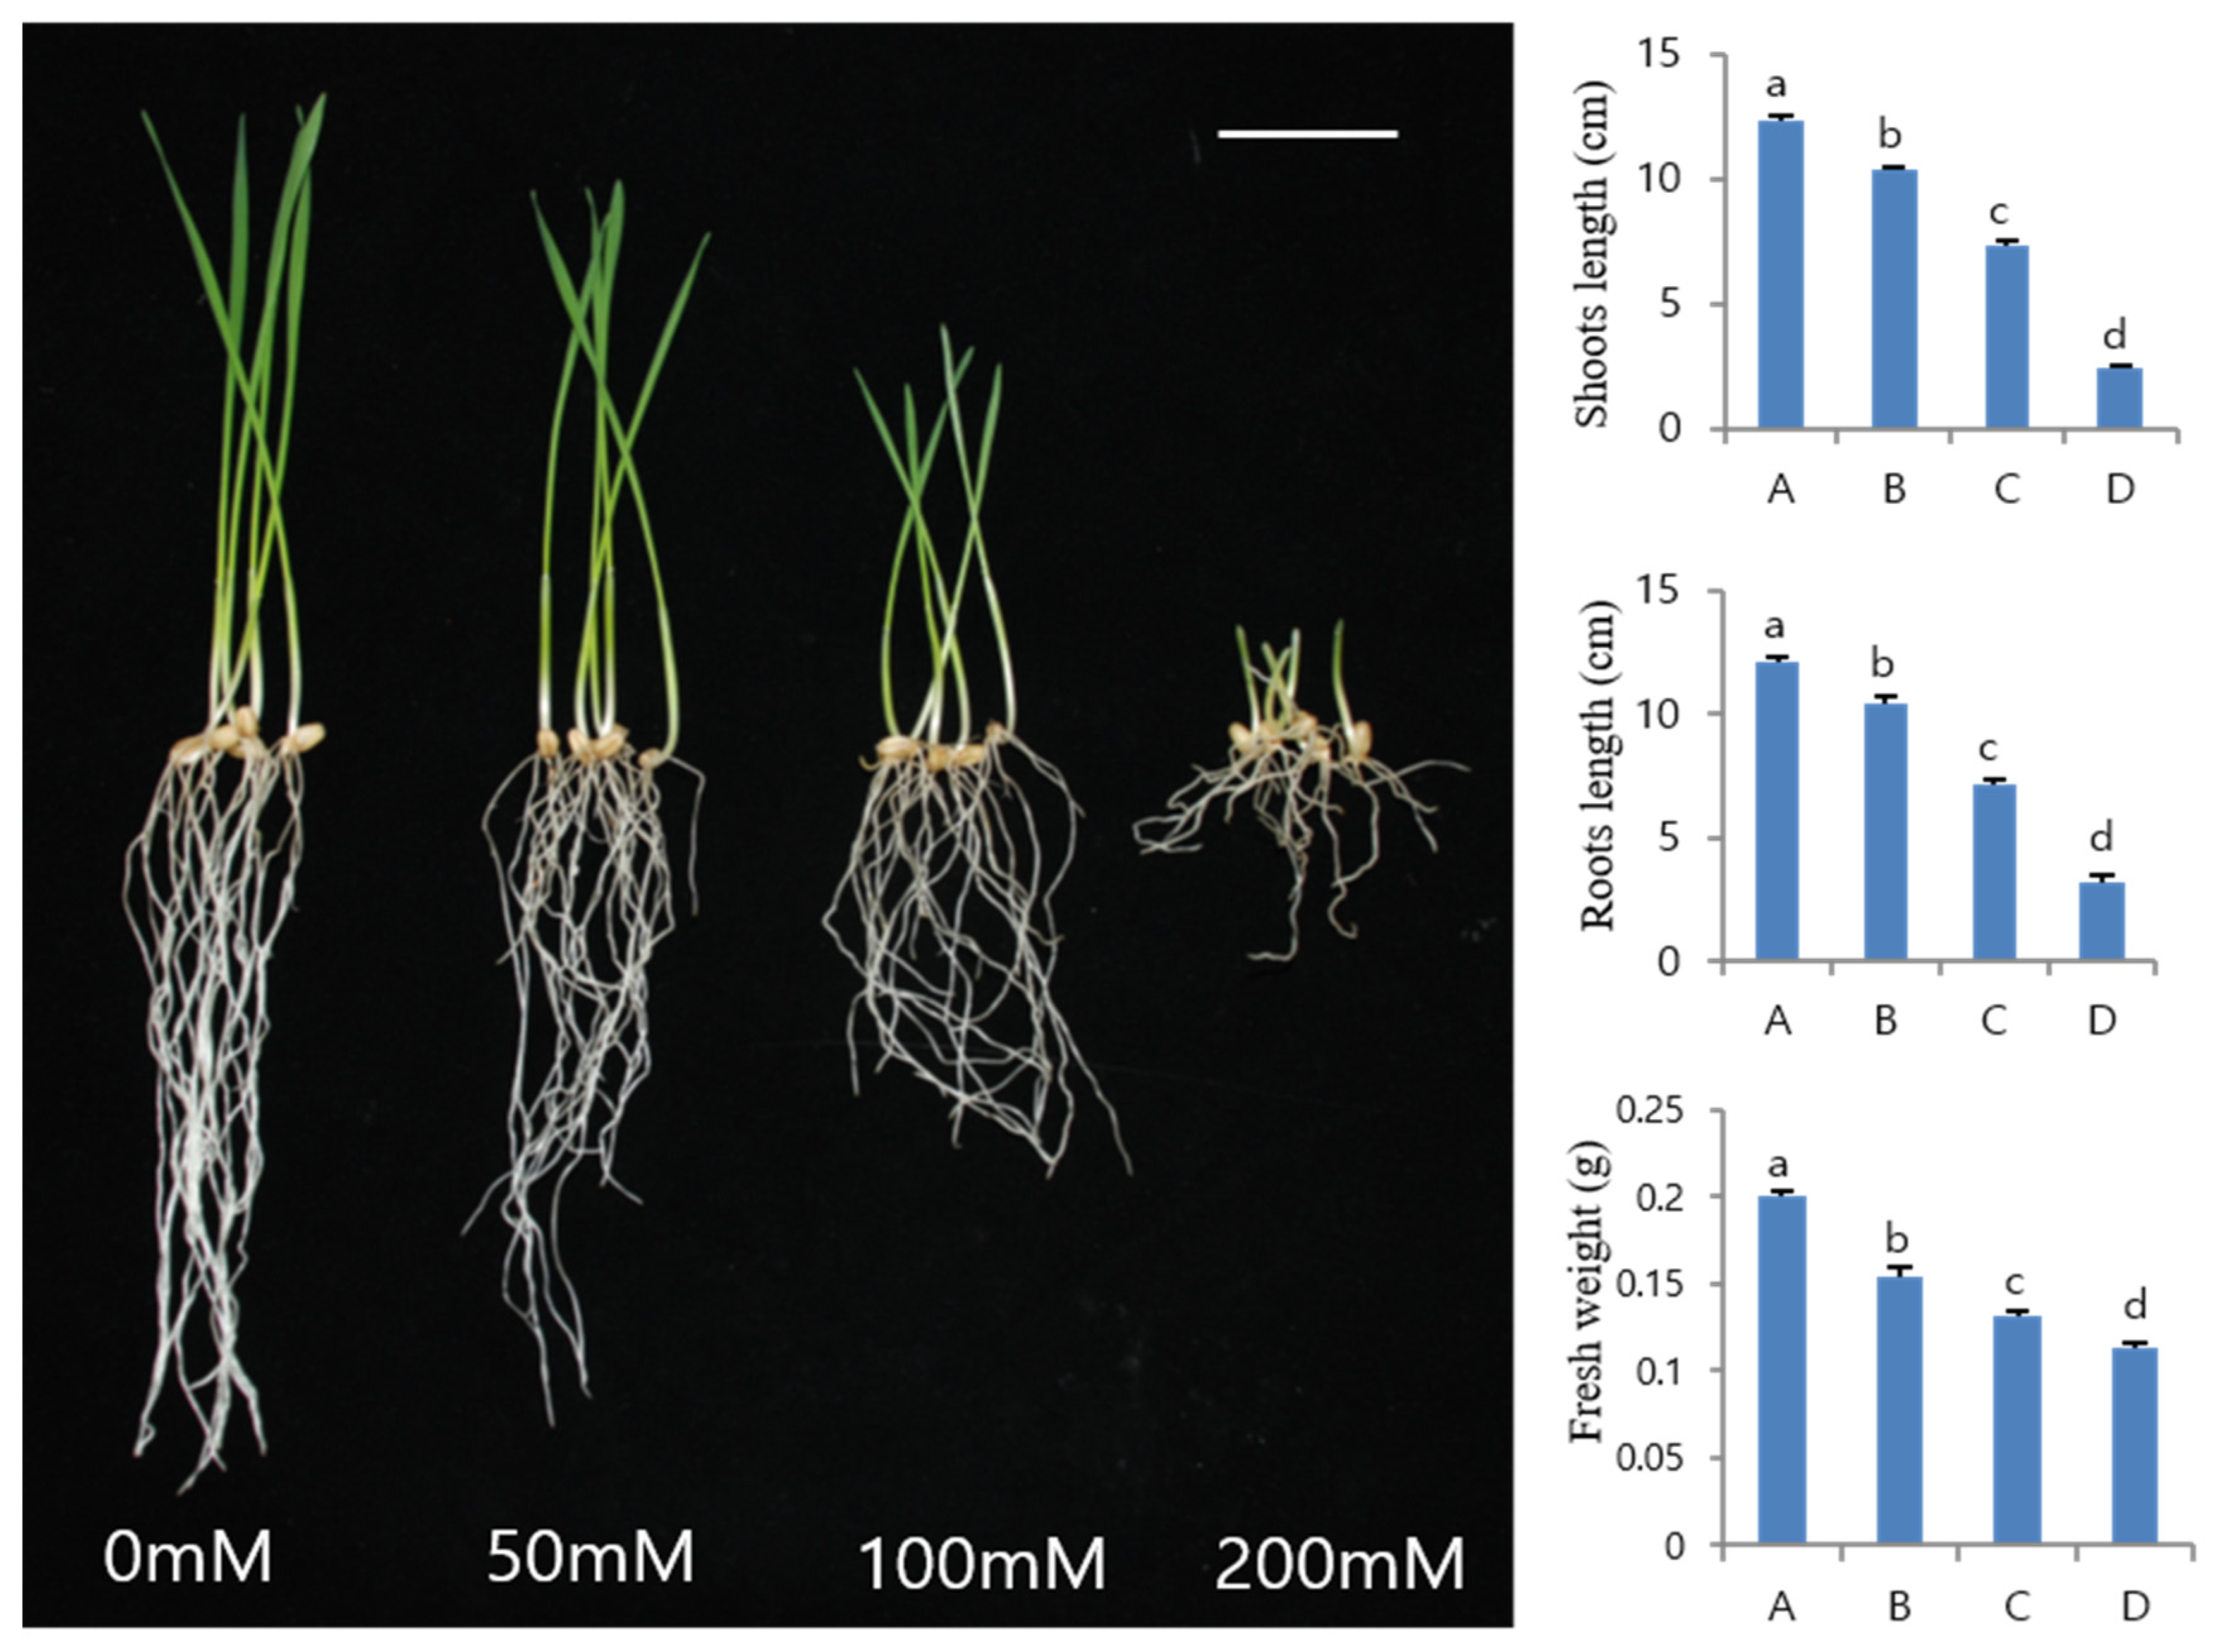
3.1. Effect of NaCl Treatment on the Growth of Wheat Sprouts

The fresh weight, shoot, and root length of wheat sprouts, were measured 6 days after the treatment with 0 mM (control), 50, 100, and 200 mM NaCl (Figure 2). The growth rate of wheat sprouts was significantly affected by NaCl treatment (Figure 2). The fresh weight, shoot, and root length of wheat sprouts significantly reduced as the NaCl concentration increased from 50 mM to 200 mM. The shoot length of wheat sprouts treated with 50, 100, and 200 mM NaCl was 15.69%, 40.29%, 80.26% lower than the control, respectively. The root length was 13.93%, 40.79%, and 73.63% lower than the control following treatment with 50, 100, and 200 mM NaCl, respectively. Similarly, the fresh weight of sprouts decreased with NaCl treatment and was 22.8%, 33.9%, and 43% lower than the control following treatment with 50, 100, and 200 mM NaCl, respectively. This is consistent with previous studies, which indicated that salinity caused a significant reduction in root and shoot length and root and fresh shoot weight of Sesamum indicum [27], Vigna radiate [28], Cassia angustifolia [29], cabbage, sugar beet, Paniculate amaranth, Pak-choi [30], and Pisum sativum [21]. The water imbalance caused by high salinity may decrease osmotic adjustment and reduce plant growth [31].

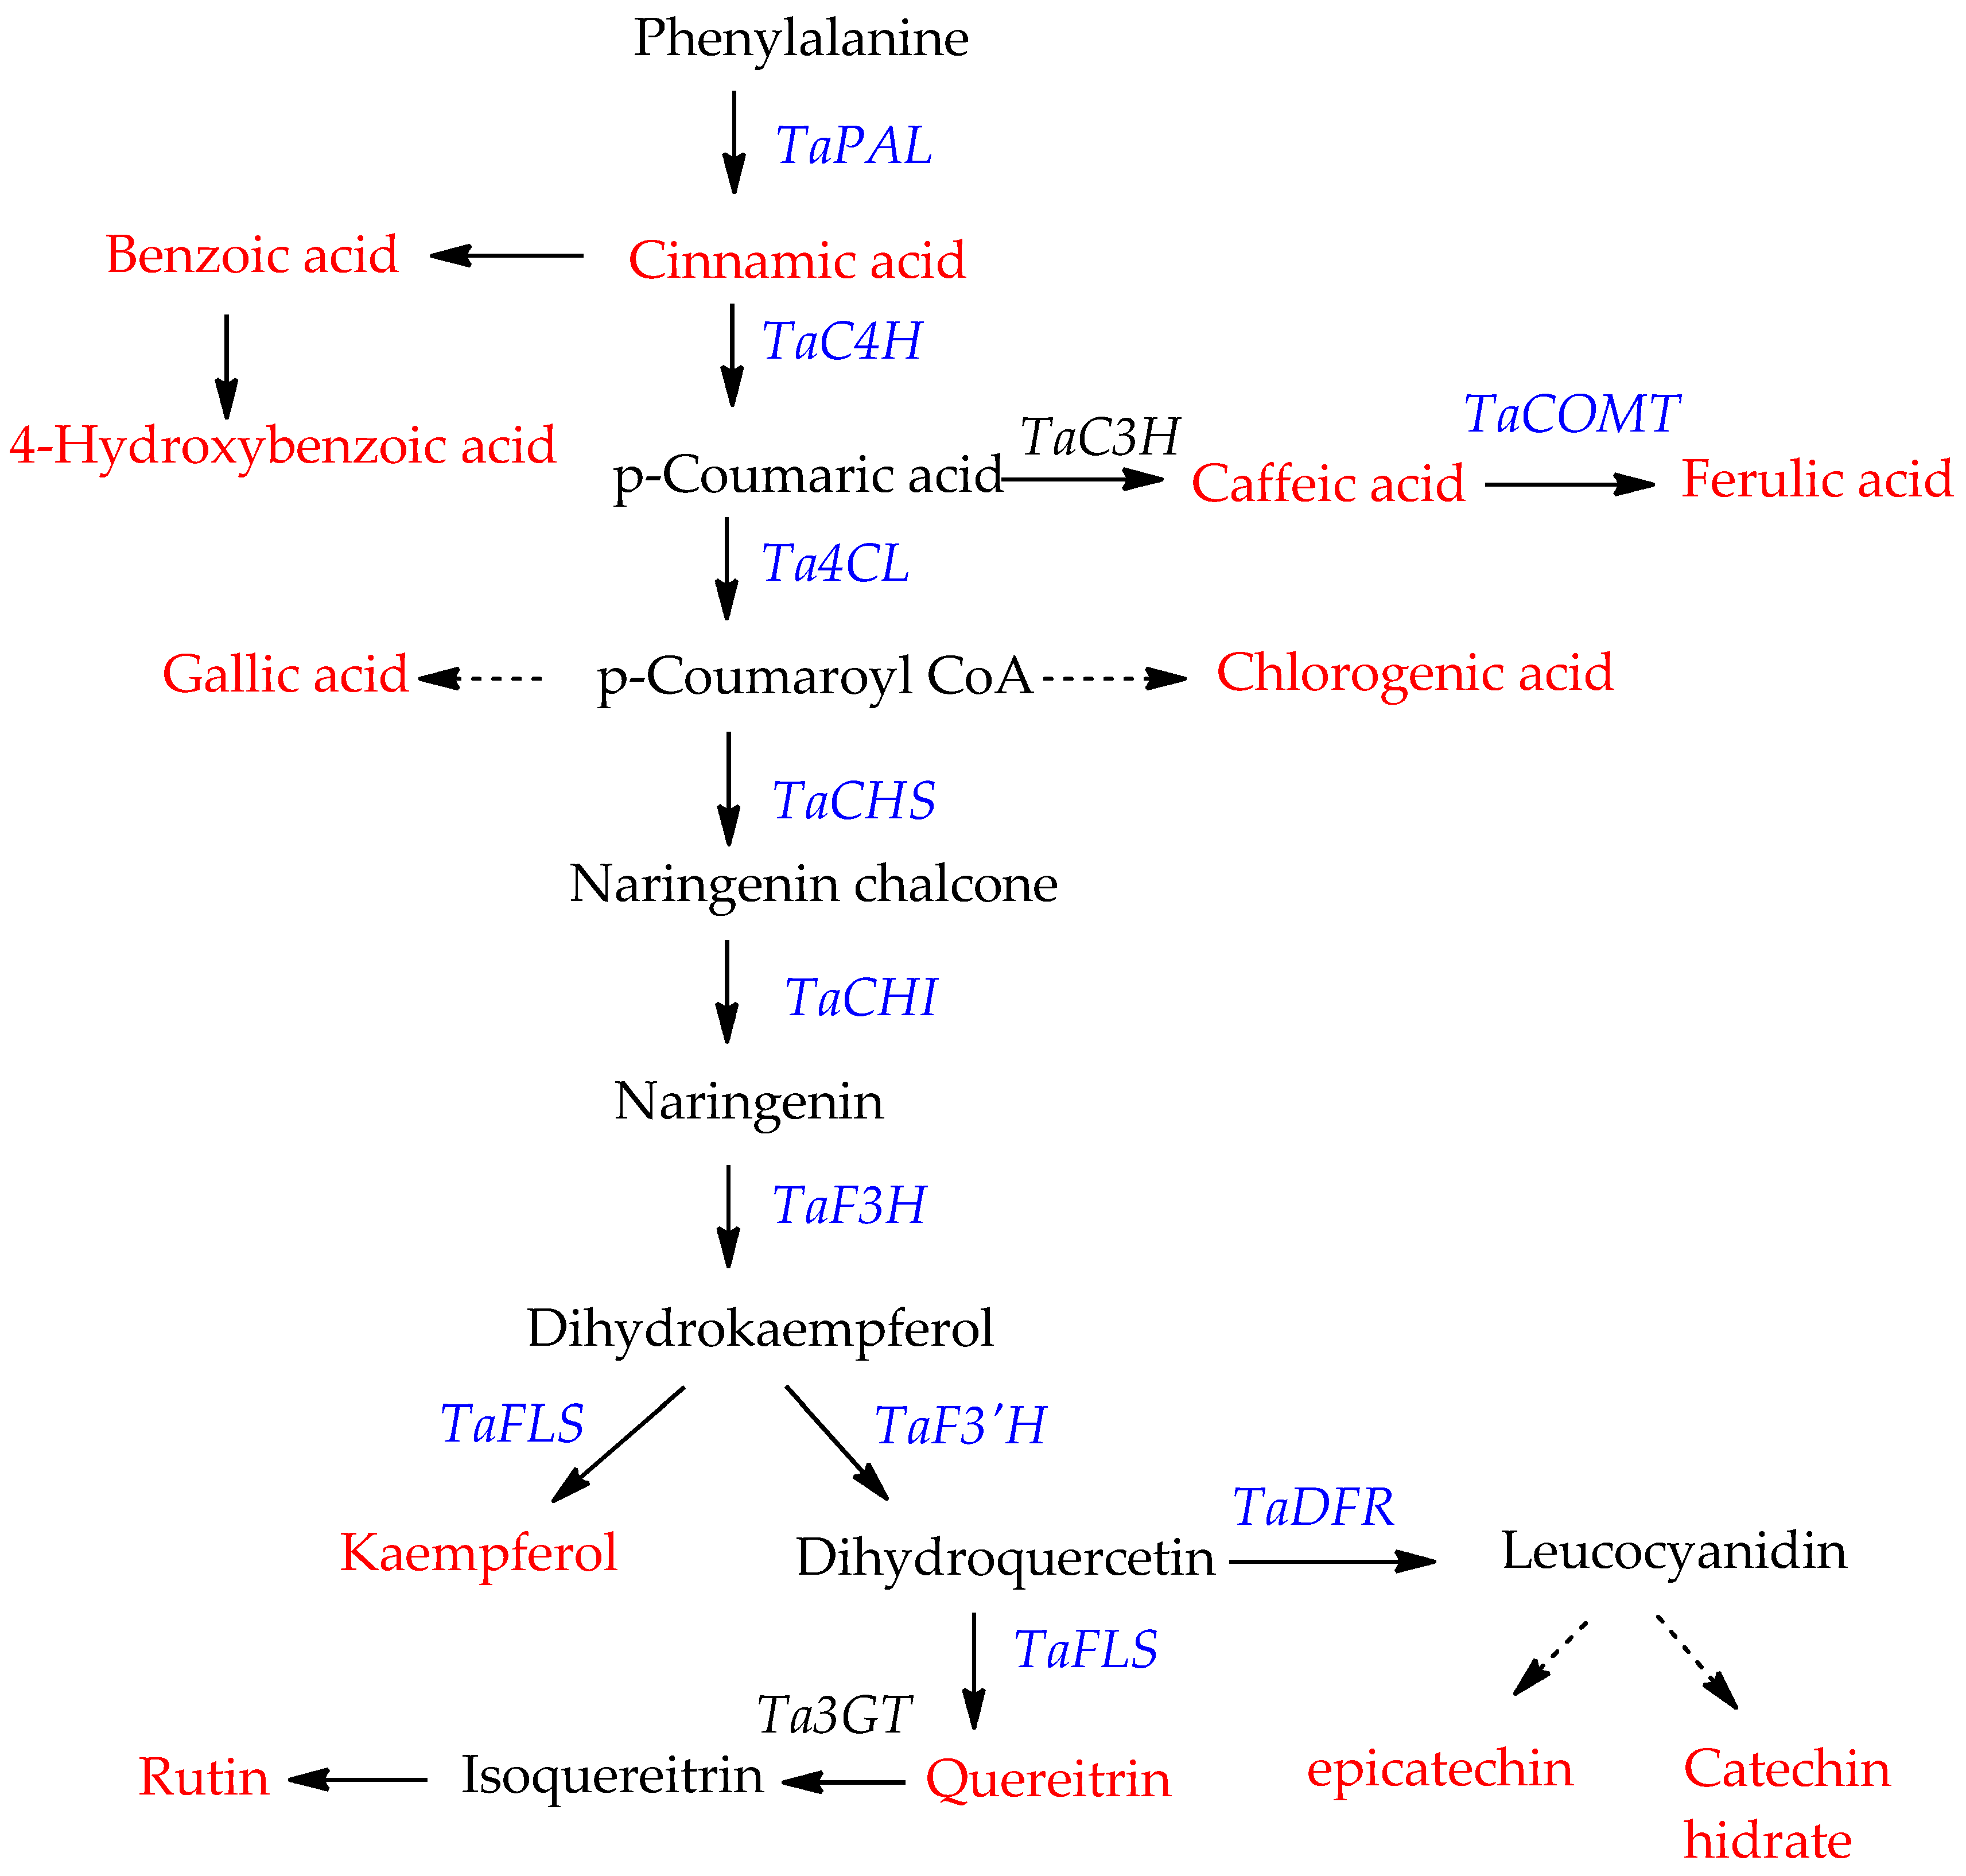
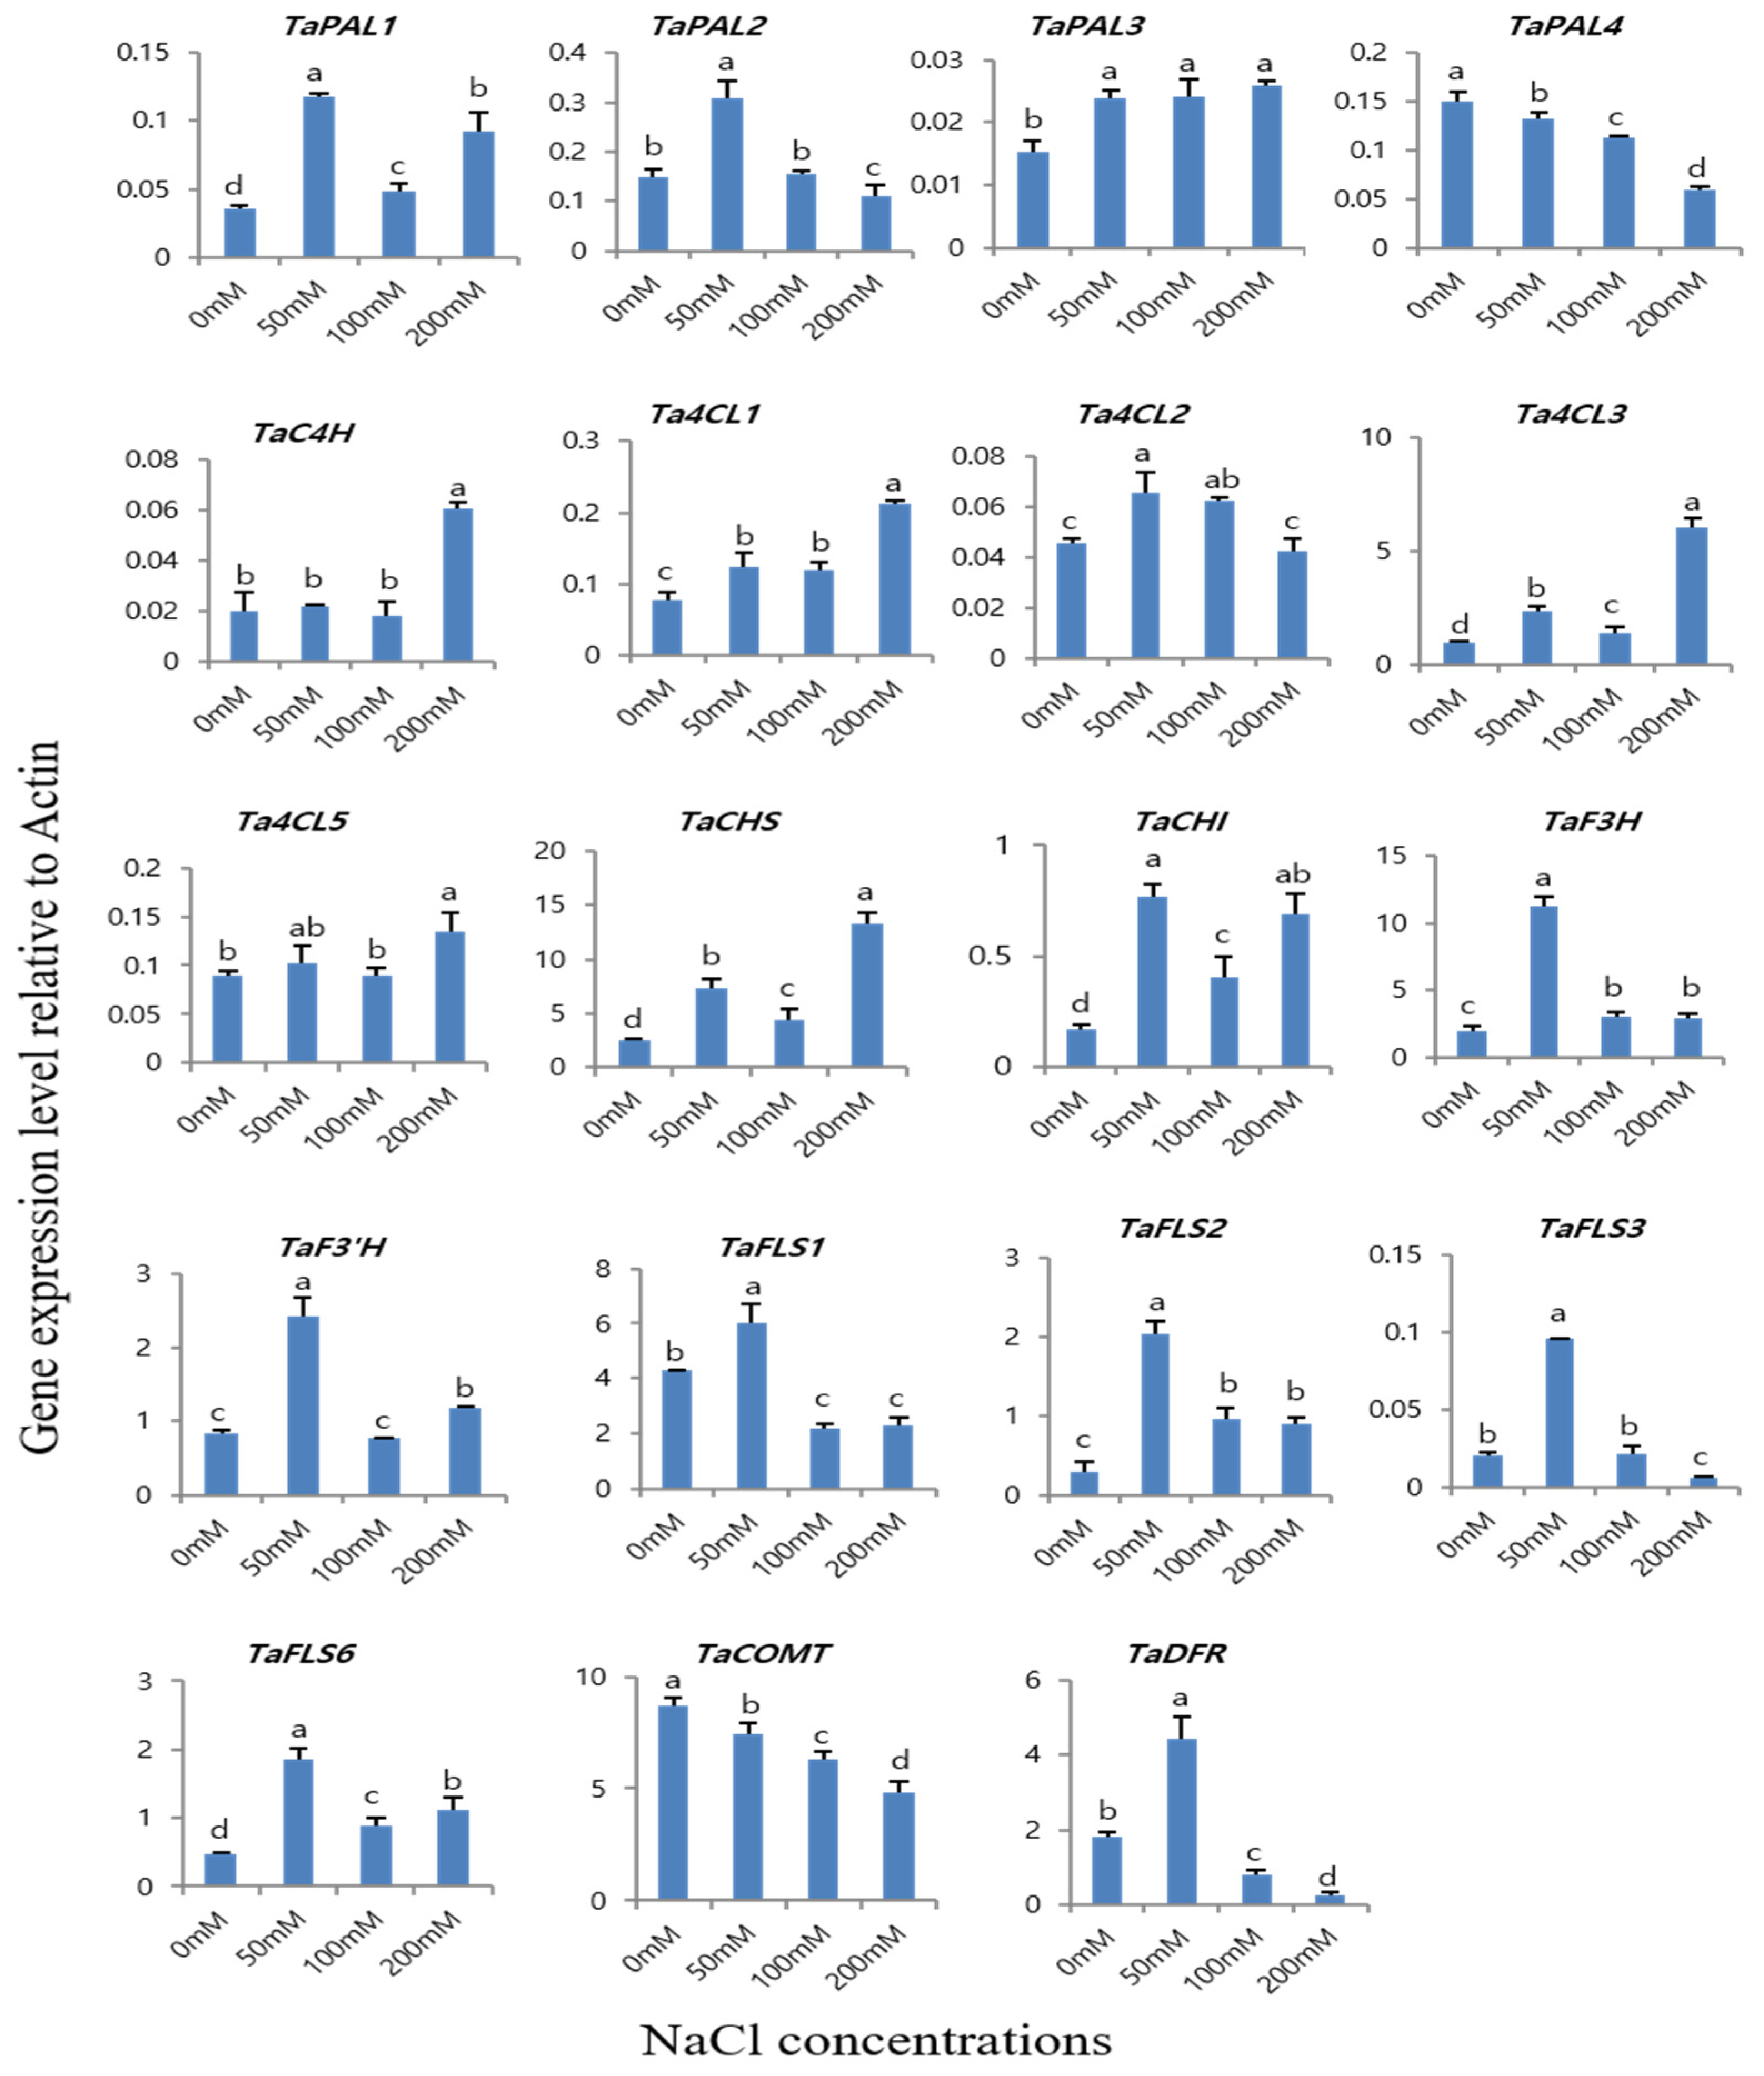
3.2. Effect of NaCl on Genes Expression of Phenylpropanoid Biosynthetic Pathway

Quantitative RT-PCR analysis was used to investigate the transcription levels of genes involved in phenylpropanoid biosynthesis in 6-day-old wheat sprouts in different NaCl concentration treatments (Figure 3). Under salt stress, the expression levels of TaPAL3, Ta4CL1, Ta4CL3, and TaCHS genes were increased for a 200 mM NaCl treatment. However, the expression levels of TaC4H were changed insignificantly after 0, 50, and 100 mM NaCl treatment. In contrast, the expression of TaPAL4 and TaCOMT genes decreased as the NaCl concentration increased from 0 mM to 200 mM. The expression of TaPAL2, Ta4CL2, TaF3H, TaFLS1, TaFLS2, TaFLS3, and TaDFR genes increased and peaked at 50 mM of NaCl treatment, then decreased at 100 and 200 mM of NaCl treatment. The expression level of TaPAL1, Ta4CL3, TaCHS, TaCHI, TaF3′H, and TaFLS6 increased from 0 to 50 mM of NaCl treatment, then decreased at 100 mM NaCl treatment, and increased again at 200 mM NaCl treatment. The finding of phenylpropanoid biosynthesis-related gene expression is consistent with previous reports that NaCl treatment induces differential regulation of the phenylpropanoid pathway in Olea europaea [32], Brassica napus [33], and Ginkgo biloba [34].

3.3. Phenylpropanoid Content under Different NaCl Concentrations

HPLC analysis was performed to analyze whether the phenylpropanoid accumulation is influenced by NaCl stress. A total of eleven phenylpropanoid compounds were identified and quantified (Table 2). Overall, the accumulation of phenylpropanoids varied with different salt concentrations treatment. After NaCl treatment, the epicatechin content was increased, whereas the level of catechin hydrate, benzoic acid, and quercetin became reduced. When compared to the control (0 mM NaCl), the trans-cinnamic acid content was increased in wheat sprouting at 50 mM NaCl treatment, whereas the caffeic acid, ferulic acid, and 4-hydroxybenzoic acid content increased only at 50 and 100 mM NaCl. However, the level of chlorogenic acid was detected only at 200 mM NaCl treatment, while rutin content was constant under different salt concentrations. The accumulation of kaempferol decreased with salt treatment except at 50 mM NaCl, its content was similar to that of the control. Caffeic acid content was highest at 100 mM NaCl treatment, 1.35-times higher than control. The 50 mM NaCl treatment showed higher accumulation of caffeic acid, epicatechin, ferulic acid, trans-cinnamic acid, and 4-hydroxybenzoic acid than control. These results coincided with the expression of TaPAL, Ta PAL2, TaPAL3, Ta4CL2, TaCHI, TaF3H, TaF3′H, TaFLS1, TaFLS2, TaFLS3, TaFLS6, and TaDFR genes, which had higher expression at 50 mM NaCl than control. In particular, the accumulation of epicatechin (2708.96 µg g−1 dry weight), was 4.39-fold higher than the control. The accumulation of catechin hydrate, benzoic acid, and quercetin was 28.27-, 3.14-, and 1.53-times lower, respectively in 50 mM NaCl, than control. Total phenylpropanoid level in wheat sprouts was the highest with 50 mM NaCl treatment and therefore this salt concentration was used for the time treatment experiment. These results are similar to previous studies in the NaCl treatment of buckwheat sprout [22], Solanum nigrum [35], maize [24], and red pepper [36], which had a higher phenylpropanoid content in salt treatment than control (no salt treatment). However, other studies showed that phenylpropanoid compounds failed to accumulate irrespective of salt treatments in lettuce [23] or broccoli [37] suggesting that accumulation of phenylpropanoid compounds due to salt stress may be species-dependent.

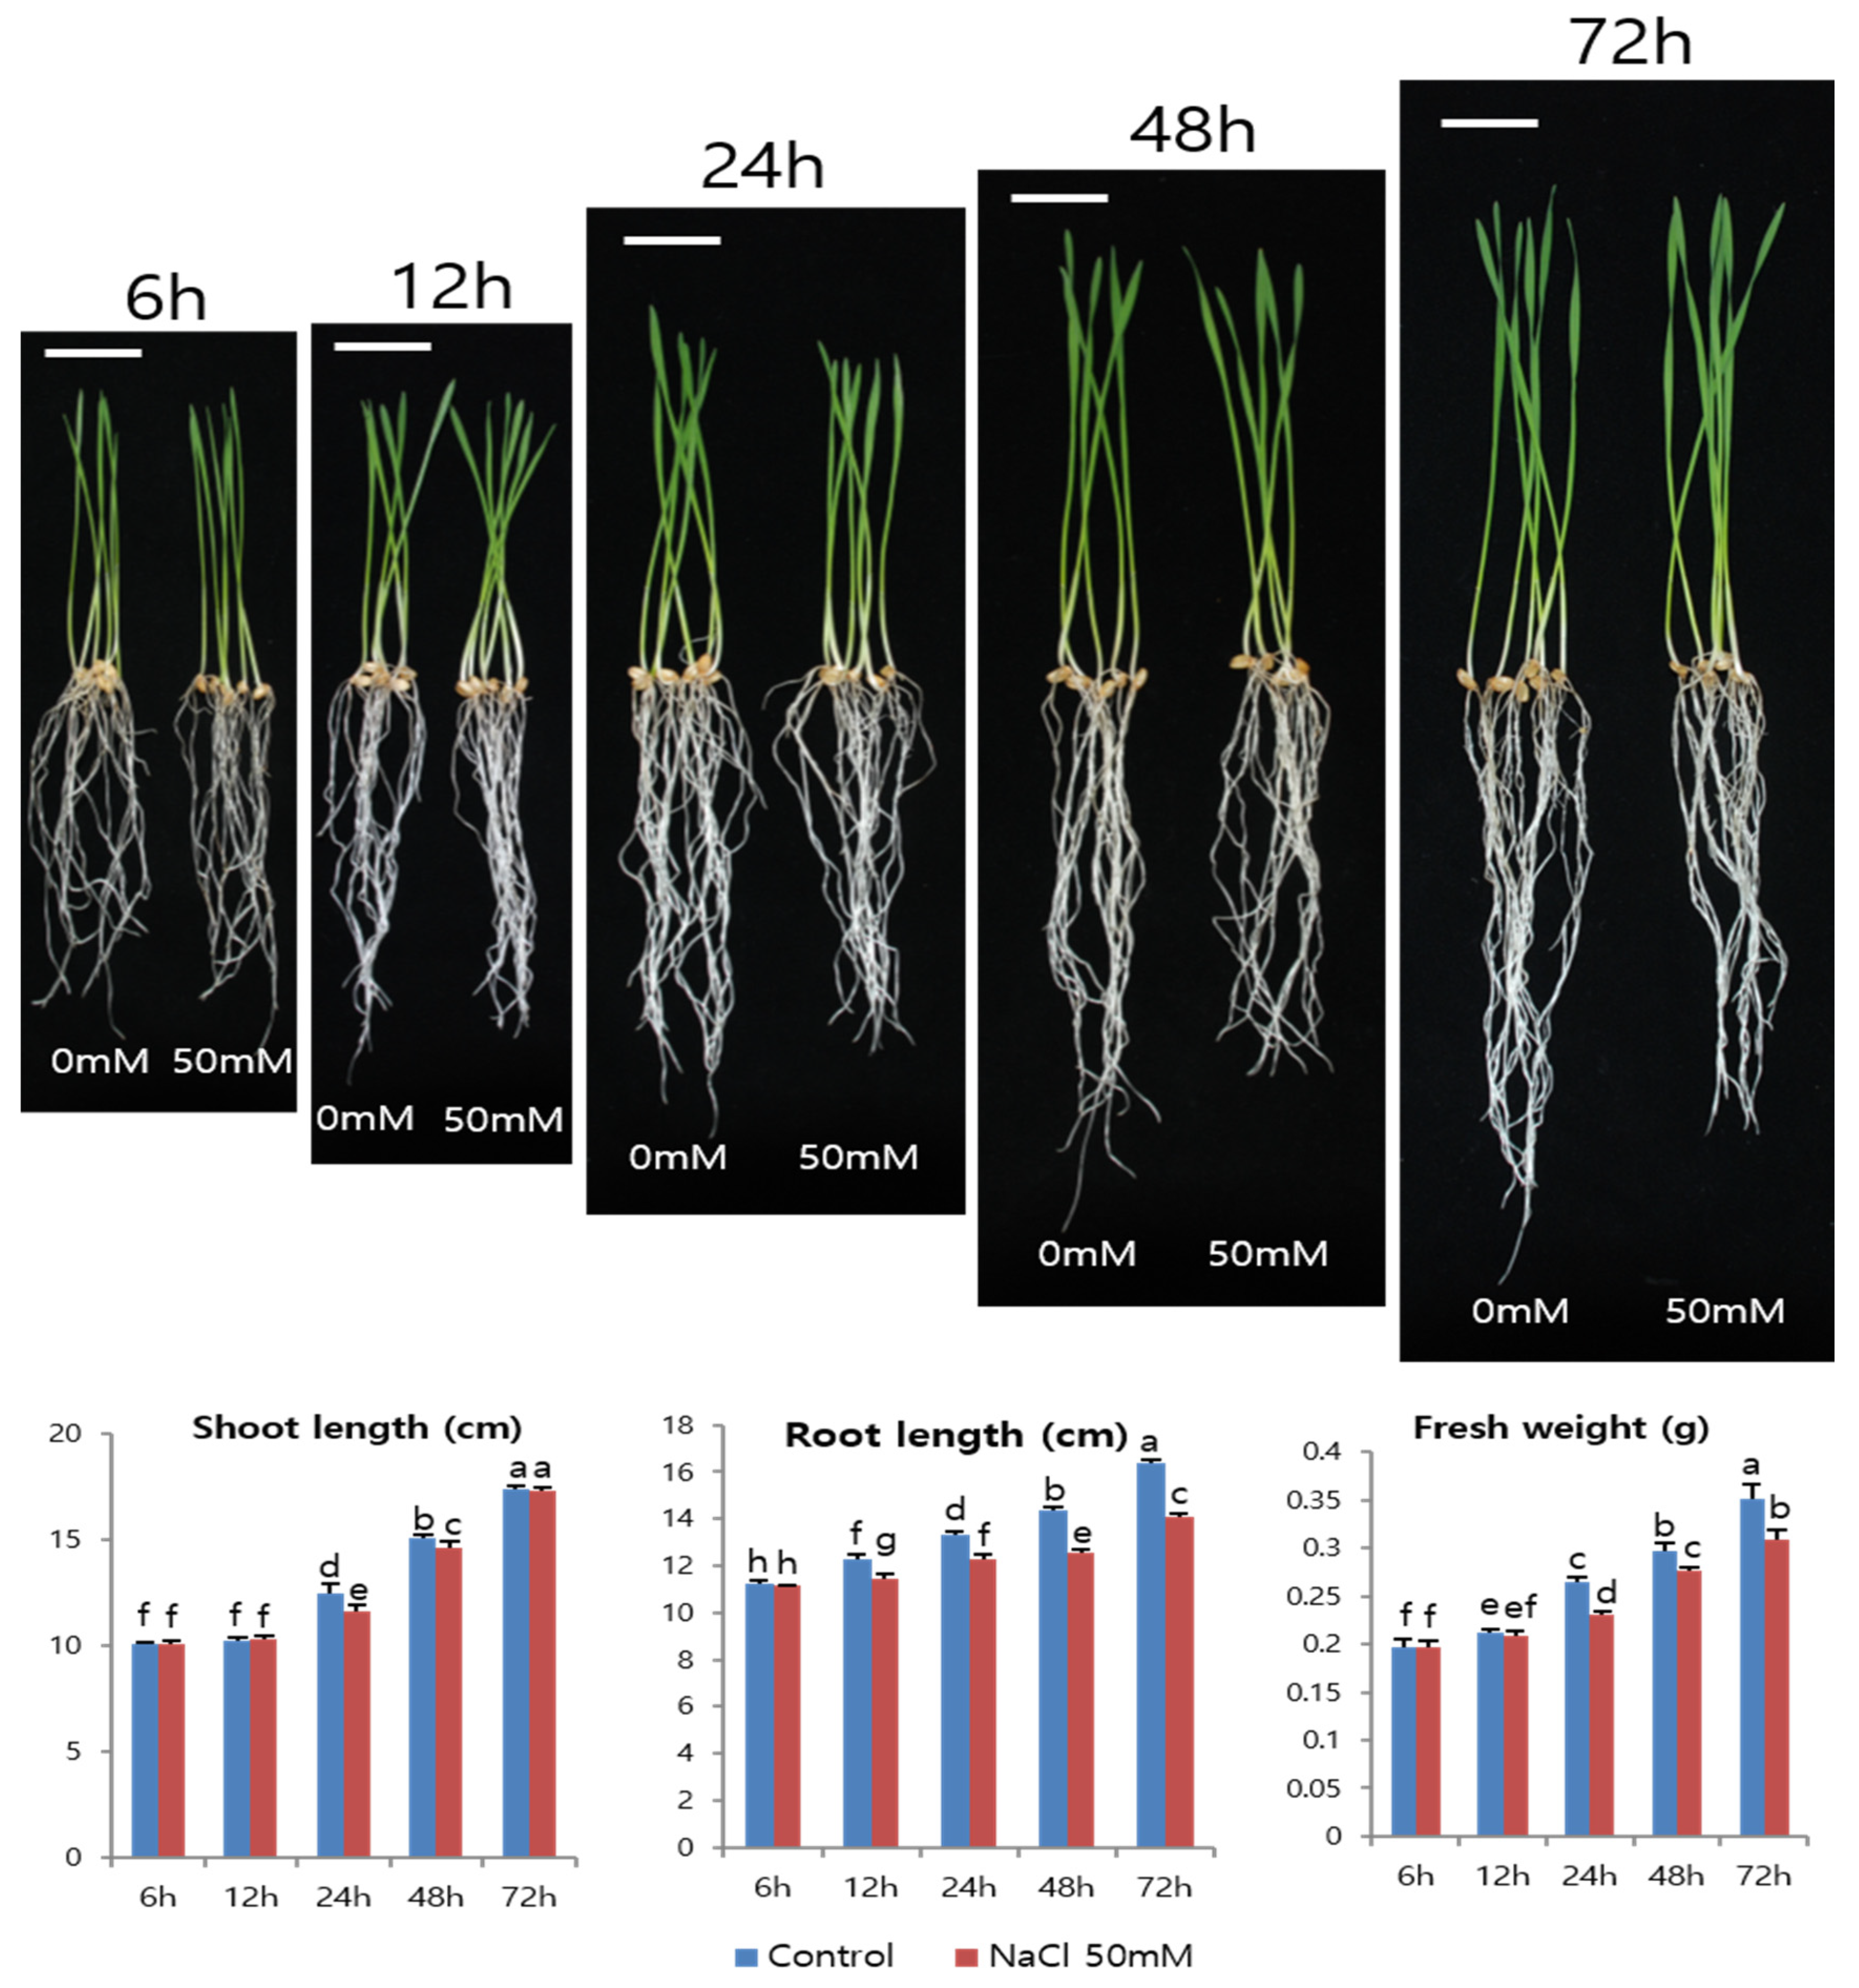
3.4. Wheat Plantlet Growth under 50 mM NaCl Treatment

In this experiment, 6-day-old wheat plantlets were treated with 50 mM NaCl and 0 mM NaCl for control. Whole seedlings were harvested at different time intervals (0, 6, 12, 24, 48, and 72 h) and fresh weight, shoot, and root length were measured and analyzed (Figure 4). At 6 h after the treatment, the shoot and root length and fresh weight had not significantly changed. A significant decrease in the root length was observed at 12 h (when compared to control), but no significant changes were found in shoot length and fresh weight. After the 24 and 48 h treatments, fresh weight, shoot length, and root length were significantly lower than the control. Interestingly, after the 72 h treatment, the shoot length was not significantly different from the control, although root length and fresh weight were both lower with salt treatment. These results suggest that the growth rate of wheat seedlings depends on the duration of salt treatment and it significantly changes after 24 h of treatment. These findings are not consistent with prior studies indicating that plant growth with NaCl treatment continues to reduce in the seedlings of Triticum aestivum [38], Brassica juncea [39], and Schizonepeta tenuifolia [40].

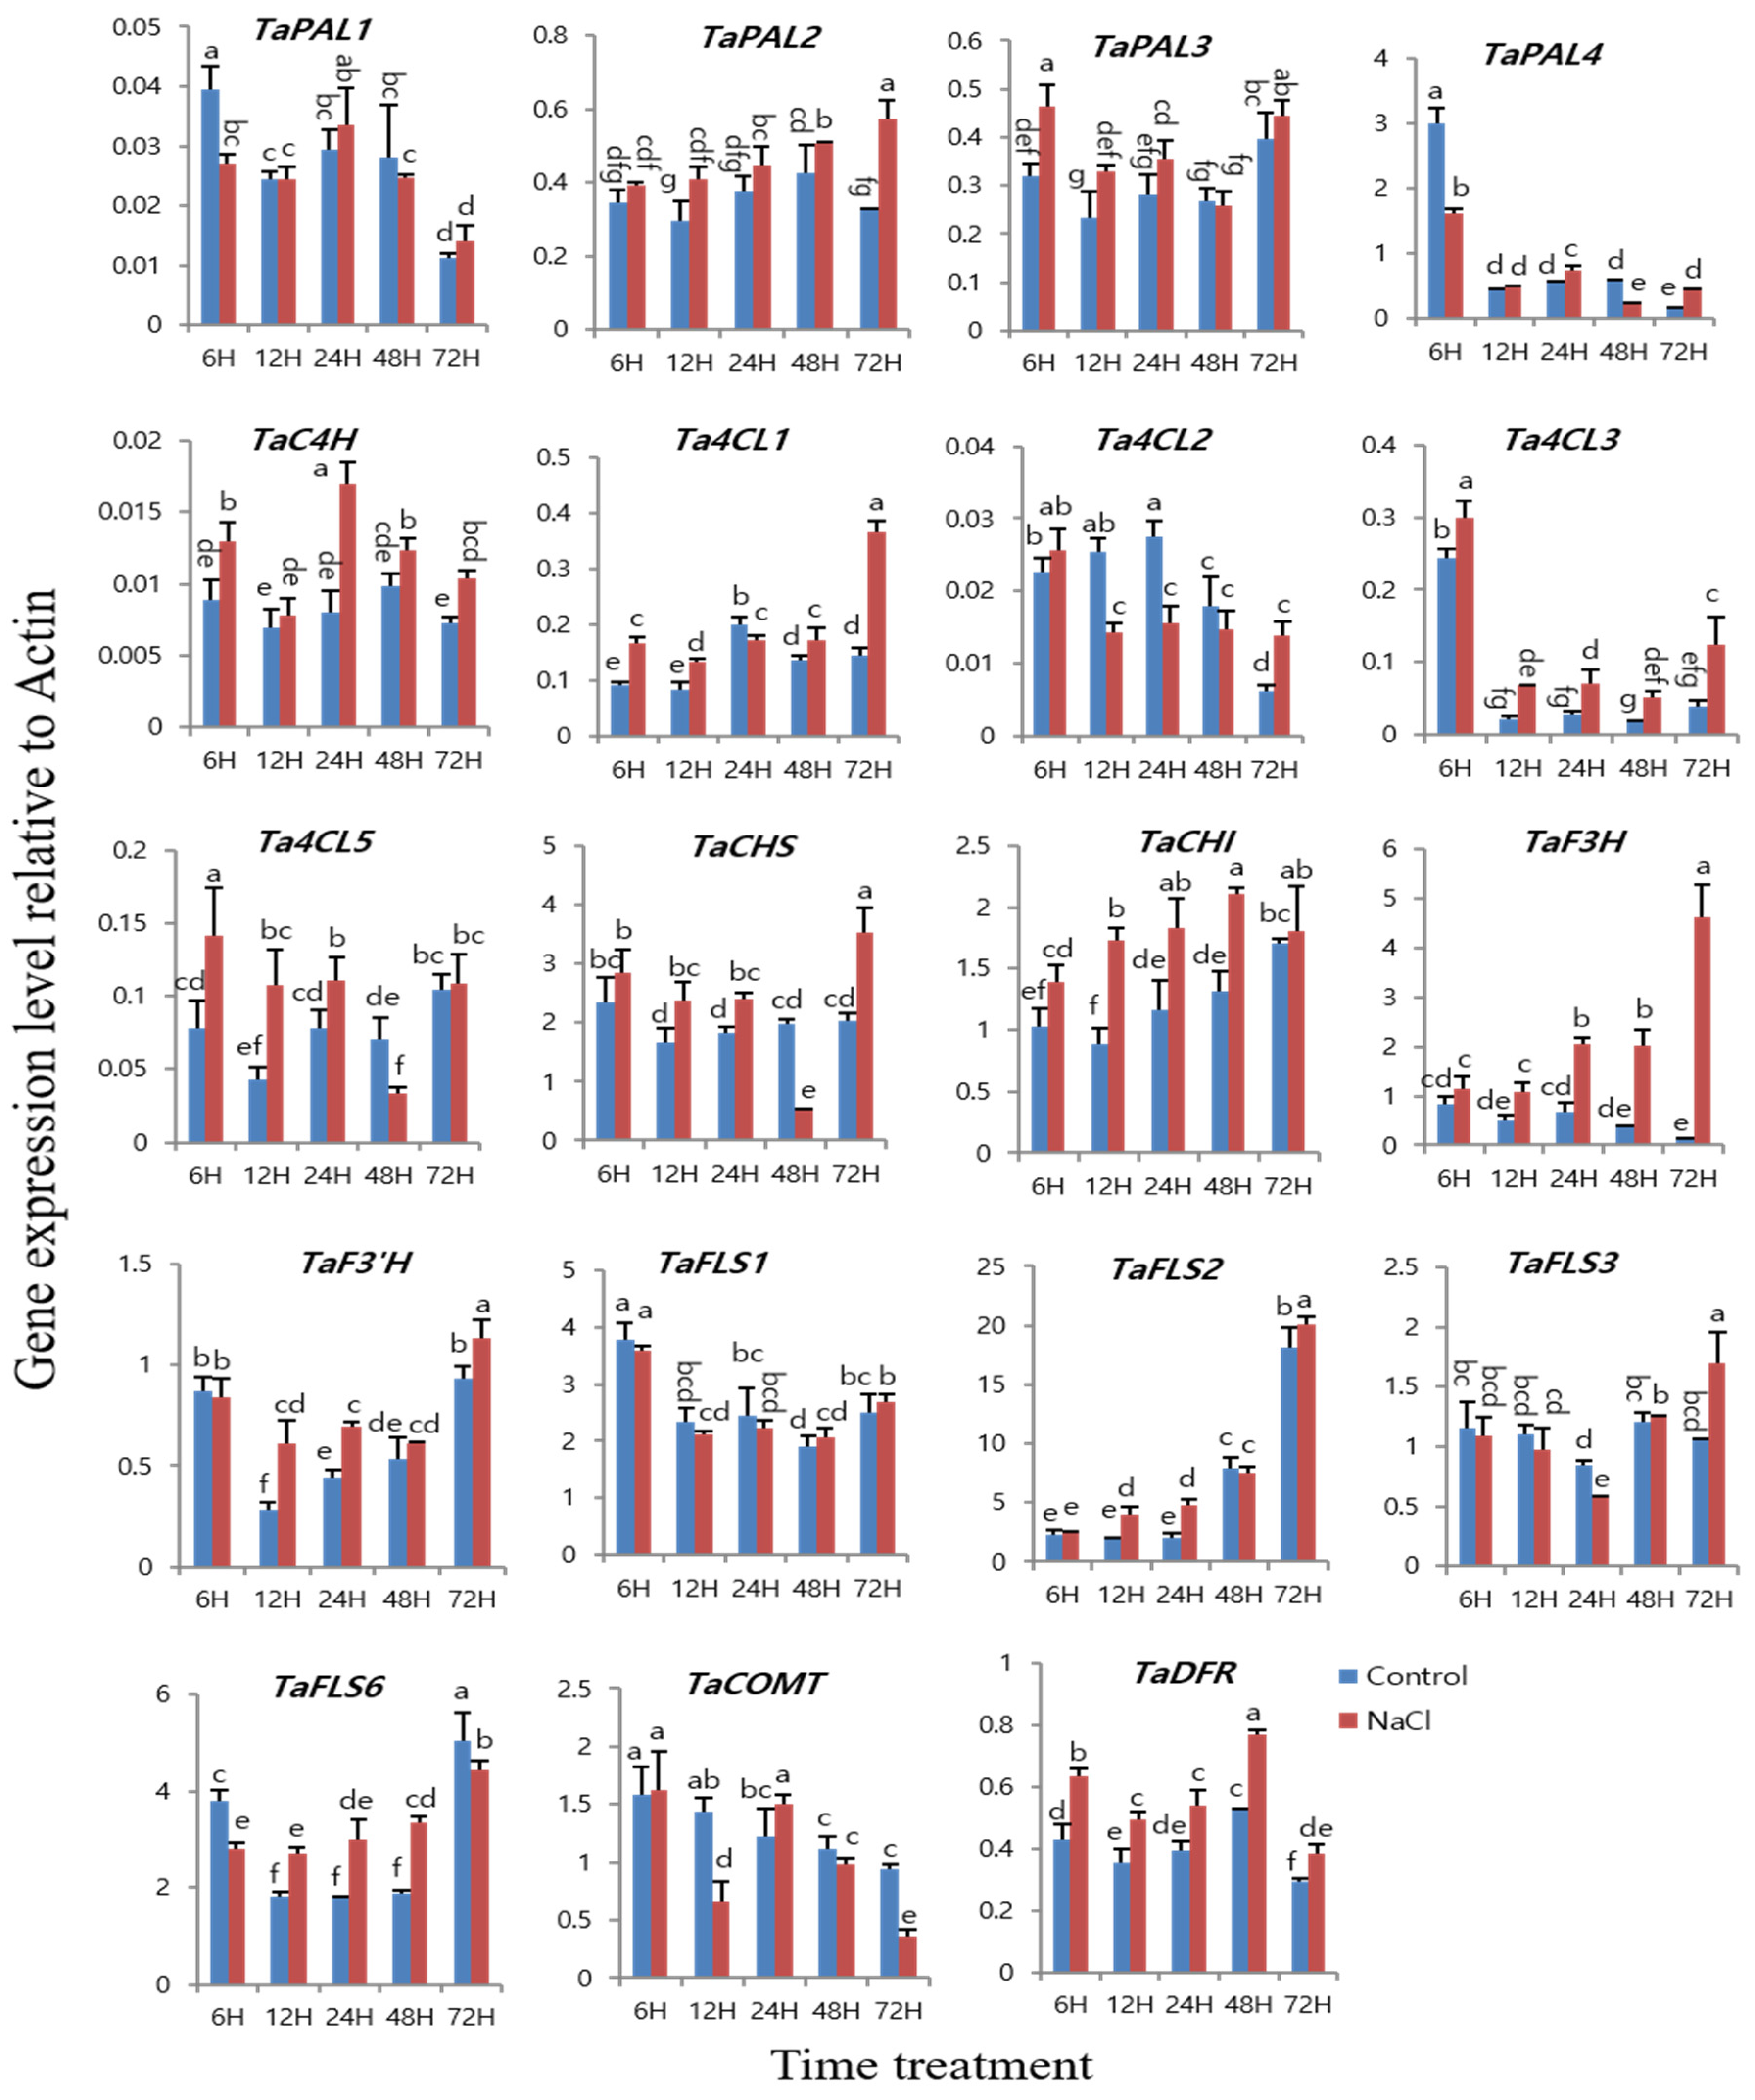
3.5. Expression of Phenylpropanoid Biosynthetic Genes in Six-day-old Wheat Plantlets under 50 mM NaCl Treatment

To analyze the effect of NaCl on the wheat sprout, the expression level of phenylpropanoid biosynthetic pathway genes were examined under specific conditions, such as exposing the 6-day-old wheat plantlets with 50 mM NaCl for 6, 12, 24, 48, and 72 h. The expression level of most genes related to phenylpropanoid biosynthesis in wheat plantlets was higher under 50 mM NaCl treatment than the control for each time treatment (Figure 5). After the 6 h treatment, the expression of TaPAL2, TaPAL3, TaC4H, Ta4CL1, Ta4CL2, Ta4CL3, Ta4Cl5, TaCHS, TaCHI, TaF3H, and TaDFR was higher under 50 mM of NaCl treatment than for control; contrarily, the expression of TaPAL1, TaPAL4, and TaFLS6 was lower than control. The expression of TaF3′H, TaFLS1, TaFLS2, TaFLS3, and TaCOMT did not differ between control and 50 mM NaCl treatment at 6 h. After the 12 h treatment, almost all of phenylpropanoid biosynthetic genes were more expressed under salt treatment than for the control, except for TaPAL1, TaPAL4, TaC4H, TaFLS1, and TaFLS3, which had similar expression levels in both treatments; while the two genes Ta4CL2 and TaCOMT were more expressed under control than for the 50 mM NaCl treatment. After the 24 h treatment, most of wheat phenylpropanoid genes were less expressed in control, except for Ta4CL1, Ta4CL3, TaFLS3, and TaFLS1, which were similar or higher in control. After the 48 h treatment TaPAL1, TaPAL3, Ta4CL2, TaFLS1, TaFLS2, and TaFLS3 genes were similarly expressed in both treatments, expression of TaPAL4, Ta4CL5, and TaCHS was higher in control, but for TaPAL2, TaC4H, Ta4CL1, Ta4CL3, TaCHI, TaF3H, TaF3′H, TaFLS6, and TaDFR it was higher in the 50 mM NaCl treatment than the control. After the 72 h salt treatment, the expression of almost all wheat phenylpropanoid genes was higher in salt treatment than the control; in contrast, the expression of TaFLS6 and TaCOMT was higher in the control than for salt treatment, and the expression of Ta4CL5, TaCHI, and TaFLS1 was similar in the salt treatment and the control. Yun et al. [41] demonstrated that the expression of most phenylpropanoid biosynthesis-related genes was up-regulated in pak choi treated with NaCl. Ben Abdallah et al. [35] reported gene expression of flavonoid biosynthesis in salinity-treated black nightshade was higher than in the non-treated control. These results are consistent with our work.

3.6. Phenylpropanoid Content in Six-day-old Wheat Plantlets after 50 mM NaCl Treatment for 6, 12, 24, 48 and 72 h

To investigate whether phenylpropanoid compound accumulation in wheat plantlets is influenced by the duration of NaCl stress, HPLC analysis was performed and the results are showed in Table 3. Result of Table 3 showed that the 50 mM NaCl treatment had a higher accumulation of most phenylpropanoids than the control for the same time, except for: the accumulation of benzoic acid at 12 h; caffeic acid and rutin at 24 h; rutin at 48 h; and garlic acid and ferulic acid at 72 h, for which their content was lower than the control. The level of trans-cinnamic acid (9.33 ± 0.27 µg g−1 dry weight), and caffeic acid (26.08 ± 0.64 µg g−1 dry weight) in wheat sprouting were highest after 72 h treated by 50 mM NaCl, while the accumulation of benzoic acid (1261.05 ± 14.24 µg g−1 dry weight), 4-hydroxybenzoic acid (105.27 ± 1.55 µg g−1 dry weight), epicatechin (9158.68 ± 56.56 µg g−1 dry weight) were highest after 48 h treated by 50 mM NaCl. Table 3 showed that epicatechin and benzoic acid are the main phenylpropanoids in wheat plantlets, their accumulation increased and peaked at 48 h, then decreased at 72 h of treatment. The accumulation of epicatechin was 1.08-, 1.23-, 1.21-, 1.27-, and 2.38-fold higher in 50 mM of NaCl treatment than for the control after 6, 12, 24, 48, and 72 h, respectively. This result concurred with the expression of TaCHI and TaDFR which increased and peaked at 48 h, and was more expressed with 50 mM of NaCl than control. Meanwhile, the accumulation of benzoic acid was similar in both treatments at 6, 12, and 24 h; after the 48 h treatment, the benzoic content was 1.15-fold higher in the control than for the NaCl treatment, and after the 72 h treatment, it was 3.75-fold higher in salt treatment than in control. The accumulation of trans-cinnamic acid increased overtime treatment; however, there was no significant change in accumulation between salt treatment and control, except for 72 h treatment, in which trans-cinnamic acid content was 1.34-fold higher in salt treatment than control. The accumulation of trans-cinnamic acid coincided with the expression of TaPAL2, which had the highest expression level at 72 h in salt treatment. 4-hydroxybenzoic acid content was similar in 12 h and 72 h salt treatments and control; but was significantly higher in salt treatment after 6, 24, and 48 h treatments. The accumulation of caffeic acid was 1.88-, 1.09-, 1.72-, and 1.17-fold higher in salt treatment than control in 6, 12, 48, and 72 h after treatments, respectively; however, caffeic acid content after the 24 h treatment was 1.4-fold higher in control than 50 mM NaCl treatment. Ferulic acid content was 1.91-, 1.61-, 1.55-, 2.02-fold higher in salt treatment than control in 6, 12, 24, and 48 h treatments, respectively; but in 72 h treatment, it was 3.4-fold higher in control than salt treatment. The accumulation of gallic acid (6, 12, and 48 h) and kaempferol (12, 24, and 48 h) were higher in salt treatment than control, but in 72 h treatment, their accumulation was 0.74- and 0.65-fold lower than in the control, respectively. Rutin content was not significantly different between salt treatment and control, except for the 48 h treatment, in which rutin accumulation was higher in control than NaCl treatment. The highest level of phenylpropanoid compounds was obtained in epicatechin, benzoic acid, and 4-hydroxybenzoic acid in the 48 h treatment. Although the fresh weight, shoot and root length of wheat sprouts slightly decreased with 48 h, 50 mM NaCl treatment, this treatment improved the nutritional quality of wheat plantlets by increasing the levels of phenylpropanoid compounds. This result is consistent with previous investigations indicating that the accumulation of total phenylpropanoid content in plants under salinity stress was higher than that in the control [35,41,42].

4. Conclusions

In conclusion, we found that NaCl stress enhances the phenylpropanoid accumulation and their related gene expression in wheat sprout. The HPLC results indicated that total phenylpropanoid content in wheat sprouts was the highest in the 50 mM NaCl treatment. In addition, different time course experiments at 50 mM of NaCl treatment also showed that most of the phenylpropanoid compounds level was increased with increasing exposure time. Although the growth rate (fresh weight, and shoots and roots length) of wheat seedlings decreased under NaCl treatment. Our results suggest that NaCl treatment may represent a method to enhance the accumulation of phenylpropanoid compounds in wheat sprout.

Author Contributions

J.K.K. and S.U.P. designed the experiments and analyzed the data. D.M.C., S.-J.K., B.V.N., and S.W.C. performed the experiments and analyzed the data. D.M.C. and S.U.P. wrote the manuscript. All authors have read and agreed to the published version of the manuscript.

Funding

This research was supported by grants from the Research Program of KAERI, Republic of Korea.

Conflicts of Interest

The authors declare no conflict of interest.

References

  1. Shewry, P.R.; Hey, S.J. The contribution of wheat to human diet and health. Food Energy Secur. 2015, 4, 178–202. [Google Scholar] [CrossRef] [PubMed]
  2. Shannon, M.C. Adaptation of plants to salinity. Adv. Agron. 1997, 60, 75–120. [Google Scholar]
  3. Gupta, B.; Huang, B.R. Mechanism of Salinity Tolerance in Plants: Physiological, Biochemical, and Molecular Characterization. Int. J. Genom. 2014, 2014, 701596. [Google Scholar] [CrossRef] [PubMed]
  4. Parida, A.K.; Das, A.B. Salt tolerance and salinity effects on plants: A review. Ecotoxicol. Environ. Saf. 2005, 60, 324–349. [Google Scholar] [CrossRef]
  5. Katerji, N.; van Hoorn, J.W.; Hamdy, A.; Mastrorilli, M.; Karam, F. Salinity and drought, a comparison of their effects on the relationship between yield and evapotranspiration. Agric. Water Manag. 1998, 36, 45–54. [Google Scholar] [CrossRef]
  6. Hu, Y.C.; Schmidhalter, U. Drought and salinity: A comparison of their effects on mineral nutrition of plants. J. Plant Nutr. Soil Sci. 2005, 168, 541–549. [Google Scholar] [CrossRef]
  7. Wahid, A.; Ghazanfar, A. Possible involvement of some secondary metabolites in salt tolerance of sugarcane. J. Plant Physiol. 2006, 163, 723–730. [Google Scholar] [CrossRef]
  8. Sharma, A.; Shahzad, B.; Rehman, A.; Bhardwaj, R.; Landi, M.; Zheng, B. Response of Phenylpropanoid Pathway and the Role of Polyphenols in Plants under Abiotic Stress. Molecules 2019, 24, 2452. [Google Scholar] [CrossRef] [Green Version]
  9. Valifard, M.; Mohsenzadeh, S.; Kholdebarin, T.T.; Rowshan, V.; Niazi, A.; Moghadam, A. Effect of salt stress on terpenoid biosynthesis in Salvia mirzayanii: From gene to metabolite. J. Hortic. Sci. Biotech. 2019, 94, 389–399. [Google Scholar] [CrossRef]
  10. Vogt, T. Phenylpropanoid Biosynthesis. Mol. Plant 2010, 3, 2–20. [Google Scholar] [CrossRef] [Green Version]
  11. Shahidi, F.; Ambigaipalan, P. Phenolics and polyphenolics in foods, beverages and spices: Antioxidant activity and health effects—A review. J. Funct. Foods 2015, 18, 820–897. [Google Scholar] [CrossRef]
  12. Ignat, I.; Volf, I.; Popa, V.I. A critical review of methods for characterisation of polyphenolic compounds in fruits and vegetables. Food Chem. 2011, 126, 1821–1835. [Google Scholar] [CrossRef] [PubMed]
  13. Cevallos-Casals, B.A.; Cisneros-Zevallos, L. Impact of germination on phenolic content and antioxidant activity of 13 edible seed species. Food Chem. 2010, 119, 1485–1490. [Google Scholar] [CrossRef]
  14. Panda, P.; Appalashetti, M.; Judeh, Z.M.A. Phenylpropanoid Sucrose Esters: Plant-Derived Natural Products as Potential Leads for New Therapeutics. Curr. Med. Chem. 2011, 18, 3234–3251. [Google Scholar] [CrossRef]
  15. Korkina, L.; Kostyuk, V.; De Luca, C.; Pastore, S. Plant Phenylpropanoids as Emerging Anti-Inflammatory Agents. Mini Rev. Med. Chem. 2011, 11, 823–835. [Google Scholar] [CrossRef] [PubMed]
  16. Yang, C.S.; Landau, J.M.; Huang, M.T.; Newmark, H.L. Inhibition of carcinogenesis by dietary polyphenolic compounds. Annu. Rev. Nutr. 2001, 21, 381–406. [Google Scholar] [CrossRef] [Green Version]
  17. Yao, L.H.; Jiang, Y.M.; Shi, J.; Tomas-Barberan, F.A.; Datta, N.; Singanusong, R.; Chen, S.S. Flavonoids in food and their health benefits. Plant Food Hum. Nutr. 2004, 59, 113–122. [Google Scholar] [CrossRef]
  18. Eudes, A.; Liang, Y.; Mitra, P.; Loque, D. Lignin bioengineering. Curr. Opin. Biotechnol. 2014, 26, 189–198. [Google Scholar] [CrossRef] [Green Version]
  19. Naoumkina, M.A.; Zhao, Q.; Gallego-Giraldo, L.; Dai, X.; Zhao, P.X.; Dixon, R.A. Genome-wide analysis of phenylpropanoid defence pathways. Mol. Plant Pathol. 2010, 11, 829–846. [Google Scholar] [CrossRef]
  20. Liu, J.Y.; Osbourn, A.; Ma, P.D. MYB Transcription Factors as Regulators of Phenylpropanoid Metabolism in Plants. Mol. Plant 2015, 8, 689–708. [Google Scholar] [CrossRef] [Green Version]
  21. Noreen, Z.; Ashraf, M. Assessment of variation in antioxidative defense system in salt-treated pea (Pisum sativum) cultivars and its putative use as salinity tolerance markers. J. Plant Physiol. 2009, 166, 1764–1774. [Google Scholar] [CrossRef] [PubMed]
  22. Lim, J.H.; Park, K.J.; Kim, B.K.; Jeong, J.W.; Kim, H.J. Effect of salinity stress on phenolic compounds and carotenoids in buckwheat (Fagopyrum esculentum M.) sprout. Food Chem. 2012, 135, 1065–1070. [Google Scholar] [CrossRef] [PubMed]
  23. Kim, H.J.; Fonseca, J.M.; Choi, J.H.; Kubota, C.; Kwon, D.Y. Salt in irrigation water affects the nutritional and visual properties of romaine lettuce (Lactuca sativa L.). J. Agric. Food Chem. 2008, 56, 3772–3776. [Google Scholar] [CrossRef] [PubMed]
  24. Hichem, H.; Mounir, D.; Naceur, E. Differential responses of two maize (Zea mays L.) varieties to salt stress: Changes on polyphenols composition of foliage and oxidative damages. Ind. Crop. Prod. 2009, 30, 144–151. [Google Scholar] [CrossRef]
  25. Untergasser, A.; Cutcutache, I.; Koressaar, T.; Ye, J.; Faircloth, B.C.; Remm, M.; Rozen, S.G. Primer3—New capabilities and interfaces. Nucleic Acids Res. 2012, 40, e115. [Google Scholar] [CrossRef] [Green Version]
  26. Cuong, D.M.; Kwon, S.J.; Jeon, J.; Park, Y.J.; Park, J.S.; Park, S.U. Identification and Characterization of Phenylpropanoid Biosynthetic Genes and Their Accumulation in Bitter Melon (Momordica charantia). Molecules 2018, 23, 469. [Google Scholar] [CrossRef] [Green Version]
  27. Koca, H.; Bor, M.; Ozdemir, F.; Turkan, I. The effect of salt stress on lipid peroxidation, antioxidative enzymes and proline content of sesame cultivars. Environ. Exp. Bot. 2007, 60, 344–351. [Google Scholar] [CrossRef]
  28. Saha, P.; Chatterjee, P.; Biswas, A.K. NaCl pretreatment alleviates salt stress by enhancement of antioxidant defense system and osmolyte accumulation in mungbean (Vigna radiata L. Wilczek). Indian J. Exp. Biol. 2010, 48, 593–600. [Google Scholar]
  29. Agarwal, S.; Pandey, V. Antioxidant enzyme responses to NaCl stress in Cassia angustifolia. Biol. Plant. 2004, 48, 555–560. [Google Scholar] [CrossRef]
  30. Jamil, M.; Bae, D.L.; Yong, J.K.; Ashraf, M.; Chun, L.S.; Shik, R.E. Effect of salt (NaCl) stress on germination and early seedling growth of four vegetables species. J Cent. Eur. Agric. 2006, 7, 273–282. [Google Scholar]
  31. Bohnert, H.J.; Jensen, R.G. Strategies for engineering water-stress tolerance in plants. Trends Biotechnol. 1996, 14, 89–97. [Google Scholar] [CrossRef]
  32. Rossi, L.; Borghi, M.; Francini, A.; Lin, X.; Xie, D.Y.; Sebastiani, L. Salt stress induces differential regulation of the phenylpropanoid pathway in Olea europaea cultivars Frantoio (salt-tolerant) and Leccino (salt-sensitive). J. Plant Physiol. 2016, 204, 8–15. [Google Scholar] [CrossRef] [PubMed]
  33. Irani, S.; Todd, C.D.; Wei, Y.; Bonham-Smith, P.C. Changes in phenylpropanoid pathway gene expression in roots and leaves of susceptible and resistant Brassica napus lines in response to Plasmodiophora brassicae inoculation. Physiol. Mol. Plant Pathol. 2019, 106, 196–203. [Google Scholar] [CrossRef]
  34. Ni, J.; Hao, J.; Jiang, Z.; Zhan, X.; Dong, L.; Yang, X.; Sun, Z.; Xu, W.; Wang, Z.; Xu, M. NaCl induces flavonoid biosynthesis through a putative novel pathway in post-harvest ginkgo leaves. Front. Plant Sci. 2017, 8, 920. [Google Scholar] [CrossRef] [Green Version]
  35. Ben Abdallah, S.; Aung, B.; Amyot, L.; Lalin, I.; Lachaal, M.; Karray-Bouraoui, N.; Hannoufa, A. Salt stress (NaCl) affects plant growth and branch pathways of carotenoid and flavonoid biosyntheses in Solanum nigrum. Acta Physiol. Plant. 2016, 38, 72. [Google Scholar] [CrossRef]
  36. Navarro, J.M.; Flores, P.; Garrido, C.; Martinez, V. Changes in the contents of antioxidant compounds in pepper fruits at different ripening stages, as affected by salinity. Food Chem. 2006, 96, 66–73. [Google Scholar] [CrossRef]
  37. Lopez-Berenguer, C.; Martinez-Ballesta, M.D.; Moreno, D.A.; Carvajal, M.; Garcia-Viguera, C. Growing hardier crops for better health: Salinity tolerance and the nutritional value of Broccoli. J. Agric. Food Chem. 2009, 57, 572–578. [Google Scholar] [CrossRef]
  38. Grieve, C.M.; Francois, L.E.; Poss, J.A. Effect of salt stress during early seedling growth on phenology and yield of spring wheat. Cereal Res. Commun. 2001, 29, 167–174. [Google Scholar] [CrossRef]
  39. Pandey, M.; Penna, S. Time course of physiological, biochemical, and gene expression changes under short-term salt stress in Brassica juncea L. Crop. J. 2017, 5, 219–230. [Google Scholar] [CrossRef] [Green Version]
  40. Zhou, Y.; Tang, N.; Huang, L.; Zhao, Y.; Tang, X.; Wang, K. Effects of salt stress on plant growth, antioxidant capacity, glandular trichome density, and volatile exudates of Schizonepeta tenuifolia Briq. Int. J. Mol. Sci. 2018, 19, 252. [Google Scholar] [CrossRef] [Green Version]
  41. Yun, Y.; Jung, H.J.; Rahim, M.A.; Park, N.K.; Kuk, Y. Molecular analysis of genes related to phenylpropanoid and ascorbate biosynthesis in salt and UV-B treated pak choi grown under LEDs. Botany 2019, 97, 513–519. [Google Scholar] [CrossRef]
  42. Kim, N.S.; Kwon, S.J.; Cuong, D.M.; Jeon, J.; Park, J.S.; Park, S.U. Accumulation of phenylpropanoids in tartary buckwheat (Fagopyrum tataricum) under salt stress. Agronomy 2019, 9, 739. [Google Scholar] [CrossRef] [Green Version]
Figure 1. The phenylpropanoid biosynthetic pathway in wheat sprouts. A red color indicates the phenylpropanoids and flavonoids quantified in this study by HPLC. Blue indicates the enzymes whose gene expression was analyzed by using qRT-PCR. Abbreviations: PAL, phenylalanine ammonia-lyase; C4H, cinnamate 4-hydroxylase; C3H, 4-hydroxycinnamate 3-hydroxylase; COMT, caffeic acid 3-O-methyltransferase; 4CL, 4-coumaroyl CoA ligase; CHS, chalcone synthase; CHI, chalcone isomerase; F3H, flavanone 3-hydroxylase; F3′H, flavonoid 3′-hydroxylase; FLS, flavonol synthase; and DFR, dihydroflavonol-4 reductase.
Agronomy 10 00390 g001
Figure 2. Development of wheat sprouting at 6 days under different NaCl concentration treatments. A, 0 mM NaCl; B, 50 mM NaCl; C, 100 mM NaCl; and D, 200 mM NaCl. The means and standard deviations (SD) were calculated from three biological replicates. Letters a-d denote significant differences (P < 0.05). The scale bars represent 5 cm.
Agronomy 10 00390 g002
Figure 3. Relative expression levels of phenylpropanoid biosynthetic pathway gene in 6-day-old wheat sprouts grown under different NaCl concentrations. The means and SD were calculated from three biological replicates. Letters a-d denote significant differences (P < 0.05).
Agronomy 10 00390 g003
Figure 4. Wheat plantlet growth under control and 50 mM NaCl treatments. Six-day-old plantlets were treated with 0 mM and 50 mM NaCl for 6, 12, 24, 48, and 72 h. The means and SD were calculated from three biological replicates. Letters a-g denote significant differences (P < 0.05). The scale bars represent 4 cm.
Agronomy 10 00390 g004
Figure 5. Expression of phenylpropanoid biosynthetic genes in 6-day-old wheat plantlets after 50 mM NaCl treatment for 6, 12, 24, 48 and 72 h. The means and SD were calculated from three biological replicates. Letters a-g denote significant differences (P < 0.05).
Agronomy 10 00390 g005
Table 1. Primers used in this study for quantitative real-time PCR analysis.
GeneIDForward Primer (5′ to 3′)Reverse Primer (5′ to 3′)
TaPAL1CJ628388.1GCTCTTTGAGGCCAATGTTCTTGCTTCTATCTGTCCAGGGTGGT
TaPAL2CJ707202.1CTACATGGCACTCGCAAAGAAGGTTGATCTCACGCTCGATTGAC
TaPAL3CJ805150.1TACATGAAGCAGGCAAAGAAGCTTGTCGTTGACGGAGTTGATCT
TaPAL4BQ752712.1GTGAACTCTCTGGGCCTTGTGTTCACGGAGGTCTTGATGTTCTC
TaC4HHX132432.1CAACCACCGCAACCTCATGGTGAAGATGTCGAAGACGA
Ta4CL1GH727954.1GCCGCTGTTCCACATCTAGGTCGCTCTTGGCGATCT
Ta4CL2CJ951387.1GAGGCCACAAAGAACACCATTTTGATTTCGGCGTGTGTAA
Ta4CL3CK163034.1AGTTCGCCTTCTCCTTCCTCCGTACTCCAGCACCTTGTCC
Ta4CL5GH724596.1CAAGGGCGTCATGCTCAAGCGAGTAGATGTGGAACAGC
TaCHSHX091886.1CGTGGACGAAGTGATGAAGATTAGGTGTTCGCTGTTGGTG
TaCHICD890742.1ACAAGGTGACGGAGAACTGCGAGTGGGTGAAGAGGATGGA
TaF3HCJ659795.1CTGGAGAAGGTGATGGCTGTCAGATAGTCCCGCCAGTTGT
TaF3′HHX255892.1AAGGAGAGGCGCAATAGGATGTGATGGGGAAGCTACAAGC
TaFLS1BE423889.1TGAAGGATTTGGCTACTGTGGGAGAAGACGCGGATGTCGT
TaFSL2BQ244276.1ATCCAAACTGACACGCATGAAGTTCCCGGCCAAGTACAAG
TaFLS3HX107493.1CTACGGCTTCTTCCAGATCGCAGATAGTCCCGCCAGTTGT
TaFLS6CD454732.1GTACCAGCATCCGTCCTTGAGTGGTGCTCCTCCAGAAGAT
TaDFRCJ714375.1TACGACCAGGACAACTGGAGGGGATGATGCTGATGAAGTC
TaCOMT1CJ858964.1CCATCAAGGGCATCAACTTCCAAGGCGTCGTAGCAGTTCT
TaActinGQ339780CGTGTTGGATTCTGGTGATGCGAGCTTCTCCTTGATGTCC
Table 2. The phenylpropanoid content (µg g−1 dry weight) under different NaCl concentrations. ND, not detected. Each result was calculated from three biological replicates. Letters a-d denote significant differences (P < 0.05).
Phenylpropanoid Compound0 mM NaCl50 mM NaCl100 mM NaCl200 mM NaCl
4-hydroxybenzoic acidND22.59 ± 0.55 a9.81 ± 0.06 bND
Catechin hydrate65.41 ± 4.26 a2.31 ± 0.03 b2.65 ± 0.09 bND
Chlorogenic acidNDNDND44.59 ± 0.49 a
Caffeic acid8.61 ± 0.16 c10.11 ± 0.34 b11.62 ± 0.14 a6.99 ± 0.09 c
Epicatechin617.15 ± 26.58 c2708.96 ± 227.11 a1323.13 ± 29.72 b1218.85 ± 29.45 b
Ferulic acid30.63 ± 1.91 c53.75 ± 1.6 a36.3 ± 2.53 b28.37 ± 1.31 c
Benzoic acid1604.61 ± 65.0 a510.14 ± 12.26 c739.53 ± 6.28 b191.62 ± 0.51 d
Rutin3.99 ± 0.61 a3.76 ± 0.37 a4.01 ± 0.8 a3.33 ± 0.47 a
Trans-cinnamic acid0.57 ± 0.27 b1.12 ± 0.15 a0.64 ± 0.2 b0.52 ± 0.19 b
Quercetin35.7 ± 4.93 a23.37 ± 3.49 b5.07 ± 1.64 c6.78 ± 3.65 c
Kaempferol7.06 ± 0.63 a6.77 ± 0.88 a5.01 ± 0.54 b5.19 ± 0.72 b
Total phenylpropanoid2373.74 ± 45.06 b3342.88 ± 241.55 a2137.77 ± 27.87 c1506.23 ± 25.61 d
Table 3. The Phenylpropanoid level (µg g−1 dry weight) in 6 days old wheat plantlets at 6, 12, 24, 48, and 72 under the condition of 50mM NaCl. The means and SD were calculated from three biological replicates. Letters a-h denotes significant differences (P < 0.05).
Time (h)ConditionGallic Acid4-Hydroxybenzoic AcidCaffeic AcidEpicatechinFerulic Acid
6Control8.11 ± 0.09 h33.99 ± 1.7 g10.61 ± 0.86 f6716.99 ± 123.18 d37.99 ± 3.25 f
NaCl 50mM8.91 ± 0.26 gh46.31 ± 1.15 f19.91 ± 0.68 cd7228.10 ± 89.74 c72.63 ± 2.61 d
12Control8.7 ± 0.34 gh58.51 ± 2.44 e20.8 ± 1.00 c6875.85 ± 78.56 d68.83 ± 4.26 d
NaCl 50mM10.53 ± 0.32 de59.82 ± 1.48 e22.74 ± 0.60 b8480.07 ± 140.49 b110.72 ± 8.16 d
24Control10.27 ± 0.083 ef60.55 ± 6.08 e18.59 ± 1.52 d5925.99 ± 169.33 e48.76 ± 3.89 e
NaCl 50mM9.41 ± 0.34 fg66.08 ± 1.99 d13.25 ± 0.34 e7180.61 ± 164.84 c75.77 ± 7.19 d
48Control11.29 ± 0.64 cd98.49 ± 4.43 b14.51 ± 1.39 e7224.31 ± 41.13 c49.77 ± 1.63 e
NaCl 50mM14.43 ± 0.39 b105.27 ± 1.55 a24.91 ± 0.32 a9158.68 ± 56.56 a100.58 ± 2.38 c
72Control16.2 ± 1.37 a90.39 ± 0.48 c22.35 ± 0.27 b1756.89 ± 97.70 g179.24 ± 8.93 a
NaCl 50mM11.94 ± 0.25 c93.14 ± 1.84 c26.08 ± 0.64 a4184.02 ± 113.26 f52.77 ± 3.46 e
Time (h)ConditionBenzoic AcidRutinTrans-Cinnamic AcidKaempferolTotal Phenylpropanoids
6Control847.63 ± 11.04 f129.15 ± 6.52 f1.68 ± 0.13 f5.75 ± 0.94 f7791.91 ± 118.28 f
NaCl 50mM878.01 ± 2.24 f142.55 ± 2.28 f1.85 ± 0.46 ef5.09 ± 0.11 f8403.41 ± 85.22 e
12Control1032.99 ± 27.20 de157.21 ± 6.29 e2.21 ± 0.02 de6.09 ± 0.94 ef8231.19 ± 81.91 e
NaCl 50mM998.95 ± 28.71 e156.61 ± 4.67 e2.32 ± 0.07 d6.54 ± 0.83 f9848.29 ± 164.88 b
24Control1016.11 ± 25.62 de232.47 ± 7.32 d4.97 ± 0.025 c5.85 ± 0.59 f7323.56 ± 208.51 g
NaCl 50mM1044.75 ± 24.02 d224.57 ± 14.10 d5.05 ± 0.23 c7.99 ± 0.34 c8627.49 ± 156.74 d
48Control1449.77 ± 33.71 a366.73 ± 5.79 b6.91 ± 0.19 b7.38 ± 0.98 de9229.18 ± 70.52 c
NaCl 50mM1261.05 ± 14.24 b351.68 ± 3.49 c6.87 ± 0.24 b8.7 ± 0.46 c11032.17 ± 42.17 a
72Control305.84 ± 6.68 g416.41 ± 11.08 a6.95 ± 0.25 b16.25 ± 1.29 a2810.52 ± 73.55 i
NaCl 50mM1148.33 ± 19.58 c425.98 ± 8.42 a9.33 ± 0.27 a10.53 ± 0.07 b5962.11 ± 142.09 h

