Reclaimed Wastewater to Irrigate Olive Groves and Vineyards: Effects on Soil Properties


Escuela Técnica Superior de Ingenieros Agrónomos (ETSIAM), Higher Technical School of Agricultural and Forestry Engineering, University of Castilla-La Mancha, Edificio Manuel Alonso Peña, Campus Universitario, 02071 Albacete, Spain
*
Author to whom correspondence should be addressed.
Agronomy 2020, 10(5), 649; https://0-doi-org.brum.beds.ac.uk/10.3390/agronomy10050649
Submission received: 30 March 2020
/
Revised: 28 April 2020
/
Accepted: 30 April 2020
/
Published: 3 May 2020
(This article belongs to the Special Issue Organic Wastes as a Source of Innovative Fertilizers, a Down-to-Earth Principle for Sustainable Agriculture)
Abstract
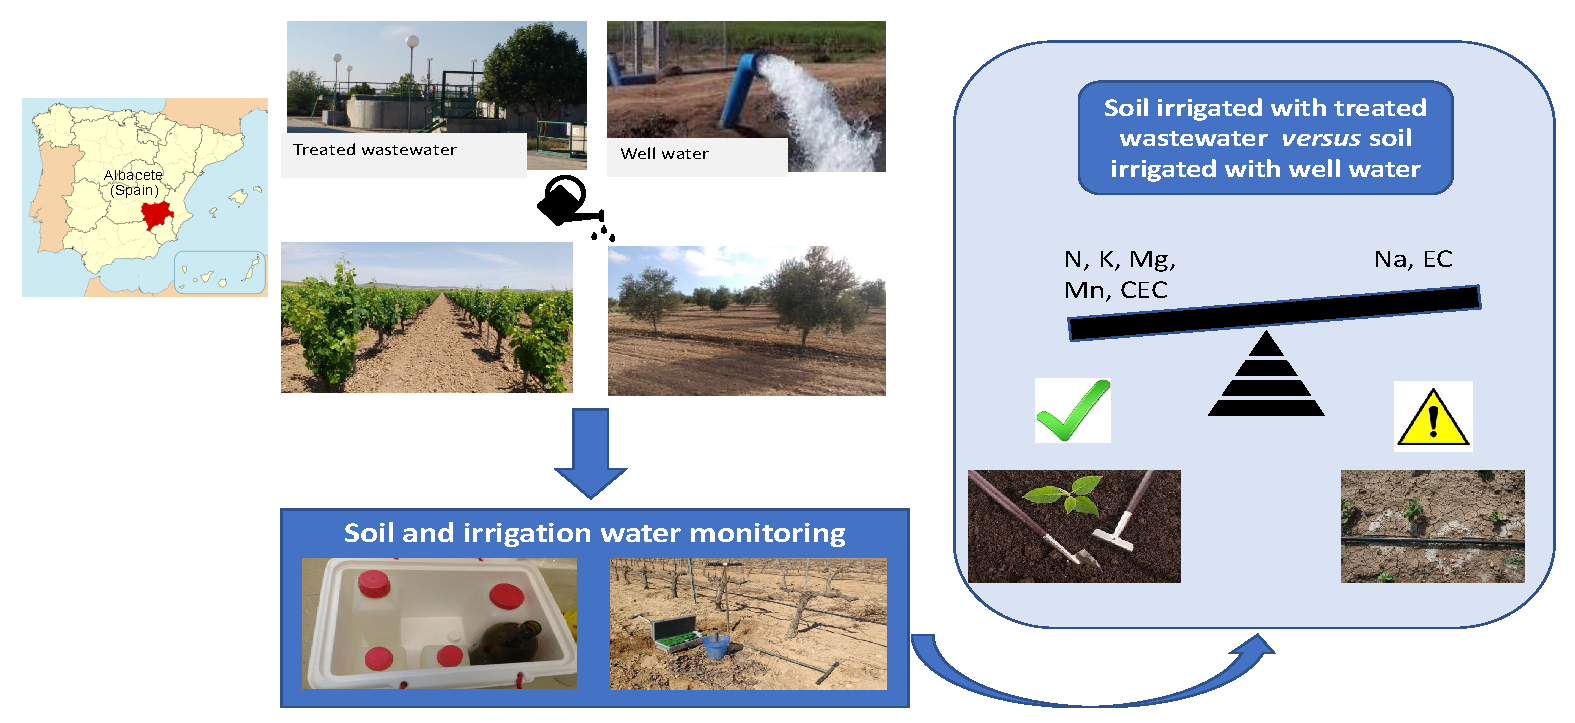
:Having drinking water is one of the sustainable development goals (SDG no. 6) that is not always easy to ensure, especially in countries like Spain or arid regions marked by water deficit. The reuse of treated water should be considered when planning water resources, but it is necessary to verify that this effectiveness is applicable to real situations. A field trial was carried out in several study areas distributed in agricultural parcels of south east Spain. Soils from two olive groves and two vineyards irrigated with treated wastewater (TW) were monitored for to compare with other plantations irrigated with conventional well water (WW) since July 2016–September 2018. Five different irrigation water sources were analyzed (two from well water and three from reclaimed wastewater). No microbiological, metal content, toxicity or organic compounds (PAHs and PCBs) in the studied water samples were detected and reclaimed municipal wastewater was comparable in quality to the conventional sources at all the demonstration sites, except for higher electrical conductivity. Soils irrigated with TW had higher values for electrical conductivity, N, K, Na, Mg, Mn and cation exchange capacity. The main precautions to be considered when irrigating with treated wastewater are its salt content and its tendency to high values of electrical conductivity. Otherwise, they are an interesting contribution of nutrients to soil. Hence adopting this water type to irrigate orchards, vineyards and olive groves could help to save primary water resources.

1. Introduction
When referring to water reuse, we mean taking treated wastewater (TW) and then reusing it for other purposes rather than dumping it into the sea or a river. To be able to reuse it, treated water has to undergo an extra water treatment process because conventional processes do not suffice. Having drinking water is one of the sustainable development goals (SDG no. 6) that is not always easy to ensure, especially in countries like Spain or arid regions marked by water deficit. In Spain and other Mediterranean Region countries, reusing treated water should be considered when the main stakeholders and policy makers plan water resources because it is an area with strong water stress. In other words, water is short, and “wasting” water instead of reusing it is a luxury we cannot afford.
According to a new study by UN University’s Canadian-based Institute for Water, Environment and Health [1], today, some 380 billion cubic meters of wastewater are produced annually worldwide. Furthermore, the paper says, wastewater volumes are increasing quickly, with a projected rise of roughly 24% by 2030, 51% by 2050. In Spain, the 2016 reuse data published at the end of 2018 by the INE (National Statistics Institute) [2] indicate that the TW volume is 12,949,076 m3 per day, with 1,350,536 m3 per day for reused treated water. What this implies is that only 10.5% of the treated water is actually used, and the rest is wasted. Notwithstanding, Spain is the EU country that reuses the biggest wastewater volume and is one of the top ten world countries because the average figure in Europe only comes to 2.4%. The most widespread reused water use is agricultural as 70% of the total volume is reused, which is estimated to be slightly over 400 hm3.
Technically speaking, it is feasible to close the cycle, i.e., we can treat water sufficiently to be able to drink it again. Yet for the time being, legislation does not allow this, at least not directly. Legal wastewater treatment is regulated by European legislation, namely Council Directive 91/271/EEC [3], which has been adopted in each Member Country’s legislation and recently, in 2018, a document entitled “Proposal for a regulation of the European Parliament and of the Council on minimum requirements for water reuse” was published by European Comission [4]. The proposal would contribute to the implementation of several other EU policies, in particular the EU climate change adaptation and disaster prevention policies and the resource-efficient Europe flagship initiative under the Europe 2020 Strategy. Council Directive 91/271/EEC is about urban wastewater treatment and protecting the environment from adverse effects of wastewater discharges. Among many other matters, this directive expects treatment data to be monitored and acquired, which will provide an overall idea of the water treatment situation in Europe. Similarly, Spanish Royal Decree 1620/2007 [5] sets out a series of definitions to clarify the reclaimed water concept. It also deals with aspects of the legal regime. Finally, it sets out the quality conditions that regenerated water must meet to be used by indicating the permitted and prohibited uses, and responsibilities related to quality maintenance, by setting out five major use types: urban, agricultural, industrial, recreational, environmental.
Reusing wastewater for irrigation remains a controversial issue. Although reused water has remarkably increased, reuse is still far from being a representative and important water source worldwide. It is stated that only 55 countries have reliable information about wastewater production, treatment and reuse [6]. Water reuse is essential for water supply diversification strategies in order to ensure water security in a context that is adapting to climate change in countries or basins with structural scarcity-type problems, and to also cushion pressure on aquatic ecosystems, which comes in the form of pollution from numerous chemical substances. Most of the studies where residual water is applied to irrigate agree that this type of water contains beneficial nutrients for the crops but nevertheless, it must be considered that they are generally waters that can increase soil salinity [7,8,9]. Another potential problem that can be found to the use wastewater for irrigation is increasing heavy metals in soil, especially if water comes from industrial areas [10,11]. Finally, to achieve a safe irrigation, it is essential to have strict microbiological irrigation control. Microbiological contamination is not exclusive to wastewater [12] and must be controlled depending on its use. In any case, the limit values to consider water suitable for irrigation in this regard depend on the legal regulations of each country and each region.
Traditionally, rain-fed conditions have been used to grow vineyards and olive groves. Nonetheless, irrigation practices have improved yields [13]. Hence optimizing water resources is essential to properly manage both these crops. With grapevines, the life cycle assessment of wine, particularly the water footprint related to production, needs more efficient water use to either maintain or extend today’s economic markets [14]. When freshwater is scarce in traditional olive and vineyard growing areas, alternative water sources have been employed, including reclaimed irrigation wastewater, which normally contains large amounts of minerals and organic matter [15]. Moreover, soil salinity has increased, but does not necessarily affect crops [16] as each rain event could reduce excess salinity by allowing soil’s ability to self-cleanse [17]. Hence, good recycled water management as an alternative source to irrigating with conventional well water is fundamental to first obtain optimum harvest values so that farmers can maintain their adequate economic level, and second, to improve the sustainability of scarce water resources in countries like Spain or others in the Mediterranean Region within a European circular economic framework.
Agronomic TW suitability has been proven in many studies, designed and conducted under controlled conditions [18,19,20]. However, experiments need to be directly carried out in the field to check whether this effectiveness can be applied to real situations. Researchers know that agronomic follow-up in these situations is a particularly complex practice because many factors must be considered when assessing outcomes. All in all, it is necessary to perform such experiments to be able to actually apply former knowledge.
Our study aims to determine differences among soils of the same vegetation type (vineyard, olive grove), but that have been irrigated with water of distinct qualities (freshwater, reclaimed water). We hypothesized that continuing irrigation on the studied agricultural land with treated wastewater would not harm soil or woody crops. The principle objective of this study was to assess soil response after being irrigated with treated wastewater for years. The aims of the present study were to: (i) initially compare the compositions of soils irrigated for years with reclaimed wastewater to others that have always been irrigated with freshwater in the same zone; (ii) monitor both soil and the applied irrigation water in two typical woody crops of the Mediterranean Region for 3 years running.
2. Materials and Methods
2.1. Experimental Design and Study Area
The field trial was carried out in several study areas distributed in agricultural parcels of SE Spain (Table 1). Olive and vineyard plantations irrigated with treated wastewater (TW) were searched for to compare them with other plantations irrigated with conventional well water (WW).
Firstly, we contacted farmers who owned vineyards and olive groves irrigated with TW for years to allow us access to their farms to monitor their croplands and irrigation water during the study period (July 2016–September 2018).
Moreover, plots in the same area that had always been irrigated with freshwater were sought too. Hence, the study plots were identified as follows: OC (control olive grove); O1 and O2 (olive groves with TW irrigation); VC (control vineyard), V1 and V2 (vineyards with TW irrigation). All the demo sites were located in the province of Albacete (Spain). Table 1 provides details about the selected test plots.
Two irrigation water types were considered: freshwater from conventional wells used as the control (WW) and treated wastewater (TW) from three different wastewater treatment plants (WWTPs). All these WWTPs were located in the province of Albacete (Spain) and employed biological secondary treatment without disinfection and different numbers of Inhabitants Equivalent (IE) as a measure of pollutant load. They were located in Valdeganga (39°07’26.3″ N 1°40’25.2″ W; 3000 IE), Fuenteálamo (38°41’07.4″ N 1°27’27.8″ W; 5600 IE) and Ontur (38°36’44.6″ N 1°30’22.4″ W; 1500 IE). In this way, five different water sources were used for the study, namely: (1) WCV: Control water (to irrigate the control vineyard plot: VC); (2) WCO: Control water (to irrigate the control olive grove plot: OC); (3) W1: TW (to irrigate V1 and O1) collected from the Fuenteálamo WWTP; (4) W2: TW (to irrigate V2) collected from the Valdeganga WWTP; (5) W3: TW (to irrigate O2) collected from the Ontur WWTP.
Albacete is located in the local steppe climate. There is little rainfall throughout the year. This climate is considered BSk according to the Köppen–Geiger climate classification. During the study period, meteorological conditions were monitored from the Ontur (UTM X: 630,946 UTM Y: 4,276,000 Altitude: 682 m) and Albacete (UTM X: 595,166 UTM Y: 4,311,730 Altitud: 677 m) weather stations. According to the information from the Albacete weather station, mean average, minimum absolute and maximum absolute temperatures were 14.77 °C, −10.9 °C (18/01/2017) and 40 °C (13/07/2017). Average annual rainfall during the study period was 407 mm and mean daily sunshine was 9.82 h. According to the information from the Ontur weather station, mean average, minimum absolute and maximum absolute temperatures were 15.73 °C, −5.9° C (18/01/2017) and 40.1 °C (12/07/2017). Average annual rainfall was 402 mm and mean daily sunshine was 9.77 h.
2.2. Crop Description
2.2.1. Olive Groves (Variety “Picual”)
O1 Plot: Irrigated with TW from Fuenteálamo WWTP (W1) since 2011. Super high-density plantation system (row distance was 3.75 m and the tree spacing along each row was 1.30 m).
O2 Plot: Irrigated with TW from Ontur WWTP (W3) since 2007. Plantation framework: row distance was 7 m and the tree spacing along each row was 6 m.
OC Plot: Irrigated with well water (WCO) since 2011. Plantation framework: row distance was 6 m and the tree spacing along each row was 6 m.
Neither pesticides nor fertilizers were used in plots O1 and O2. Weeds are removed every year using agricultural machinery. In the OC plot, complex fertilisers (1.5–2.8% N, 4–6.5% K2O, 22–26% organic C) and Bacillus thurigiensis were usually applied in winter and spring. Harvesting was done manually (OC and O2) and mechanically (O1). For olive groves, irrigation season is considered from April to October. Water requirements were covered by distributing the total water volume (Table 1) in weekly irrigations during the irrigation season, plus rainfall (about 400 mm per year).
2.2.2. Vineyards
All the selected vineyards were trellised with varieties of red grapes for wine.
V1 Plot: Irrigated with TW from Fuenteálamo WWTP (W1) since 2000. Plantation framework: row distance was 2.70 m and the tree spacing along each row was 2.70 m.
V2 Plot: Irrigated with TW from Valdeganga WWTP (W2) since 2009. Plantation framework: row distance was 1.5 m and the tree spacing along each row was 3 m.
VC Plot: Irrigated with well water (WCV) since 2004. Plantation framework: row distance was 1.4 m and the tree spacing along each row was 3.30 m.
The farmers of all the vineyards fertilized crops every year using agricultural machinery and complex fertilisers (15-15-15) traditionally in winter during the dormant period (December to March) and performed fungal treatment to prevent oidium and mildew. Every 3 years they applied sheep manure (NPK value: 3-1-3) to alternating lanes. For vineyards, irrigation season is considered from May to August. During this period, water requirements are covered by distributing the total water volume (Table 1) in one watering every 10 days. Rainfall (about 400 mm per year) covers the other water needs.
2.3. Irrigation System
All the study plots (including controls) were watered by drip irrigation using 16 mm-diameter polyethylene pipelines. In vineyards, the height of pipelines over soil was 50 cm. The irrigation management and management guidelines depended on the companies in charge of the WWTPs in each town, and on Farmer Associations. The most important characteristics are specified in Table 1.
2.4. Sampling and Measurement
2.4.1. Water
The material used for samplings:
- 1 L glass bottles for the physico-chemical analysis
- 0.5 L polyethylene sterile bottles for the microbiological analysis
- Cool box to transport refrigerated water samples to the laboratory.
Throughout the study, twelve water samples were collected from those used to irrigate olive groves and six samples from those that irrigated vineyards. The analyzed parameters (Table 2 and Table 3) were electrical conductivity (EC), pH, NO3−, CO3=, HCO3−, SO4=, Cl−, K, Na, Mg, Ca, NH4+, PO43−, B, organic matter, total suspended solids (TSS), Sodium Adsorption Ratio (SAR), Residual Sodium Carbonate Index (RSC), hardness, Scott Index and E. coli.
Moreover, an initial analysis of polycyclic aromatic hydrocarbons (PAHs) and polychlorinated biphenyls (PCBs), helminth eggs (Taenia Saginata; Taenia Solium), Legionella sp, Salmonella sp and ecotoxicity was carried out in all the water samples. Organic compounds (PAHs and PCBs) were determined by Gas Chromatography Mass Spectrometry (GC/MS) as follows: PAHs: Sum of Acenafteno, Acenaphthylene, Anthracene, Benzo (a) anthracene, Benzo (a) pyrene, Benzo (b) Fluoranthene, Benzo (e) pyrene, Benzo (g, h, i) perylene, Benzo (k) fluoranthene, Criseno, Dibenzo (a, h), Anthracene, Fenanthrene, Fluoranthene, Fluorene, Indeno (1,2,3-c, d) pyrene, pyrene; and PCBs: sum of PCB n°s 101, 118, 138, 153, 180, 28, 52) and heavy metals (Al, As, Cd, Cu, Cr, Fe, Mn, Hg, Ni, Pb, Se, Zn) by Inductively Coupled Plasma Mass spectrometry (ICP-MS).
2.4.2. Soil
During the irrigation season of each crop, soil samples were collected monthly at 10 different random points and a depth of 0–40 cm with a hand auger from each study plot was tested. The analyzed parameters were EC, total N, nitric N, P, K, Na, Ca, Mg, Mn, B, Fe, Zn, Cu, cation exchange capacity (CEC), organic matter and the C:N ratio. Texture and pH were characterized on two occasions (at the beginning and the end of the study; Table 4). Ecotoxicity by luminescent bacteria tests was also determined.
2.5. Statistical Analysis
Data were subjected to ANOVA treatments. The methods used to discriminate among means were Fisher’s least significant differences (LSD) and Tukey’s test for p < 0.05. All the statistical calculations were performed with Statgraphic Centurion XV.
3. Results
3.1. Water
Electrical conductivity (Table 2) in all studied water samples was lower than 0.7 mS·cm−1 and SAR (Table 3) values in the range (0–3). Hence, according to FAO [21], the studied water samples do not have any degree of restriction in their use.
The sum of polycyclic aromatic hydrocarbons (PAHs) was less than 0.1 ng·L−1 for the control water samples (WCO and WCV) and in two of the studied TW samples (W1 and W3). The sum of PAHs for sample V2 came close to 40 ng·L−1 and was <0.100 ng·L−1 for the other analyzed water samples. The sum of the polychlorinated biphenyl compounds (PCBs) never went over 2500 ng·L−1 in any tested water sample.
Table 2 shows that, according to the p-value, significant differences in all the tested parameters were found, save CO3= and TSS. When control waters and TWs were compared, significant differences appeared only between the control waters (WCV and WCO) for the Cl− (WCV: 109.83 mg·L−1; WCO: 188.08 mg·L−1) and SO4= (WCV: 260.17 mg·L−1; WCO: 465.83 mg·L−1) contents. When comparing the different samples of the wastewater employed for irrigation (W1, W2 and W3), it was noteworthy that the EC in samples W1 (2.14 mS·cm−1) and W3 (2.34 mS·cm−1) was significantly higher than that of sample W2 (1.67 mS·cm−1). The W3 samples had significantly higher average concentrations of NO3− (51.94 mg·L−1), NH4+ (22.21 mg·L−1) and B (0.50 mg·L−1) than W1 (NO3−:2.50 mg·L−1; NH4+: 16.43 mg·L−1 and B: 0.31 mg·L−1) or W2 (NO3−:12.78 mg·L−1; NH4+: 5.85 mg·L−1 and B: 0.29 mg·L−1). The contents of chlorides, sulphates and Mg were significantly lower in W2 (Cl−: 206 mg·L−1; SO4=: 279.50·mg L−1; Mg: 84.50·mg L−1) than in W1 (Cl−: 274.75 mg·L−1; SO4=: 426.42·mg L−1; Mg: 119.62 mg·L−1) and W3 (Cl−: 309.40 mg·L−1; SO4=: 431 mg·L−1; Mg: 118.39 mg·L−1). According to the SAR value, no irrigation water was alkalized, and all our water samples were very hard. According to the RSC and Scott Index values, they could all be classified as recommendable, good or tolerable for irrigation purposes (Table 3).
To establish possible differences between the control water and wastewater, a factorial ANOVA was run by considering the water type factor (Table 5). To do so, WCV + WCO were grouped as WC (water control), along with W1 + W2 + W3 as TW. This statistical analysis revealed that all the tested parameters in the irrigation water samples, except pH, SO4 = and Ca, had significantly higher values for TW than for WC. Regarding the microbiological aspects, the presence of E. coli was occasionally detected in our study, but only in one TW sample. The initial analysis conducted of all the water samples revealed that Salmonella sp; Taenia Saginata; Taenia Solium and Legionella sp were absent. The luminescent bacteria tests indicated that ecotoxicity was below 2.00 toxicity units for all the studied water samples.
3.2. Soil
When comparing the initial and final texture and pH in our study, we observed no remarkable changes in both parameters (Table 4).
While searching for the relation between irrigation water and soil composition, Table 5 reveals that the values of EC, NO3−, CO3=, HCO3−, Cl−, K, Na, Mg, NH4+, PO43− and organic matter in TW were higher than in WC but, of all the above-mentioned parameters, only EC, CEC, N, K, Na, Mg and Mn were significantly higher in the soil irrigated with this type of water (Table 6). Finally, Zn was the only parameter with a lower value in the soil irrigated with TW than those irrigated with well water.
To find out which factor had more impact on the above-described differences, Table 7 shows a multifactorial analysis for those parameters to determine the potential influence of crop, type of water, and their possible interaction.
Irrigation water type was essential for determining soil composition for all the selected parameters (Table 7). Moreover, the total N, Mg and Mn contents in soil depended significantly on crop. Finally, interaction irrigation water crop determined CEC, total N and Zn composition.
4. Discussion
4.1. Water
Water salinity is one of the most influential water quality guidelines for crop yields, which is measured as EC. The primary effect on crop productivity of high EC is plants’ inability to compete with ions in soil solution for water, which is known as physiological drought [23] because plasmolysis affects root cells, and the higher the EC value, the less water is available for plants. The presence of salts and nutrients in wastewater increases the chance of both chemical precipitation and biofilm development inside emitters, which may cause clogging because of transported particles [24]. Furthermore, the salinity level of irrigation water restricts plant growth, and a sodium imbalance from irrigation water can further reduce yields under some soil texture conditions [25]. Therefore, in the case of our study, it is so important that farmers do not neglect this factor when planning irrigation with this water type.
The Urban Wastewater Directive (91/271/EEC) contains no information about the limits of PCBs allowed in wastewater discharged into surface water. The limit values set for PAH contents in foodstuffs by European Commission Regulation 835/2011a specify a maximum level of 2.0 μg·kg−1 for benzo(a)pyrene (BaP) and a sum value of 10 μg·kg−1 for benzo(a)anthracene (BaA), benzo(a)pyrene (BaP), benzo(b)fluoranthene (BbF) and chrysene (CHR) for most fats and oils. No contents of PCBs and PAHs in irrigation water were found in any of our analyzed waters, which it is a plus for use in irrigation.
Since the concentration of metals in irrigation water did not exceed the levels recommended by Ayers and Westcot [21] or the WHO [22], it did not act as a limiting factor in any studied case.
According to the FAO [23,26], the normal safe limit for Cl− ions in irrigation water is 30 me·L−1, although this statement strongly depends on specific crop tolerance. All in all, the origin of the content of these ions (Cl− and SO4=) in control waters WCV and WCO was natural as the most relevant origin of SO4= occurs in evaporitic rocks, which always accompany Ca [27], like Cl− whose concentration can rise when Na is present. Therefore, it is not a matter of contaminating compounds because the origin of their presence in water was natural.
In order to better determine irrigation water quality, the calculated indices are presented and employed as a reference to assess the suitability of the water used for irrigation purposes. Typically, irrigation water quality is assessed according to not only salt and salt-inducing contents, but also to the presence/abundance of micro-/macronutrients, alkalinity, trace elements, hardness, acidity and the number of suspended solids [23,28]. Here we refer to (Table 3): (1) SAR: it indicates the relative proportion of Na (which negatively affects soil structure) vs. Ca and Mg, which counteract this effect. If the value exceeds 10, it is considered alkalizing and harmful for the soil structure. SAR assesses the potential of infiltration problems owing to the Na imbalance in irrigation water [29]; (2) residual sodium carbonate (RSC): it is employed to predict the tendency of Ca and Mg to precipitate when soil is irrigated with highly carbonated waters. If this were the case, the SAR value would increase, and so would the soil sodification risk. Values less than 0 (e.g., negative values) indicate that water is recommendable, while values over 2.5 denote that water is not recommendable; (3) hardness (French hydrometric degrees): it refers to Ca and Mg contents. When water hardness is too high, precipitation of Ca and Mg salts might occur in the irrigation system, which could damage it or reduce its efficiency. In contrast, if hardness is too low, it might cause corrosion in the irrigation system. If it goes below 7, water is very soft; if it exceeds 54, water is very hard; (4) the Scott Index or the Alkali-metric Coefficient: it relates the Na concentration in relation to chlorides and sulfates. This index is an indirect measure of the toxicity exerted by NaCl and Na2SO4. Water is good if it goes beyond 18 and bad if it is below 2.
The soils in our study area are Calcic Cambisols [30] and are very rich in calcic carbonate as they settle on land from the Jurassic and Cretaceous, where there are irregular and discontinuous intercalations of conglomerates, marls, limestones and clays. Thus, the control waters logically gave higher values for all these parameters as they strongly depend on the soil characteristics where the collected well water was located. Hence some aspects are in favor and others against using TW for agricultural irrigation purposes. In the event of the highest concentration referring to nutritive elements like N, K, Mg or organic matter, the use of this water type can be considered beneficial as irrigation water is fertilized per se. A problem may arise from excess Na, Cl− in irrigation water or high EC values. Both parameters can harm salinity-sensitive crops, and can even affect irrigation equipment maintenance, especially drip irrigation systems because emitters may be obstructed. Nonetheless, drip irrigation allows water with a higher salt content to be used better than other delivery methods because evaporation loss is minimum. Drip irrigation can also cushion salinity effects by keeping the soil around plant roots continuously moist and providing steady salt leaching to wetted zone edges [31]. In this sense, all olive groves and vineyards in the study were irrigated using this system. Moreover, reusing TW via drip irrigation systems, which was our case, is considered the best option to protect against the contact and dispersion of pathogens [24].
The microbiological aspects related to TW used in irrigation should be considered from several points of view, along with its effect on soil. There are studies showing that TW irrigation does not affect the composition of the total soil bacterial community but may influence the active community fraction [32]. Moreover, there are aspects related to legal restrictions, which depend on each area or region, and are usually related to health aspects. Limits depend on each country’s standards for secondary treatment. Spanish Royal Decree 1620/2007, of 7 December, which sets the legal framework for the reuse of treated wastewater, establishes the guidelines for microbiological wastewater control depending on intended uses: agricultural, industrial, recreational or environmental. According to this law, Salmonella sp; Taenia Saginata; Taenia Solium and Legionella sp; together with E. coli were assessed in our study and the results proved their absence. At any rate, a previous disinfection treatment with either ozone or ultraviolet radiation is necessary. For the latter, adapting the concentration according to the microorganism to be eliminated is necessary [33]. The presence of Salmonella sp. in wastewater can pose a serious problem for human health as its resistance to the common antimicrobials employed to treat diseases in humans has been proven [34]. In our study, the absence of Salmonella sp. and E. coli in irrigation water pointed that they were not considered a major problem from both the sanitary and clogging of dripper viewpoints. Microbiological results are an excellent advantage for its use because they indicate that the existing water treatment system employed at the WWTPs where the water comes is appropriate.
4.2. Soil
Soil is the basis of food production and helps to mitigate climate change by maintaining/increasing its carbon content. According to the FAO [35], agricultural production must increase by 60% globally by 2050, and by nearly 100 percent in developing countries to meet food demands. Therefore, sustainable soil management can produce up to 58% more food. It can take as long as 1000 years for 1 cm of soil to form. Hence, not altering soil properties through improper use is essential. Texture, pH and cation exchange capacity are parameters that ought to be maintained to avoid loss of cultivated soil richness.
Most olive and vineyards from the Mediterranean Region are grown on calcareous soils [36], as is our case (pH higher than 8.0). Under these conditions, nutrient availability may be limited, and it is important that it does not increase, as is our case.
It is also a well-known fact that pH and texture are related directly to the amount of organic matter which, in turn, are related to plant material type [37]. Maintaining enough levels of organic matter in studied soils no doubt impacts the maintenance of these soils’ texture. According to Yañez [38], these average values fall within a poor-normal range for a loam soil type (VC: 1.14%; OC: 1.87%; V1: 1.88%; V2: 1.37%; O1: 2.09%; O2: 1.23%). Adequate proportions of organic matter in soil are necessary to favor the development of a good structure, and to improve water retention and capacity soil aeration, and to also protect against erosion and enhance the total capacity for change by favoring good reserves of nutritional elements.
The nutritive composition of soil is essential for maintaining an adequate soil-plant balance, thus treated wastewater usually contains significant amounts of organic matter. Mineralization of this organic matter and its effects on the soil microbiological population depend on soil type.
The efficiency of the fertigation system used to supply nutrient needs is essential for crops to develop, especially for irrigating orchards [36]. It is feasible to believe that parameters higher in treated wastewater than in well water (EC, NO3−, CO3=, HCO3−, Cl−, K, Na, Mg, NH4+, PO43−, organic matter) would also be higher in the soil, but not all these elements were higher in the soils irrigated with TW. Some water–soil–plant interactions determine soil composition after water intake. For instance, a direct relation can be found between high Na content and EC in soil [9] and, therefore, with SAR. A high Na concentration in TW, in relation to those of Ca and Mg, is an added potential hazard given its contribution to high SAR values. Nevertheless, some studies have not always detected negative effects on crops as a result of irrigation with treated wastewater versus irrigation with well water [36].
5. Conclusions
Utilization of wastewater for irrigation may be included in a fertilization strategy based on the sustainability aspect. Moreover, this type of water could be an alternative water resource.
The wastewater samples herein studied do not pose problems for being used in agricultural irrigation in relation to heavy metal contents (Al, As, Cd, Cu, Cr, Fe, Mn, Hg, Ni, Pb, Se, Zn), ecotoxicity, organic compounds like PAHs or PCBs or microbiological composition (helminth eggs: Taenia Saginata; Taenia Solium; Legionella sp and Salmonella sp).
Soils irrigated with TW versus those irrigated with conventional well water had higher values for electrical conductivity, N, K, Na, Mg, Mn and CEC. This represents an advantage for increasing the nutritional value of agricultural soil (bigger quantity of N, K, Mg and Mn) and better CEC compared to control soils. Nevertheless, the increase in Na in soil and high EC values could prove to be a long-term difficulty. Hence, the main parameter to be considered, for its potential harmful effect on soil, is a potential increase in salinity, although neither soil pH nor texture changed. All in all, the results obtained by the continuous monitoring of soil and water on agricultural plots with two different woody crops (olive grove and vineyard) are revealing as regards the agronomic aptitude of TW.
The future of water resource management policies involves sustainable wastewater reuse within a circular economy frame, because this is the only way to guarantee everyone solidarity access to water.
Author Contributions
Conceptualization, J.D.l.H. and P.M.; methodology, J.D.l.H. and P.M.; formal analysis, J.D.l.H. and P.M.; research, J.D.l.H. and P.M.; resources, J.D.l.H.; writing—original draft preparation, P.M.; writing—review and editing, J.D.l.H. and P.M.; supervision, J.D.l.H.; project administration J.D.l.H.; funding acquisition, J.D.l.H. All the authors have read and agreed to the published version of the manuscript. All authors have read and agreed to the published version of the manuscript.
Funding
This research was funded by the EU and MINECO as part of the collaborative international Consortium (MeProWaRe) financed by the ERA-NET WaterWorks 2014 Cofunded Call. This ERA-NET is an integral part of the 2015 Joint Activities performed by the Water Challenges for a Changing World Joint Programme Initiative (Water JPI).
Acknowledgments
It is necessary to thank all the owners of the farms under study without whose collaboration and willingness this study could not have been conducted. We also thank Helen Warburton for reviewing the English text.
Conflicts of Interest
The authors declare no conflict of interest.
References
- UNU-INWEH, 2020. Available online: https://smartwatermagazine.com/news/unu-inweh/vast-amounts-valuable-energy-nutrients-water-lost-worlds-fast-rising-wastewater (accessed on 17 March 2020).
- INE. 2018. Available online: https://www.ine.es/jaxi/Datos.htm?path=/t26/p067/p01/serie/&file=01005.px (accessed on 23 January 2020).
- Council Directive 91/271/EEC, of 21 May 1991 Concerning Urban Wastewater Treatment. Available online: https://eur-lex.europa.eu/legal-content/EN/TXT/?uri=CELEX%3A31991L0271 (accessed on 10 December 2019).
- European Commision. Proposal for a Regulation of the European Parliament and of the Council on Minimum Requirements for Water Reuse. 2018. Available online: https://eur-lex.europa.eu/legal-content/EN/TXT/?uri=CELEX%3A52018PC0337 (accessed on 15 December 2019).
- Royal Decree 1620/2007, of 7 December, Which Sets the Legal Framework for the Reuse of Treated Wastewater. Available online: https://www.asersagua.es/royal-decree-16202007-of-7-december-wich-sets-the-legal-framework-for-the-reuse-of-treated-wastewater/ (accessed on 20 October 2019).
- De la Cámara, G. 2018. Available online: https://www.iagua.es/noticias/international-desalination-association-ida/gonzalo-delacamara-es-esencial-resolver-quien (accessed on 28 January 2020).
- Obayomi, O.; Edelstein, M.; Safi, J.; Mihiret, M.; Ghazaryan, L.; Vonshak, A.; Bernstein, N.; Gillor, O. The combined effects of treated wastewater irrigation and plastic mulch cover on soil and crop microbial communities. Biol. Fertil. Soils 2020, 14. [Google Scholar] [CrossRef]
- Segal, E.; Dag, A.; Ben-Gal, A.; Zipori, I.; Erel, R.; Suryano, S.; Yermiyahu, U. Olive orchard irrigation with reclaimed wastewater. Agronomic and environmental considerations. Agric. Ecosyst. Environ. 2011, 140, 454–461. [Google Scholar] [CrossRef]
- Paz, A.M.; Castanheira, N.; Farzamian, M.; Paz, M.C.; Gonçalves, M.C.; Monteiro, F.A.; Triantafilis, J. Prediction of soil salinity and sodicity using electromagnetic conductivity imaging. Geoderma 2020, 361, 114086. [Google Scholar] [CrossRef]
- Haroon, B.; Ping, A.; Pervez, A.; Irshad, M. Characterization of heavy metal in soils as affected by long-term irrigation with industrial wastewater. J. Water Reuse Desalin. 2019, 1, 47–56. [Google Scholar] [CrossRef] [Green Version]
- Mahmood, A.; Mahmoud, A.H.; Zein, A.I.; Ashraf, A.; Bandar, M.A.; Almunqedhi, B.M.A. A comparative study of metals concentration in agricultural soil and vegetables irrigated by wastewater and tube well water. J. King Saud Univ. 2020, in press. [Google Scholar] [CrossRef]
- Rusiñol, M.; Hundesa, A.; Cárdenas-Youngs, Y.; Fernández-Bravo, A.; Pérez-Cataluña, A.; Moreno-Mesonero, L.; Moreno, Y.; Calvo, M.; Alonso, J.L.; Figueras, M.J.; et al. Microbiological contamination of conventional and reclaimed irrigation water: Evaluation and management measures. Sci. Total Environ. 2020, 710, 136298. [Google Scholar] [CrossRef] [PubMed]
- Ayoub, S.; Al-Shdiefat, S.; Rawashdeh, H.; Bashabsheh, I. Utilization of reclaimed wastewater for olive irrigation: Effect on soilproperties, tree growth, yield and oil. Agric. Water Manag. 2016, 176, 163–169. [Google Scholar] [CrossRef]
- Laurenson, S.; Bolan, N.; Smith, E.; McCarthy, M. Review: Use of recycled wastewater for irrigating grapevines. Aust. J. Grape Wine Res. 2011, 18. [Google Scholar] [CrossRef]
- Basheer, L.; Dag, A.; Yermiyahu, U.; Ben-Gal, A.; Zipori, I.; Kerem, Z. Effects of reclaimed wastewater irrigation and fertigation level on olive oil composition and quality. J. Sci. Food Agric. 2019, 99, 6342–6349. [Google Scholar] [CrossRef] [PubMed]
- Hirzel, D.R.; Steenwerthb, K.; Parikhc, S.J.; Oberholster, A. Impact of winery wastewater irrigation on soil, grape and wine composition. Agric. Water Manag. 2017, 180, 178–189. [Google Scholar] [CrossRef]
- Etchebarne, F.; Aveni, P.; Escudier, J.L.; Ojeda, H. Wine Reuse of treated wastewater in viticulture: Can it be an alternative source of nutrient-rich water? BIO Web Conf. 2019, 12, 01009. [Google Scholar] [CrossRef]
- Ferreira, A.; Herpin, U.; Monteiro, A.; Luiz, R.; Melfi, A.J. Agricultural use of treated sewage effluents: Agronomic and environmental implications and perspectives for Brazil. Sci. Agric. (Piracicaba, Braz.) 2007, 64, 194–209. [Google Scholar]
- Sobrinho, T.G.; Ramos, G.G. Growth of fertilized maize via fertirrigation and foundation with treated human urine and cassava wastewater. J. Agric. Sci. 2018, 10, 1916–9760. [Google Scholar] [CrossRef]
- Valdes, A.; Aguilera, E.N.; Tobón, G.; Samaniego, L.; Díaz, L.; Hernández, S.C. Potential uses of treated municipal wastewater in a semiarid region of Mexico. Sustainability 2019, 11, 2217. [Google Scholar] [CrossRef] [Green Version]
- Ayers, R.S.; Westcot, D.W. Water Quality for Agriculture. FAO Irrigation and Drainage paper Nº 29. FAO. Roma. p. 174. Available online: http://www.fao.org/3/t0234e/T0234E01.htm#note4 (accessed on 25 March 2020).
- WHO (World Health Organization). Guidelines for Drinking-Water Quality [Electronic Resource]: Incorporating First Addendum. Vol. 1, Recommendations, 3rd ed.; WHO: Geneva, Switzerland, 2006. [Google Scholar]
- Mohmmed, A. Residual Sodium Carbonate in Soil and Irrigation Water in Elsaggai Agricultural Scheme. Master’s Thesis, Sudan University of Science and Technology, Khartoum, Sudan, 2019. [Google Scholar]
- Ait-Mouheb, N.; Bahri, A.; Ben, B.; Benyahia, B.; Bourrié, G.; Cherki, B.; Condom, N.; Declercq, R.; Gunes, A.; Héran, M.; et al. The reuse of reclaimed water for irrigation around the Mediterranean Rim: A step towards a more virtuous cycle? Reg. Environ. Chang. 2018, 18, 693–705. [Google Scholar] [CrossRef]
- Urbano, P. Tratado de Fitotecnia General; Mundi-Prensa Libros: Madrid, Spain, 2015; p. 922. [Google Scholar]
- FAO. Water Quality Agriculture, Irrigation and Drainage 29; FAO: Rome, Italy, 1976; p. 97. [Google Scholar]
- Porras, J.; Thauvin, J. Aguas Subterráneas; Cuadernos del Centro Internacional de Formación en Ciencias Ambientales (CIFCA): Madrid, Spain, 1978; p. 81. [Google Scholar]
- Ajayi, F.; Nduru, M.; Oningue, A. Halting the salt that kills crops. Afr. Farmers 1990, 4, 10–12. [Google Scholar]
- Bauder, T.A.; Waskom, R.M.; Sutherland, P.L.; Davis, J.G. Irrigation Water Quality Criteria. Crops Series Irrigation. Fact Sheet nº 0.506. Colorado State University. 2014, p. 13. Available online: https://extension.colostate.edu/docs/pubs/crops/00506.pdf (accessed on 4 March 2020).
- FAO-UNESCO Soil Classification. Available online: http://www.arcgis.com/home/webmap/viewer.html?webmap=c7923f4d113d4750b3615f76c614db19 (accessed on 12 December 2019).
- Lantzke, N.; Calder, T.; Burt, J. Water Salinity and Plant Irrigation. Department of Primary Industries and Regional Development and the State of Western Australia. 2019. Available online: https://www.agric.wa.gov.au/fruit/water-salinity-and-plant-irrigation (accessed on 26 February 2020).
- Frenk, S.; Dag, A.; Yermiyahu, U.; Zipori, I.; Hadar, Y.; Minz, D. Seasonal effect and anthropogenic impact on the composition of the active bacterial community in Mediterranean orchard soil. FEMS Microbiol. Ecol. 2015, 91, 12. [Google Scholar] [CrossRef] [PubMed]
- EL-Shahawy, A.; El-Shatoury, S.; Bayomi, S.; El-Monayeri, D. Wastewater Disinfection Using Artificial Ultraviolet Rays Technology. In Unconventional Water Resources and Agriculture in Egypt. The Handbook of Environmental Chemistry 75; Negm, A., Ed.; Springer: Cham, Switzerland, 2018. [Google Scholar]
- Mhongole, O.J.; Mdegela, R.H.; Kusiluka, L.J.M. Characterization of Salmonella spp. from wastewater used for food production in Morogoro, Tanzania. World J. Microbiol. Biotechnol. 2017, 33, 42. [Google Scholar] [CrossRef] [PubMed]
- FAO. Healthy Soils Are the Basis for Healthy Food Production. 2015. Available online: http://www.fao.org/publications/card/en/c/645883cd-ba28-4b16-a7b8-34babbb3c505 (accessed on 18 February 2020).
- Zipori, I.; Erel, R.; Yermiyahu, U.; Ben-Gal, A.; Dag, A. Sustainable management of olive orchard nutrition: A review. Agriculture 2020, 10, 11. [Google Scholar] [CrossRef] [Green Version]
- Andrades, M.; Martínez, E. Fertilidad Del Suelo Y Parámetros Que La Definen, 34th ed.; Universidad de la Rioja: Logroño, España, 2014. [Google Scholar]
- Yañez, J. Análisis de suelos y su interpretación. Horticultura 1989, 49, 75–89. [Google Scholar]

Table 1.
Studio plots location and main characteristics of irrigation system.
| Vineyard | Olive Grove | |||||
|---|---|---|---|---|---|---|
| VC | V1 | V2 | OC | O1 | O2 | |
| Location | Mahora | Fuenteálamo | Valdeganga | Ontur | Fuenteálamo | Albatana |
| Type of Irrigation Water | WW | TW | TW | WW | TW | TW |
| Latitude (N) | 39°11′08″ | 38°41′35″ | 39°07′24″ | 38°37′28″ | 38°41′48″ | 38°34′34″ |
| Longitude (W) | 1°39′33″ | 1°28′27″ | 1°40′23″ | 1°30′32″ | 1°28′11″ | 1°28′09″ |
| Total Area (ha) | 7.7 | 4.8 | 4.3 | 10 | 1.5 | 3.2 |
| Monitored Area(m2) | 300 | 300 | 300 | 1000 | 1000 | 1000 |
| Distance Between Pipelines (m) | 3.30 | 2.70 | 3 | 3 | 3.75 | 3 |
| Distance Between Emitters (m) | 3.30 | 1 | 0.75 | 1 | 1 | 1 |
| Emitters Flow (L/h) | 2 | 2 | 3.5 | 3.5 | 4 | 2 |
| Irrigation (mm per year) | 100 | 100 | 100 | 100 | 100 | 100 |
TW: Treated wastewater; WW: well water. OC: control olive grove; O1 and O2: olive groves with TW irrigation; VC: control vineyard, V1 and V2: vineyards with TW irrigation.
Table 2.
Irrigation water composition.
| PARAMETER | UNIT | VALUE | p-Value | METODOLGY | ||||
|---|---|---|---|---|---|---|---|---|
| WCV (n = 6) | WCO (n = 12) | W1 (n = 12) | W2 (n = 6) | W3 (n = 12) | ||||
| EC | mS·cm−1 | 1.22 ± 0.04 a | 1.74 ± 0.09 a | 2.14 ± 0.09 c | 1.67 ± 0.10 b | 2.34 ± 0.43 c | <0.0001 * | Conductimety (1:5) |
| pH | 7.61 ± 0.14 a | 7.82 ± 0.15 ab | 7.98 ± 0.27 b | 7.92 ± 0.19 ab | 7.78 ± 0.25 ab | 0.0311 * | Potenciometry | |
| NO3− | mg·L−1 | 31.34 ± 2.71 ab | 4.13 ± 1.65 a | 2.50 ± 2.52 a | 12.78 ± 12.28 a | 51.94 ± 46.38 b | 0.0001 * | Spectrophotometry UV/VIS |
| CO3= | mg·L−1 | 4.00 ± 9.80 a | 2.00 ± 6.93 a | 17.00 ± 25.33 a | 16.00 ± 19.60 a | 8.40 ± 19.64 a | 0.2349 | Volumetry |
| HCO3− | mg·L−1 | 288.67 ± 28.51 a | 264.42 ± 34.13 a | 422.92 ± 93.39 b | 427.00 ± 57.14 b | 473.20 ± 130.30 b | <0.0001 * | Volumetry |
| SO4= | mg·L−1 | 260.17 ± 66.01 a | 465.83 ± 122.26 c | 426.42 ± 117.29 bc | 279.50 ± 66.11 ab | 431.00 ± 151.19 abc | 0.0095 * | Spectrophotometry UV/VIS |
| Cl− | mg·L−1 | 109.83 ± 4.45 a | 188.08 ± 6.63 b | 274.75 ± 33.75 c | 206.00 ± 32.86 b | 309.40 ± 63.64 c | <0.0001 * | Volumetry |
| K | mg·L−1 | 2.49 ± 0.85 a | 5.49 ± 2.77 a | 20.42 ± 3.83 b | 21.40 ± 9.21 b | 19.77 ± 8.98 b | <0.0001 * | Atomic absorption spectroph. |
| Na | mg·L−1 | 32.83 ± 13.80 a | 73.73 ± 18.27 ab | 120.40 ± 39.72 c | 95.50 ± 29.67 bc | 147.19 ± 56.89 c | <0.0001 * | Atomic absorption spectroph. |
| Mg | mg·L−1 | 55.50 ± 6.98 a | 73.06 ± 12.25 a | 119.62 ± 23.90 b | 84.50 ± 16.32 ab | 118.39 ± 37.46 b | <0.0001 * | Complexometry |
| Ca | mg·L−1 | 151.50 ± 26.68 ab | 217.50 ± 19.26 b | 160.83 ± 54.70 a | 127.33 ± 29.97 a | 174.50 ± 72.62 ab | 0.0129 * | Complexometry |
| NH4+ | mg·L−1 | (n.d.) ab | (n.d.) a | 16.43 ± 15.86 ab | 5.85 ± 7.83 ab | 22.21 ± 27.43 b | 0.0154 * | Volumetry |
| PO43− | mg·L−1 | 0.05 ± 0.12 ab | 0.06 ± 0.10 a | 7.34 ± 5.81 b | 8.87 ± 11.94 b | 4.83 ± 3.89 ab | 0.0044 * | Spectrophotometry UV/VIS |
| B | mg·L−1 | 0.10 ± 0.06 ab | 0.22 ± 0.09 a | 0.31 ± 0.10 ab | 0.29 ± 0.07 ab | 0.50 ± 0.29 b | 0.0001 * | Spectrophotometry UV/VIS |
| Organic Matter | mg·L−1 | 1.54 ± 0.74 a | 2.19 ± 1.87 a | 7.55 ± 4.39 b | 6.01 ± 1.66 ab | 7.33 ± 4.63 b | 0.0003 * | Permanganometry |
| TSS | mg·L−1 | 85.20 ± 99.46 a | 73.64 ± 19.39 a | 88.82 ± 21.77 a | 67.20 ± 28.76 a | 99.20 ± 35.73 a | 0.1864 | Gravimetry |
WCV: Control water (vineyards); WCO: Control water (olive groves); W1: Treated Wastewater (vineyard and olive grove); W2: Treated Wastewater (vineyard); W3: Treated Wastewater (olive grove). EC: Electrical Conductivity; TSS: Total Suspended Solids. (n.d.): not detected. Spectroph: Spectrophotometry Different lowercase letters indicate different groups with significant differences at p < 0.05 among treatments according to Tukey’s test. * Significant differences. Values are average ± standard deviation.
Table 3.
Average values of the secondary indexes.
| INDEX | |||||
|---|---|---|---|---|---|
| SAR | RSC | Hardness | Scott Index | ||
| UNIT | meq·L−1 | French Degrees | |||
| WCV | VALUE | 0.58 ± 0.24 | −8.00 ± −7.34 | 61.00 ± 5.14 | 18.55 ± 0.55 |
| CALIFICATION | n.a. | R | VH | G | |
| WCO | VALUE | 1.11 ± 0.26 | −12.46 ± 1.35 | 84.47 ± 6.21 | 10.92 ± 0.67 |
| CALIFICATION | n.a. | R | VH | T | |
| W1 | VALUE | 1.76 ± 0.58 | −10.36 ± 2.21 | 89.25 ± 6.55 | 7.67 ± 0.98 |
| CALIFICATION | n.a. | R | VH | T | |
| W2 | VALUE | 2.08 ± 0.73 | −10.43 ± 3.01 | 92.31 ± 12.44 | 7.00 ± 1.56 |
| CALIFICATION | n.a. | R | VH | T | |
| W3 | VALUE | 1.61 ± 0.49 | −5.75 ± 1.19 | 66.50 ± 1.76 | 10.17 ± 1.60 |
| CALIFICATION | n.a. | R | VH | T | |
SAR: Sodium Adsortium Ratio; RSC: Residual Sodium Carbonate (RSC) index. WCV: Control water (vineyard); WCO: Control water (olive grove); W2: Treated wastewater (vineyard); W3: Treated wastewater (olive grove); W1: Treated wastewater (vineyard and olive grove); n.a.: Not alkalizing; R: Recommendable; VH: Very hard; G: Good for irrigation; T: Tolerable for irrigation. Values are average ± standard deviation.
Table 4.
Differences among plots for soil composition.
| PARAMETER | Units | VC | OC | V1 | V2 | O1 | O2 | p-Value |
|---|---|---|---|---|---|---|---|---|
| Initial pH | -- | 8.60 | 8.30 | 8.70 | 8.50 | 8.40 | 8.35 | -- |
| Final pH | -- | 8.65 | 8.60 | 8.30 | 8.50 | 8.45 | 8.40 | -- |
| Initial Texture | (USDA) | Loam | Loam | Loam | Sandy clay loam | Clay loam | Sandy clay loam | -- |
| Final Texture | (USDA) | Sandy-loam | Sandy loam | Loam | Sandy loam | Loam | Loam | -- |
| EC | (mmhos·cm−1) | 0.25 ± 0.06 a | 0.28 ± 0.09 a | 0.47 ± 0.6 ab | 0.44 ± 0.9 ab | 1.13 ± 1.5 c | 0.99 ± 1.3 bc | 0.0124 * |
| Total N | (%) | 0.05 ± 0.01 a | 0.09 ± 0.01 c | 0.09 ± 0.03 c | 0.08± 0.02 b | 0.11 ± 0.02 d | 0.06 ± 0.02 a | <0.0001 * |
| Nitric N | (ppm) | 6.2 ± 4.5 a | 9.1 ± 6.0 a | 15.02 ± 22.5 ab | 18.3 ± 21.6 ab | 26.8 ± 29.9 c | 28.14 ± 29.8 c | 0.0146 * |
| P | (ppm) | 21.43 ± 5.2 a | 55.6 ± 13.1 c | 41.4 ± 11.5 b | 40.9 ± 8.6 b | 37.1 ± 13.9 b | 24.3 ± 8.3 a | <0.0001 * |
| K | (meq 100 g−1) | 0.83 ± 0.16 a | 0.82 ± 0.14 a | 1.22 ± 0.23 b | 1.17 ± 0.2 b | 1.43 ± 0.32 c | 0.75 ± 0.13 a | <0.0001 * |
| Na | (meq 100 g−1) | 0.38 ± 0.19 a | 0.41 ± 0.18 a | 0.59 ± 0.34 ab | 0.52 ± 0.25 ab | 0.84 ± 0.53 c | 0.72 ± 0.43 bc | 0.0010 * |
| Ca | (meq 100 g−1) | 37.9 ± 5.3 a | 37.3 ± 3.6 a | 38.8 ± 4.9 a | 37.0 ± 4.5 a | 39.4 ± 3.9 a | 37.0 ± 4.0 a | 0.5249 |
| Mg | (meq 100 g−1) | 1.5 ± 0.7 a | 2.6 ± 0.5 bc | 3.9 ± 1.4 d | 2.1 ± 0.7 b | 3.9 ± 0.9 d | 2.9 ± 0.9 c | <0.0001 * |
| Mn | (ppm) | 2.6 ± 0.9 a | 2.3 ± 0.8 a | 4.7 ± 2.7 b | 4.3 ± 1.3 b | 1.5 ± 0.6 a | 4.4 ± 3.3 b | <0.0001 * |
| B | (ppm) | 0.18 ± 0.18 a | 0.38 ± 0.22 b | 0.44 ± 0.15 b | 0.34 ± 0.29 ab | 0.34 ± 0.25 ab | 0.36 ± 0.32 b | 0.0809 |
| Fe | (ppm) | 1.19 ± 0.72 a | 2.12 ± 0.73 a | 0.97 ± 1.43 a | 0.97 ± 0.31 a | 0.58 ± 0.27 a | 2.96 ± 9.48 a | 0.4874 |
| Zn | (ppm) | 0.41 ± 0.13 ab | 5.85 ± 2.67 d | 0.76 ± 0.31 abc | 1.19 ± 0.38 c | 0.16 ± 0.07 a | 0.94 ± 0.61 bc | <0.0001 * |
| Cu | (ppm) | 0.62 ± 0.08 a | 2.02 ± 0.54 c | 1.43 ± 0.31 b | 0.79 ± 0.11 a | 0.57 ± 0.09 a | 2.6 ± 1.42 d | <0.0001 * |
| CEC | (meq 100 g−1) | 9.37 ± 2.3 b | 6.12 ± 1.72 a | 12.08 ± 2.53 c | 8.98 ± 1.69 b | 8.32 ± 1.63 b | 10.79 ± 1.78 c | <0.0001 * |
| Organic Matter | (%) | 1.14 ± 0.22 a | 1.87 ± 0.38 b | 1.88 ± 0.33 b | 1.37 ± 0.22 a | 1.23 ± 0.29 a | 2.09 ± 0.64 b | <0.0001* |
| C:N Ratio | 12.8 ± 3.4 a | 11.4 ± 2.5 a | 11.7 ± 3.5 a | 10.7 ± 3.4 a | 11.9 ± 4.2 a | 11.1 ± 3.3 a | 0.5743 |
VC: Control vineyard; OC: Control olive grove; V1 and V2: Treated wastewater irrigation (vineyard); O1 and O2: Treated wastewater irrigation (olive grove). EC: Electrical Conductivity; CEC: Cation Exchange Capacity Different lowercase letters indicate different groups with significant differences at p < 0.05 among treatments according to the LSD test. * Significant differences. Values are average ± standard deviation. Average concentration values are given on a dry weight basis.
Table 5.
Control water versus treated wastewater.
| PARAMETER | Units | WC (n = 18) | TW (n = 28) | TW/WC | p-Value |
|---|---|---|---|---|---|
| Electrical Conductivity | mS·cm−1 | 1.56 ± 0.26 a | 2.11 ± 0.37 b | 1.35 | <0.0001 * |
| pH | 7.75 ± 0.18 a | 7.89 ± 0.25 a | 1.02 | 0.0365 | |
| NO3− | mg·L−1 | 9.4 ± 12.5 a | 22.3 ± 35.6 b | 2.37 | 0.0465 * |
| CO3= | mg·L−1 | 2.67 ± 7.76 a | 13.7 ± 21.3 b | 5.13 | 0.0414 * |
| HCO3− | mg·L−1 | 272 ± 33 a | 442 ± 101 b | 1.63 | <0.0001 * |
| SO4= | mg·L−1 | 397 ± 145 a | 396 ± 132 a | 1.00 | 0.9865 |
| Cl− | mg·L−1 | 162 ± 38.4 a | 272 ± 61.4 b | 1.68 | <0.0001 * |
| K | mg·L−1 | 4.5 ± 2.7 a | 20.4 ± 7.1 b | 4.53 | <0.0001 * |
| Na | mg·L−1 | 60.09 ± 25.7 a | 124.6 ± 47.11 b | 2.07 | <0.0001 * |
| Mg | mg·L−1 | 67.2 ± 13.6 a | 112 ± 33.7 b | 1.67 | <0.0001 * |
| Ca | mg·L−1 | 196 ± 37 b | 159 ± 58 a | 0.81 | 0.0211 |
| NH4+ | mg·L−1 | 0.0 ± 0.0 a | 16.2 ± 20.2 b | -- | 0.0013 * |
| PO43− | mg·L−1 | 0.055 ± 0.10 a | 6.77 ± 6.8 b | 123.09 | 0.0002 * |
| B | mg·L−1 | 0.18 ± 0.09 a | 0.37 ± 0.21 b | 2.05 | 0.0006 * |
| Organic Matter | mg·L−1 | 1.97 ± 1.6 a | 7.14 ± 3.94 b | 3.62 | <0.0001 * |
| SAR | 0.93 ± 0.35 a | 1.84 ± 0.62 b | 1.98 | <0.0001 * | |
| Hardness | French degrees | 76.6 ± 12.7 a | 85.5 ± 13.4 b | 1.12 | 0.0322 * |
| Scott Index | 13.4 ± 3.7 b | 7.9 ± 1.79 a | 0.59 | <0.0001 * |
WC: VC + OC; TW: V1 + W2 + W3. EC: Electrical Conductivity; CEC: Cation Exchange Capacity. Different lowercase letters indicate different groups with significant differences at p < 0.05 among treatments according to Tukey’s test. * Significant differences. Values are average ± standard deviation.
Table 6.
Differences between the control soils (CS) versus soils irrigated with treated wastewater (TW).
Table 6.
Differences between the control soils (CS) versus soils irrigated with treated wastewater (TW).
| Units | CS | TW | TW/CS | p-Value | |
|---|---|---|---|---|---|
| n = 34 | n = 68 | ||||
| EC | (mmhos·cm−1) | 0.26 ± 0.08 a | 0.76 ± 1.1 b | 2.92 | 0.0100 * |
| Total N | (%) | 0.075 ± 0.03 a | 0.088 ± 0.03 b | 1.17 | 0.0217 * |
| Nitric N | (ppm) | 7.64 ± 5.44 a | 22.15 ± 26.13 b | 2.90 | 0.0019 * |
| P | (ppm) | 38.51 ± 19.92 a | 35.75 ± 12.69 a | 0.93 | 0.3940 |
| K | (meq 100 g−1) | 0.83 ± 0.15 a | 1.14 ± 0.33 b | 1.37 | <0.0001 * |
| Na | (meq 100 g−1) | 0.39 ± 0.18 a | 0.67 ± 0.41 b | 1.72 | 0.0004 * |
| Ca | (meq 100 g−1) | 37.63 ± 4.44 a | 38.03 ± 4.40 a | 1.01 | 0.6652 |
| Mg | (meq 100 g−1) | 2.01 ± 0.80 a | 3.21 ± 1.25 b | 1.60 | <0.0001 * |
| Mn | (ppm) | 2.46 ± 0.88 a | 3.68 ± 2.54 b | 1.50 | 0.0081 * |
| B | (ppm) | 0.28 ± 0.22 a | 0.36 ± 0.25 a | 1.29 | 0.1179 |
| Fe | (ppm) | 1.65 ± 0.85 a | 1.36 ± 4.75 a | 0.82 | 0.7222 |
| Zn | (ppm) | 3.13 ± 3.32 a | 0.75 ± 0.54 b | 0.24 | <0.0001 * |
| Cu | (ppm) | 1.32 ± 0.81 a | 1.34 ± 1.06 a | 1.01 | 0.9458 |
| CEC | (meq 100 g−1) | 7.75 ± 2.59 a | 10.01 ± 2.42 b | 1.29 | <0.0001 * |
| Organic Matter | (%) | 1.51 ± 0.49 a | 1.64 ± 0.53 a | 1.09 | 0.2077 |
| C:N Ratio | 12.09 ± 3.25 a | 11.35 ± 3.59 b | 0.94 | 0.3165 |
CS: OC + VC; TWS: O1 + O2 + V1 + V2). EC: Electrical Conductivity; CEC: Cation Exchange Capacity. Different lowercase letters indicate different groups with significant differences at p < 0.05 among treatments according to Tukey’s test. * Significant differences. Values are average ± standard deviation. Average concentration values are given on a dry weight basis.
Table 7.
p-values for type of water (1), type of crop (2) and interaction (1)–(2) in soil chemical components.
Table 7.
p-values for type of water (1), type of crop (2) and interaction (1)–(2) in soil chemical components.
| FACTOR | n | EC | Total N | Nitric N | K | Na | Mg | Mn | Zn | CEC |
|---|---|---|---|---|---|---|---|---|---|---|
| Type Of Water (1) | 34 | 0.0086 * | 0.0118 * | 0.0017 * | <0.0001 * | 0.0003 * | <0.0001 * | 0.0056 * | <0.0001 * | <0.0001 * |
| Type Of Crop (2) | 68 | 0.0868 | 0.0003 * | 0.1303 | 0.2751 | 0.0832 | 0.0012 * | 0.0315 * | <0.0001 * | <0.0001 * |
| (1)–(2) | 0.1239 | 0.0001 * | 0.3760 | 0.4072 | 0.2017 | 0.1563 | 0.1501 | <0.0001 * | 0.0209 * |
EC: Electrical Conductivity; CEC: Cation Exchange Capacity. *Significant differences at p < 0.05 among treatments according to the Tuckey test.
© 2020 by the authors. Licensee MDPI, Basel, Switzerland. This article is an open access article distributed under the terms and conditions of the Creative Commons Attribution (CC BY) license (http://creativecommons.org/licenses/by/4.0/).
Share and Cite
MDPI and ACS Style
De las Heras, J.; Mañas, P. Reclaimed Wastewater to Irrigate Olive Groves and Vineyards: Effects on Soil Properties. Agronomy 2020, 10, 649. https://0-doi-org.brum.beds.ac.uk/10.3390/agronomy10050649
AMA Style
De las Heras J, Mañas P. Reclaimed Wastewater to Irrigate Olive Groves and Vineyards: Effects on Soil Properties. Agronomy. 2020; 10(5):649. https://0-doi-org.brum.beds.ac.uk/10.3390/agronomy10050649
Chicago/Turabian StyleDe las Heras, Jorge, and Pilar Mañas. 2020. "Reclaimed Wastewater to Irrigate Olive Groves and Vineyards: Effects on Soil Properties" Agronomy 10, no. 5: 649. https://0-doi-org.brum.beds.ac.uk/10.3390/agronomy10050649
Note that from the first issue of 2016, this journal uses article numbers instead of page numbers. See further details here.