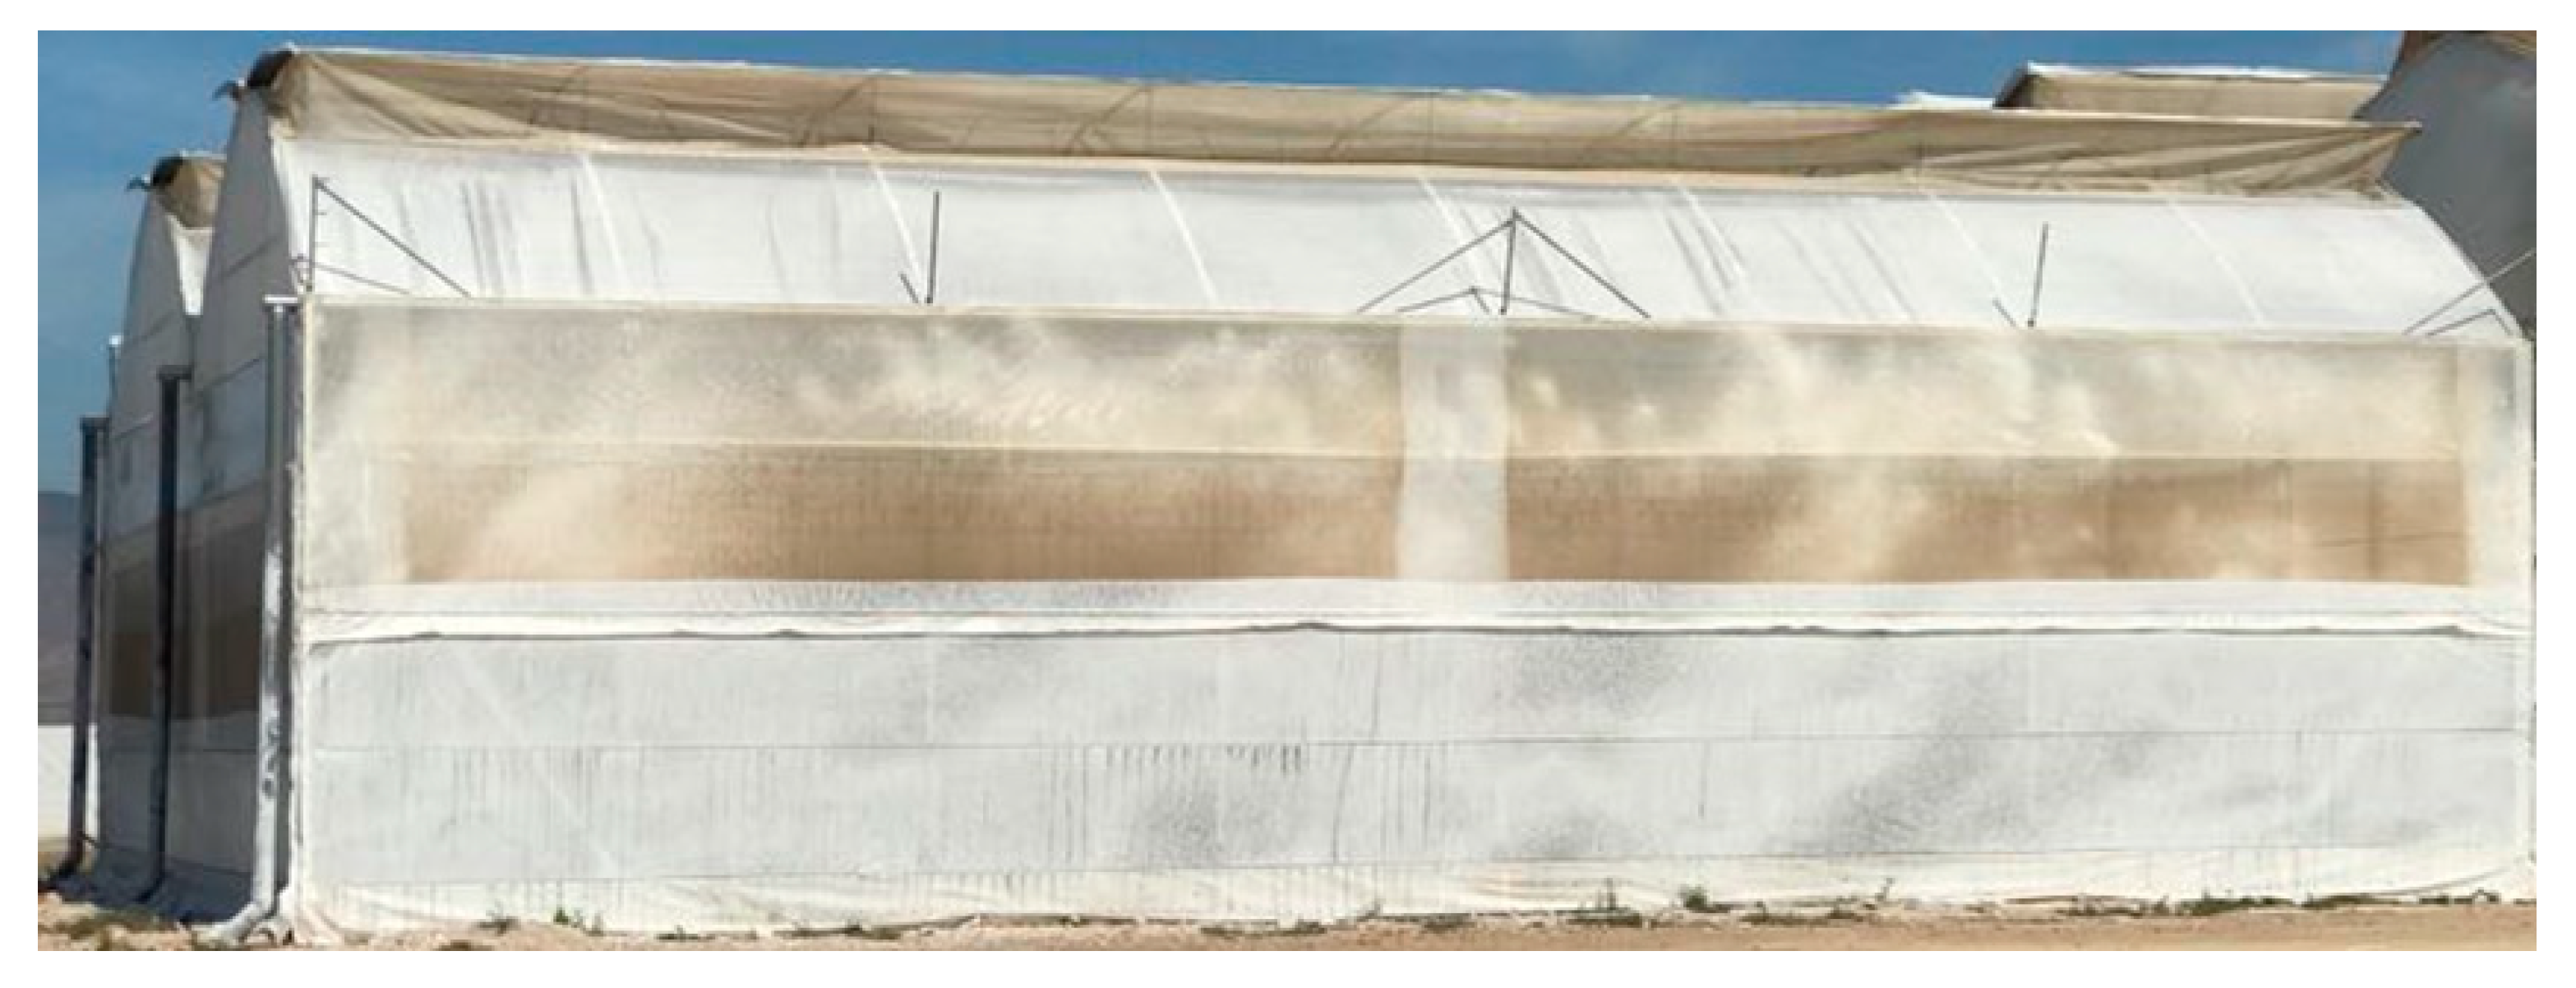
Article

Evaluation of an Adapted Greenhouse Cooling System with Pre-Chamber and Inflatable Air Ducts for Semi-Arid Regions in Warm Conditions

by
José M. Cámara-Zapata
1,*,
Jorge Antonio Sánchez-Molina
2,
Hui Wang
3,
Angel Carreño-Ortega
4 and
Francisco Rodríguez
2
1
Water and Energy for Sustainable Agriculture Research Group, Department of Applied Physic, University Miguel Hernández, 03202 Elche, Spain
2
The Automatic Control, Robotics and Mechatronics Research Group, Department of Informatics, ceiA3, CIESOL, University of Almeria, 04120 Almeria, Spain
3
Institute of Plant and Environment Protection, Beijing Academy of Agriculture and Forestry Sciences, Beijing 100097, China
4
Department of Engineering, University of Almeria, 04120 Almeria, Spain
*
Author to whom correspondence should be addressed.
Submission received: 8 April 2020 / Revised: 10 May 2020 / Accepted: 22 May 2020 / Published: 23 May 2020

Abstract

:
The growing needs for fruit and vegetable production, together with the current climate change situation, make agriculture under plastic and greenhouse cooling indispensable. The most commonly used approaches are natural ventilation, shading and fan-pad systems. To foster a climate that allows forplant production under cover in extreme conditions, a novel fan-pad system has been devised that incorporates a pre-chamber and an air distribution system using air ducts running alongside the crop rows. The system has been tested in a greenhouse in Almeria (Spain) during the daytime in August, when the weather was hotter. Tests were also carried out in combination with natural ventilation and shading. The results indicate that the fan-pad system was efficient under extreme weather conditions and that it avoided creating horizontal thermal gradients. By determining the theoretical value of the air temperature leaving the pad, we were able to estimate the evaporative cooling potential of the fan-pad system as a function of the outdoor climate. Under extreme conditions, the fan-pad system’s efficiency decreased along with increased air temperature and, above all, the increased relative humidity of the outside air. When the outdoor climate is warm and humid, natural ventilation may be the most efficient temperature control method. If the outdoor climate is warm and dry, the evaporative pad is more effective, especially when combined with shading.

1. Introduction

Greenhouses are built to protect crops from inclement weather and to increase crop quality [1,2]. In warm climates, greenhouses are specially adapted to agricultural production during the cold and mild periods of the year. However, high summer temperatures impair crop development [3]. In arid and semi-arid areas, summer is characterized by temperatures that can exceed 40 °C and relative humidity levels below 30% during the day [4]. For this reason, strategies aimed at reducing the air temperature inside the greenhouse have been developed for the hottest times of the year.
In the case of greenhouses in semi-arid climates, the most commonly used cooling systems are natural ventilation and shading, due to their low economic cost. However, natural ventilation has the inconvenience of pests and/or vectors of disease entering the greenhouse, so the air vents need to be protected with anti-insect screens, which can reduce air renewal to inadequate levels [5,6]. During the hottest months of the year (April to September), ventilation is usually combined with greenhouse roof whitening, which reduces radiation inside to values ranging from 30% to 50% that of the outside, albeit with little homogeneity [7,8]. Other drawbacks of whitening include the level of constant shading throughout the day, the high water consumption required to remove it, the need to repeat the whitening operation in the case of rain and the reduction in the cover’s lifespan [9]. The use of fixed shading screens allows one to choose the proportion of radiation inside the greenhouse and provides more homogeneous shading. However, as with whitening, the shade screens produces a constant shade and, if it they installed inside the greenhouse, the ventilation rates are reduced [10]; if outside, they can be mobile, although these also have drawbacks, such as the cost incurred for their installation and the increased loads on the greenhouse structure itself [11,12].
To overcome these problems, numerous cooling systems have been designed, amongst which are evaporative cooling techniques, which can be grouped into: direct evaporative cooling, indirect or roof evaporative cooling and two-stage cooling [13]. The direct evaporative cooling group includes the fan-pad and misting systems. The fan-pad system allows greater temperature reduction due to better air saturation efficiency although with lower homogeneity in the temperature distribution [13,14]. The horizontal temperature gradient characteristic of the fan-pad system is reduced when air distribution is carried out using perforated inflatable air ducts [15]. The main problems with these systems are water and energy consumption (higher in the misting system), which also involve greater economic investment and require higher quality water [16]. To optimise the operation of the fan-pad system, the effect of factors such as climate [17], water and air flow [18], material characteristics [19] and different evaporative cooling designs have been analysed [20]. Another strategy with acceptable results is to spray water on the greenhouse cover, and combining this with shading screens [21]. Two-stage evaporative cooling and mixed mode cooling have also been studied, where the fan-pad system is combined with heat recuperators, liquid desiccants and/or water recuperators, obtaining interesting interior temperature reduction values that vary depending on the design and location of the greenhouse [22,23]. The results from these works have been collected in various specific reviews [13,16,24].
Combining different cooling systems (evaporative cooling, natural ventilation and shading) can reduce the greenhouse energy requirements and provide the optimal conditions for plant production under cover in hot climates [17,24]. Therefore, to characterise a fan-pad system under field conditions requires analysing the effect of the other systems on the pad’s operating parameters and establishing the existence of synergies and/or incompatibilities. In general, the goal is to cool the total mass of air inside the greenhouse. However, it would be interesting to consider the cooling around the crop to better take advantage of the fan-pad system features. The main contribution of this work is the analysis and evaluation of a novel fan-pad system that consists of a pre-chamber after the pad, regulating the input of treated air into the inflatable air duct distribution system running next to the crop rows. In addition, this system is combined with natural ventilation and shading to establish synergies and/or incompatibilities between the most common cooling systems, and is used in extreme weather conditions. The objective is to establish the feasibility of this new fan-pad system for cooling greenhouses in desert areas with extreme weather conditions.

2. Materials and Methods

2.1. Greenhouse, Crop, Sensors and Actuators

Between March and September 2017, a pepper crop was grown in a gothic-form greenhouse located at the TECNOVA Foundation experimental farm [25] in Almería, Spain (36–54′19″ N 2–21′29″ W). The growing system used was on sand with paired crop rows 1.6 m apart from each other. The separation distance was 0.75 m between the growing rows of the same pair and 0.5 m between the plants within the same crop row, making the planting density 2.5 plants m−2. Interline drippers with a unit flow rate of 3.0 L h−1 were used. The greenhouse has two spaces, each 8.0 m wide and 22.5 m long with a height of 4.0 m to the gutter and 5.5 m to the roof apex. The roof runs from south to north, and crop rows are aligned east to west. As regards the actuators, the greenhouse has a surface area of 220 m2 automatically ventilated with windows placed in the west and south walls and two roof-flap windows in each span. Furthermore, 20 × 10 threads cm−1 bionet anti-insect mesh screens are installed in each window (Figure 1). The system is governed by three AC-motors: one for the roof windows (400 kW) and one for each side window (600 kW). Moreover, a shading screen with 40% transmissivity is located inside at a height of 4 m and governed by a 1.2 kW AC-motor.

2.2. Greenhouse Cooling System with Evaporative Chamber and Inflatable Air Ducts

The greenhouse has a novel fan-pad system with a pre-chamber and air distribution using six perforated air ducts distributed between the crop rows. To reduce the horizontal temperature gradient inside the greenhouse, the fan-pad system and the cooling chamber are installed on the south side of the greenhouse. The pad dimensions (CELdek 7060−15, Munters, Stockholm, Sweden) are 1.5 m high, 7 m long with a thickness of 0.1 m. Two pads are used to cool the greenhouse, with a total length of 14 m. The lower edge of the pad is located 1.0 m from the ground (1, Figure 2A).
The pre-chamber facilitates the flow of cooled air into the greenhouse due to its dimensions and its rectangular triangular-prism shape. Its depth at ground level is 1.8 m, with a width of 16.0 m and a height of 4.0 m (2, Figure 2A). On its lower transversal edge, six extractors with a maximum unit capacity of 6000 m3 h−1 are installed, which can replenish the air up to 20 times per hour (3, Figure 2A). This fan-pad system value is considered a reasonable compromise between cooling and water consumption [26].
Each extractor is connected to a flexible 0.6 m diameter transparent polyethylene air duct. These air pipelines run through the greenhouse between each pair of adjacent crop rows, resting on the ground (Figure 2B). The ducts are 17.0 m long and are drilled every 0.5 m with four small holes (0.02 m in diameter) allowing the cooled air from the cooling pre-chamber to be directed close to the plants.

2.3. Sensors and Data Collection System

For the data collection, ventilated temperature and humidity sensors (Higro Botón, Plug&Track, Willems, France) and radiation sensors (LI−190R, LI-COR, Lincoln, Nebraska, USA) were placed in the central greenhouse area. The temperature and humidity sensors were positioned at a height of 1.5 m above the ground to determine the effect of the fan-pad system on the crop environment, while the radiation sensor was installed 2.0 m above the ground (Figure 3). A ventilated temperature and humidity sensor (Higro Botón, Plug&Track, Willems, France) was also installed above a distribution line, 1.0 m from the ground and 1 m from the end of the inflatable air ducts. In the central area of the pre-chamber, at a height of 1.5 m, ventilated temperature and humidity sensors were placed (Higro Botón, Plug&Track, Willems, France). A temperature sensor was installed inside the fan-pad system’s water supply tank.
The experimental facility where the tests were carried out has a weather station (HortiMaX, West Sussex, England) that provides temperature, relative humidity, solar radiation, wind speed and wind direction data from outside the greenhouse. All the climate data are recorded every minute.

2.4. Analysis of the Fan-Pad System Operation

The saturation efficiency value of the fan-pad system (EFI, %) was determined using the expression:
EFI = 100·(To − Tc)/(To − Twb),
Abbreviations and subscripts are explained in the appendix. Similar to the EFI value, the fan-pad system’s evaporative performance (EP, %) was defined by the relationship between the actual mass of evaporated water in the pad and the maximum possible that could evaporate from the initial state of the outside air:
EP = 100·(ωc − ωo)/(ωwb − ωo),
The mass of evaporated water per unit of air mass circulating through the pad, or the specific mass, mw/ma (kg kg−1), is:
mw/ma = (ωc − ωo),
The mass of evaporated water per unit of air mass, of time, of pad area, of temperature increase, or unit mass, pw (g kg−1 h−1 m−2 °C−1), is:
pw = 60·mw/[ma·t·A·(To − Tc)],
The sensible heat per unit of treated air mass, qs (J kg−1), is:
qs = (hac + ωc·cvc·Tc) − (hao + ωo·cvo·To),
The latent heat per unit of treated air mass, ql (J kg−1), is:
ql = ωc·Lvc − ωo·Lvo,

2.5. Testing Schedule

In order to analyse the fan-pad system under the most demanding conditions and to reduce the influence of the solar radiation variation, the tests were carried out in the central hours of the day during August. The values of the properties indicate the extreme conditions typical of a Mediterranean climate during a summer period, the average maximum temperature for Almeria in August being 29 °C with a minimum of 22 °C [27]. The tests are designed to determine the effect of the fan-pad system and the other actuators on the greenhouse climate, both separately and together, under different climatic conditions. The schedule was as follows:
  • Test 1 (Fan-pad system, P). In the initial state, the ventilation is closed, the shading screens are drawn back and the temperature is constant. The fan-pad system is then activated until the temperature and humidity remain constant.
  • Test 2 (Increased ventilation, V > 0). In the initial state, the ventilation is closed, the shading screens are drawn back and the temperature is constant. The greenhouse is then ventilated in 20% steps for 20-min periods until the temperature and humidity remain constant.
  • Test 3 (Reduced ventilation, V < 0). In the initial state, the ventilation is completely open, the shading screens are drawn back and the temperature is constant. The ventilation is then closed in 20% steps for 20-min periods until the temperature and humidity remain constant.
  • Test 4 (Shading screens, S). In the initial state, the ventilation is closed, the shading screens are drawn back and the temperature is constant. Then, the shading screens are opened out for 2 h.
  • Test 5 (Ventilation and shading screens, V + S). In the initial state, the ventilation is completely open, the shading screens are drawn back and the temperature is constant. Then, the shading screens are opened out for 2 h.
  • Test 6 (Fan-pad system and ventilation, P + V). In the initial state, the ventilation is completely open, the shading screens drawn back and the temperature is constant. The fan-pad system is then activated until the temperature and humidity remain constant.
  • Test 7 (Fan-pad and shading system, P + S). In the initial state, the ventilation is closed, the shading screens are opened and the temperature is constant. The fan-pad system is then activated until the temperature and humidity remain constant.
  • Test 8 (Fan-pad system, ventilation and shading, P + V + S). In the initial state, the ventilation is completely open, the shading screens are opened and the temperature is constant. The fan-pad system is then activated until the temperature and humidity remain constant.
  • Tests 9–16. Repeat of tests 1 to 8.
Table 1 shows the tests performed, their start and end time, the status of each actuator during the test (0: Off; 1: On) and the average outdoor air property values during the tests (temperature, T, relative humidity, RH, solar radiation, R, wind speed, v, and wind direction, D).
In general, the tests took place on sunny days with little wind. The roof opening and closing tests (V > 0 and V < 0, respectively) were carried out in dry and humid weather. The shading (S) tests took place when the weather outside was dry. The outdoor weather was sunny and dry in the fan-pad system (P) tests and when combined with shading (P + S). In the P tests, which included ventilation (P + V and P + S + V), the weather was humid.

3. Results

3.1. Characterization of the Fan-Pad System Operation

To improve operational understanding of the new fan-pad system (with distribution air ducts) used in this work, we first analysed the effect of the fan-pad system on the greenhouse. A psychrometric assessment was then performed, indicating that the treated air not only experienced evaporative cooling in the pad, but also that heating occurred in the pre-chamber. Different operating parameters for the fan-pad system were then determined to quantify the sensible and latent energy transfers and to relate their value to the outside climate. Finally, the theoretical functioning of the fan-pad system was analysed to establish its possible application to greenhouse cooling under extreme conditions.

3.1.1. Effect of the Fan-Pad System on the Temporal Climate Evolution in the Greenhouse

Figure 4 shows the evolution over time of T and RH, both outdoors and inside the greenhouse, during test 1. The temporal evolution of ωg presents a maximum value at 8 min from the start of the test, followed by a rapid decrease (data not shown). At that instant, the Tg and RHg began to vary, probably due to the transient nature of the process.
Initially, the values in the greenhouse of T, Tg, and RHg were greater than those recorded outside, To and RHo. The performance of the fan-pad system over 50 min caused a 3.7 °C reduction in Tg, until it reached a value similar to that of To. For the first 8 min, Tg and RHg barely changed. During the next 20 min, the fan-pad system modified the Tg from 35.1 to 30.5 °C in 28 min, while the RHg increased from 68% to 73%.

3.1.2. Psychrometric Assessment of the Fan-Pad System with Distribution Air Ducts

Figure 5 represents the variation in the state of the outside air (red), the air in the cooling chamber (blue), the air transported by the inflatable air ducts (orange) and the air inside the greenhouse (green) during test 1. Initially, the To value was similar to that of the pre-chamber, Tc (31.2 °C and 30.7 °C, respectively) while Tg was higher, and at the end of the air ducts, Td was slightly higher (35.1 °C and 36.3 °C, respectively). These are extreme values due to the insulation of the greenhouse prior to test 1.
When circulating through the pad, the air undergoes evaporative cooling at the adiabatic constant saturation temperature, i.e., at the wet bulb temperature, Twb, which is approximately constant. The result is an increase in its specific humidity (ω, kg kg−1), a decrease in its T and a slight increase in its RH. The evaporative cooling is represented in Figure 5 by the red slanted arrow. Its extreme indicates the theoretical value of the air T at the output of the pad, Tp, even though the value of Tc is higher. The difference between the state of the air at the pad outlet and in the pre-camera is due to energy transfer, represented by the red horizontal arrow (ω = cte). The explanation for this pre-chamber air heating is found in the elevated SR value during the test, the fan-pad system’s installation on the south side of the greenhouse and the pre-chamber’s insufficient thermal insulation.
Except at the initiation of test 1, there was great similarity between the evolution of the air state in the pre-chamber and at the end of the distribution air ducts (blue and brown lines, respectively). Therefore, this distribution system eliminates the high horizontal thermal gradient that is characteristic of a conventional fan-pad system. Over the test period, the air in the greenhouse cooled and its moisture content decreased (green line).

3.1.3. Fan-Pad System Operating Parameters

The average value of To–Tc during test 1 was 3.5 °C and the average value of Tg was 0.3 °C higher than To (Table 2). The saturation efficiency values (EFI, %) and the sensible heat per unit of treated air mass (qs, kJ kg−1) were 32.1% and 1.9 kJ kg−1, respectively.
The average evaporative yield values (EP, %), latent heat per unit of driven air mass (ql, kJ kg−1), evaporated water mass per unit of treated air mass (mw/ma, kg kg−1), and the evaporated water mass per unit of air mass, time, pad area and temperature variation between the outside and the pre-chamber (pw, kg kg−1 h−1 m−2 °C−1) were 34.7%, 17.0 kJ kg−1, 0.007 kg kg−1 and 0.006 kg kg−1 h−1 m−2 °C−1, respectively. These results can be considered characteristic of a fan-pad system in a warm dry climate (Table 1). When comparing the values of variables related to changes in T (EFI and qs) with those of variables related to the evaporated water mass (EP, ql, mw/ma and pw), one can infer that the former are unsatisfactory. This may be due to the fan-pad being sited on the south-facing side of the greenhouse and the high SR value during the test, which caused an increase in the air T in the pre-chamber and reduced the fan-pad system’s effectiveness.
A relationship between the EP and mw/ma values can be obtained from Equations (2) and (3). Figure 6 shows the linear regressions between both variables for different RHo values. Table 3 shows the values for the slope (A) and the ordinate origin (B). The greater mw/ma values correspond to low EP values and are obtained when the RHo is low. The mw/ma values decrease as the RHo increases. The lowest mw/ma values and the highest EP are presented when the RHo is elevated.
From the linear regressions shown in Table 3, it is possible to determine the mw/ma value as a function of the exterior air state. Figure 7 shows the variation in mw/ma as a function of the To for different RHo values. To analyse the behaviour of the fan-pad system under extreme weather conditions, the To interval between 30.0 and 40.0 °C was chosen. The results indicate that the highest mw/ma values occur in dry climates, regardless of the To value. The mw/ma values decrease when both the To, and, above all, the RHo increase. Thus, the value of 0.005 kg kg−1, when To is 30.0 °C and RHo is 30%, reduces to 68% of that value by increasing To to 40.0 °C if the RH is maintained, but decreases to 26% of its initial value if the RH increases to 75% and To is kept constant; it reduces to 13% when the To increases to 40.0 °C and the RHo increases to 75%.
The reduction in mw/ma due to the increase in To is more pronounced as the climate becomes drier. The intensity of the decrease in the mw/ma value due to the increased RHo is lower as the To increases.

3.1.4. Evaporative Cooling Analysis

From the greenhouse cooling standpoint, the most important process that the air experiences in the fan-pad system is evaporative cooling. In the pre-chamber, warming takes place, as represented by a red horizontal arrow in Figure 4. A reduction in the Tc value improves the greenhouse cooling effectiveness of the fan-pad system although this requires increased thermal insulation of the pre-chamber and represents an increase in cost. To decide on the suitability of this technical improvement, one needs to know the maximum evaporative cooling value possible as a function of the outside climate.
In the process experienced by the air as it passes through the pad, the stationary mass and energy balances can be expressed as:
hp (J kg−1) = (ωp − ωo)·hw + ho,
where hp is the specific enthalpy (h, J kg−1) of the air resulting from the pad treatment, the first sum representing the transfer of energy from the liquid water to the unit mass of the treated air, in J kg−1, and ho is the specific enthalpy of the outside air.
Evaporative cooling takes place on the pad and there is no liquid water in the pre-chamber so the ωp value coincides with that of ωc, which can be determined using Equation (3). Therefore, Equation (7) allows us to obtain the hp value from the state of the outside air. Having obtained the values for these two air properties at the pad outlet, you can determine the T value in that state, Tp. The results based on the outdoor air properties are shown in Figure 8.
If the RHo value is kept constant, the relationship between the To and the Tp values is a linear regression. Table 4 shows the values of the slope (A) and the origin ordinate (B). The Tp values decrease along with both the To and RHo values. The lower Tp values occur in dry climates, regardless of the To value. The increase in Tp, due to an increase in To, is more pronounced as the climate gets drier. The intensity of the increased Tp value, due to the increase in RHo, gets lower as the To increases. In short, the behaviour of Tp as a function of the outside climate is contrary to that encountered when analysing that of mw/ma (Figure 7).
The behaviour of the evaporative cooling value, To–Tp, in function of the state of the outside air is similar to that described for mw/ma. Thus, To–Tp has a value of 11.4 °C when To is 30.0 °C and the RHo is 30%; this is reduced to 7.5 °C if the To is 40.0 °C and the RH is 30%, decreases to 2.4 °C if the To is 30.0 °C and the RH is 75% and finally reduces to 1.1 °C when the To is 40.0 °C and the RHo is 75% (Figure 9).
The great similarity between the mw/ma value and the evaporative cooling value is a consequence of the Tp value only being due to the evaporative cooling in the pad. Thus, the relationship between To–Tp and mw/ma is equal to the ratio between the latent heat of water vaporization, Lv, and the specific heat of the dry air, ca, which remains practically constant, regardless of the RHo value (Lv/ca ≈ 2430 kg °C kg−1).

3.2. Evaporative Pad Behaviour in Combination with the other Actuators

The complete operational analysis of the new fan-pad system used in this work needs to be studied in combination with the most used cooling systems, natural ventilation and shading. First, the test results using natural ventilation and shading are presented, both separately and together. Then, the test results for the fan-pad system used in combination with both actuators are presented.

3.2.1. Effect of Natural Ventilation and Shading Screens on the Greenhouse Climate

Natural Ventilation

Figure 10 represents the effect on Tg of a staggered ventilation dynamic (tests 2 and 9). The greenhouse was initially kept closed for 20 min (between 13:00 and 13:20 h). A 20% opening for 15 min (between 13:20 and 13:40 h) resulted in a 3.0 °C reduction in the Tg value. The total reduction in Tg over 100 min of ventilation (between 13:20 and 15:00 h) was 6.3 °C in test 2 and 4.7 °C in test 9. The wettest outdoor climate during test 2 (Table 1) allowed for a greater decrease in the Tg.
When closing the greenhouse, the increase in Tg varied as a function of the outside climate. Thus, during test 3, the outdoor climate was hot, dry and sunny, and the increase in Tg was double that recorded in test 10, with a lower To value, greater RHo and less SR. On the other hand, the RHg also increased during test 3 although this effect was not seen in test 10. Due to its larger RHo, the outside air required more energy to increase its T when entering the greenhouse in test 10 than in test 3. However, in test 10 there was less energy available since the average SR value was 570 W m−2 whereas in test 3, it was 890 W m−2. This would explain the lower Tg values and higher RHg values during test 10. In test 3, the Tg was greater due to the higher SR and the lower RHo.

Shading Screens

The weather outside was warm and dry during tests 4 and 11, which determined the effect of shading on the Tg. Consequently, Figure 11 shows only the temporal climate evolution during test 11.
Prior to the test, the greenhouse was kept closed for 2 h, so the initial Tg and RHg values were elevated. The shading screen reduced the difference between Tg and To from 5.0 to 2.0 °C in 1 h in test 11. In test 4, the greenhouse cooling was slightly lower due to the higher SR value (Table 1).

Natural Ventilation and Shading Screens

In test 5, the outdoor climate was dry, and the SR value was high, so the evolution of the Tg increased slightly and showed some divergence from the evolution of To, which was practically constant. In test 12, the outdoor climate was humid and the SR value low, so the evolution of the Tg descended and tended to converge with the evolution of To, which also descended (Figure 12).

3.2.2. Effect of Combining the Fan-Pad System with Natural Ventilation

Before starting trials 6 and 13, maximum roof ventilation was maintained in the greenhouse for 2 h. The results in both tests were very similar due to the outdoor climate, which was practically identical: warm, humid and sunny (Table 1). Therefore, Figure 13A shows the results of test 6. When using the fan-pad system, the evolution of the Tg value was a function of Tc; thus, it is considered appropriate to use the psychrometric diagram to improve the analysis of combining actuators with the processes developed in the pre-chamber.
The initial Tg was 30.1 °C, decreasing to its minimum value of 28.7 °C in 17 min, where it remained virtually constant until the end of the test. The high SR value resulted in high crop transpiration that increased the ωg value (green line; 19 g kg−1) slightly above the ωd value (orange line; 18 g kg−1) and the ωo value (red line; 15 g kg−1). On the other hand, there were hardly any differences between the air state in the pre-chamber and at the end of the distribution air duct (Figure 13A).
Under the test conditions, the effect of natural ventilation was limited due to the low vo value (Table 1) and the high ωg value (Figure 13A). Combining the fan-pad system with natural ventilation presented difficulties in reducing the Tg. Thus, the average Tg value was 1.6 °C greater than that for To, and that of Tc was 1.4 °C less than that for To. The average EFI value was 29.2% and the EP value was 34.5% (Table 5).

3.2.3. Effect of Combining the Fan-Pad System with the Shading Screens

The greenhouse remained closed and shaded for 2 h before the start of the trial, which explains the high initial Tg and RHg values (33.3 °C and 84%, i.e., an initial ωg value of 28 g kg−1; Figure 13B). Under these conditions, pad activation for 20 min reduced the Tg and RHg to 28.4 °C and 75%, representing a ωg of 18 g kg−1. The Tg was constant for the first 6 min while the RHg decreased to 74% in the first 10 min.
The combined pad and shade action resulted in a drop of 6.2 °C in the Tc and of 3.1 °C in the Tg with respect to To. Environmental humidity in the greenhouse decreased with evaporative cooling. This might be because of its high initial value given the absence of ventilation, and because the outdoor climate was warm and dry during the test (Table 1).

3.2.4. Effect of Combining the Fan-Pad System with Natural Ventilation and Shading Screens

The greenhouse was maintained with maximum roof ventilation and shading from 2 h before starting the tests. Thus, the initial Tg value was 30.5 °C, which was above the To (28.9 °C; Figure 13C). The Tg began to decrease after 2 min of evaporative pad operation, reaching a value of 28.6 °C at 15 min and 28.1 °C at 35 min from the start of the test, and remained constant from then on, below the To value, which was 28.8 °C at the end of the test.
In relation to the outside, the Tg was reduced by 0.5 °C and the Tc by 1.7 °C. The weather outdoors during the test was sunny and humid (Table 1). The high RHg value indicates a limited ventilation effect from shading. In addition, the T reduction was limited when compared to the other tests, which could be a result of low evaporative pad efficiency due to the humid outdoor climate.

4. Discussion

The different climatic conditions during the tests (Table 1) have allowed us to comprehensively analyse the operation of the fan-pad system using distribution air ducts. The fan-pad system tested in this work has a specific area of 0.06 m2 m−2 of greenhouse, slightly higher than the usual values, while the air circulation rate in the pad is approximately 1.0 m s−1, the recommended value for this type of facility [24]. It is, therefore, estimated that mass and energy transfers in the pad have taken place under appropriate conditions. As for the design of the tests, based on the evolution of the greenhouse climate, we consider it to have been appropriate.

4.1. Fan-Pad System and Air Duct Distribution

In the evaporative cooling process, the outside air yields energy to the water that evaporates in the pad, moistening and cooling it. The value of the air temperature drop varies depending on its initial state and on the mass and energy transfers during the process. If the outdoor climate is dry, the values for the evaporated water mass and the drop in air temperature increase. Therefore, the fan-pad system is more efficient and consumes more water in warm climates. During test 1, the exterior relative humidity was 35%, so the fan-pad system operation could be considered adequate. The fact that the average temperature value inside the greenhouse was 0.3 °C higher during the test than outside is due to the initial conditions (closed for 2 h without shading). Other works reported similar results [28,29].
In test 1, the average value of specific water consumption was 0.007 kg kg−1, similar to the values reported in other works with conventional fan-pad systems in semi-arid climates ([30,31]. On the other hand, the average value for the specific consumption per unit of time, pad area and temperature increase was 0.006 kg kg−1 h−1 m−2 °C−1, with an average value for the treated air speed of 1.0 m s−1. [18,19], under laboratory conditions with similar pads, determined values of 0.015 kg kg−1 h−1 m−2 °C−1 for the same air rate value on the pad. The differences between these results may be due to the different initial state of the air to be treated.
In general, the values for the variables related to energy transfer in the form of latent heat (EP, ql, mw/ma y pw) are adequate (Table 2). However, for the variables related to sensible heat transfer (EFI and qs), the opposite occurs. The energy transferred in the form of latent heat per unit of evaporated water mass can be determined as ql/(mw/ma). Its value must match the latent heat of water vaporization (Lv, J kg−1). Under the test conditions, the value of ql/(mw/ma) was 2464 kJ kg−1 while the average Lv value between the outdoor and pre-chamber conditions was 2431 kJ kg−1. Similar results were obtained in all the tests performed. On the other hand, the energy transferred in the form of sensible heat per unit of evaporated water mass is qs/(mw/ma). Under the test conditions, its value was 275 kJ kg−1, that is to say, an energy transfer that increased the air temperature value. The cause of this positive qs value was the installation of the pre-chamber on the south side of the greenhouse, its low thermal insulation and the high solar radiation value during the test. This results in an increased air temperature in the pre-chamber, and with it, a reduction in the fan-pad system’s efficiency value.
The theoretical air temperature value at the pad outlet and the maximum possible evaporative cooling value were determined as a function of the weather outdoors under extreme conditions (Figure 8 and Figure 9). The results are similar to those obtained in another work on evaporative cooling [29]. Under the test conditions, the average temperature value in the pre-chamber was 28.6 °C. However, the air temperature value at the pad outlet due to evaporative cooling under such conditions can be obtained by interpolating the regressions indicated in Table 4, resulting in a value of 22.4 °C. This value represents a significant improvement in the saturation efficiency of the fan-pad system, at 85%, slightly higher than those obtained under laboratory conditions with the same material [19,32] due to the different initial air state.
One of the main problems of conventional fan-pad systems is the important horizontal temperature gradients they produce. The amplitude of their incidence can be reduced if the fan-pad system is combined with shading screens and circulation fans [17]. In the test performed, the temperature variation between the pre-chamber and the end of the distribution air ducts was negligible.
To estimate the desirability of improving the pre-chamber’s thermal insulation, it is necessary to analyse the cost, the possible evaporative cooling as a function of the outdoor climate and the increase in production, quality and benefits that can be achieved by reducing the greenhouse temperature, amongst other factors. The value of evaporative cooling and, consequently, that of the fan-pad system’s efficiency, decreases both with increasing temperature, and in particular, the increasing relative humidity of the air outside (Figure 9). It has been suggested that evaporative cooling in a greenhouse using a fan-pad system is not effective when the temperature and relative humidity of the outdoor air exceed 35 °C and 60%, respectively [31]. However, it has been successfully tested in a subtropical climate where there was humidity of 70% [17]. The novel system used in this work can be effective in cooling greenhouses under extreme conditions. Considering the effect of the outdoor climate on the evaporative cooling value, thermally insulating the pre-chamber can be cost effective regardless of the outdoor climate. In addition, prior conditioning of the treated air to reduce its temperature and/or humidity could be interesting. [33] reported improved evaporative cooling efficiency by pre-cooling the treated air.

4.2. Combining the Fan-Pad System and Air Duct Distribution with Other Actuators

Natural ventilation depends on numerous factors such as the greenhouse size, the number of modules, the size and layout of the windows, the use of anti-pest screens, the wind speed and direction, the solar radiation and the weather conditions [34,35]. In this work, roof ventilation was the most effective cooling system when the outdoor climate was humid (Figure 10, test 2). These results are consistent with those of [36]. These same authors stated that, in areas with dry climates, the evaporative pad may be more efficient than natural ventilation. To analyse the effect of ventilation on fan-pad system operation, one can compare tests 1 and 6 with tests 7 and 8. In tests where there is no ventilation (1 and 7), the outdoor climate is hot and dry, whereas when ventilation is used (tests 6 and 8), the outdoor climate is hot and humid. In general, the operating parameter values were worse in the tests with ventilation. The behaviour of the unit mass of evaporated water stands out; this was equal to 0.003 kg−1 h−1 m−2 °C−1 in tests 1 and 6 and increased from 0.003 kg kg−1 h−1 m−2 °C−1 in test 7 to 0.004 kg kg−1 h−1 m−2 °C−1 when adding ventilation (test 8, Table 5). The worst operating parameter results for the fan-pad system were associated with the warm and humid outdoor climate. However, the increase in unit mass seems to indicate greater difficulty of the fan-pad system in reducing the greenhouse temperature due to the ventilation.
The outdoor climate may be the main factor influencing the fan-pad system, although air tightness is also a key factor in its operation [17]. The hottest air accumulates next to the greenhouse cover due to its lower density. However, the overhead ventilation used to evacuate it causes an increase in turbulence that affects the efficiency of the fan-pad system and the uniformity of temperature throughout the greenhouse. Nevertheless, air distribution using air ducts is not affected by the turbulence caused by natural ventilation, so horizontal thermal gradients are avoided.
During the tests with the fan-pad system, and when combined with shading (tests 1 and 7), the outdoor climate was very similar (hot and dry) so the results are comparable (Table 1). Shading considerably improves the operation of the fan-pad system since the average temperature value in the greenhouse was 3.1 °C lower than outside; whereas, in test 1, with the fan-pad system, it was 0.3 °C higher (Table 2 and Table 5). In addition, the difference between the air temperature in the pre-chamber and at the pad output reduced from 6.2 °C to 4.7 °C as a result of shading. Finally, the values for the specific and unit masses of evaporated water reduced from 0.007 to 0.006 kg kg−1 and from 0.006 kg kg−1 h−1 m−2 °C−1 to 0.003 kg kg−1 h−1 m−2 °C−1, respectively.
The shading effect was also observed when the climate was hot and humid, as deduced when comparing the test 6 results, in which the fan-pad system was combined with roof ventilation, and those for test 8, in which shading was added. The average temperature value in the greenhouse went from 1.6 °C higher than outside in test 6, to 0.5 °C lower in test 8, due to shading (Table 5). Moreover, the difference between the air temperature in the pre-chamber and at the pad output decreased from 2.0 °C to 1.5 °C when shading was employed. Lastly, the specific mass values of the evaporated water decreased from 0.006 kg kg−1 h−1 m−2 °C−1 to 0.004 kg kg−1 h−1 m−2 °C−1. These results are similar to those of other authors [13,14,28,36,37]. The shading screen results reduced the volume of air that needed to be cooled. [38,39] investigated the operation of a fan-pad system in Greece, concluding that shading is not necessary in dry climates. [17] reported a reduction in greenhouse temperature in the warm, humid climate of Southeastern China (Shanghai) when combining a fan-pad system and shading. However, this combination is limited by low crop transpiration [24].
The ratio value between the specific latent heat and the specific evaporated water mass, ql/(mw/ma), roughly coincides with the latent heat value of the water vapour in all the tests performed. Nonetheless, when considering sensible heat, qs/(mw/ma), the result varies with the outdoor climate and the combination of actuators used. With the exception of the shading tests, the sensible heat from solar radiation was transferred into the air in the pre-chamber (qs > 0). When shading was used, the sensible heat was transferred from the treated air (qs < 0). The values for such transfers were higher when the weather was dry than when it was humid (Table 5).
In all the tests performed with the fan-pad system, the specific humidity value of the treated air at the end of the diffuser air ducts was lower than that of the greenhouse air (Figure 5 and Figure 13). According to [14], in Almeria, the mass of water evaporated by a fan-pad system is approximately 25% that of the transpiration value for a greenhouse crop. When shading was used, the decrease in specific moisture indicated reduced transpiration due to the action of solar radiation being limited. However, when ventilation was used, the specific moisture value tended to increase in the greenhouse.

5. Conclusions

In this work, the operation of a novel fan-pad system with a pre-chamber and air distribution using perforated air ducts located next to the plants was analysed under extreme conditions. The greenhouse cooling was efficient, and the distribution system avoided the characteristic horizontal thermal gradients of the commonly used fan-pad systems. Determining the theoretical value of the air temperature when exiting the pad allows us to estimate the maximum evaporative cooling value as a function of the outdoor climate. Under extreme conditions, fan-pad system efficiency decreases along with increased air temperature and, above all, the increased relative humidity of the outside air. The results obtained indicate that fan-pad system operation improved when combined with shading. In contrast, combining it with roof ventilation was not beneficial. When the outdoor climate is warm and humid, natural ventilation can be the most efficient method to control temperature; however, if the outdoor climate is hot and dry, the evaporative pad is more effective, especially when combined with shading. The increased air temperature in the pre-chamber due to the action of solar radiation limits the efficiency value of the fan-pad system. It would be advisable to determine the effects of changing the system design, such as improving the pre-chamber’s thermal insulation to reduce the temperature and/or humidity of the air to be treated. The effect of these measures on the economic performance of greenhouse agriculture should be quantified economically to help businesses specialising in this sector decide on its suitability. Likewise, the possibility of building portable systems should be explored, which can be used when there are high temperatures. Furthermore, the effect of the fan-pad system and the distribution of air alongside the plants on crop transpiration and plant canopy temperature should be evaluated. The results of such studies would help us to design greenhouse climate control strategies that would allow water and energy consumption in plant production under plastic promoting agricultural business resilience to climate change.

Author Contributions

Conceptualization: Francisco Rodríguez; data curation: J.M.C.-Z., J.A.S.-M. and A.C.-O.; formal analysis: J.M.C.-Z. and J.A.S.-M.; funding acquisition: F.R.; investigation: J.A.S.-M. and A.C.-O.; methodology: J.M.C.-Z. and A.C.-O.; project administration: F.R.; resources: A.C.-O.; software: J.A.S.-M. and H.W.; supervision: J.M.C.-Z. and F.R.; validation: H.W.; visualization: J.M.C.-Z. and H.W.; writing—original draft: J.M.C.-Z.; writing—review and editing: H.W. All authors have read and agreed to the published version of the manuscript.

Funding

This work has been funded by the Spanish R + D + i Plan Project DPI2017-85007-R of the Ministry of Economy, Industry and Competitiveness.

Acknowledgments

The authors want to thank to Fundación Tecnova for facilitating the possibility to do tests in their facilities and allow the use of its real data.

Conflicts of Interest

The authors declare no conflict of interest.

Abbreviations

cSpecific heat (J kg−1 °C−1)
DWind direction (°)
EFIEfficiency of air saturation when circulating through the fan-pad system (%)
hEnthalpy per unit of dry or specific air mass (J kg−1)
mmass (kg)
mw/maevaporated water mass per unit of treated air mass or specific mass of evaporated water (kg kg−1).
pwevaporated water mass per unit of treated air mass, time, pad area and temperature difference between the outside and the pre-chamber
qEnergy transferred in the form of heat per unit of dry air mass (J kg−1)
RHRelative humidity (%)
SRSolar radiation intensity (W m−2)
EPWater evaporation performance in the fan-pad system (%)
TDry bulb air temperature (°C)
vWind speed (m s−1)
ωSpecific air humidity (kg kg−1)
Subscripts
adry air
cpre-chamber
ggreenhouse
dduct
llatent
oexterior
ppad
ssensible
vvapour
wwater
wbwet bulb

References

  1. Dehbi, A.; Youssef, B.; Chappey, C.; Mourad, A.-H.; Picuno, P.; Statuto, D. Multilayers Polyethylene Film for Crop Protection in Harsh Climatic Conditions. Adv. Mater. Sci. Eng. 2017, 2017, 4205862. [Google Scholar] [CrossRef] [Green Version]
  2. Gulrez, S.K.; Abdel-Ghany, A.M.; Al-Helal, I.M.; Al-Zaharani, S.M.; Alsadon, A.A. Evaluation of PE films having NIR-reflective additives for greenhouse applications in arid regions. Adv. Mater. Sci. Eng. 2013, 2013, 575081. [Google Scholar] [CrossRef] [Green Version]
  3. Callejón-Ferre, A.J.; Manzano-Agugliaro, F.; Díaz-Pérez, M.; Carreño-Ortega, A.; Pérez-Alonso, J. Effect of shading with aluminised screens on fruit production and quality in tomato (Solanum lycopersicum L.) under greenhouse conditions. Span. J. Agric. Res. 2009, 1, 41–49. [Google Scholar] [CrossRef] [Green Version]
  4. Al-Helal, I.; Al-Abbadi, N.; Al-Ibrahim, A. A study of fan-pad performance for a photovoltaic powered greenhouse in Saudi Arabian summer. Int. Agric. Eng. J. 2004, 1, 14. [Google Scholar]
  5. Kittas, C.; Boulard, T.; Bartzanas, T.; Katsoulas, N.; Mermier, M. Influence of an insect screen on greenhouse ventilation. Trans. ASAE 2002, 45, 1083–1090. [Google Scholar] [CrossRef]
  6. Muñoz, P.; Montero, J.I.; Antón, A.; Giuffrida, F. Effect of insect-proof screens and roof openings on greenhouse ventilation. J. Agric. Eng. Res. 1999, 73, 171–178. [Google Scholar] [CrossRef]
  7. Baille, A.; Kittas, C.; Katsoulas, N. Influence of whitening on greenhouse micro-climate and crop energy partitioning. Agric. Forest Meteorol. 2001, 107, 293–306. [Google Scholar] [CrossRef]
  8. Fernandez-Rodríguez, E.J.; Fernández, J.; Kenig, A. Radiative field uniformity under shading screens under greenhouse vs. whitewash in Spain. Acta Hortic. 2000, 534, 125–130. [Google Scholar] [CrossRef]
  9. Ahemd, H.A.; Al-Faraj, A.A.; Abdel-Ghany, A.M. Shading greenhouses to improve the microclimate, energy and water saving in hot regions: A review. Sci. Hortic. Amst. 2016, 201, 36–45. [Google Scholar] [CrossRef]
  10. Montero, J.; Muñoz, P.; Sánchez-Guerrero, M.; Medrano, E.; Piscia, D.; Lorenzo, P. Shading screens for the improvement of the night time climate of unheated greenhouses. Span. J. Agric. Res. 2013, 11, 32–46. [Google Scholar] [CrossRef] [Green Version]
  11. González-Real, M.M.; Baille, A. Plant response to greenhouse cooling. Acta Hortic. 2006, 719, 427–438. [Google Scholar] [CrossRef]
  12. Castilla, N. Intervención contra altas temperaturas: Refrigeración. In Invernaderos de Plástico. Tecnología y Manejo, 2nd ed.; Mundi-Prensa: Madrid, Spain, 2007; pp. 207–233. [Google Scholar]
  13. Misra, D.; Ghosh, S. Evaporative cooling technologies for greenhouses: A comprehensive review. Agric. Eng. Int. CIGR J. 2018, 20, 1–15. [Google Scholar]
  14. López, A.; Valera, D.L.; Molina-Aiz, F.D.; Peña, A. Sonic anemometry to evaluate airflow characteristics and temperature distribution in empty Mediterranean greenhouses equipped with pad-fan and fog systems. Biosyst. Eng. 2012, 113, 334–350. [Google Scholar] [CrossRef]
  15. Jimenez, J.I.; Casas-Vazquez, J. An experimental study of micrometeorological modification in a glasshouse during summer. Agric. Meteorol. 1978, 19, 337–348. [Google Scholar] [CrossRef]
  16. Rabbi, B.; Chen, Z.-H.; Sethuvenkatraman, S. Protected Cropping in Warm Climates: A Review of Humidity Control and Cooling Methods. Energies 2019, 12, 2737. [Google Scholar] [CrossRef] [Green Version]
  17. Xu, J.; Li, Y.; Wang, R.Z.; Liu, W.; Zhou, P. Experimental performance of evaporative cooling pad systems in greenhouses in humid subtropical climates. Appl. Energy 2015, 138, 291–301. [Google Scholar] [CrossRef]
  18. Franco, A.; Valera, D.L.; Madueño, A.; Peña, A. Influence of water and air flow on the performance of cellulose evaporative cooling pads used in Mediterranean greenhouses. Trans. ASABE 2015, 53, 565–576. [Google Scholar] [CrossRef]
  19. Franco, A.; Valera, D.L.; Peña, A. Energy Efficiency in greenhouse evaporative cooling techniques: Cooling boxes versus Cellulose Pads. Energies 2014, 7, 1427–1447. [Google Scholar] [CrossRef]
  20. Sun, W.; Zhou, B.; Xu, F.; Shang, C.; Lu, C.; Guo, W. Performance of positive pressure fan-pad cooling system and cooling load model for Chinese solar greenhouse. Trans. Chin. Soc. Agric. Eng. 2019, 35, 214–224. [Google Scholar]
  21. Ghosal, M.K.; Tiwari, G.N.; Sirivastava, N.S.L. Modeling and experimental validation of a greenhouse with evaporative cooling by moving water film over external shade cloth. Energ. Build. 2003, 35, 843–850. [Google Scholar] [CrossRef]
  22. Bailey, B.J.; Raoueche, A. Design and performance aspects of a water producing greenhouse cooled by seawater. Acta Hortic. 1998, 458, 311–316. [Google Scholar] [CrossRef]
  23. Abbouda, S.K.; Almuhanna, E.A. Improvement of evaporative cooling system efficiency in greenhouses. Int. J. Latest Trends Agric. Food Sci. 2012, 2, 83–89. [Google Scholar]
  24. Ghoulem, M.; El Moueddeb, K.; Nehdi, E.; Boukhanouf, R.; Calautit, J.K. Greenhouse design and cooling technologies for sustainable food cultivation in hot climates: Review of current practice and future status. Biosyst. Eng. 2019, 183, 121–150. [Google Scholar] [CrossRef]
  25. TECNOVA Foundation Experimental Farm. Available online: http://www.fundaciontecnova.com/ (accessed on 21 April 2020).
  26. Jamal, K.A. Greenhouse cooling in hot countries. Energy 1994, 19, 1187–1192. [Google Scholar] [CrossRef]
  27. Fernández, M.D.; López, J.C.; Baeza, E.; Céspedes, A.; Meca, D.E.; Bailey, B. Generation and evaluation of typical meteorological year datasets for greenhouse and external conditions on the Mediterranean coast. Int. J. Biometeorol. 2015, 59, 1067–1081. [Google Scholar] [CrossRef]
  28. Ganguly, A.; Ghosh, S. Modeling and analysis of a fan-pad ventilated floricultural greenhouse. Energy Build. 2007, 39, 1092–1097. [Google Scholar] [CrossRef]
  29. Chen, X.; Su, Y.; Aydin, D.; Ding, Y.; Zhang, S.; Reay, D.; Riffat, S. A novel evaporative cooling system with a polymer hollow fibre spindle. X. App. Therm. Eng. 2018, 132, 665–675. [Google Scholar] [CrossRef]
  30. Sabeh, N.C.; Giacomelli, G.A.; Kubota, C. Water use for pad and fan evaporative cooling of a greenhouse in a semiarid climate. Acta Hortic. 2006, 719, 409–416. [Google Scholar] [CrossRef]
  31. Fuchs, M.; Dayan, E.; Presnov, E. Evaporative cooling of a ventilated greenhouse rose crop. Agric. Forest Meteorol. 2006, 138, 203–215. [Google Scholar] [CrossRef]
  32. Wu, J.M.; Huang, X.; Zhang, H. Theoretical analysis on heat and mass transfer in a direct evaporative cooler. App. Therm. Eng. 2009, 29, 980–984. [Google Scholar] [CrossRef]
  33. Farmahini-Farahani, M.; Heidarinejad, G. Increasing effectiveness of evaporative cooling by pre-cooling using nocturnally stored water. App. Therm. Eng. 2012, 38, 117–123. [Google Scholar] [CrossRef]
  34. Baeza, E.J.; Pérez-Parra, J.J.; Montero, J.I.; Bailey, B.J.; López, J.C.; Gázquez, J.C. Analysis of the role of sidewall vents on buoyancy-driven natural ventilation in parral-type greenhouses with and without insect screens using computational fluid dynamics. Biosyst. Eng. 2009, 104, 86–96. [Google Scholar] [CrossRef]
  35. Mashonjowa, E.; Ronsse, F.; Milford, J.R.; Pieters, J.G. Modelling the thermal performance of a naturally ventilated greenhouse in Zimbabwe using a dynamic greenhouse climate model. Sol. Energy 2013, 91, 381–393. [Google Scholar] [CrossRef]
  36. Thipe, E.L.; Workneh, T.; Odindo, A.; Laing, M. Greenhouse technology for agriculture under arid conditions. Sustain. Agric. Rev. 2017, 22, 37–55. [Google Scholar]
  37. Willits, D.H. The effect of cloth characteristics on the cooling performance of external shade cloths for greenhouses. J. Agric. Eng. Res. 2001, 79, 331–340. [Google Scholar] [CrossRef]
  38. Kittas, C.; Bartzanas, T.; Jaffrin, A. Greenhouse evaporative cooling: Measurement and data analysis. Trans. ASAE 2001, 44, 683–689. [Google Scholar] [CrossRef]
  39. Kittas, C.; Bartzanas, T.; Jaffrin, A. Temperature gradients in a partially shaded large greenhouse equipped with evaporative cooling pads. Biosyst. Eng. 2003, 85, 87–94. [Google Scholar] [CrossRef]
Figure 1. Greenhouse with fan-pad system.
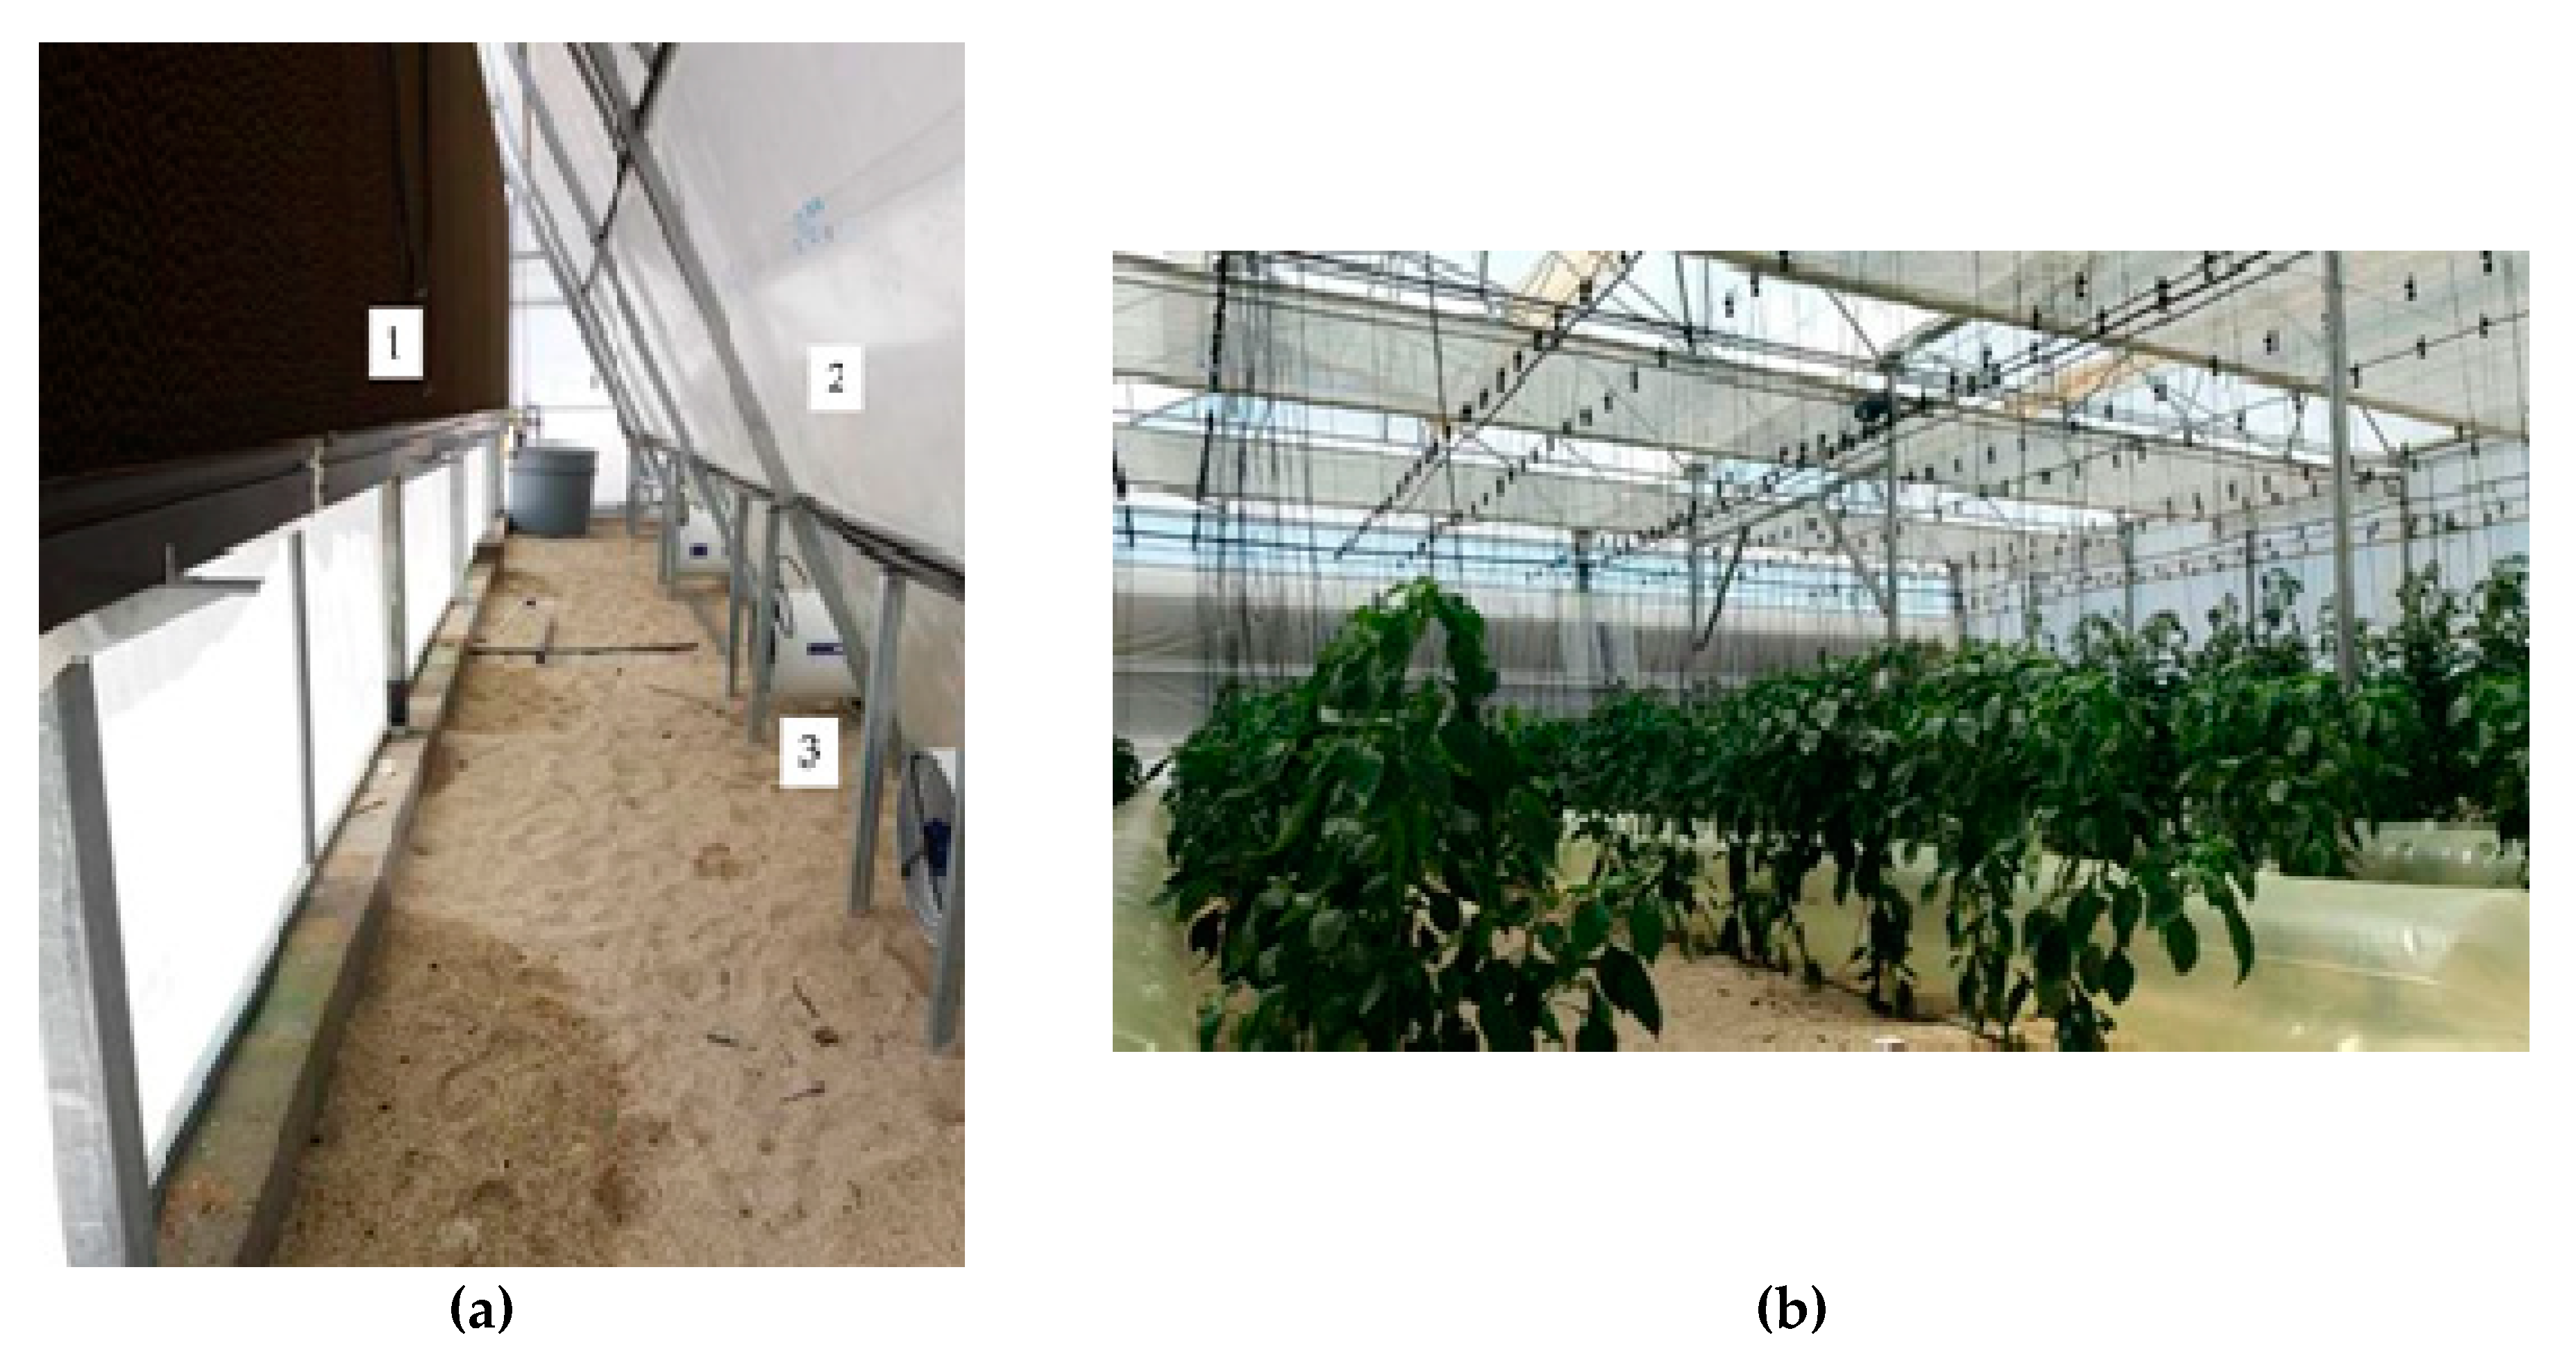
Agronomy 10 00752 g001
Figure 2. Greenhouse. (a) Fan-pad system, pre-chamber and extractors. (b) Distribution air ducts.
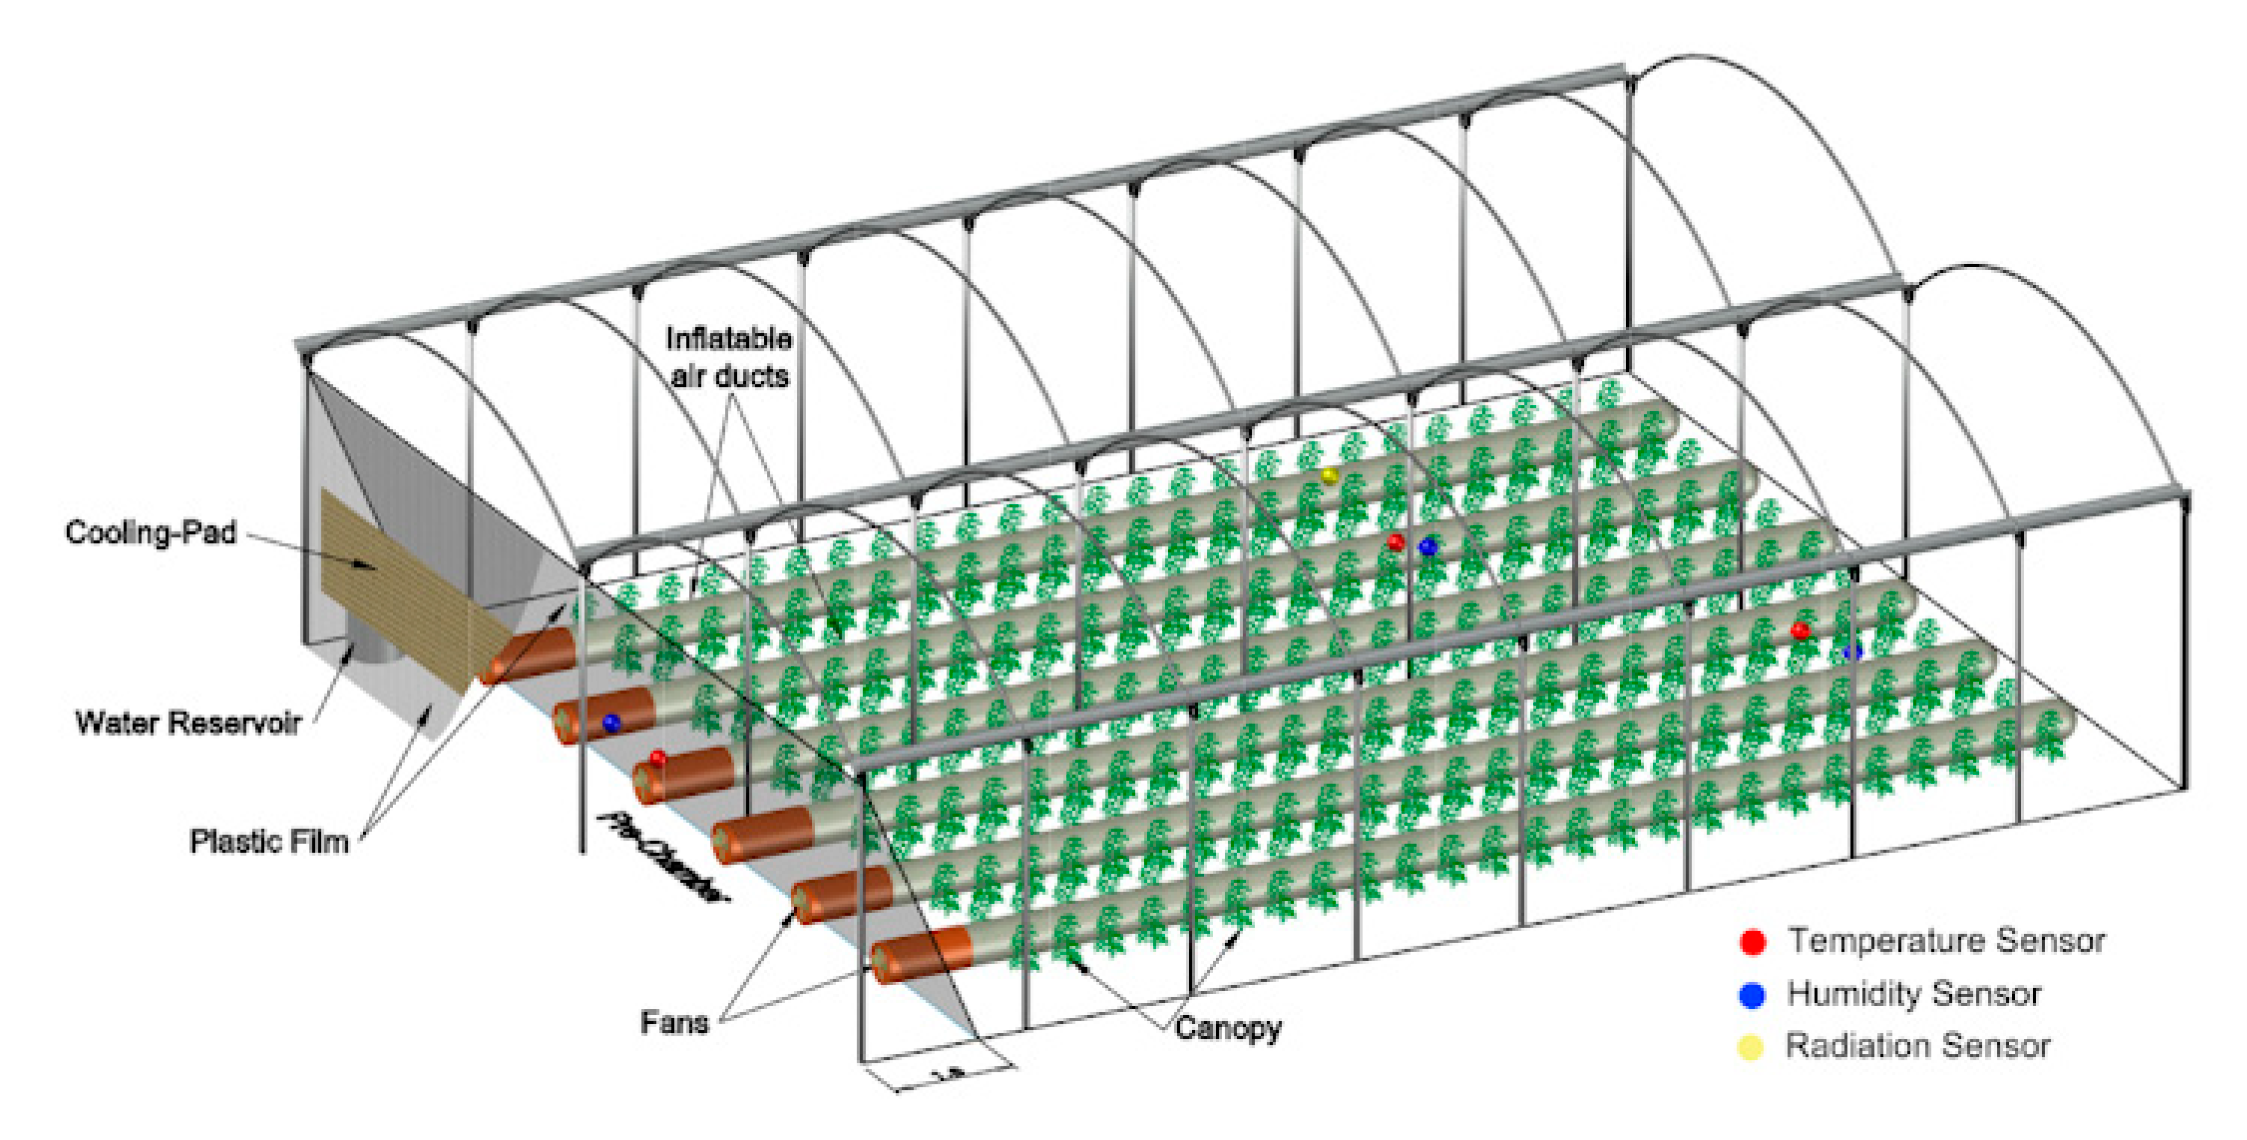
Agronomy 10 00752 g002
Figure 3. Diagram of the greenhouse with pre-chamber and inflatable air ducts and the location of the sensors used.
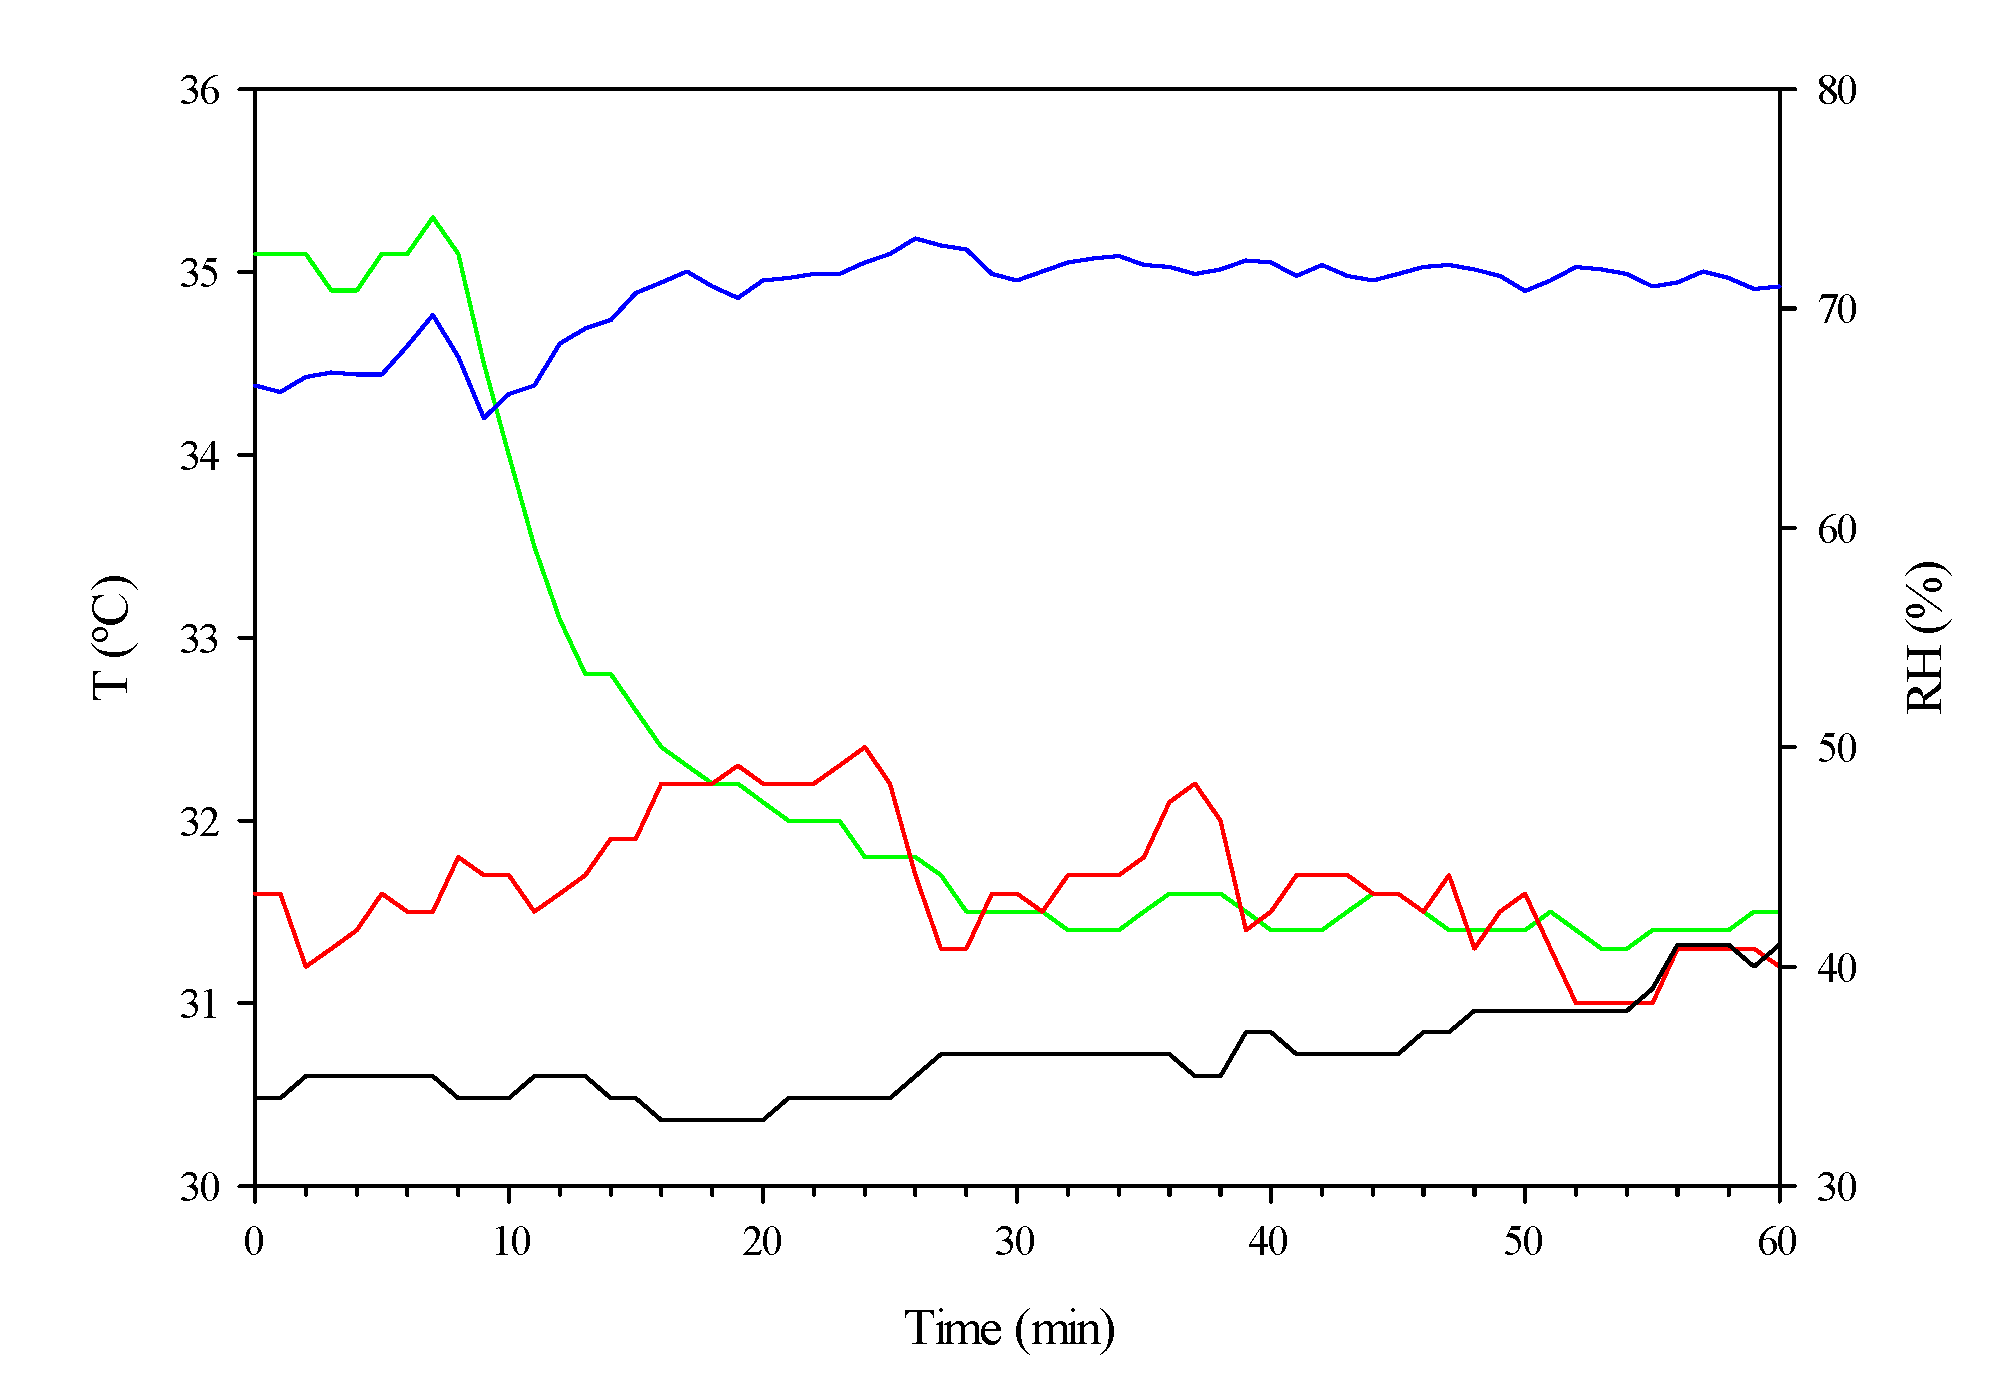
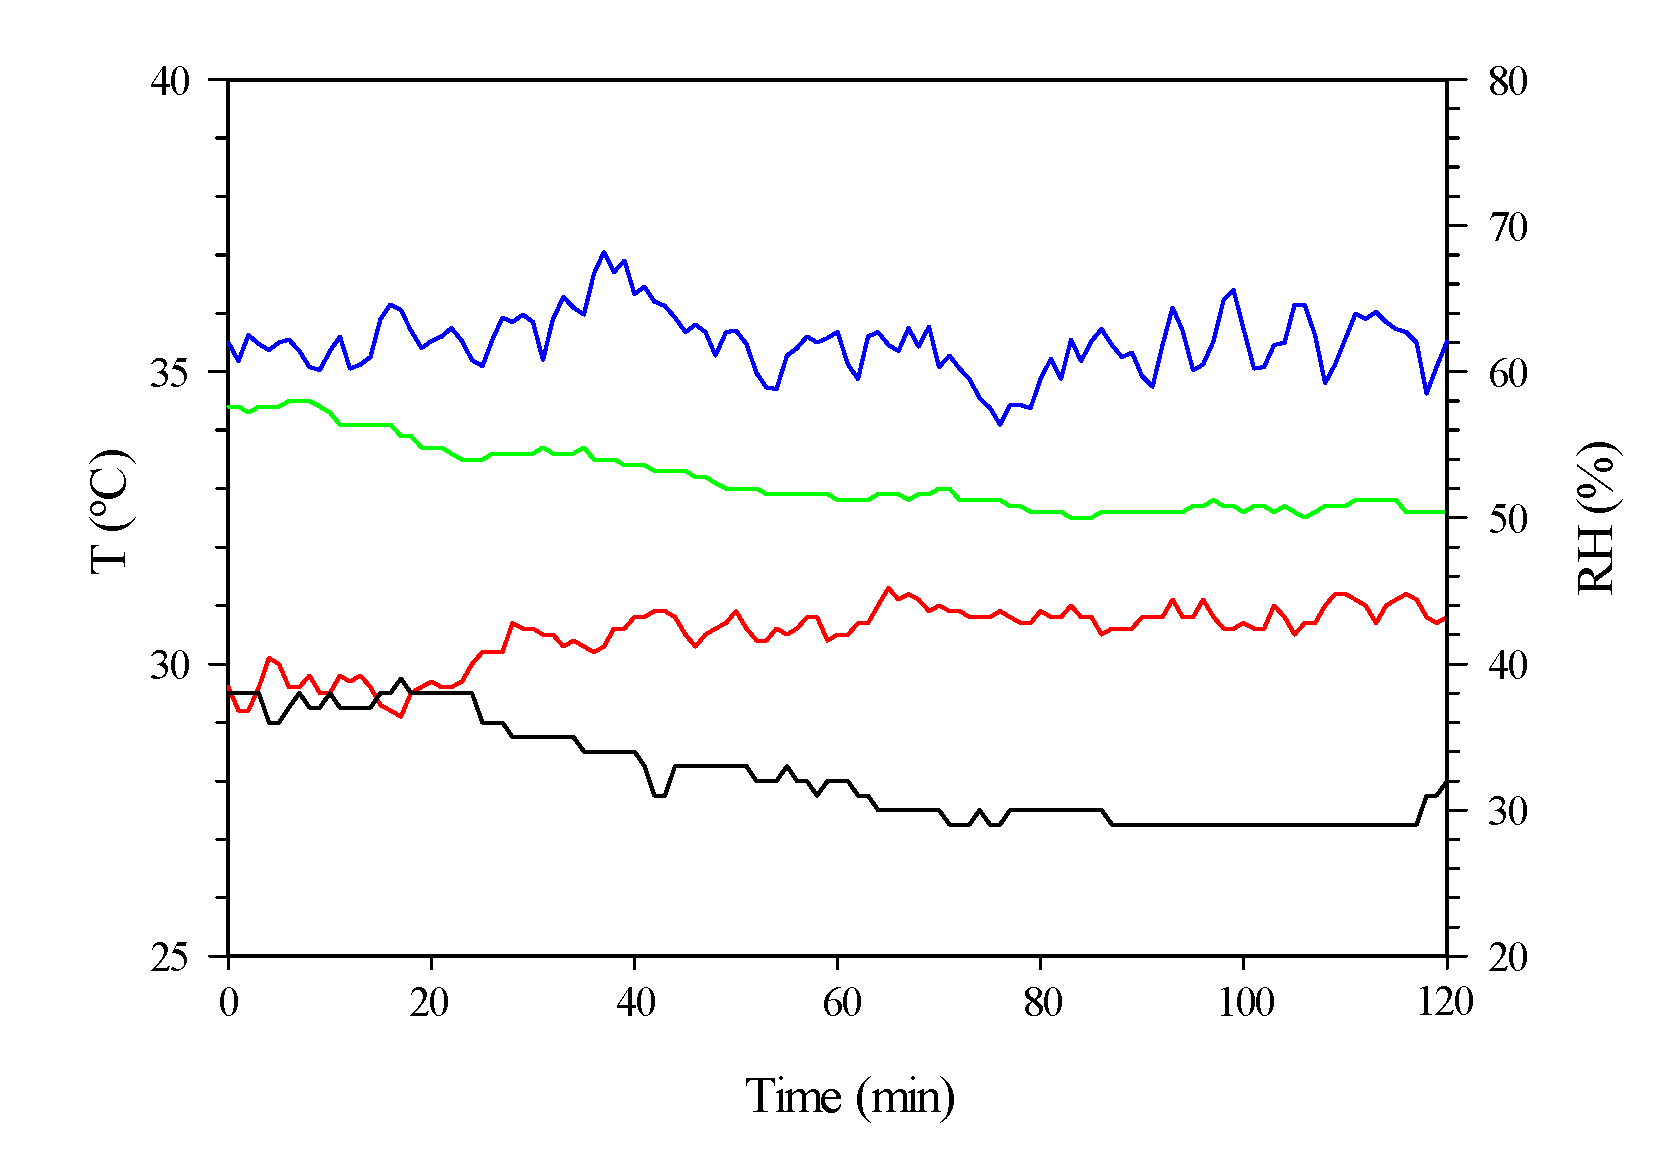
Agronomy 10 00752 g003
Figure 4. Temporary evolution of the temperature (T, °C, on the main axis; in the greenhouse, green, and outdoors, red) and relative humidity (RH, %, on the secondary axis; in the greenhouse, blue, and outside, black) during test 1 using the fan-pad system.
Agronomy 10 00752 g004
Figure 5. State of the air outdoors (red), in the pre-chamber (blue), at the end of the air duct (orange) and in the greenhouse (green) during test 1 when using the fan-pad system. The red arrows represent the evaporative cooling of the air in the pad (which was tilted) and its heating (horizontal) in the pre-chamber.
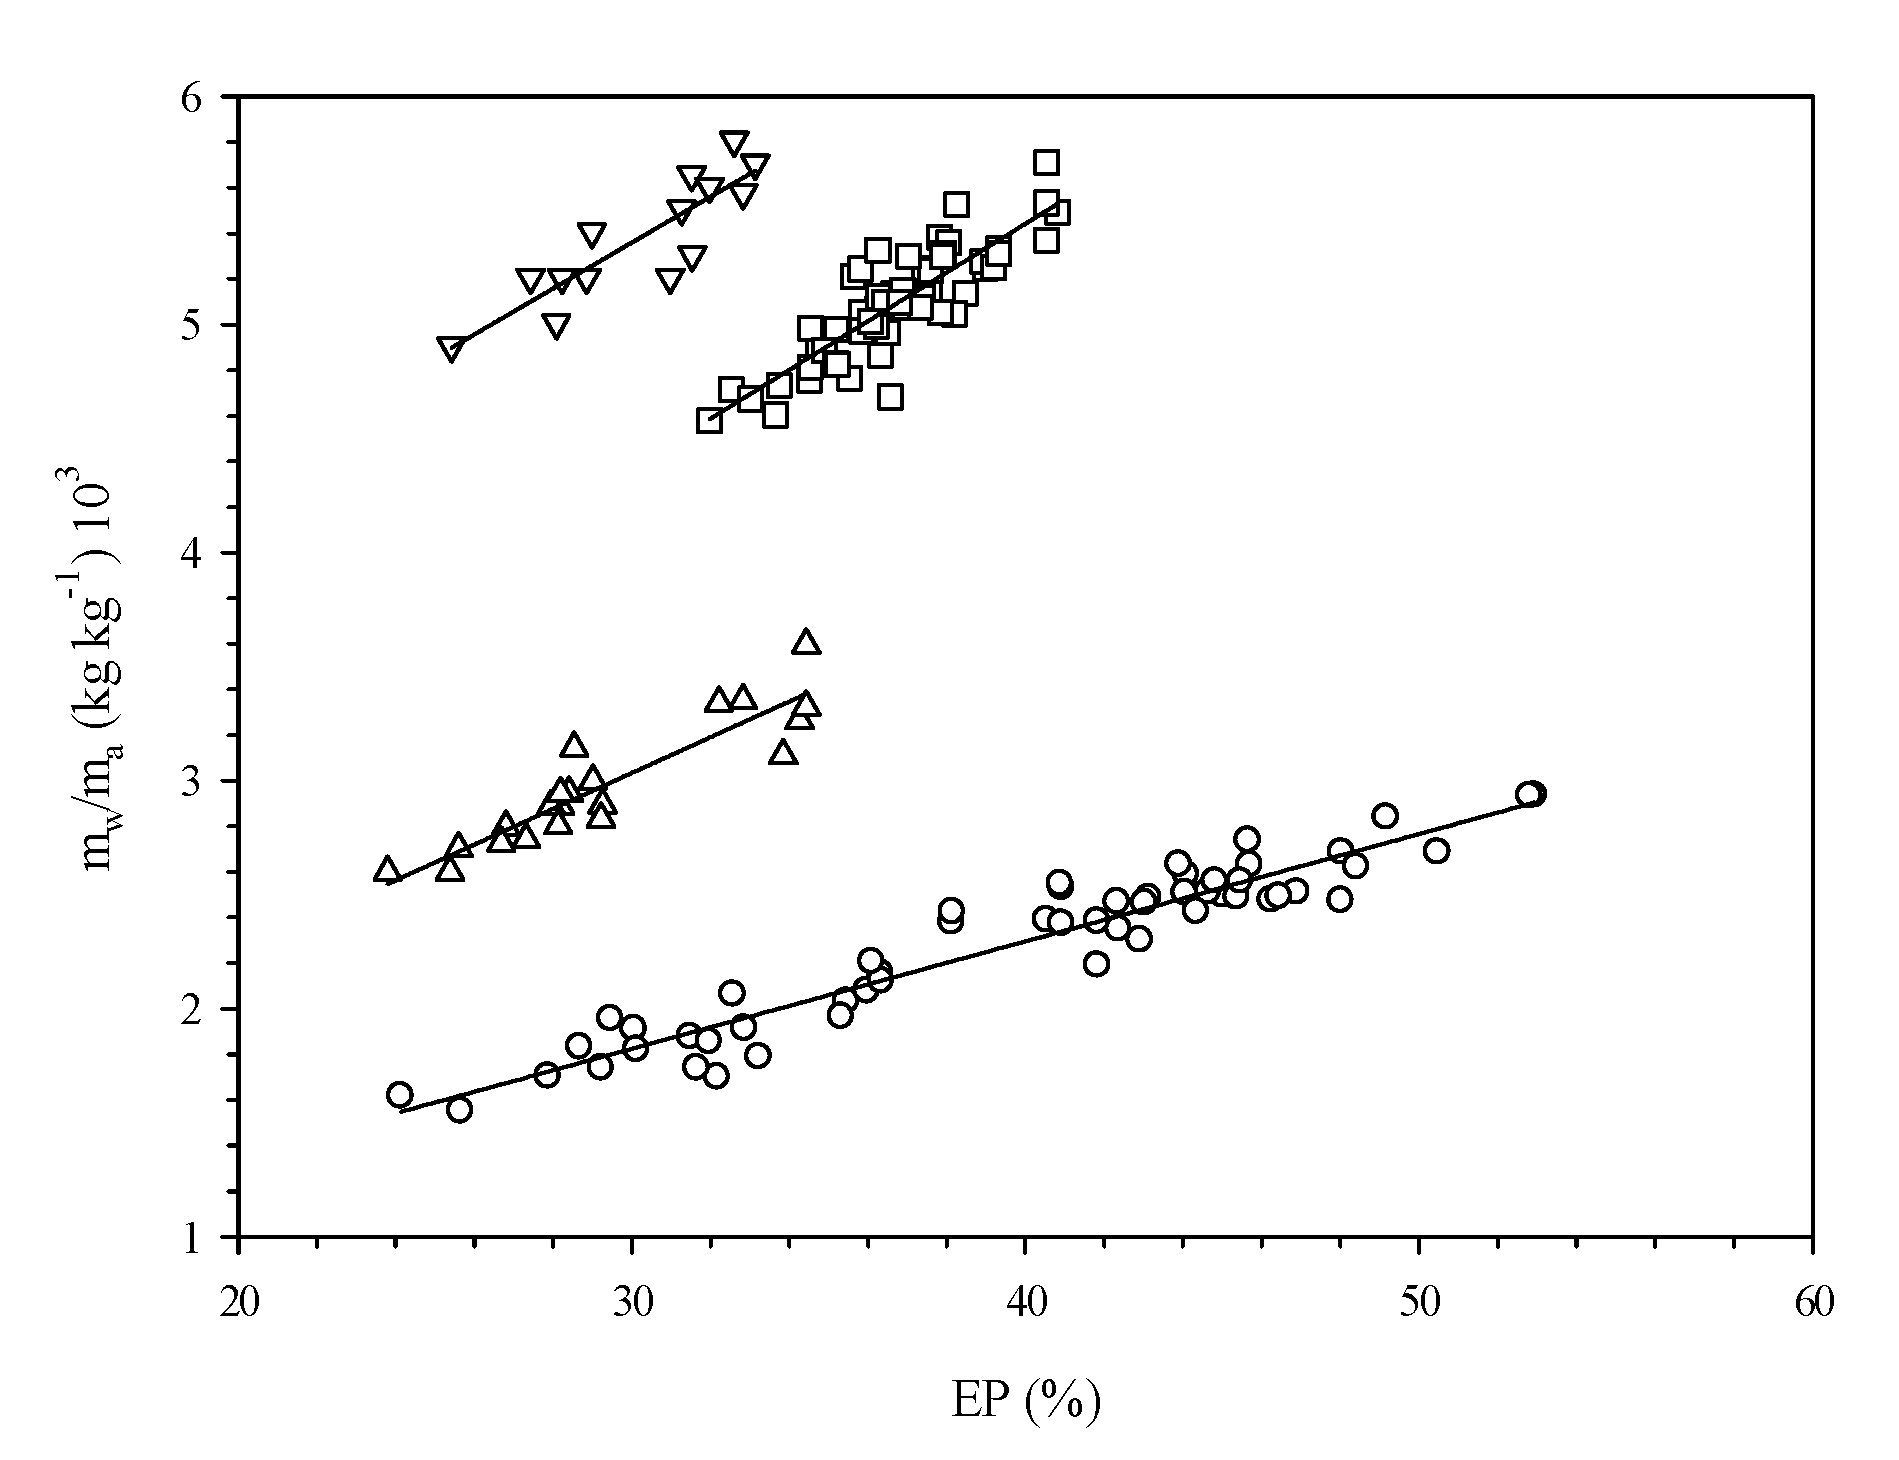
Agronomy 10 00752 g005
Figure 6. Relationship between the specific water consumption (mw/ma (kg kg−1) 103) and the EP (%) as a function of the HR value of the outdoor air (75%, ○; 60%, △; 45%, □; and 30%, ▽).
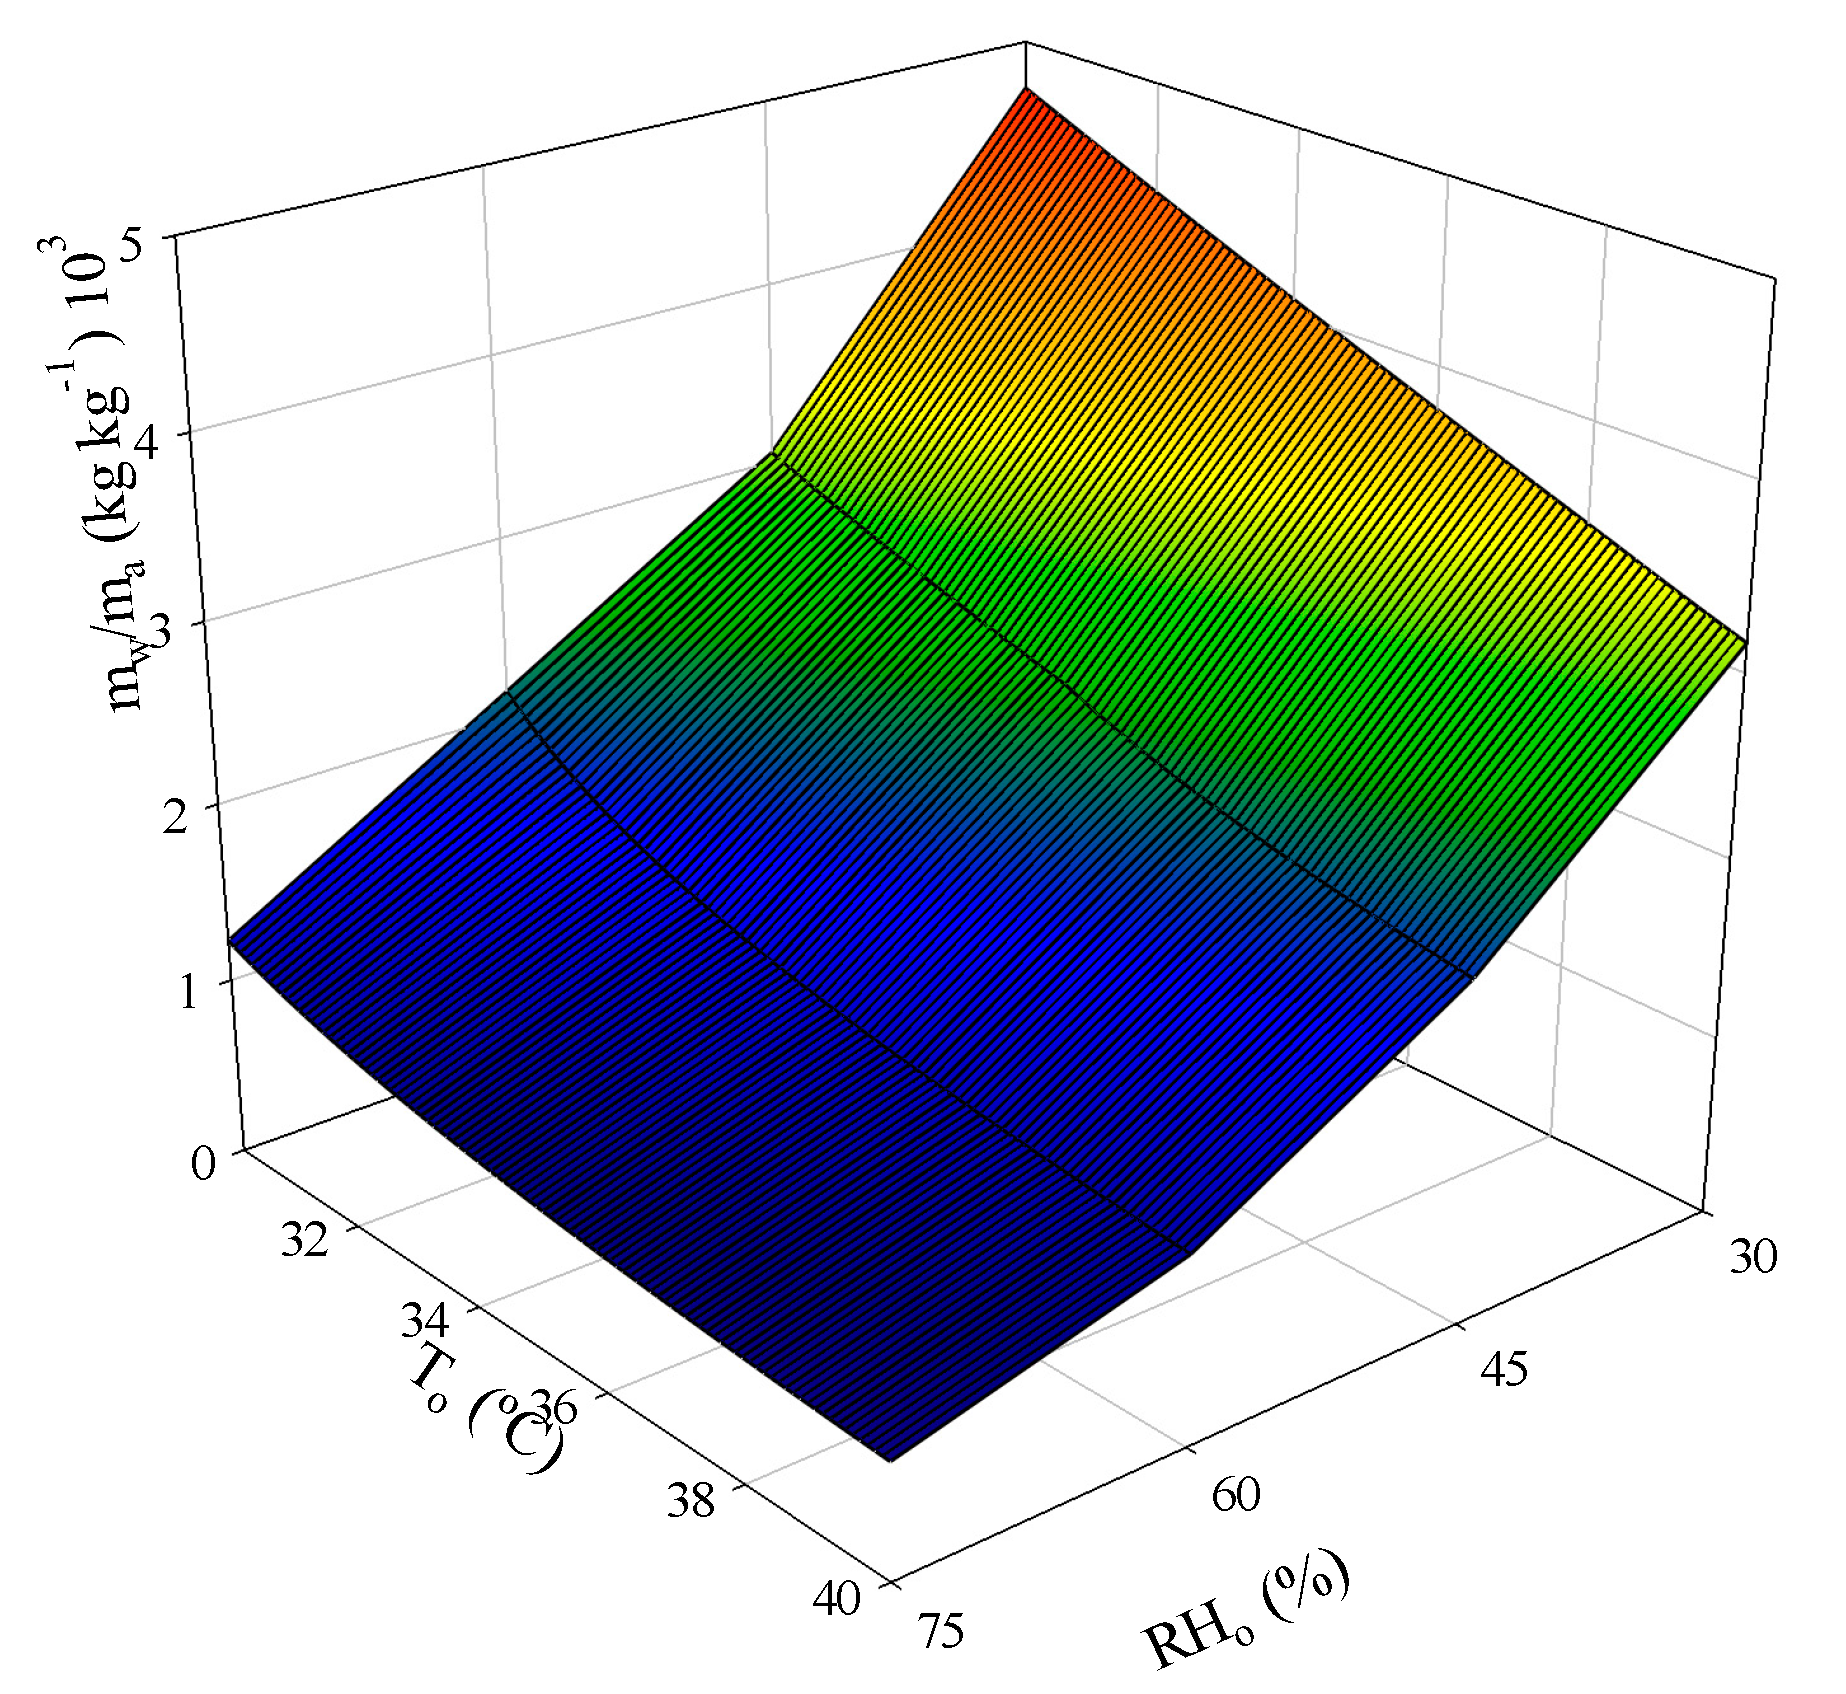
Agronomy 10 00752 g006
Figure 7. Evolution of the specific water consumption (mw/ma (kg kg−1) 103) as a function of the exterior temperature (T, °C) and relative humidity (RH, %) values.
Agronomy 10 00752 g007
Figure 8. Evolution of the air temperature when exiting the pad (Tp, °C) as a function of the exterior temperature (T, °C) and relative humidity (RH, %) values.
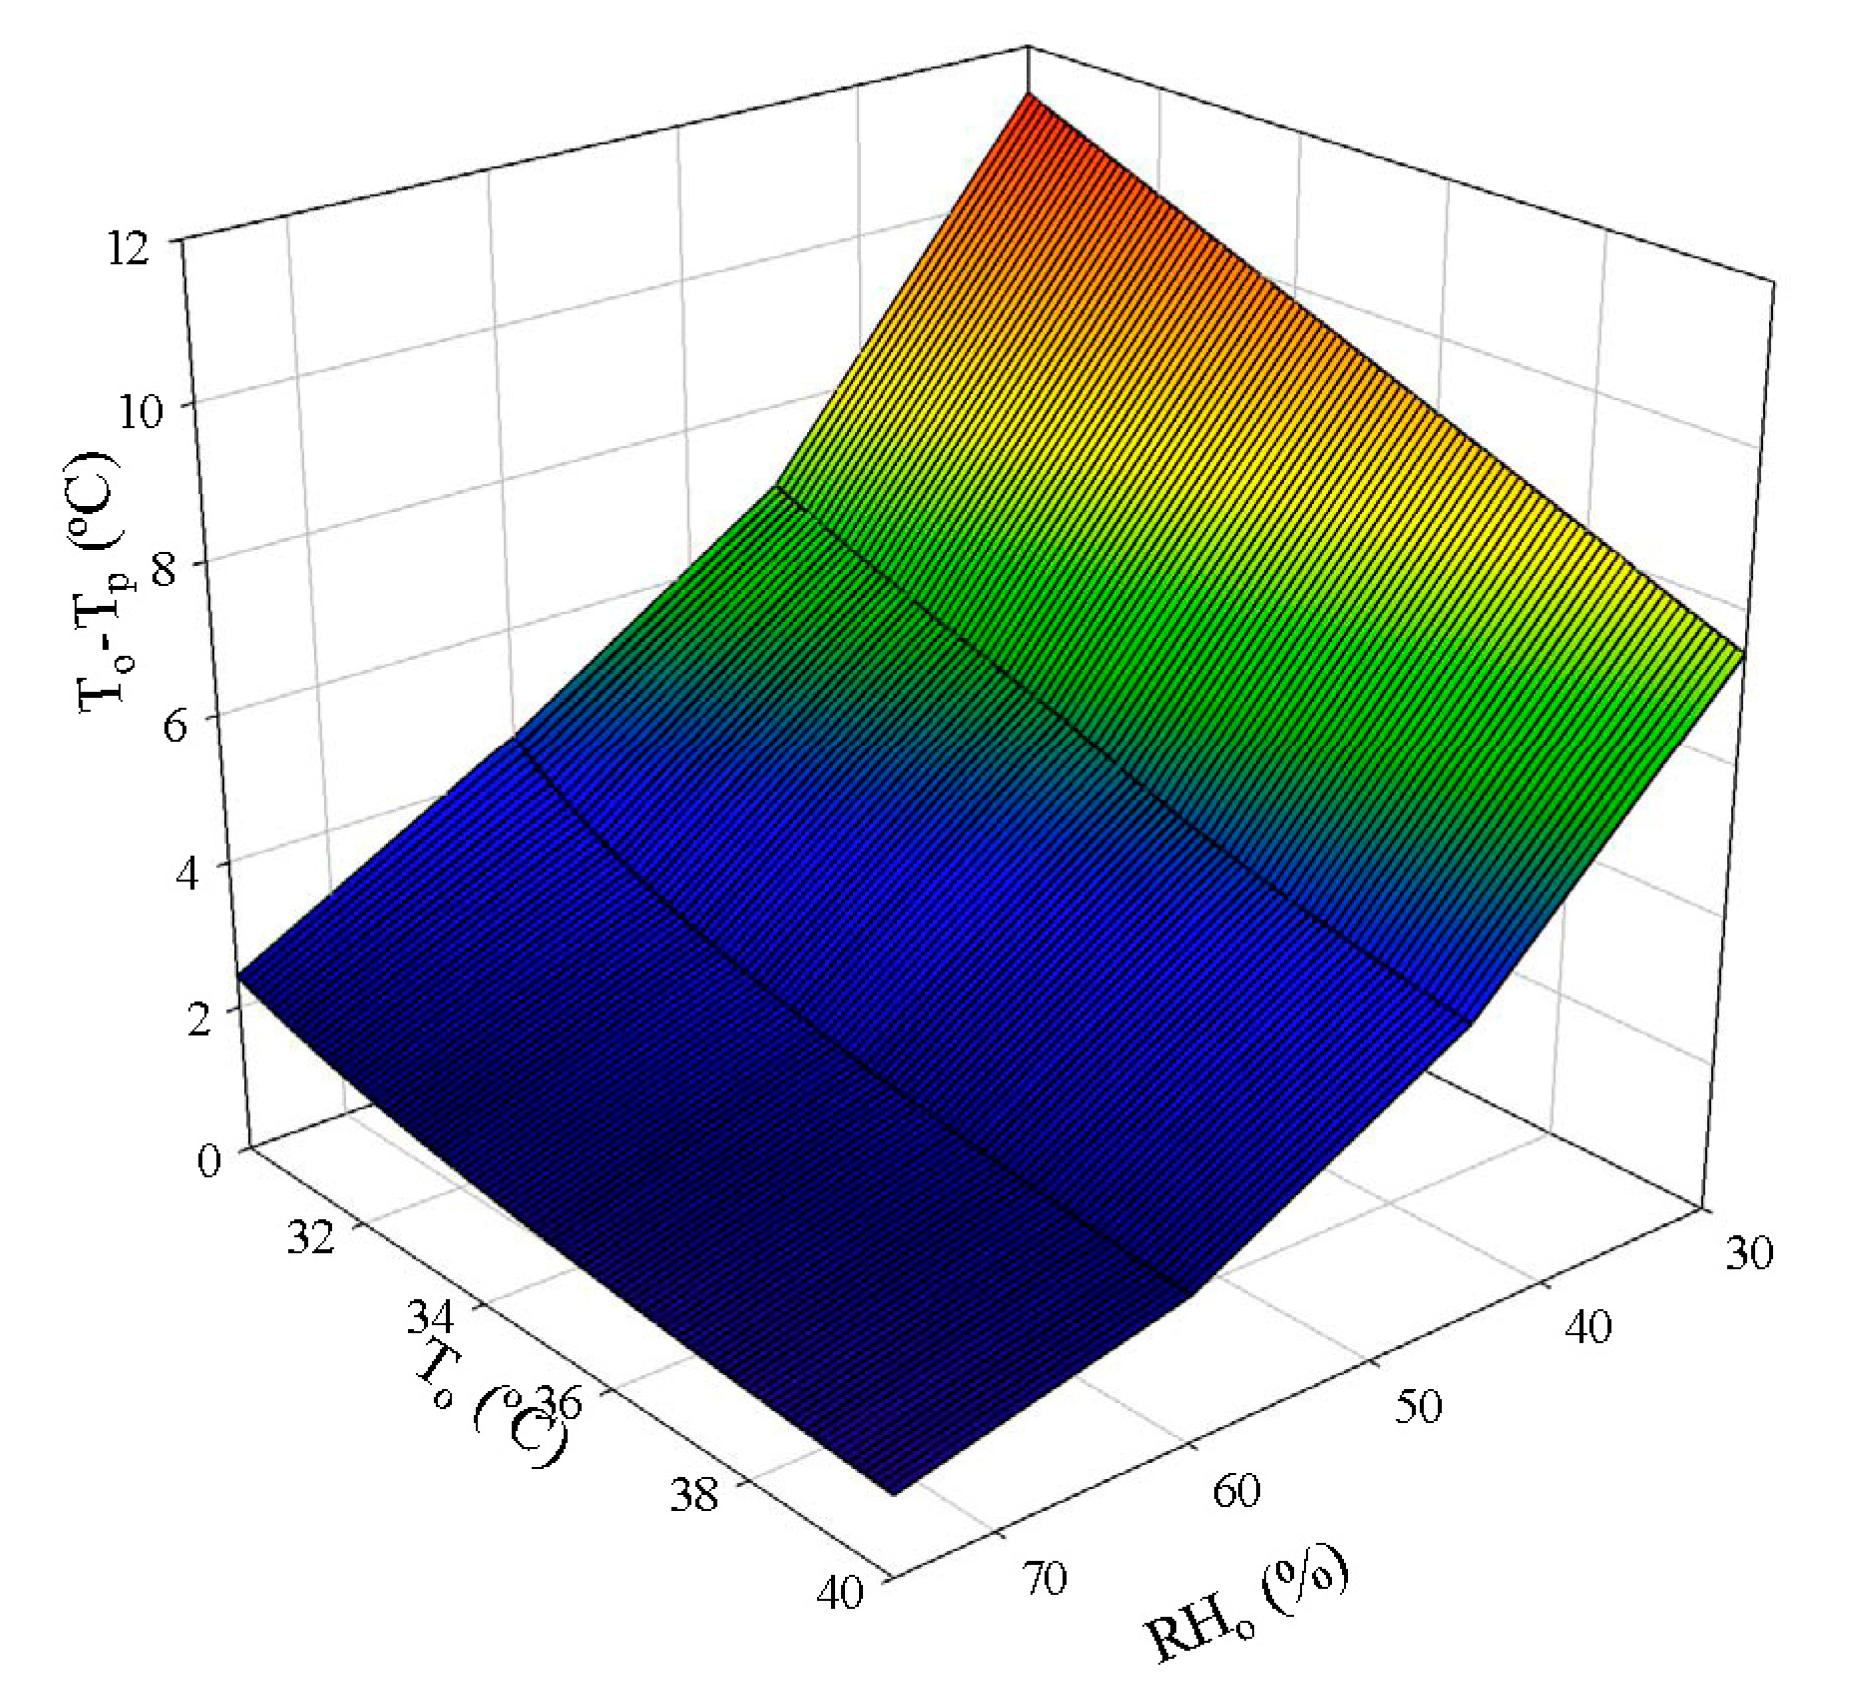
Agronomy 10 00752 g008
Figure 9. Evolution of the evaporative air cooling on the pad (To–Tp, °C) as a function of the exterior temperature (T, °C) and relative humidity (RH, %) values.
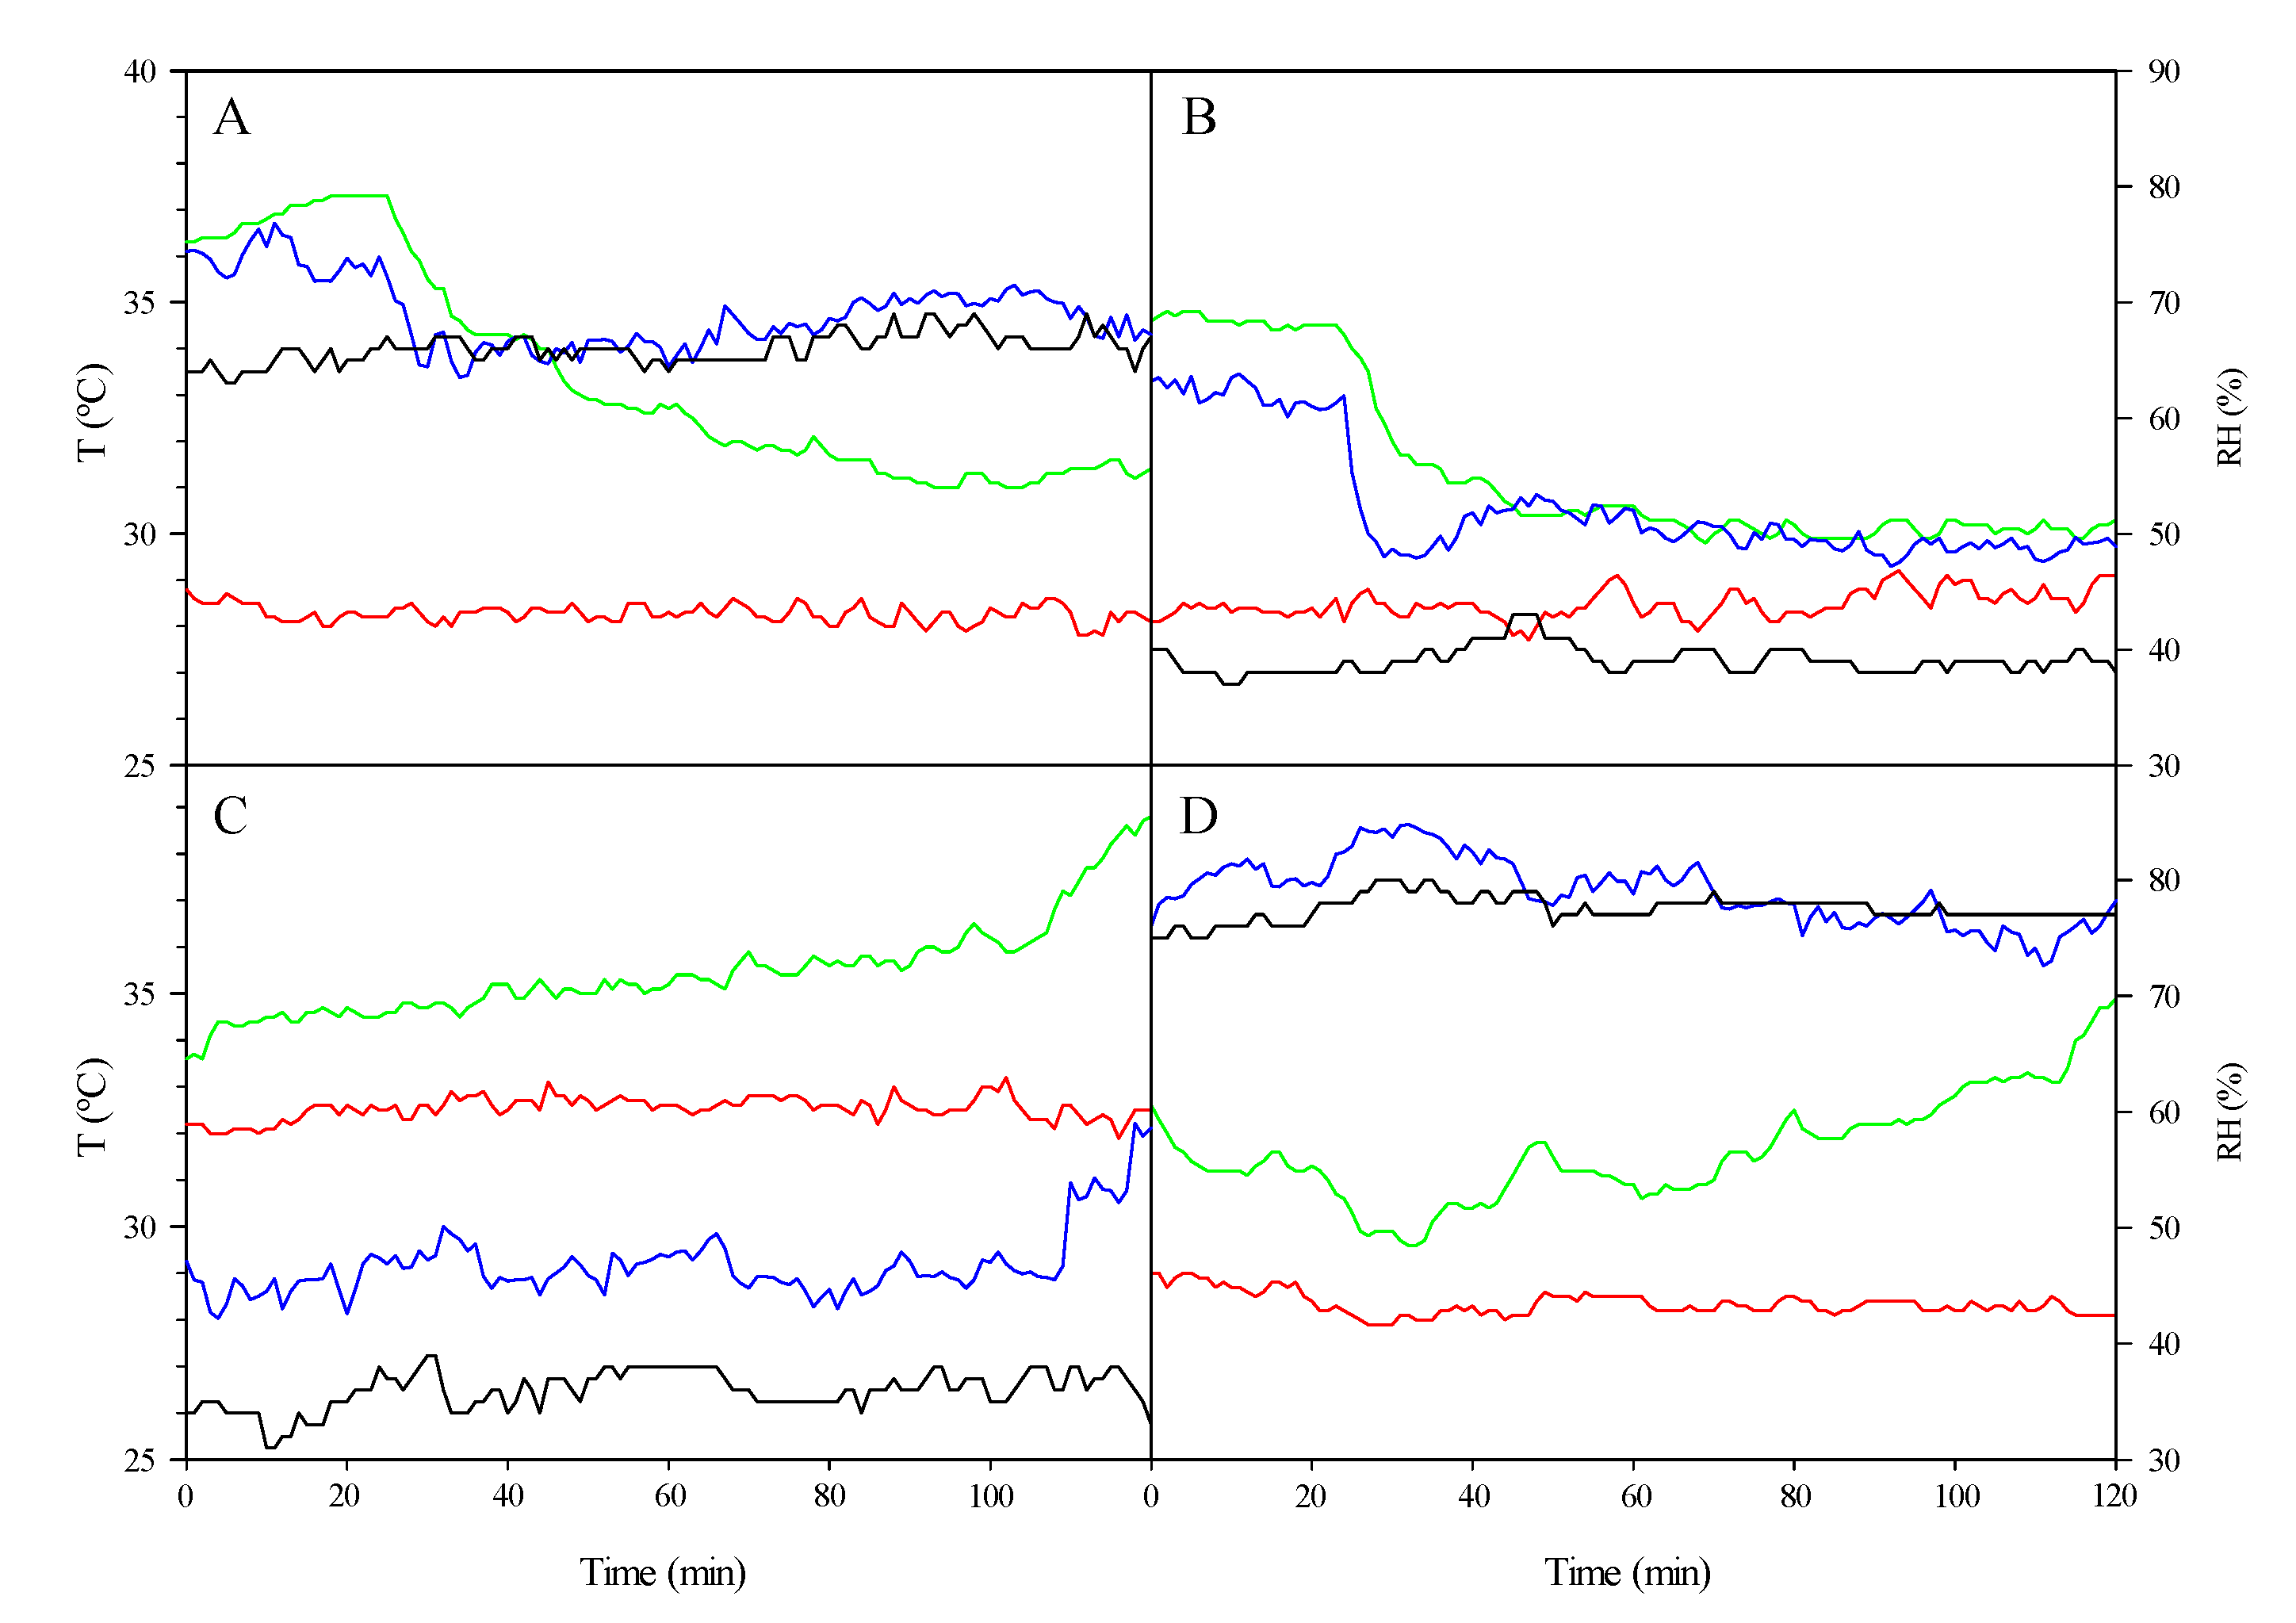
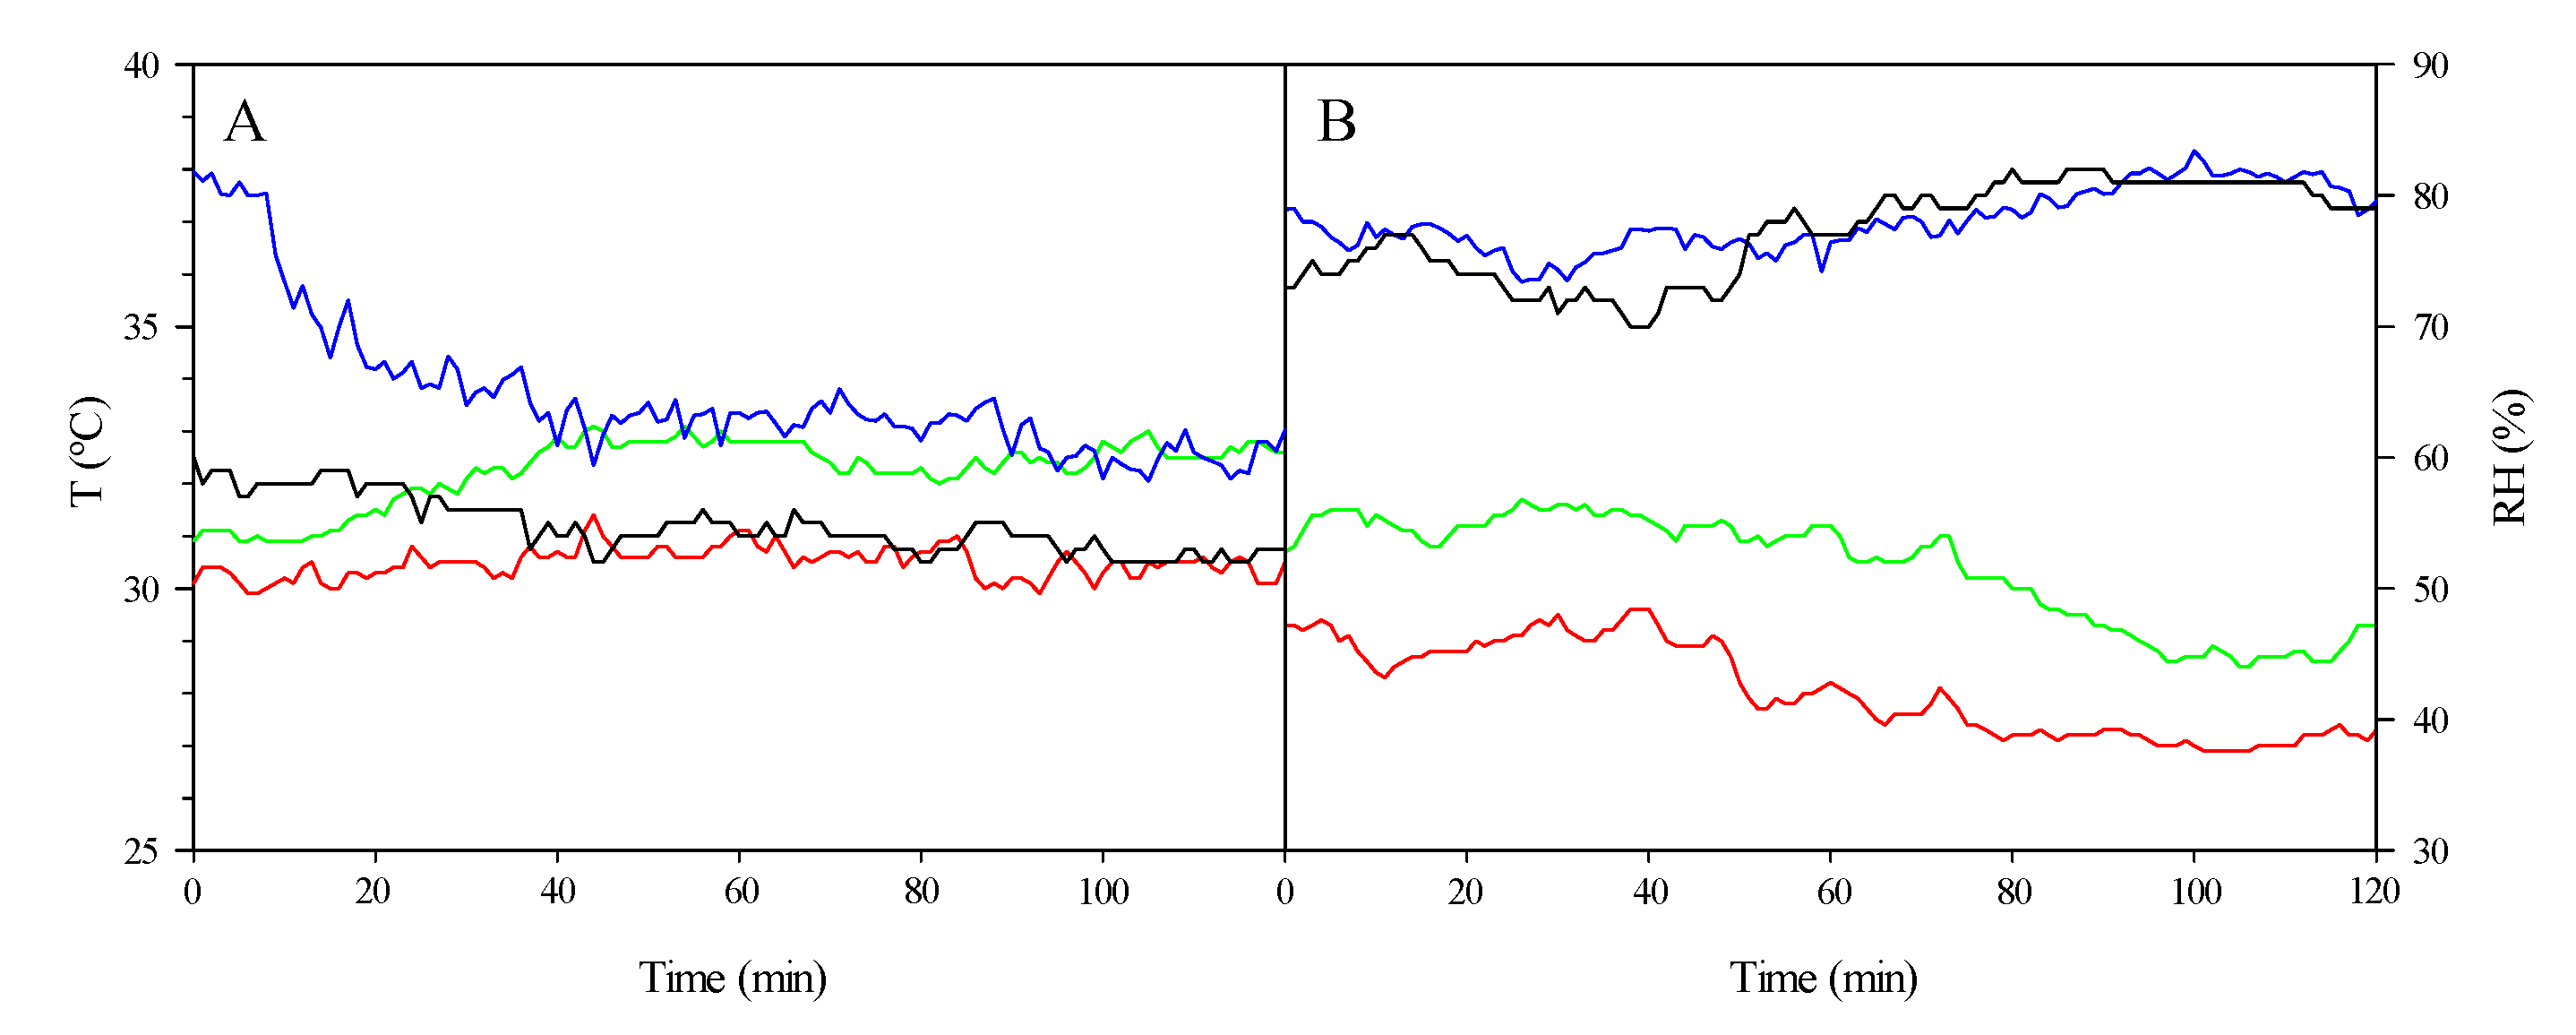
Agronomy 10 00752 g009
Figure 10. The temperature (indoor, green, and exterior, red) and relative humidity dynamic (indoor, blue, and exterior, black) for the roof ventilation tests between 13:00 and 15:00. Opening (ΔV > 0; test 2, (A) and test 9, (B)); Closing (ΔV < 0; test 3, (C) and test 10, (D)).
Agronomy 10 00752 g010
Figure 11. Temperature dynamics (indoor, green, and outdoor, red) and relative humidity (indoor, blue, and outdoor, black) during shading test 11 between 13:00 and 15:00 h.
Agronomy 10 00752 g011
Figure 12. Temperature (indoor, green, and outdoor, red) and relative humidity dynamics (indoor, blue, and outdoor, black) during roof and shaded ventilation (V + S) tests between 13:00 and 15:00 h ((A): test 5; (B): test 12).
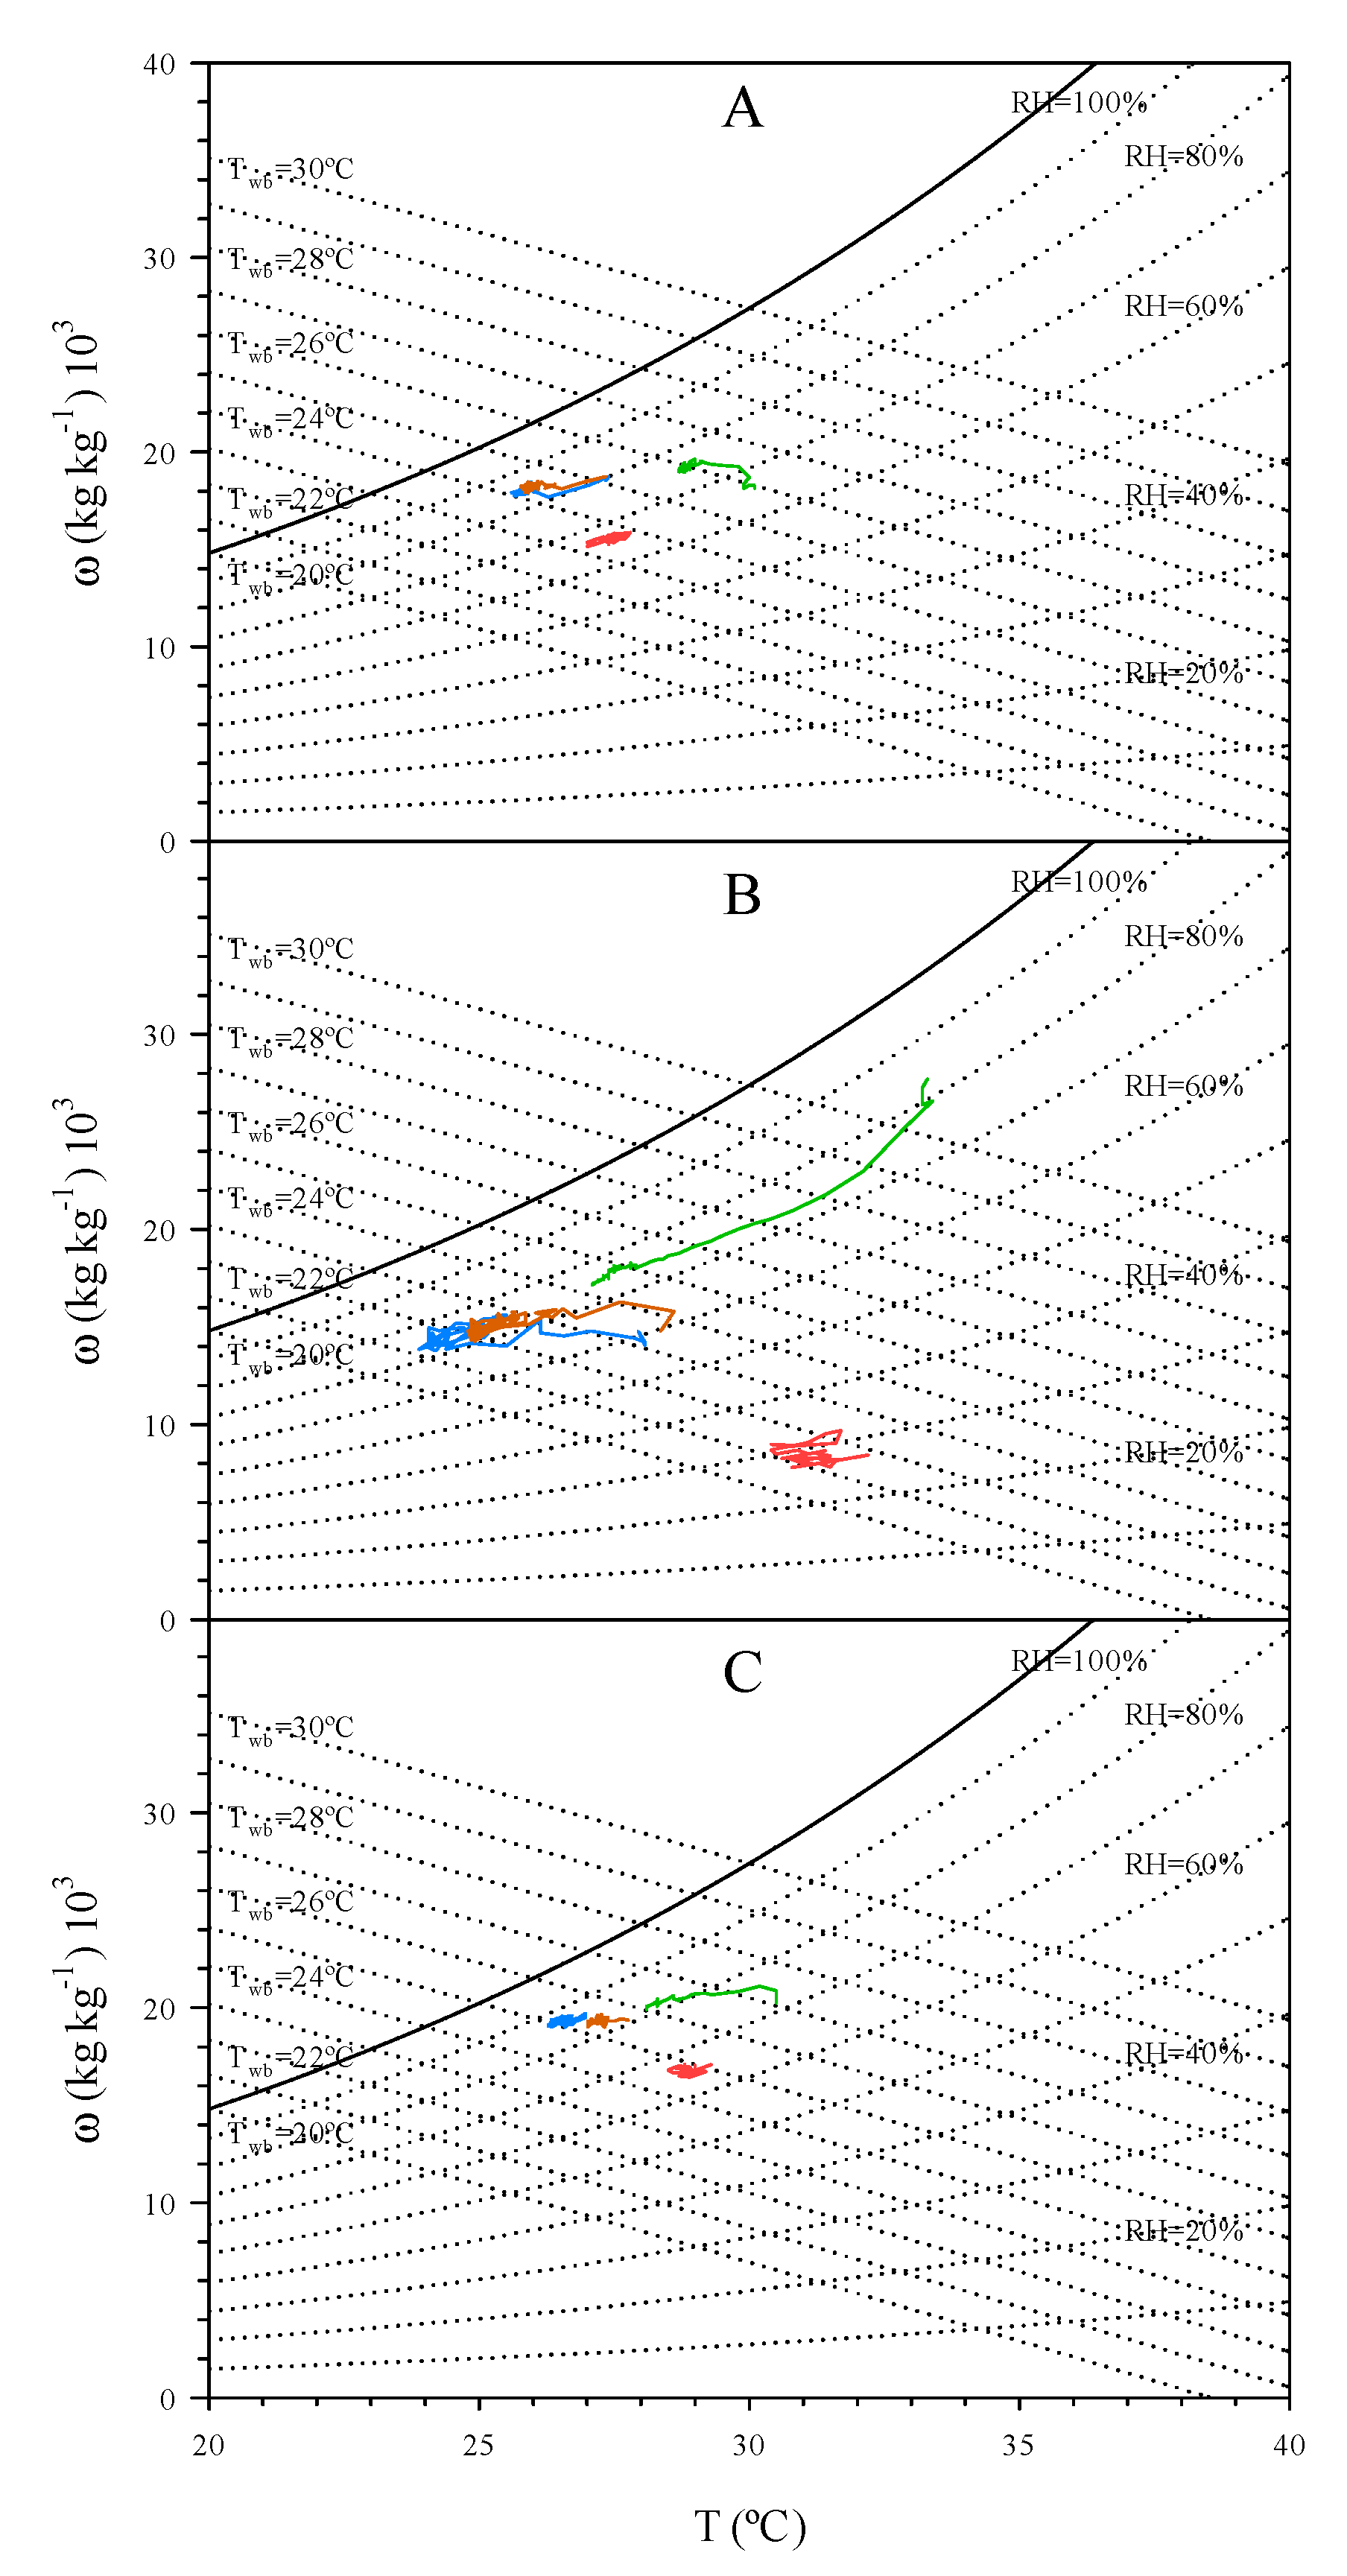
Agronomy 10 00752 g012
Figure 13. The state of the air outside (red), in the pre-chamber (blue), at the air duct end (orange) and in the greenhouse (green) during the fan-pad (P) system tests combined with roof ventilation (V) and shading (S) ((A): Test 6, P + V; (B): Test 7, P + S; (C): Test 8, P + V + S).
Agronomy 10 00752 g013
Table 1. Tests performed. The initiation, end, duration and average values for the outdoor climate properties during testing (fan-pad system, S; ventilation, V; shading, S; 0: Off; 1: On).
TestDateOn/Off (hh:mm)PVST (°C)HR (%)SR (W m−2)v (m s−1)D (Angle, °)
1 (P)21/0813:00/14:0010031.7358484.588
2 (V > 0)09/0813:00/15:0001028.3669044.4190
3 (V < 0)04/0813:00/15:0001032.5368933.5185
4 (S)12/0813:00/14:0000131.0319066.199
5 (V + S)03/0813:00/15:0001130.5548903.7190
6 (P + V)23/0813:00/14:0011027.4678683.5198
7 (P + S)22/0813:00/14:0010130.4358634.8177
8 (P + V + S)18/0813:00/14:0011128.9668573.5157
9 (V > 0)11/0813:00/15:0001028.5399035.8119
10 (V < 0)07/0813:00/15:0001028.4775683.8185
11 (S)13/0813:00/14:0000130.2358525.294
12 (V + S)08/0813:00/15:0001128.1776734.6161
13 (P + V)25/0813:00/14:0011028.2668433.8193
14 (P + V + S)24/0813:00/14:0011126.5638694.5195
Table 2. The average values and standard deviation of the different operating parameters for the fan-pad system in test 1.
Operating ParametersAverage Values ± Standard Deviation
To–Tc (°C)3.5 ± 0.1
To–Tg (°C)−0.3 ± 0.2
EFI (%)32.1 ± 1.0
EP (%)34.7 ± 0.3
qs (kJ kg−1)1.9 ± 0.2
ql (kJ kg−1)17.0 ± 0.1
mw/ma (kg kg−1)0.007 ± 0.000
pw (kg kg−1 h−1 m−2 °C−1)0.006 ± 0.000
Table 3. Slope values (A) and the ordinate origin (B) of the linear regressions between the specific water consumption (mw/ma (kg kg−1) 103) and the EP (%) for different outdoor RH values (RHo). The determination coefficient value, R2, and its statistical significance (***, p < 0.0001) are also indicated.
103 mw/ma = A·EP + B
RHo, %ABR2
750.0470.4070.89 ***
600.0780.6480.73 ***
450.0911.3150.71 ***
300.1032.3360.79 ***
Table 4. Values for the slope (A) and the origin ordinate (B) of the linear regressions between the air temperature at the pad output (Tp, °C) and the outside temperature (To, °C) for different exterior RH values. The determination coefficient value, R2, and its statistical significance (***, p < 0.0001) is also indicated.
Tp (°C) = A·To (°C) + B
RHo, %ABR2
751.13−5.580.99 ***
601.23−10.830.99 ***
451.30−15.910.99 ***
302.39−23.110.99 ***
Table 5. Average values and standard deviation of the different fan-pad system operating parameters. The tests analysed are the fan-pad system (P) together with roof ventilation (P + V, test 6), with shading (P + S, test 7) and with both (P + V + S, test 8).
Operating ParametersP + VP + SP + V + S
To–Tc (°C)−1.4 ± 0.06.2 ± 0.11.7 ± 0.0
To–Tg (°C)−1.6 ± 0.13.1 ± 0.10.5 ± 0.0
EFI (%)29.2 ± 0.852.3 ± 0.834.4 ± 0.5
EP (%)34.5 ± 0.429.9 ± 0.428.7 ± 0.3
qs (kJ kg−1)0.3 ± 0.1−3.0 ± 0.2−0.4 ± 0.1
ql (kJ kg−1)6.6 ± 0.114.9 ± 0.26.3 ± 0.1
mw/ma (kg kg−1)0.003 ± 0.0000.006 ± 0.0000.003 ± 0.000
pw (kg kg−1 h−1 m−2 °C−1)0.006 ± 0.0000.003 ± 0.0000.004 ± 0.000

