Strengths and Weaknesses of National Variety Trial Data for Multi-Environment Analysis: A Case Study on Grain Yield and Protein Content

 , , and
Abstract
:1. Introduction
2. Materials and Methods
2.1. General NVT Protocols
2.2. Multi-Environmental Analysis and Graph Depiction
3. Results
4. Discussion
5. Conclusions
Supplementary Materials
Author Contributions
Funding
Acknowledgments
Conflicts of Interest
References
- Shewry, P.R.; Hey, S.J. The contribution of wheat to human diet and health. Food Energy Secur. 2015, 4, 178–202. [Google Scholar] [CrossRef]
- Curtis, T.; Halford, N.G. Food security: The challenge of increasing wheat yield and the importance of not compromising food safety. Ann. Appl. Boil. 2014, 164, 354–372. [Google Scholar] [CrossRef] [Green Version]
- Godfray, H.C.J.; Beddington, J.R.; Crute, I.R.; Haddad, L.; Lawrence, D.; Muir, J.F.; Pretty, J.; Robinson, S.; Thomas, S.M.; Toulmin, C. Food security: The challenge of feeding 9 billion people. Science 2010, 327, 812–818. [Google Scholar] [CrossRef] [Green Version]
- FAOSTAT. Available online: http://faostat.fao.org/default.aspx (accessed on 20 February 2020).
- FAO. How to Feed the World 2050; Food and Agriculture Organization of the United Nations: Rome, Italy, 2009. [Google Scholar]
- Pardey, P.; Beddow, J.; Hurley, T.; Beatty, T.; Eidman, V. A bounds analysis of world food futures: Global agriculture through to 2050. Aust. J. Agric. Resour. Econ. 2014, 58, 571–589. [Google Scholar] [CrossRef] [Green Version]
- Husenov, B.; Makhkamov, M.; Garkava-Gustavsson, L.; Muminjanov, H.; Johansson, E. Breeding for wheat quality to assure food security of a staple crop: The case study of Tajikistan. Agric. Food Secur. 2015, 4, 9. [Google Scholar] [CrossRef]
- Kuhn, J.C.; Stubbs, T.L.; Carter, A.H. Effect of the gpc-b1 allele in hard red winter wheat in the US pacific northwest. Crop. Sci. 2016, 56, 1009–1017. [Google Scholar] [CrossRef]
- Laidig, F.; Piepho, H.P.; Rentel, D.; Drobek, T.; Meyer, U.; Huesken, A. Breeding progress, environmental variation and correlation of winter wheat yield and quality traits in german official variety trials and on-farm during 1983–2014. Theor. Appl. Genet. 2017, 130, 223–245. [Google Scholar] [CrossRef] [Green Version]
- Blakeney, A.B.; Cracknell, R.L.; Crosbie, G.B.; Jefferies, S.P.; Miskelly, D.M.; O’Brien, L.; Panozzo, J.F.; Suter, D.A.I.; Solah, V.; Watts, T.; et al. Understanding Australian Wheat Quality: A Basic Introduction to Australian Wheat Quality; GRDC: Canberra, Australia, 2009. [Google Scholar]
- Oury, F.X.; Bérard, P.; Brancourt-Hulmel, M.; Depatureaux, C.; Doussinault, G.; Galic, N.; Giraud, A.; Heumez, E.; Lecomte, C.; Pluchard, P.; et al. Yield and grain protein concentration in bread wheat: A review and a study of multi-annual data from a french breeding program. J. Genet. Breed. 2003, 57, 59–68. [Google Scholar]
- Cooper, M.; Woodruff, D.R.; Philips, I.G.; Basford, K.E.; Gilmour, A.R. Genotype-by-management interactions for grain yield and grain protein concentration of wheat. Field Crop. Res. 2001, 70, 87–88. [Google Scholar] [CrossRef]
- Zörb, C.; Ludewig, U.; Hawkesford, M.J. Perspective on wheat yield and quality with reduced nitrogen supply. Trends Plant Sci. 2018, 23, 1029–1037. [Google Scholar] [CrossRef] [Green Version]
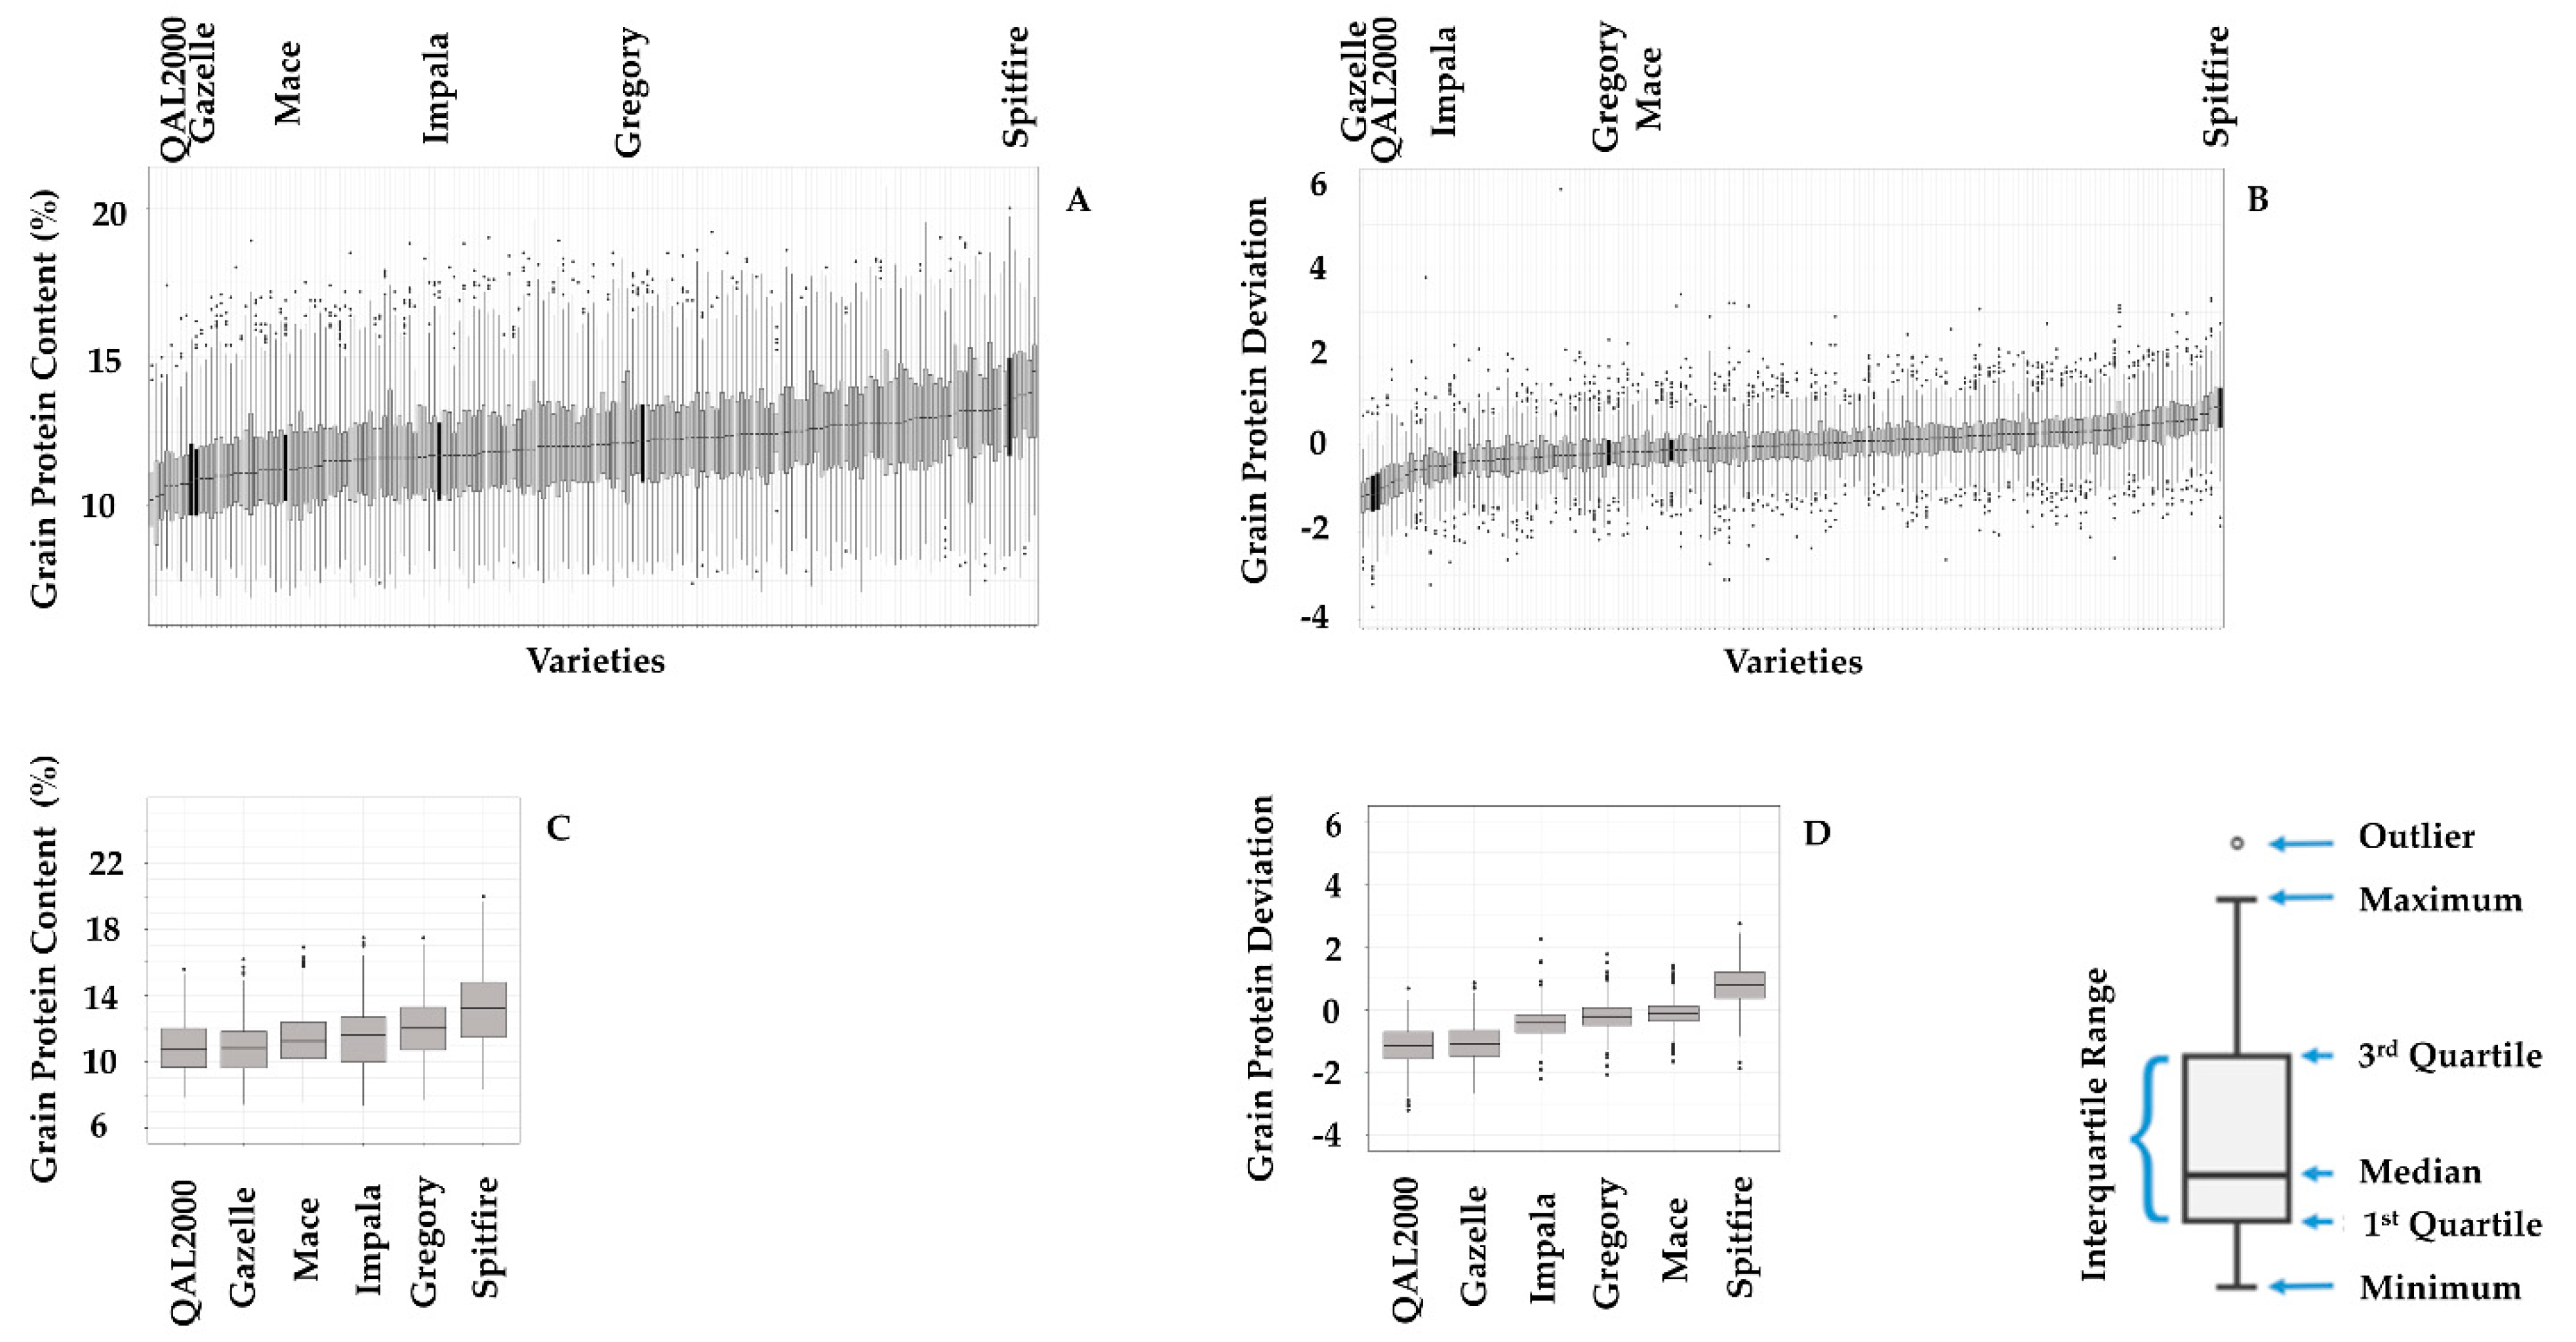
- Monaghan, J.; Snape, J.; Chojecki, A.; Kettlewell, P. The use of grain protein deviation for identifying wheat cultivars with high grain protein concentration and yield. Int. J. Plant Breed. 2001, 122, 309–317. [Google Scholar]
- Bogard, M.; Allard, V.; Brancourt-Hulmel, M.; Heumez, E.; Machet, J.-M.; Jeuffroy, M.-H.; Gate, P.; Martre, P.; Le Gouis, J. Deviation from the grain protein concentration–grain yield negative relationship is highly correlated to post-anthesis n uptake in winter wheat. J. Exp. Bot. 2010, 61, 4303–4312. [Google Scholar] [CrossRef] [PubMed] [Green Version]
- Michel, S.; Loschenberger, F.; Ametz, C.; Pachler, B.; Sparry, E.; Burstmayr, H. Simultaneous selection for grain yield and protein content in genomics-assisted wheat breeding. Theor. Appl. Genet. 2019, 132, 1745–1760. [Google Scholar] [CrossRef] [PubMed]
- Bilgin, O.; Guzman, C.; Baser, I.; Crossa, J.; Korkut, K.Z. Evaluation of grain yield and quality traits of bread wheat genotypes cultivated in northwest turkey. Crop Sci. 2016, 56, 73–84. [Google Scholar] [CrossRef]
- Thorwarth, P.; Piepho, H.P.; Zhao, Y.; Ebmeyer, E.; Schacht, J.; Schachschneider, R.; Kazman, E.; Reif, J.C.; Würschum, T.; Longin, C.F.H. Higher grain yield and higher grain protein deviation underline the potential of hybrid wheat for a sustainable agriculture. Plant Breed. 2018, 137, 326–337. [Google Scholar] [CrossRef]
- Oury, F.X.; Godin, C. Yield and grain protein concentration in bread wheat: How to use the negative relationship between the two characters to identify favourable genotypes? Euphytica 2007, 157, 45–57. [Google Scholar] [CrossRef]
- Mahjourimajd, S.; Taylor, J.; Rengel, Z.; Khabaz-Saberi, H.; Kuchel, H.; Okamoto, M.; Langridge, P. The genetic control of grain protein content under variable nitrogen supply in an australian wheat mapping population. PLoS ONE 2016, 11, e0159371. [Google Scholar] [CrossRef]
- Brill, R.; Gardner, M.; Fettell, N.; Martin, P.; Haskins, B.; McMullen, G. Grain Protein Concentration of Several Commercial Wheat Varieties. In Proceedings of the 16th ASA Conference: Capturing Opportunities and Overcoming Obstacles in Australian Agronomy, Armidale, Australia, 14–18 October 2012. [Google Scholar]
- Fettell, N.; Brill, R.; Gardner, M.; McMullen, G. Yield and Protein Relationships in Wheat; GRDC: Canberra, Australia, 2012. [Google Scholar]
- Giles, T. How nvt works. In National Variety Trials Supplement; Leonard, E., Ed.; GRDC: Canberra, Australia, 2012; p. 3. [Google Scholar]
- Giles, T.; Bedggood, A.; Kelly, A. Trials with maximum value. In National Variety Trials Supplement; Leonard, E., Ed.; GRDC: Canberra, Australia, 2012. [Google Scholar]
- Hochman, Z. Pushing the yield frontier. In National Variety Trials Supplement; Leonard, E., Ed.; GRDC: Canberra, Australia, 2012; p. 13. [Google Scholar]
- Braun, H.J.; Rajaram, S.; vanGinkel, M. Cimmyt’s approach to breeding for wide adaptation. Euphytica 1996, 92, 175–183. [Google Scholar] [CrossRef]
- Hodson, D.P.; White, J.W. Use of spatial analyses for global characterization of wheat-based production systems. J. Agric. Sci. 2007, 145, 115–125. [Google Scholar] [CrossRef]
- Chenu, K.; Deihimfard, R.; Chapman, S.C. Large-scale characterization of drought pattern: A continent-wide modelling approach applied to the australian wheatbelt spatial and temporal trends. New Phytol. 2013, 198, 801–820. [Google Scholar] [CrossRef]
- Reynolds, M.; Dreccer, F.; Trethowan, R. Drought-adaptive traits derived from wheat wild relatives and landraces. J. Exp. Bot. 2007, 58, 177–186. [Google Scholar] [CrossRef] [PubMed] [Green Version]
- Dupont, F.M.; Hurkman, W.J.; Vensel, W.H.; Tanaka, C.; Kothari, K.M.; Chung, O.K.; Altenbach, S.B. Protein accumulation and composition in wheat grains: Effects of mineral nutrients and high temperature. Eur. J. Agron. 2006, 25, 96–107. [Google Scholar] [CrossRef]
- Flagella, Z.; Giuliani, M.M.; Giuzio, L.; Volpi, C.; Masci, S. Influence of water deficit on durum wheat storage protein composition and technological quality. Eur. J. Agron. 2010, 33, 197–207. [Google Scholar] [CrossRef]
- Rharrabti, Y.; Villegas, D.; Royo, C.; Martos-Nunez, V.; del Moral, L.F.G. Durum wheat quality in mediterranean environments ii. Influence of climatic variables and relationships between quality parameters. Field Crop. Res. 2003, 80, 133–140. [Google Scholar] [CrossRef]
- Rahimi Eichi, V.; Okamato, M.; Haefele, S.M.; Jewell, N.; Brien, C.; Garnett, T.; Langridge, P. Understanding the interactions between biomass, grain production and grain protein content in high and low protein wheat genotypes under controlled environments. Agronomy 2019, 9, 706. [Google Scholar] [CrossRef] [Green Version]
- Sadras, V.O.; McDonald, G. Benchmarking Wheat Water Use Efficiency: Accounting for Climate and Nitrogen; GRDC: Adelaide, Australia, 2012. [Google Scholar]
- Stoddard, F.L.; Marshall, D.R. Variability in grain protein in australian hexaploid wheats. Aust. J. Agric. Res. 1990, 41, 277–288. [Google Scholar] [CrossRef]
- Smith, A.B.; Thompson, R.; Butler, D.G.; Cullis, B.R. The design and analysis of variety trials using mixtures of composite and individual plot samples. J. R. Stat. Soc. Ser. C (Appl. Stat.) 2011, 60, 437–455. [Google Scholar] [CrossRef]
- Chapman, S.C.; Hammer, G.L.; Meinke, H. A sunflower simulation model: I. Model development. Agron. J. 1993, 85, 725–735. [Google Scholar] [CrossRef]
- Chenu, K.; Cooper, M.; Hammer, G.L.; Mathews, K.L.; Dreccer, M.F.; Chapman, S.C. Environment characterization as an aid to wheat improvement: Interpreting genotype–environment interactions by modelling water-deficit patterns in north-eastern australia. J. Exp. Bot. 2011, 62, 1743–1755. [Google Scholar] [CrossRef] [Green Version]
- Ababaei, B.; Chenu, K. Heat shocks increasingly impede grain filling but have little effect on grain setting across the Australian wheatbelt. Agric. For. Meteorol. 2020, 284, 107889. [Google Scholar] [CrossRef]
- R Foundation for Statistical Computing. R: A Language and Environment for Statistical Computing; R Development Core Team: Vienna, Austria, 2009. [Google Scholar]
- Bureau of Meteorology. Climate Statistics for Australian Locations, Monthly Climate Statistics, Summary Statistics, 29th ed.; Australian Government: Launceston, Ti Tree Bend, Australia, 2019. [Google Scholar]
- Acuna, T.B.; Dean, G.; Riffkin, P. Constraints to achieving high potential yield of wheat in a temperate, high-rainfall environment in south-eastern Australia. Crop Pasture Sci. 2011, 62, 125–136. [Google Scholar] [CrossRef]
- Zhang, H.; Turner, N.C.; Poole, M.L.; Simpson, N. Crop production in the high rainfall zones of Southern Australia—Potential, constraints and opportunities. Aust. J. Exp. Agric. 2006, 46, 1035–1049. [Google Scholar] [CrossRef]
- Chen, W.; Bell, R.W.; Brennan, R.F.; Bowden, J.W.; Dobermann, A.; Rengel, Z.; Porter, W. Key crop nutrient management issues in the western australia grains industry: A review. Aust. J. Soil Res. 2009, 47, 1–18. [Google Scholar] [CrossRef]
- Hill, N.; Zhang, H.; Trezise, T.; Young, J.; Moyes, N.; Carslake, L.; Turner, N.C.; Anderson, W.; Poole, M. Successful Cropping in the High Rainfall Zone of Western Australia: Crop Research and Extension in the Zone; Department of Agriculture and Food: Perth, Western Australia, 2005. [Google Scholar]
- Gooding, M.J.; Ellis, R.H.; Shewry, P.R.; Schofield, J.D. Effects of restricted water availability and increasedtemperature on the grain filling, dryingand quality of winter wheat. J. Cereal Sci. 2003, 37, 295–309. [Google Scholar] [CrossRef]
- Barbottin, A.; Lecomte, C.; Bouchard, C.; Jeuffroy, M.H. Nitrogen remobilization during grain filling in wheat: Genotypic and environmental effects. Crop Sci. 2005, 45, 1141–1150. [Google Scholar] [CrossRef]
- Triboi, E.; Martre, P.; Triboi-Blondel, A.M. Environmentally-induced changes in protein composition in developing grains of wheat are related to changes in total protein content. J. Exp. Bot. 2003, 54, 1731–1742. [Google Scholar] [CrossRef]
- Crosbie, G.B.; Fisher, H. Variation in wheat protein content: The effect of environment. J. Agric. West. Aust. 1987, 28, 124–127. [Google Scholar]
- Simmonds, D.H. Wheat and Wheat Quality in Australia; CSIRO Publishing: Clayton, Australia, 1989. [Google Scholar]
- Torrion, J.A.; Walsh, O.S.; Liang, X.; Bicego, B.; Sapkota, A. Managing ‘egan’ wheat with a gene for high grain protein. Agrosystems Geosci. Environ. 2019, 2, 1–8. [Google Scholar] [CrossRef]
- Zorb, C.; Becker, E.; Merkt, N.; Kafka, S.; Schmidt, S.; Schmidhalter, U. Shift of grain protein composition in bread wheat under summer drought events. J. Plant Nutr. Soil Sci. 2017, 180, 49–55. [Google Scholar] [CrossRef]
- Stone, P.J.; Nicolas, M.E. A survey of the effects of high-temperature during grain filling on yield and quality of 75 wheat cultivars. Aust. J. Agric. Res. 1995, 46, 475–492. [Google Scholar] [CrossRef]
- Daniel, C.; Triboi, E. Changes in wheat protein aggregation during grain development: Effects of temperatures and water stress. Eur. J. Agron. 2002, 16, 1–12. [Google Scholar] [CrossRef]
- Anderson, W.K.; Sawkins, D. Production practices for improved grain yield and quality of soft wheats in western australia. Aust. J. Exp. Agric. 1997, 37, 173–180. [Google Scholar] [CrossRef]
- Spragg, J. Benefit to Australian Grain Growers in the Feed Grain Market; Grains Research and Development Corporation: Victoria, Australia, 2008. [Google Scholar]
- Turner, N.C. Agronomic options for improving rainfall-use efficiency of crops in dryland farming systems. J. Exp. Bot. 2004, 55, 2413–2425. [Google Scholar] [CrossRef] [PubMed] [Green Version]
- Rozbicki, J.; Ceglinska, A.; Gozdowski, D.; Jakubczak, M.; Cacak-Pietrzak, G.; Madry, W.; Golba, J.; Piechocinski, M.; Sobczynski, G.; Studnicki, M.; et al. Influence of the cultivar, environment and management on the grain yield and bread-making quality in winter wheat. J. Cereal Sci. 2015, 61, 126–132. [Google Scholar] [CrossRef]
- Fischer, R.A.; Howe, G.N.; Ibrahim, Z. Irrigated spring wheat and timing and amount of nitrogen-fertilizer. 1. Grain-yield and protein-content. Field Crop. Res. 1993, 33, 37–56. [Google Scholar]
- Smith, A.B.; Cullis, B.R. Plant breeding selection tools built on factor analytic mixed models for multi-environment trial data. Euphytica 2018, 214, 143. [Google Scholar] [CrossRef] [Green Version]
- Anderson, W.K.; Hamza, M.A.; Sharma, D.L.; D’Antuono, M.F.; Hoyle, F.C.; Hill, N.; Shackley, B.J.; Amjad, M.; Zaicou-Kunesch, C. The role of management in yield improvement of the wheat crop—A review with special emphasis on western australia. Aust. J. Agric. Res. 2005, 56, 1137–1149. [Google Scholar] [CrossRef]
- Anderson, W.K.; Impiglia, A. Management of dryland wheat. In Bread Wheat Improvement and Production; Curtis, B.C., Rajaram, S., Gomez Macpherson, H., Eds.; FAO: Rome, Italy, 2002; pp. 407–432. [Google Scholar]


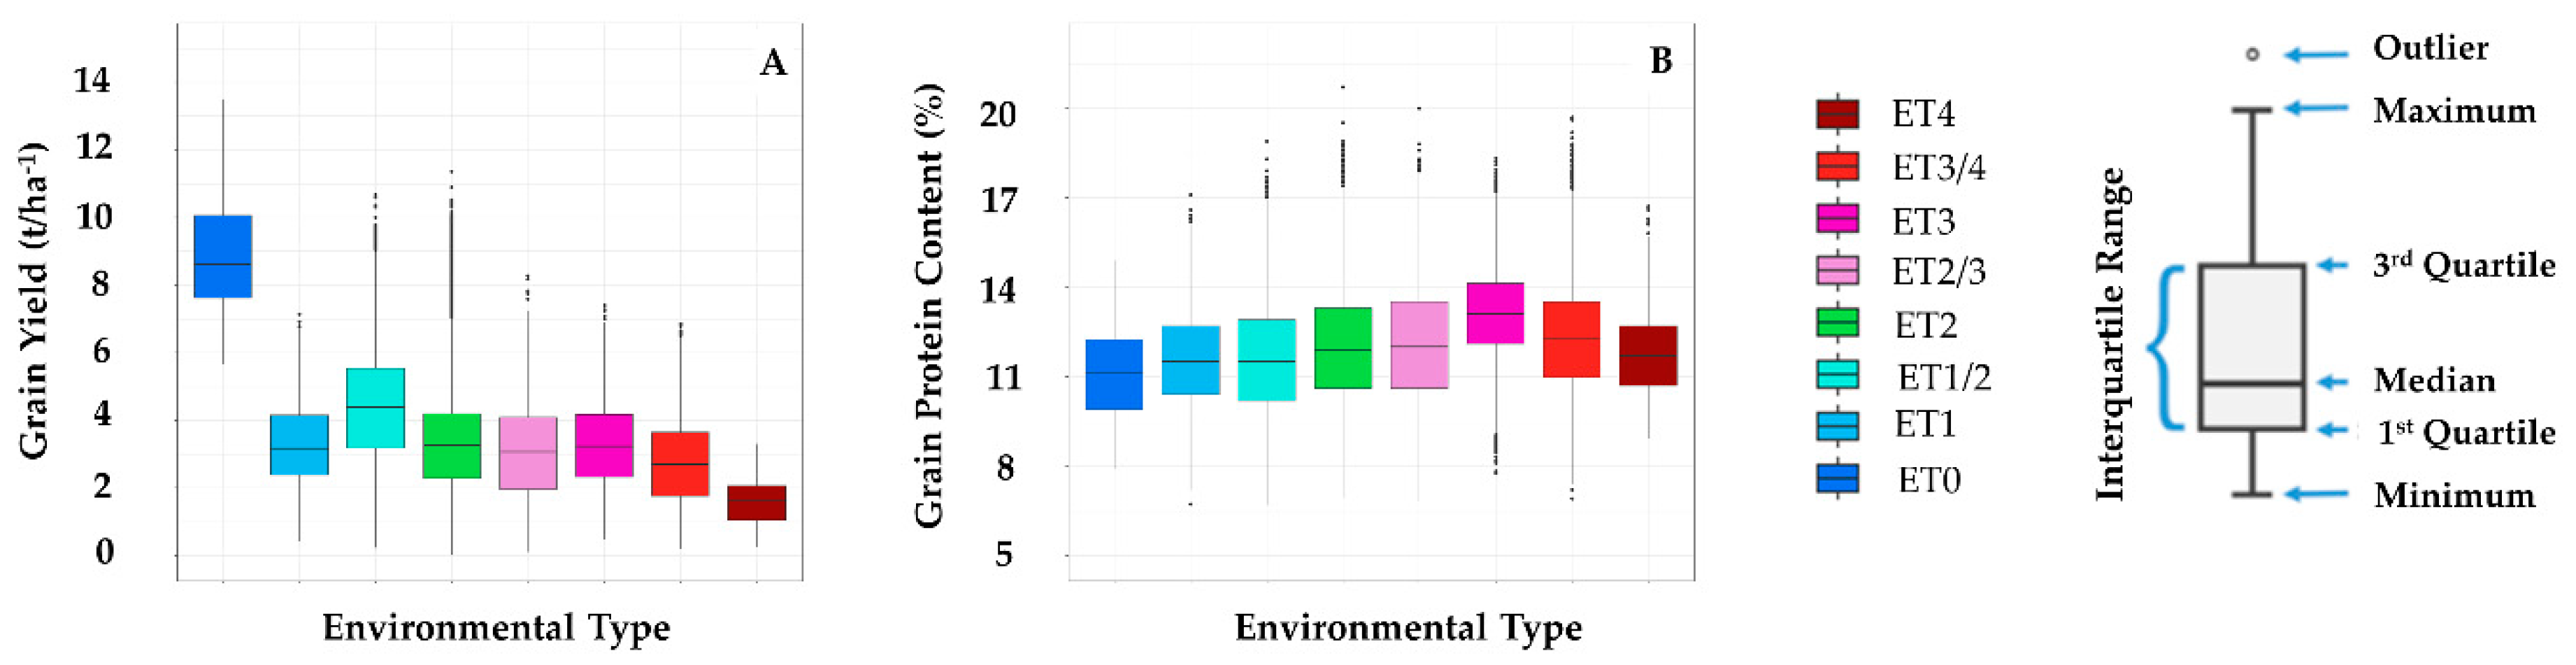
| Environment Type | ET0 | ET1 | ET1/2 | ET2 | ET2/3 | ET3 | ET3/4 | ET4 |
|---|---|---|---|---|---|---|---|---|
| Average no. of varieties per site | 20 | 32 | 41 | 43 | 40 | 43 | 38 | 28 |
| No. of years | 7 | 11 | 11 | 11 | 11 | 11 | 11 | 11 |
| No. of sites × year | 7 | 132 | 254 | 321 | 317 | 85 | 193 | 29 |
| Total no. of variety × site × year × season | 140 | 4263 | 10,347 | 13,766 | 12,597 | 3666 | 7237 | 805 |
| Environment Type | ET0 | ET1 | ET1/2 | ET2 | ET2/3 | ET3 | ET3/4 | ET4 |
|---|---|---|---|---|---|---|---|---|
| Average GPC (%) | 11.2 | 11.6 | 11.6 | 11.9 | 12.1 | 13.1 | 12.2 | 11.8 |
| Average GY (t/ha) | 9.2 | 3.3 | 4.3 | 3.1 | 2.9 | 3.2 | 2.6 | 1.6 |
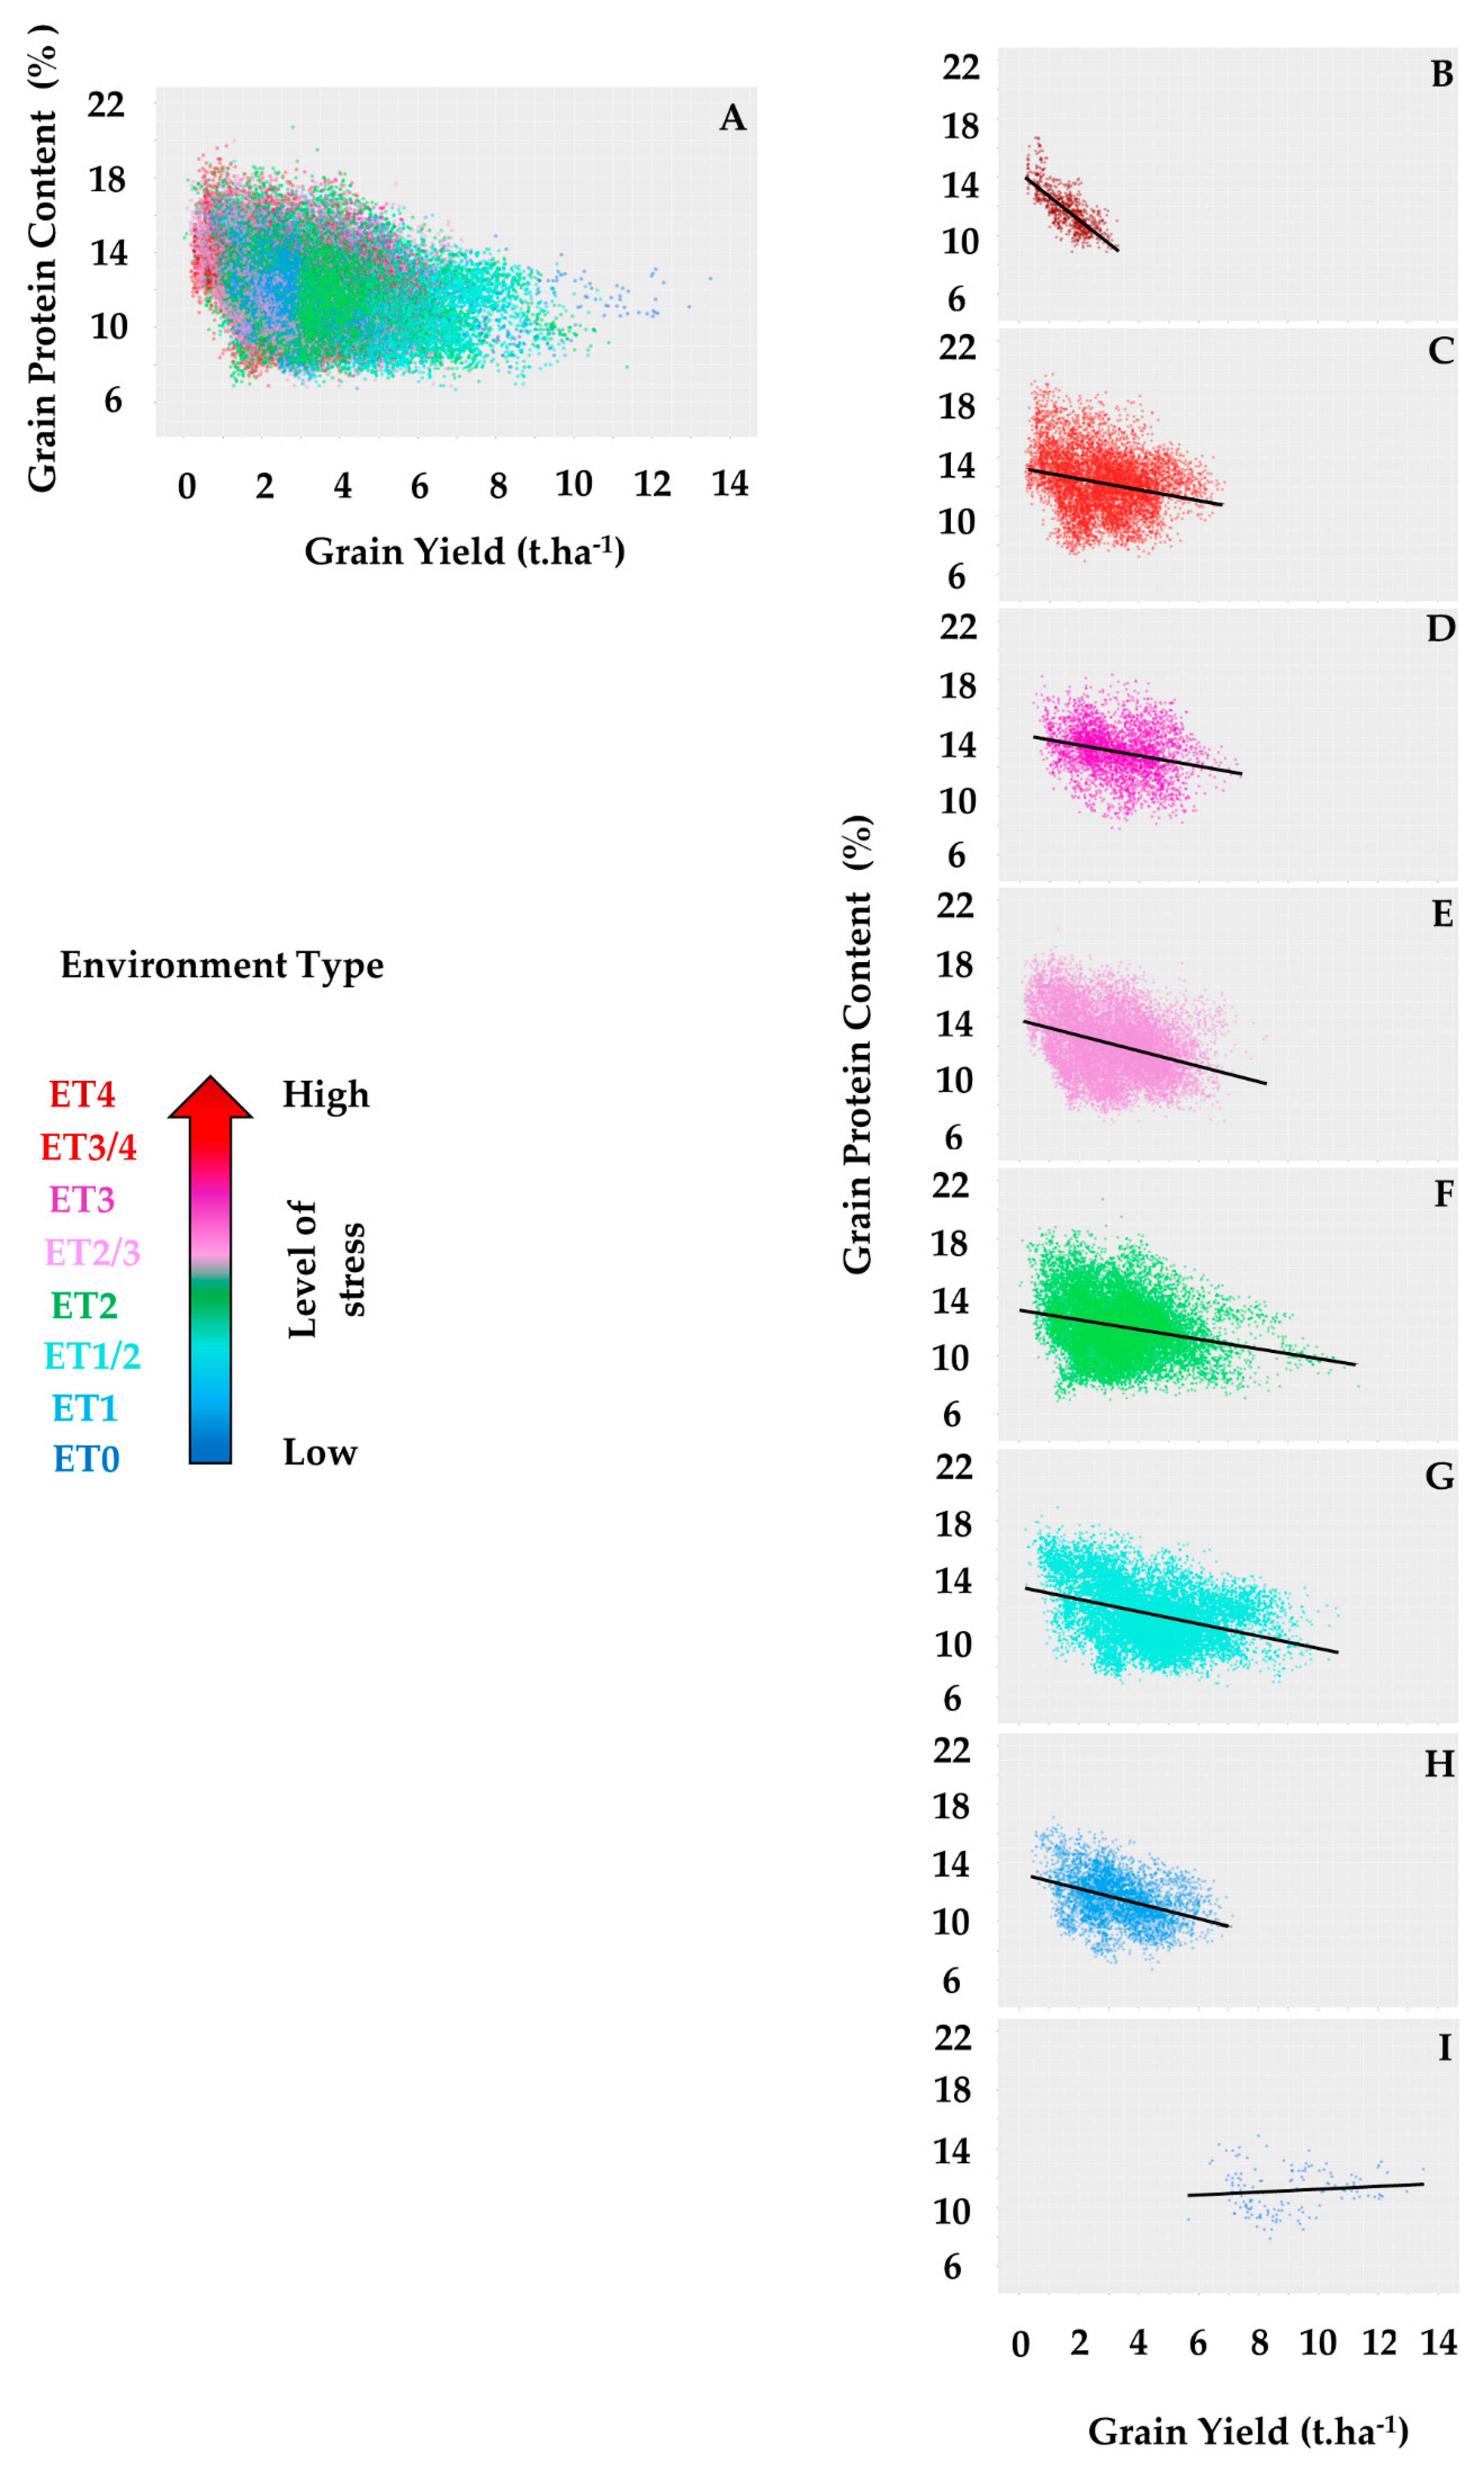
| Average slope of GY-GPC relationship | −0.45 | −1.19 | −0.93 | −1.27 | −1.43 | −1.35 | −1.44 | −1.63 |
| SE of GPC | 0.5 | 0.1 | 0.1 | 0.1 | 0.1 | 0.2 | 0.1 | 0.2 |
| SE of GY | 0.6 | 0.1 | 0.1 | 0.1 | 0.1 | 0.1 | 0.1 | 0.1 |
| Range of Average GPC (%) | 7 | 10.37 | 12.2 | 13.8 | 13.2 | 10.56 | 12.8 | 7.8 |
| Range of Average GY (t/ha) | 7.85 | 6.71 | 10.46 | 11.34 | 8.17 | 6.93 | 6.67 | 3.05 |
© 2020 by the authors. Licensee MDPI, Basel, Switzerland. This article is an open access article distributed under the terms and conditions of the Creative Commons Attribution (CC BY) license (http://creativecommons.org/licenses/by/4.0/).
Share and Cite
Eichi, V.R.; Okamoto, M.; Garnett, T.; Eckermann, P.; Darrier, B.; Riboni, M.; Langridge, P. Strengths and Weaknesses of National Variety Trial Data for Multi-Environment Analysis: A Case Study on Grain Yield and Protein Content. Agronomy 2020, 10, 753. https://0-doi-org.brum.beds.ac.uk/10.3390/agronomy10050753
Eichi VR, Okamoto M, Garnett T, Eckermann P, Darrier B, Riboni M, Langridge P. Strengths and Weaknesses of National Variety Trial Data for Multi-Environment Analysis: A Case Study on Grain Yield and Protein Content. Agronomy. 2020; 10(5):753. https://0-doi-org.brum.beds.ac.uk/10.3390/agronomy10050753
Chicago/Turabian StyleEichi, Vahid Rahimi, Mamoru Okamoto, Trevor Garnett, Paul Eckermann, Benoit Darrier, Matteo Riboni, and Peter Langridge. 2020. "Strengths and Weaknesses of National Variety Trial Data for Multi-Environment Analysis: A Case Study on Grain Yield and Protein Content" Agronomy 10, no. 5: 753. https://0-doi-org.brum.beds.ac.uk/10.3390/agronomy10050753