Sulfur Uptake from Fertilizer Fortified with Sulfate and Elemental S in Three Contrasting Climatic Zones

 ,
,
Abstract
:1. Introduction
2. Materials and Methods
2.1. Trial Overview
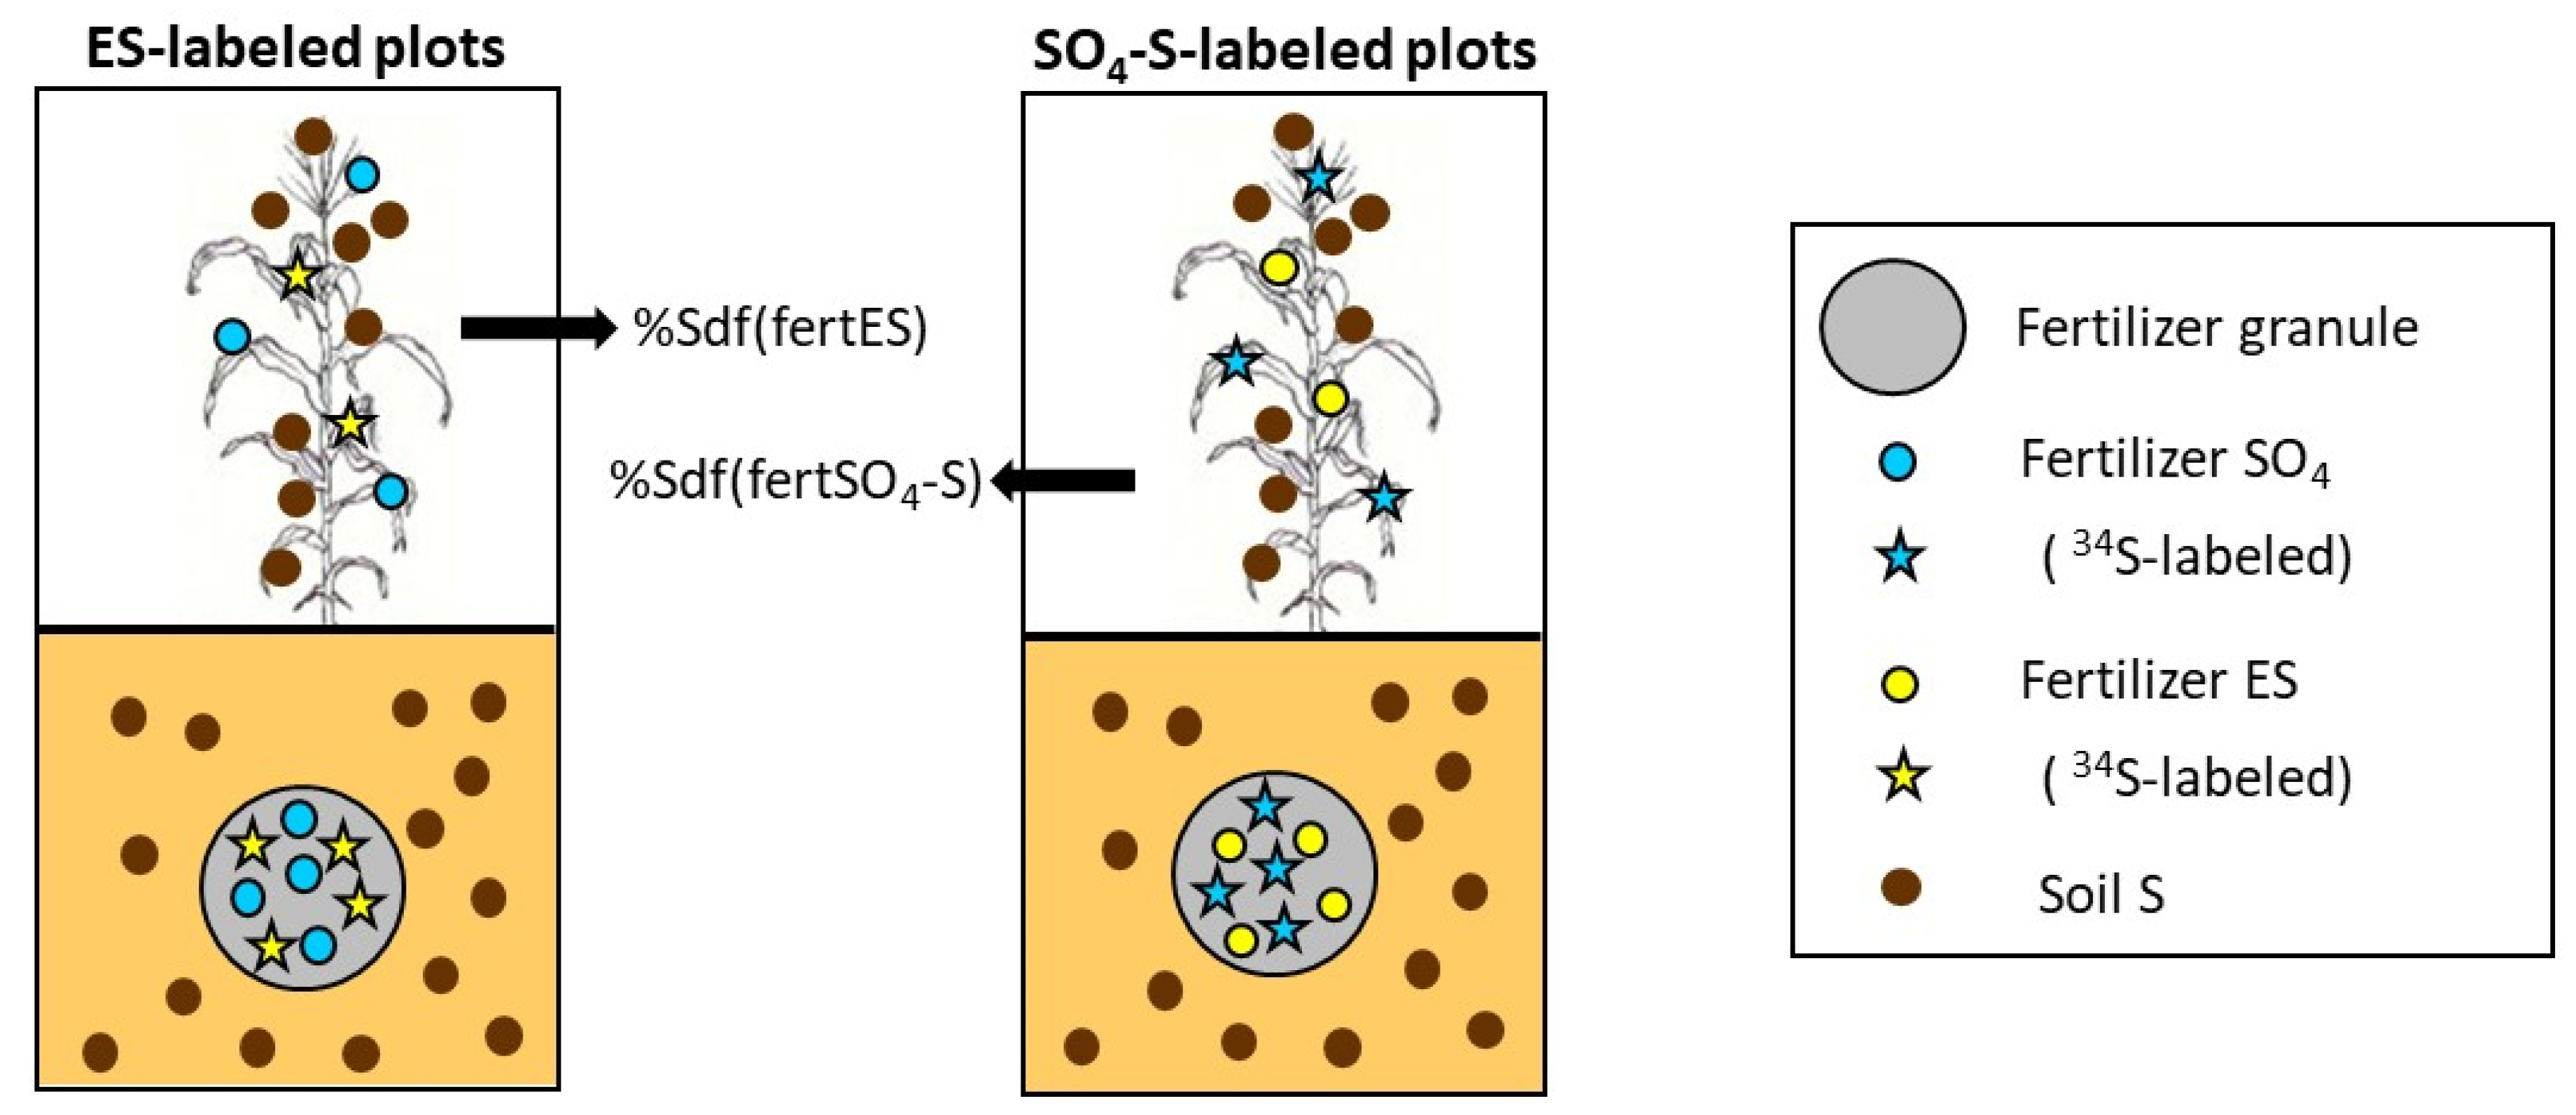
2.2. Fertilizer Labeling
2.3. Field Trials
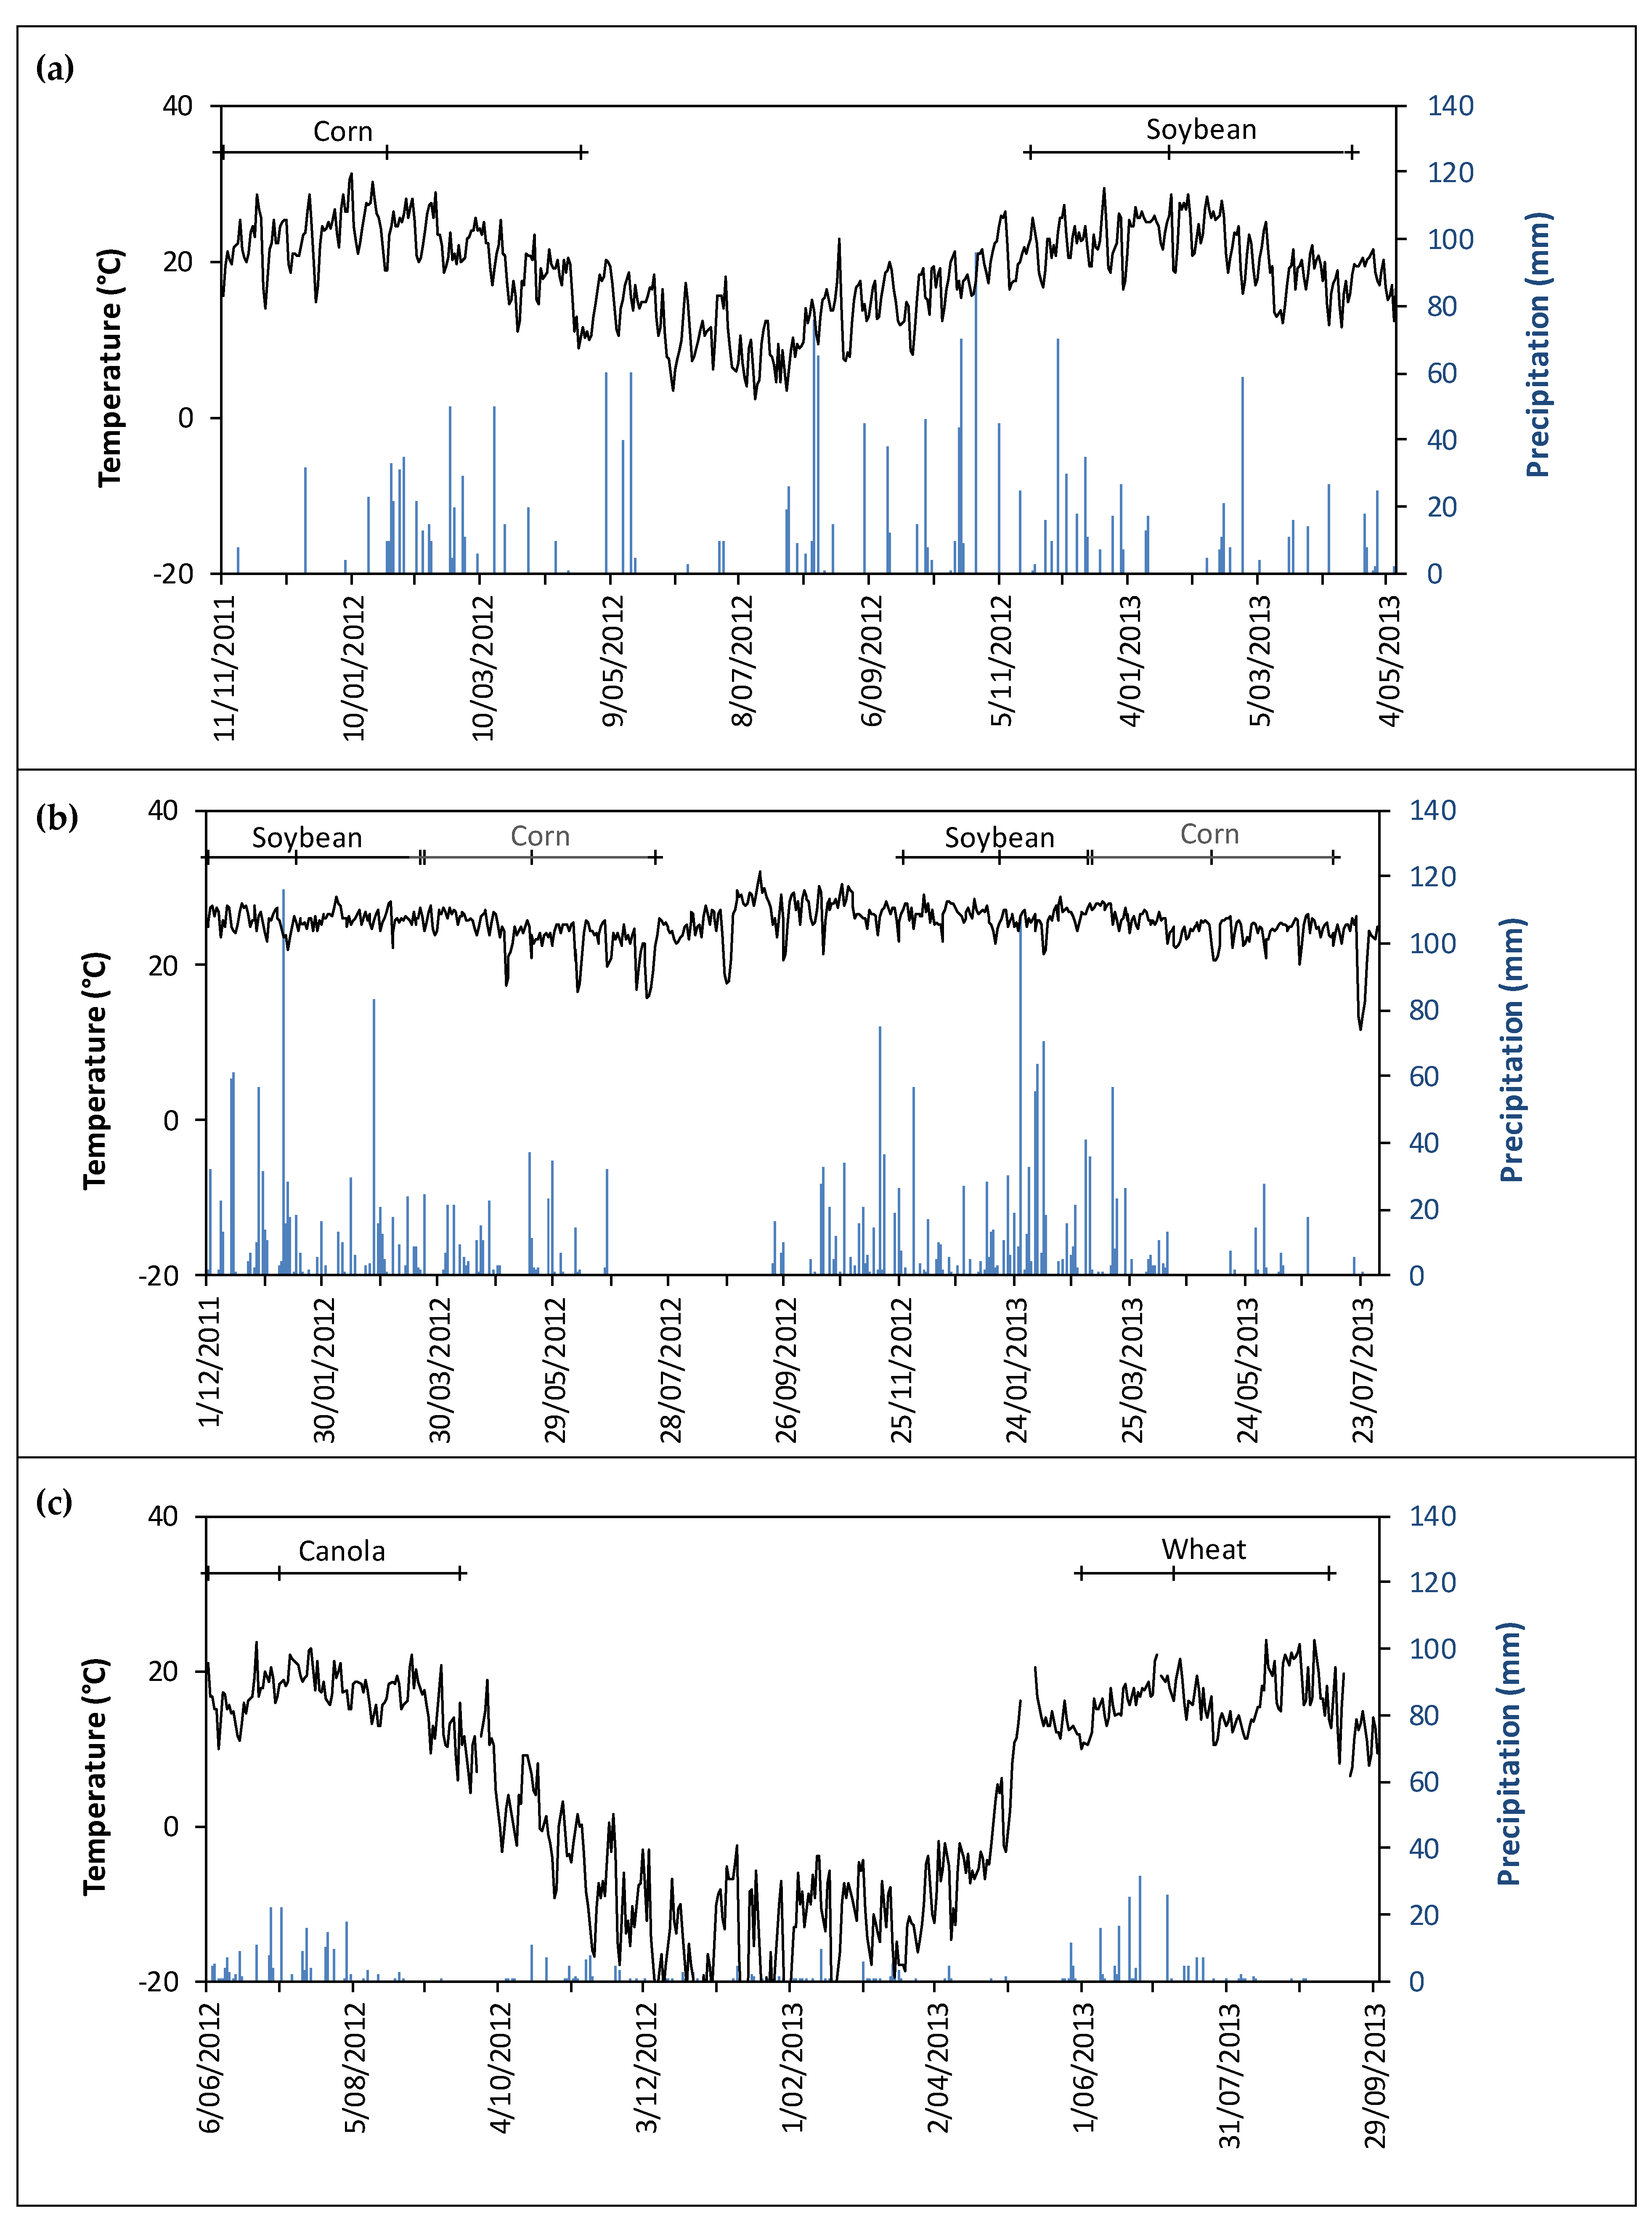
2.3.1. Argentina
2.3.2. Brazil
2.3.3. Canada
2.4. Plant Analysis
2.5. Statistical Aanalysis
3. Results
3.1. Crop Yield, S Concentrations in Plant Tissue, and Total S Uptake
3.2. Fertilizer S Uptake and Recovery
4. Discussion
5. Conclusions
Author Contributions
Funding
Acknowledgments
Conflicts of Interest
References
- Ceccotti, S.P.; Morris, R.J.; Messick, D.L. A Global Overview of the Sulphur Situation: Industry’s Background, Market, Trends, and Commercial Aspects of Sulphur Fertilizers; Nutrients in Ecosystems 2, Ed.; Springer: Dordrecht, The Netherlands, 1998; pp. 175–202. [Google Scholar]
- Curtin, D.; Syers, J. Extractability and adsorption of sulphate in soils. Eur. J. Soil Sci. 1990, 41, 305–312. [Google Scholar] [CrossRef]
- Jones, M.; Martin, W.; Williams, W. Behavior of sulfate sulfur and elemental sulfur in three California soils in lysimeters. Soil Sci. Soc. Am. J. 1968, 32, 535–540. [Google Scholar] [CrossRef]
- Riley, N.; Zhao, F.; McGrath, S. Leaching losses of sulphur from different forms of sulphur fertilizers: A field lysimeter study. Soil Use Manag. 2002, 18, 120–126. [Google Scholar] [CrossRef]
- Kirchmann, H.; Pichlmayer, F.; Gerzabek, M.H. Sulfur balances and sulfur-34 abundance in a long-term fertilizer experiment. Soil Sci. Soc. Am. J. 1996, 60, 174–178. [Google Scholar] [CrossRef]
- Friesen, D.K. Fate and efficiency of sulfur fertilizer applied to food crops in West Africa. Fertil. Res. 1991, 29, 35–44. [Google Scholar] [CrossRef]
- Germida, J.J.; Janzen, H.H. Factors affecting the oxidation of elemental sulfur in soils. Fertil. Res. 1993, 35, 101–114. [Google Scholar] [CrossRef]
- Zhao, C.; Degryse, F.; Gupta, V.; McLaughlin, M.J. Elemental sulfur oxidation in Australian cropping soils. Soil Sci. Soc. Am. J. 2015, 79, 89–96. [Google Scholar] [CrossRef]
- Lee, A.; Boswell, C.; Watkinson, J. Effect of particle size on the oxidation of elemental sulphur, thiobacilli numbers, soil sulphate, and its availability to pasture. N. Z. J. Agric. Res. 1988, 31, 179–186. [Google Scholar] [CrossRef]
- Friesen, D.K. Influence of co-granulated nutrients and granule size on plant responses to elemental sulfur in compound fertilizers. Nutr. Cycl. Agroecosyst. 1996, 46, 81–90. [Google Scholar] [CrossRef]
- Degryse, F.; Ajiboye, B.; Baird, R.; da Silva, R.C.; McLaughlin, M.J. Oxidation of elemental sulfur in granular fertilizers depends on the soil-exposed surface area. Soil Sci. Soc. Am. J. 2016, 80, 294–305. [Google Scholar] [CrossRef]
- Chien, S.H.; Teixeira, L.A.; Cantarella, H.; Rehm, G.W.; Grant, C.A.; Gearhart, M.M. Agronomic effectiveness of granular nitrogen/phosphorus fertilizers containing elemental sulfur with and without ammonium sulfate: A Review. Agron. J. 2016, 108, 1203–1213. [Google Scholar] [CrossRef] [Green Version]
- Sawyer, J.E.; Lang, B.J.; Barker, D.W. Sulfur fertilization response in Iowa corn production. Better Crops 2011, 95, 8. [Google Scholar]
- Scherer, H.W. Sulfur in soils. J. Plant. Nutr. Soil Sci. 2009, 172, 326–335. [Google Scholar] [CrossRef]
- Hauck, R.; Bremner, J. Use of tracers for soil and fertilizer nitrogen research. Adv. Agron. 1976, 28, 219–266. [Google Scholar]
- Goh, K.M.; Gregg, P.E.H. Field studies on the fate of radioactive sulphur fertilizer applied to pastures. Fertil. Res. 1982, 3, 337–351. [Google Scholar] [CrossRef]
- Sanborn, P.; Brockley, R.; Mayer, B. Stable isotope tracing of fertilizer sulphur uptake by lodgepole pine: Foliar responses. Can. J. For. Res. 2011, 41, 493–500. [Google Scholar] [CrossRef]
- Chalk, P.M. Can N fertilizer use efficiency be estimated using 15N natural abundance? Soil Biol. Biochem. 2018, 126, 191–193. [Google Scholar] [CrossRef]
- Degryse, F.; da Silva, R.C.; Baird, R.; Beyrer, T.; Below, F.; McLaughlin, M.J. Uptake of elemental or sulfate-S from fall-or spring-applied co-granulated fertilizer by corn—A stable isotope and modeling study. Field Crop. Res. 2018, 221, 322–332. [Google Scholar] [CrossRef]
- Chalk, P.; Inácio, C.; Chen, D. Tracing S dynamics in agro-ecosystems using 34S. Soil Biol. Biochem. 2017, 114, 295–308. [Google Scholar] [CrossRef]
- Koppen, W. Das geographische System der Klimate. Handb. Der Klimatol. 1936, 46. [Google Scholar]
- Soil Survey Staff. Keys to Soil Taxonomy, 12th ed.; USDA-NRCS: Washington, DC, USA, 2014. [Google Scholar]
- Fox, R.L.; Olson, R.; Rhoades, H.F. Evaluating the sulfur status of soils by plant and soil tests. Soil Sci. Soc. Am. J. 1964, 28, 243–246. [Google Scholar] [CrossRef]
- Matejovic, I. Determination of carbon and nitrogen in samples of various soils by the dry combustion. Commun. Soil Sci. Plant. Anal. 1997, 28, 1499–1511. [Google Scholar] [CrossRef]
- Rayment, G.E.; Higginson, F.R. Australian Laboratory Handbook of Soil and Water Chemical Methods; Australian soil and land survey handbooks 3, Inkata Press: Melbourne, Australia, 1992; p. 330. [Google Scholar]
- Martin, A.E.; Reeve, R. A rapid manometeic method for determining soil carbonate. Soil Sci. 1955, 79, 187–198. [Google Scholar] [CrossRef]
- McKenzie, N.J.; Coughlan, K.J.; Cresswell, H.P. Soil Physical Measurements and Iterpretation for Land Evaluation; Australian Soil and Land Survey Handbook Series 5; CSIRO Publishing: Melbourne, Australia, 2002. [Google Scholar]
- McWilliams, D.A.; Berglund, D.R.; Endres, G. Corn Growth and Management Quick Guide; Dak., Fargo, USA, 1999; North Dakota State University Agriculture and University Extension: Fargo, ND, USA, 1999; pp. 5–8. [Google Scholar]
- Pedersen, P.; Kumudini, S.; Board, J.; Conley, S. Soybean Growth and Development; Iowa State University, University Extension: Ames, IA, USA, 2004. [Google Scholar]
- Arvor, D.; Meirelles, M.; Dubreuil, V.; Begue, A.; Shimabukuro, Y.E. Analyzing the agricultural transition in Mato Grosso, Brazil, using satellite-derived indices. Appl. Geogr. 2012, 32, 702–713. [Google Scholar] [CrossRef] [Green Version]
- Lancashire, P.D.; Bleiholder, H.; Boom, T.v.d.; Langelüddeke, P.; Stauss, R.; WEBER, E.; Witzenberger, A. A uniform decimal code for growth stages of crops and weeds. Ann. Appl. Biol. 1991, 119, 561–601. [Google Scholar] [CrossRef]
- Miller, T.D. Growth stages of wheat. Better Crop. Plant. Food. Potash Phosphate Inst. 1992, 76, 12. [Google Scholar]
- Reuter, D.; Robinson, J.B. Plant Analysis: An Interpretation Manual; CSIRO publishing: Collingwood, Australia, 1997. [Google Scholar]
- Hitsuda, K.; Sfredo, G.J.; Klepker, D. Diagnosis of sulfur deficiency in soybean using seeds. Soil Sci. Soc. Am. J. 2004, 68, 1445–1451. [Google Scholar] [CrossRef]
- Vermeiren, C.; Smolders, E.; McLaughlin, M.; Degryse, F. Model-based rationalization of sulphur mineralization in soils using 35S isotope dilution. Soil Biol. Biochem. 2018, 120, 1–11. [Google Scholar] [CrossRef]
- Smith, C.J.; Chalk, P.M. The residual value of fertiliser N in crop sequences: An appraisal of 60 years of research using 15N tracer. Field Crop. Res. 2018, 217, 66–74. [Google Scholar] [CrossRef]
- Simunek, J.; Sejna, M.; Saito, H.; Sakai, M.; Van Genuchten, M.T. The HYDRUS-1D Software Package for Simulating the One-Dimensional Movement of Water. Heat Mult. Solutes Var. Satur. Media 2005, 3. [Google Scholar]
- Rhue, R.; Kamprath, E. Leaching losses of sulfur during winter months when applied as gypsum, elemental S or prilled S. Agron. J. 1973, 65, 603–605. [Google Scholar] [CrossRef]
- Heng, L.; White, R.; Bolan, N.; Scotter, D. Leaching losses of major nutrients from a mole-drained soil under pasture. N. Z. J. Agric. Res. 1991, 34, 325–334. [Google Scholar] [CrossRef]
- Bender, R.R.; Haegele, J.W.; Ruffo, M.L.; Below, F.E. Nutrient uptake, partitioning, and remobilization in modern, transgenic insect-protected maize hybrids. Agron. J. 2013, 105, 161–170. [Google Scholar] [CrossRef] [Green Version]
- Watkinson, J.H. Measurement of the oxidation rate of elemental sulfur in soil. Soil Res. 1989, 27, 365–375. [Google Scholar] [CrossRef]
- Degryse, F.; da Silva, R.C.; Baird, R.; McLaughlin, M.J. Effect of cogranulation on oxidation of elemental sulfur: Theoretical model and experimental validation. Soil Sci. Soc. Am. J. 2016, 80, 1244–1253. [Google Scholar] [CrossRef] [Green Version]
- Watkinson, J.H.; Blair, G.J. Modelling the oxidation of elemental sulfur in soils. Fertil. Res. 1993, 35, 115–126. [Google Scholar] [CrossRef]
- Hart, P.; Rayner, J.; Jenkinson, D. Influence of pool substitution on the interpretation of fertilizer experiments with 15N. Eur. J. Soil Sci. 1986, 37, 389–403. [Google Scholar] [CrossRef]
- Schindler, F.; Knighton, R. Fate of fertilizer nitrogen applied to corn as estimated by the isotopic and difference methods. Soil Sci. Soc. Am. J. 1999, 63, 1734–1740. [Google Scholar] [CrossRef]
- Harmsen, K.; Moraghan, J. A comparison of the isotope recovery and difference methods for determining nitrogen fertilizer efficiency. Plant. Soil 1988, 105, 55–67. [Google Scholar] [CrossRef]
- Jenkinson, D.; Poulton, P.; Johnston, A.; Powlson, D. Turnover of nitrogen-15-labeled fertilizer in old grassland. Soil Sci. Soc. Am. J. 2004, 68, 865–875. [Google Scholar] [CrossRef]


| Argentina | Brazil | Canada | |
|---|---|---|---|
| Location | Lujan, Buenos Aires | Itiquira, Mato Grosso | Indian Head, Saskatchewan |
| Coordinates | 34°46″ S, 59°37″ W | 17°09″ S, 54°45″ W | 50°32″ N, 103°40″ W |
| Climate 1 | Humid subtropical | Tropical | Humid continental |
| Soil 2 | Typic Argiudoll | Typic Hapludox | Udic Boroll |
| pH (water) | 6.4 | 5.8 | 8.1 |
| SO4-S (mg kg−1) 3 | 4.2 | 5.8 | 4.0 |
| Organic C (%) 4 | 1.4 | 2.0 | 2.5 |
| CEC (cmolc kg−1) 5 | 19 | 10 | 13 |
| CaCO3 (%) 6 | 0 | 0 | 1.7 |
| Clay (%) 7 | 20.0 | 65.8 | 46.9 |
| Texture | Silt loam | Clay | Clay |
| Site | Fertilizer 1(%SO4-S/%ES) | S Rate (kg ha−1) | Crop | Sowing Date |
|---|---|---|---|---|
| Argentina | MES10 (5/5) | 20 | Corn | 11 November 2011 |
| Soybean | 20 November 2012 | |||
| Brazil | MES9 (2/7) | 28 | Soybean | 2 December 2011 |
| Corn | 23 March 2012 | |||
| Soybean | 27 November 2012 | |||
| Corn | 5 March 2013 | |||
| Canada | MES15 (7.5/7.5) | 32 | Canola | 6 June 2012 |
| Wheat | 1 June 2013 |
| Dry Matter Yield (Mg ha−1) | S in Plant (g kg−1) | S Uptake (kg ha−1) | |||||||||
|---|---|---|---|---|---|---|---|---|---|---|---|
| Site | Crop | Stage | MAP | MES | Sign.1 | MAP | MES | Sign.1 | MAP | MES | Sign.1 |
| Argentina | Corn | Early | 9.2 | 10.0 | * | 1.20 | 1.43 | * | 11.1 | 14.2 | *** |
| Maturity | 37.0 (22.9/14.1) | 40.2 (26.5/13.8) | ns | 1.30 | 1.33 | ns | 47.6 | 51.5 | ns | ||
| Soybean | Early | 4.8 | 4.6 | ns | 1.54 | 1.69 | ns | 7.2 | 7.7 | ns | |
| Maturity | 9.4 (5.8/3.6) | 7.7 (4.9/2.8) | ns | 1.44 (0.63/2.78) | 1.53 (0.80/2.80) | ns | 13.5 (3.6/9.9) | 11.9 (4.0/7.9) | ns | ||
| Brazil | Soybean | Early | 1.6 | 1.9 | ns | 2.32 | 2.23 | ns | 3.8 | 4.1 | ns |
| Maturity | 12.7 | 12.4 | ns | 1.47 | 1.57 | ns | 18.8 | 19.6 | ns | ||
| Corn | Early | 5.5 | 4.9 | ns | 0.53 | 0.53 | ns | 2.9 | 2.6 | ns | |
| Maturity | 15.2 | 17.2 | ns | 1.35 | 1.34 | ns | 19.4 | 22.1 | ns | ||
| Soybean | Early | 0.75 | 0.77 | ns | 1.95 | 1.96 | ns | 1.4 | 1.5 | ns | |
| Maturity | 6.6 | 6.9 | ns | 1.96 | 1.90 | ns | 13.1 | 13.0 | ns | ||
| Corn | Early | 3.5 | 3.1 | ns | 0.94 | 1.08 | ns | 3.3 | 3.4 | ns | |
| Maturity | 12.0 | 12.8 | ns | 1.10 | 1.06 | ns | 12.9 | 13.4 | ns | ||
| Canada | Canola | Early | 1.1 | 1.4 | * | 3.36 | 8.37 | *** | 3.6 | 11.8 | *** |
| Maturity | 11.7 (7.4/4.3) | 12.5 (7.9/4.6) | ns | 5.00 (5.88/3.48) | 5.64 (6.33/3.55) | ns | 58.2 (42.6/15.1) | 68.5 (52.7/16.2) | ns | ||
| Wheat | Early | 2.2 | 2.3 | ns | 2.37 | 2.65 | * | 5.2 | 6.1 | * | |
| Maturity | 20.1 (14.5/5.6) | 19.9 (14.4/5.5) | ns | 1.03 (0.75/1.78) | 1.08 (0.85/1.67) | ns | 20.8 (10.9/9.9) | 21.4 (12.2/9.1) | ns | ||
| S Recovery (%) | Cumulative S Recovery (%) | |||||||
|---|---|---|---|---|---|---|---|---|
| Site | Crop | Stage | SO4-S | ES | Sign.2 | SO4-S | ES | Sign.2 |
| Argentina | Corn 1 | Early | 30.4 | 4.4 | 30.4 | 4.4 | ||
| Maturity | 77.6 | 12.3 | 77.6 | 12.3 | ||||
| Soybean | Early | 5.7 (1.2) | 9.6 (2.4) | ns | 83.3 | 21.9 | ||
| Maturity | 8.1 (1.0) | 13.4 (0.7) | ** | 85.7 | 25.7 | |||
| Brazil | Soybean | Early | 2.9 (1.0) | 2.3 (0.2) | ns | 2.9 (1.0) | 2.3 (0.2) | ns |
| Maturity | 4.3 (0.9) | 4.2 (0.7) | ns | 4.3 (0.9) | 4.2 (0.7) | ns | ||
| Corn | Early | 0.2 (0.1) | 0.6 (0.1) | * | 4.5 (0.9) | 4.8 (0.7) | ns | |
| Maturity | 2.5 (0.9) | 4.0 (0.9) | ns | 6.8 (1.3) | 8.3 (1.1) | ns | ||
| Soybean | Early | 0.2 (0.0) | 1.1 (0.1) | *** | 7.0 (1.3) | 9.4 (1.1) | ns | |
| Maturity | 1.2 (0.2) | 3.5 (0.4) | ** | 8.0 (1.3) | 11.8 (1.2) | ns | ||
| Corn | Early | 0.3 (0.1) | 1.0 (0.2) | * | 8.3 (1.3) | 12.8 (1.2) | * | |
| Maturity | 1.3 (0.4) | 4.2 (0.2) | *** | 9.3 (1.3) | 15.9 (1.2) | * | ||
| Canada | Canola | Early | 50.7 (0.8) | 0.2 (0.1) | *** | 50.7 (0.8) | 0.2 (0.1) | *** |
| Maturity | 59.1 (2.2) | 5.8 (0.9) | *** | 59.1 (2.2) | 5.8 (0.9) | *** | ||
| Wheat | Early | 2.1 (0.2) | 4.5 (0.6) | ** | 61.2 (2.2) | 10.3 (1.0) | *** | |
| Maturity | 6.5 (0.5) | 13.4 (2.6) | * | 65.7 (2.3) | 19.2 (2.7) | *** | ||
© 2020 by the authors. Licensee MDPI, Basel, Switzerland. This article is an open access article distributed under the terms and conditions of the Creative Commons Attribution (CC BY) license (http://creativecommons.org/licenses/by/4.0/).
Share and Cite
Degryse, F.; Baird, R.; da Silva, R.C.; Holzapfel, C.B.; Kappes, C.; Tysko, M.; McLaughlin, M.J. Sulfur Uptake from Fertilizer Fortified with Sulfate and Elemental S in Three Contrasting Climatic Zones. Agronomy 2020, 10, 1035. https://0-doi-org.brum.beds.ac.uk/10.3390/agronomy10071035
Degryse F, Baird R, da Silva RC, Holzapfel CB, Kappes C, Tysko M, McLaughlin MJ. Sulfur Uptake from Fertilizer Fortified with Sulfate and Elemental S in Three Contrasting Climatic Zones. Agronomy. 2020; 10(7):1035. https://0-doi-org.brum.beds.ac.uk/10.3390/agronomy10071035
Chicago/Turabian StyleDegryse, Fien, Roslyn Baird, Rodrigo C. da Silva, Christopher B. Holzapfel, Claudinei Kappes, Monica Tysko, and Michael J. McLaughlin. 2020. "Sulfur Uptake from Fertilizer Fortified with Sulfate and Elemental S in Three Contrasting Climatic Zones" Agronomy 10, no. 7: 1035. https://0-doi-org.brum.beds.ac.uk/10.3390/agronomy10071035