Article

Physiological Responses of Tomato and Cucumber Seedlings under Different Light–Dark Cycles

by
Pedro García-Caparrós
1,†,
Francisco Sabio
1,†,
Francisco Javier Barbero
2,†,
Rosa María Chica
3,† and
María Teresa Lao
1,*,†
1
Agronomy Department of Superior School Engineering, University of Almeria, CIAIMBITAL, Agrifood Campus of International Excellence ceiA3. Ctra. Sacramento s/n, La Cañada de San Urbano, 04120 Almería, Spain
2
Chemistry and Physics Department of Superior School Engineering, University of Almería, CIAIMBITAL, Agrifood Campus of International Excellence ceiA3, Ctra. Sacramento s/n, La Cañada de San Urbano, 04120 Almería, Spain
3
Engineering Department of Superior School Engineering, University of Almería, CIAIMBITAL, Agrifood Campus of International Excellence ceiA3, Ctra. Sacramento s/n, La Cañada de San Urbano, 04120 Almería, Spain
*
Author to whom correspondence should be addressed.
The authors contributed equally to this work.
Submission received: 29 April 2020 / Revised: 16 June 2020 / Accepted: 18 June 2020 / Published: 1 July 2020
(This article belongs to the Section Horticultural and Floricultural Crops)

Abstract

:
Tomato and cucumber seedlings were grown in a growth chamber to evaluate the effects of different cycles of light–dark exposure conditions (T0 (control treatment) (1 cycle of 24 h distributed in 18 h of light exposure and six hours of dark), T1 (two cycles of 12 h distributed in nine hours of light exposure and three hours of dark) and T2 (three cycles of eight hours distributed in six hours of light exposure and two hours of dark) on growth, nutrient status, pigment concentration and physiological changes. Total dry weight showed different behaviors in both species, since in tomato the total dry weight remained unchanged under varying light–dark cycles, whereas in cucumber seedlings there was a clear decrease compared to the control treatment. In both species, plants grown under T2 showed the best water content. Nitrogen, P and K content—as well as partitioning in the different organs of the plants—displayed different patterns under varying cycles of light–dark conditions in both species. Chlorophyll (b and a + b) concentration decreased significantly in both species in T1 and T2 compared to the control treatment (T0). At physiological level, the concentration of total soluble sugars and proline in leaf showed the highest value in the control treatment with 18 h of light and six hours of dark.

1. Introduction

Light is one of the most important environmental regulators for the growth of crop species since it provides essential energy input and triggers various signaling pathways for the dynamic growth regulation of crops [1].
Nowadays, the production of horticultural seedlings in southern Spain totals around 1,800,000,000 seedling plants. To produce horticultural seedlings, supplementary artificial lighting has been considered as economically practical since it allows growers to improve profits, mainly due to a faster development and quality of plants, therefore improving their sales [2].
In plant cultivation, a wide variety of lamps have been used to increase the yields. Growth improvements have been obtained by using lamps to increase the irradiance received by the crop. Fluorescent lamps (FL) and high intensity discharge (HID) lamps (e.g., high-pressure sodium (HPS)) are the most commonly used artificial light sources for plant research and greenhouse horticulture [3]. Nevertheless, there is a need to adjust the spectral quality in order to achieve higher yields [4]. Currently, growers are using light emitting diodes (LEDs), especially red and blue LEDs, since they can produce more mainly due to their high spectral specificity, relative energy efficiency and longer lifetimes compared to the other lamps [1].
There is a plenty of research about the effect of different spectral regions and light requirements on the growth and physiology in vegetable transplants including tomato [5,6,7] and cucumber [8,9]. With respect to the quality of seedlings, local growers consider that in both species, compactness and high dry weight and water content are essential to ensure an adequate transplanting process.
In plants, the photoperiod regulates different processes like photomorphogenesis, growth, flowering and circadian rhythms [10]. This ability to detect day length or photoperiodism is perceived by plant photoreceptors such as phytochromes, cryptochromes, phototropins and other plant-specific proteins [11]. Plants have evolved to live in a rhythmic environment, and most physiological processes relevant for partitioning exhibit a rhythmic behavior [12]. Circadian clocks are molecular oscillators comprised of interlocking regulatory feedback loops. The components of the clock are set or “entrained” by external cues such as light and temperature and form a time-keeping mechanism to predict daily and seasonal changes in the environment and directly regulate rhythmic physiological outputs [13]. Reviewing previous literature, there are references about the effects of different photoperiods in crops [14,15]. These references have reported an increase on biomass and a faster flowering under longer photoperiods as a result of the higher total amount of daily radiation received by the plants. Nevertheless, the information about changes in circadian clock, that is to say changes in intervals of light–dark exposure conditions under the same daily integrated PPFD in crops culture is rather limited, being necessary to point out that in previous literature, we only found one reference with intervals of light–dark exposure conditions in lettuce seedlings [16]. Therefore, the aim of this trial is to determine the effects of changes in the cycles of light–dark exposure conditions on growth, nutrient status, pigment concentration and physiological changes in tomato and cucumber seedlings.

2. Materials and Methods

2.1. Plant material and Precultivation

The present study was carried out at the University of Almeria (36°49′ N, 2°24′ W). Seeds of Solanum lycopersicum L. var. Caniles (Zeraim) belonging to Solanaceae family and Cucumis sativus L. var. Litoral (Rijk Zwaan) belonging to Cucurbitaceae family were acquired from a commercial nursery. The pre-germination of seeds was performed in a germination chamber (28 °C and 100% of RH under dark conditions) during a period of 3 and 1.5 days for tomato and cucumber, respectively.
Germinated plants were then transplanted into polystyrene multilink tray (43.9 × 69.7 × 7 cm3 with 27 sockets) containing peat moss (pH 6.0 and electrical conductivity (EC) of 0.8 dS m−1) covered with coconut fiber (pH (5.4–6.3); EC (0.7 dS m−1)). Germinated plants were scheduled for follow-up in three growth chambers of 1.5 × 1.5 × 2 = 4.50 m3. Each growth chamber was assigned to each light treatment during the entire experiment (36 days for tomato and 22 days for cucumber). The differential period of the treatment for each species was considering the recommendations of local grower to produce saleable seedlings plants of high quality.
The growth chamber was set at a constant (day/night) temperature of 28 °C and a relative humidity of 78% to minimize any potentially confounding effect of temperature difference or relative humidity on extension growth. To further minimize any edge or position effects within each treatment, the multilink trays were rearranged every other day. During the experimental period, plants of both species were watered manually on alternate days with 150 mL per plant with a nutrient solution with the following composition: pH (6.5); E.C. (1.48 dS m−1); NO3- (12.0-mmol L−1), PO43− (1.7-mmol L−1), K+ (7.0-mmol L−1), Ca2+ (4.5-mmol L−1), Mg2+ (2.5-mmol L−1) and SO42- (1.5-mmol L−1) in order to avoid any water or nutrient limitation. The mineral salts used for the preparation of the nutrient solution were the following: potassium nitrate (KNO3), calcium nitrate (Ca(NO3)2), potassium sulfate (K2SO4), monopotassium phosphate (KH2PO4), magnesium sulfate (MgSO4) and phosphoric acid (H3PO4).

2.2. Experimental Setup and Light Quality Treatments

The experiment consisted of three light treatments using LED lamps (35QPQW, JCBritw, Beijing China) with a power 90 (45 × 2) W, 0.4 A and 220 V, ratio red/blue light: (7/2) related to the light–dark photoperiod with the same daily radiation power and spectral quality: T0 (control treatment) (1 cycle of 24 h distributed in 18 h of light exposure and 6 h of dark), T1 (2 cycles of 12 h distributed in 9 h of light exposure and 3 h of dark) and T2 (3 cycles of 8 h distributed in 6 h of light exposure and 2 h of dark). The selection of this lamp was done following the recommendations given by local nursery growers. The spectral distribution scans were recorded at 300–1100 nm with 2-nm steps of the light lamp with a calibrated spectroradiometer (LI-COR 1800, Lincoln, NE, USA) at the canopy level. Spectral distribution of the different light treatments showed peaks at 454, 622, 632 and 638 nm (Figure 1). As far as agronomic characterization is concerned, this type of LEDs lamps showed a high irradiance mainly in the R region and lower irradiance in FR region leading to the high values of B:FR and R:FR (Table 1). It is important to highlight that all plants have received the same daily irradiance, the same spectral quality and in consequence, the same ratios of B/R, B/FR, etc.
With these measurements, agronomic characterization of each light treatment was assessed following the methodology established by Baille et al. [17]. The experimental design consisted of three light treatments, three blocks with four plants per block and species which were randomly ubicated giving a total of 36 plants per species plus border plants.

2.3. Biomass Parameters

At the end of the trial, the plants were harvested, the substrate gently washed from the roots and the root surface dried with blotting study. Plant length (expressed in cm) was determined using a ruler, number of internodes counting directly in plant and stem diameter (expressed in cm) with a caliper was measured. Then, the plants were divided into roots (R), stems (S) and leaves (L) (in cucumber plants, cotyledons (C) were studied separately) and the respective fresh weights (FW) were measured. Roots, stems and leaves were then oven-dried at 70 °C until they reached a constant weight to provide the respective dry weights (DW) during 48 h. The total plant dry weight (TDW) was calculated as the sum of the leaves, stems, roots and cotyledons (in the case of cucumber) DW. The percentage of biomass associated with each organ was assessed in each treatment. The fresh and dry weights of roots, stems, leaves and cotyledons (in the case of cucumber) were used to calculate the water content (WC—g water per g DW) in each organ as indicated by Ben Amor et al. [18].

2.4. Root, Stem and Leaf Nutrients

The oven-dried samples were ground in a mill and divided into two subsamples. Samples were mineralized with sulfuric acid (H2SO4, 96%) in the presence of hydrogen peroxide (H2O2, 30% (w v1), P-free) at 300 °C and used for the colorimetric determination of N [19] and total P [20] (expressed as mg g−1 DW). The K+ concentration expressed as mg g−1 DW was directly measured in the mineralized extract by flame spectrophotometry (model Jenway PFP7) [21]. The extraction by organ was calculated multiplying the dry weight of each fraction and the nutrient concentration. The extraction of the entire plant was also determined by adding the extraction of the different organs.

2.5. Pigment Concentrations

To determine the concentrations of pigments (chlorophylls and carotenoids) in leaves, four plants were randomly selected per treatment at harvest. Extraction of chlorophyll a and b (Chl a and Chl b) and carotenoids were performed by submerging 0.2 g of fresh leaves in methanol in the dark at room temperature (15 °C) for 24 h. After shaken vigorously, the supernatant was removed and the photosynthetic pigment concentrations were determined colorimetrically at their respective wavelengths in a spectrophotometer (model Shimadzu UV-1201): Chl a (λ = 666 nm), Chl b (λ = 653 nm) and carotenoids (λ = 470 nm) following the methodology of Wellburn [22] (Equations (1)–(3)). Pigments concentration were expressed as mg g−1 FW.
Chl a = [15.65 (A666) − 7.34 (A653)]
Chl b = [27.05 (A653) − 11.21 (A666)]
Car: [1000 (A470) − 2.86 (Chl a) − 129.2 (Chl b)]/221

2.6. Physiological Parameters

To determine the concentrations of proline and total soluble sugars (TSS) in leaves, four plants were randomly selected per treatment at harvest. Fresh material (0.5 g of leaves) was crushed in 5 mL of 95% (v v−1) ethanol. The pellet was washed with 5 mL of 70% (v v−1) ethanol and centrifuged (model Digicen 21 R) at 3500× g for 10 min. The free proline and TSS concentrations were determined in the alcoholic extract supernatant. The free proline concentration was determined by the ninhydrin reagent method (expressed as µg g−1 FW) [23]. The total soluble sugars (TSS) concentration was determined by the anthrone reagent method and was expressed as mg glucose-equivalent g−1 FW [23].

2.7. Statistical Analysis

The experiment had a completely randomized block design, and the values obtained for each plant and each variable were considered independent replicates. The data were analyzed through one-way analysis of variance (ANOVA) and least significant difference (LSD) tests (p < 0.05) in order to assess the differences between treatments. All statistical analyses were done with Statgraphic Plus for Windows (version 5.1; Statpoint Technologies, Warrenton, VA, USA).

3. Results

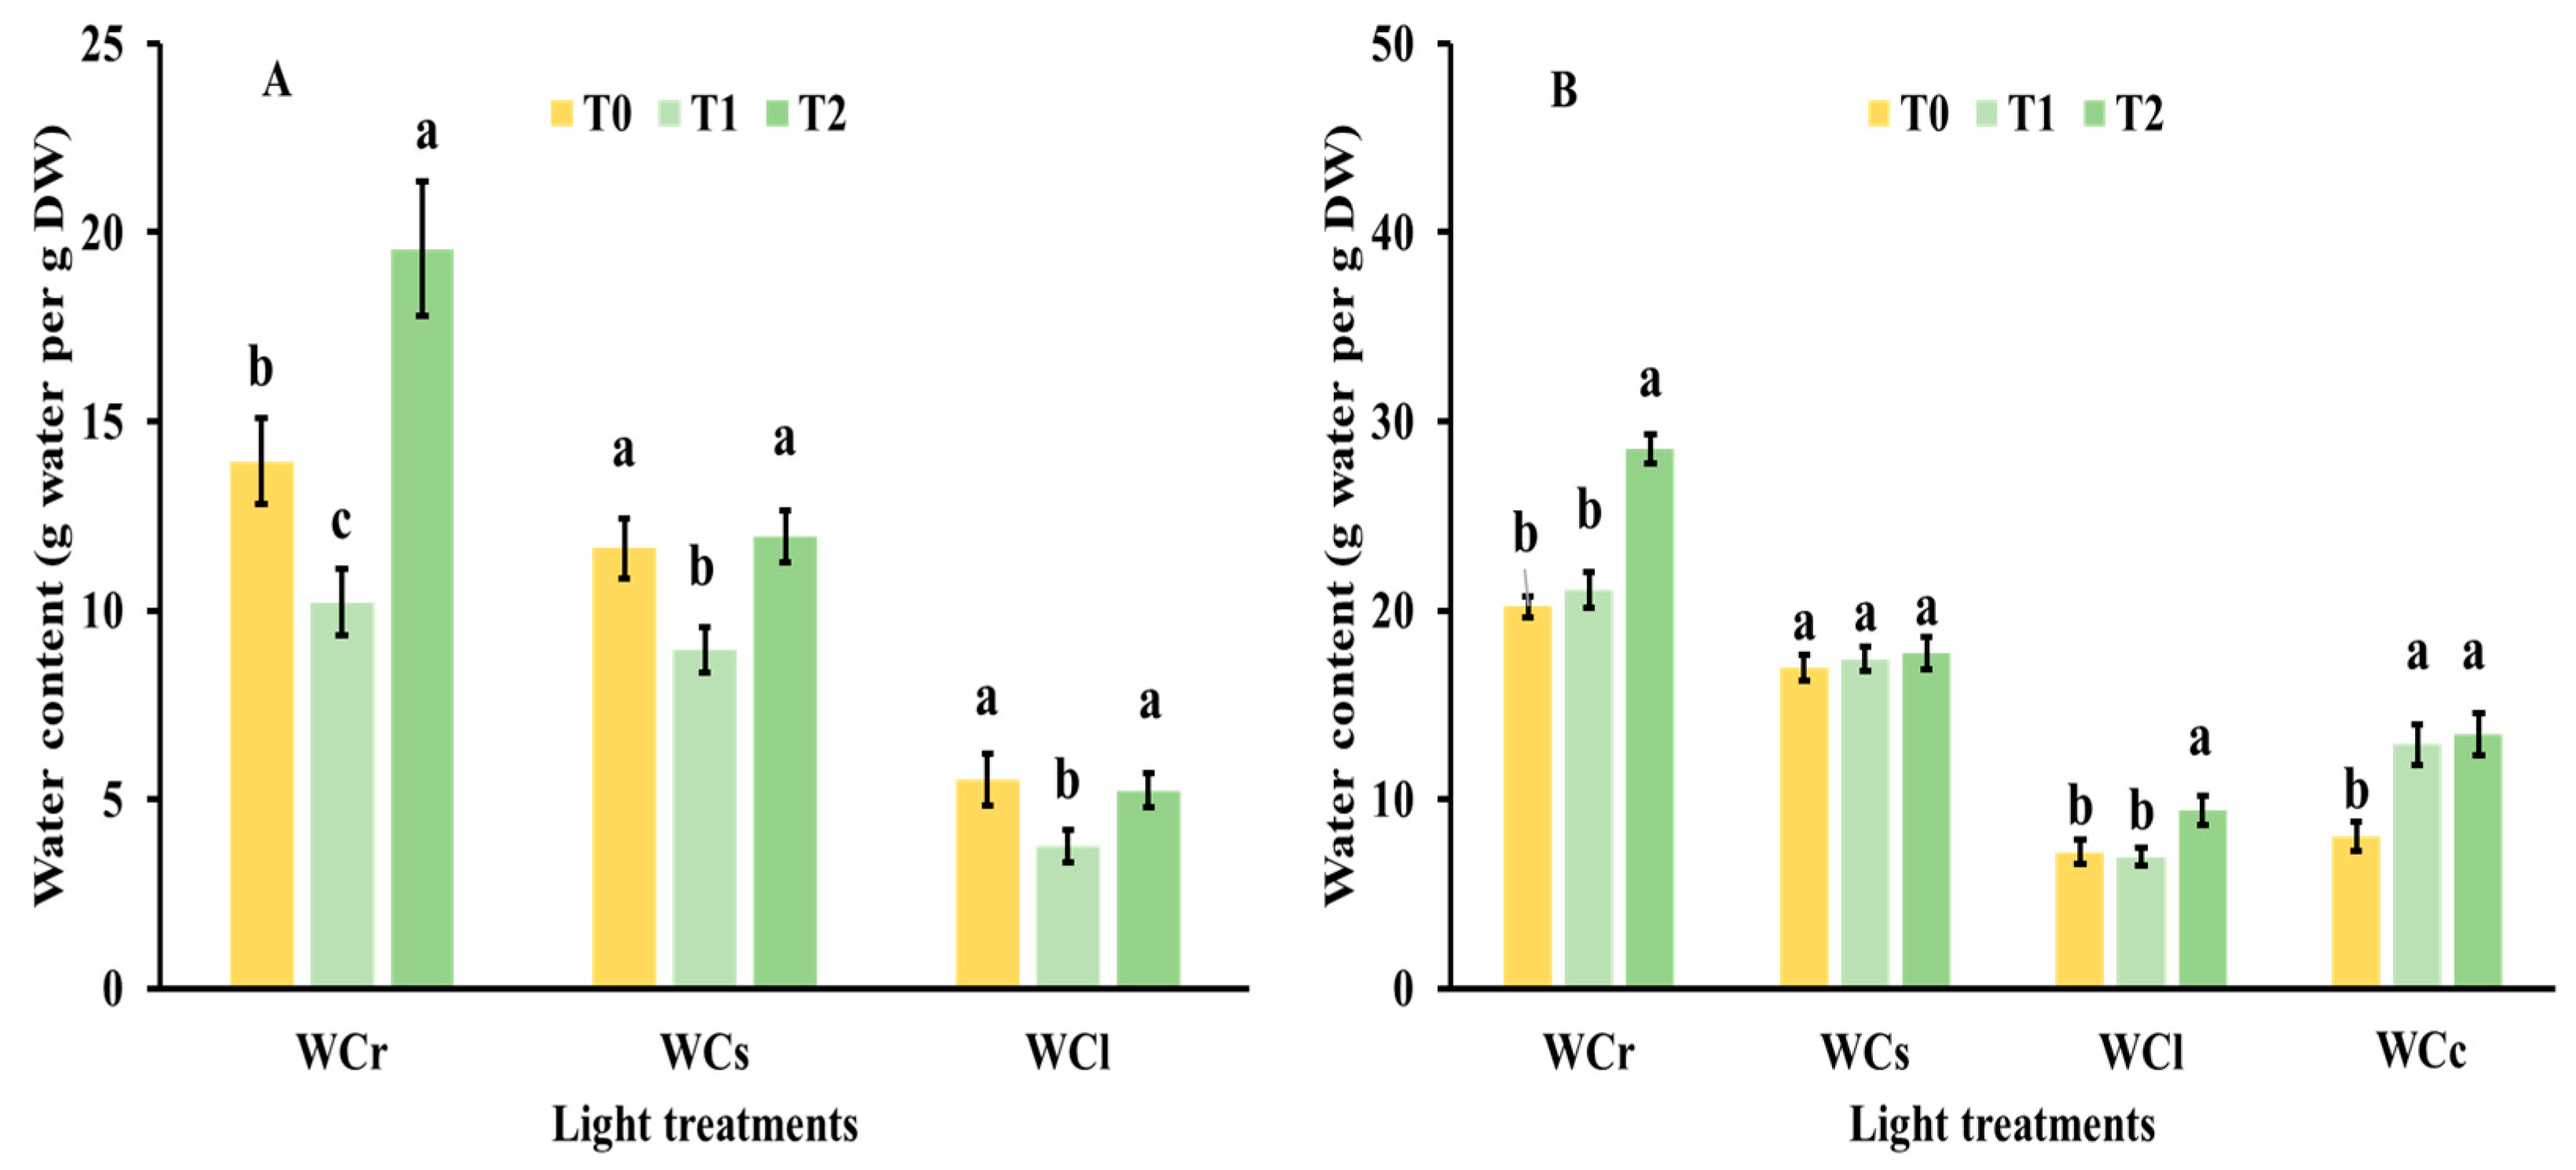
3.1. Biomass Parameters

A differential behavior was observed between the 2 species studied. The total fresh and dry weight in tomato plants remained unchanged under the different light treatments. With respect to cucumber, seedlings grown under the control treatment (T0) showed the highest fresh and dry weight.
At level of partitioning, tomato plants grown under T2 showed an increase in percentage of shoot dry weight in detriment to root fresh and dry weight compared to seedlings grown under T0. Considering the partitioning between light treatments in cucumber seedlings, both T1 and T2 showed a reduction of shoot and cotyledons fresh and dry weight and the consequent increase in leaf fresh and dry weight (Figure 2).
Tomato seedlings grown under T0 or control treatment showed the shortest stem and the highest shoot diameter. Nevertheless, with respect to the internodes number, there were no significant differences between light treatments. Cucumber seedlings did not show any significant changes in length, internodes number and shoot diameter under the different light treatments assessed (Table 2).
In tomato seedlings, the water content in roots showed the highest value under T2 whereas in shoot and leaves both T0 and T2 showed the highest values, but without significant differences between them. In cucumber seedlings, the water content in roots and leaves showed the highest value under T2. There were no significant differences in shoot water content, but seedlings grown under T0 showed the lowest value of water content in cotyledons (Figure 3).

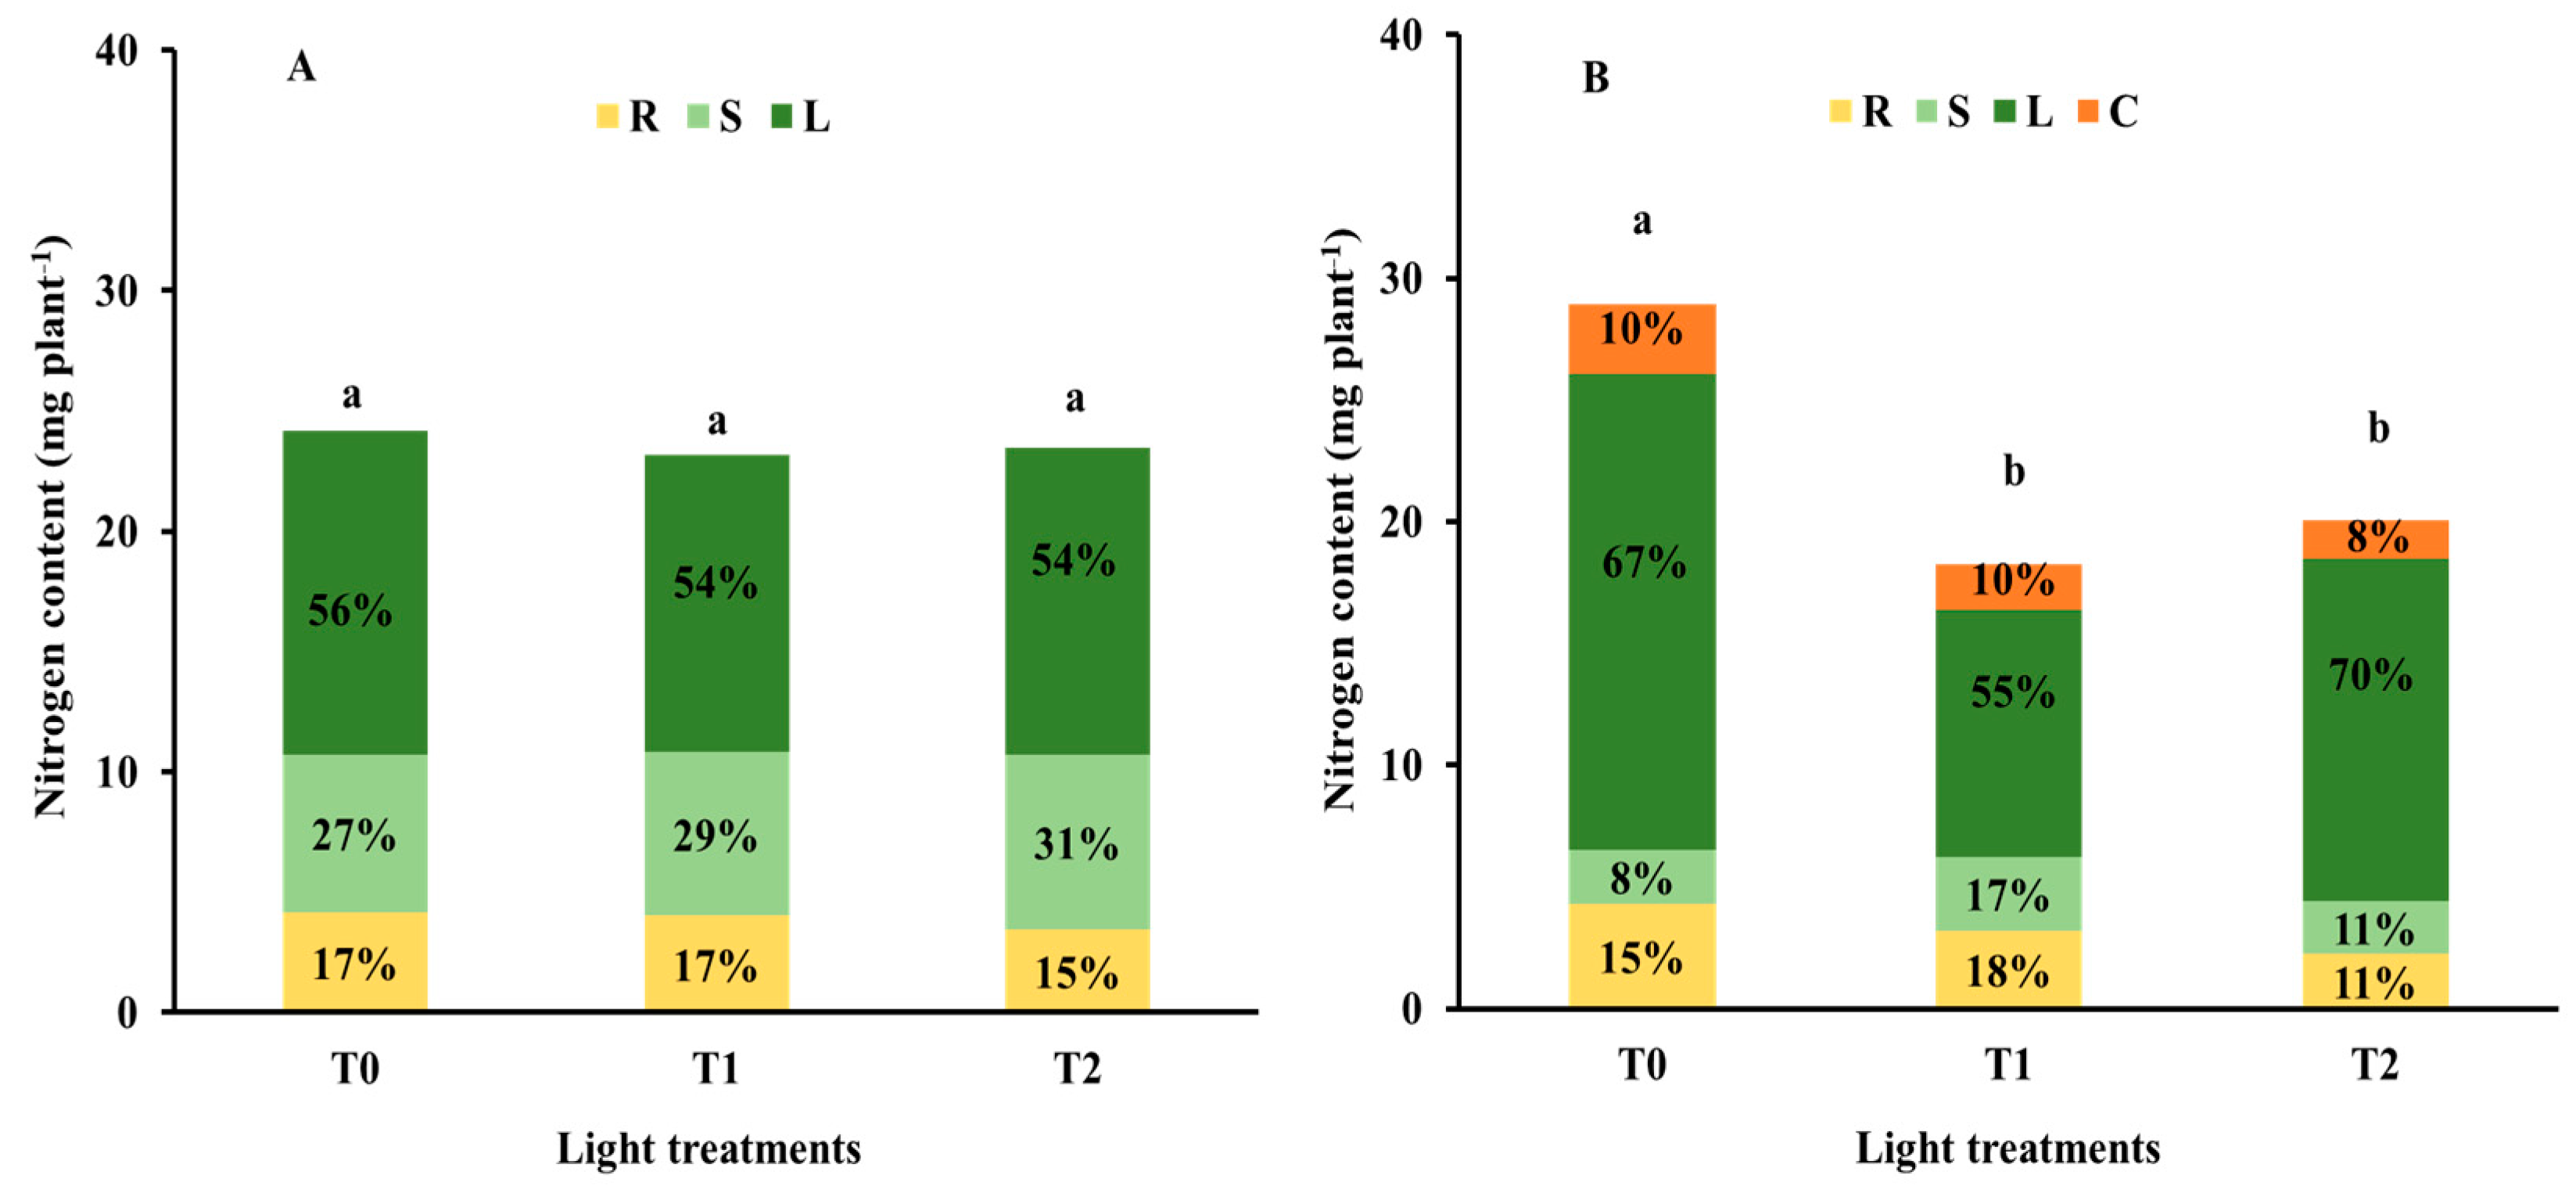
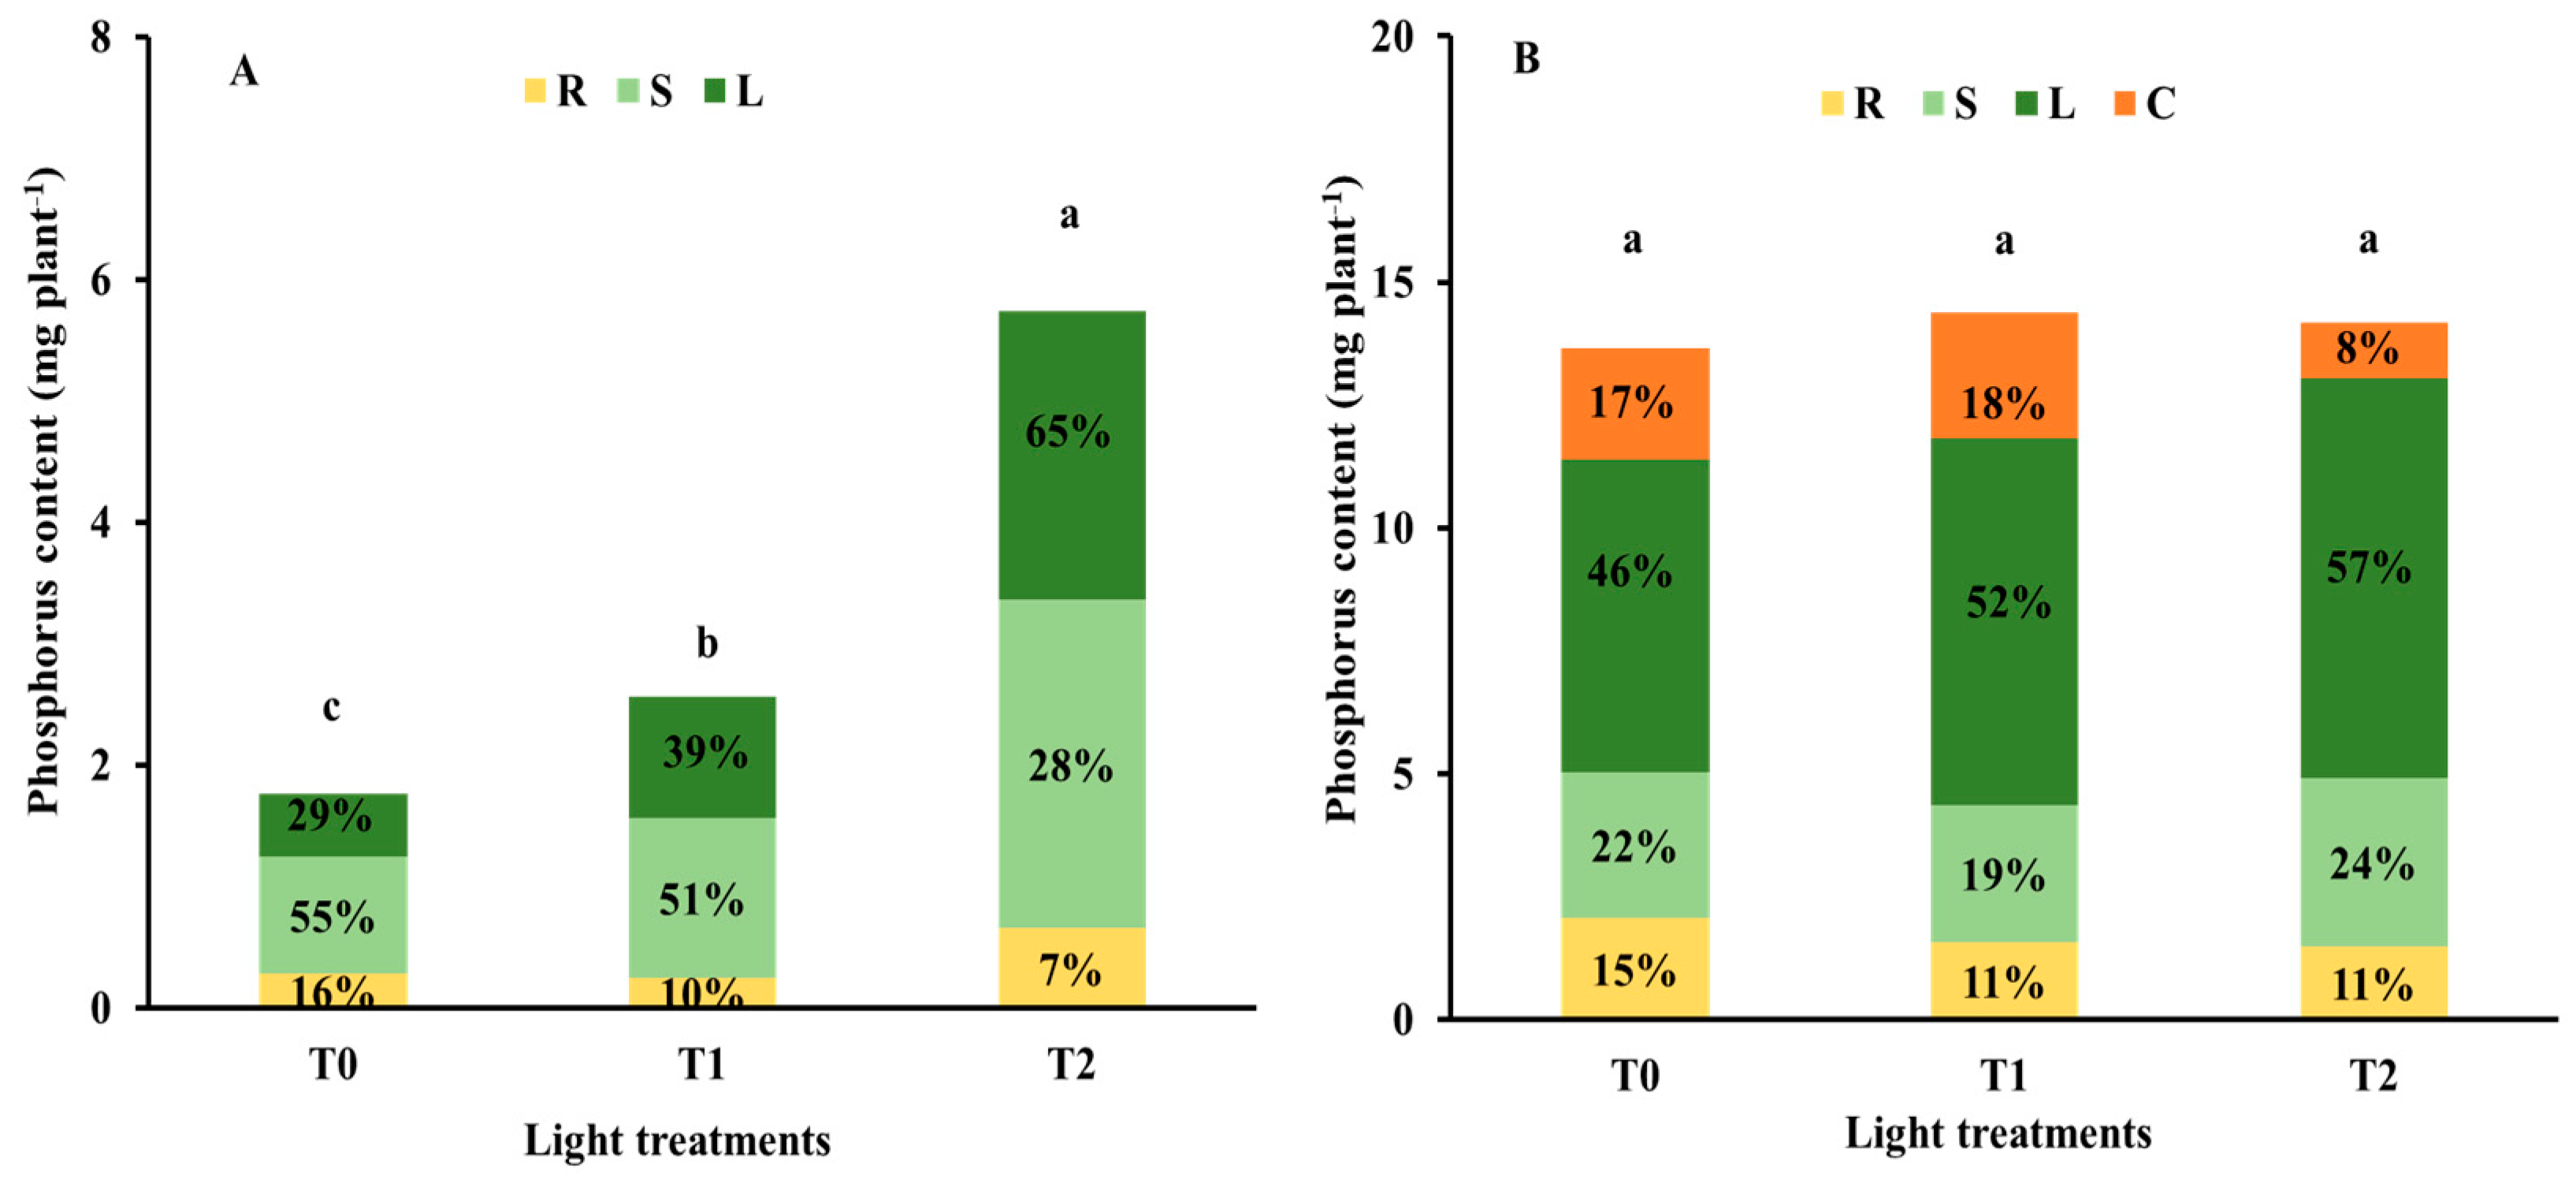
3.2. Nutrient Status

In the tomato seedlings, nitrogen content remained unchanged under the different light treatments. In addition, at partitioning level, there were no significant differences between the different organs assessed, being the leaves the organ with the highest nutrient content (around 55%). In cucumber seedlings, the control treatment or To showed the highest nitrogen content. The nitrogen partitioning in T1 and T2 compared to the control treatment or T0 showed different trends. Comparing to the control treatment, in T1, the capacity of nitrogen content is increased in stems in detriment to leaves, whereas in T2, there was a decrease in the nitrogen content mainly in roots (Figure 4).
In tomato seedlings, phosphorus content showed the highest value when the seedlings were grown under T2. At partitioning level, in T2 there was a decrease in the uptake capacity of roots and stems in benefit of phosphorus content by leaves compared to T0. In cucumber seedlings, we found a different tendency in roots and leaves, but no significant differences in phosphorus content between light treatments were found in stems. Furthermore, there was a detriment in cotyledons compared to the control treatment in T2 (Figure 5).
In tomato seedlings, T1 showed the highest potassium content. Comparing to the control treatment, T1 and T2 showed different trends at level of partitioning of potassium content in plants. In seedlings grown under T1 there was an increase in root content in detriment to stem whereas in the case of T2 the decrease in the content was showed in roots and leaves in benefit of stems. In cucumber seedlings, the control treatment showed the highest potassium content. At partitioning level like happened in tomato seedlings, there were different trends when seedlings were grown under T1 compared to the control treatment. In T1, there was an increase in the potassium content in roots, stems and cotyledons in detriment to leaves whereas in the case of T2 potassium content was similar to T0 (Figure 6).

3.3. Pigment Concentrations

Chlorophyll a concentrations in both species in all treatments were higher than the respective chl b concentrations. In tomato seedlings, Chl a concentration remained without differences between light treatments. With respect to Chl b and (a + b), the control treatment showed the highest values, but considering the ratio Chl a/b, the control treatment showed the lowest value. Carotenoids concentration showed the highest value in seedlings grown under T2. Cucumber seedlings grown under T2 showed the highest values in Chl a and the ratio Chl a/b whereas under the control treatment, Chl b and a + b concentration were the highest. With respect to carotenoids concentration, there were no significant differences between light treatments in cucumber seedlings (Table 3).

3.4. Physiological Parameters

The leaves of tomato seedlings grown under T0 showed the highest concentration of total soluble sugars and proline. On the same hand, cucumber seedlings also showed the highest concentration of leaf total soluble sugars and proline in the control treatment (Table 4).

4. Discussion

With respect to light quality and intensity, all the treatments received the same spectral quality only varying in the length of the cycles. In our experiment, there were no variations in dry weight in tomato seedlings under varying light–dark cycles. It may mean that the length of the light–dark cycles does not affect the generation of biomass and therefore the growth of the seedlings depends on the PAR radiation received [24]. Nevertheless, our results were not in line with the results obtained by different researchers in other crops such as lettuce (Koontz and Prince [25]; Kang et al. [16]) who reported that the lengthening of the cycles (high number of light exposure hours) resulted in substantial increases in dry weight. This increase in dry weight can be explained because in several cases the higher plant growth under extended light–dark cycles may match with their endogenous circadian rhythms [26,27] or because under long light cycles, plants receive a greater amount of radiation per cycle and therefore generate more photoassimilates. The loss of dry weight in cucumber seedlings under T1 and T2 compared to the control treatment can be ascribed to the arrhythmicity generated by the remoteness of natural circadian rhythm as reported by Anderson and Kay [28] causing a metabolism disequilibrium and the consequent decrease in plant dry weight.
At level of partitioning of fresh and dry weight between organs, there was a differential behavior between species. In the case of tomato seedlings, there was an increase of shoot fresh and dry weight in detriment to root fresh and dry weight under increasing number of cycles of light–dark conditions which can be associated with the effects related to the etiolation process as was reported by Holmes and Smith [29]. This etiolation process is characterized by a higher capacity of retention of photosynthates in the shoot at expense of root growth, developing longer internodes and producing larger and thinner leaves [30]. The etiolation process can be due to low ratio R:FR generated because in short cycles, the low period of darkness does not allow the “dark reversal” of Pfr to Pr [31], related to modifications in the phytochrome photoequilibrium (Pfr/P) that generates changes in the expression of some genes ascribed to the activity of photoreceptors under varying circadian rhythms [32]. However, in our experiment, the ratio R:FR was the same in all the treatments maybe the etiolation trend suffered by the plants can be explained by an imbalance in the synthesis or degradation of Pfr under varying circadian rhythms [29]. With respect to cucumber seedlings, the increase in the number of cycles reduced the percentage of cotyledons and shoots fresh and dry weight increasing the percentage of fresh and dry weight in leaves and this fact can be associated with changes in the circadian rhythms [33]. The differential response found between the tomato and cucumber may be due to the different concentration of phytochrome (phy A) what modulates this response in the case of cucumber [34].
As it was previously reported for dry weight, the length, the number of internodes and the shoot diameter also showed a differential response between species. In our experiment, the increase of number of cycles of light–dark conditions resulted tomato seedlings with higher size and reduced shoot diameter. These results agreeing with the explanation previously commented above. It is necessary to point out that the compactness of the seedlings in the control treatment is more demanded between growers than seedlings with higher size [35]. In the case of cucumber seedlings, no variations in the parameters assessed under the different light treatments seem to be an specific response of this species under varying cycles of light–dark conditions.
In both species, T2 presents the best water content. Nevertheless, T1 presents a different behavior between species. In cucumber presents the same tendency than T2, but in tomato the response was the opposite. This can be due to the water resistance offered by the long stems related to the capacity of roots to supply water to leaves in function to the water potential generated in a soil–plant–atmosphere as reported by Federer [36]. The specific information about the effects of varying cycles of light–dark conditions in crops physiology is rather limited. In addition, it is necessary to point out that an imbalance in the circadian clock may led to the closing of the stomatal aperture as reported by Hotta et al. [37].
Reviewing previous literature, there are scarce references about the changes in the mineral nutrient content by changing photoperiods. It is necessary to mention that the transpiration generates the major pathway from nutrient movement through the xylem and this transpiration is coordinated by the regulation of the stomatal aperture which is regulated by the circadian clock [38]. Nevertheless, the mechanisms involved in the nutrient content in plants is rather unknown. The results in this experiment showed that the N, P and K content as well as partitioning in the different organs of the plants displayed different patterns under varying cycles of light–dark conditions in both species. In tomato seedlings, no variations in nitrogen content under changing cycles can be ascribed to the short light period and also the fact that the length of experiment may be short to involve changes in this species. With respect to cucumber seedlings, the highest nitrogen content under the control treatment could be due to the changes in the partitioning in the different organs under the treatments assessed and also due to a differential allocation of nitrogen compounds in plant [39]. These results suggest that in these species there was not a direct link between the circadian oscillations and N content as suggested by Gutierrez et al. [40] in Arabidopsis plants.
As far as P is concerned, the highest phosphorus content under higher number of cycles of light–dark conditions in tomato seedlings agree with the results reported by Haydon et al. [41] who noted a direct relationship between changes in circadian rhythms and phosphorous content by plants. The highest percentage of phosphorus content in leaves under the highest number of cycles can be ascribed to a higher rate of sequestration in leaves as a consequence of the energy in form of ATP during the photosynthetic process [42]. In the case of cucumber seedlings, no variation in phosphorus content between treatments can be ascribed to a non-relationship between changes in circadian rhythms and phosphorous uptake capacity being not in line with the findings reported by Versaw et al. [43] who reported the presence of one phosphate transporter enhanced by cyrcadian rhythms in Arabidopsis thaliana plants. The increase in leaf content in detriment to the other organs in cucumber seedlings could be explained as it was reported before in tomato seedlings.
It is necessary to mention that there is scarce information about the changes in the acquisition pathways of potassium in crops under varying photoperiods. In this sense, it is assumed that there is a circadian regulation of transcripts for several K+ transporters in Arabidopsis [41], but the mechanisms involved remain still unknown. With respect to potassium content, tomato seedlings did not show a clear trend under increasing cycles of light–dark conditions. This fact can be due to changes in nutrient concentration in the different organs assessed. In the case of cucumber seedlings, our results suggest that the increase of number cycles did not enhance the potassium content.
In our experiment, no variations in chlorophyll a concentration, the highest value in chl b and a + b concentration and the lowest value in the ratio Chl a/b in tomato seedlings in the control treatment was not in line with the results in strawberry reported by Zeng et al. [44] who reported increasing pigment concentrations when increasing light–dark cycles. These results may suggest that tomato seedlings did not show a relationship between the circadian clock and the chl a concentrations as reported Yang et al. [45] in pepper seedlings, belonging also to Solanaceae family, under two photoperiods 12 and 16 h light during 24 h. The increasing concentration of carotenoids under increasing cycles in tomato plants may suggest a photoprotective role of these compounds under increasing the number of cycles of light–dark conditions [46].
With respect to cucumber seedlings, there were different trends in pigment concentrations under the different light treatments assessed. The highest Chl a and the ratio Chl a/b concentration and lower values of Chl b and a + b concentration under the highest number of cycles can be explained by the fact that under several shorts cycles of simultaneous light conditions, phyB and cry1 are synergistic, but under continuous light conditions, the actions of these photoreceptors may become independent and additive as reported by Casal [47]. No differences in carotenoids concentration under increasing pulses was in line with the results reported by Chen et al. [48] in lettuce seedlings under different light conditions.
As far as physiological parameters was concerned, both species studied showed a similar response. It is interesting to note that leaf starch concentration in tomato seedlings is very low and therefore the energy pool of the seedlings can be directly related to soluble sugars [49]. In addition, sugar transport from source (leaves) to sink (roots) is modeled as mass flow driven by osmotic pressure which is regulated by a circadian clock [50]. In our experiment, the highest concentration of total soluble sugars in the control treatment in both species disagrees with the results reported by other researchers in lettuce seedlings [51,52]. This result could be explained by the fact that longer exposure irradiation without cycles produce higher energy from photosynthesis to be used in Calvin cycle, therefore the leaf total soluble sugars was also elevated as reported by Taiz and Zeiger [53]. In addition, the decrease in leaf soluble sugars under increasing cycles of light–dark conditions can be attributed to a translocation of these soluble sugars to roots. With respect to proline, the consequent decrease of leaf proline concentration in both species under increasing cycles may be ascribed to the fact that changes in the circadian clock can result changes in proline synthesis as reported by Hayashi et al. [54].

5. Conclusions

The results of this experiment show that the increasing cycles of light–dark conditions led to no variations in fresh and dry weight in tomato seedlings, although they showed higher size, but reduced shoot diameter. In the case of cucumber seedlings, the increasing number of cycles of light–dark conditions resulted in a decrease in fresh and dry weight without modifications in biomass parameters (length, internodes number and shoot diameter). Previous results suggest that the increasing cycles of light–dark in both species was not effective to enhance the biomass, therefore the control treatment would be the best option for the growers. On the same vein, the increasing cycles of light–dark conditions resulted in a decline of pigments, total soluble sugars and proline concentration in both species and in the case of nutritional status, there was no clear trend. Further studies in other horticultural crops under similar conditions should be carried out to check if these increasing cycles of light–dark conditions may be effective to produce more saleable plants.

Author Contributions

P.G.-C. investigation, data curation, writing—original draft preparation. F.S. investigation, data curation. F.J.B. formal analysis, investigation. R.M.C. analysis, investigation. M.T.L. conceptualization, supervision, project administration. All authors have read and agreed to the published version of the manuscript.

Funding

This research received no external funding.

Acknowledgments

The authors thank the funding of this work by the group AGR-242 from University of Almería (Sustainability of Horticultural and Ornamental Protected Systems) and the support for management knowledge and seedling plants to Natural-Green company.

Conflicts of Interest

The authors declare no conflicts of interest.

References

  1. García-Caparrós, P.; Almansa, E.M.; Chica, R.M.; Lao, M.T. Effects of Artificial Light Treatments on Growth, mineral composition, physiology, and pigment concentration in Dieffenbachia maculata “Compacta” plants. Sustainability 2019, 11, 2867. [Google Scholar] [CrossRef] [Green Version]
  2. García-Caparros, P.; Chica, R.M.; Almansa, E.M.; Rull, A.; Rivas, L.A.; García-Buendía, A.; Barbero, F.J.; Lao, M.T. Comparisons of different lighting systems for horticultural seedling production aimed at energy saving. Sustainability 2018, 10, 3351. [Google Scholar] [CrossRef] [Green Version]
  3. García-Caparros, P.; Almansa, E.M.; Barbero, F.J.; Chica, R.M.; Lao, M.T. Fittonia verschaffeltii response to artificial light treatments: Biomass, nutrient concentrations and physiological changes. Agronomy 2020, 10, 126. [Google Scholar] [CrossRef] [Green Version]
  4. Hogewoning, S.W.; Douwstra, P.; Trouwborst, G.; van Ieperen, W.; Harbinson, J. An artificial solar spectrum substantially alters plant development compared with usual climate room irradiance spectra. J. Exp. Bot. 2010, 61, 1267–1276. [Google Scholar] [CrossRef] [Green Version]
  5. Hernández, R.; Eguchi, T.; Deveci, M.; Kubota, C. Tomato seedling physiological responses under different percentages of blue and red photon flux ratios using LEDs and cool white fluorescent lamps. Sci. Hortic. 2016, 213, 270–280. [Google Scholar] [CrossRef] [Green Version]
  6. Kim, H.J.; Lin, M.Y.; Mitchell, C.A. Light spectral and thermal properties govern biomass allocation in tomato through morphological and physiological changes. Env. Exp. Bot. 2019, 157, 228–240. [Google Scholar] [CrossRef]
  7. Groher, T.; Röhlen-Schmittgen, S.; Fiebig, A.; Noga, G.; Hunsche, M. Influence of supplementary LED lighting on physiological and biochemical parameters of tomato (Solanum lycopersicum L.) leaves. Sci. Hortic. 2019, 250, 154–158. [Google Scholar] [CrossRef]
  8. Van Ieperen, W.; Savvides, A.; Fanourakis, D. Red and blue light effects during growth on hydraulic and stomatal conductance in leaves of young cucumber plants. Acta Hortic. 2012, 956, 223–230. [Google Scholar] [CrossRef] [Green Version]
  9. Hernandez, R.; Kubota, C. Physiological responses of cucumber seedlings under different blue and red photon flux ratios using LEDs. Env. Exp. Bot. 2016, 121, 66–74. [Google Scholar] [CrossRef]
  10. Jackson, S.D. Plant responses to photoperiod. New Phytol. 2009, 181, 517–531. [Google Scholar] [CrossRef] [Green Version]
  11. Serrano-Bueno, G.; Romero-Campero, F.J.; Lucas-Reina, E.; Romero, J.M.; Valverde, F. Evolution of photoperiod sensing in plants and algae. Curr. Opin. Plant Biol. 2017, 37, 10–17. [Google Scholar] [CrossRef] [PubMed]
  12. Harmer, S.L.; Hogenesch, J.B.; Straume, M.; Chang, H.S.; Han, B.; Zhu, T.; Wang, X.; Kreps, J.A.; Kay, S.A. Orchestrated transcription of key pathways in Arabidopsis by the circadian clock. Science 2000, 290, 2110–2113. [Google Scholar] [CrossRef] [PubMed]
  13. Haydon, M.J.; Román, Á.; Arshad, W. Nutrient homeostasis within the plant circadian network. Front. Plant Sci. 2015, 6, 299. [Google Scholar] [CrossRef] [PubMed] [Green Version]
  14. Hidaka, K.; Okamoto, A.; Araki, T.; Miyoshi, Y.; Dan, K.; Imamura, H.; Kitano, M.; Sameshima, K.; Okimura, M. Effect of photoperiod of supplemental lighting with light-emitting diodes on growth and yield of strawberry. Env. Control. Biol. 2014, 52, 63–71. [Google Scholar] [CrossRef] [Green Version]
  15. Tsuruyama, J.; Shibuya, T. Growth and flowering responses of seed-propagated strawberry seedlings to different photoperiods in controlled environment chambers. Horttechnology 2018, 28, 453–458. [Google Scholar] [CrossRef]
  16. Kang, J.H.; KrishnaKumar, S.; Atulba, S.L.S.; Jeong, B.R.; Hwang, S.J. Light intensity and photoperiod influence the growth and development of hydroponically grown leaf lettuce in a closed-type plant factory system. Hort. Env. Biotech. 2013, 54, 501–509. [Google Scholar] [CrossRef]
  17. Baille, A.; González-Real, M.M.; López, J.C.; Cabrera, J.; Pérez-Parra, J. Characterization of the solar diffuse component under “Parral” plastic greenhouses. Acta Hortic. 2003, 614, 341–346. [Google Scholar] [CrossRef]
  18. Ben Amor, N.; Ben Hamed, K.; Debez, A.; Grignon, C.; Abdelly, C. Physiological and antioxidant responses of the perennial halophyte Crithmum maritimum to salinity. Plant. Sci. 2005, 168, 889–899. [Google Scholar] [CrossRef]
  19. Krom, M.D. Spectrophotometric determination of ammonia: Study of a modified Berthelot reaction using salicylate and dicholoroisocyanurate. Analyst 1980, 105, 305–316. [Google Scholar] [CrossRef]
  20. Hogue, E.; Wilcow, G.E.; Cantliffe, D.J. Effect of soil P on phosphate fraction in tomato leaves. J. Am. Soc. Hortic. Sci. 1970, 95, 174–176. [Google Scholar]
  21. Lachica, M.; Aguilar, A.; Yanez, J. Análisis foliar: Métodos utilizados en la estación experimental del Zaidín. Anal. Edafol. Agrobiol. 1973, 32, 1033–1047. [Google Scholar]
  22. Wellburn, A. The spectral determination of chlorophylls a and b, as well as total carotenoids, using various solvent with spectrophotometers of different resolution. J. Plant. Physiol. 1994, 144, 307–313. [Google Scholar] [CrossRef]
  23. Irigoyen, J.J.; Emerich, D.W.; Sánchez-Díaz, M. Water stress induced changes in concentrations of proline and total soluble sugars in nodulated alfalfa (Medicago sativa) plants. Physiol. Plant. 1992, 84, 55–60. [Google Scholar] [CrossRef]
  24. Baret, F.; Guyot, G.; Major, D.J. Crop biomass evaluation using radiometric measurements. Photogrammetria 1989, 43, 241–256. [Google Scholar] [CrossRef]
  25. Koontz, H.V.; Prince, R.P. Effect of 16 and 24 hours daily radiation (light) on lettuce growth. Hortscience 1986, 21, 123–124. [Google Scholar] [PubMed]
  26. Dodd, A.N.; Salathia, N.; Hall, A.; Kevei, E.; Toth, R.; Nagy, F.; Hibberd, J.M.; Millar, A.J.; Webb, A.A. Plant circadian clocks increase photosynthesis, growth, survival, and competitive advantage. Science 2005, 309, 630–633. [Google Scholar] [CrossRef] [Green Version]
  27. Graf, A.; Schlereth, A.; Stitt, M.; Smith, A.M. Circadian control of carbohydrate availability for growth in Arabidopsis plants at night. Proc. Natl. Acad. Sci. USA 2010, 107, 9458–9463. [Google Scholar] [CrossRef] [Green Version]
  28. Anderson, S.L.; Kay, S.A. Illuminating the mechanism of the circadian clock in plants. Trends Plant. Sci. 1996, 1, 51–57. [Google Scholar] [CrossRef]
  29. Holmes, M.G.; Smith, H. The function of phytochrome in the natural environment—II. The influence of vegetation canopies on the spectral energy distribution of natural daylight. Photochem. Photobiol. 1977, 25, 539–545. [Google Scholar] [CrossRef]
  30. Smith, H.; Whitelam, G.C. The shade avoidance syndrome: Multiple responses mediated by multiple phytochromes. Plant. Cell Env. 1997, 20, 840–844. [Google Scholar] [CrossRef] [Green Version]
  31. Raven, C.W. Chlorophyll formation and phytochrome. Ph.D. Thesis, Wageningen University, Wageningen, The Netherlands, June 1973. [Google Scholar]
  32. Oakenfull, R.J.; Davis, S.J. Shining a light on the Arabidopsis circadian clock. Plant. Cell Env. 2017, 40, 2571–2582. [Google Scholar] [CrossRef] [Green Version]
  33. Webb, A.A. The physiology of circadian rhythms in plants. New Phytol. 2003, 160, 281–303. [Google Scholar] [CrossRef] [Green Version]
  34. Possart, A.; Fleck, C.; Hiltbrunner, A. Shedding (far-red) light on phytochrome mechanisms and responses in land plants. Plant. Sci. 2014, 217, 36–46. [Google Scholar] [CrossRef] [PubMed]
  35. Kubota, C.; de Gelder, A.; Peet, M.M. Greenhouse tomato production. In Tomatoes; CABI: Wallingford, England, 2018; Volume 13, pp. 276–314. [Google Scholar]
  36. Federer, C.A. A soil-plant-atmosphere model for transpiration and availability of soil water. Water Resour. Res. 1979, 15, 555–562. [Google Scholar] [CrossRef]
  37. Hotta, C.T.; Gardner, M.J.; Hubbard, K.E.; Baek, S.J.; Dalchau, N.; Suhita, D.; Dodd, A.N.; Webb, A.A. Modulation of environmental responses of plants by circadian clocks. Plant. Cell Env. 2007, 30, 333–349. [Google Scholar] [CrossRef] [PubMed]
  38. Noordally, Z.B.; Ishii, K.; Atkins, K.A.; Wetherill, S.J.; Kusakina, J.; Walton, E.J.; Kato, M.; Azuma, M.; Tanaka, K.; Hanaoka, M.; et al. Circadian control of chloroplast transcription by a nuclear-encoded timing signal. Science 2013, 339, 1316–1319. [Google Scholar] [CrossRef] [PubMed]
  39. Evans, J.R.; Clarke, V.C. The nitrogen cost of photosynthesis. J. Exp. Bot. 2019, 70, 7–15. [Google Scholar] [CrossRef] [PubMed]
  40. Gutiérrez, R.A.; Stokes, T.L.; Thum, K.; Xu, X.; Obertello, M.; Katari, M.S.; Tanurdzic, M.; Dean, A.; Nero, D.C.; McClung, R.; et al. Systems approach identifies an organic nitrogen-responsive gene network that is regulated by the master clock control gene CCA1. Proc. Natl. Acad. Sci. USA 2008, 105, 7–15. [Google Scholar] [CrossRef] [PubMed] [Green Version]
  41. Haydon, M.J.; Bell, L.J.; Webb, A.A.R. Interactions between plant circadian clocks and solute transport. J. Exp. Bot. 2011, 62, 2333–2348. [Google Scholar] [CrossRef]
  42. Voon, C.P.; Lim, B.L. ATP translocation and chloroplast biology. Nat. Sci. Rev. 2019, 6, 1073–1076. [Google Scholar] [CrossRef] [Green Version]
  43. Versaw, W.K.; Harrison, M.J.; Samuel, T.; Noble, R.; Parkway, S.N. A chloroplast phosphate transporter, PHT2;1, influences allocation of phosphate within the plant and phosphate-starvation responses. Plant. Cell 2002, 14, 1751–1766. [Google Scholar] [CrossRef] [PubMed] [Green Version]
  44. Zheng, J.; He, D.; Ji, F. Effects of light intensity and photoperiod on runner plant propagation of hydroponic strawberry transplants under LED lighting. Int. J. Agr. Biol. Eng. 2019, 12, 2631. [Google Scholar] [CrossRef]
  45. Yang, Z.; He, W.; Mou, S.; Wang, X.; Chen, D.; Hu, X.; Chen, L.; Bai, J. Plant growth and development of pepper seedlings under different photoperiods and photon flux ratios of red and blue LEDs. Trans. Chin. Soc. Agr. Eng. 2017, 33, 173–180. [Google Scholar]
  46. Takahashi, S.; Badger, M.R. Photoprotection in plants: A new light on photosystem II damage. Trends Plant. Sci. 2011, 16, 53–60. [Google Scholar] [CrossRef] [PubMed]
  47. Casal, J.J. Phytochromes, cryptochromes, phototropin: Photoreceptor interactions in plants. Photochem. Photobiol. 2000, 71, 1–11. [Google Scholar] [CrossRef]
  48. Chen, X.L.; Wang, L.C.; Li, T.; Yang, Q.C.; Guo, W.Z. Sugar accumulation and growth of lettuce exposed to different lighting modes of red and blue LED light. Sci. Rep. 2019, 9, 6926. [Google Scholar] [CrossRef] [Green Version]
  49. Almansa, E.M.; Espín, A.; Chica, R.M.; Lao, M.T. Bioassimilation behaviour of tomato seedling cultivars under different sources of artificial light. Aust. J. Crop. Sci. 2014, 8, 873. [Google Scholar]
  50. Graf, A.; Smith, A.M. Starch and the clock: The dark side of plant productivity. Trends Plant. Sci. 2011, 16, 169–175. [Google Scholar] [CrossRef]
  51. Jieun, P.; Yoogyeong, P.; Byoungryong, J.; Seungjae, H. Growth and anthocyanin content of lettuce as affected by artificial light source and photoperiod in a closedtype plant production system. Kor. J. Hortic. Sci. Technol. 2012, 30, 673–679. [Google Scholar]
  52. López, A.; Hellín, P.; Fenoll, J.; Flores, P. Effect of temperature and photoperiod on soluble sugar and organic acid concentrations in lettuce. Acta Hortic. 2012, 939, 227–230. [Google Scholar] [CrossRef]
  53. Taiz, L.; Zeiger, E. Plant Physiology, 3rd ed.; Sinauer Associates: Sunderland, MA, USA, 2002; p. 690. [Google Scholar]
  54. Hayashi, F.; Ichino, T.; Osanai, M.; Wada, K. Oscillation and regulation of proline content by P5CS and ProDH gene expressions in the light/dark cycles in Arabidopsis thaliana L. Plant. Cell Physiol. 2000, 41, 1096–1101. [Google Scholar] [CrossRef] [PubMed] [Green Version]
Figure 1. Spectral distribution of the lamp.
Agronomy 10 00945 g001
Figure 2. Effects of different light treatments (T0, T1 and T2) on fresh weight and dry weight of roots (R), stems (S), leaves and cotyledons (C) (in the case of cucumber) in S. lycopersicum (A,C) and C. sativus (B,D) seedlings. Different letters indicate a significant difference at p < 0.05 according to the ANOVA and LSD test. Data are means of four replicates (n = 4).
Agronomy 10 00945 g002
Figure 3. Effects of different light treatments (T0, T1 and T2) on water content in roots (WCr), stems (WCs), leaves (WCl) and cotyledons (WCc) (in the case of cucumber) in (A) S. lycopersicum and (B) C. sativus seedlings. Different letters indicate a significant difference at p < 0.05 according to the ANOVA and LSD test. The data are means of four replicates (n = 4) ± SD.
Agronomy 10 00945 g003
Figure 4. Effects of different light treatments (T0, T1 and T2) on nitrogen content and partitioning between organs in roots (R), stems (S), leaves (L) and cotyledons (C) (in the case of cucumber) in (A) S. lycopersicum and (B) C. sativus seedlings. Different letters indicate a significant difference at p < 0.05 according to the ANOVA and LSD test. Data are means of four replicates (n = 4).
Agronomy 10 00945 g004
Figure 5. Effects of different light treatments (T0, T1 and T2) on phosphorus content and partitioning between organs in roots (R), stems (S), leaves (L) and cotyledons (C) (in the case of cucumber) in (A) S. lycopersicum and (B) C. sativus seedlings. Different letters indicate a significant difference at p < 0.05 according to the ANOVA and LSD test. Data are means of four replicates (n = 4).
Agronomy 10 00945 g005
Figure 6. Effects of different light treatments (T0, T1 and T2) on potassium content and partitioning between organs in roots (R), stems (S), leaves (L) and cotyledons (C) (in the case of cucumber) in (A) S. lycopersicum and (B) C. sativus seedlings. Different letters indicate a significant difference at p < 0.05 according to the ANOVA and LSD test. Data are means of four replicates (n = 4).
Agronomy 10 00945 g006
Table 1. Agronomic characterization of the light emitting diodes (LED) lamps.
Spectral region (nm)Irradiance (µmol m−2 s−1)
UV (300–400)0.59
B (400–500)201.83
R (600–700)506.58
FR (700–800)0.38
PAR (400–700)731.41
NIR (700–1100)0.37
TOTAL (300–1100)732.32
PAR:TOTAL1
PAR:NIR1973.23
B:R0.40
B:FR528.61
R:FR1326.76
UV = ultraviolet, B = blue, R = red, FR = far red, PAR = photosynthetically active radiation, NIR = near red infrared.
Table 2. Effects of different light treatments (T0, T1 and T2) on length (cm), internodes number and shoot diameter (cm) in (A) S. lycopersicum and (B) C. sativus seedlings. Different letters indicate a significant difference at p < 0.05 according to the ANOVA and LSD test. The data are means of four replicates (n = 4) ± SD.
TreatmentsT0T1T2
S. lycopersicumLength27.38 ± 1.70 b31.13 ± 1.85 a32.75 ± 2.09 a
Internodes number4.00 ± 0.20 a3.75 ± 0.40 a4.25 ± 0.30 a
Shoot diameter1.70 ± 0.10 a1.38 ± 0.09 b1.45 ± 0.10 b
C. sativusLength7.15 ± 0.61 a7.12 ± 0.65 a7.37 ± 0.67 a
Internodes number4.00 ± 0.30 a3.75 ± 0.40 a4.00 ± 0.30 a
Shoot diameter1.82 ± 0.11 a1.75 ± 0.10 a1.73 ± 0.10 a
Table 3. Effects of different light treatments (T0, T1 and T2) on pigments concentrations (mg g−1 FW) in S. lycopersicum (A) and C. sativus (B) seedlings. Different letters indicate a significant difference at p < 0.05 according to the ANOVA and LSD test. The data are means of four replicates (n = 4) ± SD.
Light treatmentsT0T1T2
S. lycopersicumChl a5.71 ± 0.51 a5.47 ± 0.61 a5.77 ± 0.47 a
Chl b3.82 ± 0.31 a2.17 ± 0.21 b2.11 ± 0.19 b
Chl (a + b)9.50 ± 0.61 a7.60 ± 0.70 b7.85 ± 0.79 b
Chl a/b1.50 ± 0.11 b2.52 ± 0.23 a2.70 ± 0.26 a
Car0.01 ± 0.001 c0.24 ± 0.02 b0.47 ± 0.04 a
C. sativusChl a3.64 ± 0.33 b3.36 ± 0.34 b4.45 ± 0.43 a
Chl b2.52 ± 0.30 a1.75 ± 0.18 b0.84 ± 0.09 b
Chl (a + b)6.14 ± 0.56 a5.11 ± 0.40 b5.29 ± 0.50 b
Chl a/b1.44 ± 0.12 c1.92 ± 0.16 b5.29 ± 0.50 a
Car0.19 ± 0.02 a0.20 ± 0.02 a0.21 ± 0.02 a
Table 4. Effects of different light treatments (T0, T1 and T2) on leaf total soluble sugars (mg glucose-equivalent g−1 FW) and proline (µg g−1 FW) concentration in S. lycopersicum (A) and C. sativus (B) seedlings. Different letters indicate a significant difference at p < 0.05 according to the ANOVA and LSD test. The data are means of four replicates (n = 4) ± SD.
Light TreatmentsT0T1T2
S. lycopersicumTSS32.06 ± 3.21 a20.40 ± 1.94 b18.79 ± 1.83 b
Proline56.66 ± 5.55 a36.57 ± 3.48 b38.74 ± 3.75 b
C. sativusTSS21.86 ± 1.91 a15.48 ± 1.50 b16.26 ± 1.62 b
Proline78.72 ± 7.88 a47.26 ± 4.33 b35.84 ± 3.08 c

