Article

Introduction of Cardoon (Cynara cardunculus L.) in a Rainfed Rotation to Improve Soil Organic Carbon Stock in Marginal Lands

1
CREA—Research Centre for Agriculture and Environment, via di Lanciola 12/a, 50125 Florence, Italy
2
CREA—Research Centre for Agriculture and Environment, via della Navicella 2–4, 00184 Rome, Italy
3
Novamont Spa, Piazz.le G. Donegani, 4, 05100 Terni, Italy
*
Author to whom correspondence should be addressed.
Submission received: 29 May 2020 / Revised: 19 June 2020 / Accepted: 23 June 2020 / Published: 1 July 2020
(This article belongs to the Special Issue Soil Degradation Prevention and Restoration at Farm and Field Scale)

Abstract

:
The production of a biomass as a feedstock for biorefinery is gaining attention in many agricultural areas. The adoption of biorefinery crops (i.e., perennial cardoon) can represent an interesting option for farmers and can contribute to increase soil organic carbon stock (SOCS). The study aimed to assess the potential effect on long-term SOCS change by the introduction of cardoon in a Mediterranean marginal area (Sassari, Italy). To this end, three process-oriented models, namely the Intergovernmental Panel on Climate Change (IPCC) guidelines for national greenhouse gas inventories (Tier 2), a humus-balance model (SOMBIT) and Rothamsted carbon model (RothC), were used to compare two scenarios over 20 years. The traditional cropping system’s faba bean–durum wheat biennial rotation was compared with the same scenario alternating seven years of cardoon cultivation. The model’s calibration was performed using climate, soil and crop data measured in three cardoon trials between 2011 and 2019. SOMBIT and Roth C models showed the best values of model performance metrics. By the insertion of cardoon, IPCC tool, SOMBIT and RothC models predicted an average annual SOCS increase, whereas, in the baseline scenario, the models predicted a steady state or a slight SOCS decrease. This increase can be attributed to a higher input of above- and belowground plant residues and a lower number of bare soil days (41 vs. 146 days year−1).

Graphical Abstract

1. Introduction

In the future decades, the transition from a fossil-based to a biomass-based economy is crucial for economic and environmental sustainability; therefore, Europe aims at achieving an optimal and efficient multipurpose exploitation of renewable biomasses as food, added valued chemicals and energy [1,2,3]. As well, the impact in biomass production for the bioeconomy is crucial for environmental sustainability [4,5]. Land degradation caused by human activities negatively impacts the well-being of at least 3.2 billion people, costing more than 10% of annual global gross products through the loss of biodiversity and ecosystem services [6]. Soil degradation, as part of land degradation, includes the loss of soil through erosion and the depletion of soil organic matter (SOM) [3,7]; it has been estimated that nearly two billion ha (23%) of the world’s used lands— agricultural lands, permanent pastures, forests and woodlands—have been degraded since the mid-twentieth century [8], causing important implications, particularly in the Mediterranean area [9]. Soil organic Carbon (SOC), conventionally assumed to be 58% of the SOM [10], is beneficial for soil health for many reasons, including improved fertility, productivity and soil biodiversity, reduced erosion, runoff and water pollution, and can help buffer crops and pasture systems against the impacts of climate change [11,12]. Furthermore, maintaining organic C-rich soils, restoring and improving degraded agricultural lands and, in general terms, increasing the soil C could play fundamental roles in addressing food security and in mitigating the anthropogenic greenhouse gas (GHG) emissions. For these reasons, any bio-based product chain should start from a responsible use of agricultural land, such as a sustainable SOC management. Due to the high variability of SOC and slow change, the time horizon is usually referred almost to 20 years and dynamics assessed by modeling. Within this context, the assessment of the biorefinery cropping system on the SOC stock (SOCS) variation over a long period becomes a key factor. To this end, the Horizon 2020 First2Run project (http://www.first2run.eu/) provided soil and crop data measured in three farm trials under Cynara cardunculus L. (CAR). This project aimed at demonstrating the techno, economical and environmental sustainability at the industrial scale of a first-of-its-kind value chain with a low input and underutilized oil crop (i.e., CAR) grown in arid and/or marginal lands whose vegetable oil is converted into bio-monomers as building blocks for high added value bio-based products, i.e., biolubricants, cosmetics, bioplastics and additives, through the integration of chemical and biotechnological processes [13]. Furthermore, several authors showed how simple cropping techniques and low production costs are the main requirements to produce nonfood crops [14], and the growth of perennial crops, as CAR, increase the amount of SOC sequestration in soil compared with annual arable cropping systems [15,16].
In the last 80 years, several process-oriented models have been developed to predict SOC dynamics and biogeochemical-related soil processes on a daily, monthly or annual basis [17,18]. At sites where less-detailed data are available, models requiring few parameters able to produce reliable and accurate simulations are preferred in comparison with those requiring large amounts of data (meteorological data, crop phenological data, soil chemical and physical characteristics), which can limit their use. In this context, among the simplest models used for assessing SOC dynamics, the 20-year step Intergovernmental Panel on Climate Change (IPCC) tool [19,20], the annual-step humic balance family [21,22,23] such as the SOM stock dynamics for the Biorefinery Integrated into the Territory (SOMBIT) model [24] and the monthly-step Rothamsted carbon (RothC) model [25] have been extensively applied to numerous field studies worldwide to predict the SOC dynamics under various types of agricultural management and agroclimatic regions (e.g., the IPCC tool: [26,27,28,29]; humic balance: [30,31,32] and RothC: [33,34,35]). Both humic balance and RothC models follow exponential kinetics and reflect SOC variations over 1- to 100-year periods well.
In the Mediterranean region, these models and revised versions have already been used both at the plot (e.g., [36,37,38,39]) and sub-regional (e.g., [40,41]) scales.
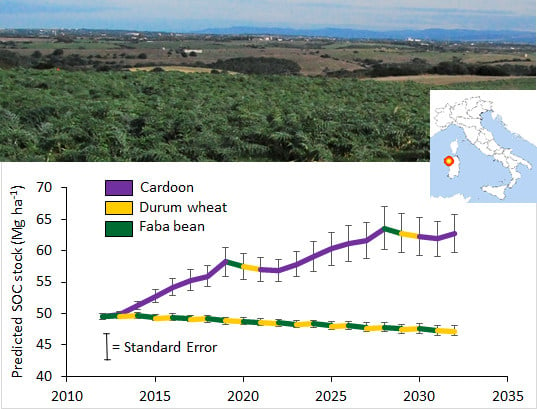
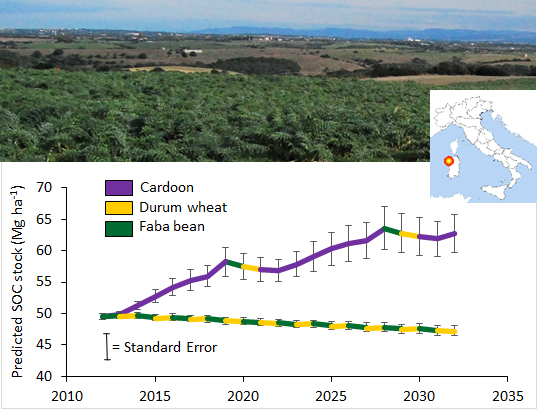
However, to the best of our knowledge, there have not been studies so far investigating SOC dynamics at the plot scale, linking CAR cultivation with prediction management scenarios using different modeling approaches. Thereby, the main general aim of this study was to evaluate how the introduction of perennial CAR in a typical industrial rainfed cropping system of Sardinia (Italy) influenced the SOCS dynamic and sequestration in the topsoil (0–30 cm) over a 20-year period (2012–2031) by using the IPCC tool, SOMBIT and RothC models. This study focused on quantifying how this cropping system could contribute in three Mediterranean marginal lands to mitigate climate change.

2. Materials and Methods

2.1. Study Area

The study area was located in the Municipality of Porto Torres (Sassari, Sardinia, Italy). According to the Corine Land Cover inventory [42], the area is classified as nonirrigated arable land. The widespread rotation in the area is the two-year rainfed durum wheat (Triticum durum Desf.; DW)–faba bean (Vicia faba L. var. minor; FB). According to the classification suggested by Fernando et al. [43], the area can be considered a marginal land, because the local yields of DW and FB [24,44] resulted in lower than 7-year national Italian mean values (−16% and −41%, respectively) [45]. In this context, two farms of 7 ha (farms 1 and 2) and one of 18 ha (farm 3) were selected for the introduction of a 7-year CAR (C. cardunculus var. altilis DC) cultivation and monitored during the period 2011–2018. Dominant reference soil groups of the World Reference Bases for Soil Resources classification in that area are Luvisols [46], and the climate is typical Mediterranean, with hot and dry summers. The 30-year average temperature, rainfall and evapotranspiration are 16.77 °C, 567.99 mm and 1128.98 mm, respectively (Table 1).

2.2. Farm Management and Soil Sampling of Cardoon

At sowing, the seedbed was prepared between October and November (Figure 1) with ploughing at 20 cm, followed by harrowing at 10–15 cm. During the first year, mineral fertilization with P2O5 and N was added, and weeds were chemically controlled. CAR was harvested every year when the moisture content of the seeds and stalks was about 8% and 15%, respectively. Thus, harvest was performed in late August by combine harvester, separating seeds and aboveground biomass in bales after raking. CAR was fertilized yearly starting from the second year, after the harvest (usually in October or November) and before it “covered” the field.
In the three farms, soils were sampled at 0–30-cm depths in different growing seasons (Figure 1). The samples were air-dried, powdered and sieved at 2 mm prior to being analyzed for the main physicochemical soil properties. Bulk density (BD; kg m−3) was estimated by using a pedotransfer function specific for Mediterranean regions from clay, sand and SOC content (% w/w), following Pellegrini et al. [47]:
BD = 1.68 1.16 × 10 5   c l a y 2 4.48 × 10 4   s a n d 2.35 × 10 1 ( SOC 0.58 ) 0.5

2.3. Assessment of Plant Residue Inputs

To run the SOMBIT and RothC models, annual aboveground plant residues (Rag) were measured for CAR and estimated for DW and FB. Belowground (Rbg) of all crops were estimated from aboveground biomasses. Regarding arable crops, aboveground FB was derived from Razza et al. [24], while for the DW by statistical data [44], using a harvest index (HI) of 0.40 [48]. For both crops, Rbg were estimated from the Rag according to previous studies [40,49,50]. Weeds were estimated as 7% of the total aboveground biomass [40]. Regarding CAR, the main agricultural operations were recorded yearly. Three different crop-growing periods were considered to calculate the plant residues. The first period refers to the first growth year (YR1), in which grain and biomass yields are generally low; the second period goes from the second to the sixth years (YRS2–6), in which the grain and biomass yields are estimated as the mean of five years of production, and the third period is the explant year (YR7). CAR straw yields were measured, whereas Rbg were estimated. The Rag of CAR was about 30% of the aboveground biomass left on the ground after harvest. Moreover, further residues came from basal leaves (8–10% of foliar biomass), stem and threshing residues of leaves produced during the annual crop cycle. Weeds were present only in YR1 before the CAR canopy development and accounted for 6% of the total CAR aboveground biomass by experimental observation.
Total CAR belowground biomass was mainly allocated in the topsoil (70–80%) and estimated considering a 1:1 shoot (as leaves, stalks and heads) to root ratio [51]. Rbg included: (i) the annual decomposed fractions of roots, except for the first year (YR1), when root renewal was negligible and for the explant year (YR7) when the total root biomass was accounted for and (ii) the root exudates following Di Bene et al. [38] and Pausch and Kuzyakov [52]. Moreover, it was estimated that the CAR root biomass totally renewed in three years [53]; consequently, one-third decomposed yearly. Table 2 shows formulas used to calculate plant residues (Mg ha−1) according to the procedure outlined above and following previous studies.
The SOMBIT model directly used dry matter plant residues as the input, whereas, to run RothC, plant residues were previously converted to C inputs. For FB and DW, the C content of both above- and belowground was assumed to be 45% [40]. Measured CAR C content was 45% and 49% for above- and belowground, respectively.

2.4. Agricultural Systems Models

2.4.1. IPCC for Italy at the Farm Level

In 2006, the Intergovernmental Panel on Climate Change developed a guideline for estimating the SOCS over time [19] used by countries for reporting to the United Nations Framework Convention on Climate Change. The IPCC set up the methodology for estimating the SOCS after a 20-year steady-state management by considering three different tiers of complexity. In this study, we used the tier 2 method, applying the SOCS increase as predicted by the model in redefined standard SOCS values following the tier 1 procedure but calibrating the model from the observed SOCS data. Therefore, the yearly changes in the SOCS were calculated by the difference between the final and initial predicted SOCS values. The input data required for this model are the mean annual temperature (°C), potential evapotranspiration (mm), frost occurrence, soil type and land-use class. In addition, for croplands, tillage and organic input classes were also considered.
The model was run to match the values of observed SOCS in each farm in the first soil sampling year (i.e., first and second year after CAR planting for farms 1 and 2 and farm 3, respectively). Since in farms 1 and 2, the first soil analysis occurred in 2013, the model was run in inverse mode to calculate the initial SOCS and starting the scenario in 2012.

2.4.2. The SOMBIT Model

The SOMBIT model was implemented in the BIT3G project [54] for estimating the site-specific SOM stock dynamics in cropping systems carried out to produce raw materials for biorefinery. It belongs to the humus-balancing family model referred to the SOM turnover as a function of ecological site properties and input amount and quality [55].
SOMBIT model has a year-step and uses primary or published data to estimate (i) the increase of SOCS due to the amount and type of biomass supply, the latter through the isohumic coefficient (k1) relying on biomass compositions in soluble fraction, hemicellulose, lignin and cutin, crude fiber and ash contents [55,56,57,58], and (ii) the decrease of SOCS through the mineralization coefficient (k2) influenced by pedoclimatic conditions and farming practices [59,60,61]. SOMBIT implements in Hénin-Dupuis model the estimation of the management coefficient using fuzzy logic to reach continuous instead of discrete values. It has already been applied in annual [62], annual-perennial [24] and perennial [63] agricultural systems.
The input data required to run the model are: mean annual temperature (°C), bulk density (kg dm−3), coarse fragments (dm3 dm−3), SOC (% w/w), clay and calcium carbonate contents (g kg−1), depth of the soil layer considered (cm), presence or absence of irrigation, organic matter supply (% w/w), tillage type, frequency (n year−1) and depth (cm). In addition, annual organic input supply is considered, i.e., amounts of above- and belowground residues and organic manure—if applied—(Mg ha−1) with respective isohumic coefficients (kg kg−1).
The k1 attribution for the Rag and Rbg of FB, DW and CAR was included in the parametrization. The model calibration was performed by attributing the initial SOCS equal to those determined with the first soil analysis performed for each farm, because the model cannot run in inverse mode.

2.4.3. RothC Model

The Rothamsted carbon model (version 26.3; RothC-26.3) is a process-based and multicompartmental model to simulate the long-term C turnover in the topsoil [25,64] for different vegetation types, including arable crops, grasslands and forests, on a monthly step base [65,66].
The model splits the SOC into five pools: one inert organic matter (IOM) pool—which does not participate in C turnover—and four active fractions, i.e., decomposable plant material (DPM), resistant plant material (RPM), microbial biomass (BIO) and humified organic matter (HUM). The decomposition rate is influenced by clay content, soil moisture, air temperature and plant cover.
The model input data are climate (monthly temperature, precipitation and evapotranspiration); soil (clay content and initial SOCS) and land use and management information, such as soil cover (bare or covered), quantity and quality of plant residues returned to soil and organic exogenous inputs, if any.
To calibrate the model, monthly C inputs for FB-DW and CAR were estimated after Farina et al. [40] and Raccuia and Melilli [51], respectively, whereas the DPM/RPM ratio after Coleman and Jenkinson [25] and Jones et al. [67].
The model was first run iteratively in inverse mode to equilibrium (10,000 years) under constant environmental conditions and with the default pools and coefficient in order to generate the C input required to match the initial value of SOCS [68]. Then, RothC was run for calibration using the data of farm 1, with the C input estimated as in Section 2.3 from 2012 to 2018 (7 years) and by adjusting the DPM/RPM ratios up to fit the measured SOCS variation in the soil [69]. Subsequently, the 2012–2018 simulations of farms 2 and 3 were used to model the validation.

2.5. Scenarios Configuration

After the parametrization, calibration and validation processes, the three models were run for a 20-year period (2012–2031) using climate, soil and management data as the inputs to assess the potential SOCS change after the introduction of CAR in a typical Mediterranean industrial rainfed cropping system.
Two different scenarios, both conceivable, were hypothesized as follows:
  • Scenario S0 represented by 2-year rainfed FB-DW rotation (FB–DW) commonly cultivated in the study area under conventional tillage (annual ploughing).
  • Scenario S1 represented by the introduction of CAR cultivation in the conventional 2-year FB–DW rotation with this succession: CAR (7 years)–FB–DW–CAR (7 years)–FB–DW–CAR (2 years). Thus, the S1 represents a biorefinery-feed-food cropping system.
  • In both scenarios, the referred year is the year in which the crop was harvested. To explore the maximum potential for SOC sequestration, scenarios were run assuming all FB-DW and 30% CAR plant straws returned to the soil.
The potential SOC sequestration rate (SR) was used to compare the efficiency in the SOC sequestration after 20 years of S0 and S1 simulated managements. It was calculated as:
SR = ( SOC final SOC initial ) I
where SOCfinal and SOCinitial refer to the SOC values estimated at the end and beginning of the simulation, respectively, and I is the total C input implemented in the model during the 20-year period.
The SR values can be negative, null or positive. Value null indicates a steady state between C inputs and outputs and positive values show that C inputs are sequestered in soils, while negative values indicate that the C inputs did not offset SOC losses due to the mineralization process [70]. SR was calculated only for SOMBIT and RothC models, since the IPCC tool implements the amount of organic inputs only by qualitative classes.

2.6. Statistical Analysis

Main soil characteristics were analyzed by using one-way analysis of variance (ANOVA). If H0 data showed neither a normal distribution of error terms nor constant error variance, a nonparametric Kruskal–Wallis test was used. The analyses were performed using Statistica 7.0 (Statsoft©, Tulsa, OK, USA).
Model performances were assessed by comparing the simulated SOC dynamic against the observed measurements—excluding values utilized for calibration—to assess model performances using the following statistics:
  • The root mean square error of prediction (RMSE) indicates the difference between observed and model-estimated values (range 0-∞). RMSE close to 0 shows a perfect agreement between observed and model-estimated values. The better is the simulation, and the lower is the value of RMSE [71].
  • The relative error (RE) is the mean difference between measured and simulated data giving an indication of the bias in the simulation weighted as a percentage of the mean value of observed data (Ō). Positive values indicate an underestimation and negative an overestimation of predicted vs. measured data [72].
The formulas of RMSE and RE are shown in Equations (3) and (4) below:
R M S E = i = 1 n ( P i O i ) 2 n
R E = 100 O ¯ × i = 1 n ( O i P i ) n
where O ¯   is the mean values of observed data, respectively, Oi and Pi indicate the observed and predicted values, respectively, and n is the number of measurements.

3. Results

3.1. Soil Characteristics

As a consequence of the farm size, ranging from 7 to 18 ha, the main physicochemical characteristics did not significantly differ among the farms. Soils were clay, with a common or frequent presence of coarse fragments, and medium bulk density. On average, the main differences were detected as a limestone content, i.e., scarcely calcareous in farm 3, moderately calcareous in farm 1 and very limestone in farm 2 (Table 3).

3.2. Plant and C Inputs

The total plant inputs (from Rag, Rbg and Rw) and C input values of the soil are reported in Table 4 with the aim of defining the influence of different crop cultivations on SOCS changes. The total plant and C inputs varied throughout the cultivation years, depending on the amount of Rag and Rbg returned to the soil.
In the three case studies, the total aboveground biomass of the CAR was quite stable, with a mean value of 11.6 Mg ha−1y−1. The highest and lowest productions were both observed in farm 1 during the YR2–6 and YR1 growth periods, respectively.
The CAR Rbg was affected by the crop stand age and positively related to the root turnover, reaching the highest value in the explant year.
On average, the plant and C inputs observed in YR7 were around four times higher than the value obtained in YR1. The total amount of the plant and C inputs returned to the soil seven years after CAR cultivation were 94.8 and 46.3 Mg ha−1, respectively.
The total plant and C inputs returned to the soil in the FB-DW rotation were estimated to be 11.0 and 5.0 Mg ha−1, respectively (Table 4).

3.3. SOC Stock Change and Model Performance

Figure 2 shows the observed SOCS values for the 2012–2018 period (grey dots), compared with the simulated SOCS trends for the same period and averaged for the three farms (mean ± standard error), reporting dots and lines in green, blue and red colors for IPCC tool (20-year step), SOMBIT (annual step) and RothC (monthly step), respectively. In the three farms, SOCS measured values changed over the seven years of CAR cultivation, reaching a mean value of 64.2 ± 2.1 Mg ha−1 at the explant year (YR7). After seven years of CAR, the final SOCS was 29% higher than the initial value.
The validation of the three models was performed by comparing the simulated SOCS values with the observed data in the three farm trials. The IPCC tool (tier 2 assessment) was not able to satisfactorily reproduce the increasing trend of the observed SOCS values during the seven years of the CAR cycle (i.e., 1.3 Mg ha−1 predicted vs. 14.4 Mg ha−1 observed in 2018). Conversely, both SOMBIT and RothC models were able to adequately predict the SOCS increase in the same period (7.2 Mg ha−1 vs. 14.0 Mg ha−1 predicted with SOMBIT and RothC, respectively). In both the SOMBIT and RothC models, the highest increase was predicted at the explant of CAR (YR7) when all root biomass was completely accounted for Rbg and recycled.
Models’ performances are reported in Table 5. The best RSME value was observer under the RothC prediction. The lowest RE value was observed under the SOMBIT model.

3.4. SOC Stock Predictions by Modeling

Figure 3 shows the SOCS predictions by the three models over 20 years of simulation, for both S0 and S1. In all predictions, the SOCS changes under S0 showed a maintenance (IPCC tool) or slow decrease (SOMBIT and RothC), while in S1, a slight (IPCC tool) or a noteworthy increase (SOMBIT and RothC) in the SOCS values were observed.
In details, the SOCS changes predicted by the IPCC tool were unperceivable for both scenarios, with respect to the initial SOC value. After 20 years, the SOCS for the three farms did not change in S0 (49.3 ± 0.6 Mg C ha−1), while increased by 1.5 Mg C ha−1 in S1 (50.8 ± 0.6 Mg C ha−1).
The 20-year predictions by the SOMBIT model showed that the final SOCS under S0 reached 44.4 ± 1.0 Mg C ha−1, decreasing by a mean value of 0.3 Mg C ha−1year−1. Contrariwise, in S1, the estimated increase in the SOCS was, on average, 0.9 ± 0.1 Mg C ha−1 per year, reaching, after 20 years, a mean SOC value of 67.9 ± 1.1 Mg C ha−1.
Similarly to the SOMBIT model, the SOCS dynamic predicted by the RothC model showed that, in S0, the SOCS decreased annually by a mean value of 0.1 Mg C ha−1, reaching, after 20 years, 48.1 ± 0.6 Mg C ha−1 SOCS values. Regarding S1, the predicted SOCS increased by 1.0 ± 0.1 Mg C ha−1 per year, reaching, after 20 years, the values of 69.5 ± 1.2 Mg C ha−1.

3.5. Potential SOC Sequestration

As reported in Table 6, the SOMBIT simulations for the 20-year period showed that the final SOCS decreased in the baseline scenario (S0) in respect to the initial SOC value, while, in the alternative scenario (S1), the final SOCS raised by 18.1 Mg C ha−1 compared with the initial SOC value. The SR ranged from −0.1 to 0.2 under S0 and S1. Similarly, for the same period, RothC simulated a final SOCS that showed a slight decrease and a greater increase than the initial SOC value in S0 and S1, respectively.

4. Discussion

To the best of our knowledge, this paper is the first study in the Mediterranean Basin assessing the influence of CAR crop introduction in a typical industrial rainfed cropping system on SOCS change in a 20-year scenario perspective using a modeling approach.
Several studies have indicated that CAR—native to the Mediterranean Basin—is one of the most promising species for energy production in this area [73,74,75]. The crop characteristics that support these applications are the relatively low crop input and large biomass productivity, mainly of lignocellulosic compositions and high heating values [76].
Moreover, the introduction of these crops into the traditional agricultural system may represent an interesting alternative to increase the agroenvironmental cropping system’s sustainability. This is because CAR directly enhances the soil fertility due to the reduction of the tsoil tillage frequency and low nutritional requirements [77] and reduces the soil degradation due to the protection of its dense canopy against the erosion [78,79].
CAR is a perennial herbaceous rhizomatous root species native to the Mediterranean Basin [14,
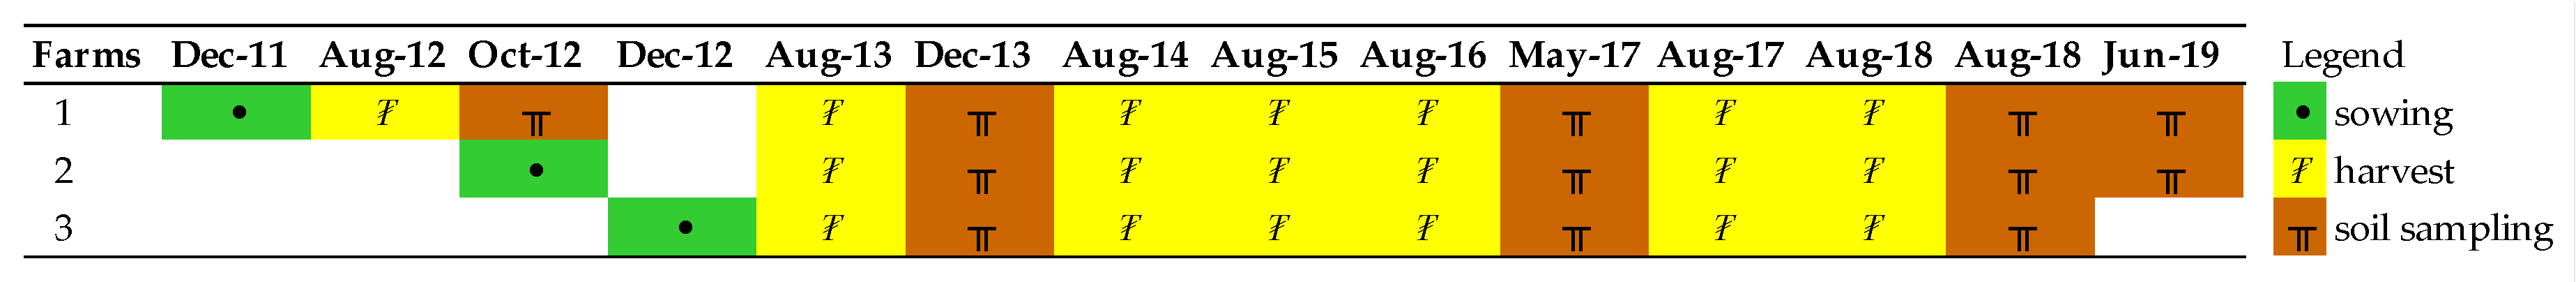
80], which can grow up to 2-m-high and presents the leaves of the basal rosette petiolata very large and coriaceous [81]. It is an autumn-sown and summer-harvested crop, with an annual reproductive cycle, which is completed yearly by the end of spring [82].
In Mediterranean conditions, it is normally rainfed, and the biomass depends only on the amount of the rainwater accumulated during autumn, winter and early spring in the soil and extracted by its deep roots system [83]. Good performances occur with 450-mm water availability in the period ranging from shoot emissions to head differentiations [76]. The CAR biomass yields observed in the present study (Table 4) are comparable with the scientific literature available from similar studies carried out in other rainfed Mediterranean areas. In fact, the aboveground biomass production during the first growth year is usually low; then, the biomass production usually rises to the third and becomes more stable over the following years [84], decreasing by the seventh or subsequent years [77,85]. In this research, the average production in grain and straws was lower in YR1 and higher in YR2–6, while, in YR7, decreased slightly, hence corroborating the planning of a seven-year CAR cultivation also in the study area. Further, in a study carried out in the Basilicata Region (Southern Italy), Piscioneri et al. [86] observed a three-year average dry biomass yield of 12.5 Mg ha−1 (ranging from 10.0 to 15.0 Mg ha−1). Similarly, Ledda et al. [87] in Sardinia (Italy) observed a dry biomass yield of 10.2 Mg ha−1 (ranging from 6.8 to 11.6 Mg ha−1), while Francaviglia et al. [88] and Neri et al. [79] in a marginal hilly area of the Latium Region (Central Italy) reported a yield of 12.9 and 11.4 Mg ha−1 as the average, respectively. In Portugal, Gominho et al. [89] reported a total dry biomass yield of 9.7 Mg ha−1 (range 4.4–18.4 Mg ha−1), while in Northern Greece, Vasilakoglou and Dhima [90] observed dry biomass yields of 11.0 Mg ha−1.
Since the cropping system’s purpose aimed to maintain or increase the SOCS, in both scenarios, straws of FB and DW after the harvests were supposed to be left on the ground and incorporated by the next tillage. Indeed, in the study area, in 70% of the cropping systems, straw is left in the field [91], notably in marginal areas where yields are lower. CAR straws were harvested as biorefinery feedstock, although 30% of the aboveground biomass was left in the soil to increase sustainability, instead of 10%, as reported in previous trials [24].
The models required specific parametrizations. Following the IPCC classification (2006 to 2019), in the study area, (i) the climate fell in a “warm temperate, dry” region (comparing Table 1 data), (ii) soils were classified as “high-activity clay soils” (Table 3), (iii) land use was “long-term cultivated” and “cropland remaining as cropland”. However, the SOCS predicted by the IPCC model changed in S0 and S1 due to variations in the soil management. The steady-state (S0) management fell in the “full tillage” class due to annual arable crops with generally full inversions, and organic inputs resulted “medium”, according to the IPCC definition, because the annual crop residues were returned to the field, and N-fixing crop (FB) was present in the cropping system. Conversely, as a result of semi-perennial CAR cultivation (S1), tillage occurred only six times in the 20-years scenario (0.3 frequency), so the cropping system could be attributed to the “no till” IPCC class, and the estimated residues supplied in 20 years increased from 104 Mg ha−1 in S0 to 229 Mg ha−1 in S1, taking into account both agricultural cropping systems and the data reported in Table 3. For that reason, the organic inputs in S1 were attributable to the “high without manure” IPCC class.
The SOMBIT parametrization provided k1 from the literature, except CAR Rbg, that has been estimated. DW and FB Rag was 0.10 and 0.08, respectively, whereas Rbg was 0.15 for both crops [92]. CAR Rag was 0.18, as experimentally calculated by Razza et al. [24], whereas Rbg was estimated considering that roots of perennial plants have higher decay resistance than annual ones, due to the higher lignin contents [93]. In detail, k1 was estimated as 0.27, increasing the k1 Rbg value applied for annual crops by the perennial and annual RPM ratio applied in RothC (1.80).
In RothC, the arable crop default value (1.44) of the DPM/RPM ratio was used for FB and DW residues, whereas, for CAR residues, 1 and 0.35 ratios were used for Rag and Rbg, respectively. The DPM/RPM Rag value means 50% DPM and 50% RPM and is intermediate between the typical value for arable crops and scrubs (1.44 and 0.67, respectively). The DPM/RPM Rbg value was lower following Kätterer et al. [93] and was assumed as the ratio of 0.26% DPM and 0.74% RPM.
The introduction of CAR (S1) led to a 75-kg C ha−1 annual increase applying the IPCC tool (2019) refining default values (Figure 3). This value seems rather underestimated compared with the observed data reported in Figure 2. Indeed, for both RMSE and RE statistics (
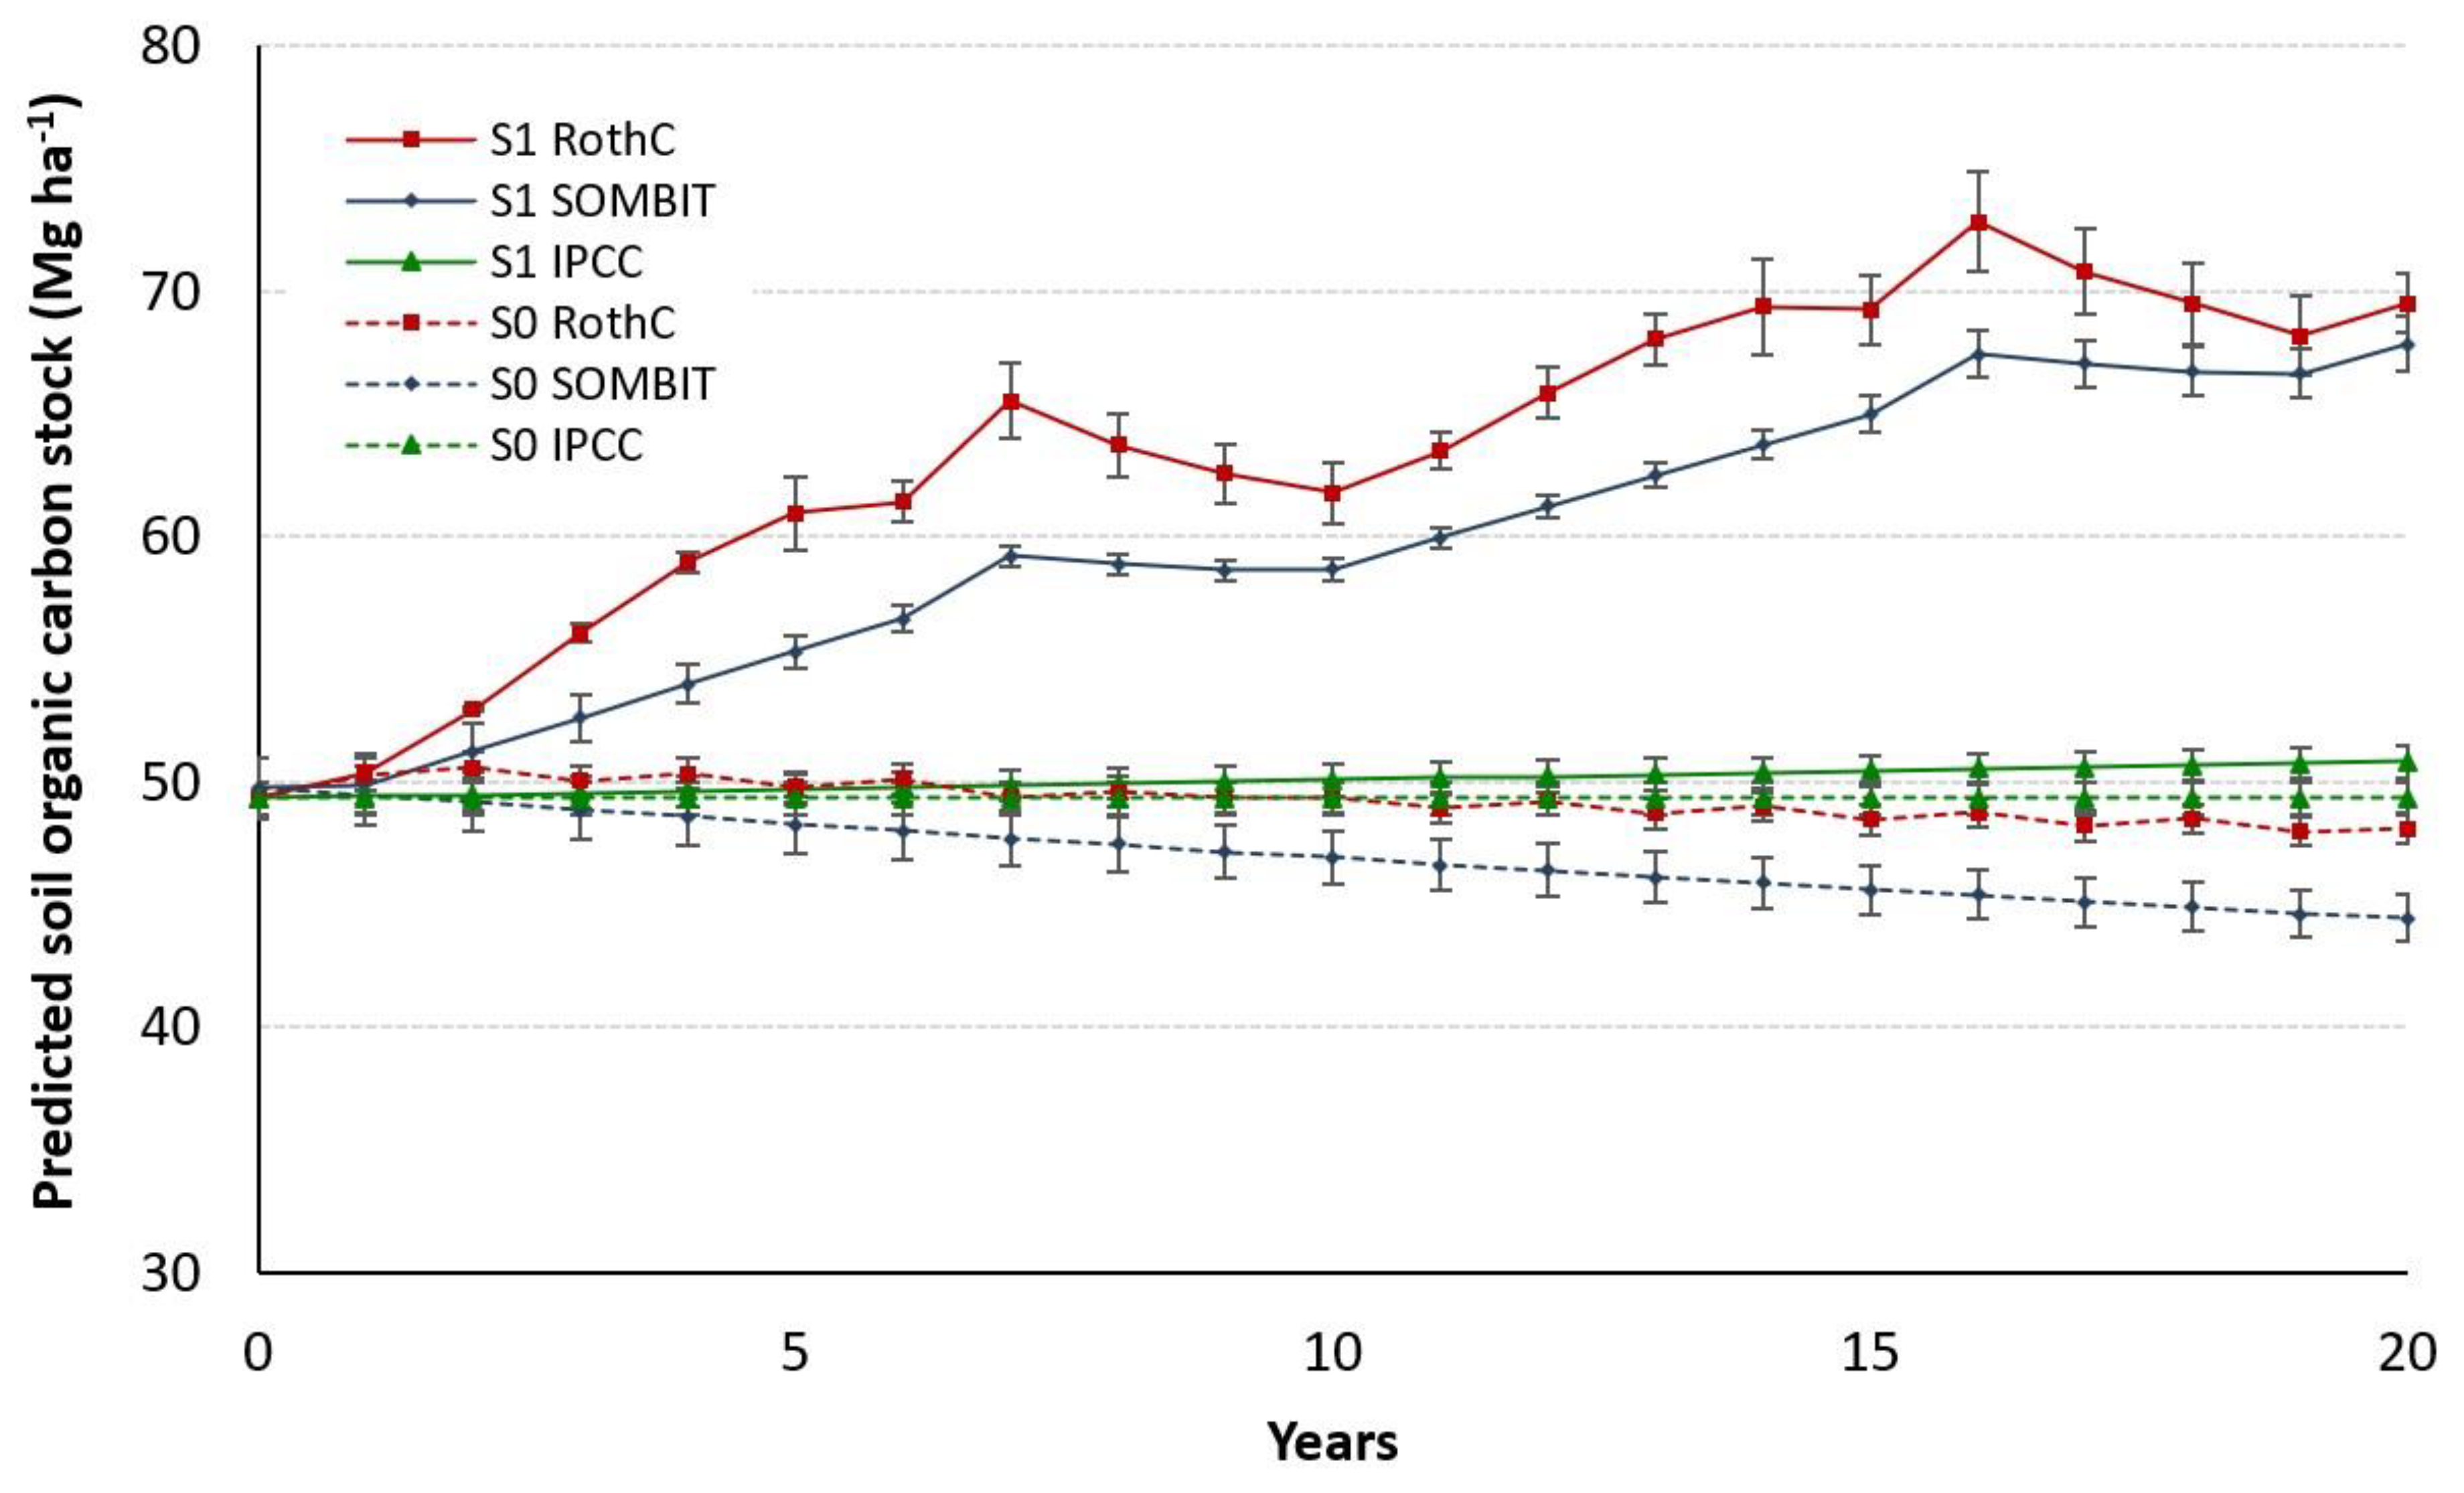
Table 5), the IPCC tool showed the lowest performance, because it did not accurately predict either the SOC trend or its change. In the SOMBIT and RothC models, the simulated values remained within, or very close to, the standard error of the measured values. The high model performances in simulating the measured data in the studied area gave high reliability to the simulation in the perspective of the next 20 years. However, the IPCC tool results were preserved mainly to compare the predictions obtained with other models. Indeed, the increase in SOCS predicted by the SOMBIT and RothC models resulted higher than the IPCC model (Figure 3), because they considered even the annual residue quantities supplied and the specific soil features. This improvement in input quantification allowed to assess the different field conditions, reducing the uncertainty due to IPCC wide classes tailored for a national scale.
In S0, SOCS predicted by SOMBIT and RothC decreased, on average, by 267 ± 14 and 61 ± 0.3 kg C ha−1 per year. These findings are consistent with a decrease observed by Mazzoncini et al. [94] in a 28-years trial in similar conditions. Contrariwise, in S1, SOCS predicted by SOMBIT and RothC increased in average by 905 ± 110 and 1009 ± 53 kg C ha−1 per year, respectively. The higher increase occurred in the last year of CAR cultivation for both models when, at explant, all roots were left in the soil.
The long-term prediction highlighted the positive effect of CAR introduction in the rainfed two-year FB-DW rotation in terms of SOC sequestration. In this study, the SR was about 70% greater than that estimated in different cropping systems [67], resulting from the high C input from plant residues and a simultaneous reduction of C loss by no soil disturbance. Furthermore, the predicted increase is remarkable if related to the carbon footprint of CAR cultivated without organic input in the same area, as estimated by Razza et al. [24] and Cocco et al. [95], in 1.7 and 2.1 MgCO2 eq ha−1, respectively. Indeed, it is possible to convert the change of the SOCS in potential CO2 emissions by the ratio of CO2 and carbon molecular weights: 1 Mg ha−1 of SOCS corresponds to 3.66 Mg of CO2 [96,97]; hence, the predicted SOCS increase in S1 can probably offset the carbon footprint of CAR. The 4p1000 initiative [98], despite the criticism on a global-scale application [99], could be an interesting target at the farm scale, applying the formula suggested by Priori et al. [97]. It allows to compare the 4‰ target SOCS increase with results of the model predictions. In the investigated fields, to reach the target, the SOCS after 20 years should be 53.9 ± 1.4 Mg C ha−1, a result widely achieved in S1 following the RothC and SOMBIT models, while not in S0 (Figure 3).
An explanation to better understand the increase of SOCS, both observed and predicted in 20 years, might be attributed to the reduced bare soil introducing CAR (S1-72% bare soil days than S0), consequently reducing the SOCS mineralization.
Thus, the S1 scenario represents a possible option for farmers to adopt a more sustainable cropping system able to decrease C losses and to increase C inputs in comparison with the traditional systems.

5. Conclusions

The transition from a fossil-based to a bio-based economy in future decades is of crucial importance. The demand for more sustainable materials from agriculture to replace oil-derived supplies is ever-increasing due to ecological concerns [100]. The CAR, a perennial plant adapted to the Mediterranean low rainfall and hot, dry summer conditions, is a promising nonfood agricultural crop for marginal or set-aside lands suitable to feed a vegetable oil-based biorefinery. Within this research, the effects of the introduction of CAR on SOCS dynamics were assessed by different models, namely the IPCC tool, SOMBIT and RothC, whose outcomes were compared against the experimental farm data on SOCS in order to test the robustness of the provisional estimations. The observed results showed that the RothC and SOMBIT models provide the most accurate previsions. RothC slightly overestimates the SOCS prediction, instead of both other models underestimating it. In quantitative terms, the CAR crop, after 20 years, is able to increase the SOC of about 20.2 Mg/ha (RothC) and 18.6 Mg/ha (SOMBIT) within the first 30 cm of soil. Beyond the benefits associated with the SOM increase of the soil, the SOC dynamics have very relevant implications with the GHG balance. According to previous studies [24,95], the “cradle to farm gate” carbon footprint of CAR cultivation is 1.7–2.1-Mg CO2-equivalent ha−1, whereas the CO2 uptake associated to the SOC increase is about 3.6-Mg CO2-equivalent ha−1, as observed in this study from the RothC and SOMBIT models. It means that, in specific circumstances, the CO2 uptake overcomes GHG emissions, making CAR crop cultivation GHG balance neutral or even negative. The obtained results provide valuable insights and bring new knowledge on how the introduction of a perennial industrial crop in a Mediterranean agricultural system may increase the SOM, which positively influences the soil quality. This may represent a crucial aspect to improving the efficacy of bioeconomy polices aimed at ecosystem service enhancements.

Author Contributions

L.D. conceptualized the paper and acted as a liaison among the authors. F.R. performed the set-up of the farm trials. L.D., C.D.B. and R.F. contributed equally to data analysis and draft preparation. All authors contributed to the manuscript writing. C.D.B. and R.F. contributed to the manuscript reviewing and editing, L.D. figuring out the final version. L.D. performed IPCC tool and SOMBIT model calibrations and simulations. C.D.B. and R.F. performed RothC model calibrations, simulations and analyzed the model’s performance. All authors have read and agreed to the published version of the manuscript.

Funding

This project has received funding from the bio-based industries’ joint undertaking under the European Union’s Horizon 2020 Research and Innovation Programme under grant agreement No. 669029. CREA did not receive any specific grant from funding agencies in the public commercial or not-for-profit sectors.

Acknowledgments

The authors would like to thank Salvatore Antonino Raccuia (CNR) for providing information for above- and belowground residue estimations of cardoon. The authors are grateful to Michele Falce, Mario Stefano and Anna Ciancolini for providing field measurements and supporting the analysis of plant and soil samples. In addition, we wish to thank the colleagues of CREA-AA Sergio Pellegrini, Nadia Vignozzi and Giovanni L’Abate for their help in estimating the bulk density by using the pedotransfer function.

Conflicts of Interest

The authors declare no conflict of interest. The funders had no role in the design of the study; in the collection, analyses or interpretation of data; in the writing of the manuscript or in the decision to publish the results.

References

  1. EC. A Sustainable Bioeconomy for Europe: Strengthening the Connection between Economy, Society and the Environment—Updated Bioeconomy Strategy. 2018. Available online: https://ec.europa.eu/research/bioeconomy/pdf/ec_bioeconomy_strategy_2018.pdf (accessed on 25 May 2020).
  2. Keegan, D.; Kretschmer, B.; Elbersen, B.; Panoutsou, C. Cascading use: A systematic approach to biomass beyond the energy sector. Biofuels Bioprod. Biorefin. 2013, 7, 193–206. [Google Scholar] [CrossRef]
  3. EC. Final Report of the High-Level Panel of the European Decarbonisation Pathways Initiative. 2018. Available online: https://ec.europa.eu/info/publications/final-report-high-level-panel-european-decarbonisation-pathways-initiative_en (accessed on 25 May 2020).
  4. D’Avino, L.; Dainelli, R.; Lazzeri, L.; Spugnoli, P. The role of co-products in biorefinery sustainability: Energy allocation versus substitution method in rapeseed and carinata biodiesel chains. J. Clean. Prod. 2015, 94, 108–115. [Google Scholar] [CrossRef]
  5. Notarnicola, B.; Sala, S.; Anton, A.; McLaren, S.J.; Saouter, E.; Sonesson, U. The role of life cycle assessment in supporting sustainable agri-food systems: A review of the challenges. J. Clean. Prod. 2017, 140, 399–409. [Google Scholar] [CrossRef]
  6. Montanarella, L.; Scholes, R.; Brainich, A. (Eds.) The IPBES Assessment Report on Land Degradation and Restoration; Secretariat of the Intergovernmental Science-Policy Platform on Biodiversity and Ecosystem Services: Bonn, Germany, 2018; p. 744. Available online: https://ipbes.net/sites/default/files/2018_ldr_full_report_book_v4_pages.pdf (accessed on 26 May 2020).
  7. Gomiero, T. Soil degradation, land scarcity and food security: Reviewing a complex challenge. Sustainability 2016, 8, 281. [Google Scholar] [CrossRef] [Green Version]
  8. Scherr, S.J. Soil Degradation: A Threat to Developing Country Food Security by 2020? Vision 2020: Food, Agriculture, and the Environment Discussion Paper 27. 1999, p. 71. Available online: http://cdm15738.contentdm.oclc.org/utils/getfile/collection/p15738coll2/id/125787/filename/125818.pdf (accessed on 26 May 2020).
  9. Ondrasek, G.; Begic, H.B.; Zovko, M.; Filipovic, L.; Merino-Gergichevich, C.; Savic, R.; Rengel, Z. Biogeochemistry of soil organic matter in agroecosystems & environmental implications. Sci. Total Environ. 2019, 658, 1559–1573. [Google Scholar] [CrossRef]
  10. Nelson, P.W.; Sommers, C.E. Total C, organic C and organic matter. In Methods of Soil Analysis, Part 2: Chemical and Microbiological Properties; Page, A.L., Miller, R.H., Keeney, D.R., Eds.; American Society of Agronomy, Inc.: Madison, WI, USA, 1982; pp. 539–579. [Google Scholar]
  11. Paustian, K.; Lehmann, J.; Ogle, S.; Reay, D.; Robertson, G.P.; Smith, P. Climate-smart soils. Nature 2016, 532, 49–57. [Google Scholar] [CrossRef] [Green Version]
  12. Cherlet, M.; Hutchinson, C.; Reynolds, J.; Hill, J.; Sommer, S.; von Maltitz, G. World Atlas of Desertification; Publication Office of the European Union: Luxembourg, 2018; Available online: https://wad.jrc.ec.europa.eu/download (accessed on 27 January 2020).
  13. Turco, R.; Tesser, R.; Cucciolito, M.E.; Fagnano, M.; Ottaiano, L.; Mallardo, S.; Malinconico, M.; Santagata, G.; Di Serio, M. Cynara cardunculus biomass recovery: An eco-sustainable, nonedible resource of vegetable oil for the production of poly (lactic acid) bioplasticizers. ACS Sustain. Chem. Eng. 2019, 7, 4069–4077. [Google Scholar] [CrossRef]
  14. Ronga, D.; Villecco, D.; Zaccardelli, M. Effects of compost and defatted oilseed meals as sustainable organic fertilisers on cardoon (Cynara cardunculus L.) production in the Mediterranean basin. J. Hortic. Sci. Biotech. 2019, 94, 664–675. [Google Scholar] [CrossRef]
  15. Pimentel, D.; Cerasale, D.; Stanley, R.C.; Perlman, R.; Newman, E.M.; Brent, L.C.; Mullan, A.; Chang, A.T.I. Annual vs. perennial grain production. Agric. Ecosyst. Environ. 2012, 161, 1–9. [Google Scholar] [CrossRef]
  16. Ferchaud, F.; Vitte, G.; Mary, B. Changes in soil carbon stocks under perennial and annual bioenergy crops. GCB. Bioenergy 2016, 8, 290–306. [Google Scholar] [CrossRef]
  17. Manzoni, S.; Porporato, A. Soil carbon and nitrogen mineralization: Theory and models across scales. Soil Biol. Biochem. 2009, 41, 1355–1379. [Google Scholar] [CrossRef]
  18. Campbell, E.E.; Paustian, K. Current developments in soil organic matter modelling and the expansion of model applications: A review. Environ. Res. 2015, 10, 123004. [Google Scholar] [CrossRef]
  19. Eggleston, H.S.; Buendia, L.; Miwa, K.; Ngara, T.; Tanabe, K. (Eds.) 2006 IPCC Guidelines for National Greenhouse Gas Inventories, Prepared by the National Greenhouse Gas Inventories Programme; IGES: Hayama, Kanagawa, Japan, 2006. [Google Scholar]
  20. Calvo Buendia, E.; Tanabe, K.; Kranjc, A.; Baasansuren, J.; Fukuda, M.; Ngarize, S.; Osako, A.; Pyrozhenko, Y.; Shermanau, P.; Federici, S. (Eds.) Refinement to the 2006 IPCC Guidelines for National Greenhouse Gas Inventories; IPCC: Genève, Switzerland, 2019. [Google Scholar]
  21. Hénin, S.; Dupuis, M. Essai de bilan de la matière organique du sol. Ann. Agron. 1945, 15, 17–19. [Google Scholar]
  22. Janssen, B.H. A simple method for calculating decomposition and accumulation of ‘young’ soil organic matter. Plant Soil 1984, 76, 297–304. [Google Scholar] [CrossRef]
  23. Shibu, M.E.; Leffelaar, P.A.; Van Keulen, H.; Aggarwal, P.K. Quantitative description of soil organic matter dynamics—A review of approaches with reference to rice-based cropping systems. Geoderma 2006, 137, 1–18. [Google Scholar] [CrossRef]
  24. Razza, F.; D’Avino, L.; L’Abate, G.; Lazzeri, L. The role of compost in bio-waste management and circular economy. In Designing Sustainable Technologies, Products and Policies; Benetto, E., Gericke, K., Guiton, M., Eds.; Springer: Cham, Switzerland, 2018; pp. 133–143. [Google Scholar] [CrossRef] [Green Version]
  25. Coleman, K.; Jenkinson, D.S. RothC-26.3—A model for the turnover of carbon in soil. In Evaluation of Soil Organic Matter Models Using Existing Long-Term Datasets; NATO ASI Series, I; Powlson, D.S., Smith, P., Smith, J.U., Eds.; Springer-Verlag: Heidelberg, Germany, 1996; pp. 237–246. [Google Scholar]
  26. Villarino, S.H.; Studdert, G.A.; Laterra, P.; Cendoya, M.G. Agricultural impact on soil organic carbon content: Testing the IPCC carbon accounting method for evaluations at county scale. Agric. Ecosyst. Environ. 2014, 185, 118–132. [Google Scholar] [CrossRef]
  27. Sperow, M. Estimating carbon sequestration potential on US agricultural topsoils. Soil Tillage Res. 2016, 155, 390–400. [Google Scholar] [CrossRef]
  28. Ogle, S.M.; Domke, G.; Kurz, W.A.; Rocha, M.T.; Huffman, T.; Swan, A.; Smith, J.E.; Woodall, C.; Krug, T. Delineating managed land for reporting national greenhouse gas emissions and removals to the United Nations framework convention on climate change. Carbon Balance Manag. 2018, 13, 9. [Google Scholar] [CrossRef]
  29. FAO. Measuring and Modelling Soil Carbon Stocks and Stock Changes in Livestock Production Systems—A Scoping Analysis for the LEAP Work Stream on Soil Carbon Stock Changes; FAO: Rome, Italy, 2019; p. 84. [Google Scholar]
  30. Andriulo, A.; Mary, B.; Guerif, J. Modelling soil carbon dynamics with various cropping sequences on the rolling pampas. Agronomie 1999, 19, 365–377. [Google Scholar] [CrossRef]
  31. Bayer, C.; Lovato, T.; Dieckow, J.; Zanatta, J.; Mielniczuk, J. A method for estimating coefficients of soil organic matter dynamics based on long-term experiments. Soil Tillage Res. 2006, 91, 217–226. [Google Scholar] [CrossRef]
  32. Bockstaller, C.; Guichard, L.; Makowski, D.; Aveline, A.; Girardin, P.; Plantureux, S. Agri-environmental indicators to assess cropping and farming systems. A review. Agron. Sustain. Dev. 2008, 28, 139–149. [Google Scholar] [CrossRef]
  33. Jenkinson, D.S.; Meredith, J.; Kinyamario, J.I.; Warren, G.P.; Wong, M.T.F.; Harkness, D.D.; Bol, R.; Coleman, K. Estimating net primary production from measurements made on soil organic-matter. Ecology 1999, 80, 2762–2773. [Google Scholar] [CrossRef]
  34. Kaonga, M.L.; Coleman, K. Modelling soil organic carbon turnover in improved fallows in eastern Zambia using the RothC-26.3 model. Ecol. Manag. 2008, 256, 1160–1166. [Google Scholar] [CrossRef]
  35. Ludwig, B.; Hu, K.L.; Niu, L.A.; Liu, X.J. Modelling the dynamics of organic carbon in fertilization and tillage experiments in the North China Plain using the Rothamsted Carbon Model-initialization and calculation of C inputs. Plant Soil 2010, 332, 193–206. [Google Scholar] [CrossRef]
  36. Bertora, C.; Zavattaro, L.; Sacco, D.; Monaco, S.; Grignani, C. Soil organic matter dynamics and losses in manured maize-based forage systems. Eur. J. Agron. 2009, 30, 177–186. [Google Scholar] [CrossRef]
  37. Bechini, L.; Castoldi, N.; Stein, A. Sensitivity to information upscaling of agro-ecological assessments: Application to soil organic carbon management. Agric. Syst. 2011, 104, 480–490. [Google Scholar] [CrossRef]
  38. Di Bene, C.; Tavarini, S.; Mazzoncini, M.; Angelini, L.G. Changes in soil chemical parameters and organic matter balance after 13 years of ramie [Boehmeria nivea (L.) Gaud.] cultivation in the Mediterranean region. Eur. J. Agron. 2011, 35, 154–163. [Google Scholar] [CrossRef]
  39. Marraccini, E.; Debolini, M.; Di Bene, C.; Bonari, E. Factors affecting soil organic matter conservation in Mediterranean hillside winter cereals-legumes cropping sys-tems. Ital. J. Agron. 2012, 3, 283–292. [Google Scholar] [CrossRef] [Green Version]
  40. Farina, R.; Marchetti, A.; Francaviglia, R.; Napoli, R.; Di Bene, C. Modeling regional soil C stocks and CO2 emissions under Mediterranean cropping systems and soil types. Agric. Ecosyst. Environ. 2017, 238, 128–141. [Google Scholar] [CrossRef]
  41. Jebari, A.; Del Prado, A.; Pardo, G.; Martín, J.A.R.; Álvaro-Fuentes, J. Modeling regional effects of climate change on soil organic carbon in Spain. J. Environ. Qual. 2018, 47, 644–653. [Google Scholar] [CrossRef] [Green Version]
  42. CORINE Land Cover. Copernicus Programme, European Environment Agency. Available online: https://land.copernicus.eu/pan-european/corine-land-cover/clc2018 (accessed on 26 May 2020).
  43. Fernando, A.L.; Costa, J.; Barbosa, B.; Monti, A.; Rettenmaier, N. Environmental impact assessment of perennial crops cultivation on marginal soils in the Mediterranean Region. Biomass Bioenergy 2018, 111, 174–186. [Google Scholar] [CrossRef]
  44. ISTAT. Sassari Province Mean of Agricultural Production and Area of Durum Wheat 2012–2018. 2019. Available online: http://dat.istat.it (accessed on 25 March 2020).
  45. ISTAT. Italian Mean of Agricultural Production and Area of Durum Wheat and Field Bean 2013–2019. 2020. Available online: http://dat.istat.it (accessed on 25 March 2020).
  46. Costantini, E.A.C.; Barbetti, R.; Fantappié, M.; L’Abate, G.; Lorenzetti, R.; Magini, S. Pedodiversity. In The Soils of Italy; Costantini, E.A.C., Dazzi, C., Eds.; Springer: Berlin/Heidelberg, Germany, 2013; pp. 105–178. [Google Scholar]
  47. Pellegrini, S.; Vignozzi, N.; Costantini, E.A.C.; L’Abate, G. A new pedotransfer function for estimating soil bulk density. In The Soils of Tomorrow. Soils Changing in a Changing World; Dazzi, C., Ed.; Catena Verlag: Reiskirchen, Germany, 2008; p. 728. [Google Scholar]
  48. Giunta, F.; Motzo, R.; Pruneddu, G. Trends since 1900 in the yield potential of Italian-bred durum wheat cultivars. Eur. J. Agron. 2007, 27, 12–24. [Google Scholar] [CrossRef]
  49. Bolinder, M.A.; Janzen, H.H.; Gregorich, E.G.; Angers, D.A.; van den Bygaart, A.J. An approach for estimating net primary productivity and annual carbon inputs to soil for common agricultural crops in Canada. Agric. Ecosyst. Environ. 2007, 118, 29–42. [Google Scholar] [CrossRef]
  50. Hu, T.; Sørensen, P.; Wahlström, E.M.; Chirinda, N.; Sharif, B.; Li, X.; Olesen, J.E. Root biomass in cereals, catch crops and weeds can be reliably estimated without considering aboveground biomass. Agric. Ecosyst. Environ. 2018, 251, 141–148. [Google Scholar] [CrossRef]
  51. Raccuia, S.A.; Melilli, M.G. Seasonal dynamics of biomass, inulin, and water-soluble sugars in roots of Cynara cardunculus L. Field Crop. Res. 2010, 116, 147–153. [Google Scholar] [CrossRef]
  52. Pausch, J.; Kuzyakov, Y. Carbon input by roots into the soil: Quantification of rhizodeposition from root to ecosystem scale. Glob. Chang. Biol. 2018, 24, 1–12. [Google Scholar] [CrossRef]
  53. Raccuia, S.A.; (CNR-ISAFOM, Catania, Italy). Personal communication, 2016.
  54. BIT3G (3rd Generation Biorefinery Integrated into the Territory). Development of a Biorefinery Integrated into the Local Area 2014–2017. Available online: https://www.novamont.it/bit3g (accessed on 27 May 2020).
  55. Brock, C.; Franko, U.; Oberholzer, H.R.; Kuka, K.; Leithold, G.; Kolbe, H.; Reinhold, J. Humus balancing in Central Europe—Concepts, state of the art, and further challenges. J. Plant Nutr. Soil Sci. 2013, 176, 3–11. [Google Scholar] [CrossRef]
  56. Tremblay, M.E.; Nduwamungu, C.; Parent, L.E.; Bolinder, M.A. Biological stability of carbon and nitrogen in organic products and crop residues using Fourier-transform near-infrared reflectance spectroscopy. Commun. Soil Sci. Plant 2010, 41, 917–934. [Google Scholar] [CrossRef]
  57. Fernández-Tirado, F.; Parra-López, C.; Calatrava-Requena, J. A methodological proposal for Life Cycle Inventory of fertilization in energy crops: The case of Argentinean soybean and Spanish rapeseed. Biomass Bioenergy 2013, 58, 104–116. [Google Scholar] [CrossRef]
  58. Bouajila, K.; Jeddi, F.B.; Jedidi, N.; Rezgui, S.; Sanaa, M. Chemical and biochemical characterization of four crop residues and farmyard manure. Rev. Des. Biol. Ressour. 2016, 6, 13. Available online: https://journals.univ-ouargla.dz/index.php/RBR/article/view/616/423 (accessed on 10 February 2020).
  59. Delphin, J.E. Etat organique du sol selon quelques systèmes de culture en Alsace. In Fertilité et Système de Production; Sebillote, M., Ed.; INRA: Paris, France, 1989; pp. 249–253. [Google Scholar]
  60. Mary, B.; Guérif, J. Intérêts et limites des modèles de prevision de l’évolution des matières organiques et de l’azote dans le sol. Cah. Agric. 1994, 3, 247–257. [Google Scholar]
  61. Saffih-Hdadi, K.; Mary, B. Modeling consequences of straw residues export on soil organic carbon. Soil Biol. Biochem. 2008, 40, 594–607. [Google Scholar] [CrossRef]
  62. D’Avino, L.; L’Abate, G.; Chiarini, F.; Correale, F.; Morari, F. SOC Sequestration in a 4-Year Conventional and Conservative Rotation. 2017. Available online: http://www.fao.org/3/a-bs081e.pdf (accessed on 10 February 2020).
  63. Priori, S.; D’Avino, L.; Agnelli, A.E.; Valboa, G.; Knapič, M.; Schroers, H.J.; Akca, E.; Tangolar, S.; Kiraz, M.E.; Giffard, B.; et al. Effect of organic treatments on soil carbon and nitrogen dynamics in vineyard. Int. J. Environ. Qual. 2018, 31, 1–10. [Google Scholar] [CrossRef]
  64. Falloon, P.; Smith, P. Simulating SOC changes in long-term experiments with RothC and CENTURY: Model evaluation for a regional scale application. Soil Use Manag. 2002, 18, 101–111. [Google Scholar] [CrossRef]
  65. Francaviglia, R.; Coleman, K.; Whitmore, A.P.; Doro, L.; Urracci, G.; Rubino, M.; Ledda, L. Changes in soil organic carbon and climate change—Application of the RothC model in agro-silvo-pastoral Mediterranean systems. Agric. Syst. 2012, 112, 48–54. [Google Scholar] [CrossRef]
  66. Mishra, G.; Jangir, A.; Francaviglia, R. Modeling soil organic carbon dynamics under shifting cultivation and forests using Rothc model. Ecol. Model. 2019, 396, 33–41. [Google Scholar] [CrossRef]
  67. Jones, C.; McConnell, C.; Coleman, K.; Cox, P.; Falloon, P.; Jenkinson, D.; Powlson, D. Global climate change and soil carbon stocks: Predictions from two contrasting models for the turnover of organic carbon in soil. Glob. Chang. Biol. 2005, 11, 154–166. [Google Scholar] [CrossRef]
  68. Farina, R.; Coleman, K.; Whitmore, A.P. Modification of the RothC model for simulations of soil organic C dynamics in dryland regions. Geoderma 2013, 200–201, 18–30. [Google Scholar] [CrossRef]
  69. Heitkamp, F.; Wendland, M.; Offenberger, K.; Gerold, G. Implications of input estimation, residue quality and carbon saturation on the predictive power of the Rothamsted Carbon Model. Geoderma 2012, 170, 168–175. [Google Scholar] [CrossRef]
  70. Farina, R.; Testani, E.; Campanelli, G.; Leteo, F.; Napoli, R.; Canali, S.; Tittarelli, F. Potential carbon sequestration in a Mediterranean organic vegetable cropping system. A model approach for evaluating the effects of compost and Agro-ecological Service Crops (ASCs). Agric. Syst. 2018, 162, 239–248. [Google Scholar] [CrossRef]
  71. Smith, P.; Smith, J.U.; Powlson, D.S.; McGill, W.B.; Arah, J.R.M.; Chertov, O.G.; Coleman, K.; Franko, U.; Frolking, S.; Jenkinson, D.S.; et al. A comparison of the performance of nine soil organic matter models using datasets from seven long-term experiments. Geoderma 1997, 81, 153–225. [Google Scholar] [CrossRef]
  72. Addiscott, T.M.; Whitmore, A.P. Computer simulation of changes in soil mineral nitrogen and crop nitrogen during autumn, winter and spring. J. Agric. Sci. 1987, 109, 141–157. [Google Scholar] [CrossRef]
  73. Cotana, F.; Cavalaglio, G.; Gelosia, M.; Coccia, V.; Petrozzi, A.; Ingles, D.; Pompili, E. A comparison between SHF and SSSF processes from cardoon for ethanol production. Ind. Crop. Prod. 2015, 69, 424–432. [Google Scholar] [CrossRef]
  74. Gominho, J.; Curt, M.D.; Lourenço, A.; Fernández, J.; Pereira, H. Cynara cardunculus L. as a biomass and multi-purpose crop: A review of 30 years of research. Biomass Bioenergy 2018, 109, 257–275. [Google Scholar] [CrossRef]
  75. Raccuia, S.A.; Piscioneri, I.; Sharma, N.; Melilli, M.G. Genetic variability in Cynara cardunculus L. domestic and wild types for grain oil production and fatty acids composition. Biomass Bioenergy 2011, 35, 3167–3173. [Google Scholar] [CrossRef]
  76. Fernández, J.; Curt, M.D.; Aguado, P.L. Industrial applications of Cynara cardunculus L. for energy and other uses. Ind. Crop. Prod. 2006, 24, 222–229. [Google Scholar] [CrossRef]
  77. Cosentino, S.L.; Copani, V.; Mantineo, M.; Patané, C.; D’Agosta, G. Agronomic, energetic and environmental aspects of biomass energy crops suitable for Italian environments. Ital. J. Agron. 2008, 2, 81–95. [Google Scholar] [CrossRef] [Green Version]
  78. Grammelis, P.; Malliopoulou, A.; Basinas, P.; Danalatos, N.G. Cultivation and characterization of Cynara cardunculus for solid biofuels production in the Mediterranean region. Int. J. Mol. Sci. 2008, 9, 1241–1258. [Google Scholar] [CrossRef]
  79. Neri, U.; Pennelli, B.; Simonetti, G.; Francaviglia, R. Biomass partition and productive aptitude of wild and cultivated cardoon genotypes (Cynara cardunculus L.) in a marginal land of Central Italy. Ind. Crop. Prod. 2017, 95, 191–201. [Google Scholar] [CrossRef]
  80. Portis, E.; Barchi, L.; Acquadro, A.; Macua, J.I.; Lanteri, S. Genetic diversity assessment in cultivated cardoon by AFLP (amplified fragment length polymorphism) and microsatellite markers. Plant Breed. 2005, 124, 299–304. [Google Scholar] [CrossRef]
  81. Sonnante, G.; Pignone, D.; Hammer, K. The domestication of artichoke and cardoon: From Roman times to the genomic age. Ann. Bot. 2007, 100, 1095–1100. [Google Scholar] [CrossRef] [PubMed] [Green Version]
  82. Cravero, V.; Martin, E.; Crippa, I.; López Anido, F.; García, S.M.; Cointry, E. Fresh biomass production and partition of aboveground growth in the threebotanical varieties of Cynara cardunculus L. Ind. Crop. Prod. 2012, 37, 253–258. [Google Scholar] [CrossRef]
  83. Pandino, G.; Lombardo, S.; Mauro, R.P.; Mauromicale, G. Variation in polyphenol profile and head morphology am ong clones of globe artichoke selected from a landrace. Sci. Hortic. 2012, 138, 259–265. [Google Scholar] [CrossRef]
  84. Raccuia, S.A.; Melilli, M.G. Biomass and grain oil yields in Cynara cardunculus L. genotypes grown in a Mediterranean environment. Field Crop. Res. 2007, 101, 187–197. [Google Scholar] [CrossRef]
  85. Angelini, L.G.; Ceccarini, L.; Nassi o Di Nasso, N.; Bonari, E. Long-term evaluation of biomass production and quality of two cardoon (Cynara cardunculus L.) cultivars for energy use. Biomass Bioenergy 2009, 33, 810–816. [Google Scholar] [CrossRef]
  86. Piscioneri, I.; Sharma, N.; Baviello, G.; Orlandini, S. Promising industrial energy crop, Cynara cardunculus: A potential source for biomass production and alternative energy. Energy Convers. Manag. 2000, 41, 1091–1105. [Google Scholar] [CrossRef]
  87. Ledda, L.; Deligios, P.A.; Farci, R.; Sulas, L. Biomass supply for energetic purposes from some Cardueae species grown in Mediterranean farming systems. Ind. Crop. Prod. 2013, 47, 218–226. [Google Scholar] [CrossRef]
  88. Francaviglia, R.; Bruno, A.; Falcucci, M.; Farina, R.; Renzi, G.; Russo, D.E.; Sepe, L.; Neri, U. Yields and quality of Cynara cardunculus L. wild and cultivated cardoon genotypes. A case study from a marginal land in Central Italy. Eur. J. Agron. 2016, 72, 10–19. [Google Scholar] [CrossRef]
  89. Gominho, J.; Lourenço, A.; Curt, M.D.; Fernández, J.; Pereira, H. Cynara cardunculus in large scale cultivation: A case study in Portugal. Chem. Eng. Trans. 2014, 37, 529–534. [Google Scholar] [CrossRef]
  90. Vasilakoglou, I.; Dhima, K. Potential of two cardoon varieties to produce biomass and oil under reduced irrigation and weed control inputs. Biomass Bioenergy 2014, 63, 177–186. [Google Scholar] [CrossRef]
  91. Cioffi, A. Rilievo Indici di Relazione tra Produzioni Agricole e Biomassa Residuale Associata, Analisi del Mercato della Biomassa Residuale nelle Province delle Regioni: Molise, Campania, Puglia, Basilicata, Calabria, Sicilia, Sardegna. ENEA Report RSE/2009/50. 2009, p. 74. Available online: http://aida.casaccia.enea.it/aida/file/RSE50.pdf (accessed on 10 February 2020).
  92. Boiffin, J.; Keli Zagbahi, J.; Sebillotte, M. Systèmes de culture et statut organique des sols dans le Noyonnais: Application du modèle de Hénin–Dupuis. Agronomie 1986, 6, 437–446. [Google Scholar] [CrossRef] [Green Version]
  93. Kätterer, T.; Bolinder, M.A.; Andrén, O.; Kirchmann, H.; Menichetti, L. Roots contribute more to refractory soil organic matter than above-ground crop residues, as revealed by a long-term field experiment. Agric. Ecosyst. Environ. 2011, 141, 184–192. [Google Scholar] [CrossRef] [Green Version]
  94. Mazzoncini, M.; Antichi, D.; Di Bene, C.; Risaliti, R.; Petri, M.; Bonari, E. Soil carbon and nitrogen changes after 28 years of no-tillage management under Mediterranean conditions. Eur. J. Agron. 2016, 77, 156–165. [Google Scholar] [CrossRef]
  95. Cocco, D.; Deligios, P.A.; Ledda, L.; Sulas, L.; Virdis, A.; Carboni, G. LCA study of oleaginous bioenergy chains in a Mediterranean environment. Energies 2014, 7, 6258–6281. [Google Scholar] [CrossRef]
  96. EU (European Union). Directive (EU) 2018/2001 of the European Parliament and of the Council of 11 December 2018 on the Promotion of the Use of Energy from Renewable Sources. 2018. Available online: https://eur-lex.europa.eu/legal-content/EN/TXT/PDF/?uri=CELEX:32018L2001&from=EN (accessed on 27 January 2020).
  97. Priori, S.; Barbetti, R.; Meini, L.; Morelli, A.; Zampolli, A.; D’Avino, L. Towards economic land evaluation at the farm scale based on soil physical-hydrological features and ecosystem services. Water 2019, 11, 1527. [Google Scholar] [CrossRef] [Green Version]
  98. Minasny, B.; Malone, B.P.; McBratney, A.B.; Angers, D.A.; Arrouays, D.; Chambers, A.; Chaplot, V.; Chen, Z.S.; Cheng, K.; Das, B.S.; et al. Soil carbon 4 per mille. Geoderma 2017, 292, 59–86. [Google Scholar] [CrossRef]
  99. Baveye, P.C.; Berthelin, J.; Tessier, D.; Lemaire, G. The “4 per 1000” initiative: A credibility issue for the soil science community? Geoderma 2019, 309, 118–123. [Google Scholar] [CrossRef]
  100. Chinthapalli, R.; Skoczinski, P.; Carus, M.; Baltus, W.; de Guzman, D.; Käb, H.; Raschka, A.; Ravenstijn, J. Biobased building blocks and polymers—Global capacities, production and trends, 2018–2023. Ind. Biotechnol. 2019, 15, 237–241. [Google Scholar] [CrossRef]
Figure 1. Dates of sowing, harvest and soil sampling during cardoon cultivation between 2011 and 2019 in the three farm trials.
Agronomy 10 00946 g001
Figure 2. Comparison between the observed and predicted values in the calibration period. Error bars show the standard errors among modeled values estimated in the three farm trials. RothC: Rothamsted carbon model and IPCC: Intergovernmental Panel on Climate Change guidelines.
Agronomy 10 00946 g002
Figure 3. Model 20-year predictions for the scenario including cardoon (S1) or not (S0). Error bars show the standard errors among modeled values estimated in the three farm trials.
Agronomy 10 00946 g003
Table 1. Thirty-year long-term monthly climate data (1989–2018) in Porto Torres Municipality (Sassari, Sardinia, Italy).
MonthsTemperature (°C)Rainfall (mm)Evapotranspiration (mm)
January10.152.133.8
February10.069.441.8
March11.741.068.2
April14.147.889.5
May17.938.9128.7
June21.916.9147.5
July24.64.8197.7
August25.011.6163.1
September21.845.3109.0
October18.768.071.9
November14.3100.743.6
December11.371.334.3
Annual mean16.8568.01129.0
Table 2. Formulas used to calculate plant residues (Mg ha−1) for faba bean (FB), durum wheat (DW) and cardoon (CAR) crops.
Residues *FB and DW CropsCAR Crop
Rag Y S 0.336 × Y s 0.7  
Rbg 0.3 × ( Y G + Y S ) + E × ( Y G + Y S ) Y R 1 :            [ E × Y s 0.7 ]
Y R 2 6 :    [ Y s 0.7 × 0.594 ] + [ E × Y s 0.7 ]
Y R 7 :            [ Y s 0.7 × 1.245 ] + [ E × Y s 0.7 ]
Rw 0.07 × ( Y G + Y S ) Y R 1   o n l y :   0.06 × Y s 0.7
* Calculated as the sum of the aboveground residues (Rag), belowground residues (Rbg) and residues from weeds (Rw), where YG is the grain yield and YS is the straw yield (Mg ha−1 of dry matter); HI is the harvest index (Mg Mg−1); E is the ratio between the exudates and roots: 0.11 in FB, 0.09 in DW and 0.15 in CAR; YR referred to the CAR year: YR1: year of the first harvest, YR2–6: from second to sixth harvest and YR7: the explant year.
Table 3. Mean physicochemical properties of the topsoil (0–30 cm) in the three farms located in the Porto Torres Municipality (Sardinia, Italy). SOC: soil organic carbon.
FarmsClay (%)Silt (%)Coarse Fragment (%)Bulk Density (kg m−3)Total Carbonate (%)Initial SOC (%)
152.316.113.31.268.51.46
248.820.58.11.2712.61.42
347.721.916.91.241.01.69
Table 4. Dry matter of above- and belowground estimated biomass residues and carbon (C) input values (Mg ha−1) for perennial cardoon (CAR), faba bean (FB) and durum wheat (DW) crops.
Crop aCase StudyTotal Biomass bResidues c
Above GroundBelow Ground RagRwRbgTotal R dC Inputs e
CAR (YR1)18.011.202.690.491.204.381.96
210.051.513.380.601.515.492.45
311.541.733.880.691.736.302.81
CAR (YR2–6)113.6210.144.58-10.1414.717.90
213.037.744.38-9.7014.086.64
311.086.583.72-8.2411.975.64
CAR (Y7)112.8716.024.32-17.9622.2810.62
213.3616.634.49-18.6323.1211.04
310.9313.613.67-15.2518.929.02
FB-3.801.552.800.281.554.622.08
DW-6.102.383.660.37 2.386.412.88
a Year refers to the year of the CAR cultivation. YR1: first growth year, YR2–6: second growth period from the second to the sixth years, in which the grain and biomass yields are estimated as the mean of five years of production, and YR7: third period referring to the explant year. b Total estimated biomass observed at the harvest time as the dry matter, including the grain and straws. Belowground was estimated from the aboveground biomass; see text for details. c Residues refers to the biomass left in the field throughout the cultivation period, including basal leaves, threshing residues, roots at the explant and decomposed fraction of roots and root exudates following Table 2 formulas. d Total R is the sum of Rag + Rw + Rbg, and it was used as inputs to run the SOMBIT model. e C inputs are obtained by multiplying plant inputs by roots or stems’ C contents, and they were used as inputs to run the RothC model.
Table 5. Statistical performances of the three models under perennial cardoon (CAR) cultivation. RothC: Rothamsted carbon model. RMSE: root mean square error and RE: relative error.
IPCC ToolSOMBITRothC
RMSE14.710.57.1
RE (%)15.14.65.3
Table 6. Predicted SOC stock change, total carbon input (I) and sequestration rate (SR) in 20 years (Mg ha−1), including cardoon (S1) or not (S0).
SOMBITRothC
S0S1S0S1
SOCfinal–SOCinitial−5.3318.10−1.2020.20
I49.39111.5949.39111.59
SR−0.110.16−0.020.18

