Impact of Cover Crops and Poultry Litter on Selected Soil Properties and Yield in Dryland Soybean Production


Abstract
:1. Introduction
2. Materials and Methods
2.1. Study Site
2.2. Experimental Design
2.3. Field Methods
2.4. Soil Sampling and Preparation
2.5. Soil Analyses
2.6. Statistical Analysis
3. Results
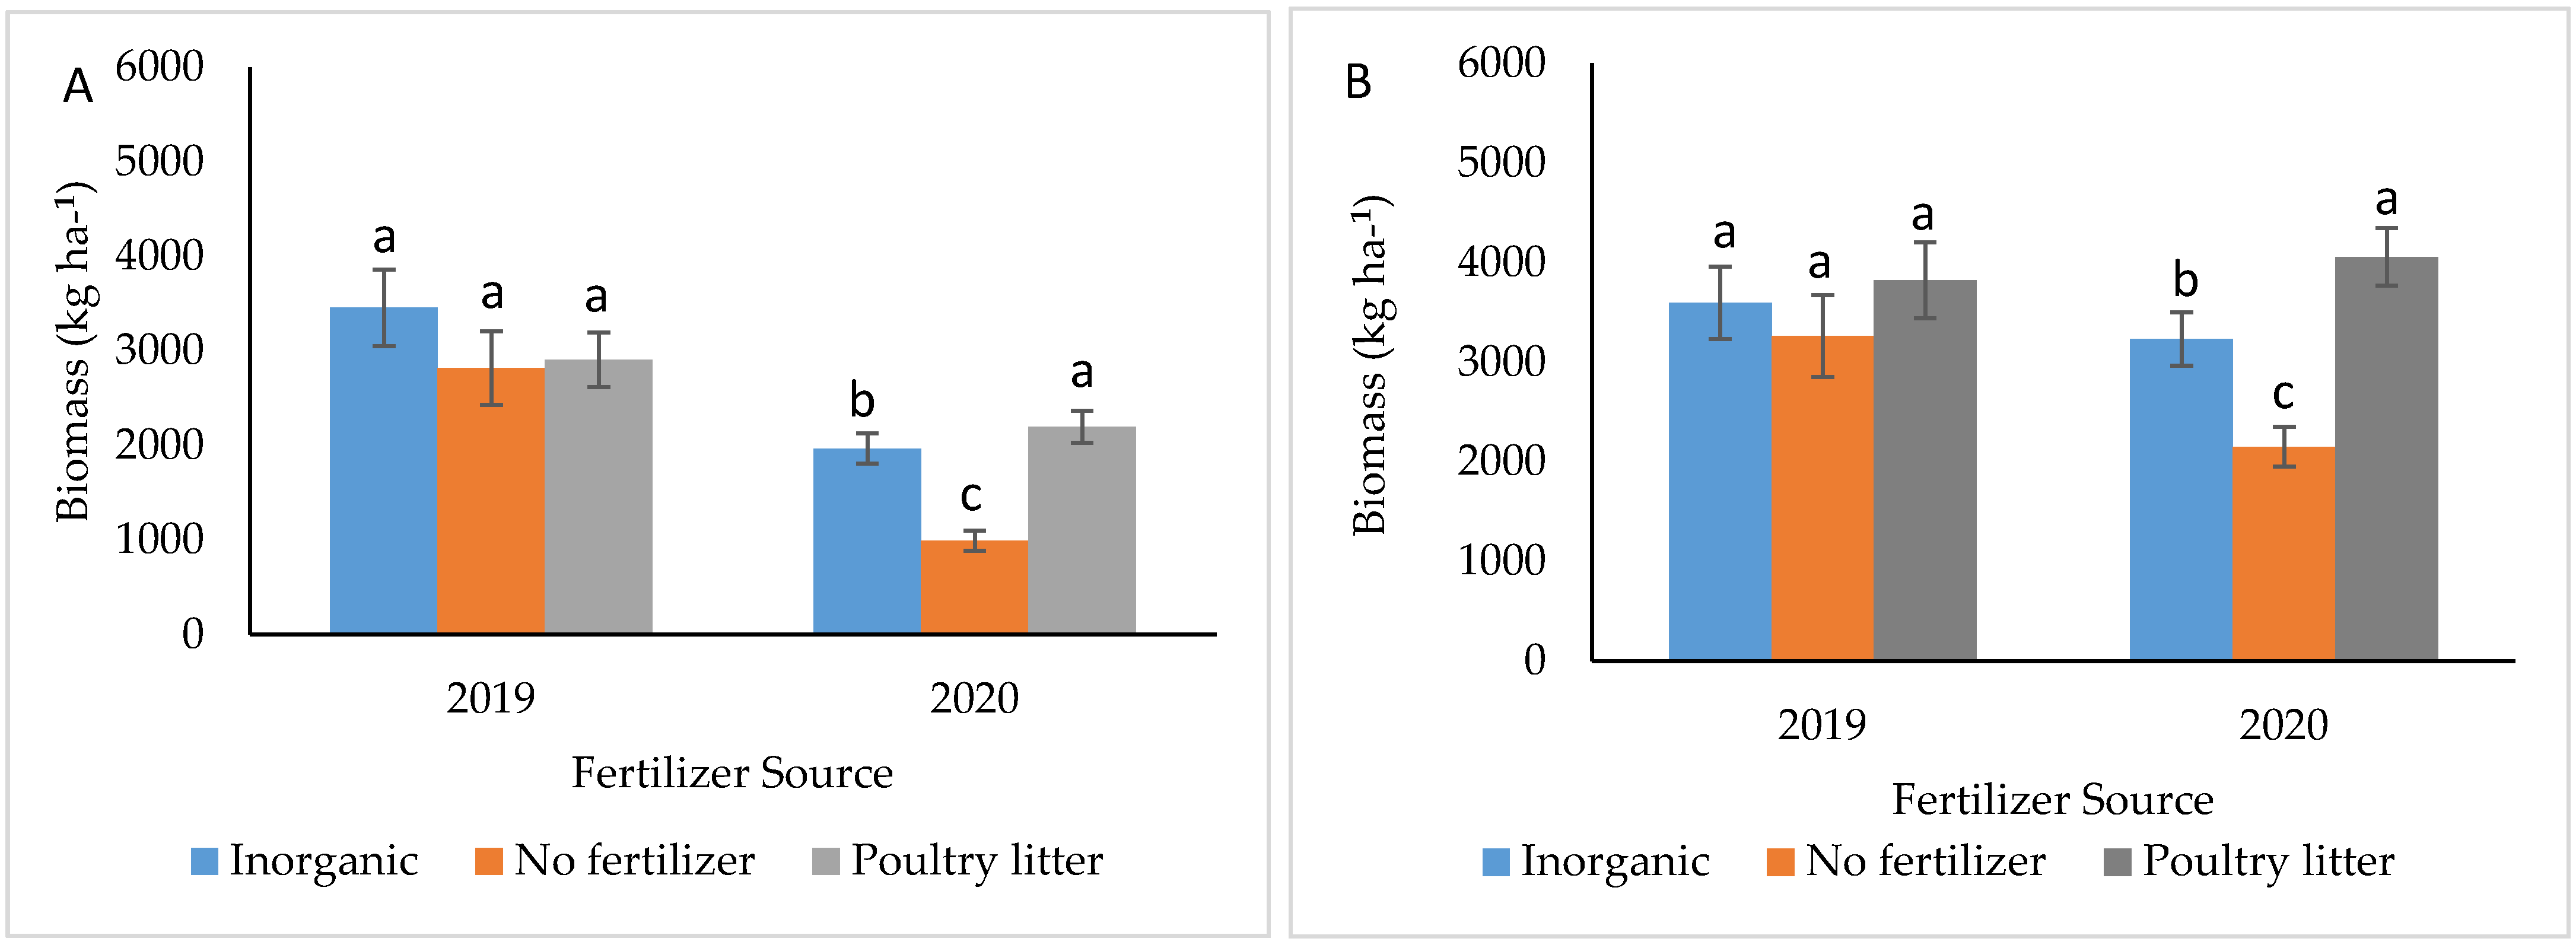
3.1. Cover Crop Production
3.2. Total Carbon and Total Nitrogen
3.3. Permanganate Oxidizable Carbon
3.4. Easily Extractable Glomalin-Related Soil Protein
3.5. Water Stable Aggregate
3.6. Soil pH
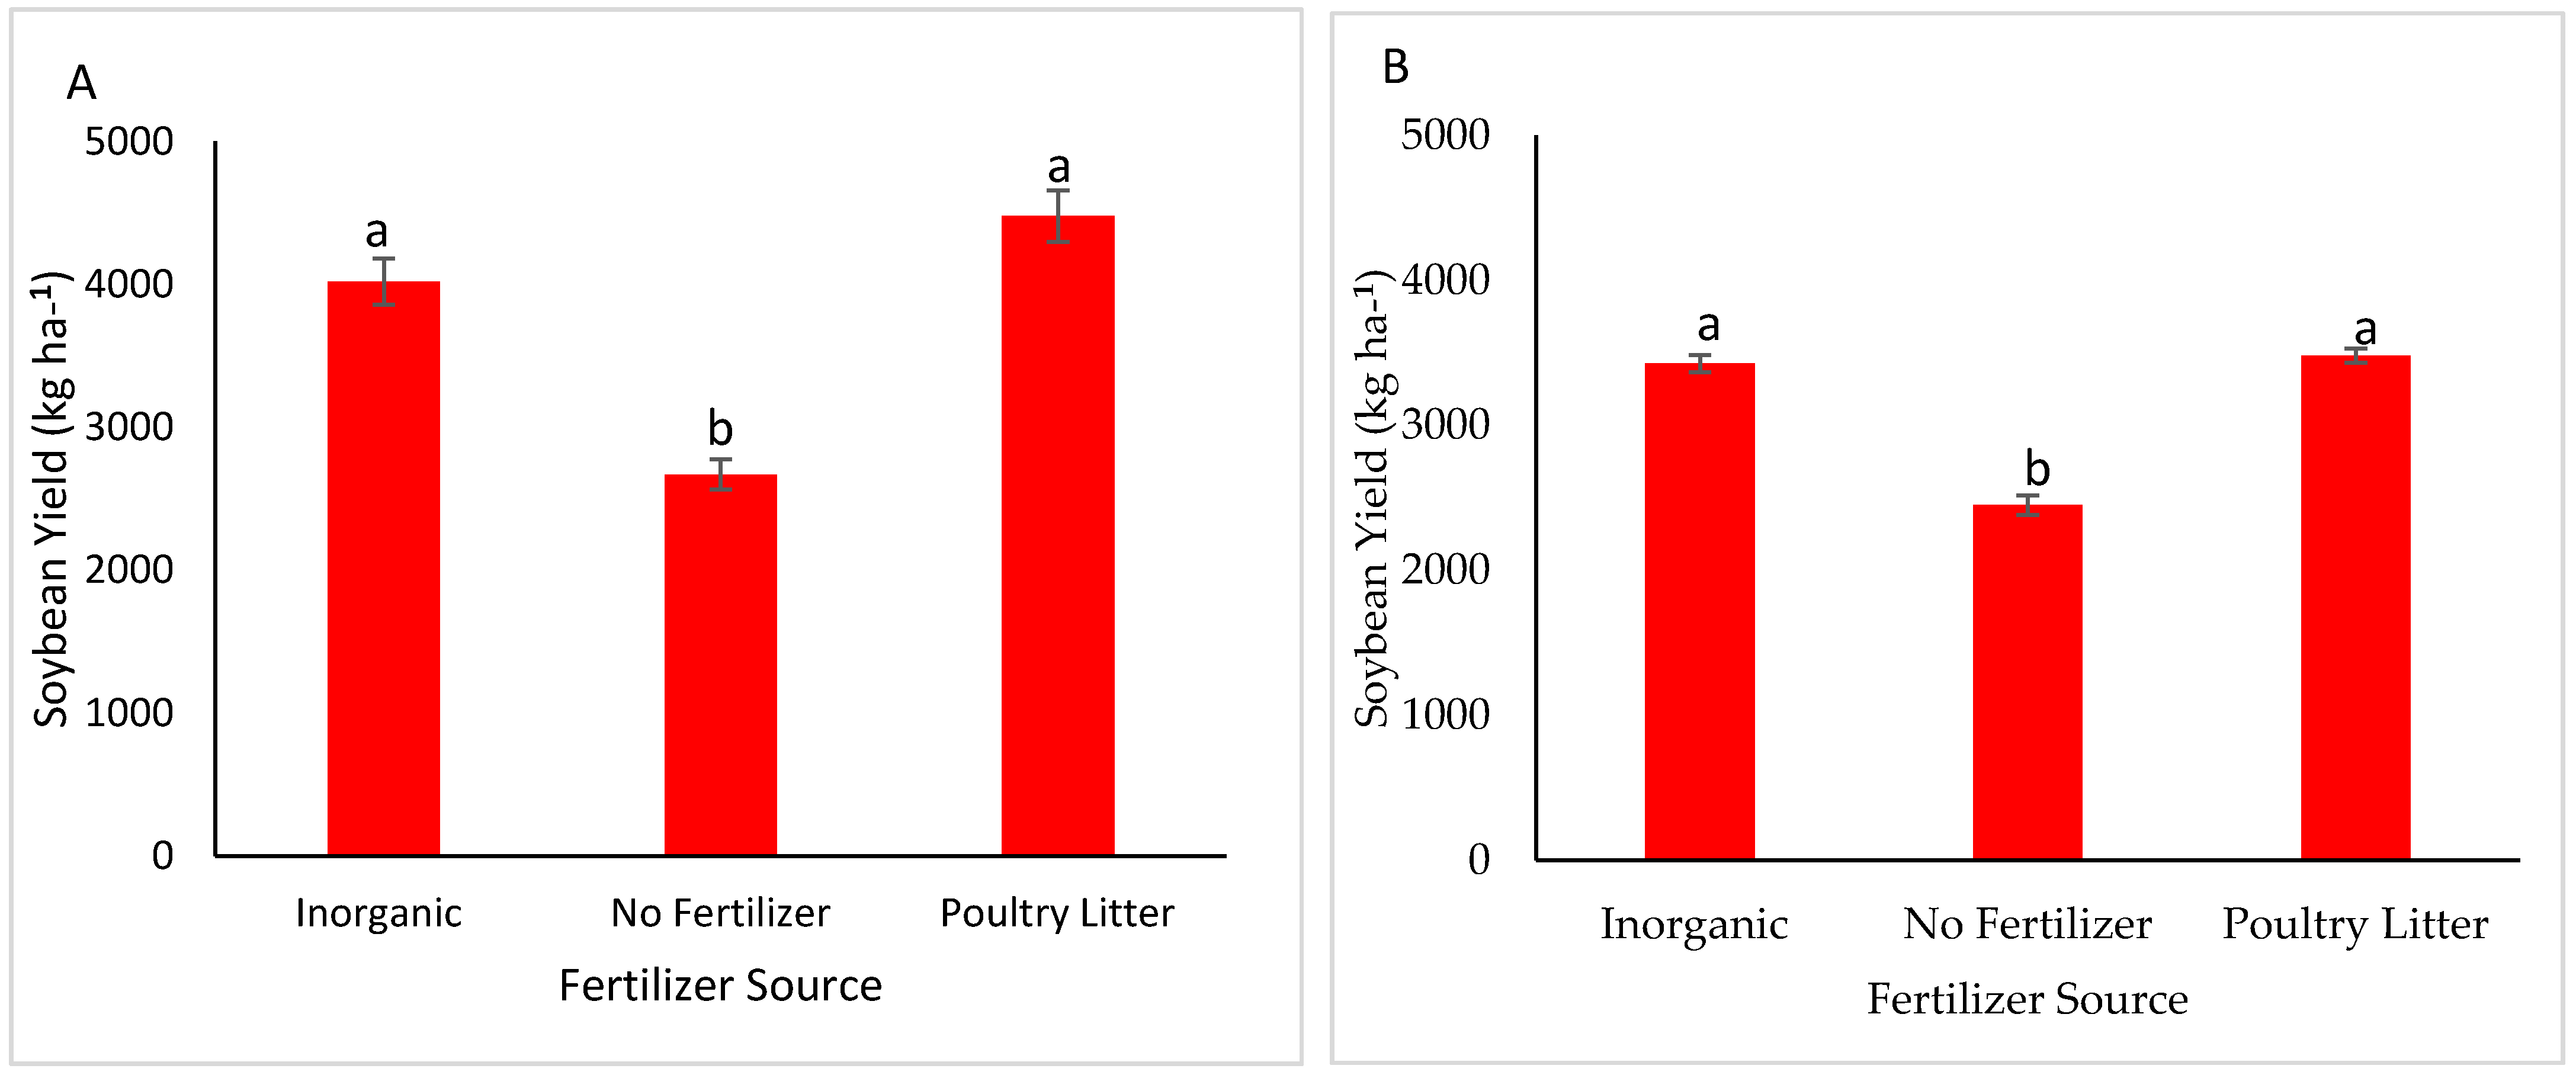
3.7. Soybean Yield
4. Discussion
4.1. Cover Crop Production
4.2. Total Carbon and Nitrogen
4.3. Permanganate Oxidizable Carbon
4.4. Easily Extractable Glomalin-Like Soil Protein
4.5. Water Stable Aggregate
4.6. Soil pH
4.7. Soybean Yield
5. Conclusions
Author Contributions
Funding
Institutional Review Board Statement
Informed Consent Statement
Data Availability Statement
Acknowledgments
Conflicts of Interest
References
- Pejić, B.; Maksimović, L.; Cimpeanu, S.; Bucur, D.; Milić, S.; Ćupina, B. Response of soybean to water stress at specific growth stages. J. Food Agric. Environ. 2011, 9, 280–284. [Google Scholar]
- Orlowski, J. Maximization of Yield and Economic Returns for Non-Irrigated Soybean Production in Mississippi. Available online: https://www.mssoy.org/uploads/files/2016-project-synopses.pdf (accessed on 24 January 2020).
- Holzman, M.E.; Rivas, R.; Piccolo, M.C. Estimating soil moisture and the relationship with crop yield using surface temperature and vegetation index. Int. J. Appl. Earth Obs. Geoinf. 2014, 28, 181–192. [Google Scholar] [CrossRef]
- Hill, C.C.; Robinson, L.A. Potentiometric Map of the Ripley Aquifers in Northeastern Mississippi; Branch, C.T., Ed.; Mississippi Department of Environmental Quality Office of Land and Water Resources: Jackson, MS, USA, 1994.
- Kühling, I.; Redozubov, D.; Broll, G.; Trautz, D. Impact of tillage, seeding rate and seeding depth on soil moisture and dryland spring wheat yield in Western Siberia. Soil Tillage Res. 2017, 170, 43–52. [Google Scholar] [CrossRef]
- Lampurlanés, J.; Plaza-Bonilla, D.; Álvaro-Fuentes, J.; Cantero-Martínez, C. Long-term analysis of soil water conservation and crop yield under different tillage systems in Mediterranean rainfed conditions. Field Crop. Res. 2016, 189, 59–67. [Google Scholar] [CrossRef] [Green Version]
- Blanco-Canqui, H.; Holman, J.D.; Schlegel, A.J.; Tatarko, J.; Shaver, T.M. Replacing fallow with cover crops in a semiarid soil: Effects on soil properties. Soil Sci. Soc. Am. J. 2013, 77, 1026–1034. [Google Scholar] [CrossRef] [Green Version]
- Nivelle, E.; Verzeaux, J.; Habbib, H.; Kuzyakov, Y.; Decocq, G.; Roger, D.; Lacoux, J.; Duclercq, J.; Spicher, F.; Nava-Saucedo, J.E.; et al. Functional response of soil microbial communities to tillage, cover crops and nitrogen fertilization. Appl. Soil Ecol. 2016, 108, 147–155. [Google Scholar] [CrossRef]
- Blanco-Canqui, H.; Mikha, M.M.; Presley, D.R.; Claassen, M.M. Addition of Cover Crops Enhances No-Till Potential for Improving Soil Physical Properties. Soil Sci. Soc. Am. J. 2011, 75, 1471–1482. [Google Scholar] [CrossRef]
- Frasier, I.; Quiroga, A.; Noellemeyer, E. Effect of different cover crops on C and N cycling in sorghum NT systems. Sci. Total Environ. 2016, 562, 628–639. [Google Scholar] [CrossRef]
- Villamil, M.B.; Bollero, G.A.; Darmody, R.G.; Simmons, F.W.; Bullock, D.G. No-Till Corn/Soybean Systems Including Winter Cover Crops. Soil Sci. Soc. Am. J. 2006, 70, 1936–1944. [Google Scholar] [CrossRef]
- Sievers, T.; Cook, R.L. Aboveground and root decomposition of cereal rye and hairy vetch cover crops. Soil Sci. Soc. Am. J. 2018, 82, 147–155. [Google Scholar] [CrossRef]
- Hontoria, C.; García-González, I.; Quemada, M.; Roldán, A.; Alguacil, M.M. The cover crop determines the AMF community composition in soil and in roots of maize after a ten-year continuous crop rotation. Sci. Total Environ. 2019, 660, 913–922. [Google Scholar] [CrossRef] [PubMed]
- Martínez-García, L.B.; Korthals, G.; Brussaard, L.; Jørgensen, H.B.; De Deyn, G.B. Organic management and cover crop species steer soil microbial community structure and functionality along with soil organic matter properties. Agric. Ecosyst. Environ. 2018, 263, 7–17. [Google Scholar] [CrossRef]
- Nair, A.; Ngouajio, M. Soil microbial biomass, functional microbial diversity, and nematode community structure as affected by cover crops and compost in an organic vegetable production system. Appl. Soil Ecol. 2012, 58, 45–55. [Google Scholar] [CrossRef]
- Mbuthia, L.W.; Acosta-Martínez, V.; DeBryun, J.; Schaeffer, S.; Tyler, D.; Odoi, E.; Mpheshea, M.; Walker, F.; Eash, N. Long term tillage, cover crop, and fertilization effects on microbial community structure, activity: Implications for soil quality. Soil Biol. Biochem. 2015, 89, 24–34. [Google Scholar] [CrossRef]
- Bryant, L. AgFax: Cover Crop Planting Increased by 5 Million Acres. Available online: https://agfax.com/2019/04/16/cover-crops-good-news-from-the-census-of-agriculture/ (accessed on 21 January 2020).
- Doran, J.W.; Zeiss, M.R. Soil health and sustainability: Managing the biotic component of soil quality. Appl. Soil Ecol. 2000, 15, 3–11. [Google Scholar] [CrossRef] [Green Version]
- Wagger, M.G. Time of desiccation effects on plant composition and subsequent nitrogen release from several winter annual cover crops. Agron. J. 1989, 81, 236–241. [Google Scholar] [CrossRef]
- Dabney, S.M.; Delgado, J.A.; Reeves, D.W. Using winter cover crops to improve soil and water quality. Commun. Soil Sci. Plant Anal. 2001, 32, 1221–1250. [Google Scholar] [CrossRef]
- Lawson, A.; Cogger, C.; Bary, A.; Fortuna, A.M. Influence of seeding ratio, planting date, and termination date on rye-hairy vetch cover crop mixture performance under organic management. PLoS ONE 2015, 10, e0129597. [Google Scholar] [CrossRef]
- Haynes, R.J. Labile organic matter as an indicator of organic matter quality in arable and pastoral soils in New Zealand. Soil Biol. Biochem. 2000, 32, 211–219. [Google Scholar] [CrossRef]
- Nascente, A.S.; Li, Y.C.; Crusciol, C.A.C. Cover crops and no-till effects on physical fractions of soil organic matter. Soil Tillage Res. 2013, 130, 52–57. [Google Scholar] [CrossRef]
- Grassini, P.; Torrion, J.A.; Yang, H.S.; Rees, J.; Andersen, D.; Cassman, K.G.; Specht, J.E. Soybean yield gaps and water productivity in the western U.S. Corn Belt. Field Crop. Res. 2015, 179, 150–163. [Google Scholar] [CrossRef]
- Ren, T.; Wang, J.; Chen, Q.; Zhang, F.; Lu, S. The effects of manure and nitrogen fertilizer applications on soil organic carbon and nitrogen in a high-input cropping system. PLoS ONE 2014, 9, e97732. [Google Scholar] [CrossRef] [PubMed]
- Geisseler, D.; Scow, K.M. Long-term effects of mineral fertilizers on soil microorganisms—A review. Soil Biol. Biochem. 2014, 75, 54–63. [Google Scholar] [CrossRef]
- Kingery, W.L.; Wood, C.W.; Williams, J.C. Tillage and amendment effects on soil carbon and nitrogen mineralization and phosphorus release. Soil Tillage Res. 1996, 37, 239–250. [Google Scholar] [CrossRef]
- Shakya, A.; Agarwal, T. Poultry litter biochar: An approach towards poultry litter management—A review. Int. J. Curr. Microbiol. Appl. Sci. 2017, 6, 2657–2668. [Google Scholar] [CrossRef]
- Ashworth, A.J.; DeBruyn, J.M.; Allen, F.L.; Radosevich, M.; Owens, P.R. Microbial community structure is affected by cropping sequences and poultry litter under long-term no-tillage. Soil Biol. Biochem. 2017, 114, 210–219. [Google Scholar] [CrossRef]
- Adeli, A.; Sistani, K.R.; Rowe, D.E.; Tewolde, H. Effects of broiler litter on soybean production and soil nitrogen and phosphorus concentrations. Agron. J. 2005, 97, 314–321. [Google Scholar] [CrossRef] [Green Version]
- Lin, Y.; van Santen, E.; Watts, D. The effect of poultry litter application on agricultural production: A meta-analysis of crop yield, nutrient uptake and soil fertility. In Proceedings of the Conference on Applied Statistics in Agriculture; New Prairie Press: Gainesville, FL, USA, 2016. [Google Scholar]
- Riegel, C.; Noe, J.P. Chicken litter soil amendment effects on soilborne microbes and Meloidogyne incognita on cotton. Plant Dis. 2000, 84, 1275–1281. [Google Scholar] [CrossRef] [Green Version]
- Mierzwa-Hersztek, M.; Klimkowicz-Pawlas, A.; Gondek, K. Influence of Poultry Litter and Poultry Litter Biochar on Soil Microbial Respiration and Nitrifying Bacteria Activity. Waste Biomass Valoriz. 2018, 9, 379–389. [Google Scholar] [CrossRef] [Green Version]
- Gaspar, A.P.; Laboski, C.A.M.; Naeve, S.L.; Conley, S.P. Phosphorus and potassium uptake, partitioning, and removal across a wide range of soybean seed yield levels. Crop Sci. 2017, 57, 2193–2204. [Google Scholar] [CrossRef] [Green Version]
- Salvagiotti, F.; Cassman, K.G.; Specht, J.E.; Walters, D.T.; Weiss, A.; Dobermann, A. Nitrogen uptake, fixation and response to fertilizer N in soybeans: A review. Field Crop. Res. 2008, 108, 1–13. [Google Scholar] [CrossRef] [Green Version]
- Fine, A.K.; Van Es, H.M.; Schindelbeck, R.R. Statistics, scoring functions, and regional analysis of a comprehensive soil health database. Soil Sci. Soc. Am. J. 2017, 81, 589–601. [Google Scholar] [CrossRef]
- Culman, S.W.; Snapp, S.S.; Freeman, M.A.; Schipanski, M.E.; Beniston, J.; Lal, R.; Drinkwater, L.E.; Franzluebbers, A.J.; Glover, J.D.; Stuart Grandy, A.; et al. Permanganate oxidizable carbon reflects a processed soil fraction that is sensitive to management. Soil Sci. Soc. Am. J. 2012, 76, 494–504. [Google Scholar] [CrossRef] [Green Version]
- Mitchell, J.P.; Shrestha, A.; Mathesius, K.; Scow, K.M.; Southard, R.J.; Haney, R.L.; Schmidt, R.; Munk, D.S.; Horwath, W.R. Cover cropping and no-tillage improve soil health in an arid irrigated cropping system in California’s San Joaquin Valley, USA. Soil Tillage Res. 2017, 165, 325–335. [Google Scholar] [CrossRef] [Green Version]
- Weil, R.R.; Islam, K.R.; Stine, M.A.; Gruver, J.B.; Samson-Liebig, S.E. Estimating active carbon for soil quality assessment: A simplified method for laboratory and field use. Am. J. Altern. Agric. 2003, 18, 3–17. [Google Scholar] [CrossRef]
- Lovelock, C.E.; Wright, S.F.; Clark, D.A.; Ruess, R.W. Soil stocks of glomalin produced by arbuscular mycorrhizal fungi across a tropical rain forest landscape. J. Ecol. 2004, 92, 278–287. [Google Scholar] [CrossRef]
- Janos, D.P.; Garamszegi, S.; Beltran, B. Glomalin extraction and measurement. Soil Biol. Biochem. 2008, 40, 728–739. [Google Scholar] [CrossRef]
- Wright, S.F.; Upadhyaya, A. A survey of soils for aggregate stability and glomalin, a glycoprotein produced by hyphae of arbuscular mycorrhizal fungi. Plant Soil 1998, 198, 97–107. [Google Scholar] [CrossRef]
- Rilling, M.C.; Wright, S.F.; REvine, V.T. The role of arbuscular mycorrhizal fungi and glomalin in soil aggregation: Comparing effects of five plant species. Plant Soil 2002, 238, 325–333. [Google Scholar] [CrossRef]
- Wang, S.; Wu, Q.S.; He, X.H. Exogenous easily extractable glomalin-related soil protein promotes soil aggregation, relevant soil enzyme activities and plant growth in trifoliate orange. Plant Soil Environ. 2015, 61, 66–71. [Google Scholar] [CrossRef] [Green Version]
- Gao, W.Q.; Wang, P.; Wu, Q.S. Functions and application of glomalin-related soil proteins: A review. Sains Malays. 2019, 48, 111–119. [Google Scholar] [CrossRef]
- Liu, H.; Wang, X.; Liang, C.; Ai, Z.; Wu, Y.; Xu, H.; Xue, S.; Liu, G. Glomalin-related soil protein affects soil aggregation and recovery of soil nutrient following natural revegetation on the Loess Plateau. Geoderma 2020, 357, 113921. [Google Scholar] [CrossRef]
- Chi, G.G.; Srivastava, A.K.; Wu, Q.S. Exogenous easily extractable glomalin-related soil protein improves drought tolerance of trifoliate orange. Arch. Agron. Soil Sci. 2018, 64, 1341–1350. [Google Scholar] [CrossRef]
- Ngosong, C.; Jarosch, M.; Raupp, J.; Neumann, E.; Ruess, L. The impact of farming practice on soil microorganisms and arbuscular mycorrhizal fungi: Crop type versus long-term mineral and organic fertilization. Appl. Soil Ecol. 2010, 46, 134–142. [Google Scholar] [CrossRef]
- Schindler, F.V.; Mercer, E.J.; Rice, J.A. Chemical characteristics of glomalin-related soil protein (GRSP) extracted from soils of varying organic matter content. Soil Biol. Biochem. 2007, 39, 320–329. [Google Scholar] [CrossRef]
- García-González, I.; Quemada, M.; Gabriel, J.L.; Hontoria, C. Arbuscular mycorrhizal fungal activity responses to winter cover crops in a sunflower and maize cropping system. Appl. Soil Ecol. 2016, 102, 10–18. [Google Scholar] [CrossRef]
- Zhang, X.; Wu, X.; Zhang, S.; Xing, Y.; Wang, R.; Liang, W. Organic amendment effects on aggregate-associated organic C, microbial biomass C and glomalin in agricultural soils. Catena 2014, 123, 188–194. [Google Scholar] [CrossRef]
- Liu, A.; Ma, B.L.; Bomke, A.A. Effects of cover crops on soil aggregate stability, total organic carbon, and polysaccharides. Soil Sci. Soc. Am. J. 2005, 69, 2041–2048. [Google Scholar] [CrossRef]
- Blanco-Canqui, H.; Shaver, T.M.; Lindquist, J.L.; Shapiro, C.A.; Elmore, R.W.; Francis, C.A.; Hergert, G.W. Cover crops and ecosystem services: Insights from studies in temperate soils. Agron. J. 2015, 107, 2449–2474. [Google Scholar] [CrossRef] [Green Version]
- Carver, R.E.; Nelson, N.O.; Abel, D.S.; Roozeboom, K.; Kluitenberg, G.J.; Tomlinson, P.J.; Williams, J.R. Impact of cover crops and phosphorus fertilizer management on nutrient cycling in no-tillage corn-soybean rotation. Kans. Agric. Exp. Stn. Res. Rep. 2017, 3. [Google Scholar] [CrossRef] [Green Version]
- Hoorman, J.J.; Islam, R.; Sundermei-er, A.; Ran-dall, R. Using cover crops to convert to no-till. Crop Soil 2009, 42, 9–13. [Google Scholar]
- De Cima, D.S.; Tein, B.; Eremeev, V.; Luik, A.; Kauer, K.; Reintam, E.; Kahu, G. Winter cover crop effects on soil structural stability and microbiological activity in organic farming. Biol. Agric. Hortic. 2016, 32, 170–181. [Google Scholar] [CrossRef]
- Ropper, W.R. Evaluating Soil Health in North Carolina; North Carolina State University: Raleigh, NC, USA, 2018. [Google Scholar]
- National Oceanic and Atmospheric Administration (NOAA) National Climatic Data Center (NCDC). Available online: https://www.ncdc.noaa.gov/IPS/coop/coop.html?_page=2&state=MS&foreign=false&stationID=227111&_target3=Next+%3E (accessed on 23 March 2020).
- Dhillon, J.; Del Corso, M.R.; Figueiredo, B.; Nambi, E.; Raun, W. Soil organic carbon, total nitrogen, and soil pH, in a long-term continuous winter wheat (Triticum aestivum L.) experiment. Commun. Soil Sci. Plant Anal. 2018, 49, 803–813. [Google Scholar] [CrossRef]
- Nelson, D.W.; Sommers, L. Total carbon, organic carbon, and organic matter. In Methods of Soil Analysis, Part 3, Chemical Methods; Sparks, D.L., Page, A.L., Helmke, P.A., Loeppert, R.H., Nelson, D.W., Sommers, L.E., Eds.; John Wiley & Sons: Hoboken, NJ, USA, 1996; pp. 1004–1005. [Google Scholar]
- Reyna, D.L.; Wall, L.G. Revision of two colorimetric methods to quantify glomalin-related compounds in soils subjected to different managements. Biol. Fertil. Soils 2014, 50, 395–400. [Google Scholar] [CrossRef]
- Kemper, W.D.; Rosenau, R.C. Aggregate stability and size distribution’. In Methods of soil analysis: Part 1 Physical and Mineralogical Methods; Klute, A., Ed.; American Society of America, Inc. Soil Science Society of America: Madison, WI, USA, 1986; Volume 9, pp. 425–442. [Google Scholar]
- Thomas, G.W. Soil pH and soil acidity. In Methods of Soil Analysis. Part 3; Sparks, D.L., Page, A.L., Helmke, P.A., Loeppert, R.H., Thomas, G.W., Eds.; SSSA: Madison, WI, USA, 1996; pp. 475–490. [Google Scholar]
- Liebig, M.A.; Hendrickson, J.R.; Archer, D.W.; Schmer, M.A.; Nichols, K.A.; Tanaka, D.L. Short-term soil responses to late-seeded cover crops in a semi-arid environment. Agron. J. 2015, 107, 2011–2019. [Google Scholar] [CrossRef] [Green Version]
- USDA-NRCS Soil Health Key Points. Available online: www.nrcs.usda.gov (accessed on 4 April 2020).
- Acuña, J.C.M.; Villamil, M.B. Short-term effects of cover crops and compaction on soil properties and soybean production in Illinois. Agron. J. 2014, 106, 860–870. [Google Scholar] [CrossRef]
- Olson, K.R.; Ebelhar, S.A.; Lang, J.M. Cover crop effects on crop yields and soil organic carbon content. Soil Sci. 2010, 175, 89–98. [Google Scholar] [CrossRef] [Green Version]
- Lin, Y.; Watts, D.B.; Torbert, H.A.; Howe, J.A. Double-crop wheat and soybean yield response to poultry litter application. Crop Forage Turfgrass Manag. 2019, 5, 180082. [Google Scholar] [CrossRef]
- Muchanga, R.A.; Hirata, T.; Araki, H. Hairy vetch and livestock compost improve soil carbon and nitrogen, and fresh-market tomato yield. HortScience 2019, 54, 1023–1030. [Google Scholar] [CrossRef] [Green Version]
- Haruna, S.I. Influence of winter wheat on soil thermal properties of a Paleudalf. Int. Agrophys. 2019, 33, 389–395. [Google Scholar] [CrossRef]
- García-González, I.; Hontoria, C.; Gabriel, J.L.; Alonso-Ayuso, M.; Quemada, M. Cover crops to mitigate soil degradation and enhance soil functionality in irrigated land. Geoderma 2018, 322, 81–88. [Google Scholar] [CrossRef]
- Ontl, T.A.; Schulte, L.A. Soil Carbon Storage. Available online: https://0-www-nature-com.brum.beds.ac.uk/scitable/knowledge/library/soil-carbon-storage-84223790/ (accessed on 9 May 2020).
- Fang, C.; Smith, P.; Moncrieff, J.B.; Smith, J.U. Similar response of labile and resistant soil organic matter pools to changes in temperature. Nature 2005, 433, 57–59. [Google Scholar] [CrossRef] [PubMed]
- Adeli, A.; Brooks, J.P.; Read, J.J.; Shankle, M.W.; Feng, G.; Jenkins, J.N. Poultry litter and cover crop integration into no-till cotton on upland soil. Agron. J. 2019, 111, 2097–2107. [Google Scholar] [CrossRef]
- Parker, M.A.; Nyakatawa, E.Z.; Reddy, K.C.; Reeves, D.W. Effects of taller wheat residue after stripper header harvest on wind run, irradiant energy interception, and evaporation. In Making Conservation Tillage Conventional: Building A Future on 25 Years of Research; Auburn University: Auburn, AL, USA, 2002; Volume 22, pp. 283–287. [Google Scholar]
- Jagadamma, S.; Essington, M.E.; Xu, S.; Yin, X. Total and active soil organic carbon from long-term agricultural management practices in west Tennessee. Agric. Environ. Lett. 2019, 4, 180062. [Google Scholar] [CrossRef] [Green Version]
- White, K.E.; Brennan, E.B.; Cavigelli, M.A.; Smith, R.F. Winter cover crops increase readily decomposable soil carbon, but compost drives total soil carbon during eight years of intensive, organic vegetable production in California. PLoS ONE 2020, 15, e0228677. [Google Scholar] [CrossRef]
- Jokela, W.E.; Grabber, J.H.; Karlen, D.L.; Balser, T.C.; Palmquist, D.E. Cover crop and liquid manure effects on soil quality indicators in a corn silage system. Agron. J. 2009, 101, 727–737. [Google Scholar] [CrossRef] [Green Version]
- Steele, M.K.; Coale, F.J.; Hill, R.L. Winter Annual Cover Crop Impacts on No-Till Soil Physical Properties and Organic Matter. Soil Sci. Soc. Am. J. 2012, 76, 2164–2173. [Google Scholar] [CrossRef]
- Nichols, J.D. Relation of Organic Carbon to Soil Properties and Climate in the Southern Great Plains. Soil Sci. Soc. Am. J. 1984, 48, 1382–1384. [Google Scholar] [CrossRef]
- Schimel, D.S.; Braswell, B.H.; Holland, E.A.; McKeown, R.; Ojima, D.S.; Painter, T.H.; Parton, W.J.; Townsend, A.R. Climatic, edaphic, and biotic controls over storage and turnover of carbon in soils. Glob. Biogeochem. Cycles 1994, 8, 279–293. [Google Scholar] [CrossRef] [Green Version]
- NRCS-USDA Soil Quality Indicators. Available online: https://www.nrcs.usda.gov/wps/PA_NRCSConsumption/download?cid=stelprdb1269818&ext=pdf (accessed on 4 August 2019).
- Balota, E.L.; Calegari, A.; Nakatani, A.S.; Coyne, M.S. Benefits of winter cover crops and no-tillage for microbial parameters in a Brazilian Oxisol: A long-term study. Agric. Ecosyst. Environ. 2014, 197, 31–40. [Google Scholar] [CrossRef] [Green Version]
- Zhang, J.; Wang, F.; Che, R.; Wang, P.; Liu, H.; Ji, B.; Cui, X. Precipitation shapes communities of arbuscular mycorrhizal fungi in Tibetan alpine steppe. Sci. Rep. 2016, 6, 23488. [Google Scholar] [CrossRef] [PubMed]
- Lekberg, Y.; Koide, R.T. Effect of soil moisture and temperature during fallow on survival of contrasting isolates of arbuscular mycorrhizal fungi. Botany 2008, 86, 1117–1124. [Google Scholar] [CrossRef]
- Daniels, B.A.; Menge, J.I. Hyperparasitization of vesicular-arbuscular mycorrhizal fungi. Phytopathology 1980, 70, 584–588. [Google Scholar] [CrossRef] [Green Version]
- Bai, C.; He, X.; Tang, H.; Shan, B.; Zhao, L. Spatial distribution of arbuscular mycorrhizal fungi, glomalin and soil enzymes under the canopy of Astragalus adsurgens Pall. in the Mu Us sandland, China. Soil Biol. Biochem. 2009, 41, 941–947. [Google Scholar] [CrossRef]
- Bedini, S.; Avio, L.; Sbrana, C.; Turrini, A.; Migliorini, P.; Vazzana, C.; Giovannetti, M. Mycorrhizal activity and diversity in a long-term organic Mediterranean agroecosystem. Biol. Fertil. Soils 2013, 49, 781–790. [Google Scholar] [CrossRef]
- Bedini, S.; Avio, L.; Argese, E.; Giovannetti, M. Effects of long-term land use on arbuscular mycorrhizal fungi and glomalin-related soil protein. Agric. Ecosyst. Environ. 2007, 120, 463–466. [Google Scholar] [CrossRef]
- Olsson, P.A.; Thingstrup, I.; Jakobsen, I.; Bååth, E. Estimation of the biomass of arbuscular mycorrhizal fungi in a linseed field. Soil Biol. Biochem. 1999, 31, 1879–1887. [Google Scholar] [CrossRef]
- Hetrick, S.; Ketterings, Q.; Czymmek, K.; Sadeghpour, A.; Langner, A.; O’Neil, K.; Gabriel, A. Improving Aggregate Stability, Agronomy Fact Sheet Series. Available online: http://nmsp.cals.cornell.edu (accessed on 2 April 2020).
- Song, K.; Zheng, X.; Lv, W.; Qin, Q.; Sun, L.; Zhang, H.; Xue, Y. Effects of tillage and straw return on water-stable aggregates, carbon stabilization and crop yield in an estuarine alluvial soil. Sci. Rep. 2019, 9, 4586. [Google Scholar] [CrossRef]
- Rorick, J.D.; Kladivko, E.J. Cereal rye cover crop effects on soil carbon and physical properties in southeastern Indiana. J. Soil Water Conserv. 2017, 72, 260–265. [Google Scholar] [CrossRef] [Green Version]
- Boyle, M.; Frankenberger, W.T.; Stolzy, L.H. The influence of organic matter on soil aggregation and water infiltration. J. Prod. Agric. 1989, 2, 290–299. [Google Scholar] [CrossRef]
- USDA-NRCS Soil quality indicators: Aggregate Stability. Soil Qual. Indic. 1996, 192, 1836–1841. [CrossRef]
- Herath, H.M.S.K.; Camps-Arbestain, M.; Hedley, M. Effect of biochar on soil physical properties in two contrasting soils: An Alfisol and an Andisol. Geoderma 2013, 209–210, 188–197. [Google Scholar] [CrossRef]
- Ramírez, P.B.; Fuentes-Alburquenque, S.; Díez, B.; Vargas, I.; Bonilla, C.A. Soil microbial community responses to labile organic carbon fractions in relation to soil type and land use along a climate gradient. Soil Biol. Biochem. 2020, 141, 107692. [Google Scholar] [CrossRef]
- Sullivan, P. Overview of Cover Crops And Green Manures. Available online: https://cpb-us-e1.wpmucdn.com/blogs.cornell.edu/dist/e/4211/files/2014/04/Overview-of-Cover-Crops-and-Green-Manures-19wvmad.pdf (accessed on 6 January 2021).
- USDA-NRCS Legumes and Soil Quality. Available online: www.mes.umn.edu (accessed on 6 April 2020).
- Freitas, M.E.; De Souza, L.C.F.; Salton, J.C.; Serra, A.P.; Mauad, M.; Cortez, J.W.; Marchetti, M.E. Crop rotation affects soybean performance in no-tillage system under optimal and dry cropping seasons. Aust. J. Crop Sci. 2016, 10, 353–361. [Google Scholar] [CrossRef]
- Ayolagha, G.A.; Peter, K.D. Effect of remediation on growth parameters, grain and dry matter yield of soybean (Glycine max) in crude oil polluted soils in ogoni land, South Eastern Nigeria. Asian J. Crop Sci. 2012, 4, 113–121. [Google Scholar] [CrossRef]


| Maximum Temperature (°C) | Minimum Temperature (°C) | Monthly Total Rainfall (mm) | ||||||||||
|---|---|---|---|---|---|---|---|---|---|---|---|---|
| Month | Year 1 | Year 2 | Year 3 | Mean | Year 1 | Year 2 | Year 3 | Mean | Year 1 | Year 2 | Year 3 | Mean |
| October | 24.6 | 22.9 | 35.6 | 22.9 | 9.5 | 10.3 | 3.9 | 10.1 | 46 | 41 | 165 | 109 |
| November | 21.4 | 15.1 | 23.3 | 16.9 | 7.2 | 4.0 | −10.0 | 5.2 | 37 | 150 | 99 | 120 |
| December | 14.6 | 11.2 | 21.1 | 11.2 | 1.1 | −0.6 | −4.4 | 0.6 | 158 | 96 | 226 | 164 |
| January | 9.0 | 14.5 | 20.6 | 9.9 | −5.4 | −1.1 | −5.6 | −0.9 | 166 | 189 | 189 | 118 |
| February | 16.3 | 15.5 | 21.7 | 12.4 | 4.7 | 2.0 | −2.8 | 1.1 | 334 | 348 | 281 | 134 |
| March | 19.2 | 17.1 | 30.0 | 17.3 | 3.6 | −1.5 | −2.8 | 5.2 | 76 | 86 | 208 | 127 |
| April | 20.9 | 23.5 | 27.2 | 21.9 | 5.1 | 9.3 | 3.3 | 9.6 | 209 | 240 | 146 | 137 |
| May | 29.8 | 29.2 | 30.6 | 26.3 | 16.7 | 15.7 | 11.1 | 14.9 | 120 | 151 | 125 | 146 |
| June | 31.4 | 30.2 | 32.2 | 29.9 | 19.6 | 17.8 | 13.9 | 19.1 | 176 | 191 | 205 | 123 |
| July | 32.6 | 32.1 | 34.4 | 31.8 | 21.3 | 20.2 | 19.4 | 20.8 | 32 | 153 | 186 | 110 |
| August | 32.2 | 32.4 | 35.6 | 31.8 | 20.4 | 21.1 | 17.2 | 20.2 | 100 | 87 | 121 | 102 |
| September | 30.5 | 34.3 | 32.2 | 28.7 | 19.5 | 18.6 | 9.4 | 16.3 | 161 | 3 | 50 | 93 |
| Cover Crop | Fertilizer Source | Soybean Operation | Soil | |||||
|---|---|---|---|---|---|---|---|---|
| Planting | Biomass Collection | Killing | Poultry Litter | Inorganic Fertilizer | Planting | Cultivar | Harvest | Soil Sampling |
| Early Planting Date | ||||||||
| 30 October 2017 | 12 April 2018 | 19 April 2018 | 10 April 2018 | 10 April 2018 | 01 May 2018 | Asgrow® 46X6 | 04 October 2018 | 07 May 2018 |
| 29 October 2018 | 02 April 2019 | 17 April 2019 | 02 April 2019 | 02 April 2019 | 30 April 2019 | Asgrow® 45X8 | 30 September 2019 | 08 May 2019 |
| 05 November 2020 | 07 April 2020 | 04 April 2019 | 16 April 2020 | 16 April 2020 | 05 May 2020 | Asgrow® 45X8 | 06 October 2020 | 05 May 2020 |
| Late Planting Date | ||||||||
| 30 October 2017 | 10 May 2018 | 14 May 2018 | 10 April 2018 | 10 April 2018 | 24 May 2018 | Asgrow® 46X6 | 19 October 2018 | 04 June 2018 |
| 29 October 2018 | 08 May 2019 | 08 May 2019 | 02 April 2019 | 02 April 2019 | 23 May 2019 | Asgrow® 45X8 | 30 September 2019 | 28 May 2019 |
| 05 November 2020 | 11 May 2020 | 11 May 2020 | 16 April 2020 | 16 April 2020 | 01 June 2020 | Asgrow® 45X8 | 06 October 2020 | 03 June 2020 |
| Year | Moisture % | TN (g kg−1) | TC (g kg−1) | K | P | Cu | Zn | Fe | Mn |
|---|---|---|---|---|---|---|---|---|---|
| -----g kg−1----- | ----------------mg kg−1-------------- | ||||||||
| 2018 | 24.1 | 31 | 250 | 25.7 | 13.0 | 0.400 | 0.424 | 1.617 | 0.656 |
| 2019 | 25.9 | 32 | 229 | 28.8 | 17.5 | 0.113 | 0.416 | 0.859 | 0.455 |
| Cover Crop Production (kg ha−1) | |||
|---|---|---|---|
| Cover Crop | 2018 | 2019 | 2020 |
| Early-terminated cover crop | |||
| Cereal rye | 1645 1 (200) 2 a | 3639 (326) a | 1986 (288) a |
| CC-mix | 1768 (288) a | 3035 (442) a | 2037 (316) a |
| Native veg. | 418 (138) b | 3140 (690) a | 1228 (174) b |
| Vetch | 685 (16) b | 1953 (260) a | 1313 (142) b |
| Wheat | 1770 (108) a | 3532 (379) a | 2026 (207) a |
| p value | 0.0014 | 0.2108 | 0.0244 |
| Late-terminated cover crop | |||
| Cereal rye | 4425 (292) a | 4228 (478) a | 3467 (468) ab |
| CC-mix | 4284 (368) a | 4408 (330) a | 4008 (457) a |
| Native veg. | 2254 (52) b | 2632 (350) a | 2544 (346) bc |
| Vetch | 1546 (212) b | 3545 (383) a | 2473 (330) c |
| Wheat | 4386 (363) a | 2989 (664) a | 3244 (294) abc |
| p value | <0.0001 | 0.3641 | 0.0031 |
| Effect | Df | C (g kg−1) | N (g kg−1) | WSA % | EE-GRSP (mg g−1) | POXC (mg kg−1) | pH | Yield (kg ha−1) |
|---|---|---|---|---|---|---|---|---|
| Early Planting Date | ||||||||
| Y 1 | 2 | <0.0390 | 0.0413 | <0.0001 | 0.0097 | 0.0075 | <0.001 | <0.001 |
| CC | 4 | <0.2452 | 0.1466 | 0.3696 | 0.2566 | 0.5448 | 0.0123 | 0.4356 |
| Y* 2CC | 8 | 0.9997 | 1.0000 | 0.7305 | 0.9993 | 0.9941 | 0.9579 | 0.8835 |
| F | 2 | 0.0265 | 0.0002 | 0.0978 | 0.2134 | 0.0066 | 0.0044 | <0.0001 |
| Y*F | 4 | 0.6733 | 0.7078 | 0.7682 | 0.8216 | 0.4450 | 0.1176 | <0.0001 |
| CC*F | 8 | 0.4397 | 0.3402 | 0.1950 | 0.3836 | 0.0462 | 0.0797 | 0.2760 |
| Y*CC*F | 16 | 0.1640 | 0.2622 | 0.7265 | 0.3456 | 0.3407 | 0.9422 | 0.9361 |
| Late Planting Date | ||||||||
| Y | 2 | <0.001 | <0.001 | 0.0002 | <0.001 | 0.0089 | 0.0006 | 0.0686 |
| CC | 4 | 0.8794 | 0.7914 | 0.5534 | 0.7464 | 0.9088 | 0.2786 | 0.3837 |
| Y*CC | 8 | 0.9003 | 0.9331 | 0.3842 | 0.9904 | 0.3723 | 0.9593 | 0.9631 |
| F | 2 | 0.0189 | 0.0004 | 0.3615 | <0.001 | 0.0276 | 0.0006 | <0.001 |
| Y*F | 4 | 0.4436 | 0.4131 | 0.0085 | 0.0366 | 0.2616 | 0.2463 | 0.0404 |
| CC*F | 8 | 0.4647 | 0.3534 | 0.1986 | 0.0419 | 0.4682 | <0.001 | 0.9979 |
| Y*CC*F | 16 | 0.8793 | 0.7221 | 0.7623 | 0.8709 | 0.9692 | 0.0971 | 0.3407 |
| Cover Crop | Total C 1 (g kg−1) | Total N (g kg−1) | POXC (mg kg−1) | EE-GRSP (mg g−1) | WSA % | pH | Yield (kg ha−1) |
|---|---|---|---|---|---|---|---|
| Early-Planting Date | |||||||
| Cereal Rye | 17.1 (0.6) | 1.7 (0.0) | 595 (26) | 89 (3) | 54 (32) | 5.84 (0.07) | 3641 (293) |
| CC-mix 2 | 18.3 (0.6) | 1.9 (0.1) | 598 (24) | 97 (3) | 54 (2) | 5.75 (0.07) | 3787 (251) |
| Native Veg. 3 | 16.0 (0.5) | 1.6 (0.1) | 541 (18) | 89 (2) | 56 (2) | 5.94 (0.07) | 3790 (257) |
| Vetch | 11.8 (0.7) | 1.9 (0.1) | 560 (22) | 89 (3) | 54 (2) | 5.63 (0.07) | 3773 (269) |
| Wheat | 16.0 (0.5) | 1.6 (0.0) | 537 (21) | 87 (3) | 51 (2) | 5.94 (0.06) | 3623 (291) |
| p-value | 0.6306 | 0.5288 | 0.8171 | 0.6101 | 0.5093 | 0.1708 | 0.9538 |
| Late-Planting Date | |||||||
| Cereal Rye | 17.7 (0.7) | 1.9 (0.1) | 580 (22) | 83 (3) | 61 (2) | 5.71 (0.06) | 3228 (136) |
| CC-mix | 17.4 (0.7) | 1.9 (0.1) | 562 (20) | 80 (3) | 59 (2) | 5.76 (0.09) | 3160 (130) |
| Native Veg. | 17.2 (0.6) | 1.8 (0.0) | 548 (22) | 80 (3) | 57 (1) | 5.89 (0.10) | 2993 (137) |
| Vetch | 17.7 (0.7) | 1.9 (0.1) | 564 (23) | 82 (4) | 59 (2) | 5.64 (0.09) | 3222 (145) |
| Wheat | 18.0 (0.7) | 1.9 (0.1) | 578 (24) | 77 (2) | 60 (1) | 5.82 (0.08) | 2995 (133) |
| p-value | 0.9705 | 0.9389 | 0.8477 | 0.9037 | 0.5268 | 0.7360 | 0.6624 |
| Fertilizer Source | Total C 1 (g kg−1) | Total N (g kg−1) | POXC (mg kg−1) | EE-GRSP (mg g−1) | WSA % | pH |
|---|---|---|---|---|---|---|
| Early-Planting Date | ||||||
| Inorganic | 16.8 (0.5) 2 a | 1.7 (0.0) b | 558 (23) a | 89 (2) a | 52 (2) a | 5.76 (0.06) a |
| No Fertilizer | 16.7 (0.5) a | 1.7 (0.0) b | 550 (15) a | 89 (2) a | 54 (2) a | 5.90 (0.05) a |
| Poultry Litter | 17.8 (0.5) a | 1.8 (0.0) a | 592 (18) a | 93 (2) a | 55 (2) a | 5.80 (0.05) a |
| p-value | 0.0727 | 0.0018 | 0.0843 | 0.2672 | 0.2297 | 0.1296 |
| Late-Planting Date | ||||||
| Inorganic | 17.6 (0.5) a | 1.9 (0.0) b | 557 (15) a | 80 (2) b | 60 (1) a | 5.71 (0.07) b |
| No Fertilizer | 17.0 (0.5) a | 1.8 (0.0) ab | 550 (18) a | 75 (2) b | 59 (1) a | 5.91 (0.07) a |
| Poultry Litter | 18.3 (0.5) a | 2.0 (0.0) a | 580 (16) a | 85 (2) a | 58 (1) a | 5.66 (0.06) b |
| p-value | 0.1962 | 0.0197 | 0.3629 | 0.0010 | 0.5973 | 0.0030 |
Publisher’s Note: MDPI stays neutral with regard to jurisdictional claims in published maps and institutional affiliations. |
© 2021 by the authors. Licensee MDPI, Basel, Switzerland. This article is an open access article distributed under the terms and conditions of the Creative Commons Attribution (CC BY) license (http://creativecommons.org/licenses/by/4.0/).
Share and Cite
Pokhrel, S.; Kingery, W.L.; Cox, M.S.; Shankle, M.W.; Shanmugam, S.G. Impact of Cover Crops and Poultry Litter on Selected Soil Properties and Yield in Dryland Soybean Production. Agronomy 2021, 11, 119. https://0-doi-org.brum.beds.ac.uk/10.3390/agronomy11010119
Pokhrel S, Kingery WL, Cox MS, Shankle MW, Shanmugam SG. Impact of Cover Crops and Poultry Litter on Selected Soil Properties and Yield in Dryland Soybean Production. Agronomy. 2021; 11(1):119. https://0-doi-org.brum.beds.ac.uk/10.3390/agronomy11010119
Chicago/Turabian StylePokhrel, Sapana, William L. Kingery, Michael S. Cox, Mark W. Shankle, and Shankar G. Shanmugam. 2021. "Impact of Cover Crops and Poultry Litter on Selected Soil Properties and Yield in Dryland Soybean Production" Agronomy 11, no. 1: 119. https://0-doi-org.brum.beds.ac.uk/10.3390/agronomy11010119