Phenotypic Evaluation of Fire Blight Outbreak in the USDA Malus Collection


1
Plant Genetic Resources Unit, United States Department of Agriculture-Agricultural Research Service, Geneva, NY 14456, USA
2
Plant Pathology and Plant-Microbe Biology Section, School of Integrated Plant Science, Cornell University, Ithaca, NY 14850, USA
*
Author to whom correspondence should be addressed.
Agronomy 2021, 11(1), 144; https://0-doi-org.brum.beds.ac.uk/10.3390/agronomy11010144
Submission received: 29 December 2020
/
Revised: 8 January 2021
/
Accepted: 10 January 2021
/
Published: 14 January 2021
(This article belongs to the Collection Genetic Diversity Evaluation of the Fruit Trees)
Abstract
:Fire blight, caused by pathogen Erwinia amylovora, is a major disease in Malus. Biological, chemical and cultural controls are efficient to manage fire blight, while rootstocks, and host resistance can limit damages. During the 2020 season a naturally occurring fire blight outbreak occurred in the United States Department of Agriculture (USDA) Malus collection, providing a unique opportunity to evaluate the diverse collection for fire blight susceptibility. The E. amylovora strain in the collection was identified as streptomycin resistant and characterized as CRISPR (clustered regularly interspaced short palindromic repeats) spacer array profile, 41:23:38. Fire blight severity was assessed using two approaches: (1) Average severity percentage, where the number of infected shoots was divided by the total number of shoots for the east and west facing sides of the tree; and (2) cut severity rating, where the trees were visually assessed after fire blight removal for amount of tree removed. Overall, 1142 trees of 41 Malus species were assessed for average severity and 2525 trees of 48 species were assessed for cut severity. A subset of 667 trees were for average severity in June and July to understand the disease progression. The species and trees presented here, can provide insight for future genetic fire blight resistance studies.
1. Introduction
Apples (Malus domestica) are an important fruit commodity worldwide. In 2018, the United States produced 9.8 billion pounds of apples valued at about 3 billion dollars [1]. Fire blight, caused by the bacterial pathogen Erwinia amylovora, is a devastating disease of Malus [2]. The first incidence of fire blight was recorded in the Hudson Valley of New York, U.S. in 1780 [2]. Since then, it has spread throughout the world. E. amylovora can infect blossoms, vegetative shoots, fruits, woody tissue, and rootstock crowns [3]. The disease can kill a tree or an entire orchard in a single season. It is estimated that fire blight causes over 100 million dollars of losses annually [4]. In 2000, a fire blight outbreak throughout Michigan in the U.S. resulted in approximately 400,000 tree deaths and 42 million dollars in losses [5]. Several top-ranking apples for production and consumer preference are highly susceptible to fire blight, including ‘Gala,’ ‘Fuji,’ and ‘Jonagold’ [3].
To manage fire blight, chemical, biological, and cultural controls are used [6,7]. Properly timed streptomycin treatments are one of the most effective means of managing fire blight [3,8]. Biological controls are able to manage fire blight to an extent but were not as effective as antibiotic treatments alone [8,9,10]. In addition to managing E. amylovora inoculum, other management approaches focus on host response. Prohexadione-calcium, trade name Apogee®, is an inhibitor of gibberellin biosynthesis, and effectively slows tree growth, while acibenzolar-S-methyl, trade name Actigard® stimulates natural tree defenses [3,4,11,12,13]. Streptomycin is the most effective management tool for control of fire blight in North America east of the Mississippi River; however, streptomycin-resistant strains of fire blight have been recorded throughout the United States [14,15,16,17].
In addition to chemical controls, host resistance is highly desired to manage fire blight. Host resistance is a complex, quantitative trait, impacted by the underlying genetics of the tree, the strain of the E. amylovora, and environmental factors [18,19]. There have been numerous studies that have identified major and minor quantitative trait loci (QTLs) and genes response for host resistance in apple [20,21,22,23,24], including QTLs associated with specific E. amylovora strains [25]. Although resistance QTLs have been identified in M. domestica, such as on apple linkage group 7 in ‘Fiesta’ [26], they are predominantly identified in wild species. A major QTL on linkage group 3 was mapped in Malus x robusta 5 [27]; two QTLs on linkage group 12 were identified in ‘Evereste’ (crab apple) and M. floribunda 821 [20] capturing 40–70% of the variation; and major QTLs on linkage group 10 in M. baccata and linkage group 12 for M. fusca have also been reported explaining 50% and 85% of the phenotypic variation, respectively [28]. Additionally, a QTL on linkage group 12 of M. arnoldiana has been reported [29].
The United States Department of Agriculture (USDA) Malus collection in Geneva, NY is home to over 6000 apple accessions and 48 species and hybrids from around the world. During the 2020 growing season, a naturally occurring severe outbreak of E. amylovora swept through the USDA apple collection, offering a unique opportunity to evaluate the germplasm for fire blight susceptibility and resistance. Although observations of fire blight in the collection were documented from 1990–2000 incidences of naturally occurring shoot blight [30], the data were not systematically collected across a large number of accessions under comparable conditions. In this study, we identified a single E. amylovora strain, and recorded fire blight shoot severity for 1341 trees, totaling 48 species in the main collection and core collection. After pruning symptomatic trees, 2525 trees consisting of 48 species were rated for cut severity to infer fire blight susceptibility. Fire blight severity and cut severity were analyzed and significant differences were found in both between and within species. This data provides the first systematic evaluation and further insight into the diversity of fire blight tolerance in the USDA Malus collection, which will facilitate future exploration of the collection for breeding of new apple cultivars resistant to fire blight.
2. Materials and Methods
2.1. Plant Material
The USDA Malus collection is maintained in Geneva, NY, USA (42°89′50.19″ N, −77°00′68.31″ W). The permanent block (2830 accessions), referred to as the “main collection” in the present work, is grafted on EMLA7, fire blight resistant and semi-dwarfing (60–70% height) rootstock. A core genetic diversity collection of 236 accessions from the permanent block is grafted on B.9 (Budagousky 9) dwarfing rootstock. EMLA7-grafted trees are planted in duplicate 6 feet (1.8 m) apart, with the second tree removed after accession establishment. B.9-grafted trees are planted six feet apart and trellis supported. Rows are spaced 20 feet (6 m) apart. Accessions are maintained with conventional horticultural and pest management practices, including annual chemical applications and mechanical pruning [31]. Planting date varied from 1 to 20 years with an average of 14.6 years. Malus taxonomy is based on the accession information from the Germplasm Resource Information Network (GRIN-Global). These collections are contiguous and make up much of the Malus collection plantings.
2.2. E. amylovora Sampling, Streptomycin Sensitivity, and Strain Identification
Infected shoots from 47 randomly selected trees from the core and main collections representing the overall collection block were sampled on 17 June 2020, shortly after symptoms were detected. Samples were surface sterilized and cambium tissue was dissected and incubated on Crosse-Goodman medium at 28 °C for 48 h, as previously described [32,33]. Bacterial growths identified as E. amylovora based on their characteristic crater-like appearance were sub-cultured and DNA was extracted by suspending individual colonies in sterile, deionized water and vortexing for 1 min. Presence of E. amylovora was confirmed using polymerase chain reaction (PCR) to amplify the plasmid pEA29 that is ubiquitous and unique to E. amylovora worldwide as previously described (Table S1) [33,34].
Sensitivity to streptomycin was determined by an initial phenotyping of growth of individual colonies on CG medium amended with 100 µg mL−1 streptomycin as previously described [33,35]. Streptomycin resistance and mechanism of resistance were identified using PCR amplification of strA and strB genes as previously described by Tancos et al. (Table S1) [33]. This gene pair codes for an aminoglycoside transferase, one of the two known determinants of streptomycin resistance in E. amylovora [14].
Strain identity was determined by characterizing CRISPR (clustered regularly interspaced short palindromic repeats) spacer array profiles on a subsample of 11 isolates, haphazardly selected to represent the affected acreage, by PCR amplification and sequencing of CRISPR regions CR1, CR2, and CR3, as previously described [35,36] (Table S1). CRISPR spacer profiles of the 11 samples were determined by aligning them to reference sequences of known CRISPR array patterns using CLC Main Workbench v20 (Qiagen, Hilden, Germany) [35].
2.3. Fire Blight Severity Scoring
In late June of 2020, 1341 trees from the main collection were scored for fire blight severity (Figure 1). To assess the severity, the total number of first year shoots and number of first year shoots showing fire blight symptoms were counted for the east and west facing sides of a tree. The severity expressed as percentage was calculated for each side of the tree as follows where “FB” stands for fire blight and “1 yr” stands for first year shoots:
Severity assessments from the east and west were averaged to get the final tree severity. Approximately three weeks after the initial rating, 667 out of the 1341 trees from the main collection were assessed in mid-July for disease progression. The entire core collection was rated in early July, and a second time three weeks later in Late July to assess disease progression. To reduce bias for fire blight severity in small trees, we removed the samples below the 15th percentile of total shoots. Trees containing fewer than 28 branches in the main collection and 22 branches in the core collection were excluded from analysis, leaving 1142/1341 trees from the main collection 199/236 trees in the core collection.
2.4. Fire Blight Cut Severity Ratings
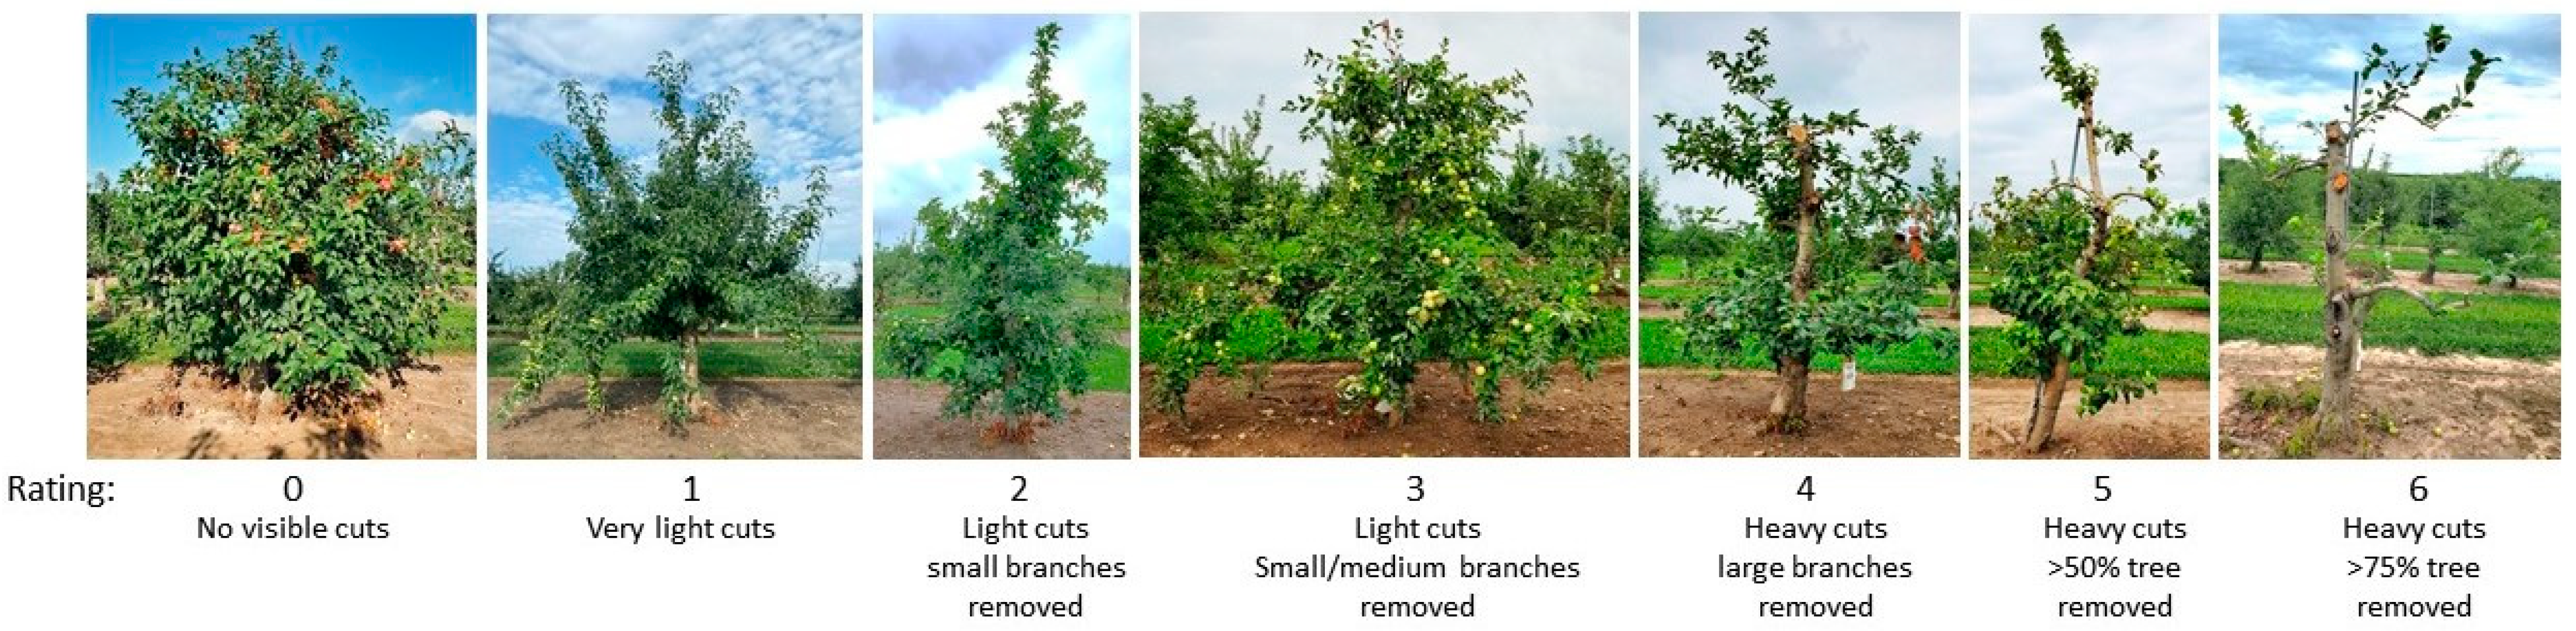
As part of the routine management of the disease, fire blight infected shoots were systematically pruned, inhibiting an accurate evaluation of disease severity as described above. As such, a rating from “0” to “6” was used in the main collection to describe how much infected tissue was removed from the tree. Where “0” represents no visible cuts, “1” represents very light cuts, “2” represents light cuts, small branches removed, “3” light cuts, small and medium branches removed, “4” represents heavy cuts with large branches removed, “5” represents heavy cuts > 50% tree removed and “6” represents heavy cuts > 75% tree removed (Figure 2). Fire blight resistance was inferred based on cut severity, where “0” is likely resistant, “1”, “2”, and “3” are mildly resistant, “4” is moderately susceptible and “5” and “6” are highly susceptible. Small, immature trees were excluded from the analysis, including the samples below the 15th percentile from severity scoring. In total 2525 trees from the main collection were used for downstream analysis.
2.5. Statistical Analysis
3. Results
3.1. E. amylovora Strain Characterization
E. amylovora was successfully isolated from 40 of 47 samples; all had positive phenotypes for streptomycin resistance, indicated by growth on streptomycin-amended media at 100 µg mL−1. For each isolate, the strA and strB gene pair was identified as the mechanism of resistance. The same CRISPR spacer array profile, 41:23:38, was identified for all 11 isolates collected over the affected acreage.
3.2. Fire Blight Severity
In the main collection 1142 trees consisting of 41 species were scored for fire blight severity in late June. The fire blight severity among all trees ranged from 0% to 85.7% (Figure S1). Only 11 of the 41 species had 10 or more trees. Of those 11 species, M. domestica had the greatest average severity of 27.3% (n = 534), followed by M. toringo (15.8%, n = 19) and Malus hybrids (14.9%, n = 136), while M. ioensis (5.4%, n = 19), M. fusca (4.0%, n = 20), and M. baccata (3.7%, n = 36) had the lowest severity. The majority of M. sieversii trees had average severity under 10%. Overall, M. domestica, M. sieversii, and Malus hybrids had the widest variations in severity with trees ranging from 0–85.7%, 0–79.3%, and 0–75.9% severity, respectively (Figure S2). A Kruksal–Wallis test was conducted for species with 10 or more trees revealing significant severity differences between species (p-value = 3.65 × 10−45). Dunn’s multiple comparison test with Bonferroni adjustment resulted in eleven significant comparisons (Table S2).
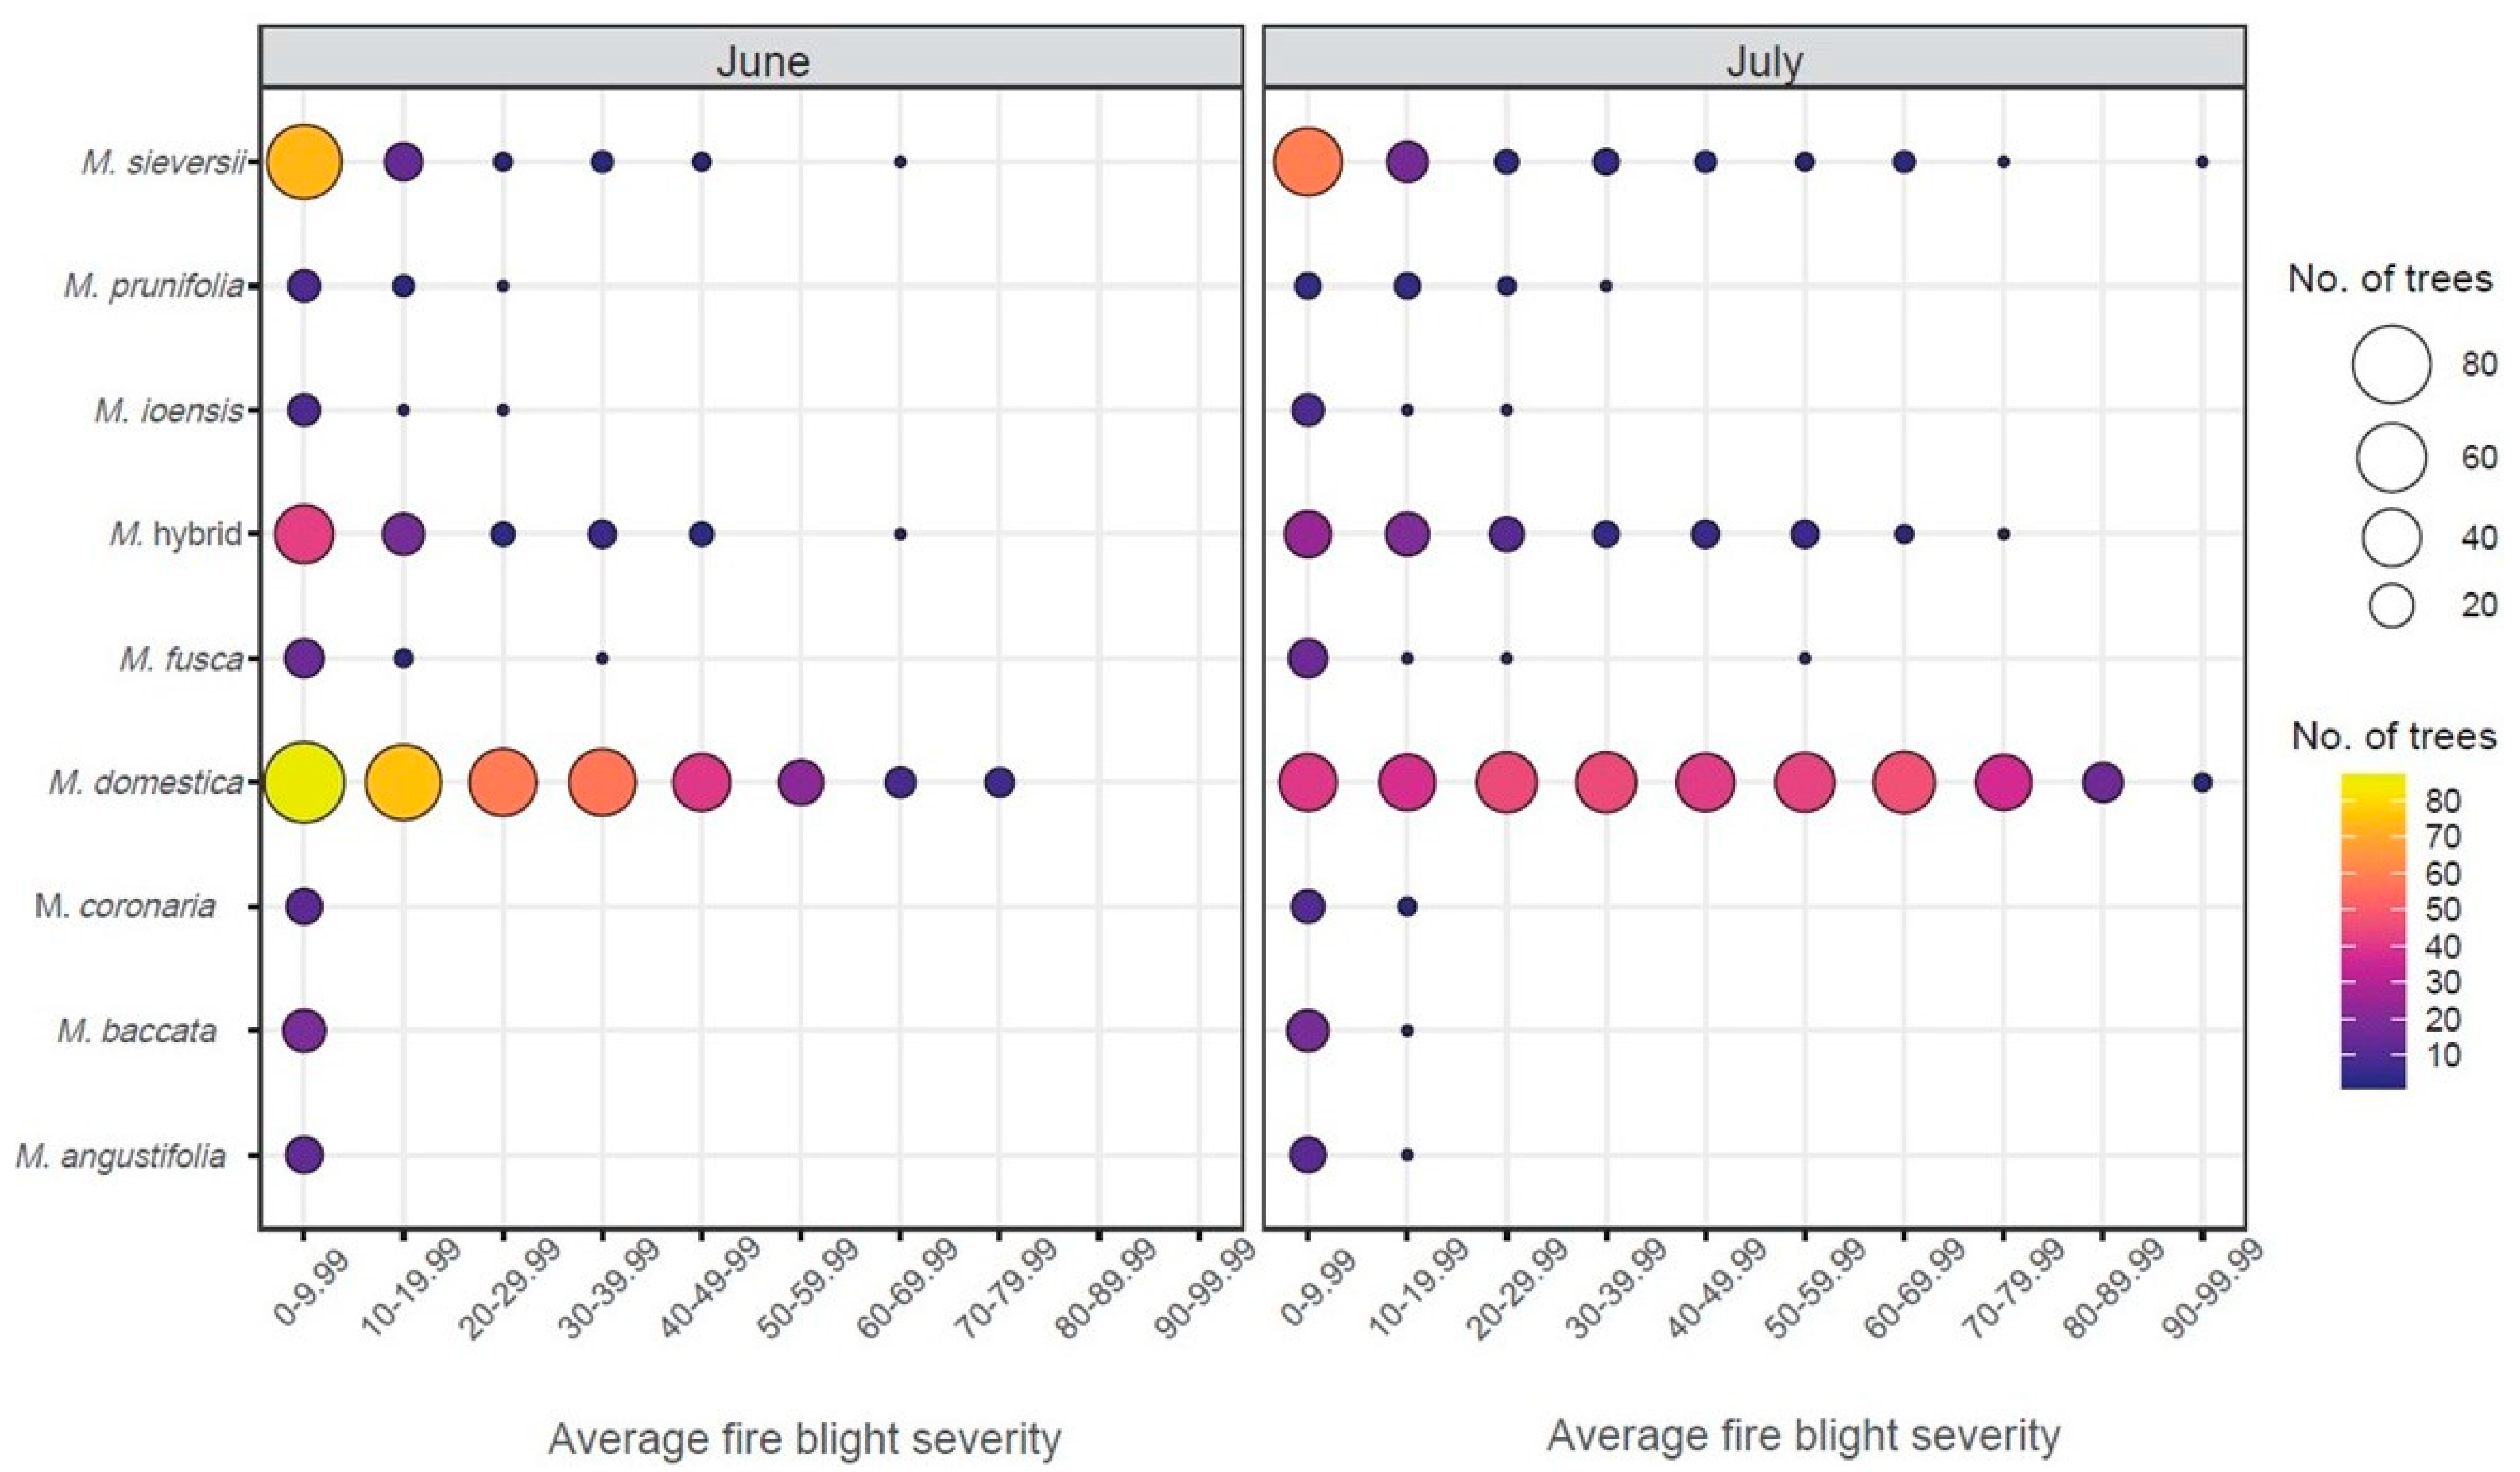
In mid-July, 667 trees consisting of 34 species in the main collection were reevaluated for fire blight severity prior to pruning, approximately three weeks after the initial scoring of the 1142 trees (Figure 3). The overall severity of the subset ranged from 0% to 73.1% in June and 0% to 92.3% in July. When comparing the June and July severity, 19.3% of the trees had no change in severity; 36.4% had increased severity between 0.1 and 10%; and 3% had increased severity greater than 40% (Figure 4). On average, severity increased 12.7% in July. There were 113 trees in June with 0% severity. In July, 76 of those trees remained at 0% severity, while 34 increased to 0.4–10% severity and 3 trees increased to <10% severity but <20%. The largest increase in average severity (65.3%) was observed in a M. domestica tree that had 11.5% average severity in June and 76.8% average severity in July. Within the set of 667 trees, only 9 of the 34 species had more than 10 trees. For those, the highest severity in June was M. domestica (25.4%, n = 354), Malus hybrids (12.4%, n = 75), and M. prunifolia (8.0%, n = 13) while the lowest severity was observed in M. coronaria (4.3%, n = 12), M. baccata (1.08%, n = 19), and M. angustifolia (0.17%, n = 13). After the July assessment, M. domestica remained with the highest average severity (42.3%), followed by Malus hybrids (21.1%) and M. sieversii (13.6%), while M. fusca (6.0%), M. baccata (2.4%), and M. angustifolia (1.4%), had the lowest severity. In July, most of the M. sieversii trees had average severity of under 10% while M. domestica trees were more uniformly spread from 0–79.99% severity at 10% range intervals (Figure 5). The Kruksal–Wallis test was conducted on the June/July datasets with 10 or more trees per species revealing a significant severity difference between species in both June (p-value: 6.32 × 10−42) and July (p-value: 2.92 × 10−48). Dunn’s multiple comparison test with Bonferroni adjustment was then completed, resulting in ten significant comparisons which were the same in June and July (Table 1).
In the core collection, 199 trees were assessed for fire blight severity twice, in early and late July (Figure S3). In the core collection there are 35 different species, however most species had one or two representative trees. Only 8 species had 5 or more scored trees, limiting species comparisons. Of those 8 species, M. toringo had the highest average severity (8.1%, n = 6)) in early July followed by M. domestica (6.6%, n = 55)) and Malus hybrids (4.4%, n = 39). The lowest average severity was observed in M. sylvestris (0.25%, n = 6)), M. baccata (0%, n = 5)), and M. orientalis (0%, n = 12)). In late July, M. domestica had the highest severity (9.3%), followed by M. toringo (8.72%) and Malus hybrids (6.48%) while M. baccata and M. orientalis remained the lowest with 0% severity.
Eighty-three trees were in the main and core collections on the EMLA7 and B.9 rootstocks, respectively. Typically, severity was higher on EMLA7 rootstock, with a mean difference in severity of 12.8% in June and 17.53% in July. Pearson correlations between accessions grafted on the two rootstocks were r = 0.24 for June and r = 0.29 for July datasets. There were 24 M. domestica trees with average severity of 10.9% in the core collection during the early July scoring and 32.0% in main collection for the late June assessment. The 19 Malus hybrids trees had average severity of 5.3% and 18.6% in the core and main collections while the 9 M. sieversii trees were 0.3% and 16.3%, respectively.
3.3. Cut Severity
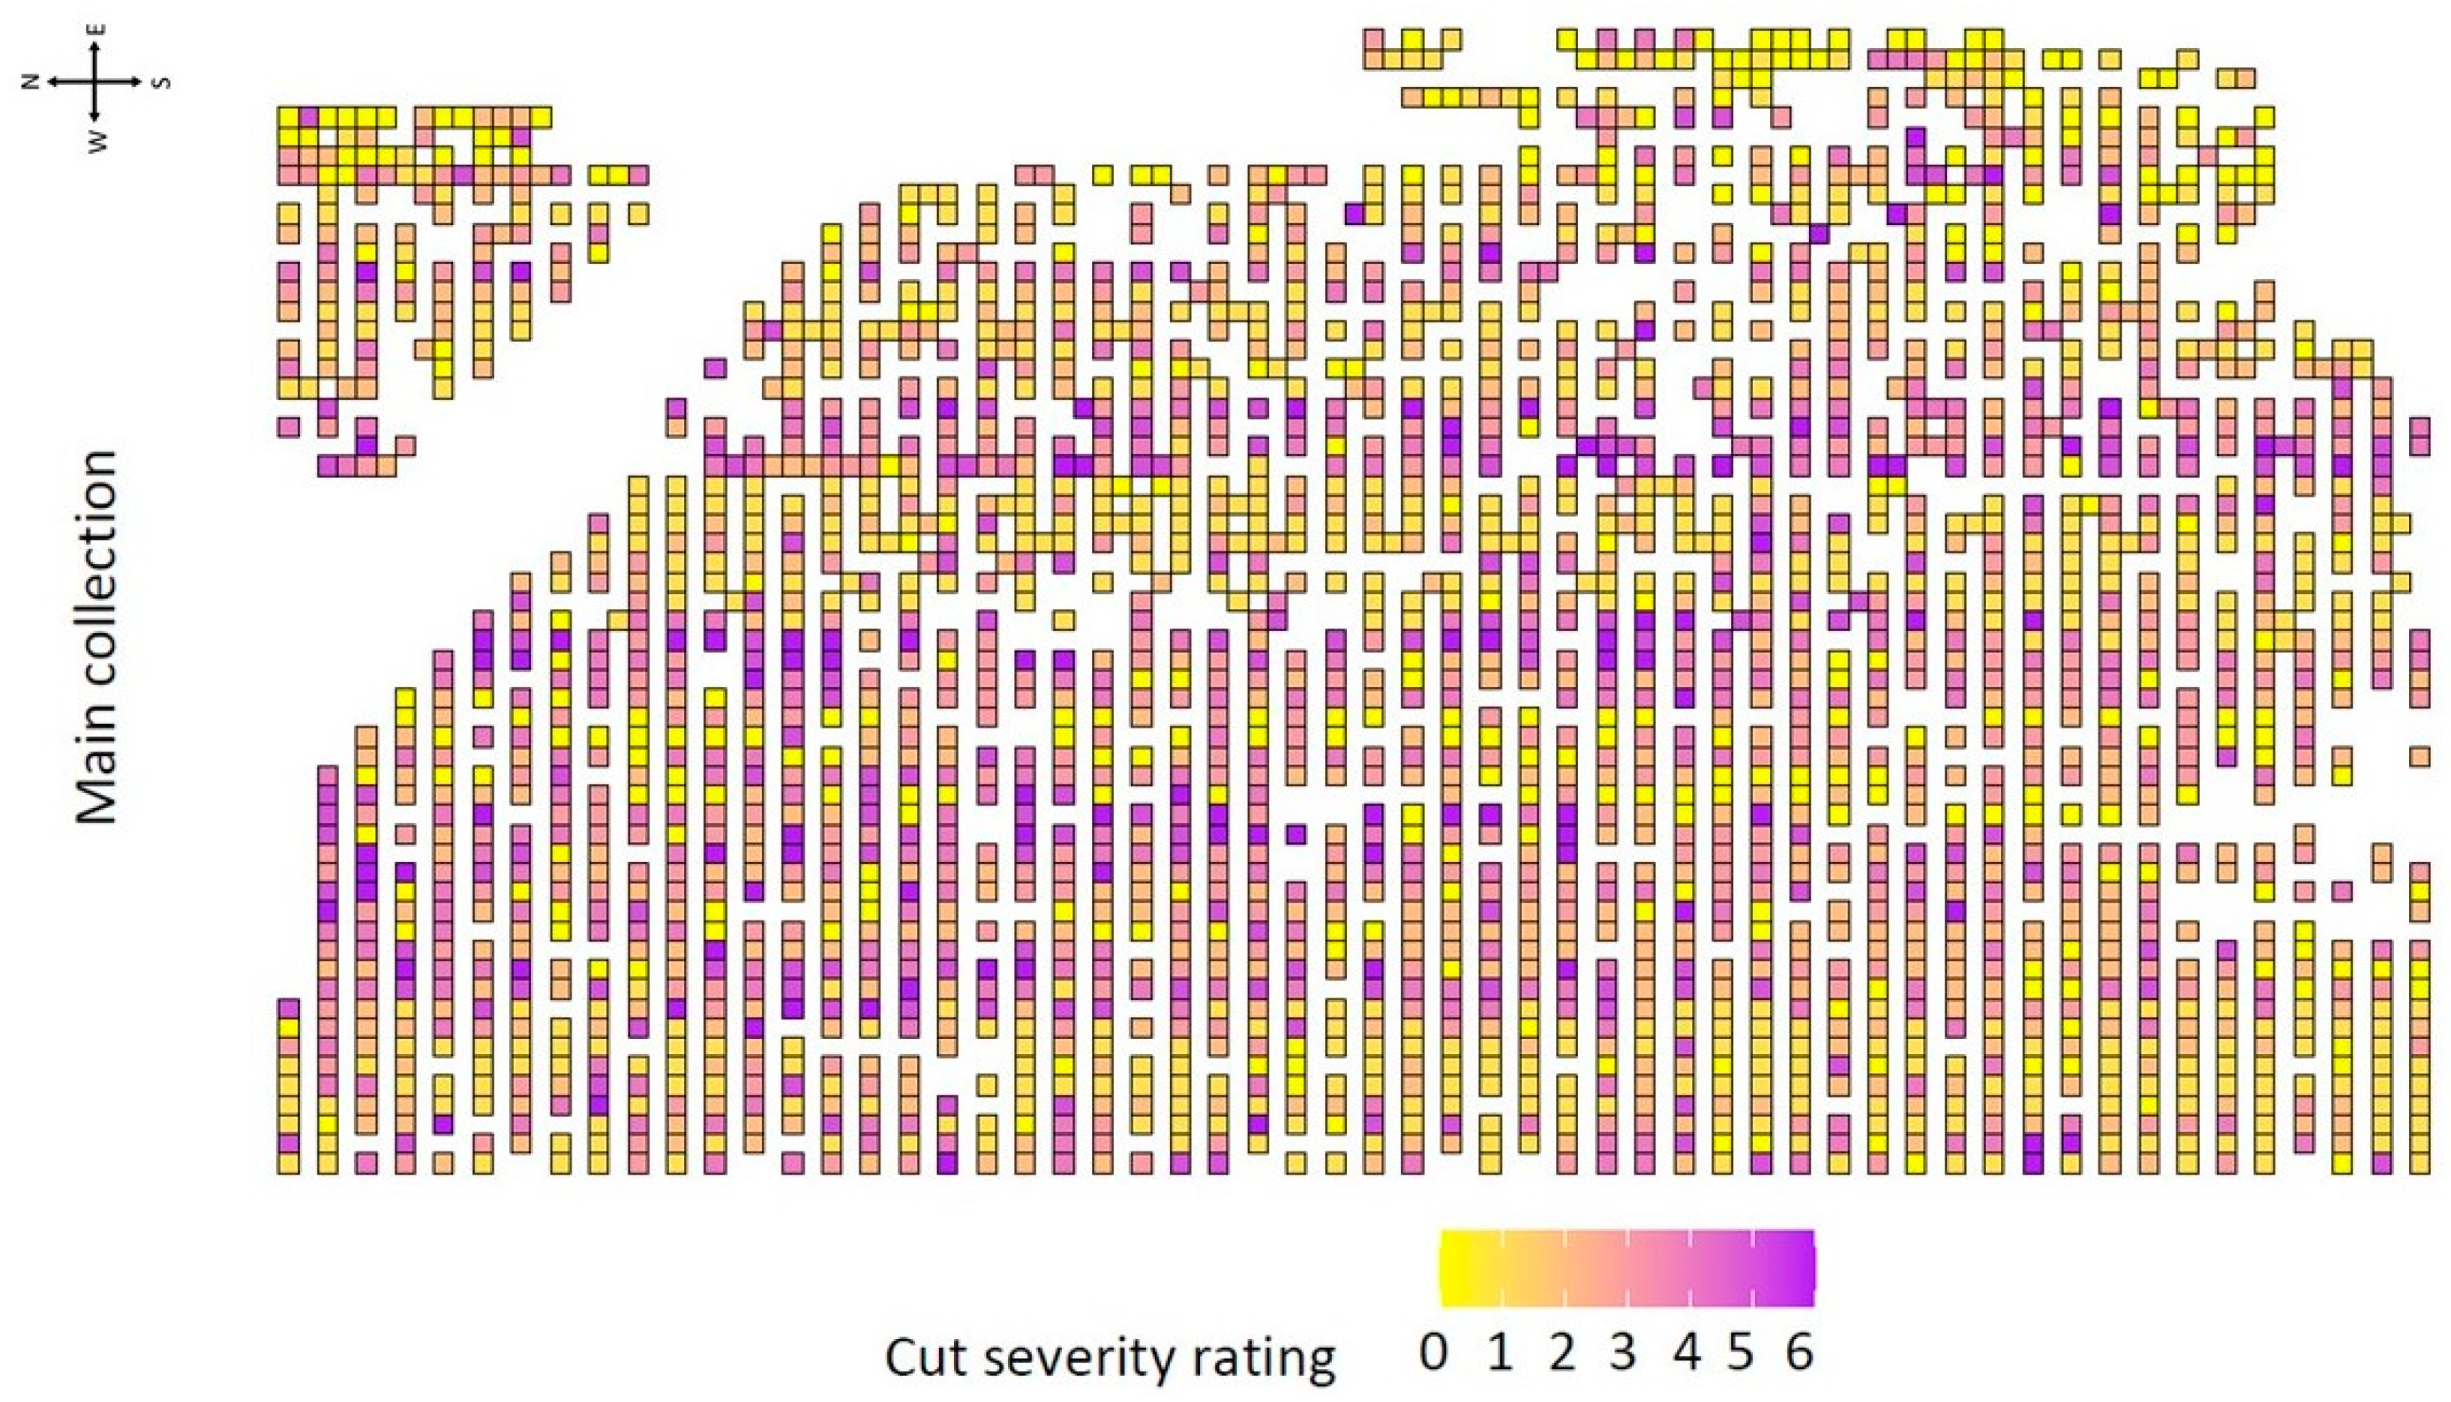
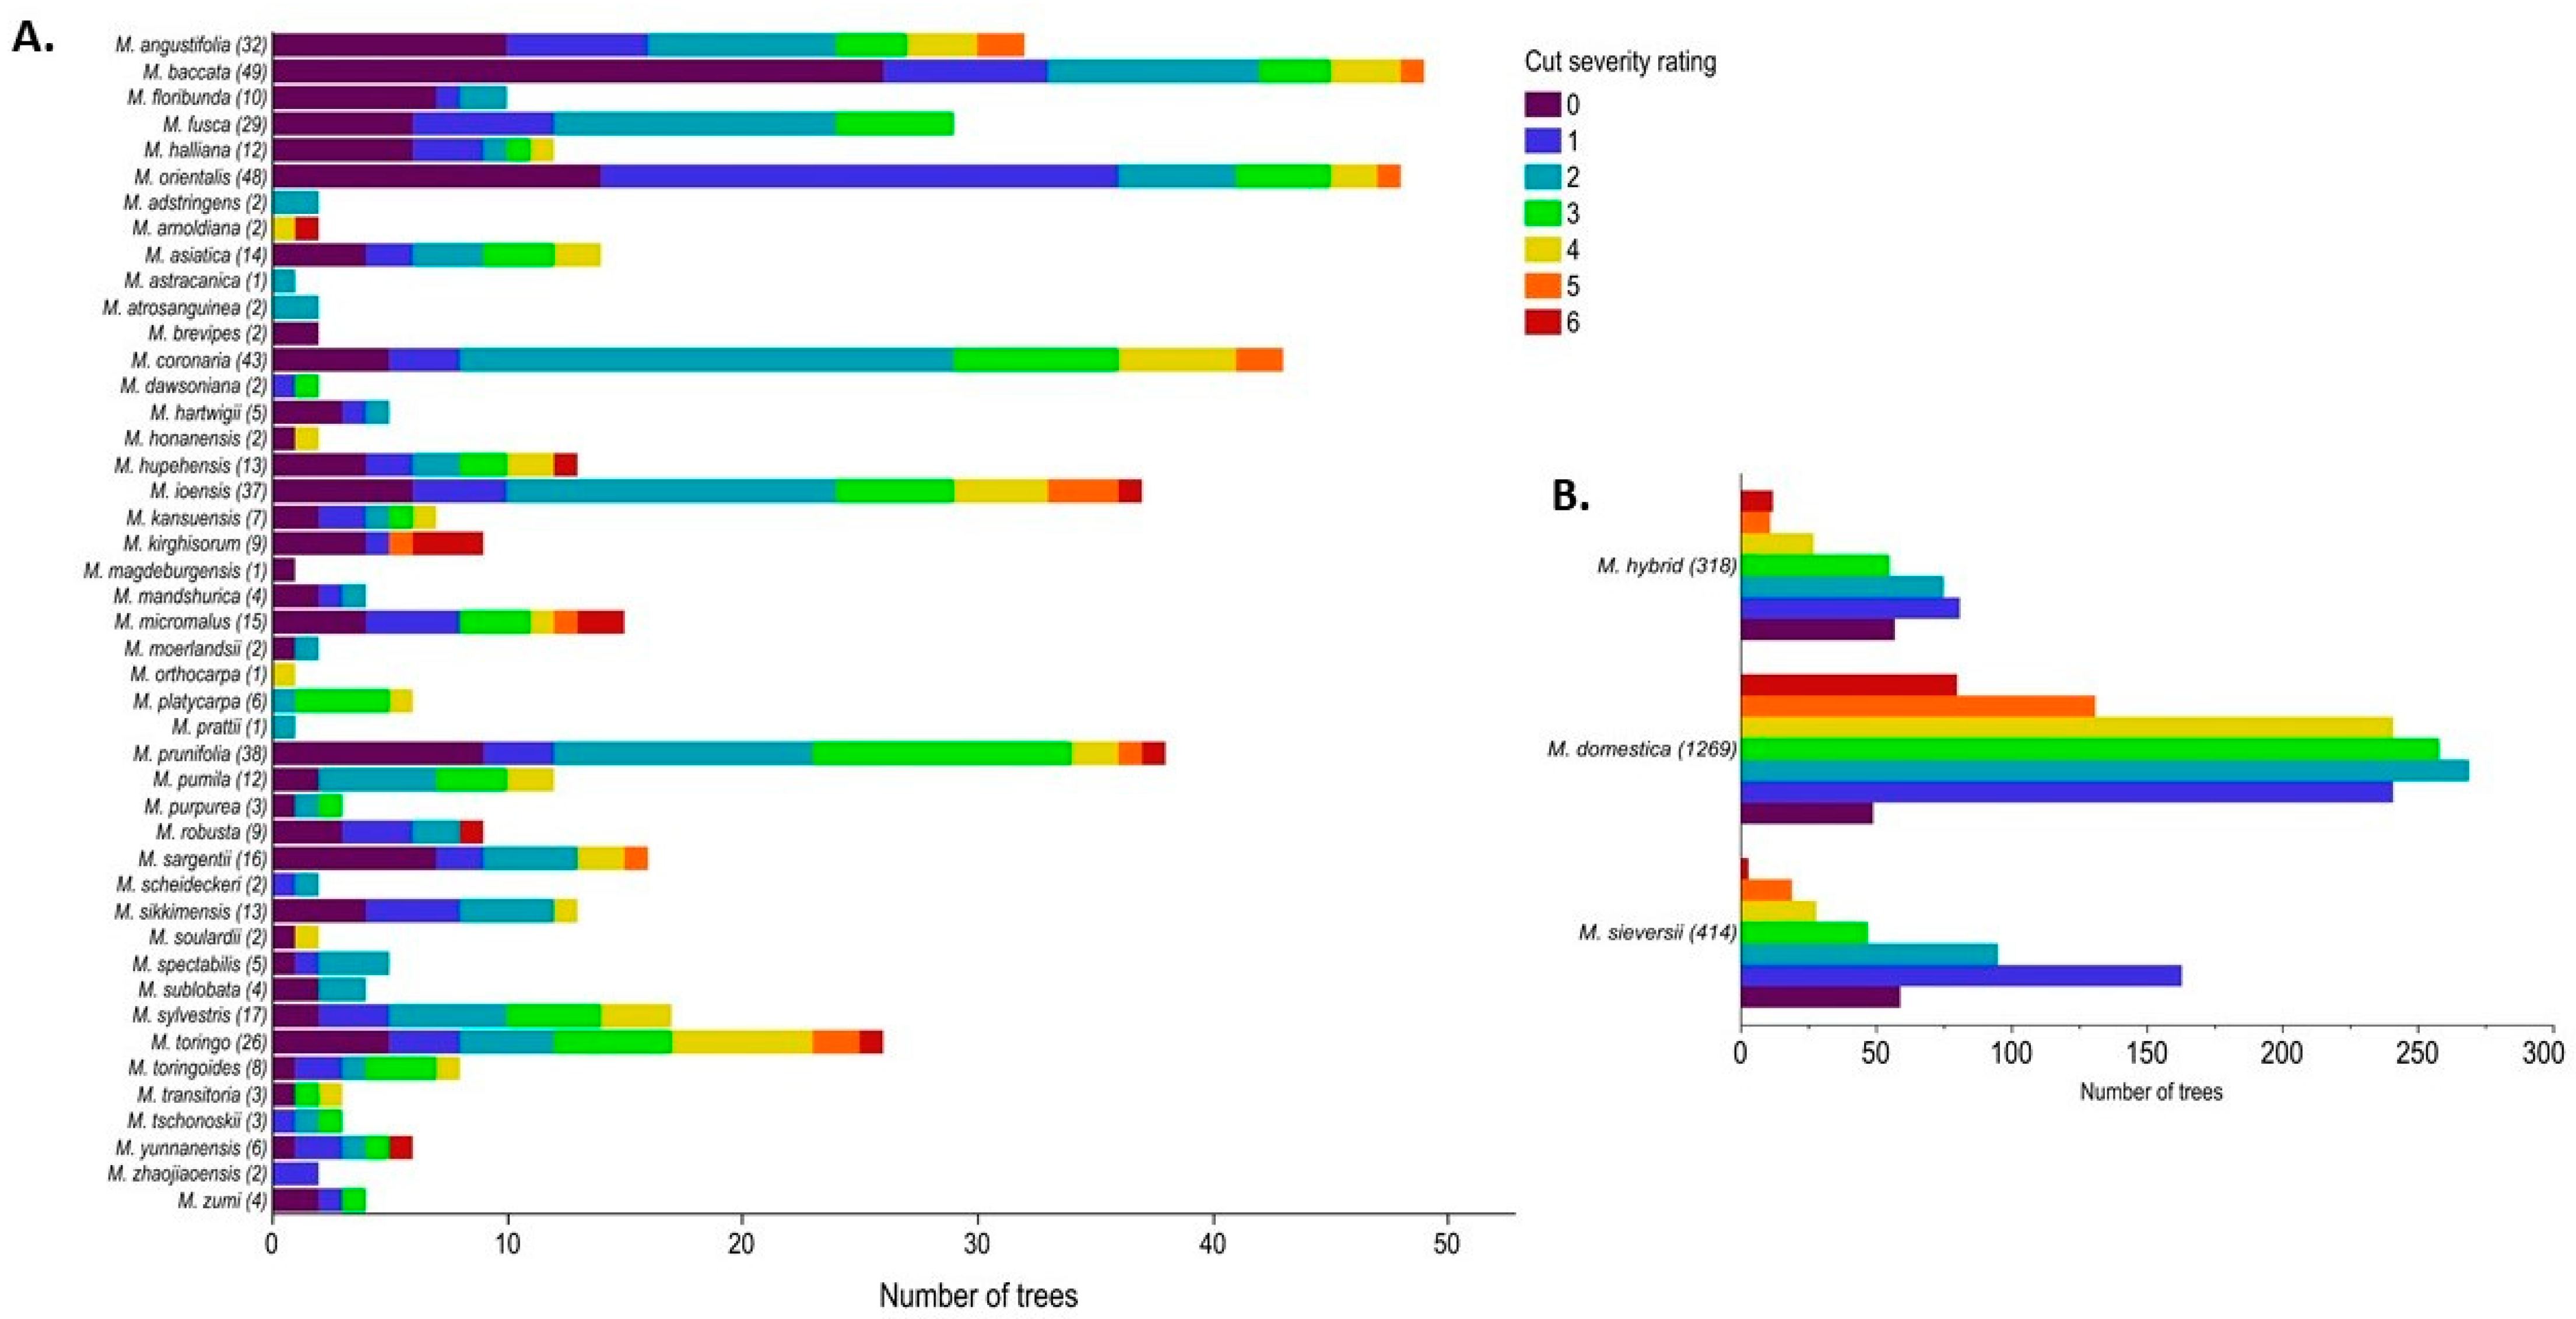
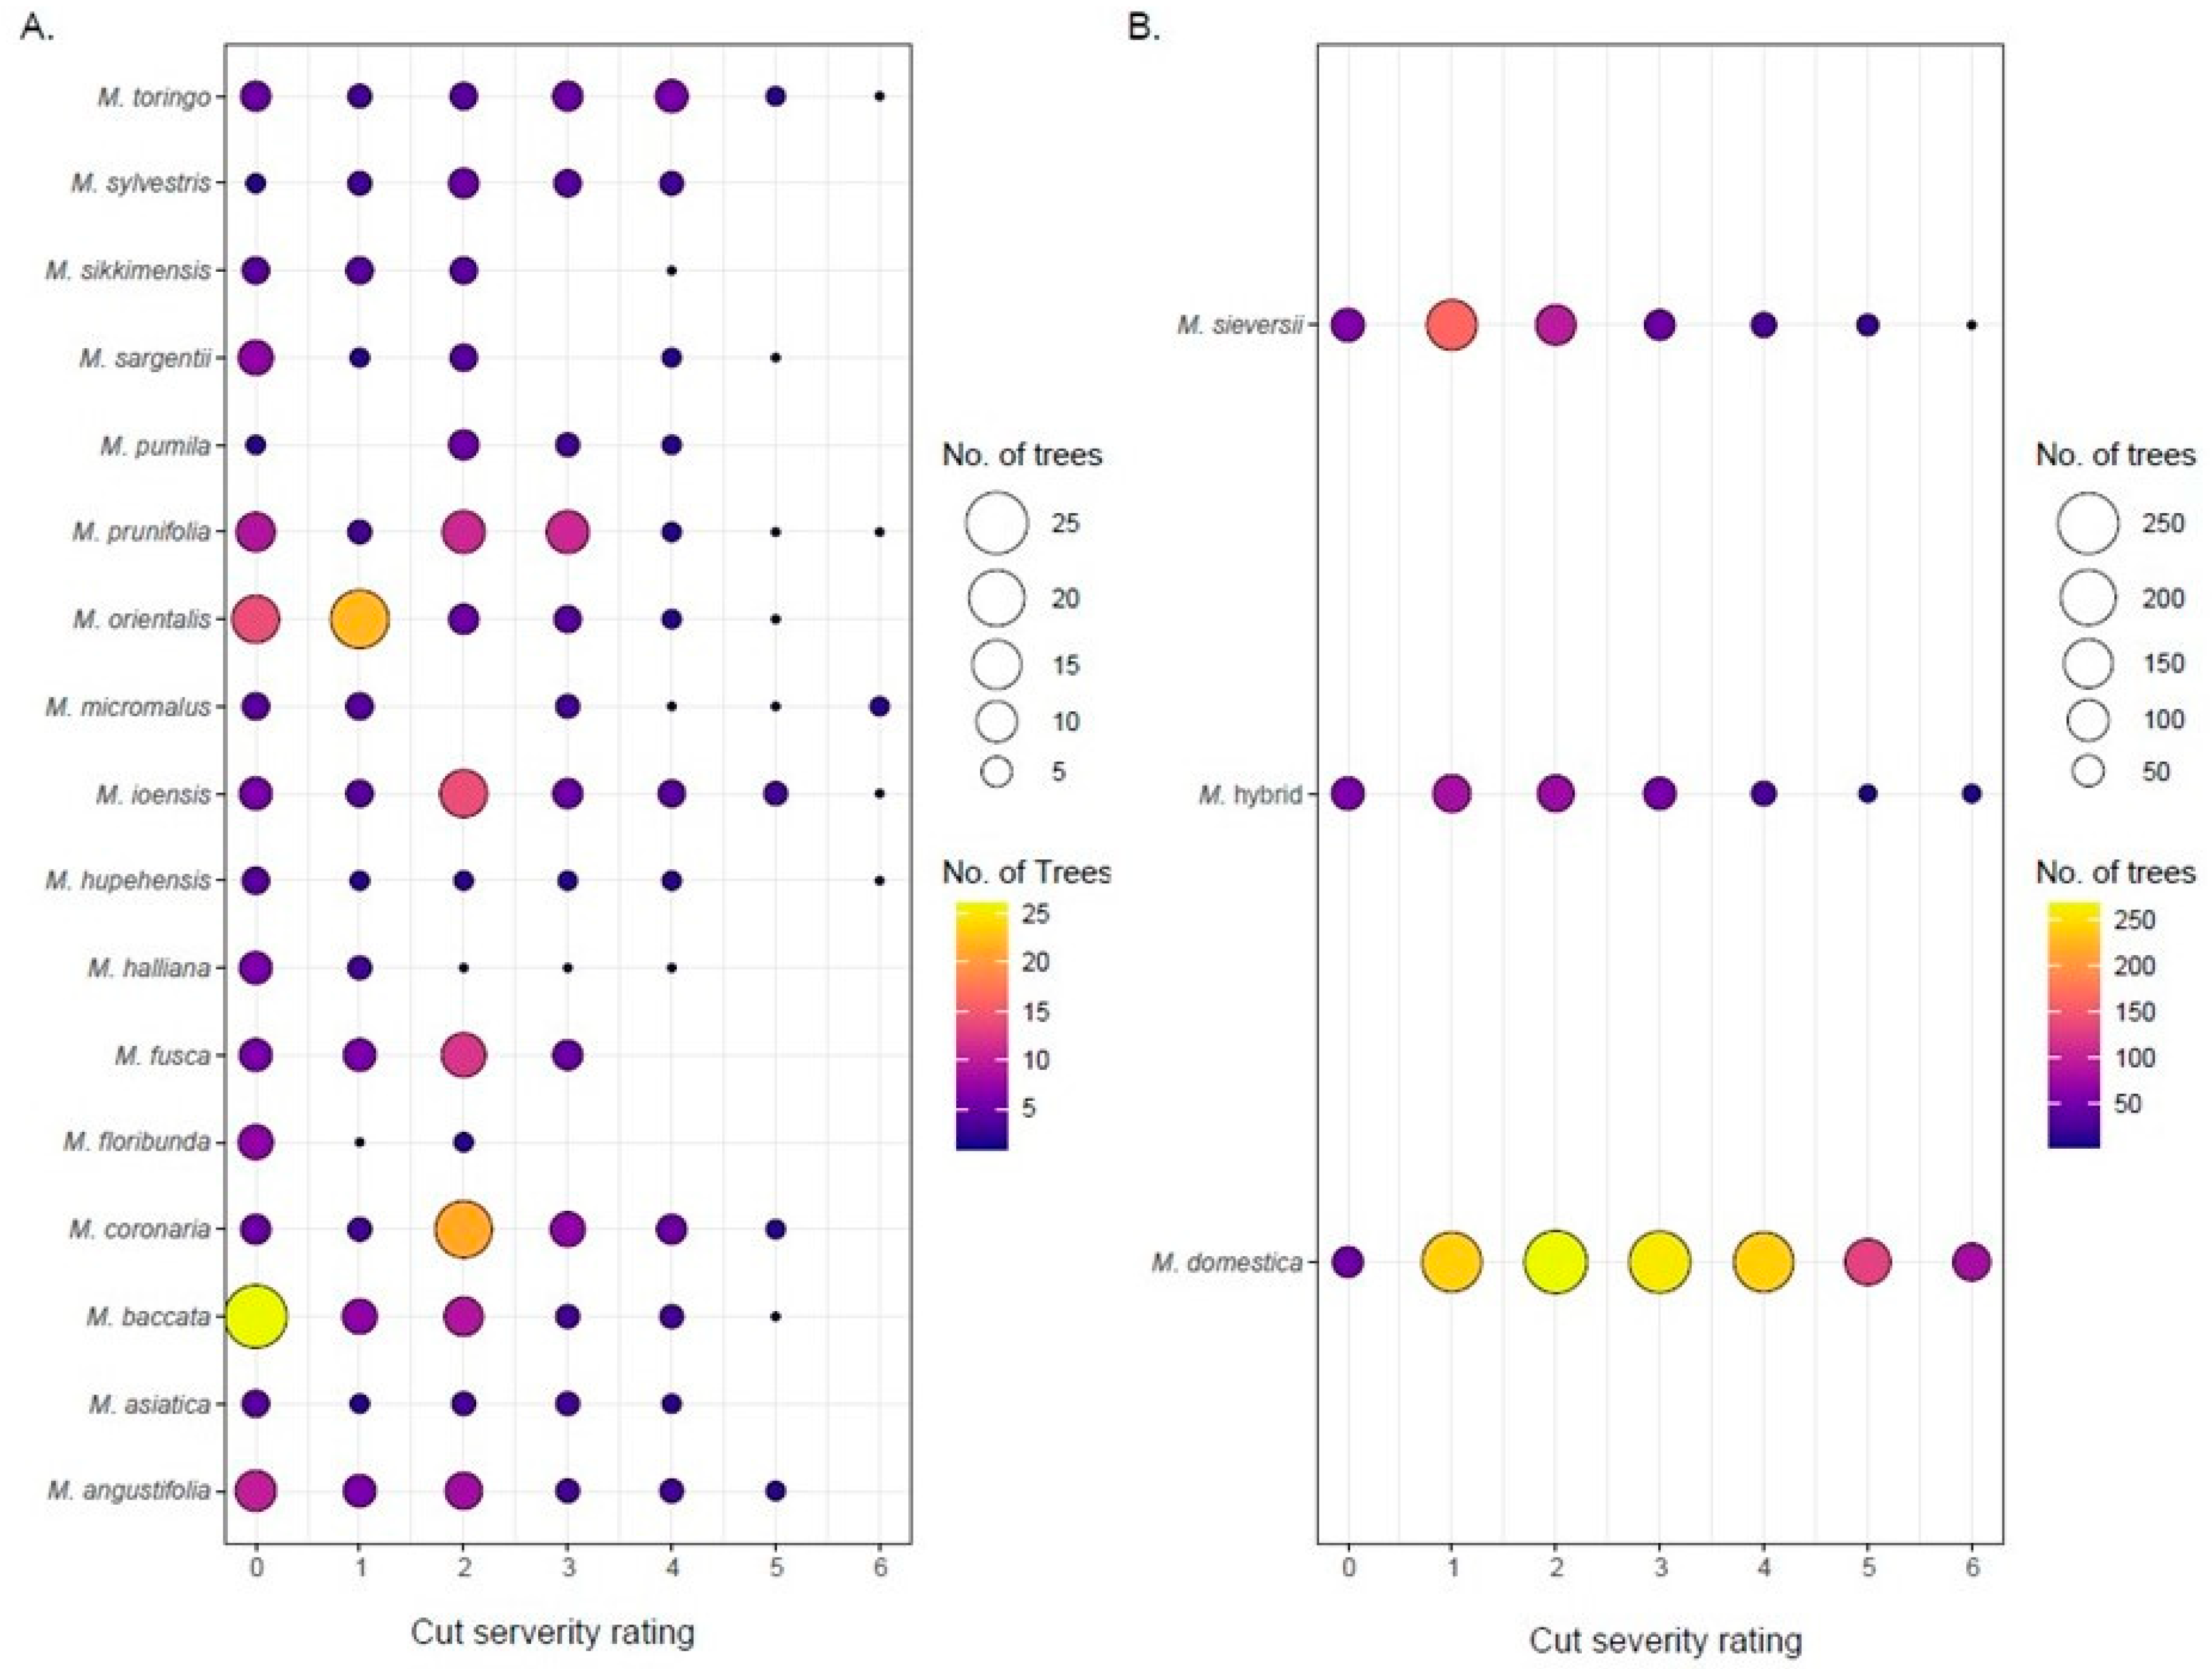
Cut severity was scored for 2525 trees in the main collection. A heat map of cut severity ratings showed the heavy cut trees were randomly spread throughout the collection and not concentrated in clusters (Figure 6). To understand the distribution of cut ratings within species the frequency of the cut severity ratings was summarized (Figure 7). In total, 25% of the trees scored had cut severity ratings of four or higher indicating substantial cutting (Figure 2). There were 107 trees with rating of “6” and 75% of those were M. domestica. Additionally, 12.5% of the trees had a cut rating “0,” of which only 15.5% were M. domestica. Twenty of the forty-eight species rated that had 10 or more trees and were used for analysis (Figure 8). A Kruskal–Wallis test on cut severity data indicated that there were significant differences between species (p-value: 2.22 × 10−58). Dunn’s multiple comparison test with Bonferroni adjustment revealed fifteen significant comparisons (Table 2). Of those comparisons M. domestica (cut severity average 2.88) had a significantly higher cut severity rating than ten other species. M. baccata had significant differences compared to M. coronaria, M. hybrid, M. ioensis, and M. toringo. Lastly, M. orientalis and M. toringo were significantly different. Further observations highlighted species M. floribunda, M. fusca, M. halliana, M. sikkimensis, and M. sylvestris did not have any trees with cut severity ratings of “5” or “6” and much of the M. orientalis and M. baccata trees were rated between “0” and “2” (Figure 8A). Most of the M. domestica trees were rated between “1” and “4,” while most of the M. sieversii were rated between “1” and “3” (Figure 8B).
The correlation coefficient between shoot severity and cut severity in the main collection subset was 0.66 in July. When comparing the 1142 June severity dataset, 667 June/July severity subset and 2525 cut severity datasets in the main collection, M. domestica was significantly more susceptible than M. angustifolia, M. baccata, M. fusca, Malus hybrids, and M. sieversii in all datasets. M. coronaria, M. ioensis, and M. prunifolia were significantly less susceptible than M. domestica in the large 1142 June severity dataset and 667 severity subset, but not in the cut severity data. M. floribunda, M. halliana, M. orientalis, M. sargentii, and M. sikkimensis were significantly less susceptible to M. domestica only in the cut severity rating data. Only M. orientalis met the 10-or-more tree requirement for the 1142 June dataset, but did not meet the requirement in the 667 subset, while the others did not meet the 10 or more trees in the 1142 or 667 subset. Additionally, M. baccata was significantly more tolerant than Malus hybrids in all three datasets.
There were 76 trees in the main collection 667 tree subset that had fire blight severity ratings of 0% in both June and July. Of those 76 trees, 55 were also rated “0” for cut severity, which included 17 species. The most represented species with 0% average severity were M. sieversii (n = 17), M. baccata (n = 9) and M. angustifolia (n = 5).
4. Discussion
The USDA Malus collection in Geneva, NY is one of the largest and most genetically diverse of its kind. The 2020 fire blight outbreak provided a unique opportunity to evaluate the genetic diversity of the collection to the disease. Random pathogen distribution is an assumption of natural fire blight observations in an orchard system. To a large extent, a random distribution pattern was observed in our study. Furthermore, we observed only one strain, CRISPR profile 41:23:28, responsible for the outbreak. This is the same profile as the first streptomycin-resistant isolates identified in NY State in 2002 [14]. The random distribution nature and single strain involved made our observations valuable for assessing the genetic diversity of fire blight tolerance across different species in the Malus collection. However, there are some inherent limitations in this study. Because of the tremendous diversity in our Malus collection, trees in the orchard can have varying blooming dates, which may compromise the comparisons of fire blight severity across different species. Moreover, the number of trees for some of the species are too few and we must exercise caution for making statistical inferences in these cases. Furthermore, we applied Apogee® for controlling the outbreak [39] during the season, which is intended to limit disease progression in the orchard and likely affected the severity evaluation; however, this treatment was applied uniformly to the block. Despite of these challenges, we believe that the data we collected served the purpose well in providing a baseline of fire blight susceptibility or resistance in the USDA Malus collection.
We used two complementary methods to evaluate the trees for fire blight damage; shoot severity and cut severity ratings. The correlation coefficient between fire blight shoot severity (%) and cut severity was 0.66 in July for the 667 main collection subset. Given the correlation strength, we can infer that cut severity ratings are representative of the fire blight infection. Although shoot severity is more informative, cut severity is more rapid and does not conflict with pruning to maintain tree health. Within the main collection there were numerous instances where severely infected trees were neighboring trees with no observable infection (Figure 3B,C). Those trees with no infection may have resistance to fire blight and should be further investigated. In a previous study evaluating susceptibility of apple cultivars to fire blight, trees were grafted on M.111 rootstock and inoculated with E. amylovora strain Ea153n in 2016 and 2017. Trees were classified as highly resistant, moderately resistant, moderately susceptible, and highly susceptible to fire blight based on the necrotic lesion divided by the total shoot length [40]. Despite differences in rootstock, fire blight strain, and method to calculate severity, we observed similar trends of cultivar responses to the outbreak. For example, in Kostick et al. [40], ‘Arlet’ was classified as moderately resistant; we observed severity of 5.9% and 7.8% in June and July respectively for this cultivar on EMLA7 rootstock. Similarly, ‘Beacon’ was classified as highly susceptible; we observed severity of 68% and 69% in June and July for this variety on EMLA7 rootstock [40].
As seen with severity, we observed heavily cut trees next to the neighboring trees with no cuts (Figure 6). Trees with ratings of “0,” may be resistant to this strain of fire blight and those with cut ratings of “1” to “3” may be mildly resistant. In total, 12.5% of trees had no cuts and 62.7% of the trees had cut ratings of “1” to “3.” Previous studies have determined that M. domestica accessions ‘Liberty,’ ‘Empire,’ ‘Florina,’ ‘Novo Easygro,’ and ‘Cox’s Orange Pippin’ have fire blight resistance [40,41]. In our main collection, those accessions all had cut severity ratings of “2” or less indicating light or no infection. Additionally, in the core collection, ‘Liberty’ and ‘Novo Easygro’ had no fire blight incidence in either July assessment and the other listed accessions were under 2% shoot severity, except ‘Cox’s Orange Pippin’ that had 5.95% severity in early July and 7.44% severity in late July.
Rootstock has a significant impact on fire blight resistance of the scion. The USDA Malus collection initially used M.9 rootstock but converted to EMLA7 following several fire blight outbreaks [30]. The core collection on B.9 dwarfing rootstock had far less fire blight incidence than the main collection, with an average severity of 4.6% and 6.2% for the June and July assessment, respectively. The dwarfing nature of the B.9 root stock and Apogee® treatments may have contributed to the reduced fire blight observations in the core collection. In previous studies B.9 rootstock has shown high survival rates when infected with fire blight [42,43]. We observed weak correlations between disease severity among the EMLA7 and B.9 rootstocks with higher fire blight severity on EMLA7 grafted trees. One notable exception was highlighted in M. transitoria PI 589384 with a severity of 83.8% and 17.1% on B.9 and EMLA7 rootstocks, respectively. Disease response × rootstock effects are likely confounded by random distribution of the pathogen and more controlled evaluations are needed.
Fire blight resistance QTLs have been identified in the wild species M. arnoldiana, M. baccata, M. robusta, M. fusca, and M. floribunda [20,28,29,44,45]. In this study we observed significant differences when comparing M. domestica to M. baccata, M. fusca, and M. floribunda. However, no significant differences between M. domestica and M. robusta or M. arnoldiana were observed and may have been due to low numbers of M. robusta and M. arnoldiana trees included in the analysis. The North American species M. fusca, M. ioensis, M. coronaria, and M. angustifolia were all significantly more tolerant to fire blight than M. domestica in at least two of the datasets, however M. angustifolia was the only one significantly more tolerant than M. domestica in all three datasets and could provide a new source of resistance deserving further evaluation. Previous studies have used limited numbers of M. angustifolia trees and to date no QTLs have been reported [46,47,48]. Additionally, M. halliana, M. orientalis, M. sargentii, and M. sikkimensis were all significantly more tolerant than M. domestica, based on cut severity ratings and may also be new sources for resistance although more severity data should be collected in the future. A report published in 1980 stated that five accessions of M. halliana were resistant to fire blight, but no additional information on how or why was provided [49]. The Malus collection contains four of the five accessions which had cut ratings of “0,” “0,” “1,” and “2,” although they were classified as Malus hybrids.
While most resistance has been discovered in wild species, the small fruit size and poor fruit quality present difficulties for gene introgression into commercial ready fruit [24]. In the collection we identified 49 M. domestica trees with no cuts and 59 M. sieversii trees with no cuts. These trees should be further investigated for potential sources of resistance. Previous studies have explored M. sieversii susceptibility to fire blight and found some accessions exhibit resistance [50,51]. M. sieversii trees have better fruit qualities than the other wild species and, given that they are a major progenitor species to the domesticated apple, they will be more suitable for breeding of commercial fruit [52,53].
This evaluation highlights the vulnerability of apple genetic resources to biotic and abiotic stress, while offering insight into fire blight resistance and susceptibility in the USDA Malus collection. Future preservation efforts for Malus should include advanced horticultural practices to mitigate disease pressure, but also leverage other approaches to safeguard genetic resources. During the 2020 fire blight outbreak, 326 accessions were severely diseased (cut severity “4” and above) and targeted for repropagation. Of those, 303 were also available as cryopreserved buds through the USDA-ARS National Laboratory for Genetic Resources Preservation in Fort Collins, Colorado, USA. Although field collections best facilitate access to woody plant germplasm, wild Malus seed banks and cryopreservation of scions safeguards allelic and clonal diversity against catastrophic loss. The streptomycin-resistant strain identified in the collection was never completely eradicated from orchards in Western New York. Prudent management and screening will be essential going forward to manage and prevent future outbreaks.
Supplementary Materials
The following are available online at https://0-www-mdpi-com.brum.beds.ac.uk/2073-4395/11/1/144/s1. Figure S1: Quantile box plot of fire blight severity for the main collection in late June 2020 by species. Figure S2: Main collection fire blight severity in late June in species with >10 trees. Table S1: Primers used for E. amylovora characterization. Table S2: Significant pairwise comparisons between species with 10 or more trees.
Author Contributions
Conceptualization, L.D., A.W., K.C., G.-Y.Z., and B.G.; data curation, L.D. and B.G.; formal analysis, L.D. and B.G.; investigation, L.D., A.W., and B.G.; methodology, L.D., A.W., and K.C.; visualization, L.D.; writing—original draft, L.D.; writing—review and editing, L.D., A.W., K.C., G.-Y.Z., and B.G. All authors have read and agreed to the published version of the manuscript.
Funding
This project was funded by the USDA-ARS Plant Genetic Resources Unit, Geneva, NY.
Institutional Review Board Statement
Not applicable.
Informed Consent Statement
Not applicable.
Data Availability Statement
Fire blight data will be available through the Genetic Resources Information Network (GRIN-Global) under the APPLE crop descriptors https://npgsweb.ars-grin.gov/gringlobal/descriptors.
Acknowledgments
We acknowledge USDA-ARS Northeast Area Summer Research Intern, Molly Dexter, for data collection. We are grateful to John Keeton, Bob Martens, Reece Perrin, Jackson Bartell, and David Osborne for field support.
Conflicts of Interest
Authors declare no conflict of interest.
References
- USDA-NASS. Noncitrus Fruits and Nuts 2018 Summary. 2019. Available online: https://www.nass.usda.gov/Publications/Todays_Reports/reports/ncit0619.pdf (accessed on 4 December 2020).
- Thomson, S.V. Epidemiology of fire blight. In Fire Blight: The Disease and its Causative Agent, Erwinia Amylovora; CAVI Publishing: Wallingfort, UK, 2000; pp. 9–37. [Google Scholar]
- Norelli, J.L.; Jones, A.L.; Aldwinckle, H.S. Fire blight management in the twenty-first century: Using new technologies that enhance host resistance in apple. Plant Dis. 2003, 87, 756–765. [Google Scholar] [CrossRef] [PubMed] [Green Version]
- Wallis, A.E.; Cox, K.D. Management of fire blight using pre-bloom application of prohexadione-calcium. Plant Dis. 2020, 104, 1048–1054. [Google Scholar] [CrossRef] [PubMed]
- Longstroth, M. The 2000 fire blight epidemic in southwest Michigan apple orchards. Compact Fruit Tree 2001, 34, 16–19. [Google Scholar]
- Van Der Zwet, T.; Orolaza-Halbrendt, N.; Zeller, W. Chapter 14: Chemical and Cultural Approaches to Enhancing Host Resistance to Fire Blight. In Fire Blight: History, Biology, and Management; Scientific Societies: Saint Paul, MN, USA, 2016; pp. 249–263. [Google Scholar]
- Cabrefiga, J.; Francés, J.; Montesinos, E.; Bonaterra, A. Improvement of fitness and efficacy of a fire blight biocontrol agent via nutritional enhancement combined with osmoadaptation. Appl. Environ. Microbiol. 2011, 77, 3174–3181. [Google Scholar] [CrossRef] [PubMed] [Green Version]
- Ngugi, H.K.; Lehman, B.L.; Madden, L.V. Multiple treatment meta-analysis of products evaluated for control of fire blight in the eastern United States. Phytopathology 2011, 101, 512–522. [Google Scholar] [CrossRef] [PubMed]
- Sundin, G.W.; Werner, N.A.; Yoder, K.S.; Aldwinckle, H.S. Field evaluation of biological control of fire blight in the eastern United States. Plant. Dis. 2009, 93, 386–394. [Google Scholar] [CrossRef] [Green Version]
- Pusey, P.L. Biological control agents for fire blight of apple compared under conditions limiting natural dispersal. Plant. Dis. 2002, 86, 639–644. [Google Scholar] [CrossRef] [Green Version]
- Yoder, K.; Miller, S.; Byers, R. Suppression of fire blight in apple shoots by prohexadione-calcium following experimental and natural inoculation. HortScience 1999, 34, 1202–1204. [Google Scholar] [CrossRef] [Green Version]
- Maxson-Stein, K.; He, S.Y.; Hammerschmidt, R.; Jones, A.L. Effect of treating apple trees with acibenzolar-s-methyl on fire blight and expression of pathogenesis-related protein genes. Plant. Dis. 2002, 86, 785–790. [Google Scholar] [CrossRef] [Green Version]
- Brisset, M.-N.; Cesbron, S.; Thomson, S.V.; Paulin, J.-P. Acibenzolar-S-methyl induces the accumulation of defense-related enzymes in apple and protects from fire blight. Eur. J. Plant. Pathol. 2000, 106, 529–536. [Google Scholar] [CrossRef]
- Russo, N.L.; Burr, T.J.; Breth, D.I.; Aldwinckle, H.S. Isolation of streptomycin-resistant isolates of Erwinia amylovora in New York. Plant. Dis. 2008, 92, 714–718. [Google Scholar] [CrossRef] [PubMed] [Green Version]
- McGhee, G.C.; Guasco, J.; Bellomo, L.M.; Blumer-Schuette, S.E.; Shane, W.W.; Irish-Brown, A.; Sundin, G.W. Genetic analysis of streptomycin-resistant (SmR) strains of Erwinia amylovora suggests that dissemination of two genotypes is responsible for the current distribution of SmR E. amylovora in Michigan. Phytopathology 2011, 101, 182–191. [Google Scholar] [CrossRef] [PubMed] [Green Version]
- Miller, T.D. Monitoring the Epiphytic Population of Erwinia amylovora on pear with a selective medium. Phytopathology 1972, 62, 1175. [Google Scholar] [CrossRef]
- Loper, J.E. Evaluation of streptomycin, oxytetracycline, and copper resistance of Erwinia amylovora isolated from pear orchards in Washington State. Plant. Dis. 1991, 75, 287. [Google Scholar] [CrossRef]
- Khan, A.; Desnoues, E.; Clark, M. Bacterial strain affects cultivar response to fire blight in apples. Fruit Q. 2018, 26, 6. [Google Scholar]
- Malnoy, M.; Martens, S.; Norelli, J.L.; Barny, M.-A.; Sundin, G.W.; Smits, T.H.M.; Duffy, B. Fire blight: Applied genomic insights of the pathogen and host. Annu. Rev. Phytopathol. 2012, 50, 475–494. [Google Scholar] [CrossRef] [Green Version]
- Durel, C.-E.; Denancé, C.; Brisset, M.-N. Two distinct major QTL for resistance to fire blight co-localize on linkage group 12 in apple genotypes ‘Evereste’ and Malus floribunda clone 821. Genome 2009, 52, 139–147. [Google Scholar] [CrossRef]
- Le Roux, P.-M.F.; Khan, M.A.; Broggini, G.A.; Duffy, B.; Gessler, C.; Patocchi, A. Mapping of quantitative trait loci for fire blight resistance in the apple cultivars ‘Florina’ and ‘Nova Easygro’. Genome 2010, 53, 710–722. [Google Scholar] [CrossRef]
- Emeriewen, O.F.; Richter, K.; Berner, T.; Keilwagen, J.; Schnable, P.S.; Malnoy, M.; Peil, A. Construction of a dense genetic map of the Malus fusca fire blight resistant accession MAL0045 using tunable genotyping-by-sequencing SNPs and microsatellites. Sci. Rep. 2020, 10, 1–10. [Google Scholar] [CrossRef]
- Tegtmeier, R.; Pompili, V.; Singh, J.; Micheletti, D.; Silva, K.J.P.; Malnoy, M.; Khan, A. Candidate gene mapping identifies genomic variations in the fire blight susceptibility genes HIPM and DIPM across the Malus germplasm. Sci. Rep. 2020, 10, 1–12. [Google Scholar] [CrossRef]
- Peil, A.; Emeriewen, O.F.; Khan, A.; Kostick, S.; Malnoy, M. Status of fire blight resistance breeding in Malus. J. Plant. Pathol. 2020. [Google Scholar] [CrossRef]
- Vogt, I.; Wöhner, T.; Richter, K.; Flachowsky, H.; Sundin, G.W.; Wensing, A.; Savory, E.A.; Geider, K.; Day, B.; Hanke, M.-V.; et al. Gene-for-gene relationship in the host-pathogen system Malus × robusta 5-Erwinia amylovora. New Phytol. 2013, 197, 1262–1275. [Google Scholar] [CrossRef] [PubMed]
- Khan, M.A.; Duffy, B.; Gessler, C.; Patocchi, A. QTL mapping of fire blight resistance in apple. Mol. Breed. 2006, 17, 299–306. [Google Scholar] [CrossRef] [Green Version]
- Peil, A.; Garcia-Libreros, T.; Richter, K.; Trognitz, F.C.; Trognitz, B.; Hanke, M.-V.; Flachowsky, H. Strong evidence for a fire blight resistance gene of Malus robusta located on linkage group 3. Plant. Breed. 2007, 126, 470–475. [Google Scholar] [CrossRef]
- Peil, A.; Wöhner, T.; Hanke, M.-V.; Flachowsky, H.; Richter, K.; Wensing, A.; Emeriewen, O.; Malnoy, M.; Leroux, P.-M.; Patocchi, A.; et al. Comparative mapping of fire blight resistance in Malus. Acta Hortic. 2014, 47–51. [Google Scholar] [CrossRef]
- Emeriewen, O.F.; Richter, K.; Zini, E.; Malnoy, M.; Peil, A.; Hanke, M.-V. Fire blight resistance of Malus ×arnoldiana is controlled by a quantitative trait locus located at the distal end of linkage group 12. Eur. J. Plant. Pathol. 2017, 148, 1011–1018. [Google Scholar] [CrossRef]
- Forsline, P.; Aldwinckle, H. Natural occurrence of fire blight in USDA apple germplasm collection after 10 years of observation. Acta Hortic. 2002, 351–357. [Google Scholar] [CrossRef]
- Agnello, A.; Beown, B.; Carroll, J.; Cheng, L.; Cox, K.; Curtis, P.; Helms, M.; Kain, D.; Robinson, T. Cornell Pest Management Guidelines for Commercial Tree Fruit Production. Cornell Cooperative Extension. 2019. Available online: https://cropandpestguides.cce.cornell.edu/Preview/2019/Tree_Fruit_Promo_19.pdf (accessed on 4 December 2020).
- Crosse, J.E. A selective medium for and a definitive colony characteristic of Erwinia amylovora. Phytopathology 1973, 63, 1425. [Google Scholar] [CrossRef]
- Tancos, K.A.; Villani, S.; Kuehne, S.; Borejsza-Wysocka, E.; Breth, D.; Carol, J.; Aldwinckle, H.S.; Cox, K.D. Prevalence of streptomycin-resistant Erwinia amylovora in New York apple orchards. Plant. Dis. 2016, 100, 802–809. [Google Scholar] [CrossRef] [Green Version]
- McGhee, G.C.; Jones, A.L. Complete nucleotide sequence of ubiquitous plasmid pEA29 from Erwinia amylovora Strain Ea88: Gene organization and intraspecies variation. Appl. Environ. Microbiol. 2000, 66, 4897–4907. [Google Scholar] [CrossRef] [Green Version]
- Tancos, K.A.; Cox, K.D. Exploring diversity and origins of streptomycin-resistant Erwinia amylovora isolates in New York through CRISPR spacer arrays. Plant. Dis. 2016, 100, 1307–1313. [Google Scholar] [CrossRef] [PubMed] [Green Version]
- McGhee, G.C.; Sundin, G.W. Erwinia amylovora CRISPR elements provide new tools for evaluating strain diversity and for microbial source tracking. PLoS ONE 2012, 7, e41706. [Google Scholar] [CrossRef] [PubMed]
- Patil, I. ggstatsplot: “ggplot2” based plots with statistical details. CRAN 2018. Available online: https://CRAN.R-project.org/package=ggstatsplot (accessed on 4 December 2020). [CrossRef]
- R Core Team. R: A Language and Environment for Statistical Computing; R Foundation for Statistical Computing: Vienna, Austria, 2020; Available online: https://www.R-project.org/ (accessed on 4 December 2020).
- Aćimović, S.; Higgins, E.; Meredith, C. Effective post-infection programs of prohexadione-calcium for reducing shoot blight and preventing fire blight canker initiation on apple wood with cost-benefit analysis. Fruit Q. 2019, 27, 25–31. [Google Scholar]
- Kostick, S.A.; Norelli, J.L.; Evans, K. Novel metrics to classify fire blight resistance of 94 apple cultivars. Plant. Pathol. 2019, 68, 985–996. [Google Scholar] [CrossRef]
- Brown, S. Apple. In Fruit Breeding; Badenes, M.L., Byrne, D.H., Eds.; Springer: Boston, MA, USA, 2012; pp. 329–367. [Google Scholar]
- Ferree, D.C.; Schmid, J.; Bishop, B. Survival of apple rootstocks to natural infections of fire blight. HortTechnology 2002, 12, 239–241. [Google Scholar] [CrossRef] [Green Version]
- Bessho, H.; Brown, S.K.; Norelli, J.L.; Aldwinckle, H.S.; Cummins, J.N. Observations on the susceptibility of Japanese apple cultivars and rootstock selections to fire blight. J. Am. Pomol. Soc. 2001, 55, 120. [Google Scholar]
- Gardiner, S.E.; Norelli, J.; De Silva, N.H.; Fazio, G.; Peil, A.; Malnoy, M.; Horner, M.; Bowatte, D.; Carlisle, C.; Wiedow, C.; et al. Putative resistance gene markers associated with quantitative trait loci for fire blight resistance in Malus ‘Robusta 5’ accessions. BMC Genet. 2012, 13, 25. [Google Scholar] [CrossRef]
- Emeriewen, O.; Malnoy, M.; Richter, K.; Kilian, A.; Hanke, M.-V.; Peil, A. Evidence of a major QTL for fire blight resistance in the apple wild species Malus fusca. Acta Hortic. 2014, 289–293. [Google Scholar] [CrossRef]
- Aldwinckle, H.; Gustafson, H.; Forsline, P. Evaluation of the core subset of the USDA apple germplasm collection for resistance to fire blight. Acta Hortic. 1999, 269–272. [Google Scholar] [CrossRef]
- Khan, M.A.; Zhao, Y.; Korban, S. Identification of genetic loci associated with fire blight resistance in Malus through combined use of QTL and association mapping. Physiol. Plant. 2013, 148, 344–353. [Google Scholar] [CrossRef] [PubMed]
- Peil, A.; Bus, V.; Geider, K.; Richter, K.; Flachowsky, H.; Hanke, M.-V. Improvement of fire blight resistance in apple and pear. Int. J. Plant Breed. 2009, 3, 1–27. [Google Scholar]
- Lambe, R. Ornamental and Flower Diseases: Fire Blight of Ornamentals. Plant Disease and Control Notes. Virginia Polytechnic Institute and Statue University. 1980. Available online: https://vtechworks.lib.vt.edu (accessed on 4 December 2020).
- Harshman, J.M.; Evans, K.M.; Allen, H.; Potts, R.; Flamenco, J.; Aldwinckle, H.S.; Wisniewski, M.E.; Norelli, J.L. Fire blight resistance in wild accessions of Malus sieversii. Plant. Dis. 2017, 101, 1738–1745. [Google Scholar] [CrossRef] [PubMed]
- Fazio, G.; Aldwinckle, H.; Volk, G.; Richards, C.; Janisiewicz, W.; Forsline, P. Progress in evaluating Malus sieversii for disease resistance and horticultural traits. Acta Hortic. 2009, 59–66. [Google Scholar] [CrossRef]
- Duan, N.; Bai, Y.; Sun, H.; Wang, N.; Thomas, C.; Linyong, M.; Wang, X.; Jiao, C.; LeGall, N.; Mao, L.; et al. Genome re-sequencing reveals the history of apple and supports a two-stage model for fruit enlargement. Nat. Commun. 2017, 8, 1–11. [Google Scholar] [CrossRef]
- Sun, X.; Jiao, C.; Schwaninger, H.; Chao, C.T.; Ma, Y.; Duan, N.; Khan, A.; Ban, S.; Xu, K.; Cheng, L.; et al. Phased diploid genome assemblies and pan-genomes provide insights into the genetic history of apple domestication. Nat. Genet. 2020, 52, 1423–1432. [Google Scholar] [CrossRef]
Figure 1.
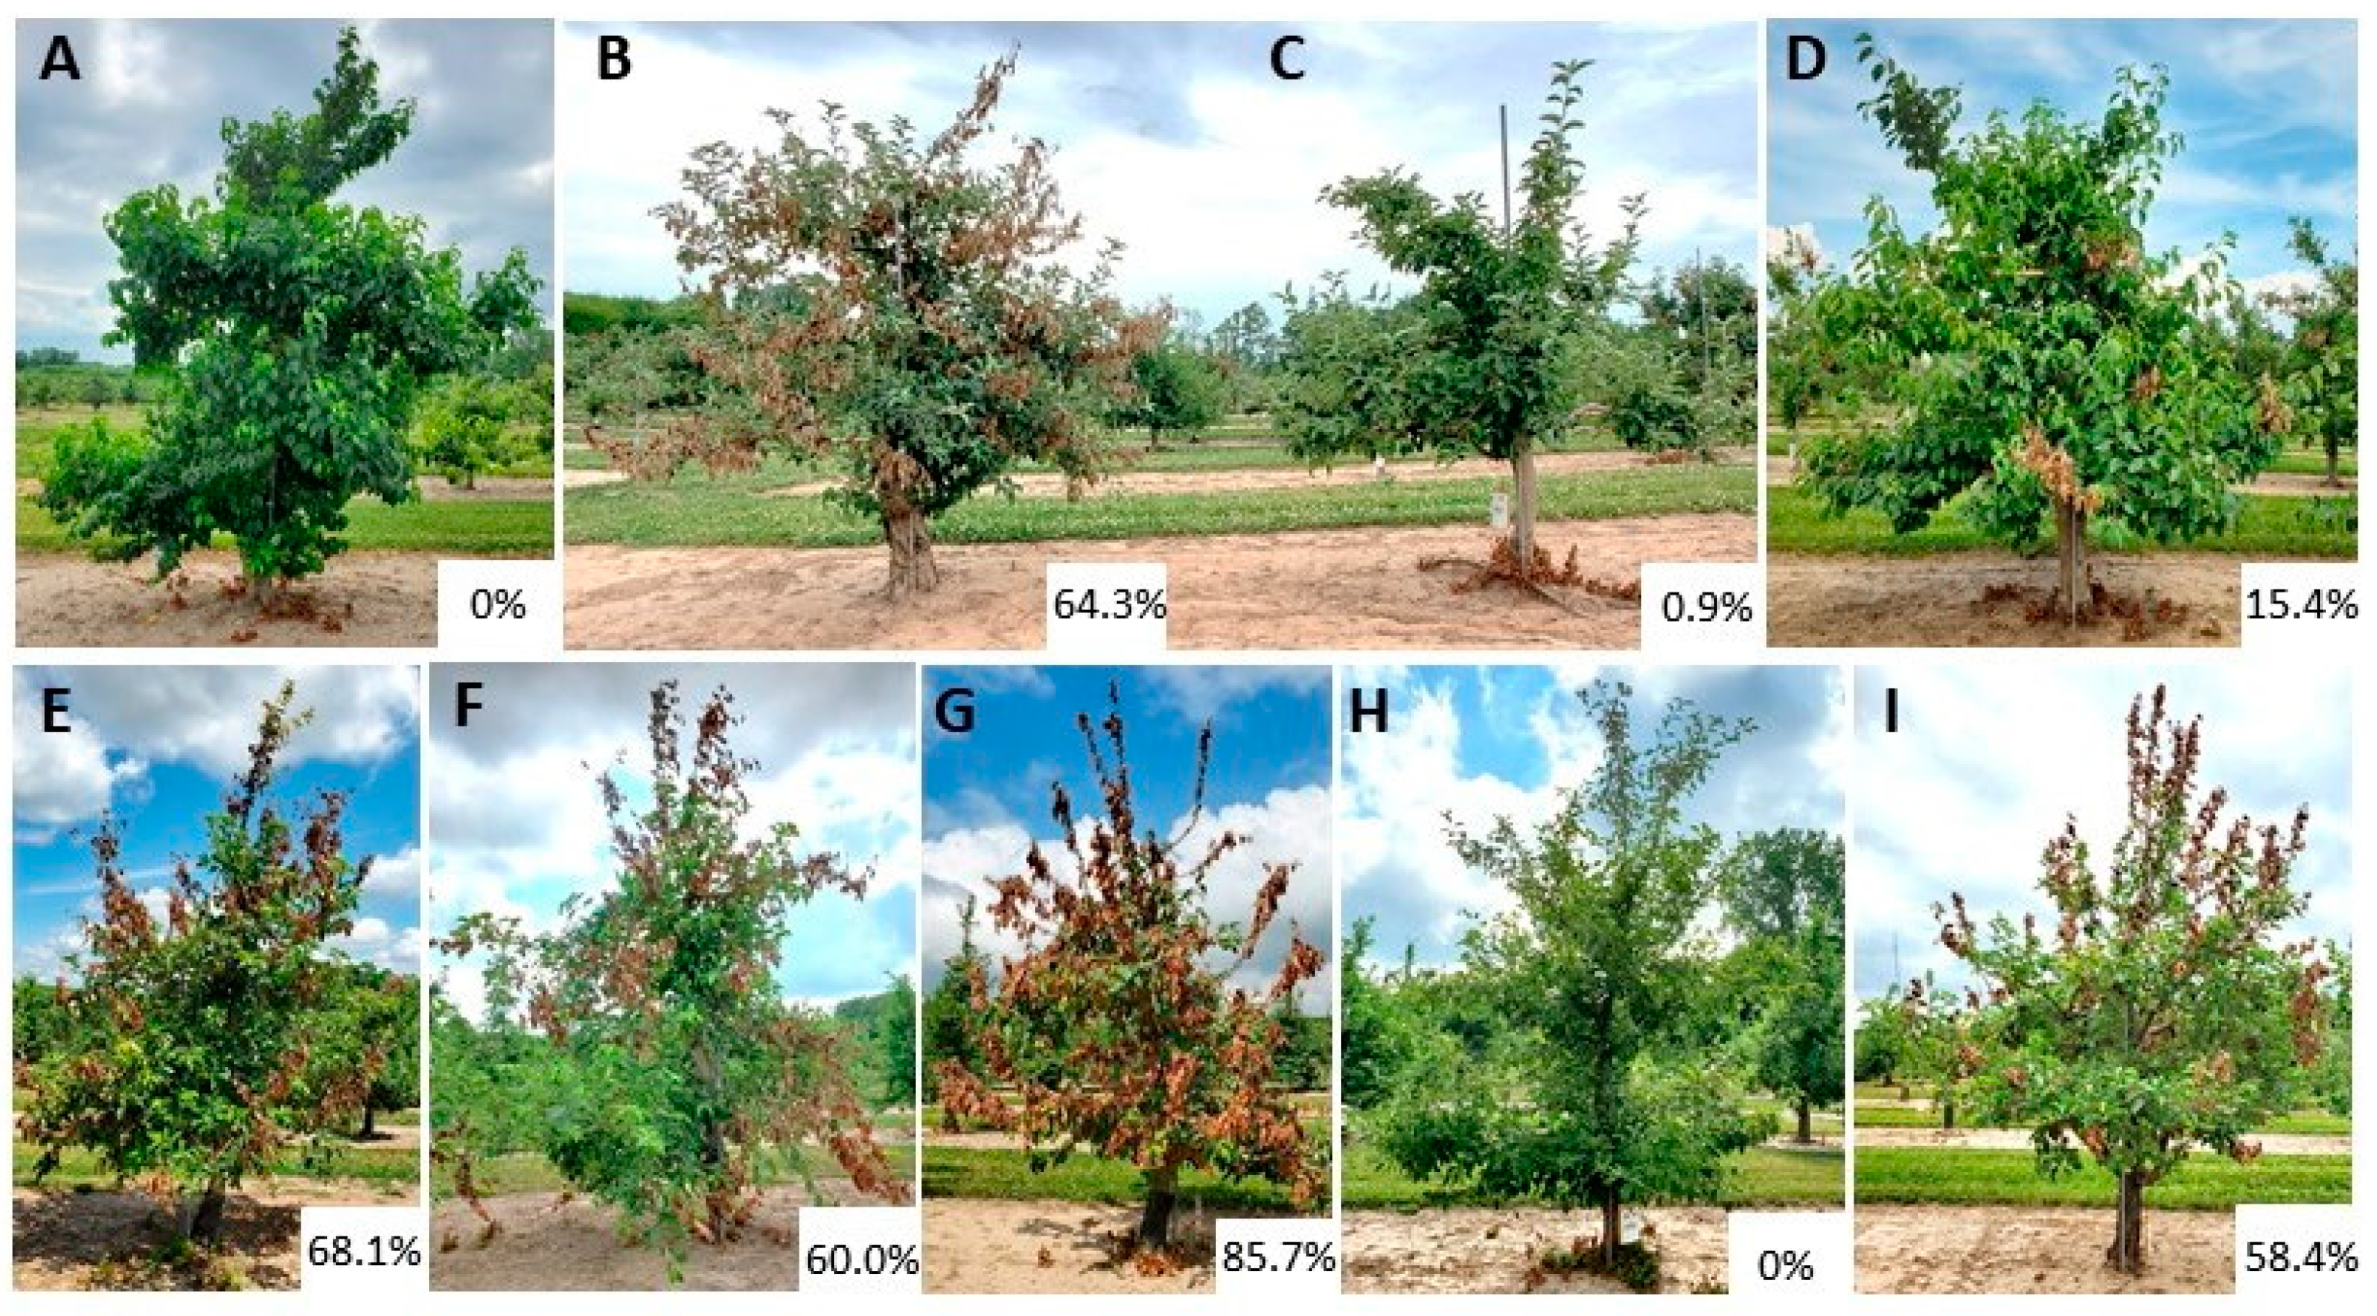
Examples of fire blight severity in the main collection. (A) Robusta 5 (M. robusta) (B) ‘Ribston’ (M. domestica) (C) ‘Honora’ (M. domestica) (D) ‘Sugar crab’ (Malus hybrid) (E) ‘Royal Gala’ (M. domestica) (F) KAZ 96 08-17 (M. sieversii) (G) ‘Skryzhapel’ (M. domestica) (H) GMAL 3173 (M. baccata) (I) ‘John Standish’ (M. domestica). The fire blight severity percentages are shown in bottom right of each panel. Pictures were taken during the initial fire blight scoring in late June 2020.
Figure 1.
Examples of fire blight severity in the main collection. (A) Robusta 5 (M. robusta) (B) ‘Ribston’ (M. domestica) (C) ‘Honora’ (M. domestica) (D) ‘Sugar crab’ (Malus hybrid) (E) ‘Royal Gala’ (M. domestica) (F) KAZ 96 08-17 (M. sieversii) (G) ‘Skryzhapel’ (M. domestica) (H) GMAL 3173 (M. baccata) (I) ‘John Standish’ (M. domestica). The fire blight severity percentages are shown in bottom right of each panel. Pictures were taken during the initial fire blight scoring in late June 2020.

Figure 2.
A visual representation of cut severity ratings with score and general description below each image.
Figure 2.
A visual representation of cut severity ratings with score and general description below each image.

Figure 3.
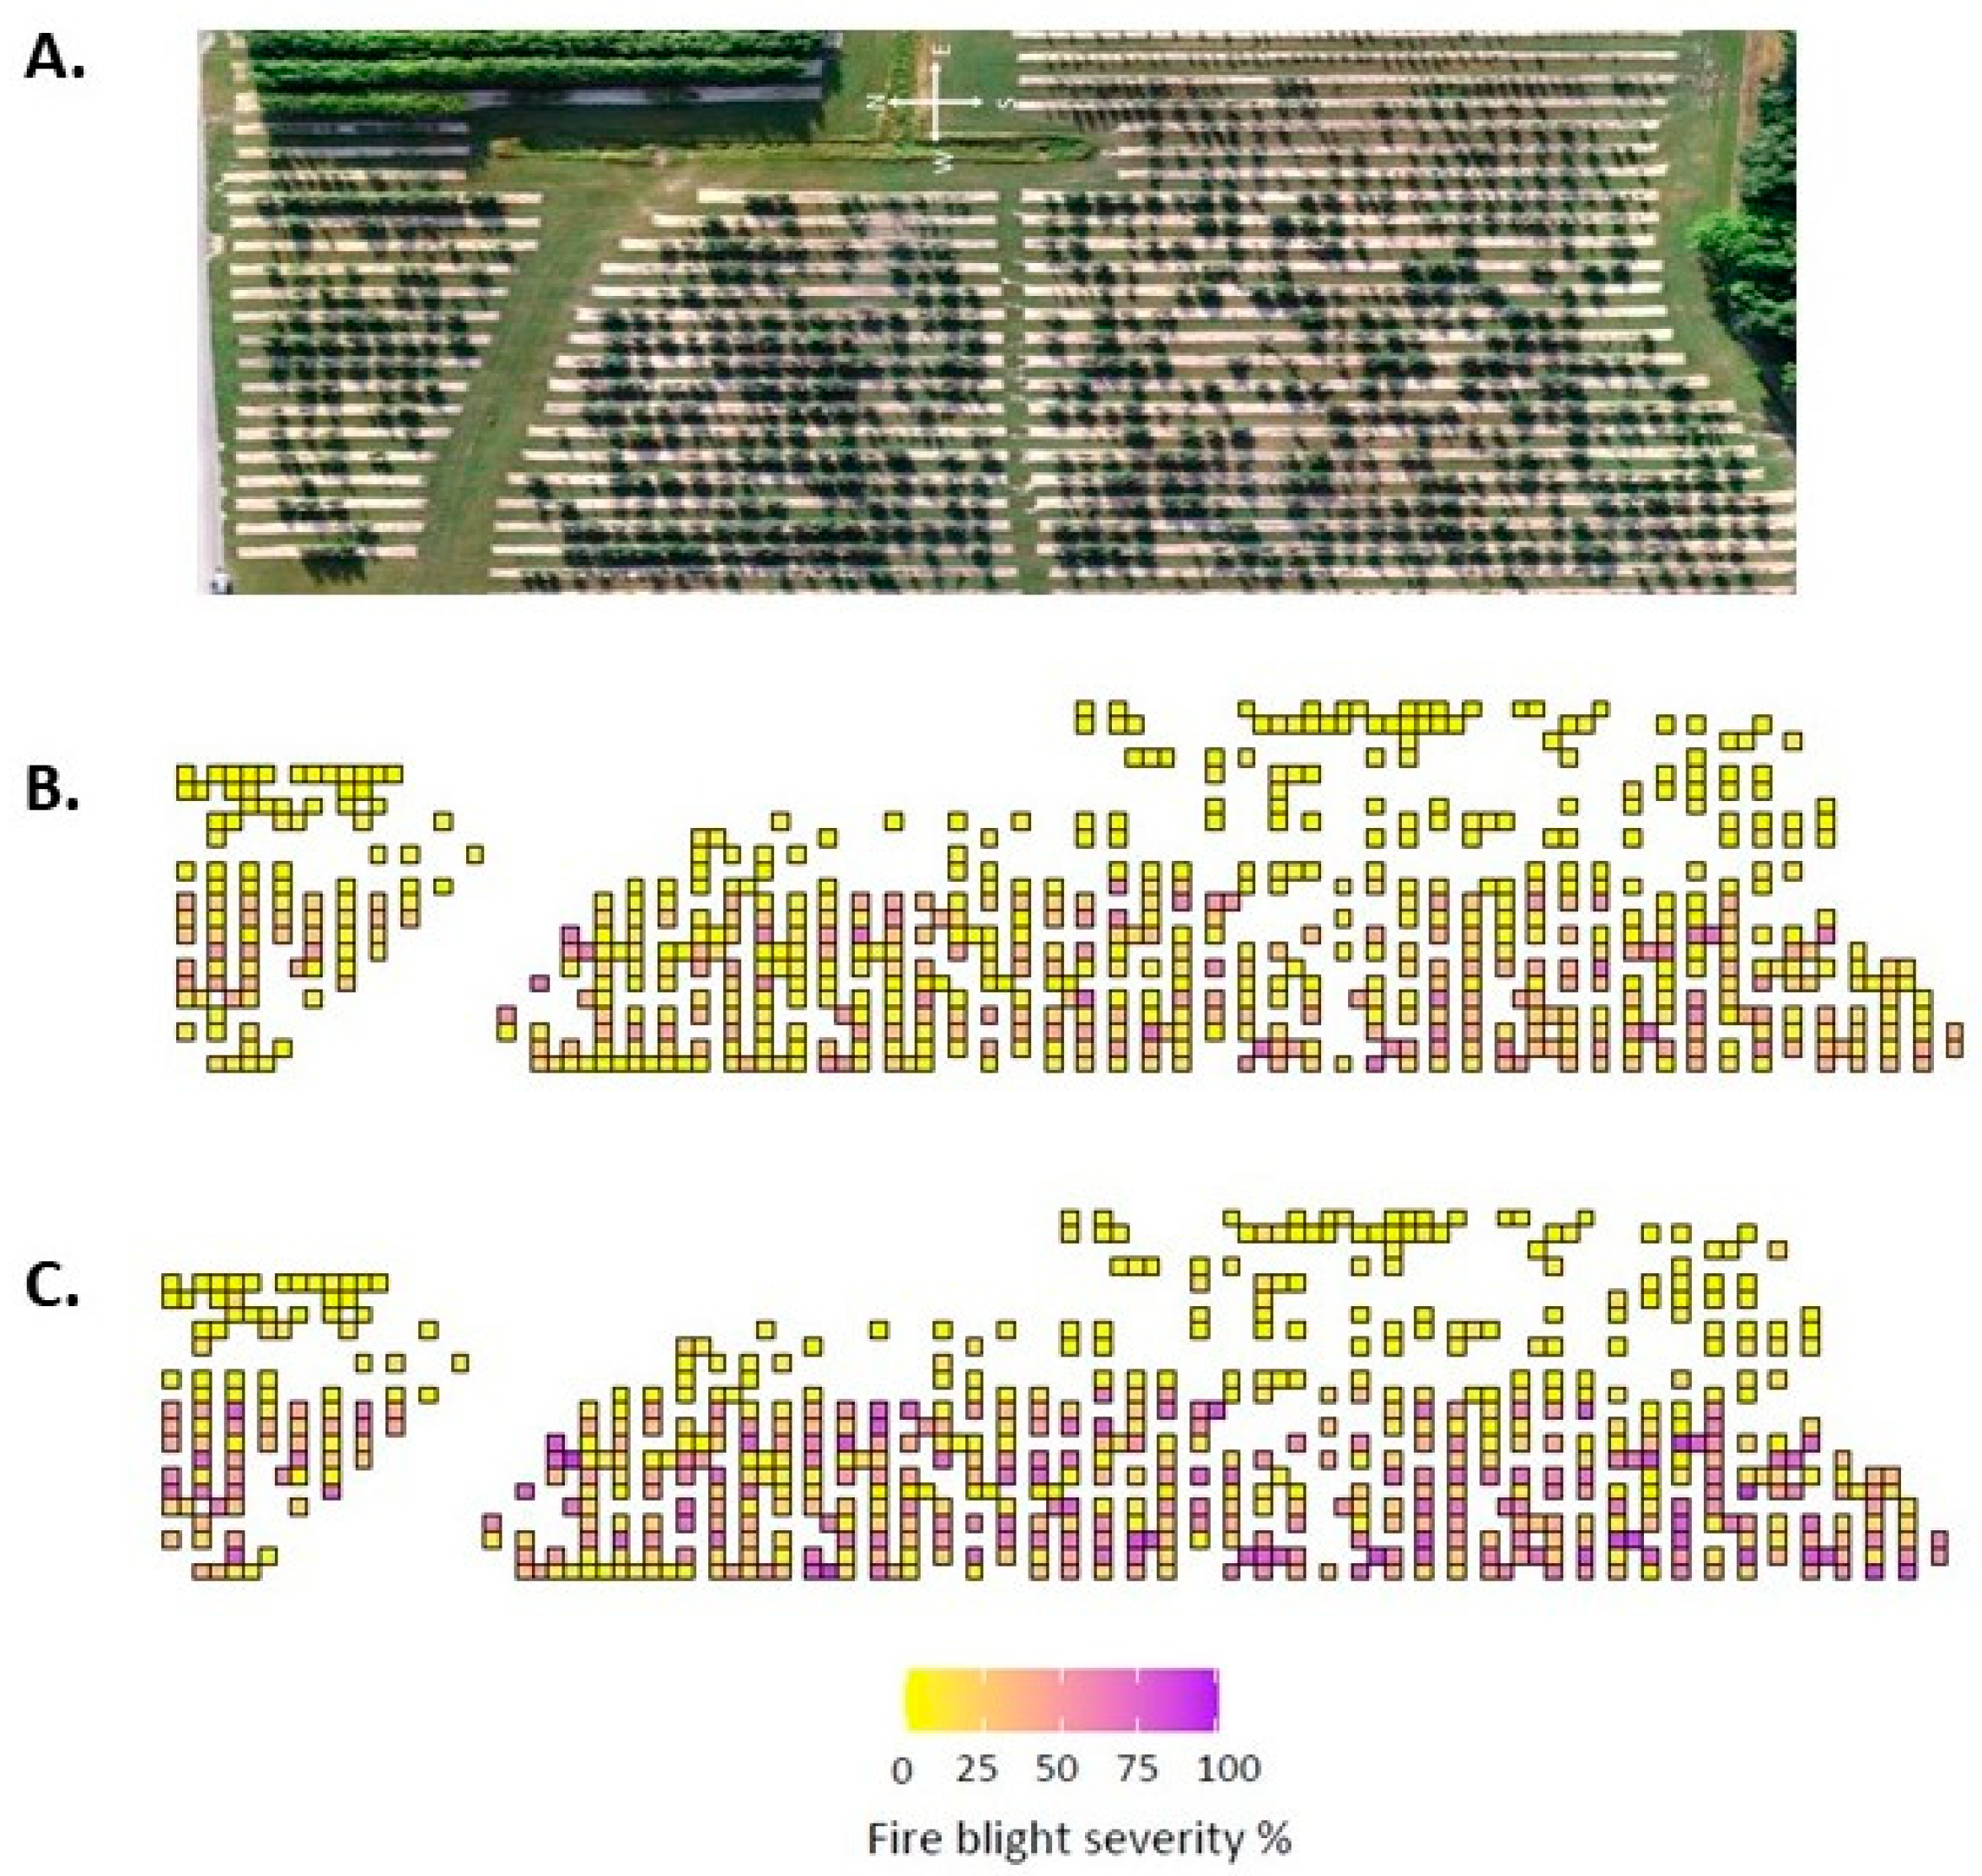
Heat map of fire blight severity for the 667-tree main collection subset. (A) Aerial image of the field. (B) Initial severity average in late June. (C) Severity average 3 weeks later, mid-July. Each square represents a tree. The compass in A. shows the cardinal directions of the field. Fire blight average severity calculated as (number of infected shoots/total number of shoots) × 100 for the west and east facing side of the tree, then averaged together.
Figure 3.
Heat map of fire blight severity for the 667-tree main collection subset. (A) Aerial image of the field. (B) Initial severity average in late June. (C) Severity average 3 weeks later, mid-July. Each square represents a tree. The compass in A. shows the cardinal directions of the field. Fire blight average severity calculated as (number of infected shoots/total number of shoots) × 100 for the west and east facing side of the tree, then averaged together.

Figure 4.
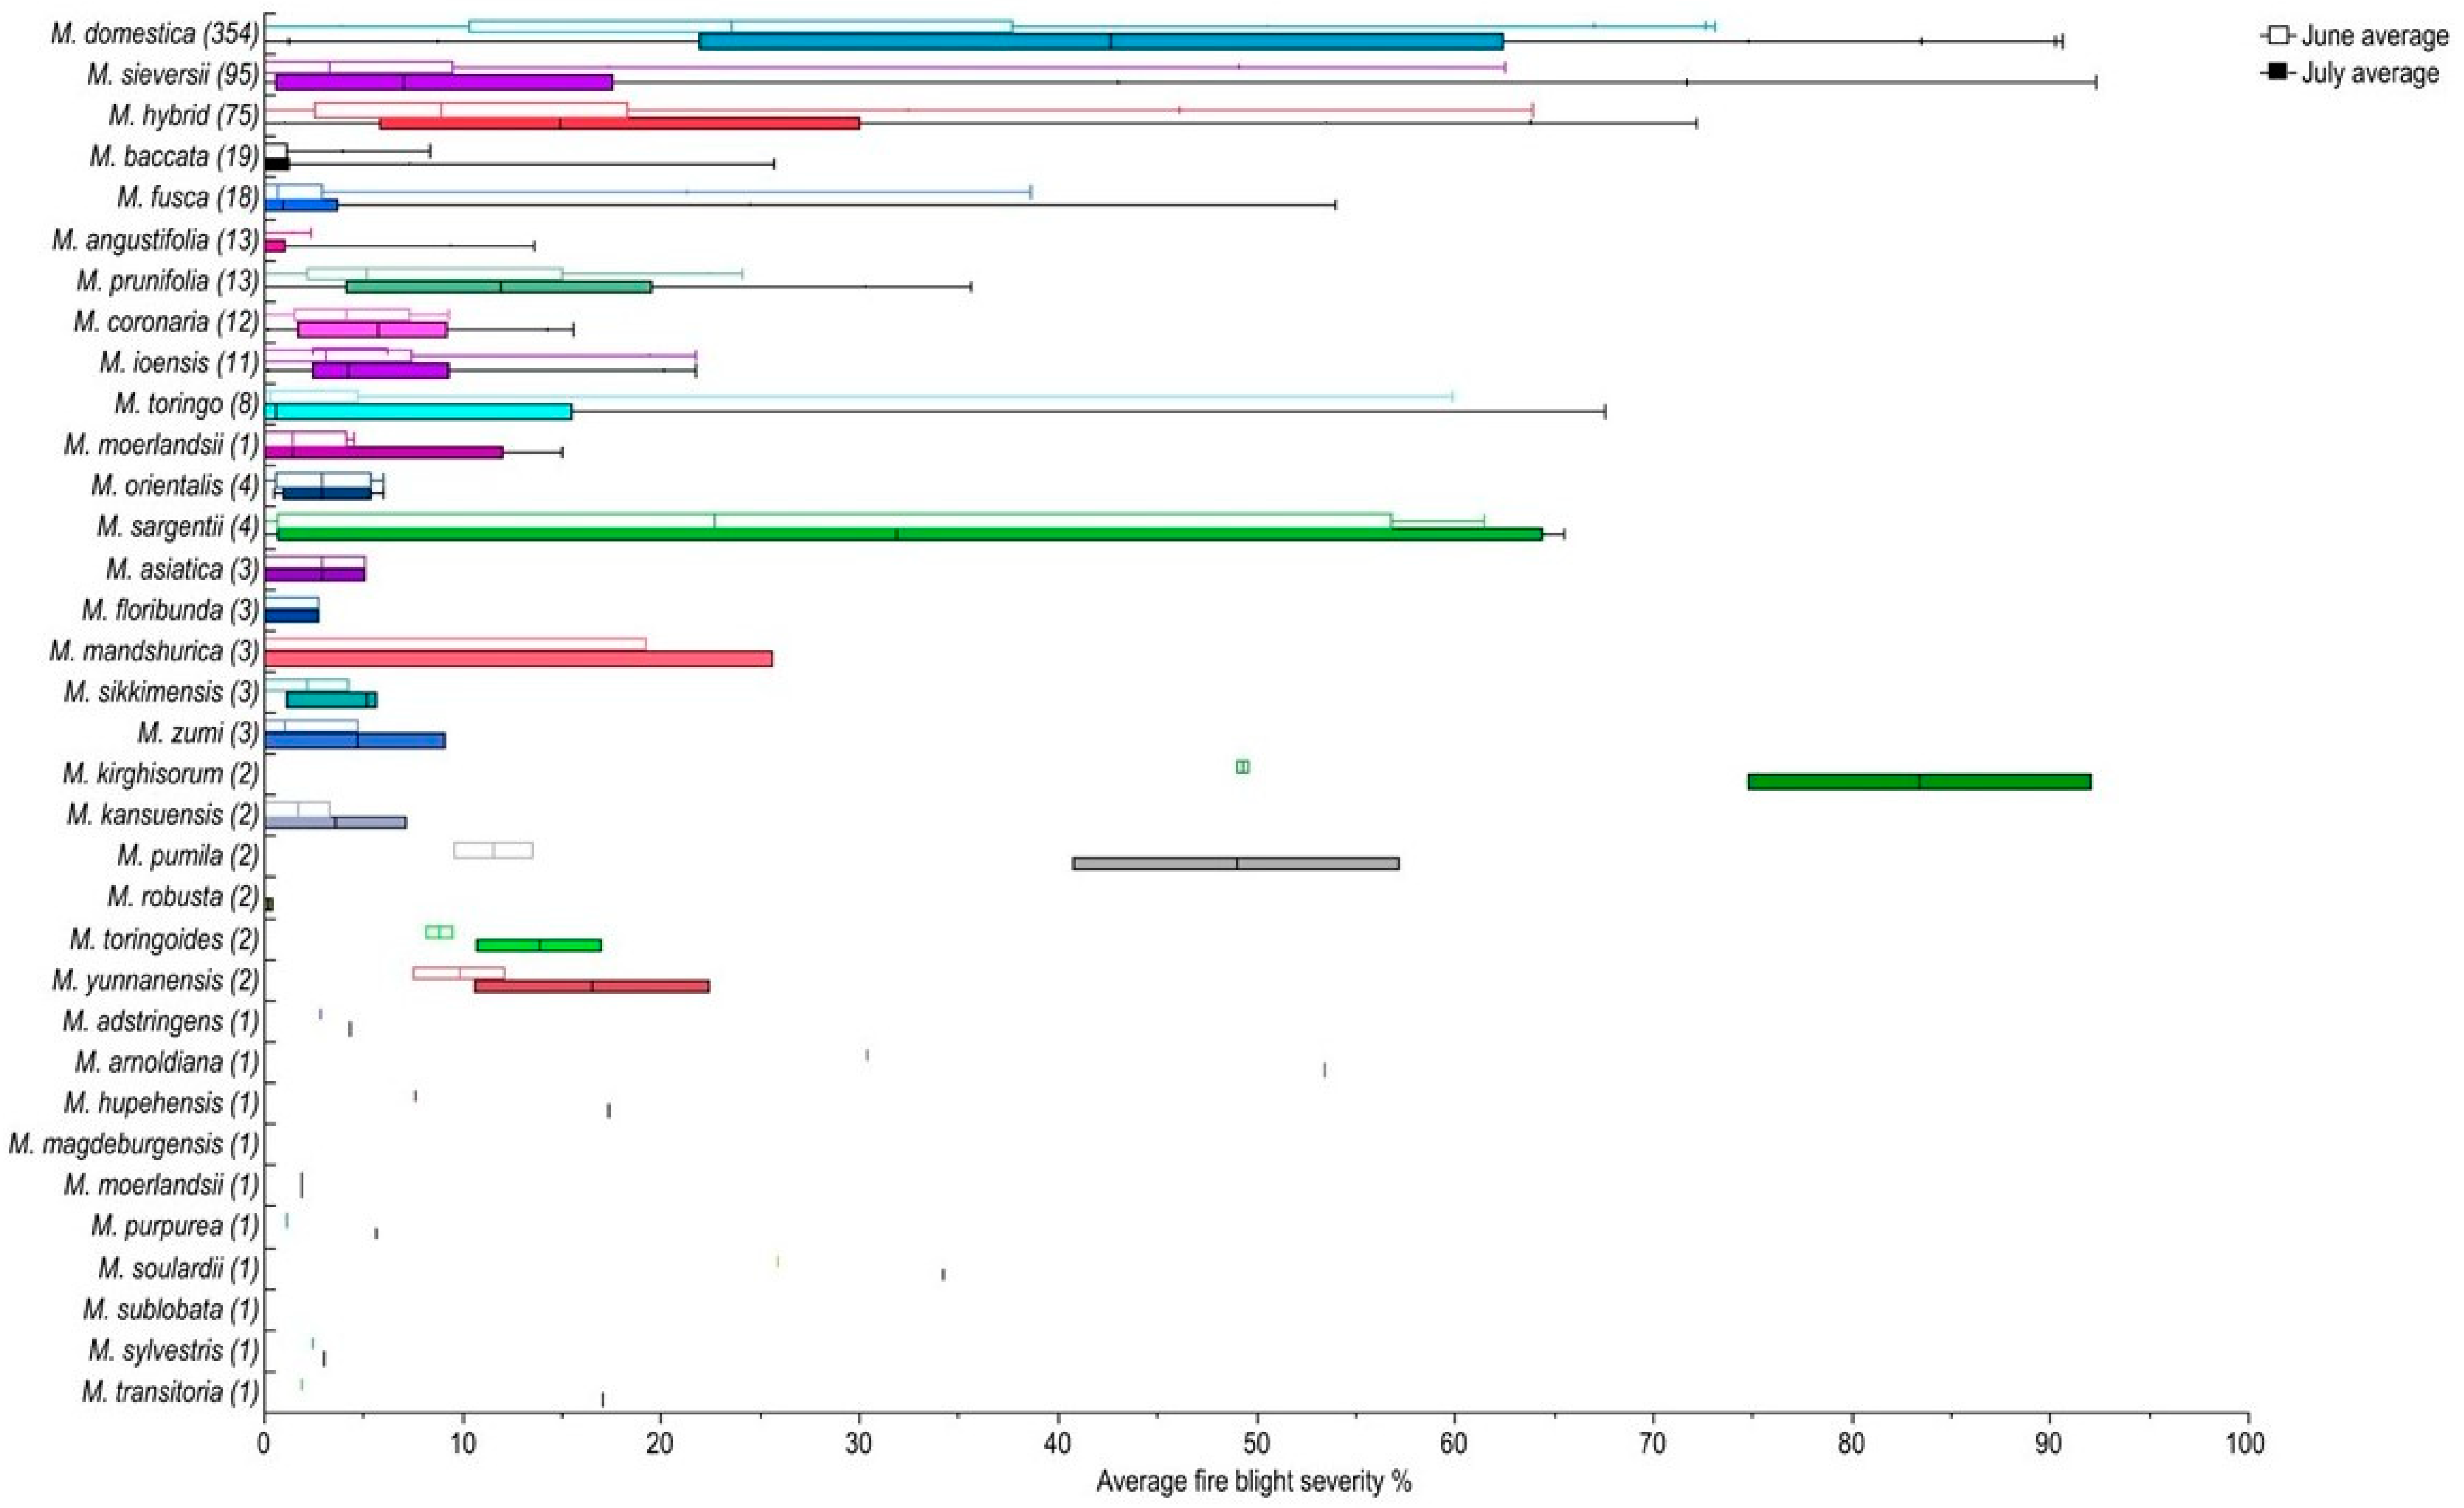
Quantile box plots of 667 main collection subset scored for fire blight severity in June and July. June is shown as open bars and July is shown as filled bars. The box indicates the 25th and 75th quantile and the median is shown as a colored line in the June box and a black line in the July box. The number of trees scored per species is shown in parenthesis. Species are ordered by descending tree count. Box plot colors delimitate species.
Figure 4.
Quantile box plots of 667 main collection subset scored for fire blight severity in June and July. June is shown as open bars and July is shown as filled bars. The box indicates the 25th and 75th quantile and the median is shown as a colored line in the June box and a black line in the July box. The number of trees scored per species is shown in parenthesis. Species are ordered by descending tree count. Box plot colors delimitate species.

Figure 5.
Main collection fire blight severity (%) in June (left) and July (right). The color and size of the circles indicates the number of trees. Only species with 10 or more trees are included in this figure.
Figure 5.
Main collection fire blight severity (%) in June (left) and July (right). The color and size of the circles indicates the number of trees. Only species with 10 or more trees are included in this figure.

Figure 6.
Heatmap of the main collection for cut severity ratings. Each tree is represented by a small box. Heavy cutting is observed throughout the orchard. White areas indicate no tree present. The cardinal directions of the field are shown in the top left corner.
Figure 6.
Heatmap of the main collection for cut severity ratings. Each tree is represented by a small box. Heavy cutting is observed throughout the orchard. White areas indicate no tree present. The cardinal directions of the field are shown in the top left corner.

Figure 7.
Cut severity ratings for the main collection. The number of trees per rating per species (A) Wild species (B) Malus hybrid, M. domestica, and M. sieversii. A rating of “0” represents no cuts. Ratings of “1”, “2”, and “3” represent light cuts while ratings of “4”, “5”, and “6” represent heavy cuts.

Figure 8.
Main collection cut severity ratings with species containing >10 trees. (A) Wild species (B) M. domestica, Malus hybrid and M. sieversii. Circle sizes indicate the number of trees, as do the corresponding colors.
Figure 8.
Main collection cut severity ratings with species containing >10 trees. (A) Wild species (B) M. domestica, Malus hybrid and M. sieversii. Circle sizes indicate the number of trees, as do the corresponding colors.


Table 1.
Significant pairwise comparisons of fire blight severity in the main collection 667 tree subset in June and July for species with 10 or more trees. Comparisons are listed with the highest severity first.
Table 1.
Significant pairwise comparisons of fire blight severity in the main collection 667 tree subset in June and July for species with 10 or more trees. Comparisons are listed with the highest severity first.
| Species Comparison | Average June Severity | June p-Value | Average July Severity | July p-Value |
|---|---|---|---|---|
| M. domestica/M. angustifolia | 25.42/0.18 | 6.08 × 10⁻¹⁰ | 42.4/1.44 | 6.93 × 10⁻¹⁰ |
| M. domestica/M. baccata | 25.42/1.08 | 1.26 × 10⁻¹¹ | 42.4/2.38 | 6.30 × 10⁻¹³ |
| M. domestica/M. coronaria | 25.42/4.33 | 0.001 | 42.4/6.03 | 3.97 × 10⁻⁵ |
| M. domestica/M. fusca | 25.42/4.48 | 1.02 × 10⁻⁷ | 42.4/5.97 | 1.43 × 10⁻⁹ |
| M. domestica/Malus hybrid | 25.42/12.43 | 7.78 × 10⁻⁷ | 42.4/21.13 | 2.75 × 10⁻⁸ |
| M. domestica/M. ioensis | 25.42/4.99 | 0.001 | 42.4/6.35 | 1.15 × 10⁻⁴ |
| M. domestica/M. prunifolia | 25.42/7.97 | 0.019 | 42.4/12.51 | 0.002 |
| M. domestica/M. sieversii | 25.42/7.41 | 6.10 × 10⁻²² | 42.4/13.63 | 2.09 × 10⁻²³ |
| Malus hybrid/M. angustifolia | 12.43/0.18 | 0.003 | 21.13/11.44 | 0.008 |
| Malus hybrid/M. baccata | 12.43/1.08 | 0.003 | 21.13/2.38 | 0.002 |
Table 2.
Significant pairwise comparisons of cut severity ratings in the main collection between species with more than 10 trees. For each comparison, the species with the higher average cut severity rating is listed first.
Table 2.
Significant pairwise comparisons of cut severity ratings in the main collection between species with more than 10 trees. For each comparison, the species with the higher average cut severity rating is listed first.
| Species Comparison | Average Cut Severity Rating | p-Value |
|---|---|---|
| M. coronaria/M. baccata | 2.23/1.04 | 0.014 |
| M. domestica/M. angustifolia | 2.88/1.66 | 0.004 |
| M. domestica/M. baccata | 2.88/1.04 | 1.67 × 10⁻¹³ |
| M. domestica/M. floribunda | 2.88/0.50 | 2.75 × 10⁻⁴ |
| M. domestica/M. fusca | 2.88/1.55 | 0.004 |
| M. domestica/M. halliana | 2.88/1.00 | 0.006 |
| M. domestica/Malus hybrid | 2.88/1.98 | 6.01 × 10⁻¹⁷ |
| M. domestica/M. orientalis | 2.88/1.19 | 1.92 × 10⁻¹¹ |
| M. domestica/M. sargentii | 2.88/1.44 | 0.049 |
| M. domestica/M. sieversii | 2.88/1.74 | 4.86 × 10⁻³⁵ |
| M. domestica/M. sikkimensis | 2.88/1.23 | 0.034 |
| Malus hybrid/M. baccata | 1.98/1.04 | 0.014 |
| M. ioensis/M. baccata | 2.27/1.04 | 0.038 |
| M. toringo/M. baccata | 2.54/1.04 | 0.012 |
| M. toringo/M. orientalis | 2.54/1.19 | 0.048 |
Publisher’s Note: MDPI stays neutral with regard to jurisdictional claims in published maps and institutional affiliations. |
© 2021 by the authors. Licensee MDPI, Basel, Switzerland. This article is an open access article distributed under the terms and conditions of the Creative Commons Attribution (CC BY) license (http://creativecommons.org/licenses/by/4.0/).
Share and Cite
MDPI and ACS Style
Dougherty, L.; Wallis, A.; Cox, K.; Zhong, G.-Y.; Gutierrez, B. Phenotypic Evaluation of Fire Blight Outbreak in the USDA Malus Collection. Agronomy 2021, 11, 144. https://0-doi-org.brum.beds.ac.uk/10.3390/agronomy11010144
AMA Style
Dougherty L, Wallis A, Cox K, Zhong G-Y, Gutierrez B. Phenotypic Evaluation of Fire Blight Outbreak in the USDA Malus Collection. Agronomy. 2021; 11(1):144. https://0-doi-org.brum.beds.ac.uk/10.3390/agronomy11010144
Chicago/Turabian StyleDougherty, Laura, Anna Wallis, Kerik Cox, Gan-Yuan Zhong, and Benjamin Gutierrez. 2021. "Phenotypic Evaluation of Fire Blight Outbreak in the USDA Malus Collection" Agronomy 11, no. 1: 144. https://0-doi-org.brum.beds.ac.uk/10.3390/agronomy11010144
Note that from the first issue of 2016, this journal uses article numbers instead of page numbers. See further details here.