Article

Phytochemical and Functional Characterization of Phenolic Compounds from Cowpea (Vigna unguiculata (L.) Walp.) Obtained by Green Extraction Technologies

by
M. Victoria Avanza
1,†,
Gerardo Álvarez-Rivera
2,†,
Alejandro Cifuentes
2,
José A. Mendiola
2,* and
Elena Ibáñez
2
1
Instituto de Química Básica y Aplicada del Nordeste Argentino (IQUIBA-NEA), Facultad de Ciencias Exactas y Naturales y Agrimensura-UNNE and Consejo Nacional de Investigaciones Científicas y Técnicas (CONICET), Avenida Libertad 5470, Corrientes 3400, Argentina
2
Foodomics Laboratory, Institute of Food Science Research (CIAL, CSIC), C/Nicolás Cabrera 9, 28049 Madrid, Spain
*
Author to whom correspondence should be addressed.
Both authors contributed equally.
Submission received: 11 December 2020 / Revised: 11 January 2021 / Accepted: 14 January 2021 / Published: 16 January 2021

Abstract

:
This work presents a green, downstream process, from extraction to phytochemical characterization and bioactivity testing, to obtain and evaluate the functional properties of phenolic compounds from cowpea (Vigna unguiculata (L.) Walp.) seeds and pods. Phenolic-rich extracts were obtained by pressurized liquid extraction (PLE). The main factors affecting the extraction conditions (temperature and solvent) were optimized in order to attain extracts with the highest extraction yield, antioxidant capacity, and total phenolic content. The optimal extraction conditions were 1:1 ethanol:water at 170 °C with one extraction cycle for seeds and three extraction cycles for pods. Phenolic compounds of optimal extract were analyzed by UHPLC-q-TOF-MS/MS (quadrupole-time of flight tandem MS). The obtained PLE-extracts exhibited higher phenolic content and antioxidant activity compared to conventional extraction procedures. The in vitro anti-neurodegenerative potential of extracts was measured through Acetylcholinesterase (AChE) inhibition assay. The results revealed the higher bioactivity observed in cowpea pod samples compared to seed extracts, which might be related to higher levels of quercetin and quercetin glycosides, kaempferol diglucoside, and other tetrahydroxylated flavones and flavonols identified in these samples. These results also provide an added-value benefit to the cultivation of this legume, considering the high potential of cowpea phenolic extracts as nutraceutical and functional ingredients in food formulations.

Graphical Abstract

1. Introduction

From a nutritional standpoint, legumes are an important source of proteins, calories, minerals, and vitamins [1]. Although the consumption of pulses in many Western countries is relatively low as compared to many other countries like India, legumes contain significant amounts of polyphenols such as flavonoids, phenolic acids, and lignins, which are considered natural antioxidants [2]. Cowpea (Vigna unguiculata (L.) Walp.) is a legume that is mainly cultivated in Africa, Asia, and Latin America. In the northeast region of Argentina, the cultivation of cowpea is run by small- and medium-sized producers. Cowpea seeds are used for human food and animal feed, while pods are either discarded or burned. Cowpea contains high levels of polyphenols with a unique profile that are mainly concentrated in the tegument and give the seeds their typical color [3]. The main polyphenols common to all varieties of cowpea are phenolic acids and flavonol glycosides. Some varieties also contain anthocyanins and/or flavan-3-ols [4]. Cowpea polyphenols’ extracts have been reported to have significant anti-inflammatory activity, with beneficial effects against diabetes, cancer, and cardiovascular diseases [4]. Cowpea pods can be considered lignocellulosic biomasses that do not contain starch and in which the carbohydrates are present as cellulose and hemicellulose [5]. This biomass also contains polyphenols, whose content increases as the plant reaches maturity while the tannin content decreases [6].
Many bioactive compounds derived from agricultural residues have been proven to be potentially useful in the food and pharmaceutical industry [7]. Nonetheless, the use of agricultural wastes as a rich, low-cost, and bio-renewable resource for the production of bioactive compounds is crucial; however, the bulk of knowledge of the field remains scarce [8].
The harmful effects of free radicals, together with the toxic effects produced by synthetic antioxidants used as food preservatives, have promoted the search for molecules with antioxidant properties to be applied in food, cosmetic, and pharmaceutical industries. In this sense, legumes are a potential source of antioxidants mainly because they synthetize a great variety of secondary metabolites with free radical scavenging capacity in response to either artificial or environmental stimuli [2].
Among the different important diseases associated with oxidative stress processes, cancer and cardiovascular diseases have been highlighted and are among the main causes of death in Argentina and in the world. These diseases are based on the accumulation of highly reactive free radicals or the impairment of the defense systems that protect biomolecules from oxidative damage [9]. Epidemiological studies show a relationship between the consumption of legumes, fruits, cereals, and vegetables and low incidence values of these syndromes [10].
Moreover, a therapeutic alternative for patients with Alzheimer disease, which is featured by oxidative stress [11], is focused on the inhibition of the acetylcholinesterase (AChE) [12]. To date, several plant species have proven to have acetylcholinesterase inhibitory (AChEI) activity [13]. Among the natural phytochemicals, flavonoids and phenolic acids represent an interesting class of biologically active compounds in this regard. In addition, there is evidence suggesting that these compounds have antioxidant capacity [14].
In recent years, there has been an increasing interest in the development of environmentally clean processes for obtaining high-added-value extracts and compounds with biological activity from natural sources. In this line, pressurized liquid extraction (PLE) has been consolidated as a high throughput and green extraction technique that may be used for the extraction of medium and polarity bioactive compounds, depending on the extraction solvent employed [15]. Green extraction processes, such as those based on PLE, make use of GRAS solvents (generally recognized as safe), which guarantees the absence of toxic solvents in the final ingredients and products obtained. While PLE can be performed using a wide range of solvents, ethanol and water are preferred for green extractions.
Considering that cowpea polyphenolic compounds are mainly obtained by conventional extraction methods (extraction with organic solvents) [16,17], an alternative green extraction procedure, followed by chemical and functional characterization, was proposed in this work in order to obtain phenolic-enriched extracts from cowpea and waste semi-feedstocks (cowpea pods) that could be used as ingredients in food formulation.

2. Materials and Methods

2.1. Samples and Chemicals

Seeds and pods of two cowpea varieties, named as Cuarentón (CUA) and Colorado (COLO), were provided by Estación Experimental El Sombrero, province of Corrientes (Instituto Nacional de Tecnología Agropecuaria (INTA)), Argentina (2018 harvest). Both cultivars are registered with the number 1981-01-13 at Registro Nacional de Cultivares (RNC) from the Instituto Nacional de Semillas de Argentina Registration. They are not native species from Argentina but foreign varieties that have been selected by humans for use since the colonial period. Therefore, they have different record numbers (colorado: N° de registro 914 and cuarenton: registry number: 909) but the same registration number. Shrunken, discolored, and insect-infested seeds were discarded. Seeds and pods were sun-dried and stored in a hermetic vessel at 10 °C until used. Cowpea seeds and pods were ground (Braun KSM2, coffee grinder, Mexico) and sifted through a 500-μm sieve. Ultrapure water obtained from a Millipore purification system (Billerica, MA, USA) and ethanol (99.5%) provided by VWR Chemicals (Fontenay-sous-Bois, France) were used for PLE. DPPH (2,2-Diphenyl-1-picrylhydrazyl hydrate, free radical, 99%), gallic acid, Trolox (6-hydroxy-2,5,7,8-tetramethylchroman-2-carboxylic acid, ≥97%), and ABTS (2,2-azinobis (3-ethylbenzothiazoline-6-sulfonic acid, ≥99%) were acquired from Sigma-Aldrich. Folin-Ciocalteu reagent for total phenolic analysis was purchased from Merck (Darmstadt, Germany).

2.2. Maceration Extraction (ME)

Seeds’ and pods’ flour dispersions (5 g in 50 mL) were prepared in different solvent mixtures: ethanol, water, water + 2% v/v formic acid, water + 5% v/v formic acid, and 70% v/v acetone + 1% v/v formic acid. Mixtures were macerated for 24 h with shaking at 230 rpm. Dispersions were then centrifuged (Hettich 380R) at 5000 rpm for 15 min and the resulting supernatant was filtered. Extracts were then evaporated using nitrogen stream and/or by lyophilization (Labconco Corporation, Kansas City, Mo, USA), depending on the extraction solvent. The yield, the polyphenols’ content, and the antioxidant activity were determined in the dried sample extracts.

2.3. Pressurized Liquid Extraction (PLE)

These extractions were carried out in a pressurized liquids extractor (ASE 200, Dionex, Sunnyvale, CA, USA). Ethanol, ultrapure water, and the mixture ethanol:water (50:50) were used as solvents, as described below. To eliminate dissolved air, at the beginning of the working day the solvents were sonicated for 10 min. For each extraction, 1 g of dried seed or pod sample was mixed with 2 g of dispersive agent (sea sand). A sandwich scheme was used inside the 11-mL stainless-steel extraction cell. This mixture was placed in the center among 2 g of sea sand and cellulose filters (Restek, Bellefonte, PA, USA) located at both ends. Briefly, the extraction was done as follows. Initially, the selected solvent filled the extraction cell and the pressure rose. Then it was heated at extraction conditions. Secondly, the static extraction conditions were maintained for 10 min, with the system closed to keep a constant pressure (1500 psi, 10.34 MPa). Finally, the extract was collected in a glass vial, the extraction cell was rinsed with fresh solvent (60% of cell volume), and pure nitrogen for 120 s was used for purging. To avoid carryover effects, a thorough rinse was done between the consecutive extractions. After extraction, solvents were eliminated using nitrogen stream, and water was removed by freeze-drying (Labconco Corporation, Kansas City, Mo, USA). The dried extracts were stored at −20 °C and protected from light until using.

2.4. Experimental Design

For optimization of PLE from cowpea seed and pods, a three-level factorial design in 16 runs (Box-Behnken) was performed to study the effects of percentage of ethanol in the mixture solvent (0–100%) (v/v), temperature (50–170 °C), number of cycles (1–3) on the extraction yield (%), total phenolic content (mg gallic acid equivalents, GAE/g extract), antioxidant capacity (TEAC, mmol of Trolox equivalents/g extract), and DPPH radical scavenging activity (EC50, µg/mL: concentration required to obtain a 50% antioxidant effect). All the experiments (16), including four center points, were carried out in random order. Response surface methodology (Statgraphics Centurion XVII, StatPoint Technologies, Inc., Warrenton, VA, USA) was used for experimental design and data analysis. In the extraction process, the influence of independent variables on the response variables was assessed using the pure error. A confidence level of 95% was considered for all the variables. The quadratic model proposed for each response variable (Yi) was:
Yi = a + bA + cB + dC + eA2 + fB2 + gC2 + hAB + iAC + jBC + ε
where A is the temperature; B is the solvent composition (percentage of ethanol in the mixture); C is the number of cycles; a is the intercept; b, c, and d are the linear coefficients; e, f, and g are quadratic coefficients; h, i, and j are the interaction coefficients; and ε is the error variable. This quadratic model (Equation (1) was estimated considering R2 (percent variation explained by model) and RSD (residual standard deviation). Additionally, lack-of-fit test was done for the models from the analysis of variance (see Tables S1 and S2 in Supplementary Material) as the significance measures. For each of the response variables the effect of each factor and their statistical significance was analyzed from the standardized Pareto chart. Graphically, a response surface of the individual mathematical model was also obtained, and significant differences were considered with p ≤ 0.05. Additionally, multiple response optimization was done combining different responses to maximize all of them at the same time.

2.5. In Vitro Experiments

2.5.1. Total Phenolic Content (TPC)

The TPC was determined in ME and PLE extracts spectrophotometrically by the Folin–Ciocalteu’s method with some modifications, as previously described [18]. Briefly, a 10-µL aliquot of the extract (10 mg mL−1) and 600 µL of ultrapure water were mixed. Fifty µL of undiluted Folin–Ciocalteu reagent were subsequently added. After 1 min, 150 µL of 20% (w/v) Na2CO3 were added and the volume was adjusted to 1.0 mL with ultrapure water. Samples were incubated for 2 h at 25 °C in the darkness. Three hundred µL of each reaction mixture were transferred to a 96-well microplate. The absorbance was measured at 760 nm in a microplate reader (Synergy HT, BioTek Instruments, Winooski, VT, USA). All analyses were done in triplicate. For calibration, standard curves constructed with serial dilutions of gallic acid (0.031–2 mg mL−1) were done and mg of gallic acid equivalents (GAE) per g of extract was used to express the TPC.

2.5.2. Trolox Equivalents of Antioxidant Capacity (TEAC)

TEAC was determined in ME and PLE extracts using the method described by Re et al. [19] with some modifications. Briefly, the ABTS•+ radical was generated through the reaction of 7 mM ABTS with 2.45 mM potassium persulfate in the absence of light, at room temperature, for 16 h before using it. This aqueous ABTS•+ solution was diluted with phosphate buffer 5 mM (pH 7.4) to an absorbance of 0.7 UA (±0.02) at 734 nm. Samples (10 µL, at five different concentrations, from 0.625 to 10 mg mL−1) and 1 mL of ABTS•+ solution were mixed in an Eppendorf vial. After incubation for 45 min, 300 µL of the mixture were transferred to a 96-well microplate. The endpoint absorbance was measured in a microplate reader (Synergy HT, BioTek Instruments, Winooski, VT, USA) at 734 nm. The results were expressed as TEAC values (mmol of Trolox/g extract), with Trolox used as reference standard. All analyses were done in triplicate. The values shown were obtained using five concentrations of each extract, chosen to obtain a linear response between 20% and 80% of the absorbance of the blank.

2.5.3. DPPH Radical Scavenging Assay

ME and PLE extracts were analyzed by the DPPH radical scavenging method adapted from the methodology described by Brand-Williams et al. [20]. A working solution containing 2.35 mg of DPPH in 100 mL of methanol was used. The extracts were tested in a range between 0.625 to 10 mg mL −1. In each well 10 µL of each extract solution or methanol (blank) and 290 µL of DPPH solution were placed to make up the final reaction volume of 300 µL. After 4 h in the dark at room temperature, the absorbance was measured in a microplate reader (Synergy HT, BioTek Instruments, Winooski, VT, USA) at 516 nm. The remaining concentration of DPPH was calculated from a calibration curve. Measurements were made in triplicate. The data shown consist of the concentration of the extract (expressed in µg mL−1) necessary for a half initial concentration of DPPH, that is, the EC50 value.

2.5.4. In Vitro AChE Inhibition Assay

The acetylcholine esterase inhibitory (AChE) activity was measured by the Ellman’s method [21] with minor modifications [22]. Kinetic parameters (Km, Michaelis-Menten constant, and Vmax, maximum velocity) values were derived from the Michaelis–Menten plot. The reaction mixture contained 100 µL of 0.15 M Tris-HCl buffer (pH 8.0), 25 µL of 0.8 U/mL acetylcholine esterase (type VI-S from Electrophorus electricus, Sigma-Aldrich, St Louis, Mo, USA), 100 µL of each extract at different concentrations in 50% ethanol (1 and 0.5 mg/mL), and 25 µL of 4 mM of DTNB (5,5-dithio-bis-(2-nitrobenzoic acid). Mixtures were incubated for 30 min at 37 °C. After 30 min, the reaction was initiated by the addition of 50 µL of 1.2 mM acetylthiocholine (substrate). The hydrolysis of acetylthiocholine was monitored as the Vmax at 412 nm for 5 min each 15 s. Galanthamine was used as positive control. All the reactions were performed in triplicate. The percentage inhibition was calculated as follows:
% inhibition = [(E − S)/E] × 100
where E is the Vmax of the enzyme without sample and S is the Vmax of enzyme with the test sample.

2.6. Liquid Chromatography-Tandem Mass Spectrometry (UHPLC-ESI-q-TOF-MS/MS)

For the phytochemical characterization of cowpea seeds and pods extracts, an Agilent 1290 UHPLC system (Ultrahigh Performance Liquid Chromatography) coupled to an Agilent 6540 quadrupole-time-of-flight mass spectrometer (q-TOF MS) equipped with an orthogonal ESI source was employed, all from Agilent Technologies (Santa Clara, CA, USA. A Zorbax Eclipse Plus C18 column (2.1 mm diameter, 100 mm length, 1.8-µm particle diameter) was employed for chromatographic separation at 30 °C. The mobile phase was composed of two solvents: solvent A water (0.01% formic acid) and solvent B acetonitrile (0.01% formic acid). Five microliters of the sample were injected using a flow rate of 0.5 mL/min in gradient elution. The gradient timetable was as follows: 0 min, 100% A; 7 min, 70% A; 9 min, 20% A; 11 min, 0% A; 13 min, 0% A; 14 min, 100% A. The mass spectrometer was operated in MS and tandem MS modes for the structural analysis of all compounds. MS parameters were the following: nebulizer pressure, 40 psi; capillary voltage, 4000 V; drying gas temperature, 350 °C at a flow rate of 10 L/min; skimmer voltage, 45 V; and fragmentor voltage, 110 V. A scan rate of 5 spectra per second between 50–1100 and 50–800 m/z for MS and Auto MS/MS modes was used.

2.7. Statistical Analysis

Each treatment was performed at least in triplicate, as stated above. Values are shown as average ± standard deviation. One-way analysis of variance was employed. Additionally, Fisher Least significant difference (LSD) test with α = 95% (confidence interval) was used to contrast the means. The statistical analysis was performed using the Infostat software (https://www.infostat.com.ar/ Universidad Nacional de Córdoba, Argentina).

3. Results and Discussion

3.1. Maceration Extraction (ME)

Table 1 shows the results of the maceration of cowpea (COLO variety) seeds and pods obtained with ethanol, water, water-formic acid (2% and 5% v/v), and acetone-formic acid (1%). The highest yield, polyphenols’ content’ and antioxidant activity was obtained by extracting with the mixture of 70% v/v acetone and 1% v/v formic acid in both seeds’ and pods ‘samples, though values were higher for seed preparations. The extraction of phenolic compounds is favored by polar organic solvents or by mixtures of polar organic solvents with water. Acetone is a dipolar aprotic solvent with great solubilization capacity of organic compounds. Addition of 1% v/v formic acid increased acetone solubility of phenolic compounds, leading to an increase of the radical scavenging capacity. Acetone 1% v/v formic acid was used to obtain relatively high levels of proanthocyanidins present in cowpea varieties of cowpea, as reported by Ojwang et al. [16]. The extraction performed with water rendered pods extract with a higher polyphenols’ content and antioxidant activity while these values were lower when ethanol was used, mainly in seeds’ samples. The content of polyphenols in the extracts of water and formic acid at 2 and 5% v/v was higher in pods than in seeds; however, the antioxidant activity was lower in pods. These results may be due to the different compounds extracted that varied according to the extraction solvent polarity and the antioxidant capacity of extracted compound. Vijayalaxmi et al. [23] reported high polyphenols’ contents in agricultural wastes such as wheat bran, peanut shell, and rice bran. Avanza at al. [3] reported similar values of polyphenols’ content in methanol extracts of cowpea seeds of different varieties. The polyphenols’ content obtained in this work are comparable to those reported by other researchers for V. unguiculata seeds [24] and are higher than those obtained in seed extracts of lentil and chickpea cultivars from Pakistan [25,26]. Previous reports have associated the TPC to the observed antioxidant activity [27,28].

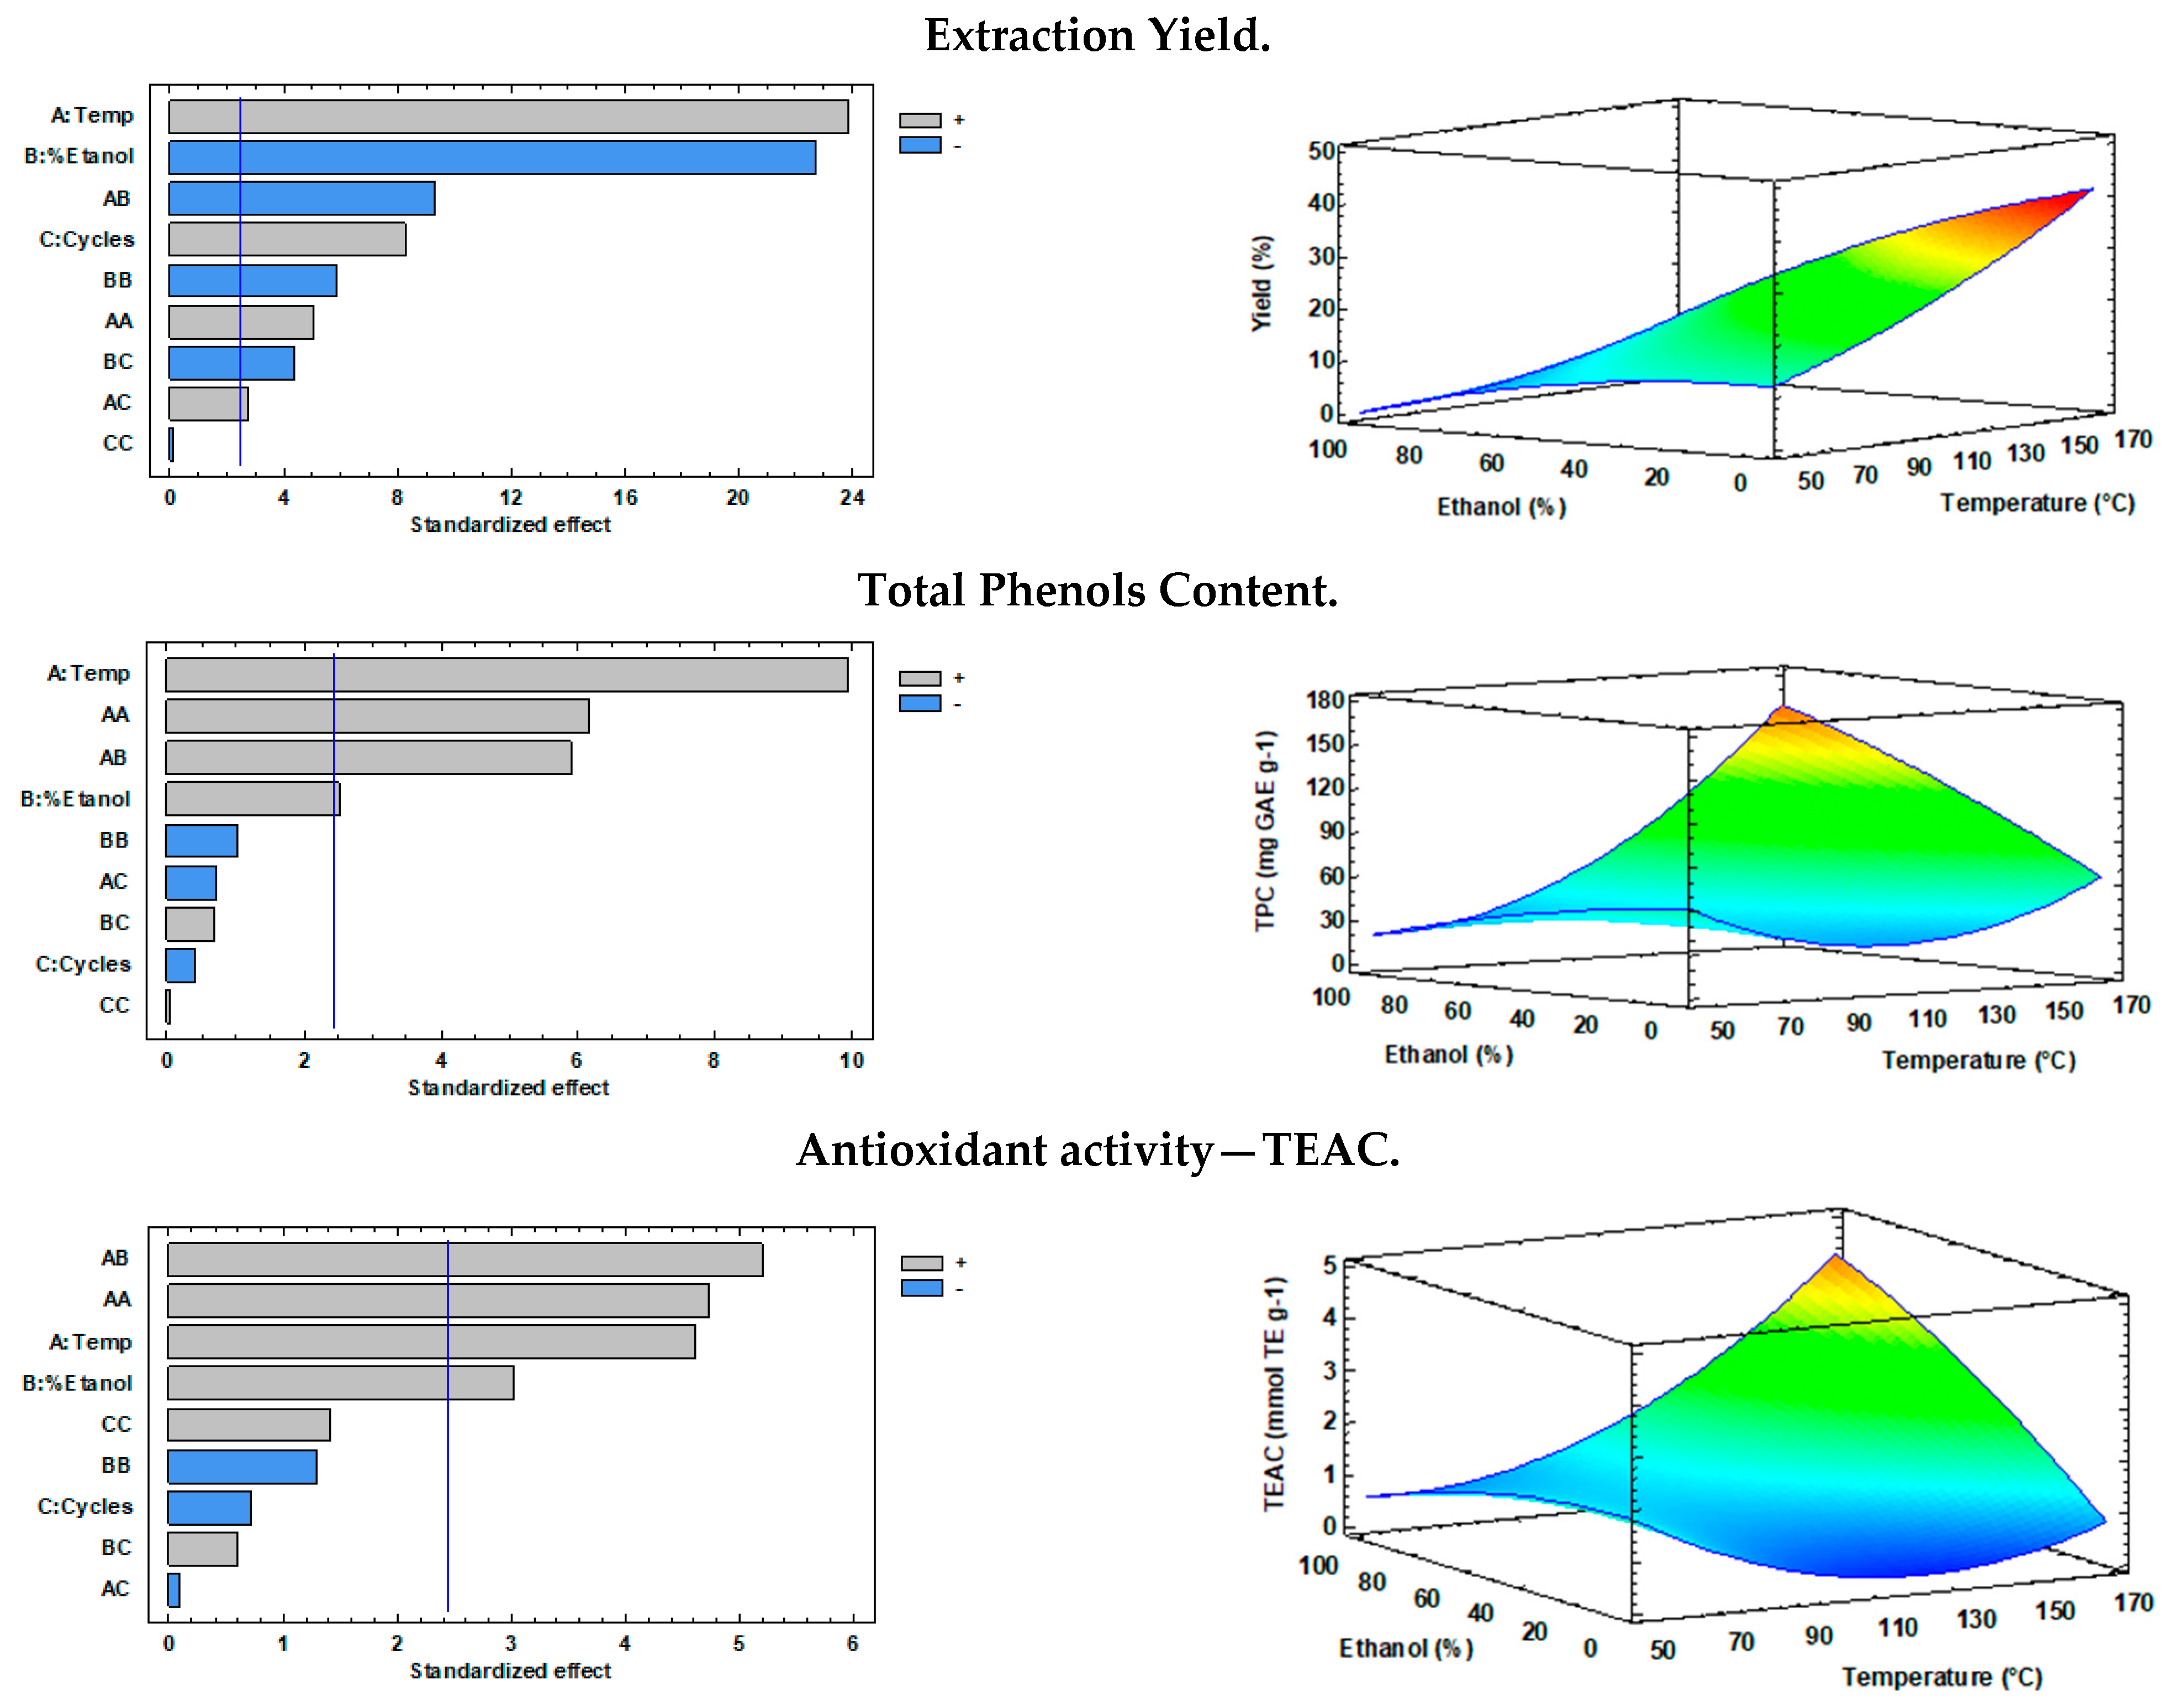
3.2. Pressurized Liquid Extraction (PLE)

In spite of the good results obtained with acetone in the maceration experiments, only green solvents that could be directly used in the formulation of food ingredients were tested on PLE. As mentioned, the experimental design was based on a response surface, where the factors were the number of extraction cycles (1, 2, and 3), ethanol–water percentage (0–100%), and the temperature (50, 110, and 170 °C). Those solvents were chosen considering their low toxicity and high extraction capacity. The rest of the extraction variables (a static extraction time of 10 min and an extraction pressure of 10.3 MPa) remained constant, based on reference values obtained from previous works by our research group [29]. The three-level factorial design allowed assessing the effect of the extraction parameters in four different response variables, i.e., the extraction yield, the polyphenols’ content, the TEAC value (ABTS), and the EC50 value (DPPH). The experimental matrix and the results obtained for each extraction condition for the COLO seeds and pods are shown in Table 2 and Table 3. The results of the ANOVA obtained for each response are provided as supplementary data (Tables S1 and S2). Results showed that the behavior of the response variables changed with the extraction condition. Extraction yield increased both with temperature and with the solvent percentage, achieving a peak value at 170 °C. For both seeds and pods, the highest yield was obtained with 50% ethanol, as compared to pure ethanol or water.
High temperatures also caused an increase in the TPC, with the difference between 110 °C and 170 °C being more marked than that observed between 50 °C and 110 °C. The highest polyphenols’ content was obtained with 50% ethanol at 170 °C for both seeds and pods (42.76 mg GAE g−1 and 107.42 mg GAE g−1, respectively). According to the results presented in this study, the mixture ethanol:water (1:1) was the most suitable solvent for the extraction of total polyphenols.
Regarding the antioxidant capacity, the most active seed extracts were obtained at 50 °C with three extraction cycles using 50% ethanol (TEAC = 0.568 mmol TE g−1 and EC50 = 73.46 µg mL−1) and at 170 °C with one extraction cycle with 50% ethanol (TEAC = 0.926 mmol TE g−1 and EC50 = 49.31 µg mL−1). The most active pod extracts were also obtained at 50 °C and 170 °C, employing 50% ethanol, but performing one extraction cycle at the lowest temperature (TEAC = 2.067 mmol TE g−1 EC50 = 212.24 µg mL−1) and with two extraction cycles carried out at the highest temperature (TEAC = 4.549 mmol TE g−1 and EC50 = 27.08 µg mL−1). For these response variables, for both seeds and pods, the temperature was the main critical variable, detecting a significant increase between 50 °C and 170 °C for 50% ethanol and a decrease for an intermediate temperature (110 °C). On the other hand, it was not possible to obtain a mathematical model based only on the studied variables (temperature, solvent composition, and number of cycles) to predict the antioxidant capacity measured as DPPH radical scavenging within the tested range.
Figure 1 and Figure 2 show the standardized Pareto charts for the three response variables analyzed, as well as their corresponding response surfaces for one and three extraction cycles (seeds and pods, respectively). The vertical line indicates the 95% confidence, whereas the colors in the bars indicate positive and negative effects. The temperature along with its quadratic effect were the main significant factors for all response variables, both in seeds and pods. As expected, an increase in temperature provided the highest yield due to an increase in the solubility of the target compounds with the temperature and to a decrease in the viscosity of the solvent that allowed improving the mass transfer of the solvent to the solid matrix. Moreover, response surfaces were similar for both polyphenols’ content and TEAC antioxidant activity in both seeds and pods. High and low temperature values proved to have a positive effect on these variables, while intermediate temperature values had a negative effect. For the three response surfaces, the ethanol-water 50% mixture had a positive effect in both seeds and pods.
A multiple response optimization was performed considering the same statistical weight to all response variables, in order to determine the most suitable extraction conditions, that is, those that maximize extraction yield, TPC, and TEAC at the same time. The optimal extraction conditions foreseen were: 50% ethanol, one extraction cycle at 170 °C for seeds and 69% ethanol and three extraction cycles at 170 °C for pods. Using these optimized values, the mathematical model forecast the values of the three response variables for both seeds and pods. As previously indicated, DPPH was not taken into account for optimization due to the poor regression coefficient obtained. In order to test the model, three independent experiments were performed for each sample (seeds and pods) using the optimized conditions and determining the four response variables. Moreover, for comparison purposes, the optimal conditions were applied for the Cuarentón (CUA) variety. The results validated our model since the experimental values agree with those predicted. The deviation (%RSD) of the predicted value was small, as can be seen in Table 4 and Table 5. Despite DPPH radical scavenging capacity not being used in the prediction model, it was measured and results are shown. Additionally, antioxidant capacity was calculated also by oxygen radical absorbance capacity (ORAC) according to the method described in [29].
Comparing results of maceration and PLE (Table 1 vs. Table 4 for seed and Table 1 vs. Table 5 for pods), we can conclude that PLE extractions provided higher yields and antioxidant capacities than ME. Nevertheless, using acetone the antioxidant capacity was higher. However, it must be taken into account that results are expressed per gram of extract. So, the higher yield obtained in PLE diluted the sample. The antioxidant activity of the seeds increased 78% (TEAC) and 28% (EC50) in the ethanol extracts (100%) with PLE at 170 °C and 44% (EC50) in the water extracts (100%) with PLE at 170 °C, compared to the ethanol and aqueous extracts by ME, respectively. Furthermore, the ethanol–water extracts (50%) with PLE and temperatures (50–170 °C) reached higher antioxidant activity values than the PLE extracts with temperature (50–170 °C), water (100%), and ethanol (100%). On the other hand, in the COLO cowpea pod extracts, an increase in antioxidant activity of 56% (TEAC) and 77% (EC50) was observed with PLE in the ethanol–water extracts (50%) at 170 °C and 71% (TEAC) and 81% (EC50) in ethanol extracts (100%) at 170 °C, compared to acetone-formic extracts from ME. Brazdauskas et al. [29] reported TEAC antioxidant activity values (4.35 mmol TE g−1 extract) of PLE extracts of black chokeberry pomace with ethanol-water at high temperatures (165 °C), slightly higher than COLO cowpea pod extracts. In carnosol-enriched rosemary extracts with PLE (150 °C; 24% water 76% ethanol; 20 min), antioxidant activity values of TEAC (2.75 mmol TE g−1 extract) were comparable to those observed in extracts of cowpea COLO pods reported under similar extraction conditions [30]. Regarding the other antioxidant capacities measured, DPPH and ORAC followed a similar trend as ABTS-predicted radical scavenging test, with antioxidant pods’ extracts being more potent versus seed extracts. Comparing cultivars, the highly pigmented bean and pod (Colorado) showed stronger antioxidant capacity in all tests.

3.3. Further Characterization of Optimum Extracts

3.3.1. Neuroprotective Activity

AChE inhibitors are used for the treatment of neurological disorders, such as Alzheimer disease, senile dementia, ataxia, and myasthenia gravis. The inhibition assay was performed with the extracts obtained under the optimum conditions: ME: acetone-1% v/v formic acid, 25 °C, 24 h (maceration, ME), 68.93% ethanol, three extraction cycles of 10 min each at 170 °C (PLE pods) and 50% ethanol, and one extraction cycle of 10 min at 170 °C (PLE seeds). Extracts were used at 1 mg/mL and 0.5 mg/mL for seeds and pods, respectively (Table 6). The seeds’ extract caused a 35% AChE inhibition, while for the pods’ extract, the inhibition was 52%. These percentages represent 0.21 and 0.69 mg galatamine/g extract, respectively.
To date, the inhibition of cholinesterase activity of cowpea extracts has never been published. Jung-Eun Song et al. [31] reported that ethanol extracts (50 µg/mL) by legume maceration (Mungbean and Kidney) presented AChE inhibition in the order of 25.3% and 22.4%, respectively. On the other hand, the ethanolic extract of Sorghum bicolor showed inhibition of 43.2%, while the methanolic extract was 63.4%. They also found that water extracts of legumes and cereals showed no AChE inhibitory activity. Farhana Mazhar et al. [32] found an AChE inhibition activity similar to that found in the COLO cowpea pods in the soluble “aqueous” fraction of the extract of Zizyphus oxyphylla (10 mg/mL) (58.5%) and a much higher one in the extracts of n-butanol (95.5%). In the latter case, the activity was attributed to a higher content of flavonoids, alkaloids, and terpenes found in the extracts. Ademiluyi et al. [33] proposed that the AChE inhibitory activity of fermented legumes (peanuts, bambara, and carob) could be attributed to their constituent phytochemicals (gallic acid, catechin, caffeic acid, epicatechin, rutin, isoquercitrin, quercitrin, quercetin, and kaempferol) as well as some bioactive peptides present in the diet of the animals studied. Conversely, other authors have reported high activity of inhibition of the enzyme acetylcholinesterase by the presence of alkaloids in extracts of medicinal plants (Zanthoxylum davyi roots) [34] or by the presence of terpenes in the essential oil of Rosemary (Rosmarinus officinalis L.) [35].

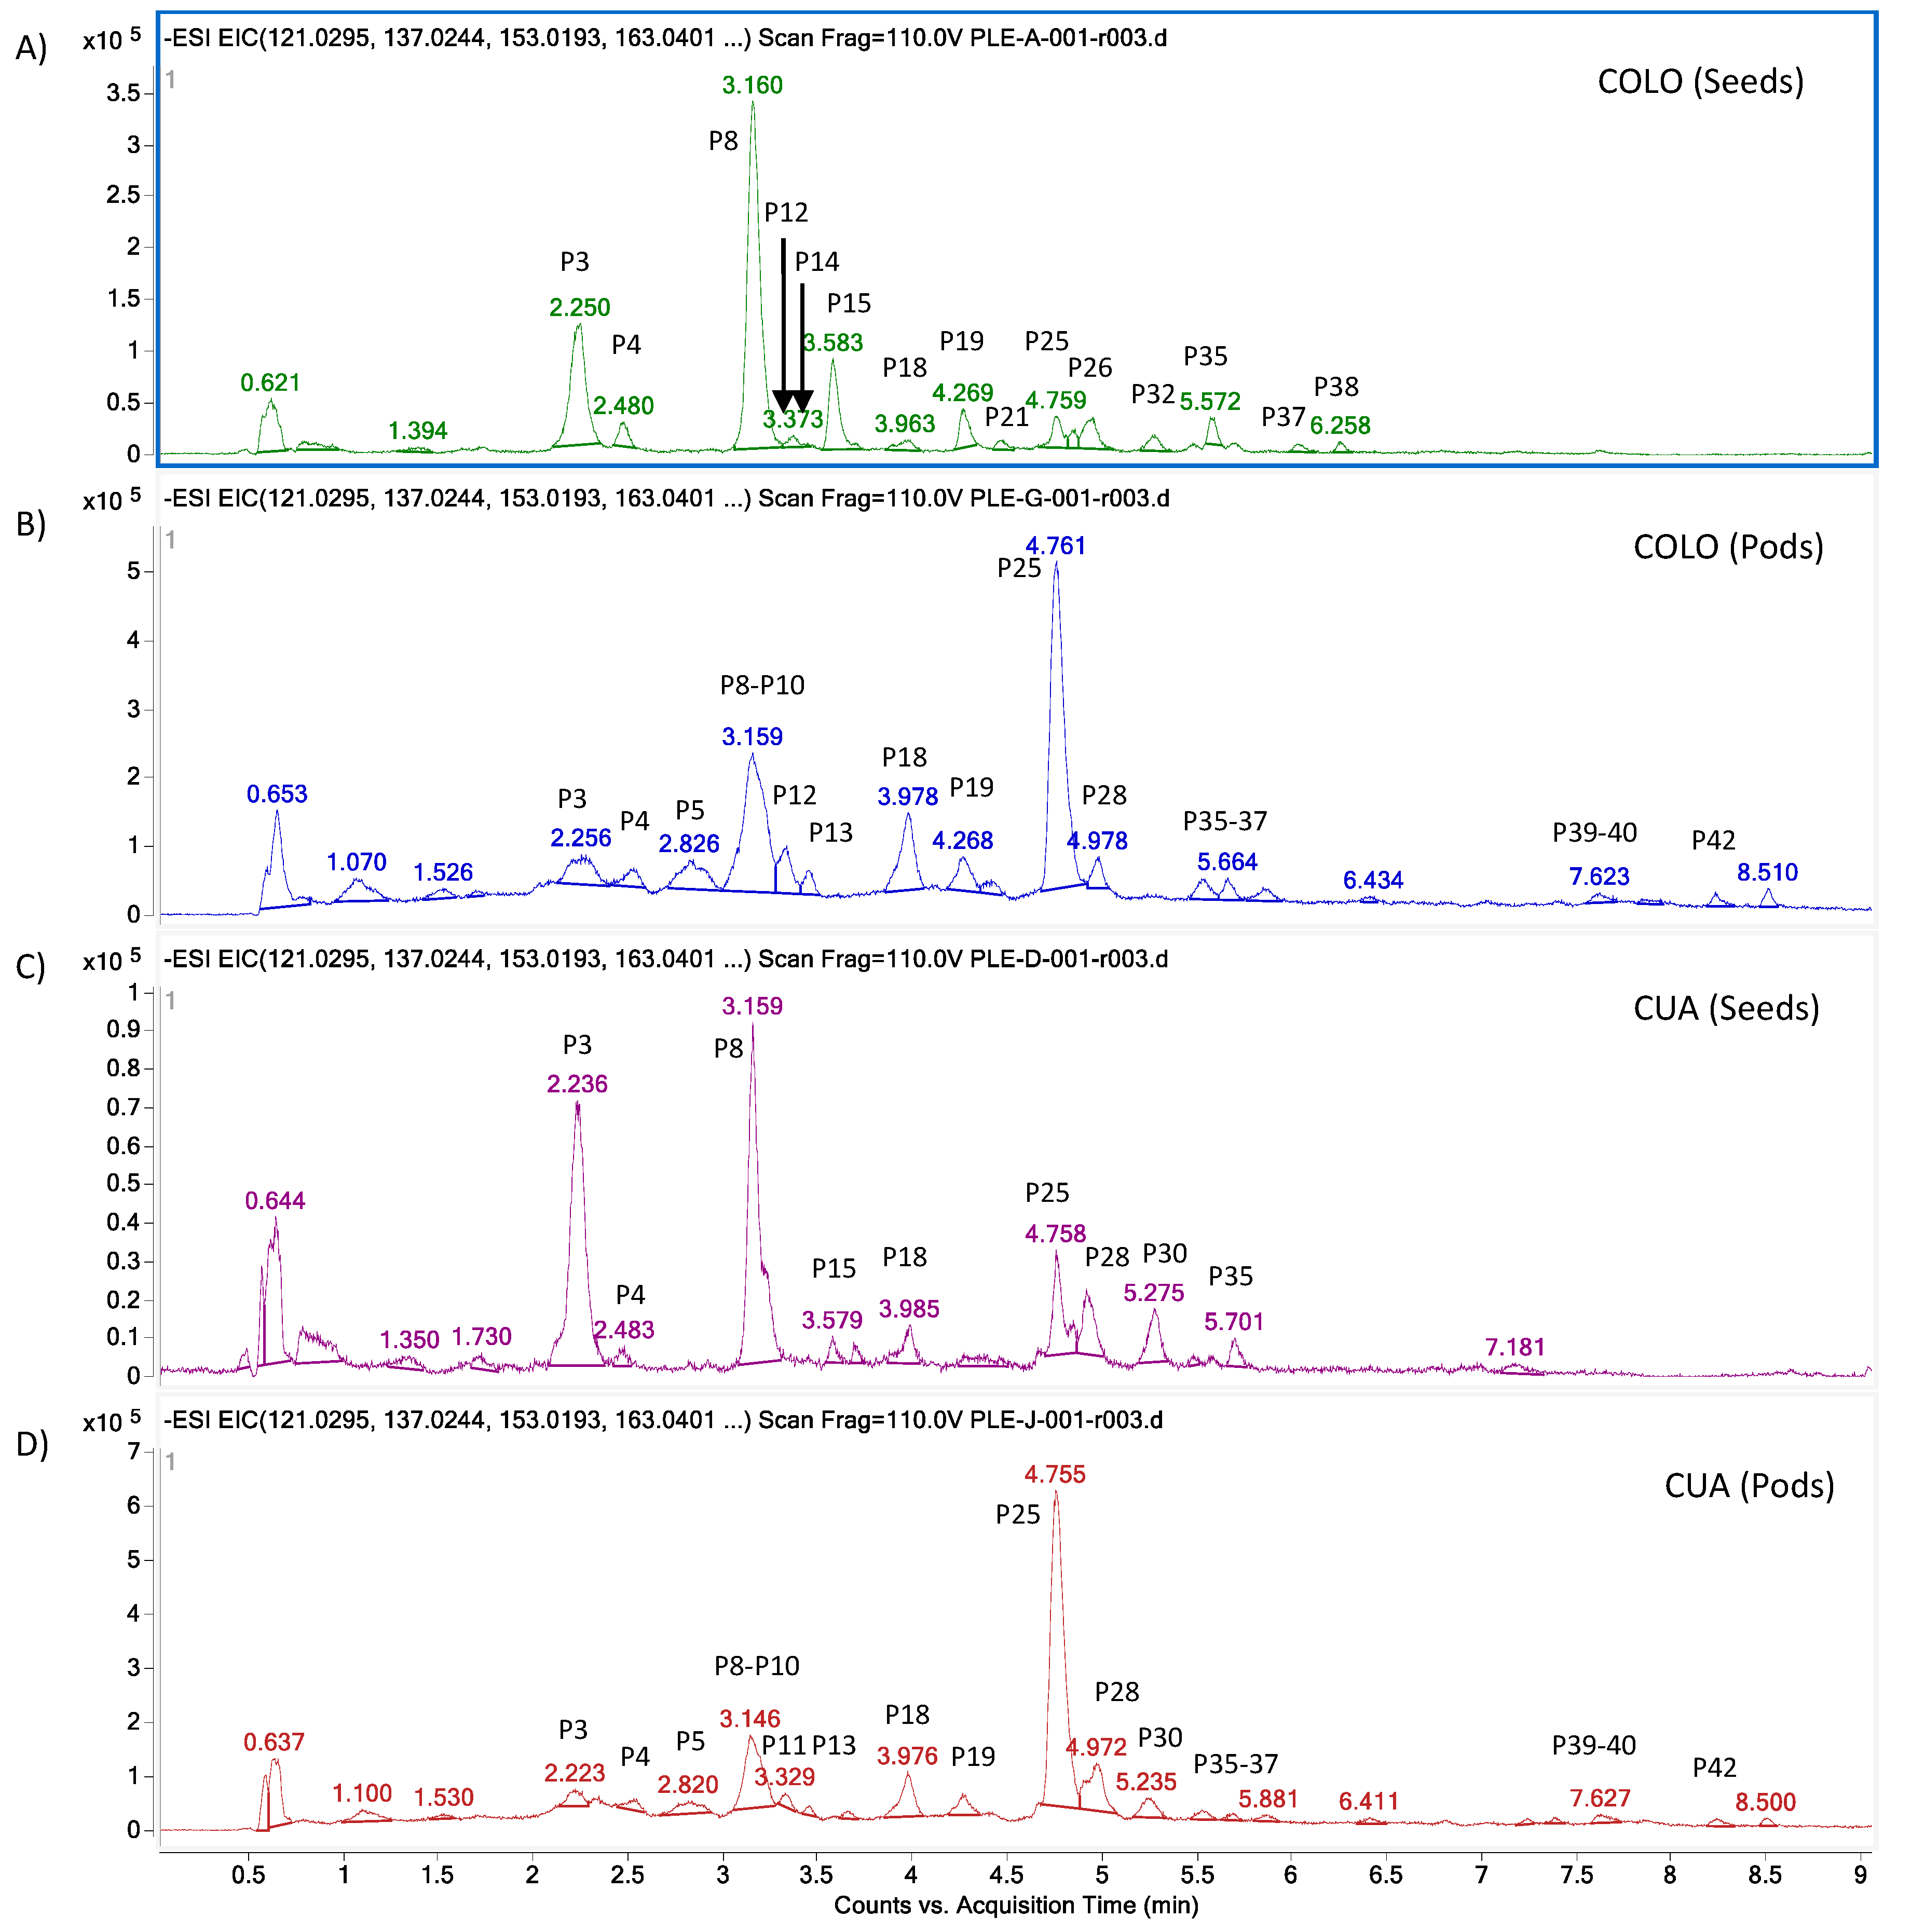
3.3.2. Phenolic Profiling Analysis by UHPLC-ESI-qTOF-MS/MS

The PLE extracts of seeds and pods obtained under optimal conditions were analyzed by UHPLC-ESI-QTOF and comparatively evaluated in terms of phenolic composition. The main objective was to correlate the different observed bioactivities (antioxidant and neuroprotective activities) with differences in the chemical composition of the two cowpea varieties (COLO and CUA) considering seeds and pods. As a result of the untargeted profiling analysis of the phenolic PLE extracts from the four optimal extracts, a total of 42 phenolic acids and flavonoids were tentatively identified in both seeds and pods, on the basis of their accurate mass of deprotonated molecular ions, isotopic profile, MS/MS fragmentation patterns, and positive match with mass spectrometry databases (i.e., HMDB, Metlin, MassBank) and previously reported data in literature. Table 7 summarizes the phytoconstituents identified by ESI-q-TOF-MS/MS analysis in negative ionization mode, including the retention time (min), molecular formula, calculated m/z [M-H]- ions, and calculated mass error (ppm). Table 7 also includes relative abundances for each compound, expressed in terms of absolute area values obtained in the full MS mode using the deprotonated molecular m/z value. Figure 3 shows the extracted ion chromatograms (EICs) of the analyzed PLE extracts, reconstructed with the [M-H]- ion exact mass values (10 ppm mass tolerance). As shown in the EICs, qualitative and quantitative differences, in terms of chemical composition, can be observed among the analyzed samples (see peak annotation in Table 7). The most abundant compounds in cowpea seeds’ extracts are p-hydroxybenzoic acid, catechin, and a protocatechuic acid isomer, tentatively identified as dihydroxybenzoic acid, whereas p-coumaric acid and several di- and trihydroxybenzoic acids were the major phenolic compounds in pods’ samples.

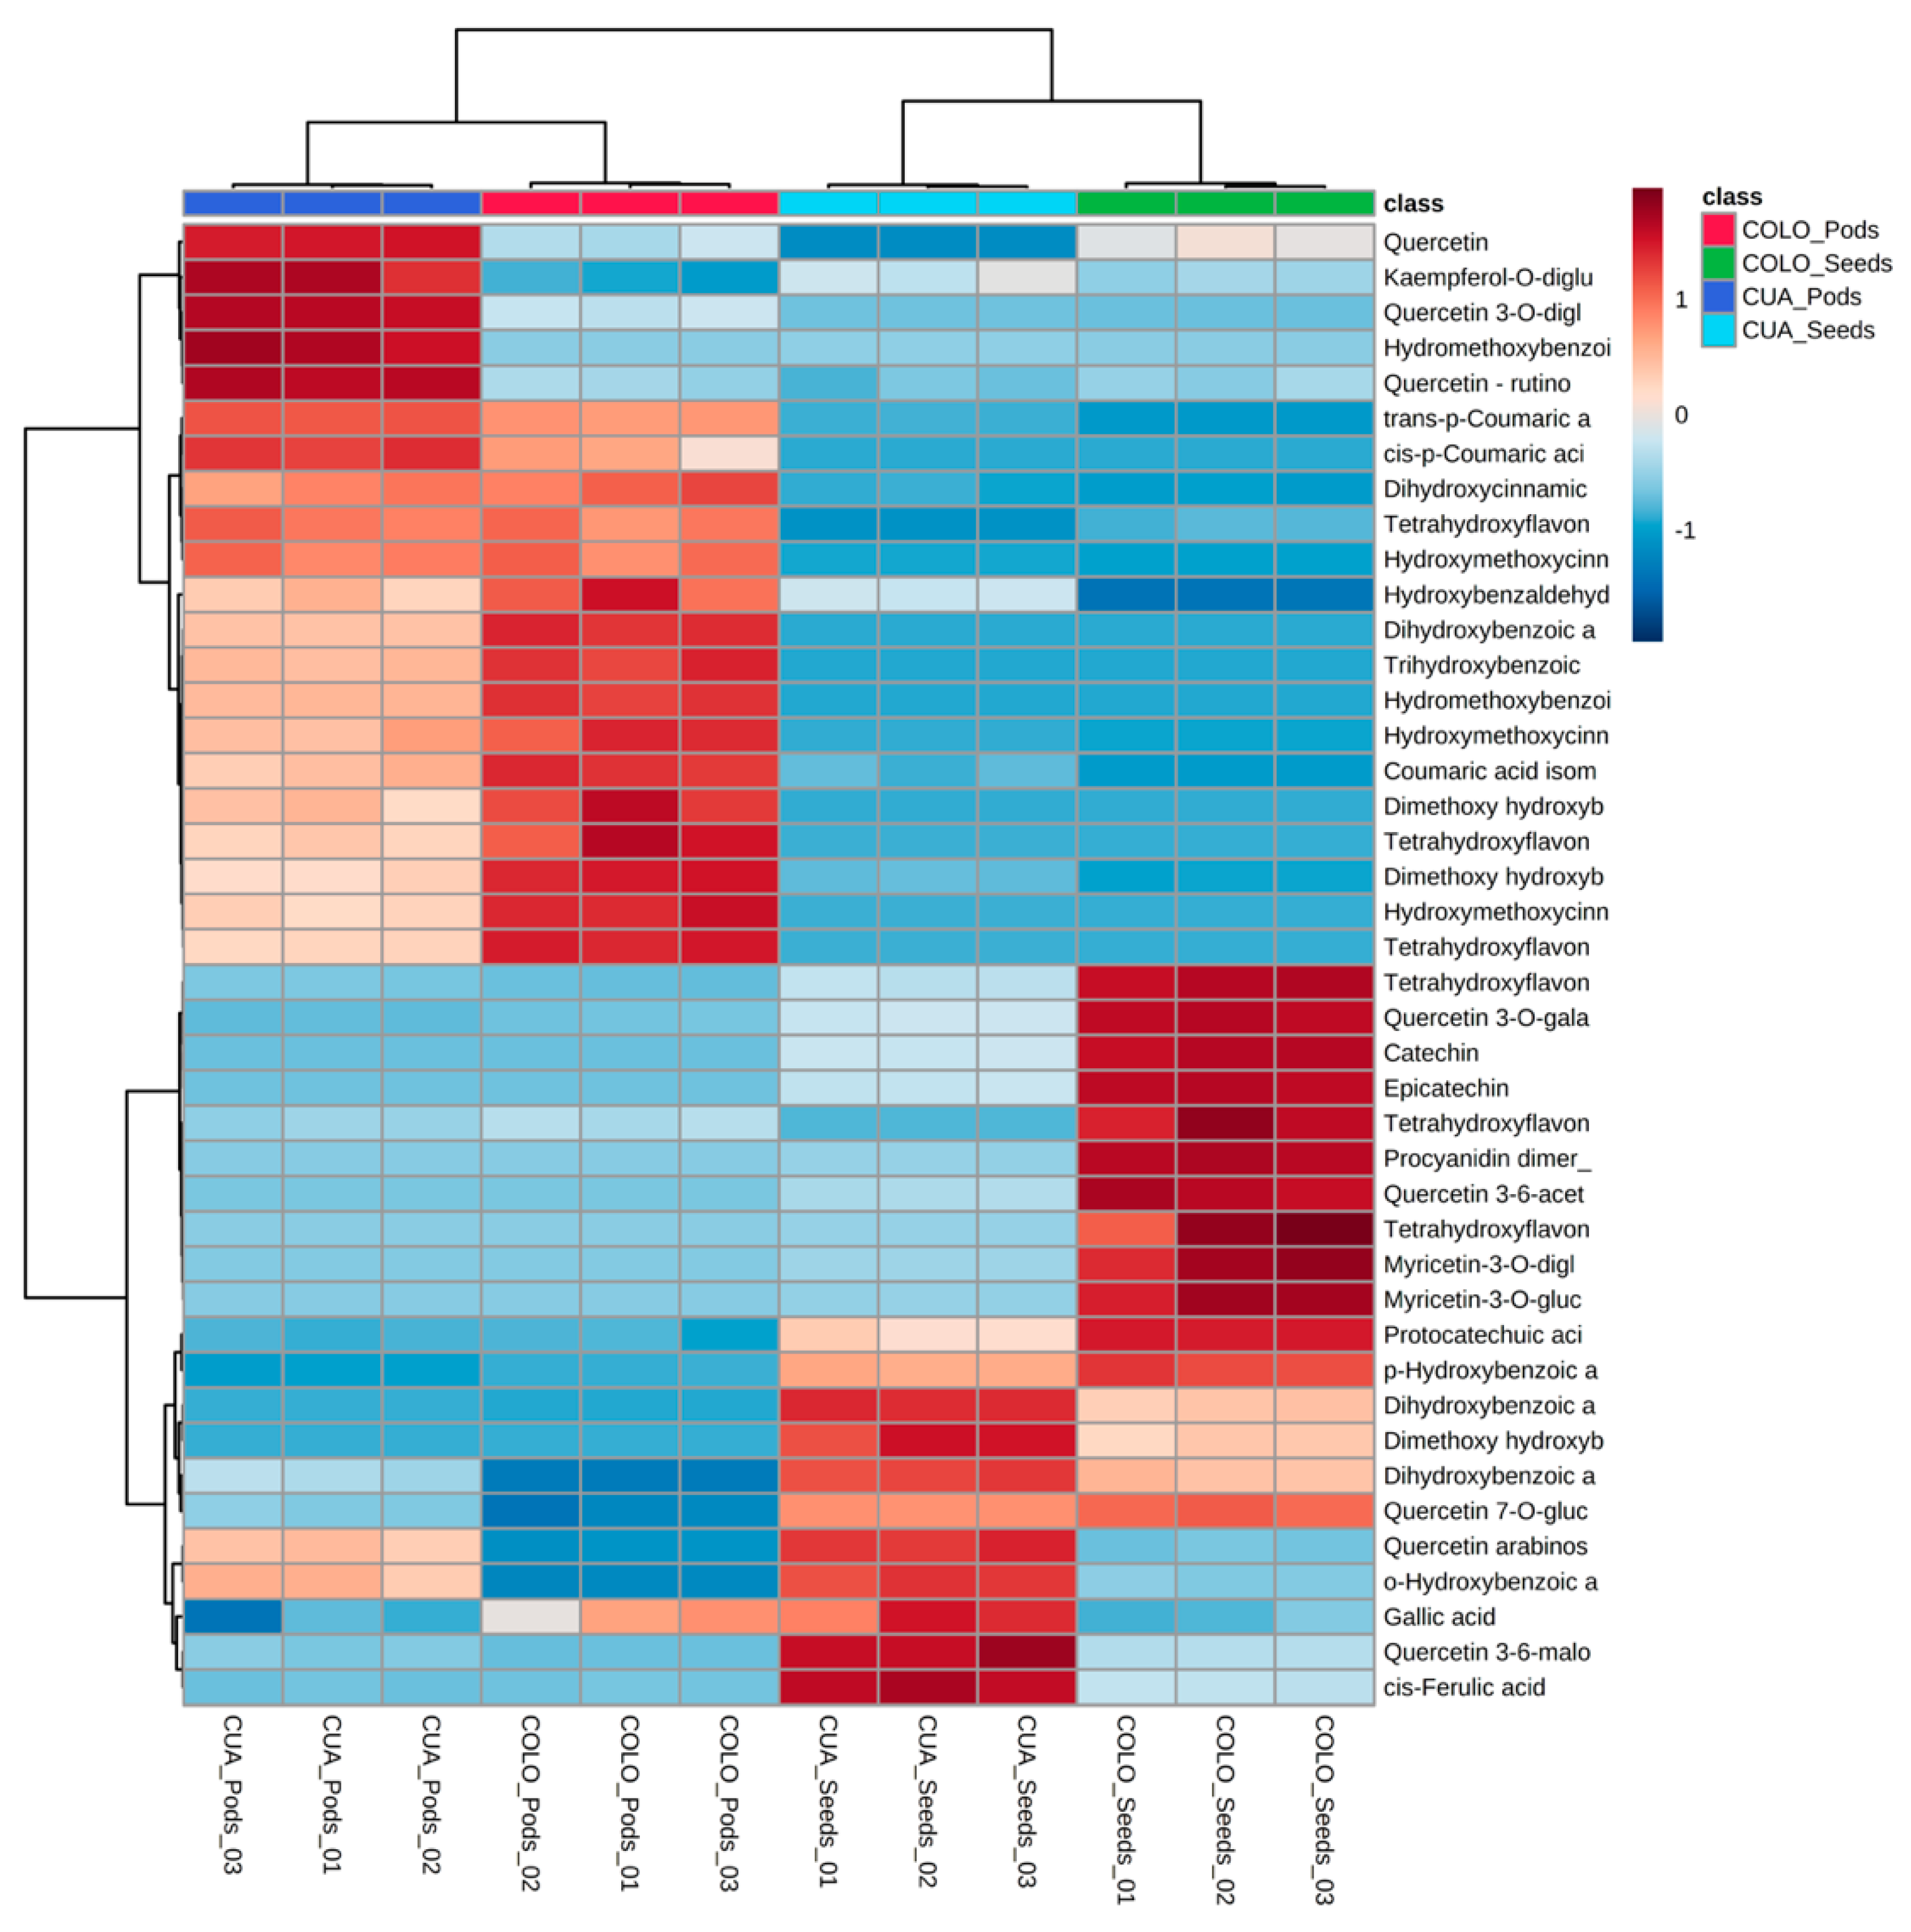
3.3.3. Linking Phytochemical Composition and Functional Properties

Remarkable differences between the analyzed varieties can be clearly observed in Figure 4, where cowpea samples are grouped according to their phenolic content as a result of a cluster analysis. The resulting heatmap shows a color code from high to low concentration, ranging from dark red to dark blue. Thus, CUA pods exhibited higher content on quercetin and quercetin glycosides (e.g., diglucoside and rutinoside derivatives) as well as kaempferol diglucoside, whereas hydroxylated and methoxylated benzoic and cinnamic acids, along with tetrahydroxylated flavones and flavonols, are more abundant in COLO pods. Regarding seed samples, the presence of gallic and ferulic acids and o-hydroxybenzoic acid was higher in CUA seeds, whereas COLO seeds showed higher concentration of p-hydroxybenzoic acid, myricetin glucosides, catechin, epicatechin, and other tetrahydroxylated flavonoids.
The detected phenolic compounds are the main compounds responsible for the antioxidant activity of the cowpea extracts since these phytochemicals can act as radical scavengers, metal chelators, reducing agents, hydrogen donors, and singlet oxygen quenchers [36]. The nutraceutical potential of buckwheat inflorescences has been confirmed and their further exploitation in food products will be very useful [37]. Thus, the values obtained from the sum of absolute peak areas of all phenolics in each sample are in agreement with the total phenolic content obtained in the Folin–Ciocalteu’s assay. Pod samples from both CUA and COLO varieties show the highest phenolic content and the highest antioxidant capacity compared to seed samples, as evidenced by the phenolic profiling analysis and in vitro testing assays.
Flavonoids have been reported to have antioxidant activity, as they can interact with enzymes, affecting pathways involved in anti-inflammatory processes [38]. The hydroxyl groups in the aromatic ring structures of flavonoid are hydrogen-donating substituents that are sensitive to redox reactions act as free radical scavenger [38]. These phytochemicals are compounds found at high concentrations in a variety of plant-based foods and beverages, associated with a variety of beneficial effects, such as increase in erythrocyte superoxide dismutase activity, decrease in lymphocyte DNA damage, decrease in urinary 8-hydroxy-2’-deoxyguanosine, and increase in plasma antioxidant capacity [39].
Regarding the role of phenolic compounds in cognition and synapsis, several research works have reported in this regard [40,41,42,43]. Thus, polyphenolic compounds like quercetin, tiliroside, or polyhydroxylated chalcone derivatives were reported to have neuroprotective properties attributed to their inhibiting activity against AChE [40]. Other polyphenols, such as genistein, luteolin-7-O-rutinoside, and silibinin, were shown to exhibit moderate activity as butyrylcholine esterase inhibitors [41]. Flavonoids are, among other polyphenols, an important class of polyphenols with demonstrated AChE inhibitory activity [42]. Flavonoids extracted from Ginkgo biloba have been reported to have inhibitory effects against AChE [43].
In silico models of AChE inhibition mechanism by quercetin revealed strong hydrogen bond formation with certain amino acids of AChE, leading to a competitive inhibition kinetics, as shown by molecular docking experiments. Thus, the combination of numerous hydrogen bonds with several amino acids and hydrophobic interaction may be responsible for inhibition of acetylcholine esterase activity by polyphenols [44]. Thus, flavonoids and other phenolic compounds are considered non-alkaloidal AChE inhibitors that seem to act as non-competitive inhibitors that bind to peripheral anionic sites mainly represented by the residues Tyr70, Asp74, Try121, Trp279, and Tyr334 in the “anionic” subsites, corresponding to the choline-binding pocket [45]. The strongest anti-AChE activity observed in cowpea samples was shown for pod extracts from both COLO and CUA varieties, which might be related to high levels of quercetin and quercetin glycosides, kaempferol diglucoside, and other tetrahydroxylated flavones and flavonols identified in these samples.

4. Conclusions

The results presented in this work demonstrate that the PLE is an environmentally safe methodology that is useful for the extraction of polyphenols from cowpea seeds and pods. These results also provide a benefit to the cultivation of this legume, since PLE affords bioactive compounds with a high potential as an ingredient in food formulations. The optimum conditions for the preparation of extracts were 50% ethanol in water at 170 °C with one extraction cycle for seeds and three extraction cycles for pods. The extraction yields in PLE were high, especially in pods (above 30% in both cultivars), which is a good point for valorization of this residue. Flavonols and phenolic acids, such as p-hydroxybenzoic acid, catechin, and dihydroxybenzoic acid, were the most abundant compounds in cowpea seeds’ extracts, whereas p-coumaric acid and several di- and trihydroxybenzoic acids were the major phenolic compounds in pods’ samples. Moreover, the pressurized liquid extracts also presented a notably inhibitory activity on the AChE test, being the first time this activity has been measured in this legume. AChE inhibition values of cowpea seeds’ and pods’ extracts by ME are comparable to PLE, suggesting that similar or even higher bioactive potential can be obtained using a greener and more efficient PLE procedure. The strongest anti-AChE activity observed in cowpea samples was shown for pod extracts from both COLO and CUA varieties, which might be related to high levels of quercetin and quercetin glycosides, kaempferol diglucoside, and other tetrahydroxylated flavones and flavonols identified by LC-ESI-q-TOF in these samples. Taken together, the results obtained herein reveal that cowpea could be used as an ingredient in the development of functional foods.

Supplementary Materials

The following are available online at https://0-www-mdpi-com.brum.beds.ac.uk/2073-4395/11/1/162/s1, Table S1: Coefficients of regression of third order model for the variables response of factorial design for the analysis of RSM for COLO seed PLE-extracts; Table S2: Coefficients of regression of third order model for the variables response of factorial design for the analysis of RSM for COLO pods PLE-extracts.

Author Contributions

Conceptualization, M.V.A, J.A.M., E.I.; Data curation, M.V.A. and G.Á.-R.; Formal analysis, M.V.A., J.A.M., G.Á.-R.; Funding acquisition, A.C. and E.I.; Investigation, M.V.A. and G.Á.-R.; Methodology, J.A.M. and E.I.; Software, J.A.M.; Supervision, J.A.M., A.C. and E.I.; Writing—original draft, M.V.A., G.Á.-R.; Writing—review & editing, M.V.A., G.Á.-R., J.A.M. and E.I. All authors have read and agreed to the published version of the manuscript.

Funding

This work was funded by Spanish Ministry of Research (AGL2017-89417-R). The research internship of M.V. Avanza in Spain was financed by the program Becas Externas from Consejo Nacional de Investigaciones Científicas y Técnicas (CONICET).

Institutional Review Board Statement

Not applicable.

Informed Consent Statement

Not applicable.

Data Availability Statement

Data sharing not applicable.

Conflicts of Interest

The authors declare no conflict of interest

References

  1. Deshpande, S.S. Food legumes in human nutrition: A personal perspective. Rev. Food Sci. Nutr. 1992, 32, 333–363. [Google Scholar] [CrossRef] [PubMed]
  2. Espin, J.C.; Garcia-Conesa, M.T.; Tomas-Barberán, F.A. Nutraceuticals: Facts and fiction. Phytochemistry 2007, 68, 2986–3008. [Google Scholar] [CrossRef] [PubMed]
  3. Avanza, M.V.; Acevedo, B.; Chaves, M.G.; Añón, M.C. Nutritional and anti nutritional components of four cowpea varieties under thermal treatments: Principal component analysis”. LWT Food Sci. Technol. 2013, 51, 148–157. [Google Scholar] [CrossRef]
  4. Awika, J.M.; Duodu, K.G. Bioactive polyphenols and peptides in cowpea (Vigna unguiculata) and their health promoting properties: A review. J. Funct. Foods 2017, 38, 686–697. [Google Scholar] [CrossRef]
  5. Onyelucheya, C.M.; Nwabanne, T.J. Onyelucheya, O.E.; Onuoha, O.E. Dilute acid hydrolysis of cowpea hulls: A kinetic study. Int. J. Adv. Sci. Eng. Inf. Technol. 2016, 6, 451–455. [Google Scholar] [CrossRef]
  6. Chikagwa-Malunga, S.K.; Adesogan, A.T.; Szabo, N.J.; Littell, R.C.; Phatak, S.C.; Kim, S.C.; Krueger, N.A. Nutritional characterization of Mucuna pruriens: 3. Effect of replacing soybean meal with Mucuna on intake, digestibility, N balance and microbial protein synthesis in sheep. Anim. Feed Sci. Technol. 2009, 148, 107–123. [Google Scholar] [CrossRef]
  7. Nguyen, V.T. (Ed.) Recovering Bioactive Compounds from Agricultural Wastes; Wiley-Blackwell, Ltd: Hoboken, NJ, USA, 2017; ISBN 978-1119168829. [Google Scholar]
  8. Durante, M.; Ferramosca, A.; Treppiccione, L.; Di Giacomo, M.; Zara, V.; Montefusco, A.; Piro, G.; Mita, G.; Bergamo, P.; Lenucci, M.S. Application of response surface methodology (RSM) for the optimization of supercritical CO2 extraction of oil from patè olive cake: Yield, content of bioactive molecules and biological effects in vivo. Food Chem. 2020, 332, 127405. [Google Scholar] [CrossRef]
  9. Mendis, S.; Fukino, K.; Cameron, A.; Laing, R.; Filipe, A., Jr.; Khatib, O.; Leowski, J.; Ewen, M. The availability and affordability of selected essential drugs for chronic diseases in six low and middle-income countries. Bull. World Health Org. 2007, 85, 279–288. [Google Scholar] [CrossRef]
  10. Nothlings, U.; Schulze, M.B.; Wiekert, C. Intake of vegetable legumes and fruit and risk for all-cause cardiovascular and cancer mortality in a European diabetic population. J. Nutr. 2008, 138, 775–781. [Google Scholar] [CrossRef] [Green Version]
  11. Tabet, N. Acetylcholinesterase inhibitors for Alzheimer’s disease: Anti-inflammatories in acetylcholine clothing. Age Ageing. 2006, 35, 336–338. [Google Scholar] [CrossRef] [Green Version]
  12. Senol, F.S.; Orhan, I.; Yilmaz, G.; Cicek, M.; Sener, B.; Acetylcholinesterase, butyrylcholinesterase, and tyrosinase inhibition studies and antioxidant activities of 33 Scutellaria, L. taxa from Turkey. Food Chem. Toxicol. 2010, 48, 781–788. [CrossRef] [PubMed]
  13. Karakaya, S.; Yılmaz, S.V.; Koca, M.; Demirci, B.; Sytar, O. Screening of non-alkaloid acetylcholinesterase inhibitors from extracts and essential oils of Anthriscus nemorosa (M.Bieb.) Spreng. (Apiaceae). S. Afr. J. Bot. 2019, 125, 261–269. [Google Scholar] [CrossRef]
  14. Zou, Y.-P.; Lu, Y.-H.; Wei, D.-Z. Protective effects of a flavonoidsrich extract of Hypericum perforatum L. against hydrogen peroxide-induced apoptosis in PC12 cells. Phytother. Res. 2010, 24, S6–S10. [Google Scholar] [CrossRef] [PubMed]
  15. Herrero, M.; Sánchez-Camargo, A.P.; Cifuentes, A.; Ibáñez, E. Plants, seaweeds, microalgae and food by-products as natural sources of functional ingredients obtained using pressurized liquid extraction and supercritical fluid extraction. TrAC Trends Anal. Chem. 2015, 71, 26–38. [Google Scholar] [CrossRef]
  16. Ojwang, L.O.; Yang, L.; Dykes, L.; Awika, J. Proanthocyanidin profile of cowpea (Vigna unguiculata) reveals catechin-O-glucoside as the dominant compound. Food Chem. 2013, 139, 35–43. [Google Scholar] [CrossRef]
  17. Ojwang, L.O.; Banerjee, N.; Noratto, G.D.; Angel-Morales, G.; Hachibamb, T.; Awika, J.M.; Mertens-Talcott, S.U. Polyphenolic extracts from cowpea (Vigna unguiculata) protect colonic myofibroblasts (CCD18Co cells) from lipopolysaccharide (LPS)-induced inflammation-modulation of microRNA 126. Food Funct. 2015, 6, 146–154. [Google Scholar] [CrossRef]
  18. Singleton, V.L.; Rossi, J.A. Colorimetry of total phenolics with phosphomolybdic-phosphotungstic acid reagents. Am. J. Enol. Vitic 1965, 16, 144–158. [Google Scholar]
  19. Re, R.; Pellegrini, N.; Proteggente, A.; Pannala, A.; Yanga, M.; Rice-Evans, C. Antioxidant activity applying an improved ABTS radical cation decolorizationassay, Free Rad. Biol. Med. 1999, 26, 1231–1237. [Google Scholar]
  20. Brand-Williams, W.; Cuvelier, M.E.; Berset, C. Use of a free radical method toevaluate antioxidant activity. LWT Food Sci. Technol. 1995, 28, 25–30. [Google Scholar] [CrossRef]
  21. Ellman, G.L.; Courtney, D.; Andies, V.; Featherstone, R.M. A new and rapid colorimetric determination of acetylcholinesterase activity. Biochem. Pharmacol. 1961, 7, 88–95. [Google Scholar] [CrossRef]
  22. Shahwar, D.; Rehman, S.U.; Raza, M.A. Acetyl cholinesterase inhibition potential and antioxidant activities of ferulic acid isolated from Impatiens bicolor Linn. J. Med. Plants Res. 2010, 4, 260–266. [Google Scholar]
  23. Vijayalaxmi, S.S.; Jayalakshmi, K.; Sreeramulu, K. Polyphenols from different agricultural residues: Extraction, identification and their antioxidant properties. Food Sci. Technol. 2015, 52, 2761–2769. [Google Scholar] [CrossRef] [PubMed] [Green Version]
  24. Zia-Ul-Haq, M.; Ahmad, S.; Amarowicz, R.; De Feo, V. Antioxidant Activity of the Extracts of Some Cowpea (Vigna unguiculata (L) Walp.) Cultivars Commonly Consumed in Pakistan. Molecules 2013, 18, 2005–2017. [Google Scholar] [CrossRef] [PubMed]
  25. Zia-Ul-Haq, M.; Ahmad, S.; Iqbal, S.; Luthria, D.L.; Amarowicz, R. Antioxidant potential of lentil cultivars commonly consumed in Pakistan. Oxid. Comm. 2011, 34, 819–831. [Google Scholar]
  26. Zia-Ul-Haq, M.; Iqbal, S.; Ahmad, S.; Bhanger, M.I.; Wiczkowski, W.; Amarowicz, R. Antioxidant potential of desi chickpea varieties commonly consumed in Pakistan. J. Food Lipids 2008, 15, 326–342. [Google Scholar] [CrossRef]
  27. Awika, J.M.; Rooney, L.W.; Wu, X.; Prior, R.L.; Zevallos, L.C. Screening methods to measure antioxidant activity of sorghum (Sorghum bicolor) and sorghum products. J. Agric. Food Chem. 2003, 51, 6657–6662. [Google Scholar] [CrossRef]
  28. Amarowicz, R.; Troszynska, A.; Barylko-Pikielna, N.; Shahidi, F. Extracts of polyphenolics from legume seeds—correlation between their total antioxidant activity, total phenolics content, tannins content and astringency. J. Food Lipids 2004, 11, 278–286. [Google Scholar] [CrossRef]
  29. Brazdauskas, T.; Montero, L.; Venskutonis, P.R.; Ibañez, E.; Herrero, M. Downstream valorization and comprehensive two-dimensional liquid chromatography-based chemical characterization of bioactives from black chokeberries (Aronia melanocarpa) pomace. J. Chromatogr. A 2016, 1468, 126–135. [Google Scholar] [CrossRef]
  30. Sánchez-Camargo, A.P.; García-Cañas, V.; Herrero, M.; Cifuentes, A.; Ibáñez, E. Comparative Study of Green Sub- and Supercritical Processes to Obtain Carnosic Acid and Carnosol-Enriched Rosemary Extracts with in Vitro Anti-Proliferative Activity on Colon Cancer Cells. Int. J. Mol. Sci. 2016, 17, 2046. [Google Scholar] [CrossRef] [Green Version]
  31. Song, J.E.; Song, J.H.; Cho, S.M.; Min, G.H.; Lee, J.S. Nutritional characteristics and physiological functionality of antidementia acetylcholinesterase inhibitor-containing methanol extract from Sorghum bicolor. Korean J. Food Nutr. 2010, 23, 226–232. [Google Scholar]
  32. Farhana, M.; Raisa, K.; Muhammad, A.; Muhammad, J. Potent AChE enzyme inhibition activity of Zizyphus oxyphylla: A new source of antioxidant compounds. Pak. J. Pharm. Sci. 2015, 28, 2053–2059. [Google Scholar]
  33. Ademiluyi, A.O.; Oboh, G.; Boligon, A.A.; Athayde, M.L. Dietary supplementation with fermented legumes modulate hyperglycemia and acetylcholinesterase activities in Streptozotocin-induced diabetes. Pathophysiology 2015, 22, 195–201. [Google Scholar] [CrossRef] [PubMed]
  34. Adewusi, E.A.; Steenkamp, V. In vitro screening for acetylcholinesterase inhibition and antioxidant activity of medicinal plants from southern Africa. Asian Pac. J. Trop. Med. 2011, 4, 829–835. [Google Scholar] [CrossRef] [Green Version]
  35. Cutillas, A.-B.; Carrasco, A.; Martinez-Gutierrez, R.; Tomas, V.; Tudela, J. Rosmarinus officinalis L. essential oils from Spain: Composition, antioxidant capacity, lipoxygenase and acetylcholinesterase inhibitory capacities, and antimicrobial activities. Plant. Biosyst. 2018, 152, 1282–1292. [Google Scholar] [CrossRef]
  36. Khadri, A.; Neffati, M.; Smiti, S.; Falé, P.; Lino, R.L.; Serralheiro, M.L.M. Antioxidant, antiacetylcholinesterase and antimicrobialactivities of Cymbopogon schoenanthus L. Spreng (lemon grass) from Tunisia. LWT Food Sci. Technol. 2010, 43, 331–336. [Google Scholar] [CrossRef]
  37. Oksana, S. Phenolic acids in the inflorescences of different varieties of buckwheat and their antioxidant activity. J. King Saud Univ. Sci. 2015, 27, 136–142. [Google Scholar]
  38. Araújo, T.A.S.; Alencar, N.L.; de Amorim, E.L.C.; de Albuquerque, U.P. A new approach to study medicinal plants with tannins and flavonoid contents from the local knowledge. J. Ethnopharmacol. 2008, 120, 72–80. [Google Scholar] [CrossRef] [PubMed]
  39. Williamson, G.; Manach, C. Bioavailability and bioefficacy of polyphenols in humans. II. Review of 93 intervention studies. Am. J. Clin Nutr. 2005, 81, 243S–255S. [Google Scholar] [CrossRef]
  40. Dhakal, S.; Kushairi, N.; Phan, C.W.; Adhikari, B.; Sabaratnam, V.; Macreadie, I. Dietary Polyphenols: A Multifactorial Strategy to Target Alzheimer’s Disease. Int. J. Mol. Sci. 2019, 20, 5090. [Google Scholar] [CrossRef] [Green Version]
  41. Orhan, I.; Kartal, M.; Tosun, F.; Şener, B. Screening of Various Phenolic Acids and Flavonoid Derivatives for their Anticholinesterase Potential. Z. Naturfirsch. C J. Biosci. 2007, 62, 829–832. [Google Scholar] [CrossRef]
  42. Khan, H.; Marya; Amin, S.; Kamal, M.A.; Patel, S. Flavonoids as acetylcholinesterase inhibitors: Current therapeutic standing and future prospects. Biomed. Pharmacother. 2018, 101, 860–870. [Google Scholar] [CrossRef] [PubMed]
  43. Ding, X.; Ouyang, M.-A.; Liu, X.; Wang, R.-Z. Acetylcholinesterase Inhibitory Activities of Flavonoids from the Leaves of Ginkgo biloba against Brown Planthopper. J. Chem. 2013, 2013, 645086. [Google Scholar] [CrossRef] [Green Version]
  44. Kuppusamy, A.; Arumugam, M.; George, S. Combining in silico and in vitro approaches to evaluate the acetylcholinesterase inhibitory profile of some commercially available flavonoids in the management of Alzheimer’s disease. Int. J. Biol. Macromol. 2017, 95, 199–203. [Google Scholar] [CrossRef] [PubMed]
  45. Santos, T.C.d.; Gomes, T.M.; Pinto, B.A.S.; Camara, A.L.; Paes, A.M.d.A. Naturally Occurring Acetylcholinesterase Inhibitors and Their Potential Use for Alzheimer’s Disease Therapy. Front. Pharmacol. 2018, 9, 1192. [Google Scholar]
Figure 1. Standardized Pareto charts and response surfaces for the three response variables studied in the experimental design (blue and gray bars show negative or positive effects, respectively) obtained with one extraction cycle of Colorado (COLO) cowpea seeds.
Agronomy 11 00162 g001aAgronomy 11 00162 g001b
Figure 2. Standardized Pareto charts and response surfaces for the three response variables studied in the experimental design (blue and gray bars show negative or positive effects, respectively) obtained with three extraction cycles of COLO cowpea pods.
Agronomy 11 00162 g002
Figure 3. UHPLC-ESI-q-TOF-MS (Ultrahigh Performance Liquid Chromatography coupled to quadrupole-time-of-flight mass spectrometer) extracted ion chromatograms (EICs) corresponding to the phenolic PLE extracts of: (A) Colorado seeds, (B), Colorado pods, (C), Cuarenton seeds, (D) Cuarenton pods. See Table 7 for peak annotation.
Agronomy 11 00162 g003
Figure 4. Heatmap showing the distribution of the main phenolic components identified in seeds’ and pods’ PLE extracts of COLO and CUA varieties of cowpea.
Agronomy 11 00162 g004
Table 1. Yields, polyphenols’ content, and antioxidant activity (DPPH and ABTS) of cowpea seed and pods’ extracts from Colorado variety obtained by maceration.
SamplesSolvent Yield (%)TPC (mg GAE g−1)TEAC (mmol TE g−1)EC50 (µg/mL)
COLO seedethanol1.67 ± 0.16 c17.70 ± 0.40 b0.198 ± 0.006 c93.86 ± 1.63 c
water5.55 ± 1.41 b15.32 ± 0.25 c0.460 ± 0.004 b268.92 ± 4.01 a
water-2% v/v formic acid 7.26 ± 0.81 b12.88 ± 0.37 d0.121 ± 0.002 c271.57 ± 3.99 a
water-5% v/v formic acid 7.36 ± 1.45 b17.40 ± 0.24 b0.115 ± 0.001 c191.53 ± 3.60 b
acetone-1% v/v formic acid 12.61 ± 1.13 a65.68 ± 0.31 a3.650 ± 0.267 a21.82 ± 0.46 d
COLO podsethanol1.18 ± 0.12 b16.70 ± 0.49 d0.442 ± 0.010 c479.64 ± 8.34 b
water4.54 ± 0.95 a43.84 ± 0.26 a2.283 ± 0.028 a326.74 ± 4.87 c
water-2% v/v formic acid 5.45 ± 1.02 a30.20 ± 0.67 c0.086 ± 0.001 d566.12 ± 8.32 a
water-5% v/v formic acid 4.63 ± 0.83 a31.50 ± 0.41 b0.066 ± 0.005 d293.50 ± 5.52 d
acetone-1% v/v formic acid 5.44 ± 0.75 a44.35 ± 0.96 a1.327 ± 0.045 b142.45 ± 3.02 e
The values are means ± sd. Different superscripts (a, b, c, d) indicate significant differences (p ≤ 0.05) within columns for each type of sample (seed or pods). Two blocks used for pairwise comparison, seed or pod.
Table 2. Experimental matrix design conditions (factor levels between parentheses) and results for each response variable studied for the optimization of the PLE of COLO cowpea seeds. Results are expressed as mean ± sd.
Exp. RunExtraction ConditionsResponse Variables
Temp. (°C)Ethanol (%)CyclesYield (%)TPC
(mg GAE g−1) a
ABTS
(mmol TE g−1) b
DPPH EC50
(µg mL−1)
1500217.70 ± 0.3713.83 ± 0.150.207 ± 0.017390.08 ±5.61
2505019.15 ± 0.1922.29 ± 0.350.468 ± 0.01588.26 ± 1.45
35050314.56 ± 0.3024.86 ± 0.100.568 ± 0.03373.46 ± 1.01
45010021.14 ± 0.0213.26 ± 0.200.073 ± 0.002429.10 ± 6.14
51100116.24 ± 0.349.79 ± 0.150.164 ± 0.012389.43 ± 6.50
61100319.28 ± 0.4012.73 ± 0.230.275 ± 0.010283.06 ± 2.32
7 c11050220.70 ± 0.4313.89 ± 0.210.324 ± 0.009159.24 ± 1.90
8 c11050221.44 ± 0.4411,33 ± 0.210.287 ± 0.011160.40 ± 3.29
9 c11050220.69 ± 0.4311.03 ± 0.250.282 ± 0.011160.39 ± 3.28
10 c11050221.46 ± 0.4412.83 ± 0.210.297 ± 0.012159.74 ± 1.28
1111010012.60 ± 0.0512.73 ± 0.060.158 ± 0.002318.09 ± 5.28
1211010033.81 ± 0.0813.09 ± 0.250.214 ± 0.007307.72 ± 5.11
131700265.09 ± 1.3519.86 ± 0.170.275 ± 0.010150.55 ± 2.32
1417050135.33 ± 0.7342.76 ± 0.780.926 ± 0.05549.31 ± 1.42
1517050344.57 ± 0.9233.63 ± 0.380.724 ± 0.04064.22 ± 1.88
1617010029.30 ± 0.1940.36 ± 0.260.895 ± 0.03167.01 ± 1.93
Superindex meaning; a: GAE (gallic acid equivalents), b: TE (Trolox equivalents), c: experimental design center points.
Table 3. Experimental matrix design conditions (factor levels between parentheses) and results for each response variable studied for the optimization of the PLE of COLO cowpea pods. Results are expressed as mean ± sd.
Exp. RunExtraction ConditionsResponse Variables
Temp. (°C) Ethanol (%)CyclesYield (%)TPC
(mg GAE g−1) a
ABTS
(mmol TE g−1) b
DPPH EC50
(µg mL−1) c
150028.97 ± 0.2049.19 ± 0.421.126 ± 0.013409.75 ± 7.19
2505015.35 ± 0.1253.29 ± 0.352.067 ± 0.046212.24 ± 4.54
3505037.99 ± 0.1852.32 ± 0.951.565 ± 0.051160.56 ± 1.62
45010021.76 ± 0.049.02 ± 0.320.209 ± 0.002579.42 ± 7.24
51100113.11 ± 0.3039.09 ± 0.450.758 ± 0.024375.30 ± 5.93
61100324 ± 0.5533.86 ± 0.260.588 ± 0.021398.72 ± 5.90
7 c11050213.26 ± 0.3050.32 ± 1.200.916 ± 0.032187.62 ± 3.13
8 c11050213.54 ± 0.3149.02 ± 0.490.865 ± 0.006188.47 ± 3.37
9 c11050213.99 ± 0.3246.06 ± 1.220.898 ± 0.046193.59 ± 3.17
10 c11050213.46 ± 0.3149.52 ± 0.720.906 ± 0.038189.60 ± 3.91
1111010011.51 ± 0.0344.36 ± 0.530.996 ± 0.060188.26 ± 3.41
1211010033.54 ± 0.0854.99 ± 0.511.363 ± 0.026168.49 ± 2.33
131700234.01 ± 0.7779.62 ± 0.650.796 ± 0.01962.03 ± 1.33
1417050121.36 ± 0.49124.46 ± 2.523.037 ± 0.13532.84 ± 0.50
1517050329.56 ± 0.67107.42 ± 2.052.442 ± 0.04335.21 ± 0.58
1617010027.86 ± 0.18174.62 ± 1.584.549 ± 0.17927.08 ± 0.43
Superindex meaning; a: GAE (gallic acid equivalents), b: TE (Trolox equivalents), c: experimental design center points.
Table 4. Optimum Pressurized liquid extraction (PLE) conditions for cowpea seeds predicted by the statistical model and those obtained experimentally. Results are expressed as mean ± sd of three independent experiments.
Extraction ConditionsResponse Variables
Temp. (°C)Ethanol (%)CyclesYield (%)TPC
(mg GAE g−1)
ABTS
(mmol TE g−1)
DPPH EC50
(µg mL−1)
ORAC
(mmol TE g−1)
Predicted17050136.5542.010.93-
Experimental (COLO seeds)17050136.02 ± 1.2240.60 ± 0.270.805 ± 0.00450.38 ± 2.4882.34 ± 4.15
% RSD 3.330.640.43-
Experimental (CUA seed)17050132.87 ± 1.2322.69 ± 1.530.448 ± 0.00686.14 ± 1.7561.78 ± 3.74
Table 5. Optimum PLE conditions for cowpea pods predicted by the statistical model and those obtained experimentally. Results are expressed as mean ± sd of three independent experiments.
Extraction ConditionsResponse Variables
Temp. (°C)Ethanol (%)CyclesYield (%)TPC
(mg GAE g−1)
ABTS
(mmol TE g−1)
DPPH EC50
(µg mL−1)
ORAC
(mmol TE g−1)
Predicted17068.932.9922.86136.363.505-
Experimental (COLO pods)17069323.49 ± 0.93116.97 ± 1.122.728 ± 0.11233.48 ± 1.08127.65 ± 6.32
% RSD 4.060.823.13-
Experimental (CUA pods)17069325.38 ± 0.45104.53 ± 1.032.227 ± 0.10145.41 ± 0.96118.51 ± 5.17
Table 6. Results of acetyl cholinesterase inhibitory activity of cowpea seeds’ and pods’ extracts obtained by maceration extraction (ME) and pressurized liquid extraction (PLE). EC50 galantamine: 0.0011 mg mL−1.
Samples% Inhibition AChEmg Galantamine Equivalents Per g Extract *Extracts Concentration (mg mL−1)
PLE-COLO seed34.965 ± 2.530 c0.211 ± 0.020 c1
PLE-CUA seed31.050 ± 2.463 c0.180 ± 0.019 c1
PLE-COLO pods51.630 ± 3.201 a0.689 ± 0.050 a0.5
PLE-CUA pods40.381 ± 2.939 b0.473 ± 0.060 b0.5
ME-COLO seed43.790 ± 0.622 c0.281 ± 0.004 c1
ME-CUA seed40.820 ± 0.622 d0.257 ± 0.004 d1
ME-COLO pods49.820 ± 0.254 a0.660 ± 0.004 a0.5
ME-CUA pods47.435 ± 1.675 b0.638 ± 0.049 b0.5
The values are means ± sd. Different superscripts (a, b, c, d) indicate significant differences (p ≤ 0.05) within columns for each treatment (PLE or ME). Pairwise comparison has been done per sample and treatment, which means two blocks per column.* Galantamine equivalents calculated by Acetylcholinesterase inhibition (ACheI) percentage.
Table 7. Tentatively identified phenolic compounds in cowpea seed and pod extracts obtained by PLE under optimal extraction conditions. Relative abundance of each compound in Colorado (COLO) and Cuarenton (CUA) varieties are expressed in terms of absolute area values.
Peak No.RT (min)Tentative IdentificationMolecular Formula[M-H]- (m/z) (Calculated)Error (ppm)Ref.bAbsolute Area Values
COLO (Seeds)COLO (Pods)CUA (Seeds)CUA (Pods)
P11.73Gallic acid aC7H6O5169.0142−6.2[4,16]20,38151,73310,47135,212
P22.03Quercetin-O-malonylglucosideC24H22O15549.0886−2.5[4]13,893942918,69114,766
P32.23Dihydroxybenzoic acid IC7H6O4153.01933.0M, H686,613158,144356,820202,548
P42.49Protocatechuic acid aC7H6O4153.01931.0[4]108,05152,11320,09155,719
P52.82Dimethoxy hydroxybenzoic acid IC9H10O5197.0455−4.3M, H6365338,0017059176,840
P62.91Hydroxymethoxycinnamic acid IC10H10O4193.0506−7.9M, HND110,100ND56,353
P73.14Hydroxymethoxycinnamic acid IIC10H10O4193.0506−3.8M, HND21,422ND14,748
P83.15p-Hydroxybenzoic acid aC7H6O3137.02443.5[4]1,690,090592,038399,005452,670
P93.19Dihydroxybenzoic acid IIC7H6O4153.0193−5.4M, HND335,348ND203,317
P103.19Trihydroxybenzoic acidC7H6O5169.0142−2.0M, HND808,002ND522,832
P113.33Hydroxymethoxybenzoic acid IC8H8O4167.0350−7.0M, HND272,625ND180,460
P123.38Tetrahydroxyflavone IC15H10O6285.04052.5M, H39,29862023043354
P133.46Coumaric acid isomerC9H8O3163.0401−1.6MND136,874239788,486
P143.46Tetrahydroxyflavonol IC15H10O7301.03542.4M, H12,717NDNDND
P153.58Catechin aC15H14O6289.07181.8[4,16]316,782ND20,473ND
P163.74Hydroxymethoxybenzoic acid IIC8H8O4167.0350−7.0M, HNDNDND61,579
P173.91Dimethoxy hydroxybenzoic acid IIC9H10O5197.0455−6.8M, HND167,147ND98,377
P183.99HydroxybenzaldehydeC7H6O2121.02953.2M, H29,494399,54735,866302,155
P194.27Epicatechin aC15H14O6289.07183.9[4,16]148,640ND8782ND
P204.28Dihydroxycinnamic acidC9H8O4179.0350−5.4M, H6182177,9963480165,317
P214.37Dihydroxybenzoic acid IIIC7H6O4153.01935.0M, H38,756ND17,37639,222
P224.46Procyanidin dimer (B-type)C30H26O12577.13523.2[16,17]12,617NDNDND
P234.46Myricetin-O-diglucosideC27H30O18641.13591.6[4]6173NDNDND
P244.67Quercetin arabinosyldiglucosideC32H38O21757.1833−1.7[4]10,194696412,46049,487
P254.70trans-p-Coumaric acid aC9H8O3163.0401−1.6[4]108,0542,391,37073,6083,001,767
P264.85Dimethoxy hydroxybenzoic acid IIIC9H10O5197.04553.3M,H52,771ND30,899ND
P274.93Quercetin-O-diglucoside C27H30O17625.14101.2[4,17]ND63,890ND348,603
P284.96cis-p-Coumaric acid C9H8O3163.0401−1.6[4]ND201,089ND333,810
P294.97Myricetin-O-glucosideC21H20O13479.08312.8[4]13,221NDNDND
P305.25o-Hydroxybenzoic acid C7H6O3137.02444.9M, H40,56616,00841,841180,368
P315.26Kaempferol-O-diglucosideC27H30O16609.1461−1.9[4,17]49365198194826,837
P325.28cis-Ferulic acid aC10H10O4193.0506−0.1[4]25,91118,10731,67217,318
P335.41Quercetin rutinoside aC27H30O16609.1461−3.1[4]1979381248511,698
P345.48Quercetin-O-glucosideC21H20O12463.08822.1[4]22,2746358623916,978
P355.57Quercetin-O-galactoside C21H20O12463.08821.7[4]129,18317,69810,28210,786
P365.86Tetrahydroxyflavone IIC15H10O6285.0405−4.0M224721,751ND23,389
P375.91Tetrahydroxyflavonol IIC15H10O7301.03544.7M39,46014,011ND10,276
P386.26Quercetin-O-acetylglucosideC23H22O13505.09882.0[4,17]32,405ND1190ND
P397.62Quercetin aC15H10O7301.03542.0[4]12,11516,470ND52,235
P407.63Tetrahydroxyflavone IIIC15H10O6285.0405−1.9M, HND128,925ND68,960
P417.79Hydroxymethoxycinnamic acid IIIC10H10O4193.0506−5.3M, HND20,692ND21,232
P428.24Tetrahydroxyflavonol IIIC15H10O7301.0354−3.2M, HND50,728ND25,997
Sum of total phenolic compounds 3,631,3686,614,2111,113,4396,873,696
a Confirmed with reference standard. b Reference: reference number in brackets, Metlin data base (M), HMDB (H); ND: not detected.
Publisher’s Note: MDPI stays neutral with regard to jurisdictional claims in published maps and institutional affiliations All authors have read and agreed to the published version of the manuscript..

