1. Introduction
Mechanization in agriculture was adapted to advance the crop cultivation systems to produce abundant food for the swiftly growing world population [
1]. However, intensive and inefficient machine applications with augmented energy demand and emissions of greenhouse gases in mechanized farming are some of the serious concerns for food production, sustainability, and environmental quality. Off-road traffic in general, and agricultural wheeled vehicles in particular, are major consumers of fossil energy due to their heavyweight and complex wheel–soil interaction [
2,
3].
Conventional wheeled tractors with low, medium, and high power ratings are the main power source for many of the cultivation operations especially land preparation and sowing. Therefore, tractors consume a large amount of energy by burning fossil fuels in the engine that converts thermal energy to mechanical energy for pulling and rotating the tillage implements. Emissions of greenhouse gases through the burning of fossil fuels in the tractor engine during cultivation process are the main source of environmental contamination and global warming as CO
2 mainly emitted through fossil fuels burning [
2,
4,
5,
6]. If the use of fossil fuels and consequently CO
2 emissions continued at their current rate, massive climate changes will be possible [
7,
8,
9].
Tillage is one of the basic and major cultivation operations that require higher power and shares 55–60% of total field energy consumed in agricultural production [
10]. Tractor equipment weight is increasing due to higher traction demand from conventional wheeled tractors for intensive tillage operations [
11]. Interaction of drive wheel and terrain soil in driving process accounts for the 20–55% losses of energy and power of wheeled tractors that severely affect the consumption and demand of fuel in drawbar applications of wheeled tractors [
3]. A study reported 575 million liters of annual fuel loss in the USA due to the mismanagement of off-road vehicles at the soil–wheel interfaces in agricultural applications alone [
3]. The energy lost in wheel soil interaction and the driving process is used to wear the tires and to compact the soil that causes detrimental effects on crop production [
12,
13].
Soil compaction alleviation requires intensive deep tillage that has a significant effect on power requirement and fuel consumption [
14,
15], in the process heavyweight tractors with poor traction again accelerate the compaction process and energy consumption, and this vicious cycle of soil compaction and energy loss is kept going on [
12]. Fuel prices are going high day by day, the abundant fuel consumption and energy losses in different mechanized cultivation operations are unviable economically and ecologically in farming systems.
Energy use efficiency, sometimes simply called energy efficiency, is to accomplish a task with minimum energy input and without compromising quality or quantity of the service or the product. Reducing fossil energy consumption by improving energy use efficiency and productivity and avoid soil compaction by proper management of machine operations is the best way to save natural and financial resources and to manage the agricultural sustainability and environmental quality [
2]. The fuel consumption and field productivity of agricultural wheeled tractors in tillage operations depend on several factors and traction performance concerning tractor weight is a very important one [
16,
17,
18].
Field productivity in this study is the operational productivity of the farm tractor that means the amount of fieldwork done in unit operational time, while it can also be considered as energy productivity as “the amount of useful work done on the expense of the unit amount of energy”. By improving the operational efficiency and productivity of farm tractors with the lowest possible tractor weight can help to reduce energy consumption [
11,
19,
20]. It is necessary to select the equipment and configuration of the tractor and tillage implements and travel speed of tractor optimal for intended field tillage operation [
2,
4]. Efficient operation of farm tractors in tillage operations includes; (1) fuel efficiency of the engine, (2) power transfer efficiency of the drivetrain and (3) power transfer efficiency of the traction device/drive gear (wheels and tracks). This manuscript focuses on the third part as the improvement of traction and power transfer indices can optimize fuel consumption, engine exhaust emissions, and field productivity of the tillage operations [
21].
The fraction of engine rotational speed is wasted due to wheel slip and causes travel reduction (TR) i.e., reducing travel speed and traveled distance of tractor. Consequently, the operation time of the tractor increased and sometimes the engine rotational speed increased to maintain the travel speed of the tractor. In both cases, the fuel consumption of tractor for specific operation increases and generates more exhaust emissions. It is required to maintain the TR below defined limit of 14–16% to maintain the efficiency and performance of tractor and also to avoid soil structure damage [
11,
22]. Higher slip also demonstrates the failure of drive wheels and terrain surface to consume the available tractor power. When a tractor operates at 70–85% of its nominal rotational speed and consumes 80% of traction power, 5–25% of fuel consumption can be saved in tillage operations [
23,
24].
If heavy tractors are used, the traction power will remain underutilized with lower drive wheel slip (<5%), in this way, fuel consumption increased up to 15% and is particularly significant at the higher working speed [
25].
The energy demand of tractor for cultivation operations depends on terrain characteristics and driving wheel type. In earlier times of tractors, rigid wheels were used as drive gears that had good traction characteristics in field conditions. In low-land farming and rice cultivation areas, rigid wheels are still being used. Tires were implemented by replacing rigid wheels to eliminate the issues of on-road drive, limited speed and higher vibration and noise. However, due to poor tire terrain interaction, high traction demands, energy losses, and soil compaction by tire wheels, rigid wheels are reconsidered for dryland cultivation as drive wheels with modified and improved structure. A new traction device “rigid lugged wheel (RLW)” was designed for intensive tillage operations and high traction demand with the similar mounting mechanism of tire wheels. RLW can engender better traction, help to improve traction, and power transfer indices in field conditions without increasing the total machine weight as the high lugs of RLW can be engaged into the loose plow layer soil and control the wheel slip within the optimum range. Eventually, it will help to avoid energy losses, economic losses, and soil compaction in agriculture. The tractive performance and wheel soil interaction of RLW are already reported [
12,
26].
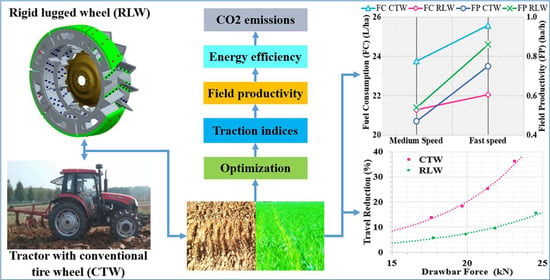
This study was aimed to compare and analyze the traction and power transfer indices in detail and the impact on fuel consumption and field productivity of farm tractor with conventional tire wheel (CTW) and RLW in field tillage operations. Trails were conducted using a 70 kW conventional farm tractor and five-bottom moldboard plow to assess the traction and power transfer indices and the consequent improvement of fuel consumption efficiency and field productivity.
2. Materials and Methods
2.1. Experiments and Field Layout Plan
Field experiments on the agricultural wheeled tractor for traction performance, fuel consumption, and field productivity were conducted at main campus research area of Huazhong Agricultural University (HZAU) situated in the mid-lower Yangtze River basin area, Wuhan, China. The soil texture type was silty clay loam.
Table 1 shows the surveyed data of soil physical and mechanical properties of the experimental field, measurement methods were explained in a previous study [
12].
According to the study requirement of field tractor performance related to traction and power transfer efficiency, energy efficiency and field productivity, three field experiments were planned with the following field layouts (
Table 2).
The first experiment tested the traction ability of two wheels (CTW and RLW) in an untilled field. Test plots were provided with the free area as buffer space on both ends of test plots so that implement lowered into the soil earlier to achieve the uniform and steady operational state when entering to the actual plot. For the second experiment, two test fields (tilled and untilled) were used for motion resistance test, both fields were in good dry condition. Fixed the poles to mark 30 m distance at sides of each plot and pulled the test tractor at a uniform speed to measure the pull force required to move the tractor “the motion resistance”. The third experiment was conducted for fuel consumption and field productivity measurements in field plowing/tillage operations.
In all three experiments, the speed of the tractor engine was set to 1660 rpm with hand throttle but due to the variable soil resistance and manual control of lowering and lifting of tillage implement, the variation in tillage depth and engine speed was observed and recorded.
2.2. Experimental Equipment Setup
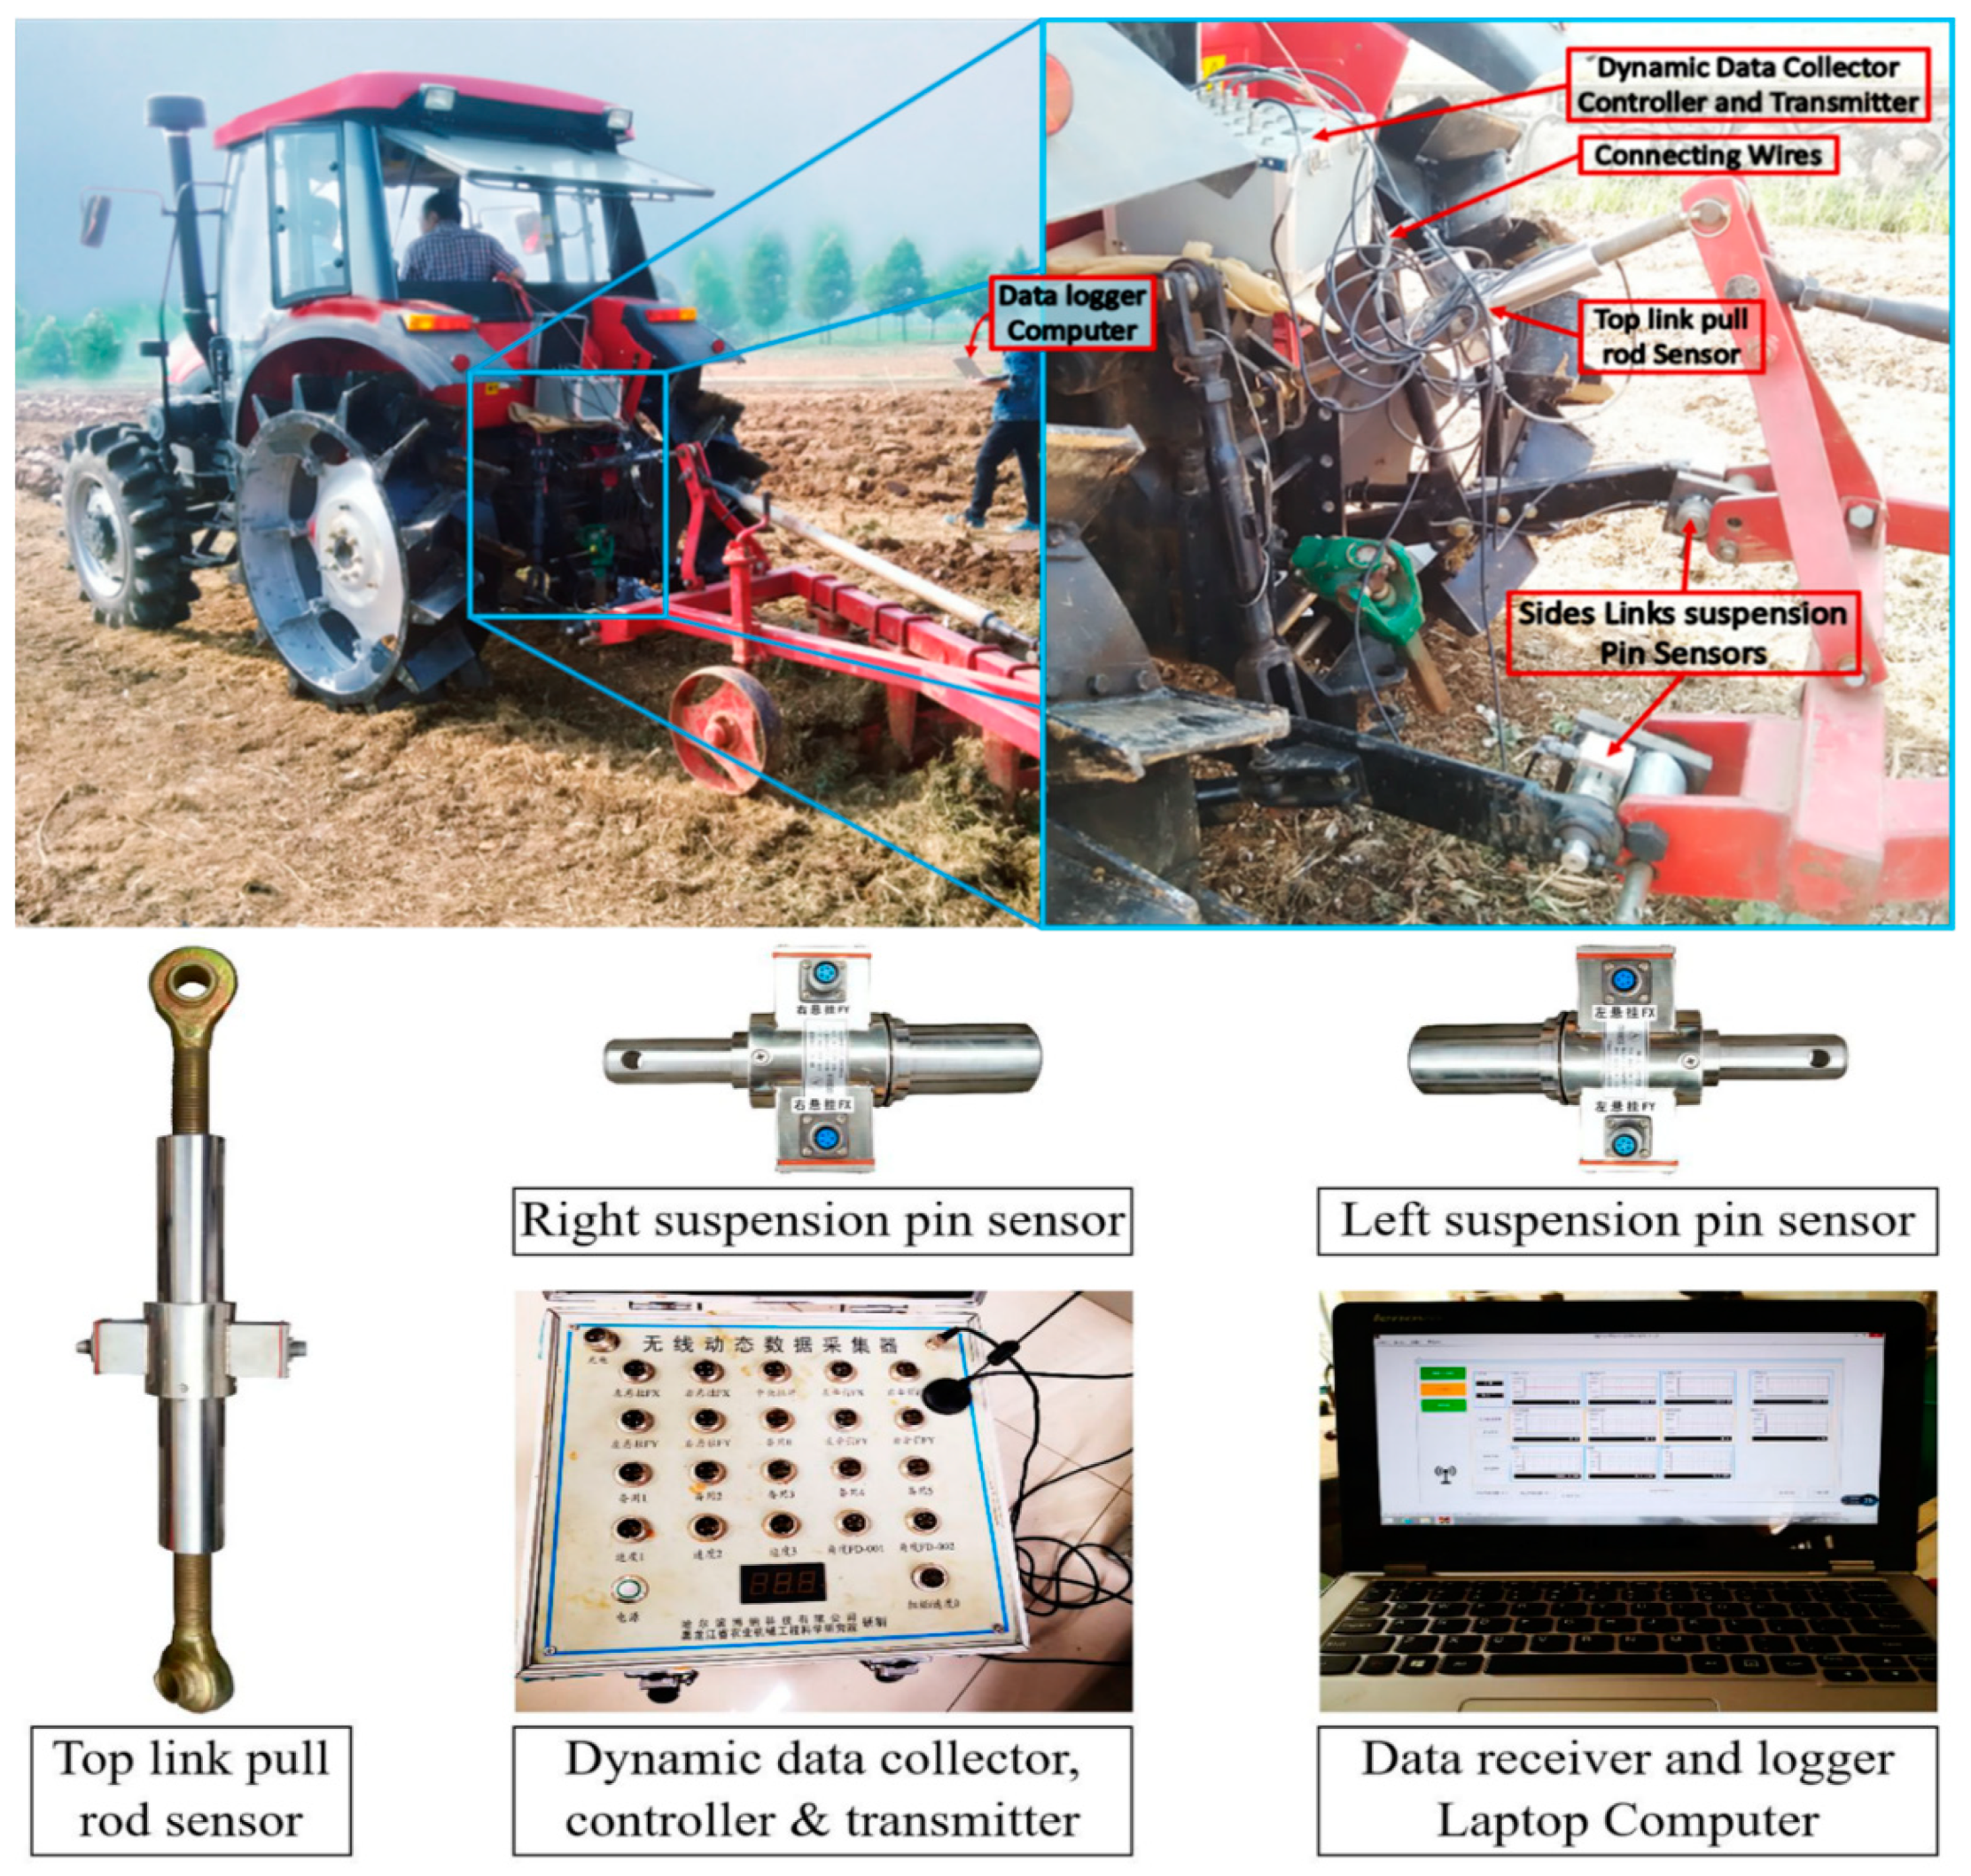
Field test equipment consisted of a mechanically assisted front-wheel drive (MFWD) YTO-LX-954 agricultural tractor with a three-point linked moldboard plow and draft sensor setup (
Figure 1). To test the traction performance of both type wheels on the same tractor, firstly tests were conducted with CTWs and then RLWs replaced the CTWs and test procedure was repeated.
Table 3 presents the specifications and operational parameters of the tractor and traction devices (drive wheels), a previous study discussed and presented the source of data and measurement methods [
12]. For tillage and traction tests, a standard moldboard plow with five bottom shears was used.
Table 4 shows the specifications and operational parameters of the moldboard plow.
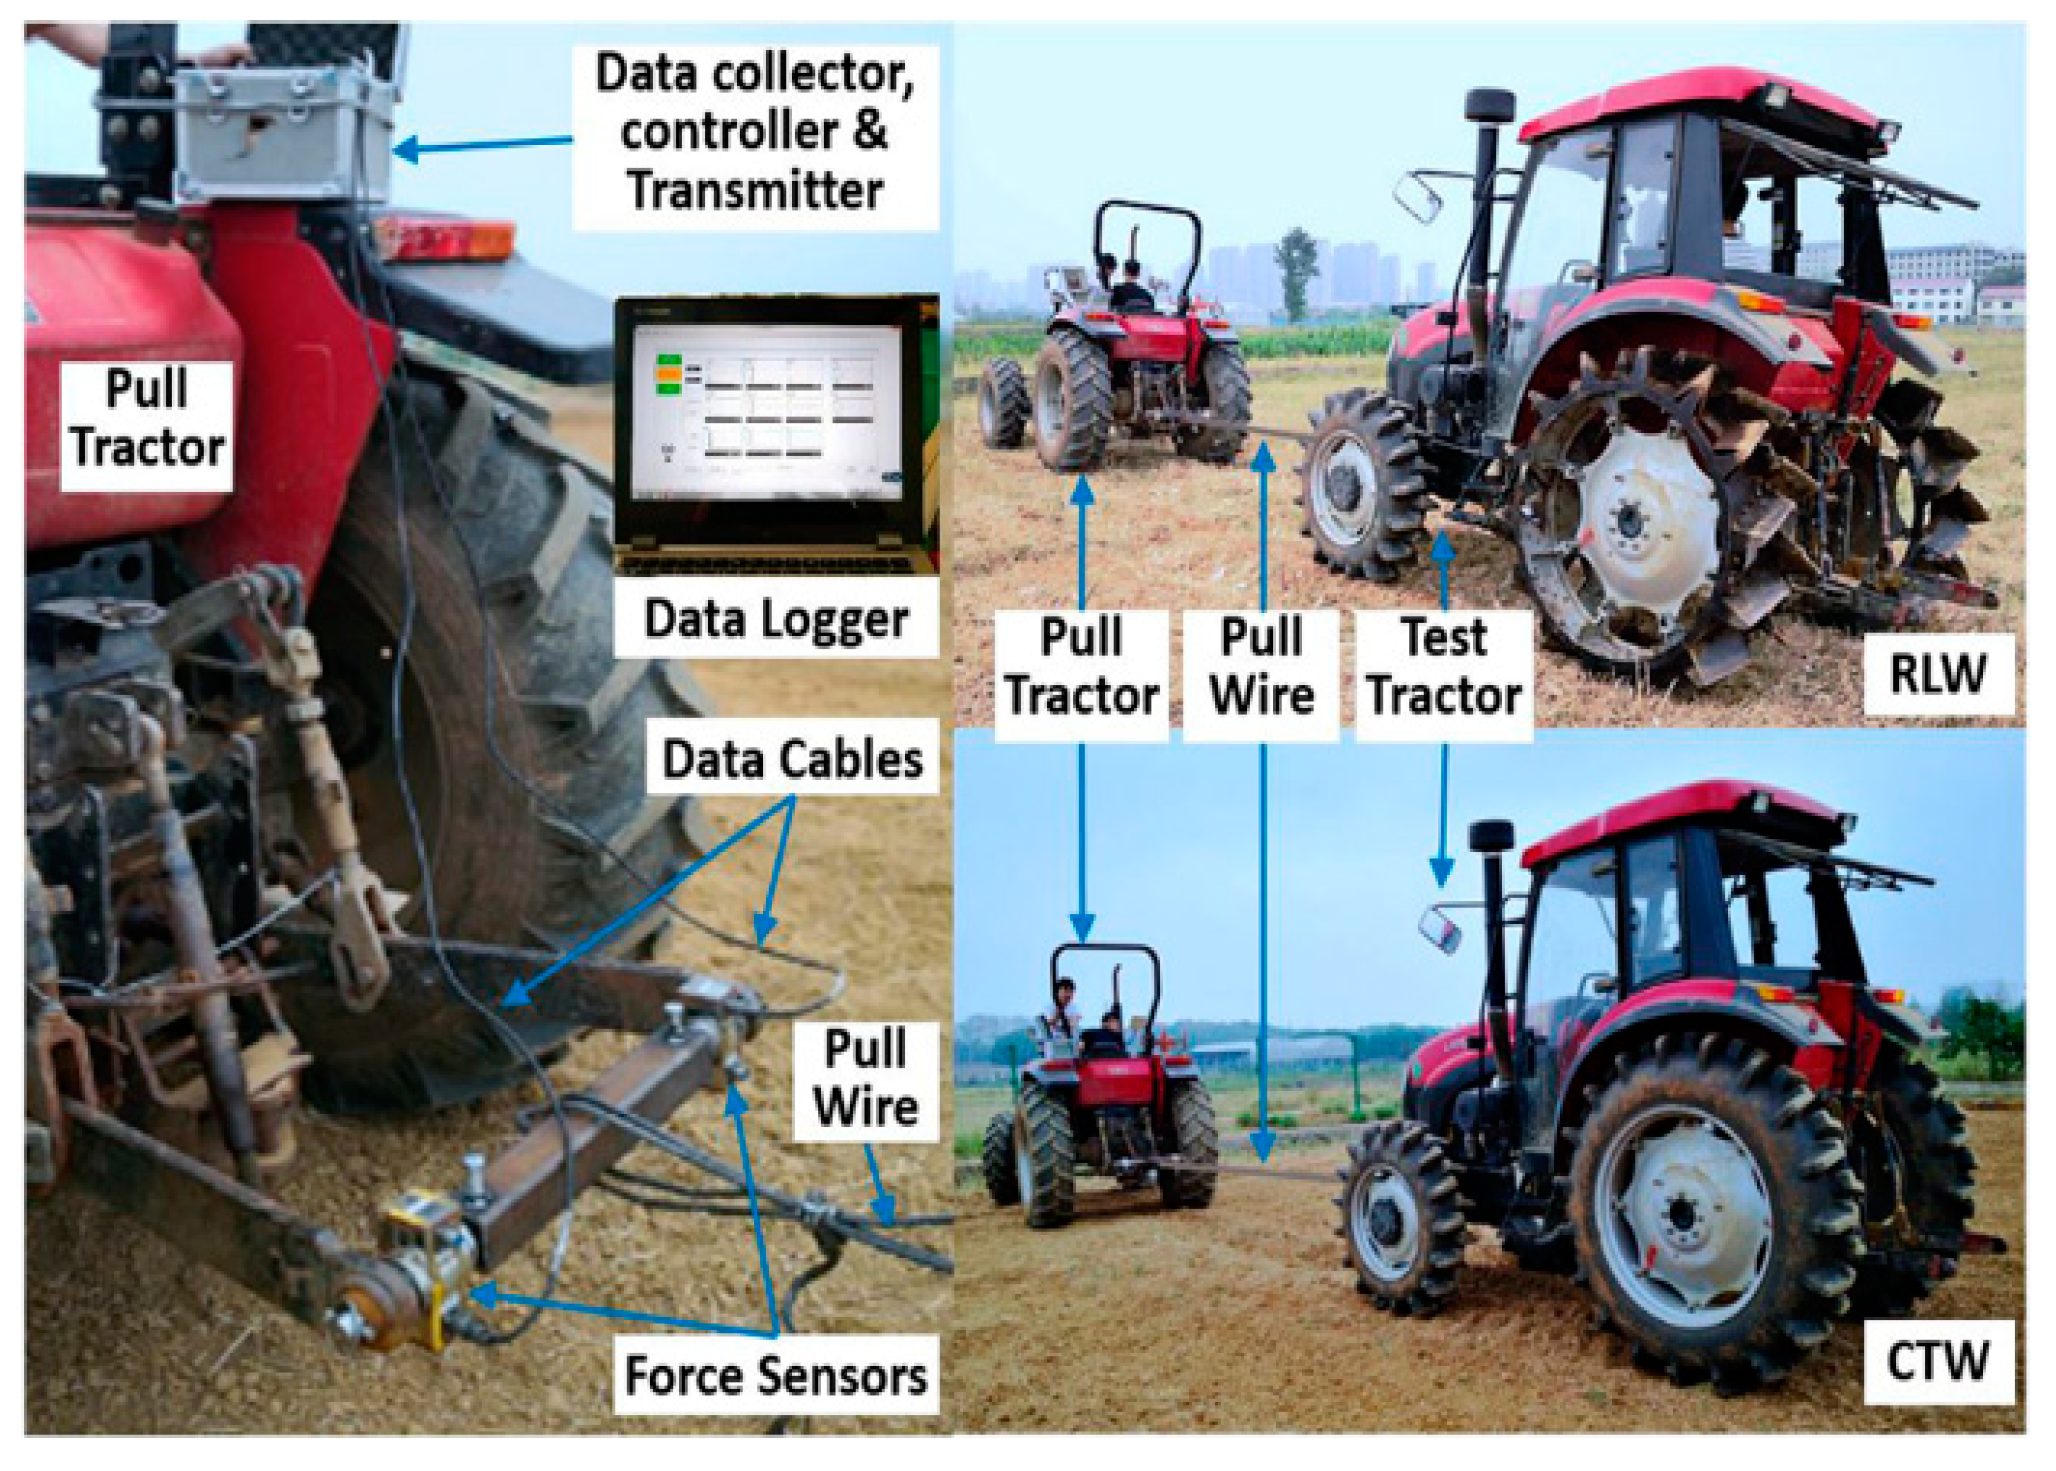
For the motion resistance test,
Figure 2 presents the equipment setup. The pull force measuring sensor instrument mounted to drawbar links of pull tractor and connected the test tractor to pull tractor link bar by a metallic pulling cable.
Drawbar force required to pull the tillage implement was measured using a special pull force instrument setup (
Figure 1) named “Field mechanical and dynamic parameters telemetering instrument” by Harbin Bona Technology Company Ltd., China.
This instrument setup is a set of some individual functional components that work together as a unit. Force sensors consist of central top link BK-1 type sensor that measures tension and pressure force and hanging pins suspension BK-5 type sensors that measure two-dimensional force i.e., Fx in the direction of motion (drawbar force) and Fy vertical force acted on the implement. The measurement range of the sensor instrument is ≤ 30 kN and accuracy of ± 0.3 kN and it was developed by China Academy of Aerospace and Aerodynamic Technology-China Aerospace.
Data acquisition device that connected to sensor units by data wires, developed by Harbin Bona Technology Co., Ltd. and Heilongjiang Academy of Agricultural Machinery Engineering Research. This is a multi-functional device with a data collector, controller, and wireless data transmitter, which collects electrical signals data, converts to digital values, and then transmits output digital values data to data-logger.
Data logger computer connected through USB receiver device and installed with data controlling system software program. It receives digital values data through receiver device and converts to dynamic drawbar force (N), data processing software displays real-time dynamic data on-screen during operation and saves to data drive as Excel worksheets in CSV file format with the event date and time stamps.
Other test parameters included; speed, time, distance, etc. measured and recorded using standard methods. Specifications of instruments provided for reference only and further technical information may not be relevant to this study.
2.3. Experimental Procedure
Traction performance was tested by recording the drawbar force of tractor and in the parallel recording of the slippage of traction wheels or TR of the tractor on the field surface during the deep plowing process.
The test-equipment setup tractor was driven in the field for plowing operation according to the experimental plan with specified tillage depth and forward speed. Three-point link pin sensors (top, right, and left) generated pull force data of two directions (transverse and vertical) with a sampling frequency of 1 Hz. Real-time drawbar force data from all three sensors unites transmitted, processed, displayed, and stored accordingly. In this study, only the transverse component of force was considered for traction performance analysis.
The time that was taken to travel the specified distance of 40 m and 10 number of wheel rotations recorded using a stopwatch in the same traction test to calculate the linear travel speed of the tractor and angular speed of traction wheel. Firstly it was recorded without load for actual speed with minimal TR and then with a trailed load of the implement in tillage operations. The data was recorded in a manual data logger for later use and further calculations.
A measuring cylinder was used to measure fuel consumed by the engine during the tillage operation of each plot. It was vertically fixed on the tractor by fixing brackets so that the fuel level of the cylinder is lower than that of the tractor fuel oil surface. It was used as an integrated reservoir by connecting it within the fuel supply line via a three-way valve joint (
Figure 3). The valve was operated to remove air from pipes, fill the cylinder with fuel from the main fuel tank and supply the fuel from cylinder to engine during operation. The height of the fuel drop was recorded for a specified time and specified field area and later used to calculate the volumetric fuel consumption rate as litters per hectare (L ha
−1) and liters per hour (L h
−1).
Tillage depth and equipment travel speed were maintained approximately uniform and time for tillage operation was recorded for each experimental plot to calculate fuel consumption and field productivity rate of equipment with both traction wheels. For agricultural fields tillage and cultivation operation, the best method recommended to measure and express the fuel consumption is (L ha
−1) than (L h
−1) which compensate the variation in the width of implements and helps in comparing energy inputs and economic analysis per hectare bases as other inputs [
28]. In this study, the area-based unit (L ha
−1) was used as the measuring unit of fuel consumption that is more suitable for field operations.
2.4. Calculations and Analysis
Parameters that directly influence the traction performance and power transfer efficiencies, affect the energy consumption and energy and field productivity in field tillage operations can be explained by the following factors [
3,
23,
29]. Therefore, these factors can be defined as the traction performance and power transfer indices and sometimes called energy indices because of their direct influence on energy consumption.
The angular speed of traction wheels was measured directly from field experiments, it is an important performance parameter to assess the amount of slippage and used for calculations of speed ratios and TR. A higher number of revolutions for a specified distance represents the higher angular speed of the wheel for the linear speed of the tractor and higher wheel slippage. Travel speed of tractor at a specified draft load is an important parameter for evaluating the traction performance and field operational performance of a working agricultural vehicle. It was measured from field experiments in parallel with other variables and recorded for further calculations and analysis.
The force applied through the drawbar of the tractor to pull the tillage implement through the soil is called drawbar force and it is equivalent to implement draft at a specific speed. In this study, the drawbar force is the sum of the horizontal force vector of the two suspension pin sensors and top pull rod sensor and calculated by the following equation:
where
FLH is a horizontal force of the left sensor, F
RH is a horizontal force of the right sensor,
FT is the force of top pull rod sensor, and α is the angle of top pull-rod with the surface in operational condition.
Traditionally, in the study of vehicle locomotion or vehicle traction, the term used is “slip” or “slippage”. TR can be defined as the reduction in traveling speed or traveled distance due to wheel–slip, deflection, and soil shearing, etc. It could be presented in decimals as travel-reduction-ratio (TRR) and in percentage as TR. In this study TR was calculated by adopting a relative method by measuring the speeds without and with towed loads conditions and the following equations were used [
12]:
where
S and
So are linear travel speeds (m.s
−1) of equipment with and without implement workload respectively. The ω and ω
o are angular speeds (rad.s
−1) of rear wheels with and without implement workload, respectively.
The ideal speed of equipment with zero slippage condition is called theoretical speed and calculated from actual speed and travel-reduction-ratio:
Theoretical speed was found useful to compare the speed losses and power losses by different traction wheels in field tillage operations.
The difference between actual travel speed and theoretical travel speed of vehicle due to the slippage of the wheel is called slip speed (
SS), it is normally in the opposite direction to forward travel speed of the vehicle.
The speed ratio is important to graphically analyze the travel performance of the traction wheel by plotting it together with a travel-reduction-ratio against drawbar force and travel speed. It is the ratio of actual travel speed (
S) to theoretical travel speed (
ST):
The motion resistance is the force required to move the tractor against terrain resistance due to tractor weight and sometimes internal resistance of drive gears. The test tractor firstly with CTW was pulled by another tractor in a tilled field at slow speed and fast speed and also in the untilled field at two speeds, draught force sensor instrument measured and recorded the force. Then RLW replaced the CTW and the test was repeated to measure the motion resistance of tractor with RLW.
Drawbar power is the output pulling power of tractor engine delivered through drawbar of the tractor by means of traction or drive wheels and is the function of drawbar force
F (kN) and travel speed
S (km h
−1) [
30]:
TR on the unprepared terrain surface reduces the pull ability and travel speed, so the wheel slippage or TR is the major source of power loss in tillage operations. Theoretical drawbar power was calculated using the power equation by theoretical travel speed. Power losses were calculated for both test drive wheels by subtracting actual drawbar power
Pa from theoretical drawbar power
Pt.
The tractive efficiency ratio is the ratio of the power available to traction wheel (axle power) and the power delivered by the traction wheel (drawbar Power P) and presented in either way as decimal or percentage.
Axle power is normally unknown in the case of agricultural tractors and it could be estimated from engine power by considering 0.78 power delivery and transmission efficiencies.
Vehicle traction ratio also sometimes referred to as the coefficient of traction, is the ratio of the drawbar force
F (kN) to the tractor weight
W (kN):
Field experiments data and parameters estimated from it were statistically analyzed by utilizing IBM SPSS 25 statistical software package. Differences of variance between treatments were determined by analysis of variance (ANOVA) and factorial design analysis method with two-way interaction. The least significant difference (LSD) comparison method with 0.05 value of alpha was applied to analyze means for levels of significance. Standard deviations were estimated for all parameters to express the deviation of replicated values from the means in the data.
4. Discussion
This study was designed to investigate the traction performance and power transfer indices improvement by implementing RLW instead of CTW and their impact on operational efficiencies like energy use efficiency and field productivity of wheeled tractor. Field experiments were conducted and the results depict the influence of traction performance and power transfer indices on fuel consumption and field productivity rate.
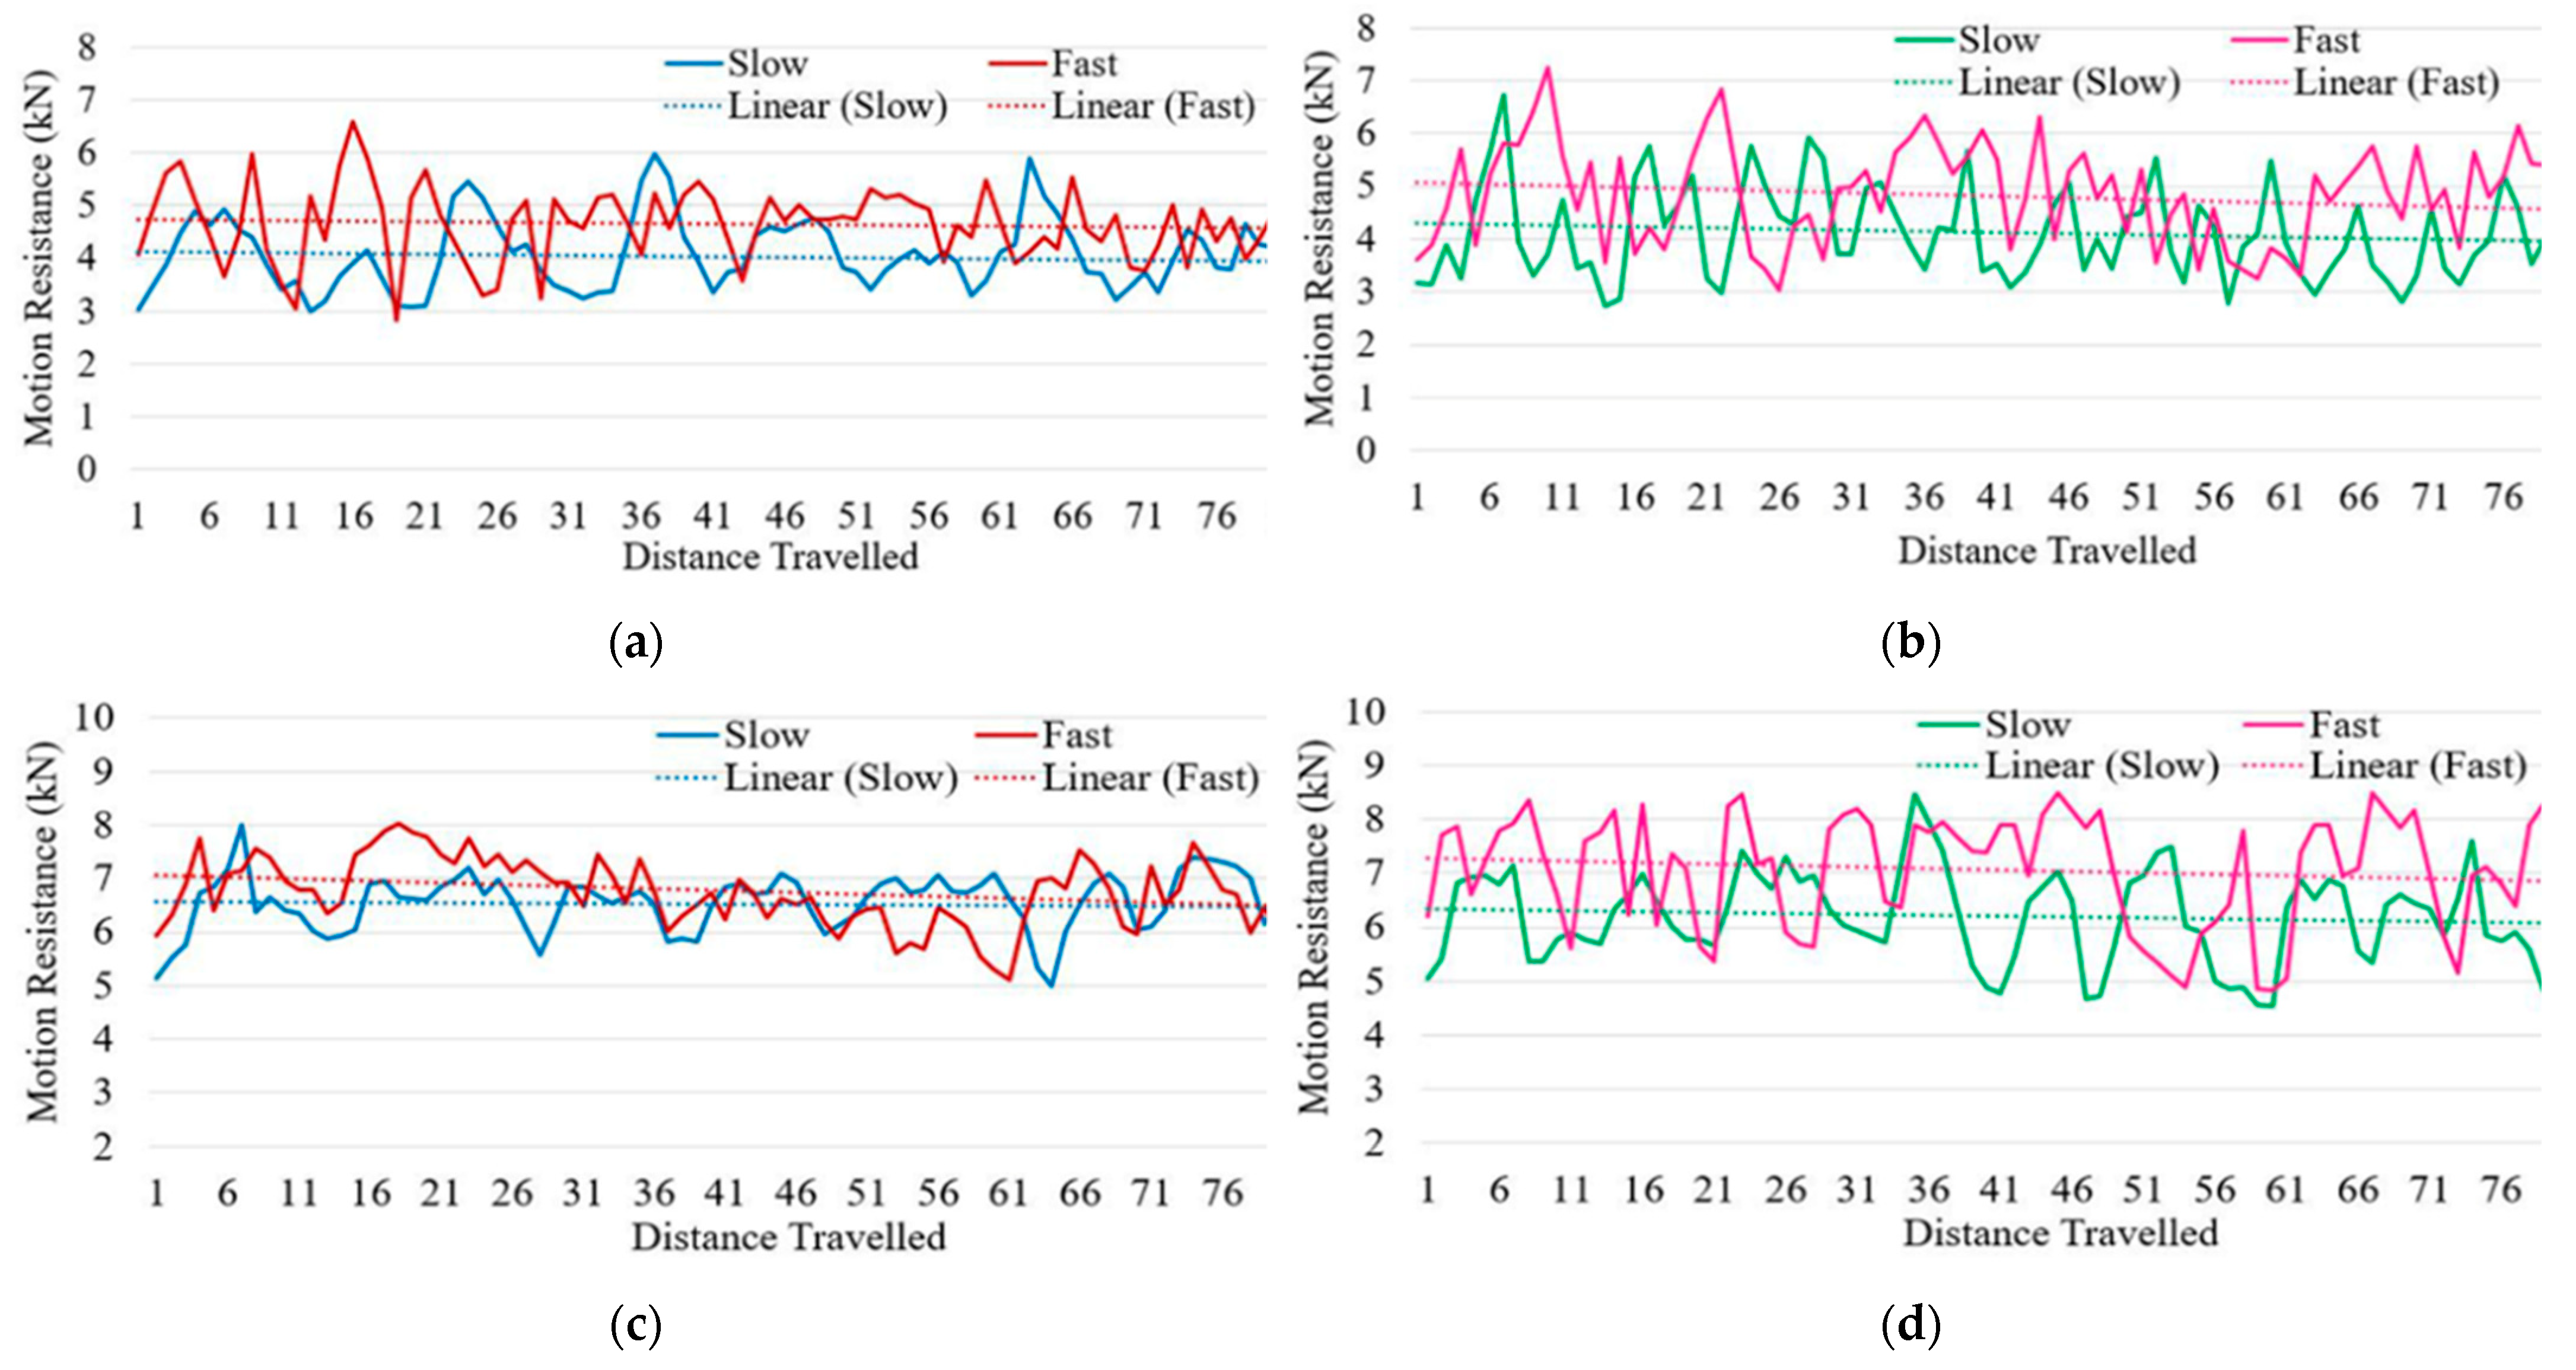
Motion resistance of both wheels in all conditions showed higher values at the start and then presented a gradual decrease, because in beginning higher force needed to start moving and accelerate the vehicle, while towards stopping end vehicle deaccelerates and tends to stop. According to pressure sinkage relationship, higher sinkage of the wheel into the soil cause higher motion resistance which is why rigid lugged wheel presented higher motion resistance [
31]. Higher motion resistance of RLW was compensated by producing pre-tillage and loosening effect to the field soil by sharp lugs.
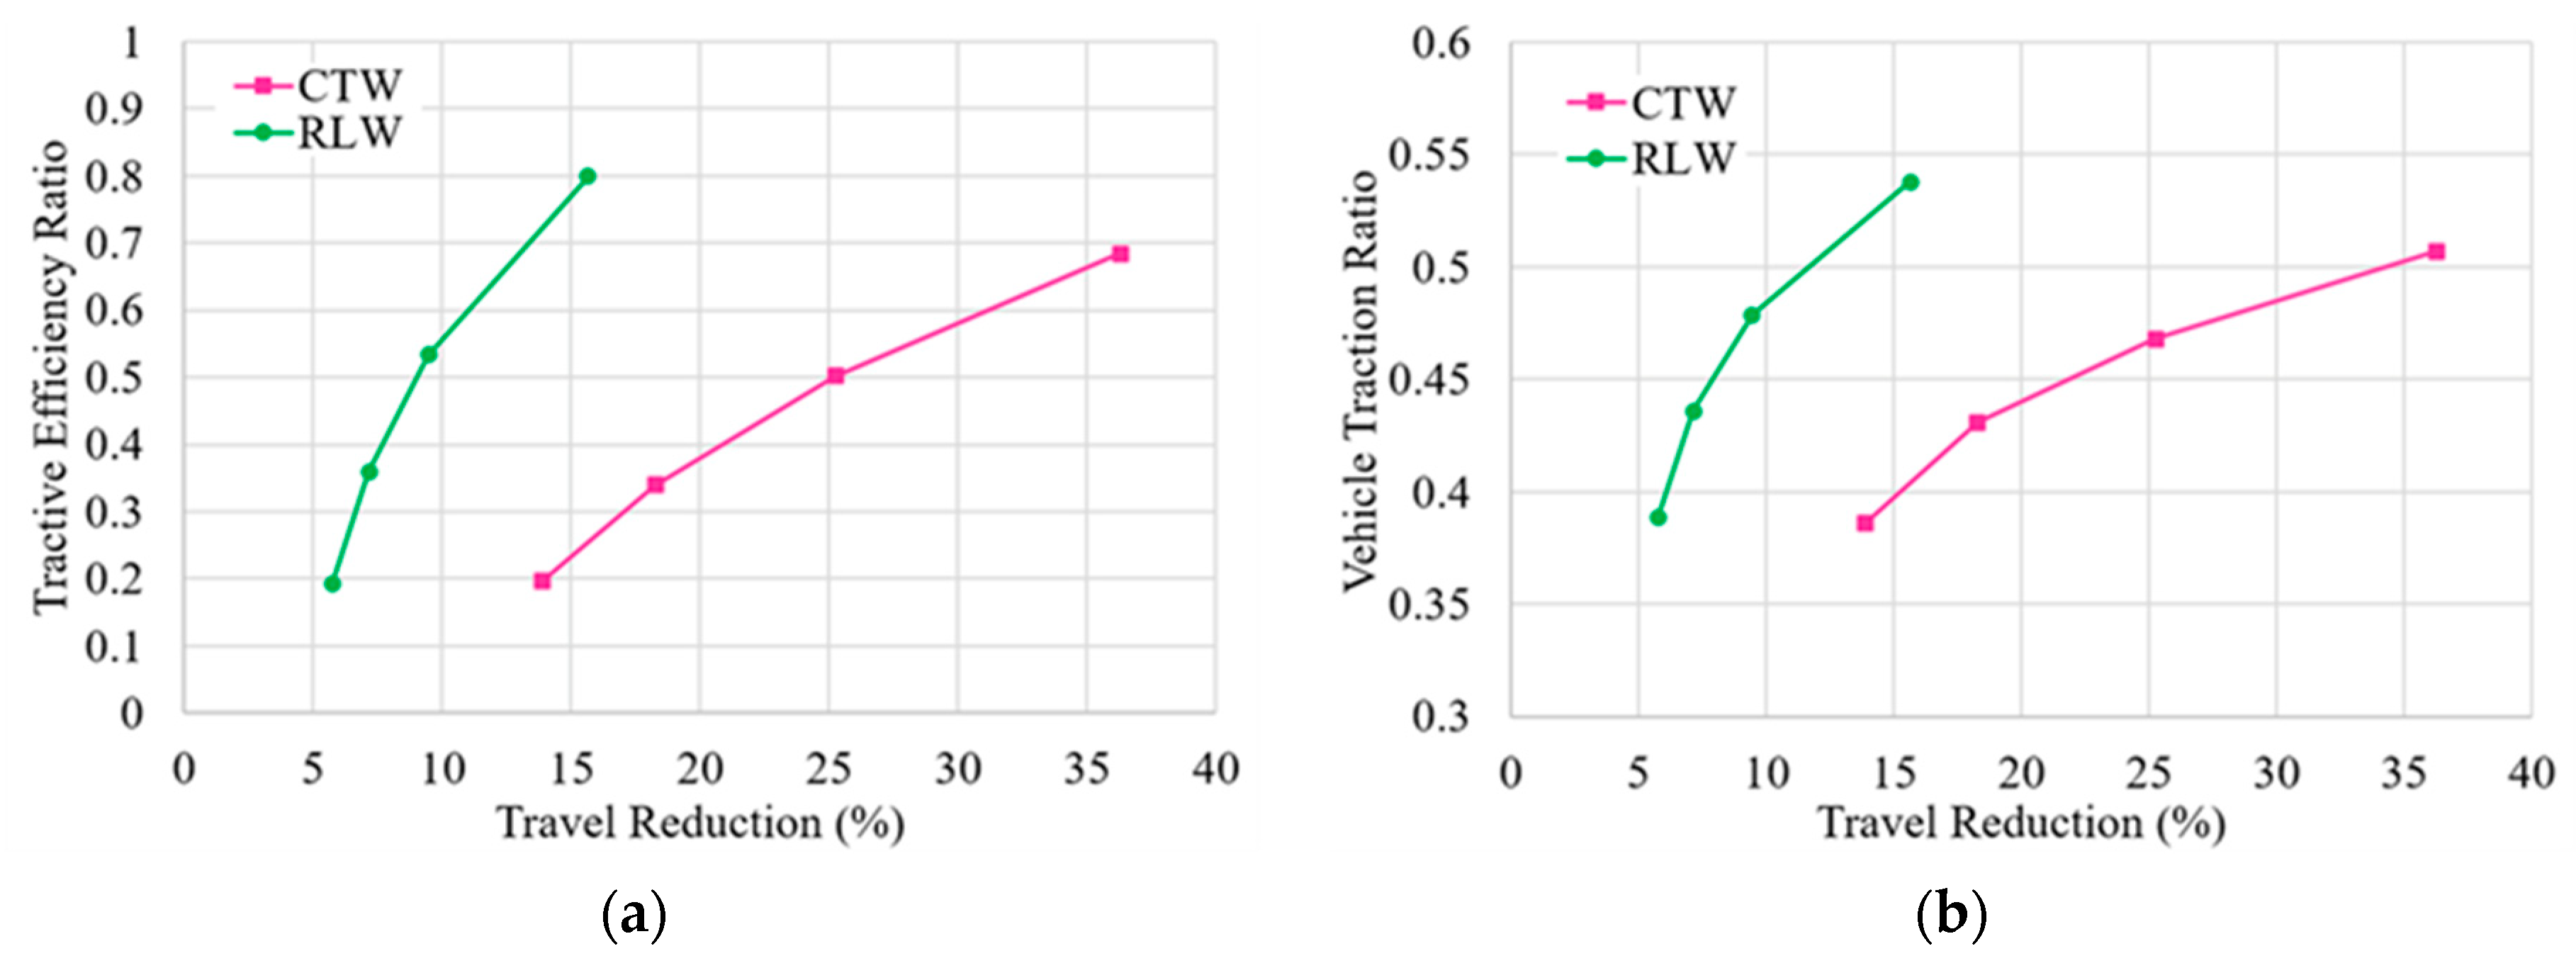
Traction performance of drive wheels was also analyzed by plotting a combined graph of TRR and SR against both independent factors of drawbar force and travel speed. The response of TRR and SR on increasing drawbar force and travel speed shows that as the TRR increases the speed ratio decreases with the same rate. Travel reduction ratio and speed ratio for CTW touched 0.5 or 50% near 25 kN drawbar force (
Figure 6a) and near 7 km.h
−1 travel speed (
Figure 6b) while for RLW the travel reduction ratio and speed ratio remained near 0.15 or 15% and 0.85 or 85%, respectively. With CTW, to maintain the travel speed near to a specified level, the engine speed needs to be increased that consumes more fuel, if the travel speed would not be maintained then it will reduce the field productivity and in both cases, the cost of operation will be increased.
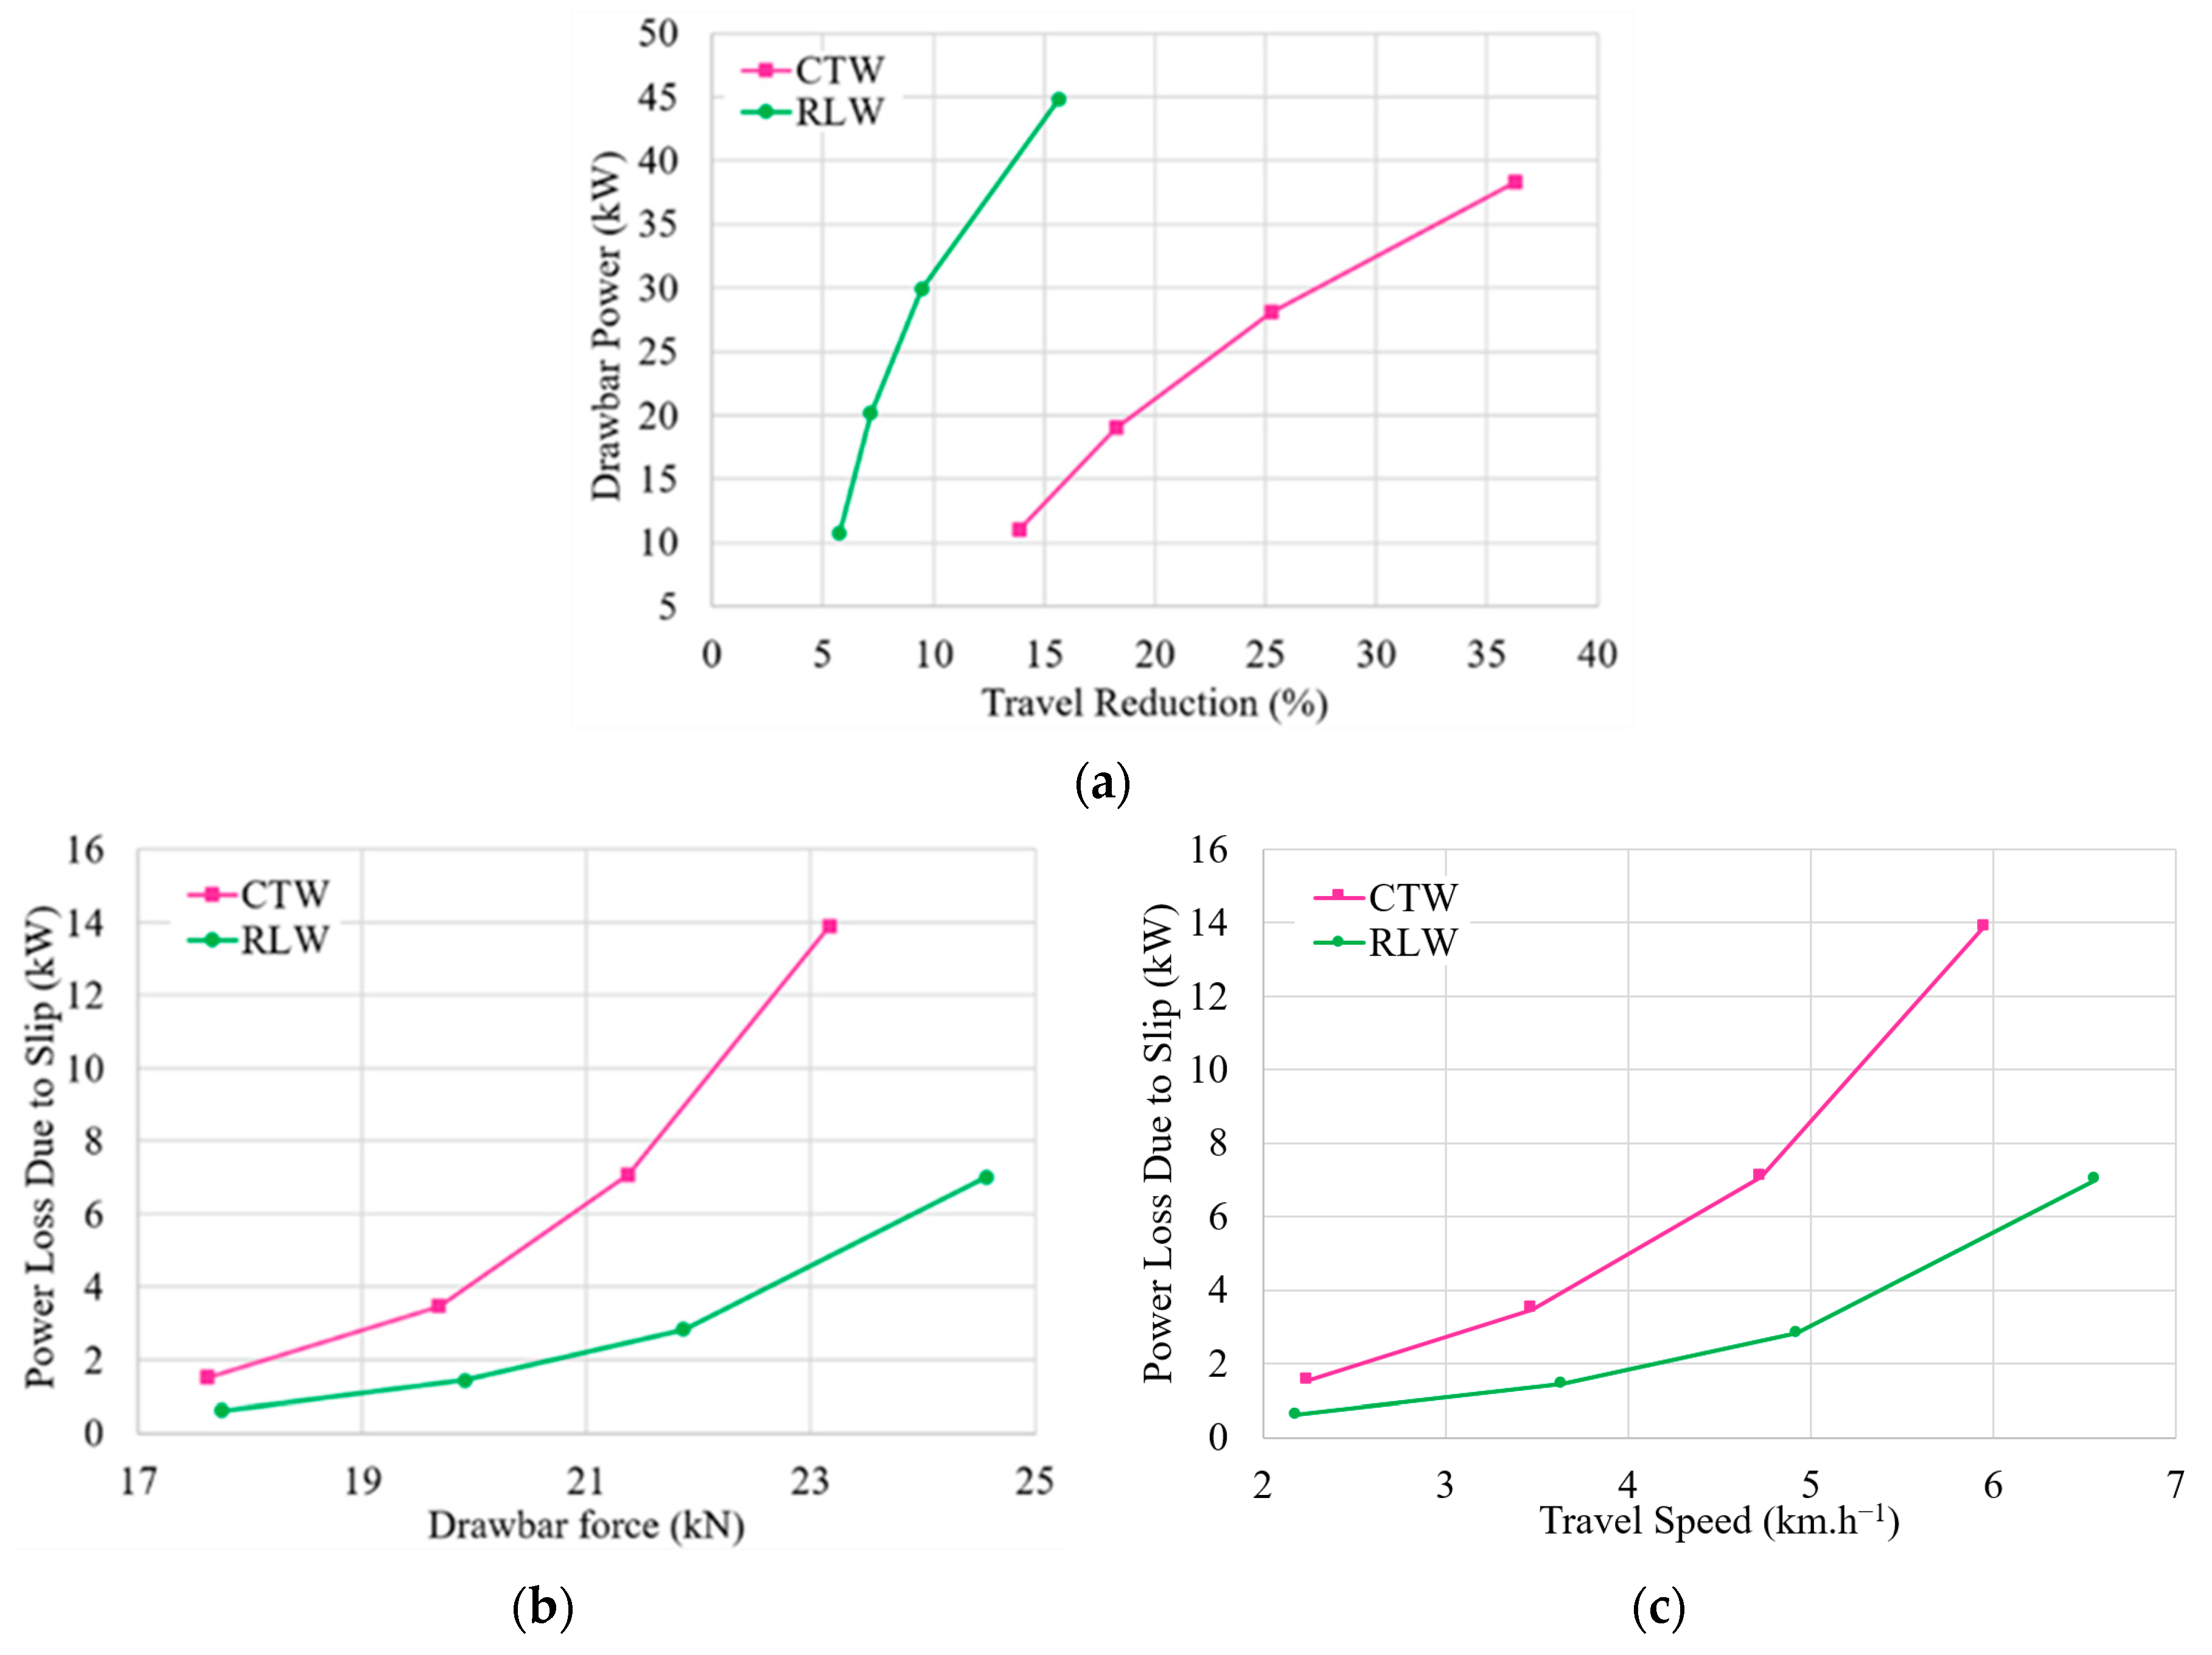
Power loss by CTW was high and reached 14 kW which impaired the traction ability and drivability of CTW. While by RLW power losses were very low (7 kW) compared to CTW (13.9 kW). The traction performance was very good by RLW as a drive wheel in terms of traction ability, drivability and power losses with respect to TR as compared to CTW. This was because of excessive slippage of CTW, while the RLW showed good control on slippage even at higher drawbar pull and higher travel speed. Lessening the slippage for a given drawbar force is, therefore, of practical significance in improving the operational efficiency of tractors [
31].
It is explicable from the results that the RLW has good and significantly higher traction ability as compared to CTW. With better traction performance, good drivability, and traction ability in intensive tillage operations, CTW can help to avoid power losses.
Fuel consumption (L ha
−1) for primary tillage with moldboard plow observed approximately similar for RLW but higher for CTW than reported results [
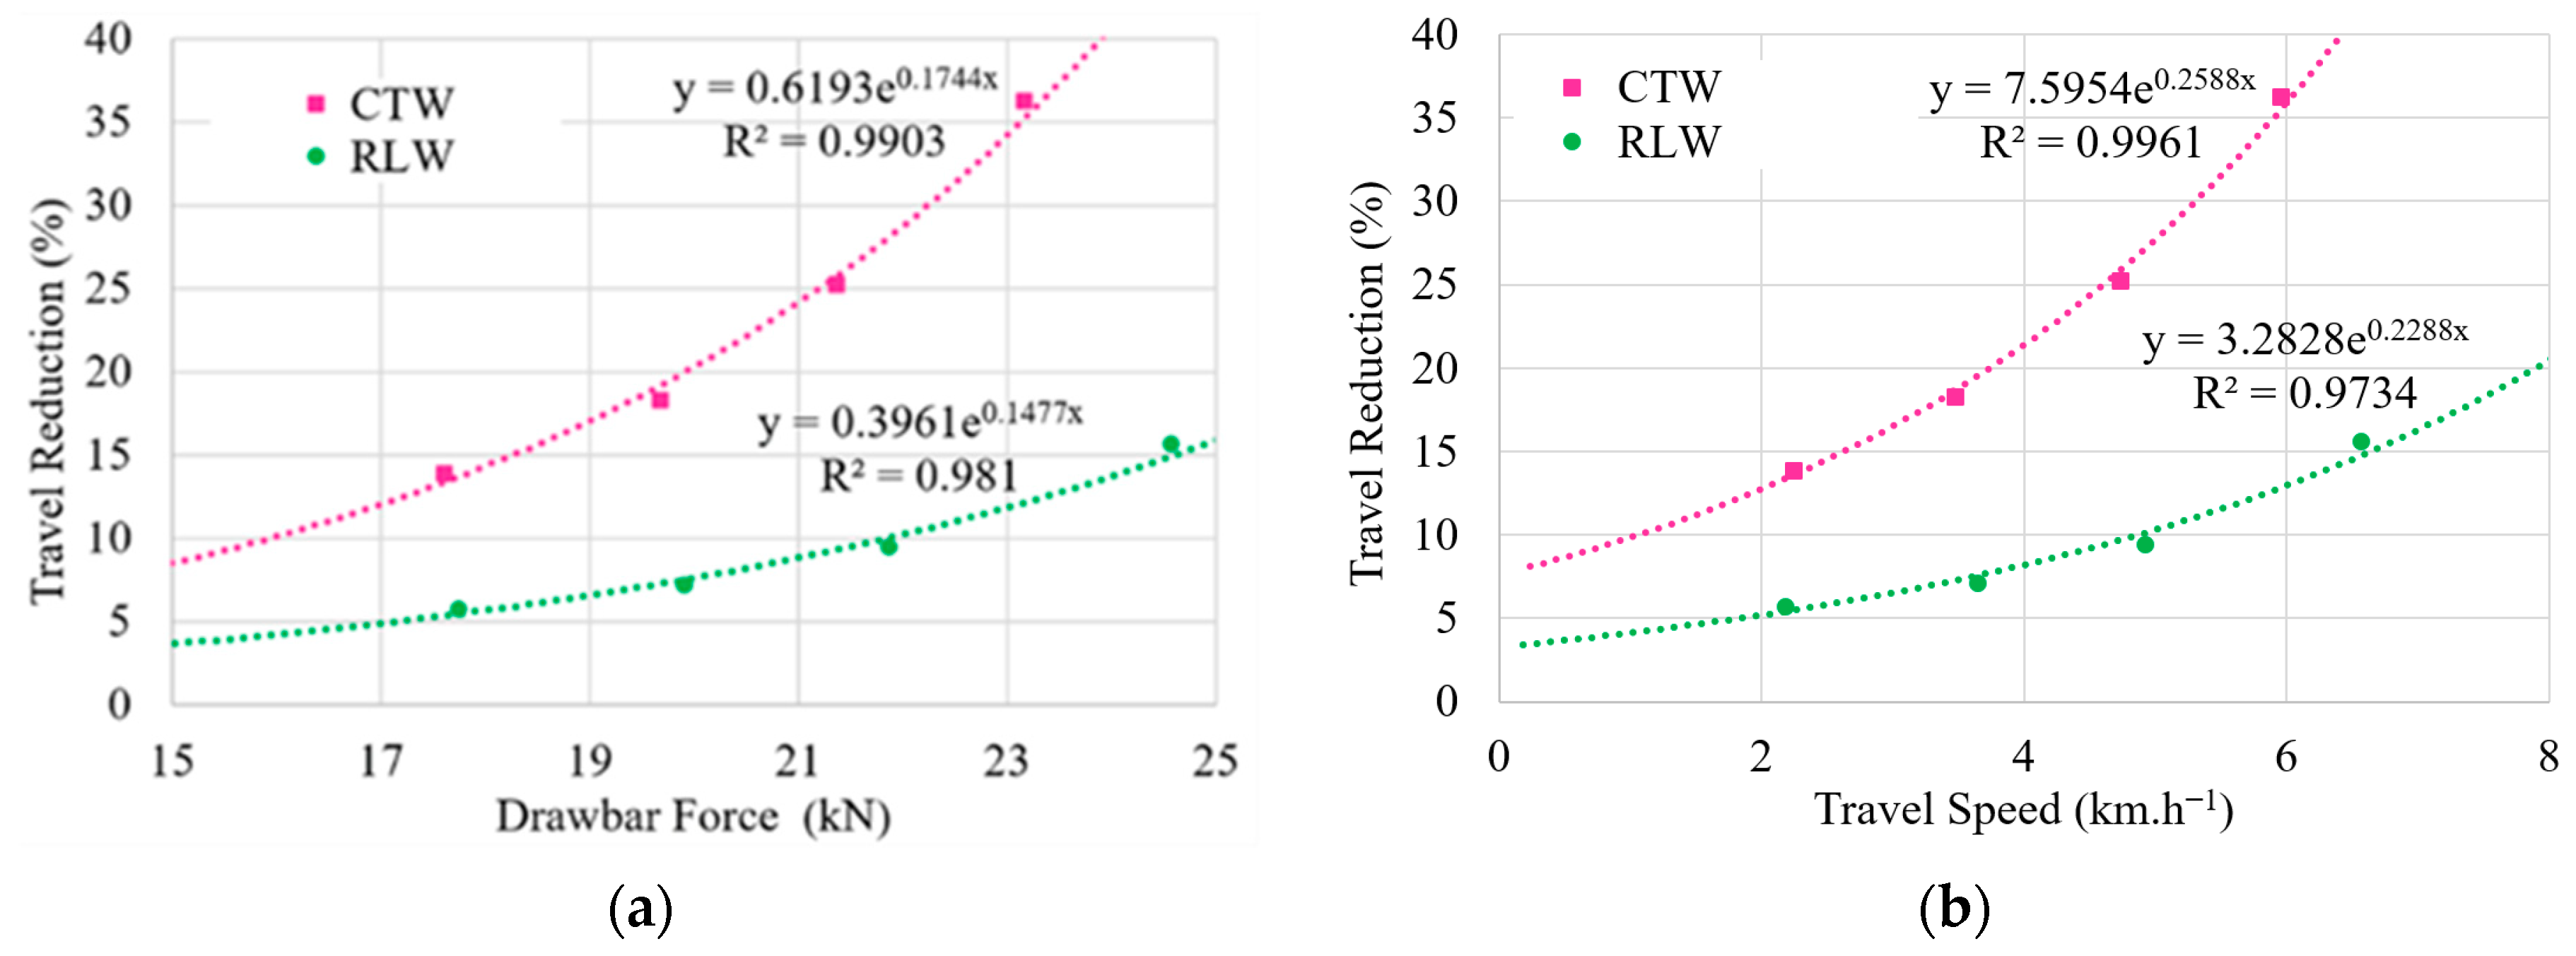
28]. This performance was observed at 20 cm fixed tillage depth, for the higher tillage depth the TR would be increased as illustrated by
Figure 5, the fuel consumption and field productivity difference gap for the CTW and RLW would become wider than indicated in
Table 5.
The initial estimated investment of RLW is lower with an expected longer operational life compared to CTW. Further research and economic analysis by considering initial manufacturing cost and lifecycle assessment after completion of the design process will present the scenario more clearly.
Tractor weight in agriculture is more important to be considered because of the higher energy requirements of heavyweight tractors [
2,
3]. RLW significantly improved traction performance and power transfer indices without adding up to the weight of the tractor with a simple lightweight structure. Whereas, tracks and multiple wheel traction devices increase the weight of tractor by 2000 kg and more with higher space requirement for tractor operations that make the tracked and multiple wheeled tractors unsuitable for smaller and medium-sized farms [
12].
For better performance and efficiency, medium speed observed more suitable for intensive tillage operations for both wheels, but with RLW medium to higher speed is also considered safe. With the improved traction by RLW without increasing equipment weight, the tractor can pull wide span implements to reduce the field traffic intensity and soil loading. Therefore, RLW provides a decent and warm opportunity to improve traction performance for energy conservation, environmental management, soil compaction prevention, and sustainable agricultural development.
5. Conclusions
This study was conducted to investigate the energy use efficiency and field productivity optimization by traction and power transfer indices improvement of tractor drive wheels and field terrain soil. That was done by implementing rigid lugged wheel (RLW) and comparing with conventional tire wheel (CTW) on the farm tractor for cultivation operations. The important findings of the study are concluded as below.
The slip of wheel that causes travel reduction (TR) of tractor corresponding to applied drawbar load is the main factor for energy use efficiency and field productivity optimization. The RLW presented higher motion resistance compared to CTW, but this was due to the higher penetration of lugs and breaking/loosening of soil that can cause the pre-tillage effect to the soil and consequently reduce the soil tillage draft.
The RLW resulted 15.6% TR that is in the optimum range for maximum tractive efficiency 80% even at higher drawbar force 24.6 kN and higher travel speed 6.6 km.h−1 while CTW resulted in 36.3% TR for lower tractive efficiency 68%, lower drawbar force 23.2 kN, and lower travel speed 6.0 km.h−1. RLW resulted in improved traction efficiency and vehicle traction ratio and increased the overall tillage efficiency and equipment pulling capacity without increasing equipment weight.
Tractor with RLW compared to the tractor with CTW, consumed less fuel by 15%, at 220.5% lower TR with 12.3% higher generated power, and 14.8% higher field productivity. Results with lower fuel consumption and higher field productivity by RLW represented better performance indicators for soil tillage.
Therefore, the RLW as a traction device significantly improved the traction and power transfer indices with optimum TR and resulted in optimized energy use efficiency and field productivity. Hence, raising the traction and power transfer indices by replacing tire wheels with RLW will help to reduce fossil fuel consumption in cultivation operations and avoid soil compaction and environmental degradation. Results of this study will provide a reference for farm machinery manufacturers and agricultural farm managers for sustainable development and efficient operations of machines in agriculture.

 ,
, 


