Article

Comparison of Drivers of Soil Microbial Communities Developed in Karst Ecosystems with Shallow and Deep Soil Depths

1
Key Laboratory of Land Surface Pattern and Simulation, Institute of Geographic Sciences and Natural Resources Research, Chinese Academy of Sciences, Beijing 100101, China
2
University of Chinese Academy of Sciences, Beijing 100049, China
3
Landcare Res, POB 69040, Lincoln 7640, New Zealand
*
Author to whom correspondence should be addressed.
Submission received: 18 November 2020 / Revised: 12 January 2021 / Accepted: 14 January 2021 / Published: 18 January 2021

Abstract

:
Soil erosion is prevalent in karst areas, but few studies have compared the differences in the drivers for soil microbial communities among karst ecosystems with different soil depths, and most studies have focused on the local scale. To fill this research gap, we investigated the upper 20 cm soil layers of 10 shallow–soil depth (shallow–SDC, total soil depth less than 100 cm) and 11 deep–soil depth communities (deep–SDC, total soil depth more than 100 cm), covering a broad range of vegetation types, soils, and climates. The microbial community characteristics of both the shallow–SDC and deep–SDC soils were tested by phospholipid fatty acid (PLFAs) analysis, and the key drivers of the microbial communities were illustrated by forward selection and variance partitioning analysis. Our findings demonstrated that more abundant soil nutrients supported higher fungal PLFA in shallow–SDC than in deep–SDC (p < 0.05). Furthermore, stronger correlation between the microbial community and the plant–soil system was found in shallow–SDC: the pure plant effect explained the 43.2% of variance in microbial biomass and 57.8% of the variance in the ratio of Gram–positive bacteria to Gram–negative bacteria (G+/G−), and the ratio of fungi to total bacteria (F/B); the pure soil effect accounted for 68.6% variance in the microbial diversity. The ratio of microbial PLFA cyclopropyl to precursors (Cy/Pr) and the ratio of saturated PLFA to monounsaturated PLFA (S/M) as indicators of microbial stress were controlled by pH, but high pH was not conducive to microorganisms in this area. Meanwhile, Cy/Pr in all communities was >0.1, indicating that microorganisms were under environmental stress. Therefore, the further ecological restoration of degraded karst communities is needed to improve their microbial communities.

1. Introduction

Soil microorganisms play an important role in nutrient cycling and biogeochemical cycles [1]. They are subject to a variety of factors, including soil properties, human activity such as reclamation [2] and forest management [3], vegetation types [4], succession stage [5] and regional climate change [6,7]. It has been suggested that microorganisms are not homogeneously distributed in soils, even with consistently stable environments [8]. They are expected to be heterogeneously distributed in complex soil environments, with different features affecting soil microorganisms to different extents depending on the niche they occupy [9]. To better understand the drivers of soil microbial communities, the combination of impacts, such as tree planting and soil [10], plant protection and agricultural management [11], land use patterns coupled with soil depth [12] and site, land use intensity and management [13], are receiving much more attention. Recent studies have considered the drivers of soil microbial communities at the landscape and regional scales [14,15], and at which scale environmental factors such as precipitation [16], slope aspect [17] or nitrogen concentration [18] exhibit regular gradients. However, gradients of factors in space are not easily found in highly heterogeneous karst areas [19,20]. This makes it more difficult to explore the driving factors of microbial communities in these areas on a regional scale, as the scale is complicated by interactions among biogeography, climate, and soil abiotic conditions [21,22].
The southwest China karst area is the largest of the three major continuous karst areas in the world [23]. Carbonate rocks are not able to produce much soil for their extremely slow soil formation rate. This has resulted in soils of the southwest China karst area being shallow [24]. Additionally, the carbonate rocks have developed broken karst surfaces through long–term hydro–chemical process due to the highly soluble carbonate rocks, strong vertical and horizontal flow exchange of groundwater and surface water, and the steep landforms of southwest China. Together, these conditions have led to serious soil loss [25,26,27]. In addition, this area is densely populated by communities of poor people mainly engaged in agriculture that involves considerable vegetation destruction [28]. This karst area has specific regional characteristics because of its different natural foundations (topography, climate, etc.) and the influence of different human social conditions determined by population and economics [28]. Therefore, different degrees of soil erosion prevail in the southwest China karst area, resulting in surface rock exposure and the uneven distribution of soil depth. In areas with severe karst rocky desertification (KRD), the soil is shallow, whereas in areas with light or no KRD the soil layer is deeper. Soil is the foundation of terrestrial ecosystems. It is well known that poorer plant and soil characteristics are always found for communities developed in shallow soil than for communities developed in deep soil [29,30,31]. Rocky desertification and shallow soils are the primary basis of ecological disasters in Southwest China. This has seriously hindered the economic growth and has a direct and significant impact on the 1.7 million people living in this karst region [24].
Microbial communities play an important role in soil fertility and plant succession [32]. Therefore, the study of the driving factors of soil microbial communities in karst areas is a necessary basis for the ecological restoration of this area. Previous studies have found that communities with deep soil depth are rich in soil organic matter and have higher fungal and bacterial diversity, ratios of fungi to bacteria, and microbial biomass than communities with shallow soil depth [33,34,35,36]. However, previous studies in karst regions have not distinguished the differences between communities with different soil depths when exploring the impact factors of microorganisms [37,38,39]. Consequently, there remains a lack of knowledge of the effects of environmental factors on microbial community composition and the structure of the communities of different soil depths. The combination of these factors and the definition of the proportion of each factor in karst communities developed in different soil depths will assist our ability to understand the importance of soil microbial communities in regulating ecosystem structure and function.
Based on the previous considerations, this study aimed to distinguish the characteristics of soil microbial communities and the driving factors in karst communities with different soil depths. We hypothesized that (1) microbial biomass and species diversity would be lower in shallow soil depth communities (shallow–SDC) than in deep soil depth communities (deep–SDC); (2) soil microbial communities in shallow–SDC would be more strongly driven by plant and edaphic factors than in deep–SDC; (3) and the microbial community would have stronger resistance to stress in shallow–SDC than in deep–SDC.

2. Materials and Methods

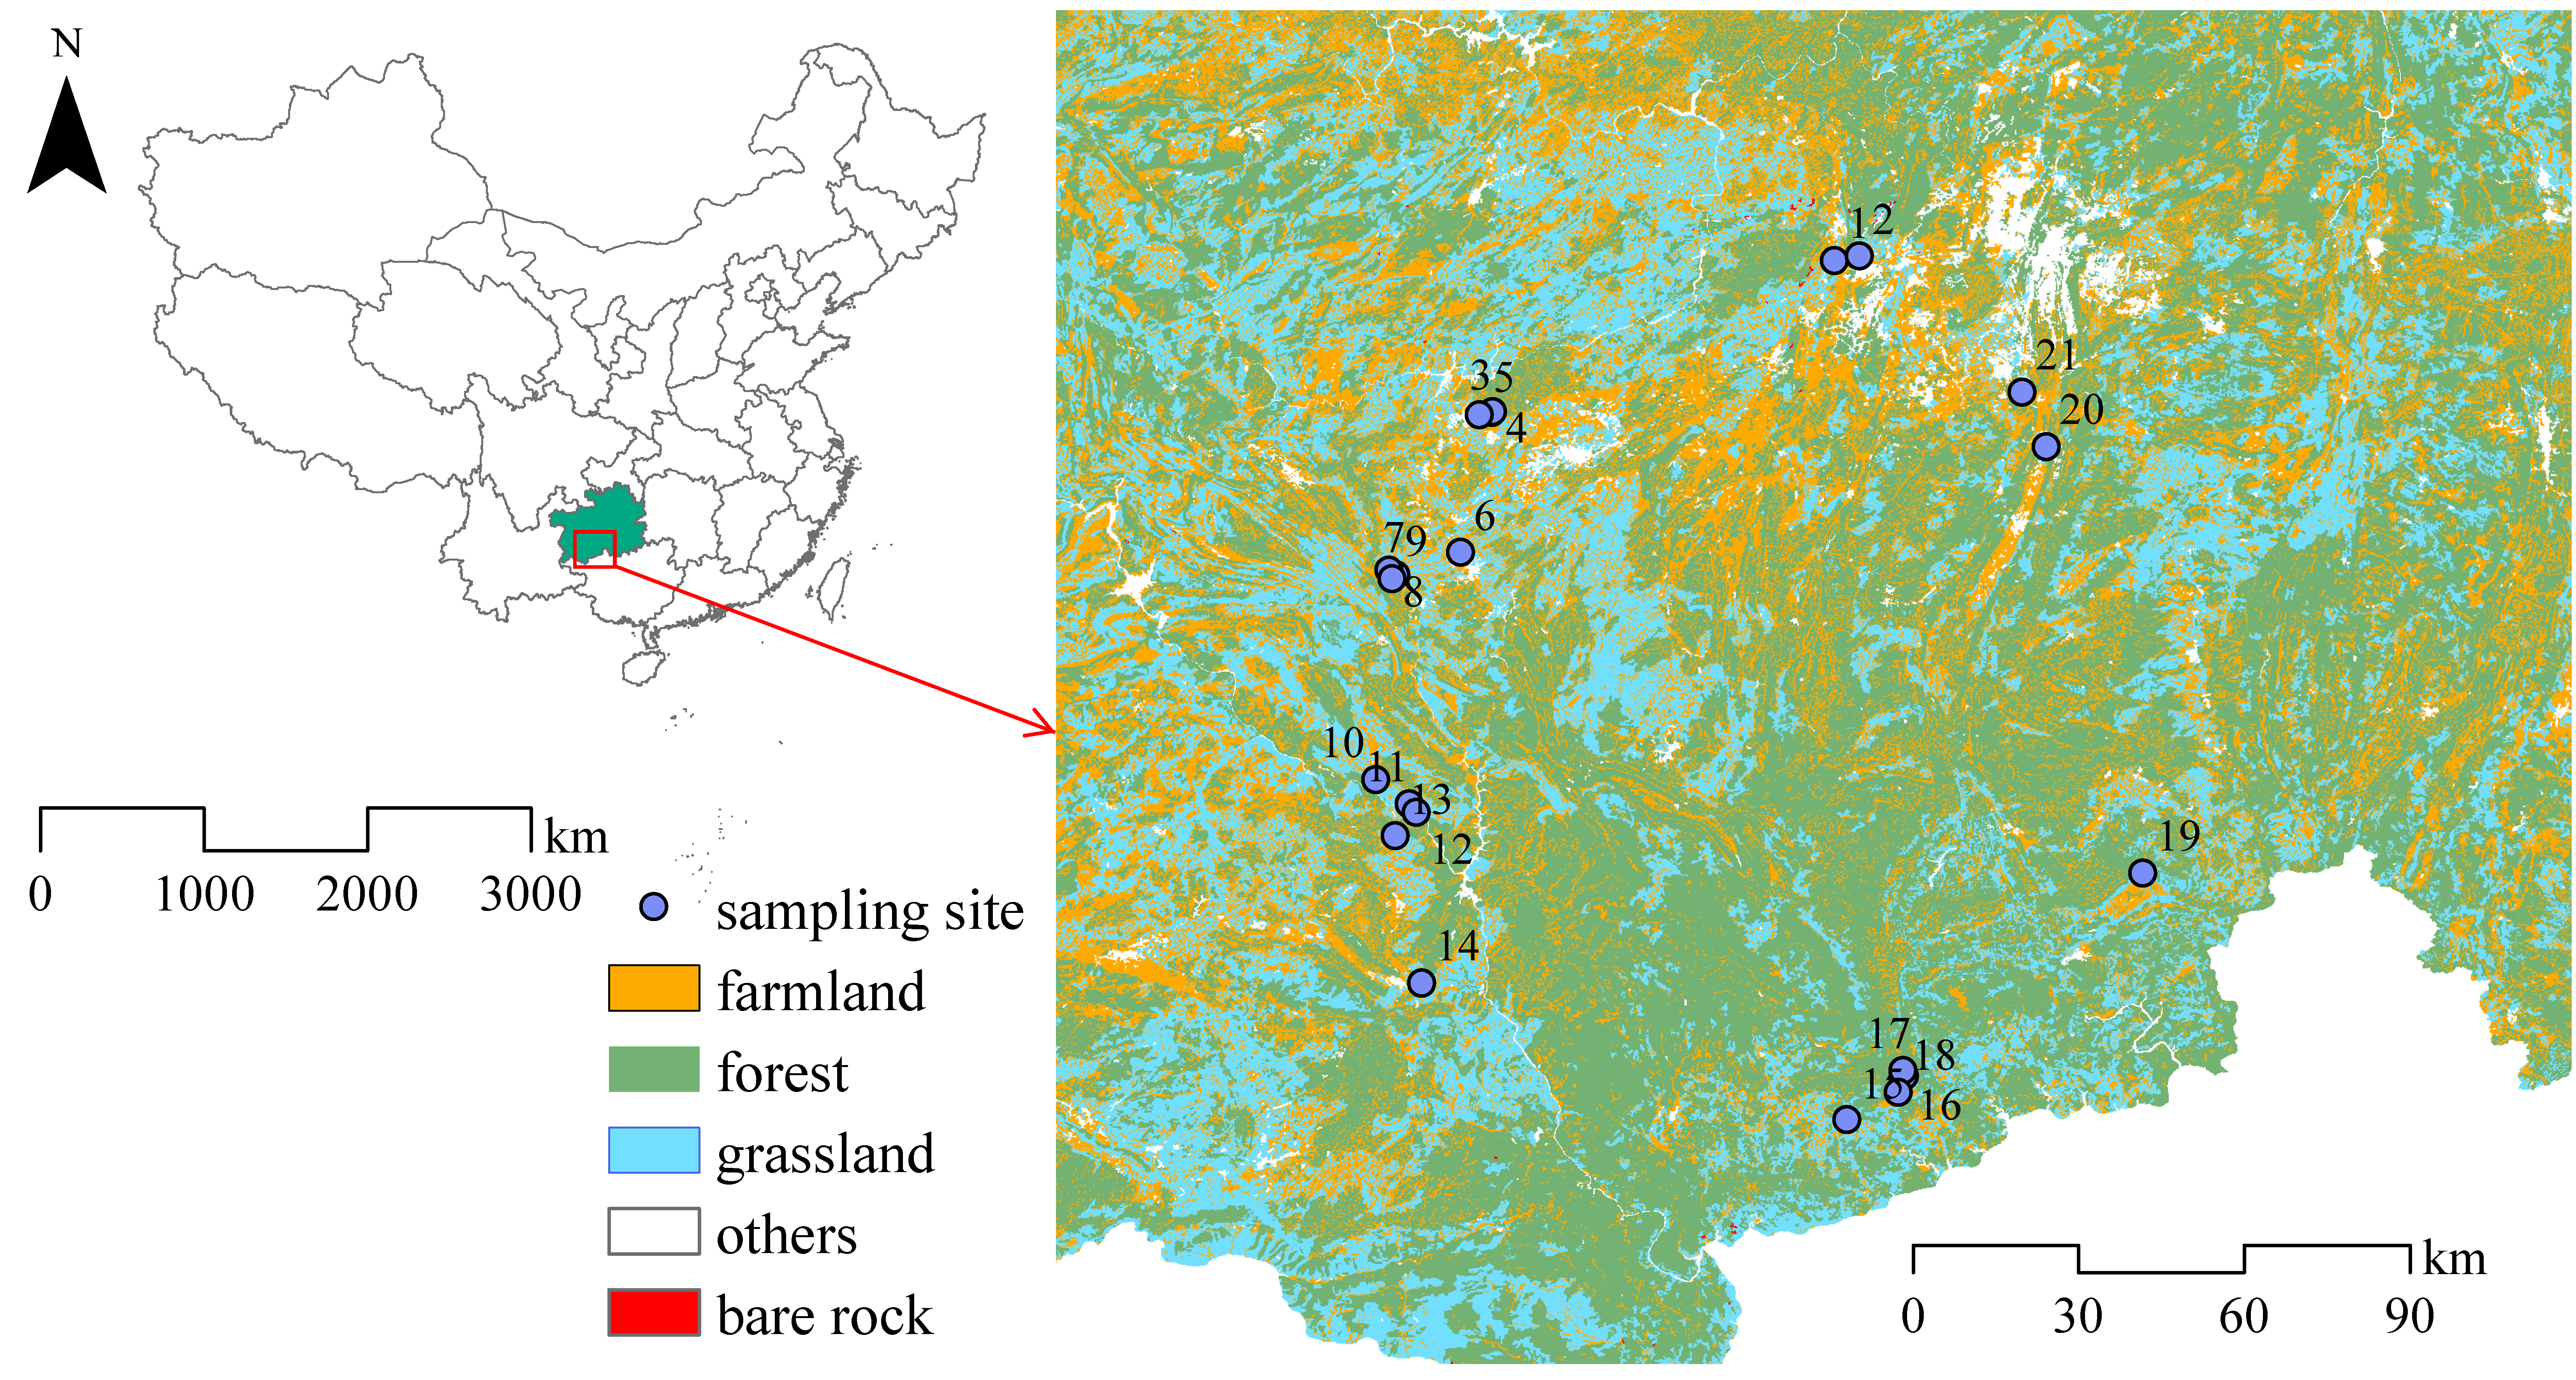
2.1. Site Description

This study was located in Guizhou Province, Southwestern China (24°37′–29°13′ N, 103°36′–109°35′ E). This area covers approximately 17.6 × 10⁶ ha and has an elevation range 153–2885 m (Figure 1). The region has a subtropical humid monsoon climate and is dominated in its natural state by evergreen broad–leaf forest. For the past 30 years the mean annual temperature (MAT) range was 6.8~20.5 °C, the mean annual precipitation (MAP) range was between 761 and 1507 mm, and mean accumulated temperature (>0 °C) was 8.9~20.5 °C. Most rainfall occurs from April to August. The landform is plateau or mountain, soils are generally shallow, mainly derived from limestone, and are prone to severe soil erosion. Since about the year 2000, the area of rocky desertification has been gradually decreased by many vegetation restoration projects. In 2016, it had an area of about 2.47 × 10⁶ ha, approximately 14.03% of the total land area of Guizhou Province.

2.2. Community Investigation and Sample Collection

Plant community investigation and sampling were undertaken in June and July 2019. Twenty–one karst ecosystems (including 3 sites of natural communities, 5 sites of abandoned land, 7 sites of economic plantation and 6 sites of ecological restoration forest) were divided into two groups; shallow–SDC consists of 10 ecosystems with soil depth less than 100 cm and deep–SDC consists of 11 ecosystems with soil depth of at least 100 cm (Figure 1). Sites for natural grassland, shrubs, and secondary forest have been maintained for centuries, whereas the ecological restoration of forests and economic plantations has been undertaken since the 1990s. The abandonment of cropping on restoration sites has occurred mainly in the last decade.
At every site, ten sampling quadrats were selected (1 m × 1 m) for investigation of herbs and another five sampling quadrats were selected (10 m × 10 m) for investigation of woody plants. GPS coordinates and the elevation of each site were determined, and their slope and aspect were recorded. Height, diameter at breast height ((DBH, 1.3 m) and coverage were measured for all trees and the number of each tree species was recorded. Shrubs and herb species were identified and measured in each quadrat. Samples of each herb species were placed into separate envelope bags, and then dried, weighed and crushed. The leaves of shrubs and trees in each quadrat were collected from at least 6 dominant plants and mixed to form one composite plant sample per plot and then stored at 4 °C for further analysis. Three plots (1 m × 1 m) of the ten samples were randomly selected in each site to determine herb and litter biomass. Woody plants biomass was calculated by models according to the measured DBH (Table S1), diameter at ground level and tree height.
Soil at depths of 0–20 cm was collected from three plots per site, providing a total of 63 plots sampled. Soil samples were mixed from at least 6 soil cores, and then stones, root, animal and plant debris were removed. These samples were then placed in ice boxes and immediately transported to the laboratory. Each soil sample was then divided into three portions. One portion was air dried and sieved through 2 mm and 0.15 mm mesh for testing soil properties. A second portion was immediately placed into a freezer at −80 °C to be used to determine the soil microbial indices, and the remaining soil sample was stored at 4 °C for backup analysis.

2.3. Sample Analysis

2.3.1. Plant and Soil Physicochemical Properties

Soil depth was measured by a 1.5 m sharp steel. Soil depth of more than 1 m was recorded as 1 m. Soil temperature at 5 cm soil depth (Ts) was determined by a portable soil thermometer. In the laboratory, for 100 cm3 soil cores, gravimetric soil water content (SWC) and bulk density (BD) at 0–20 cm were determined by drying soil samples at 105 °C for 48 h. Soil pH was measured using a pH meter with a soil–to–water ratio of 1:2.5 (w/v); soil texture (sand, silt and clay) was measured using a soil particle composition analyzer; soil organic carbon (SOC) was measured by wet oxidation with KCr2O7 and H2SO4, and titration with FeSO4; total nitrogen (soil TN) was measured by the Kjeldahl method; ammonium–nitrogen (NH4+) and nitrate–nitrogen (NO3) were measured using phenolic disulfonic acid colorimetry and indophenol blue colorimetry; available phosphorus (soil AP) and available potassium (soil AK) were measured using the M3 leaching agent and detected by spectrophotometer and flame photometer, respectively; total phosphorus (soil TP), total potassium (soil TK), soil calcium (soil Ca) and soil magnesium (soil Mg) were measured by a spectrophotometer after HF–HClO4 resolution. Plant and litter main element contents (C, N, P, K, Ca and Mg) were all analyzed by the same method as for soil total elements (SOC, TN, TP, TK, soil Ca and soil Mg). Detailed step reference was according to the China agricultural standard (2006). The stoichiometric characteristics of soil, litter and leaf, including C:N, C:P, N:P, P:K and Ca:Mg, were calculated.

2.3.2. Phospholipid Fatty Acid (PLFA) Analysis

PLFAs were extracted from subsamples (8 g) using a mixture of chloroform, methanol, and phosphate buffer according to a method modified from Zhao et al. [40]. Nonadecanoic acid methyl ester 19:0 was added as the internal standard. Samples were analyzed using gas chromatography (Agilent 6890 Series, Agilent Technologies, Palo Alto, Santa Clara, CA, USA). The concentrations of the individual compounds were obtained by comparing the peaks with a standard mixture of saturated fatty acids and unsaturated fatty acids by combination with the MIDI microbial identification system (MIDI, Inc., Newark, NJ, USA). Soil microbial PLFAs were evaluated to determine the biomass and structural diversity of soil microorganisms [41]. The biological indicators of phospholipid fatty acids according, to Ma et al. [42], Pasayat [43] and Veum et al. [44] are shown in Table 1.
A total of 85 microbial PLFAs were identified (Table 1). We further compared the PLFAs assigned to six microbial groups, including general bacterial PLFA, Gram–positive bacterial PLFA (G+), Gram–negative bacterial PLFA (G−), fungal PLFA (F), actinomycetic PLFA and eukaryotic PLFA. Total bacterial PLFA (B) is the sum of general bacterial PLFA, G+ and G−, and 6 microbial physiological indices of community structure were used, including microbial abundance, microbial diversity, G+/G−, F/B, ratio of cyclopropyl/precursors as calculated by (cy17:0 + cy19:0)/(16:1ω7 + 18:1ω7) (Cy/Pr), ratio of saturated PLFA to monounsaturated PLFA (S/M).

2.4. Data Analysis

2.4.1. Plant Species Diversity Calculation

Four typical indices were selected to represent the diversity characteristics of plant communities.
(1) Species abundance index (S)
S = N/A
(2) Shannon–Wiener species diversity index (H)
H = P i × l n P i
(3) Simpson dominance index (D)
D = 1 P i 2
(4) Pielou evenness index (J)
J = H / lnS
where N is the number of species in each quadrat, A is sample area, m2, and A = 1 when calculating microbial abundance. Pi is the importance values of species i, which are calculated as follows [45]:
  • Tree Pi = (relative frequency + relative density + relative basal coverage)/3
  • Shrub Pi = (relative frequency + relative density + relative coverage)/3
  • Herbs Pi = (relative frequency + relative height + relative coverage)/3
Where the relative density of the tree layer = the number of individuals species in the quadrat/the total number of individuals of species; relative frequency = the number of occurrences of one species in a certain quadrat/the total number of occurrences of all species; relative basal coverage = area at breast height of one species in the quadrat/area at breast height of all species.

2.4.2. Soil Microbial Diversity Calculation

Two main indices were selected to represent the diversity characteristics of soil microbial communities.
(1)
Species abundance index (S)
S = N
(2)
Shannon–Wiener species diversity index (H)
H = P i × l n P i
where N is the number of soil microbial PLFAs in each soil sample. Microorganism Pi = relative concentration, calculated by the ratio of the content of each PLFA to the total microbial PLFA content of the sample.

2.4.3. Selection of Minimum Data Set

Principal component analysis (PCA) was used to select the minimum data set (MDS) of soil PLFA variables, plant, edaphic and environmental background factors according to the method described in Guan and Fan [46], so that the representative and brief correlation analysis results could be presented. We took into consideration, for the MDS, the following conditions: (1) principal components (PCs) with eigenvalues ≥1 [47] and which explained more than 4% of the total variation; (2) indices with the maximum weight and over 90% of the maximum in each PC [48]; (3) correlation coefficient based on Pearson’s correlation analysis between indicators within a PC should be less than 0.6 [49]. When there is more than one high–loading indicator in a single PC and they are highly correlated (>0.6) with each other, only the indicator with the highest eigenvector was selected [50].

2.4.4. Statistical Analysis

The normal distribution of data was tested by Kolmogorov–Smirnov. Significant differences in indices of soil microbial community and environmental factors between two kinds of communities with shallow and deep soil depth were tested by independent sample t test at the 0.05 level. Data that did not conform to the normal distribution were tested by independent samples t test in a nonparametric test. PCA was used to select the MDS of indices in SPSS 22. The Pearson’s correlation analysis was tested between microbial indices and environmental factors. Major factors that significantly affect microbial community were analyzed with factor analysis by forward selection (alpha = 0.05). The pure and combined effects of environmental background, plant and edaphic factors were determined with variance partitioning analysis (VPA) in R 4.0. The histogram was drawn by Origin 2019.

2.5. Other Data Source

For topographic and climatic data (mean annual precipitation and mean annual temperature) in this study, refer to http://www.resdc.cn/.

3. Results

3.1. Physiochemical Properties of the Plant and Soil of the Two Soil Depth Community Categories

Soil nutrients in shallow–SDC were more abundant than those in deep–SDC. The differences in SOC, soil TN, soil TP, soil C:P, soil N:P, SWC, NH4+, soil AP and soil Ca between the two communities were significant (Table 2) (p < 0.05). The pH in the shallow–SDC (7.45) was also significantly higher than that in the deep–SDC (6.07) (p < 0.05). Similarly, significantly higher contents of leaf Ca, Mg and litter Ca, Mg were found in the shallow–SDC compared to the deep–SDC (p < 0.05). In contrast, significantly higher woody biomass, leaf C:N and litter C contents were found in the deep–SDC than in the shallow–SDC (p < 0.05). However, no significant differences in plant community diversity indices (S, H, D, J) were observed between the two communities.

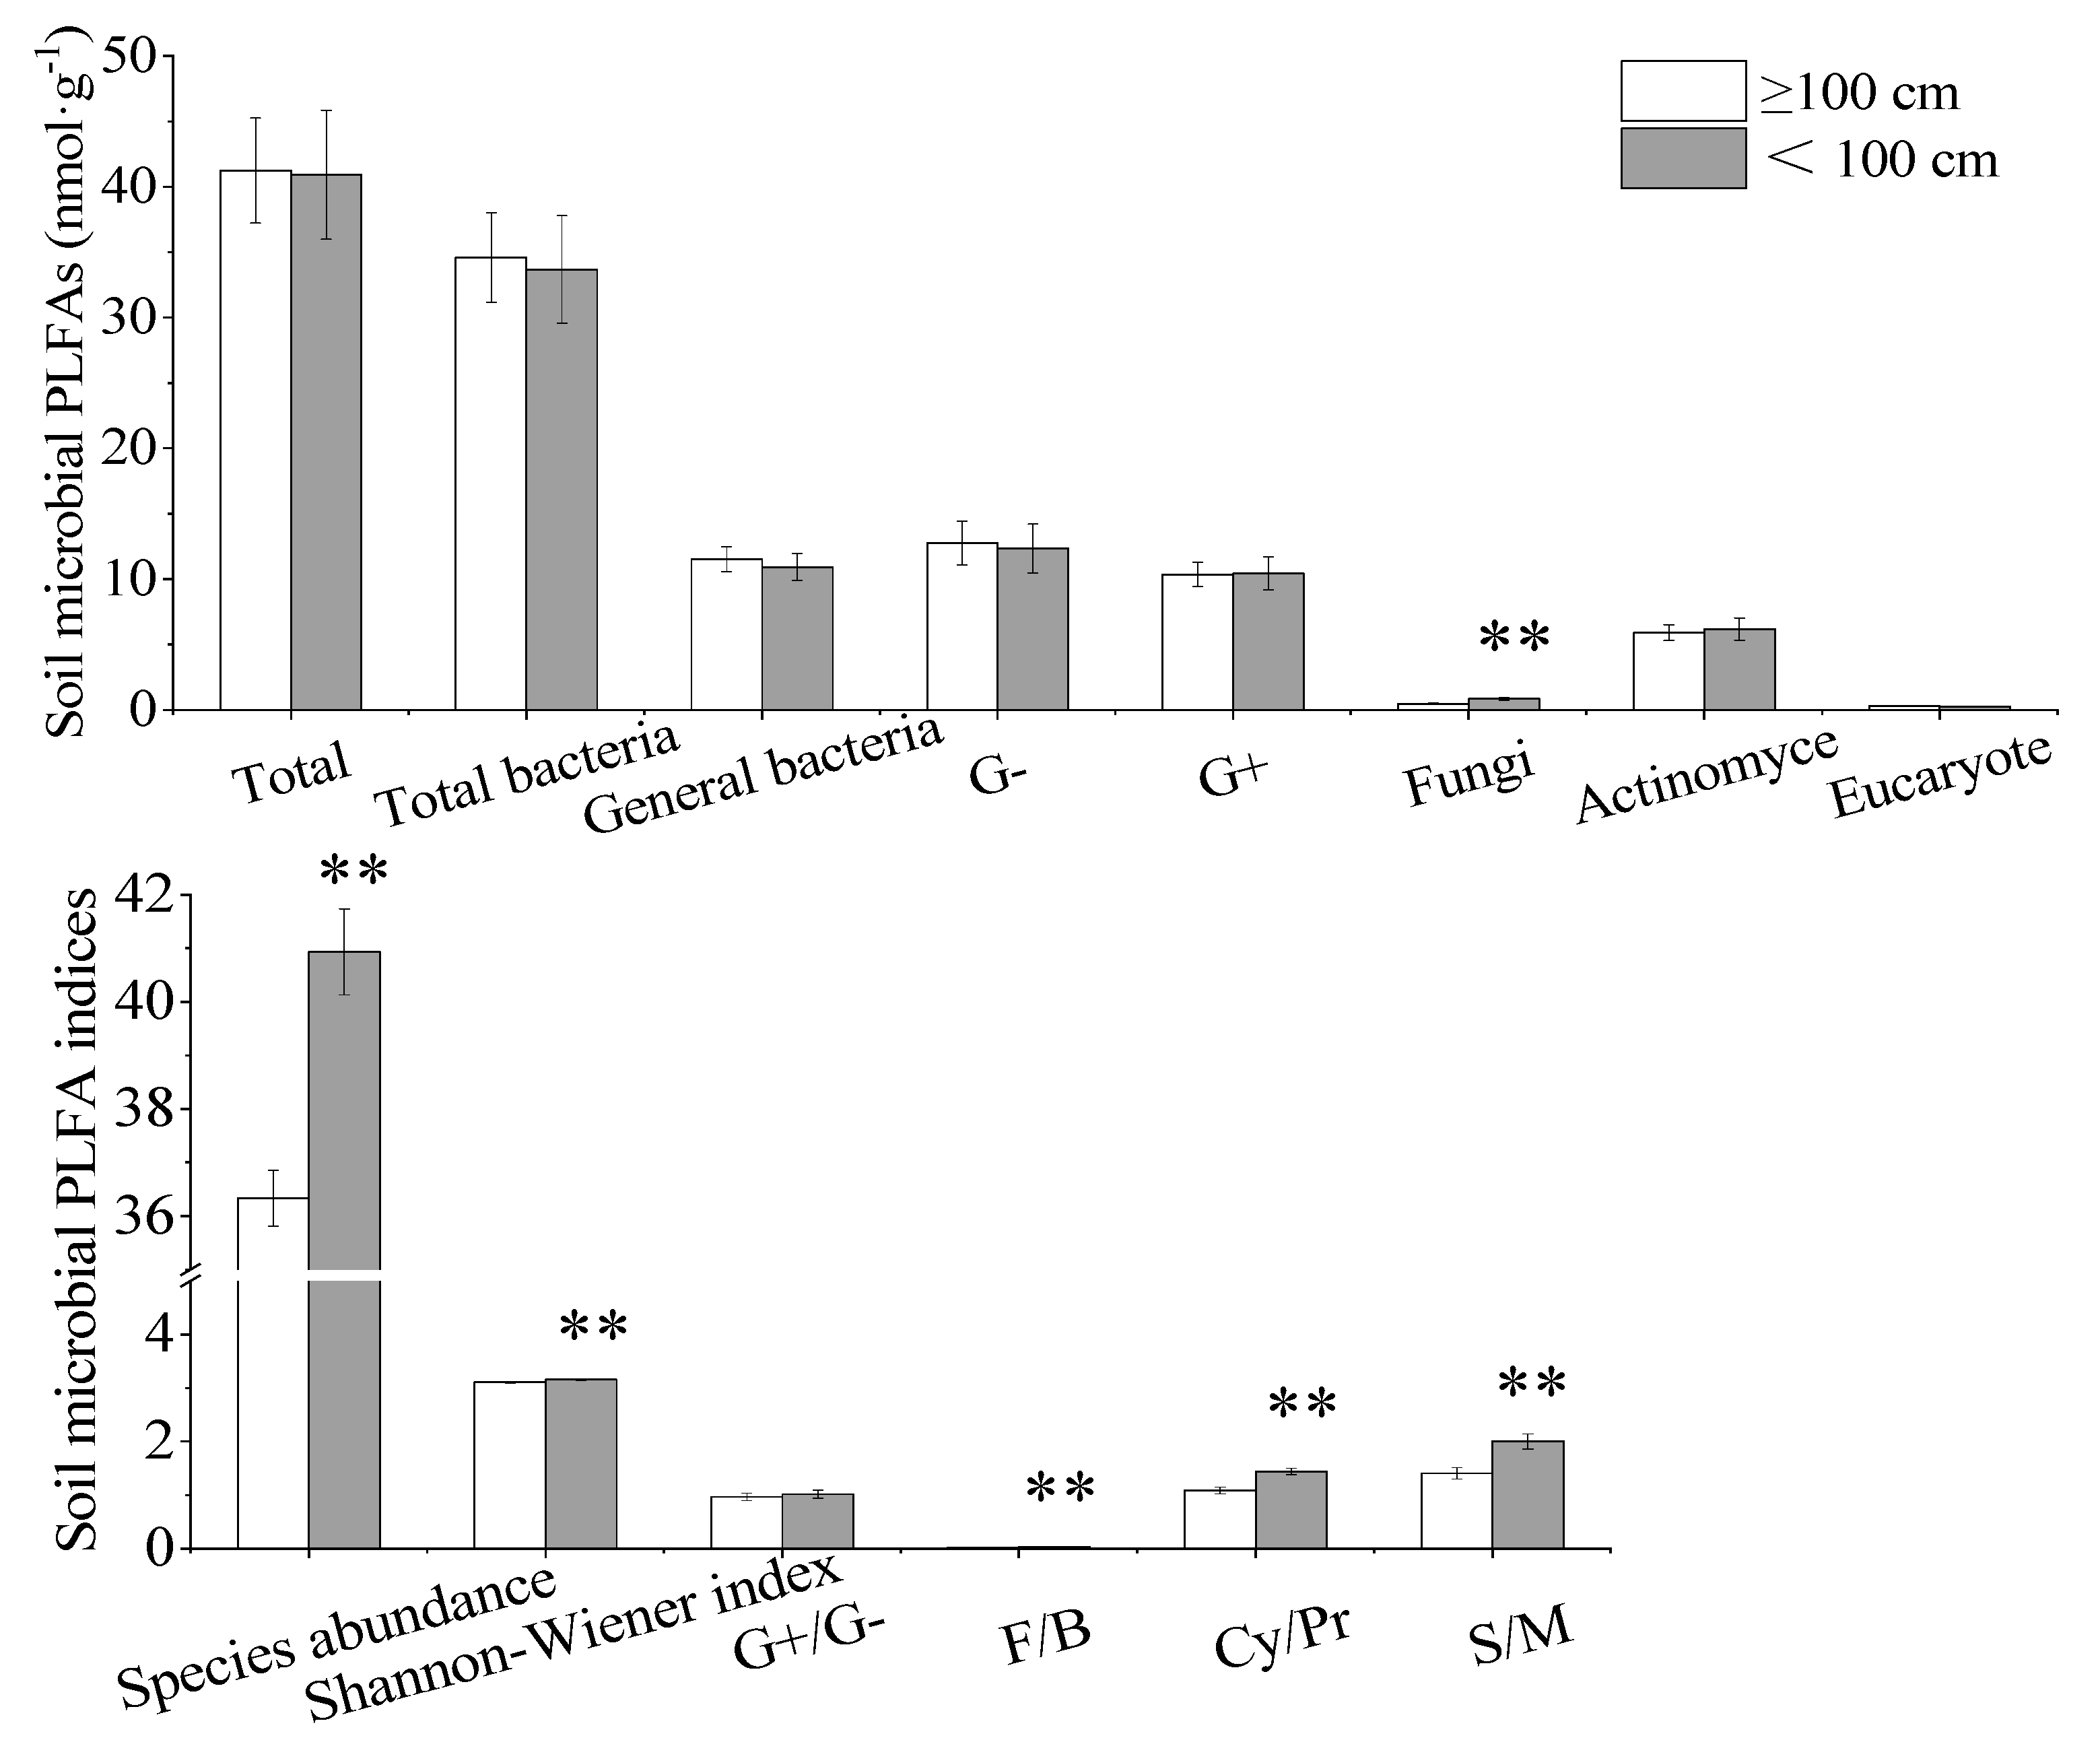
3.2. Soil PLFA Profiles of the Two Soil Depth Communitiey Categories

Fungal PLFA was significantly higher in shallow–SDC than in the deep–SDC (p < 0.01), but no significant differences in the other microbial PLFA were found between the two communities (Figure 2). Similarly, compared to deep–SDC, significantly higher soil microbial PLFA indices, including microbial S, microbial H, F/B, Cy/Pr and S/M, were found in the shallow–SDC (p < 0.01).

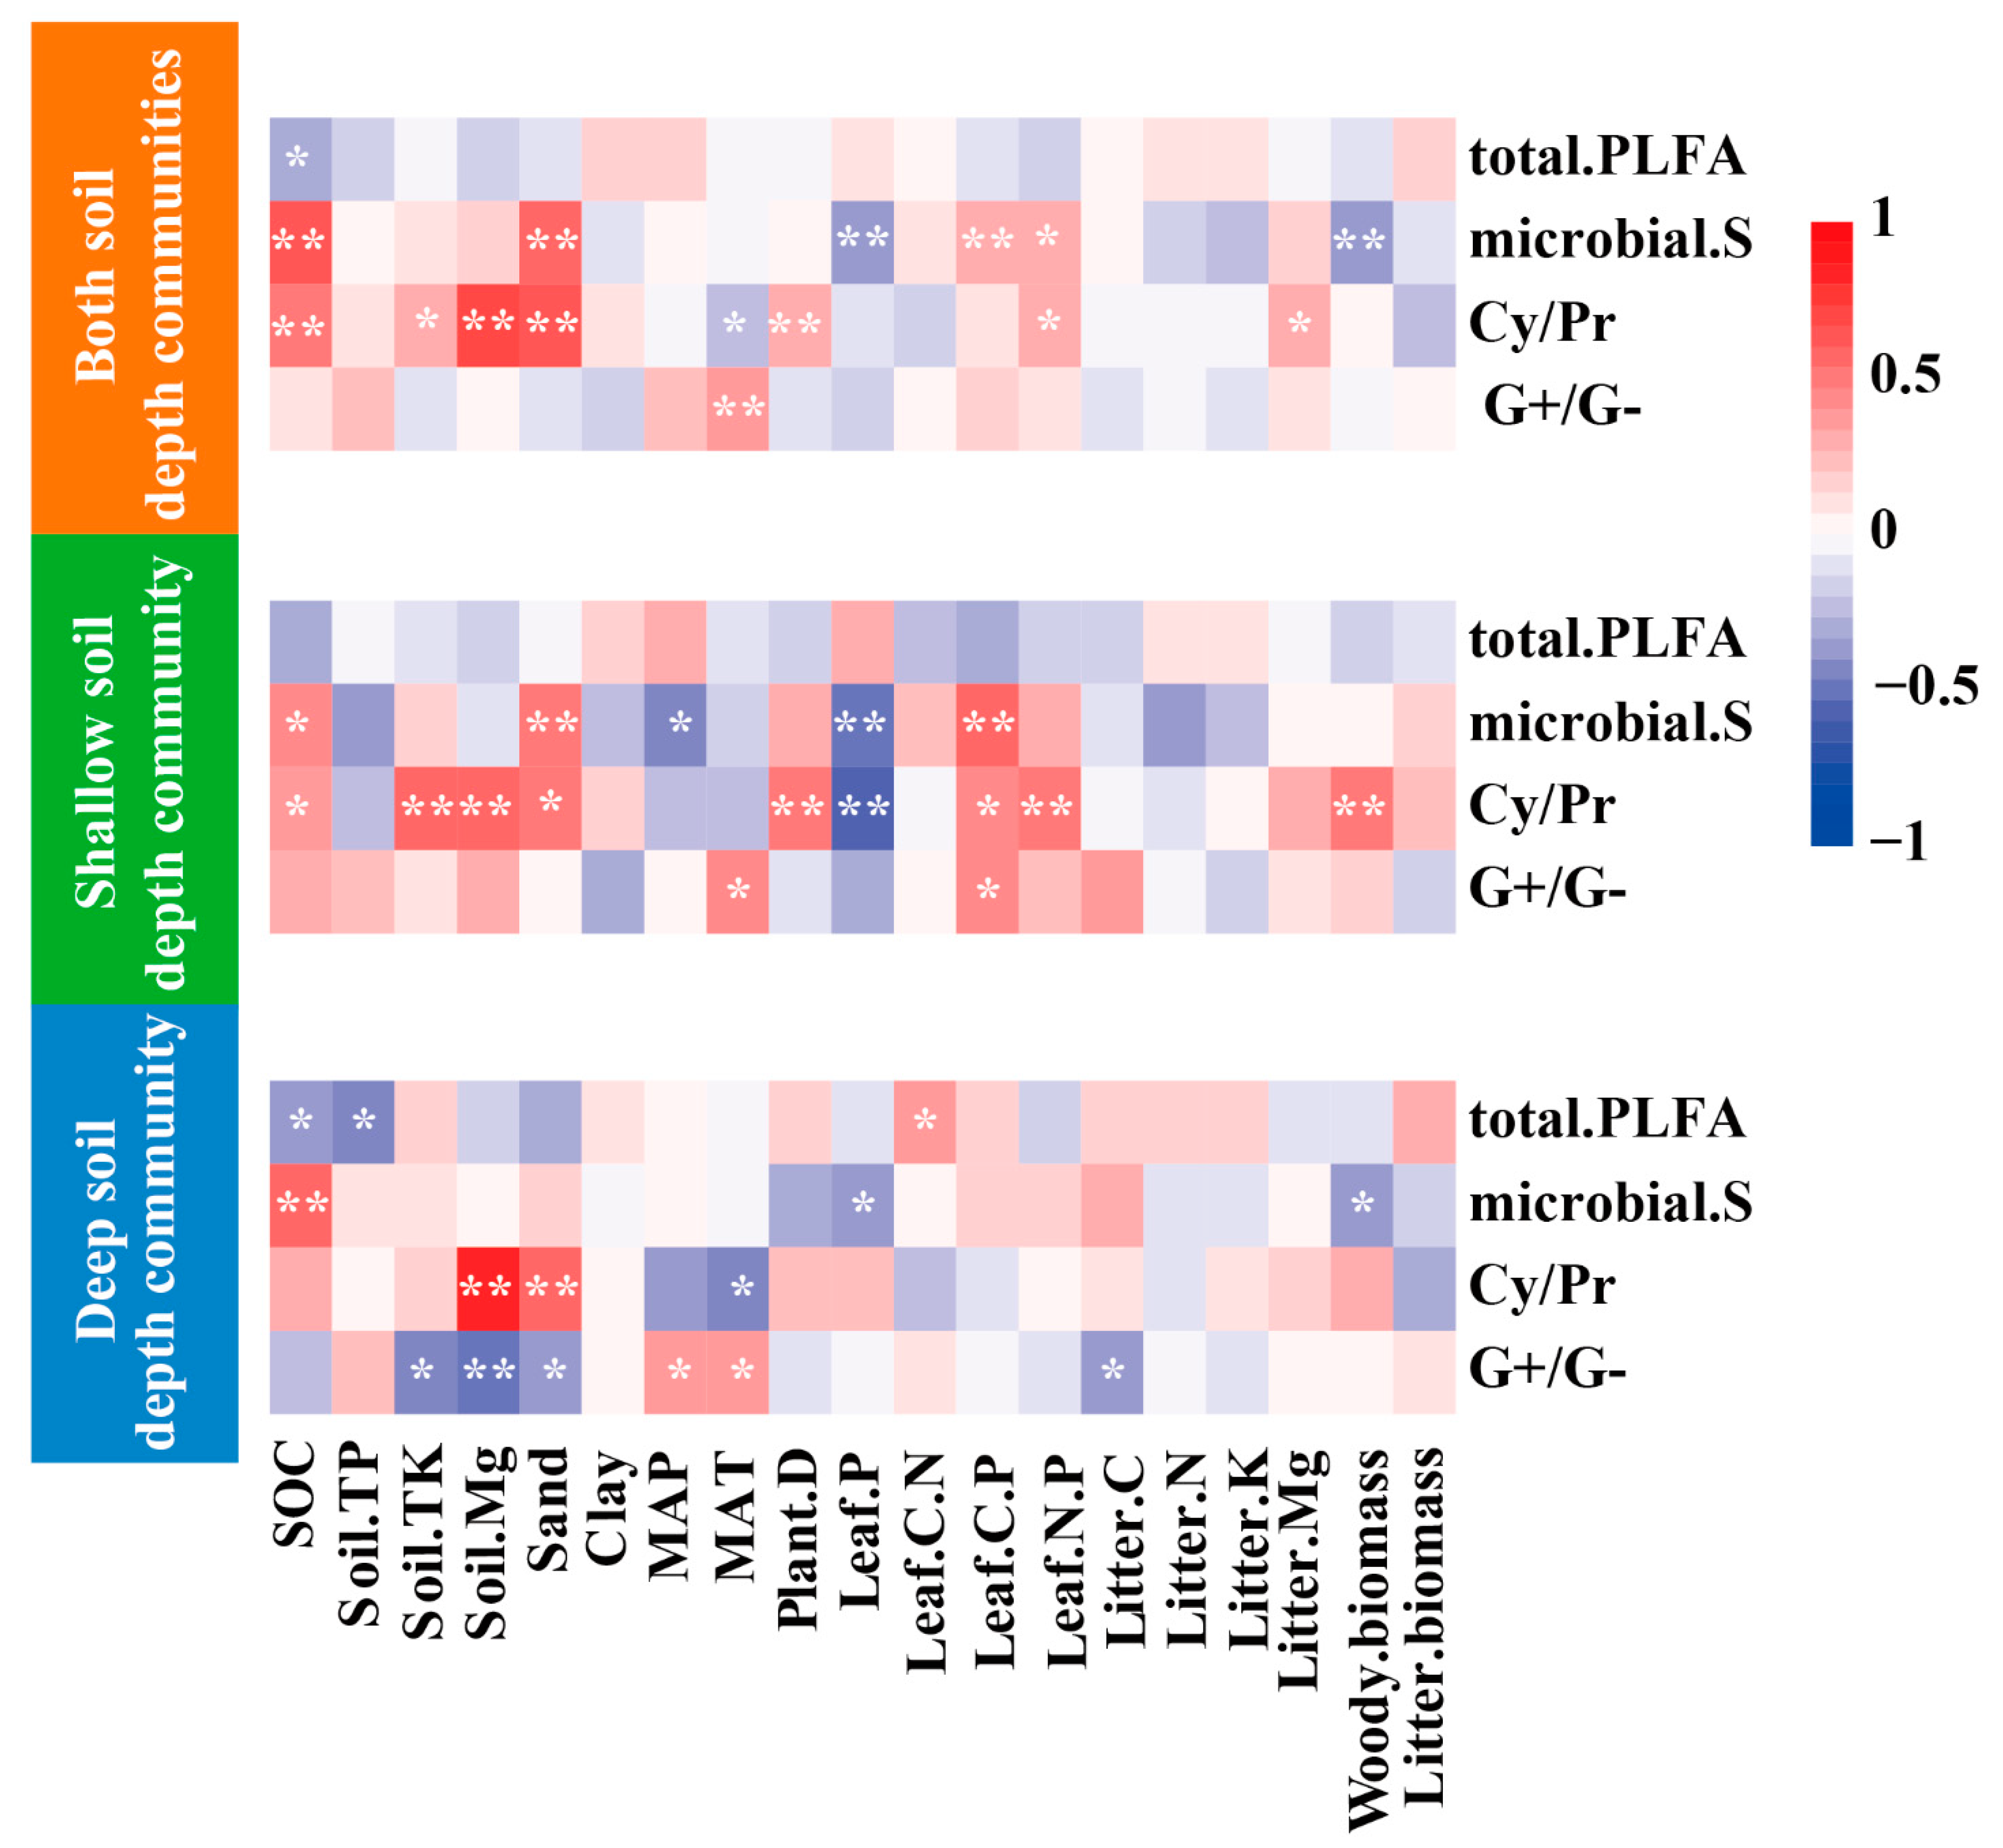
3.3. Pearson’s Correlation Analysis between Soil PLFA Profiles and Environmental Factors in the Communities with Shallow and Deep Soil Depths

The precise MDS of PLFA indices contained four indicators: total PLFA, G+/G−, Cy/Pr, and microbial S (Tables S2 and S3). Similarly, we selected four edaphic factors (SOC, TP, TK, soil Mg (Tables S4 and S5)), four background factors (sand, clay, MAP, MAT (Tables S6 and S7)), and eleven plant factors (leaf P, leaf C:N, leaf C:P, leaf N:P, plant community D, litter C, litter N, litter K, litter Mg, woody biomass and litter biomass (Tables S8 and S9)).
Pearson’s correlation analysis showed that significant negative correlation between total PLFA and SOC was observed in both soil depth communities (p < 0.05). However, the correlations between total PLFA and environmental factors were weak (Figure 3). The correlation between microbial S and SOC was significantly positive (p < 0.05). Significant negative correlation between MAP and microbial S, and significant positive correlation between leaf C:P and microbial S, were only found in the shallow–SDC (p < 0.05). In addition, significant positive correlation between Cy/Pr and plant factors, including plant D, leaf C:P, N:P, and woody biomass, was only found in the shallow–SDC (p < 0.05). Significant positive correlation between G+/G− and MAT was observed in all communities. However, significant negative correlation between edaphic factors (including soil TK, Mg and sand) and G+/G− was only found in the deep–SDC (p < 0.05).

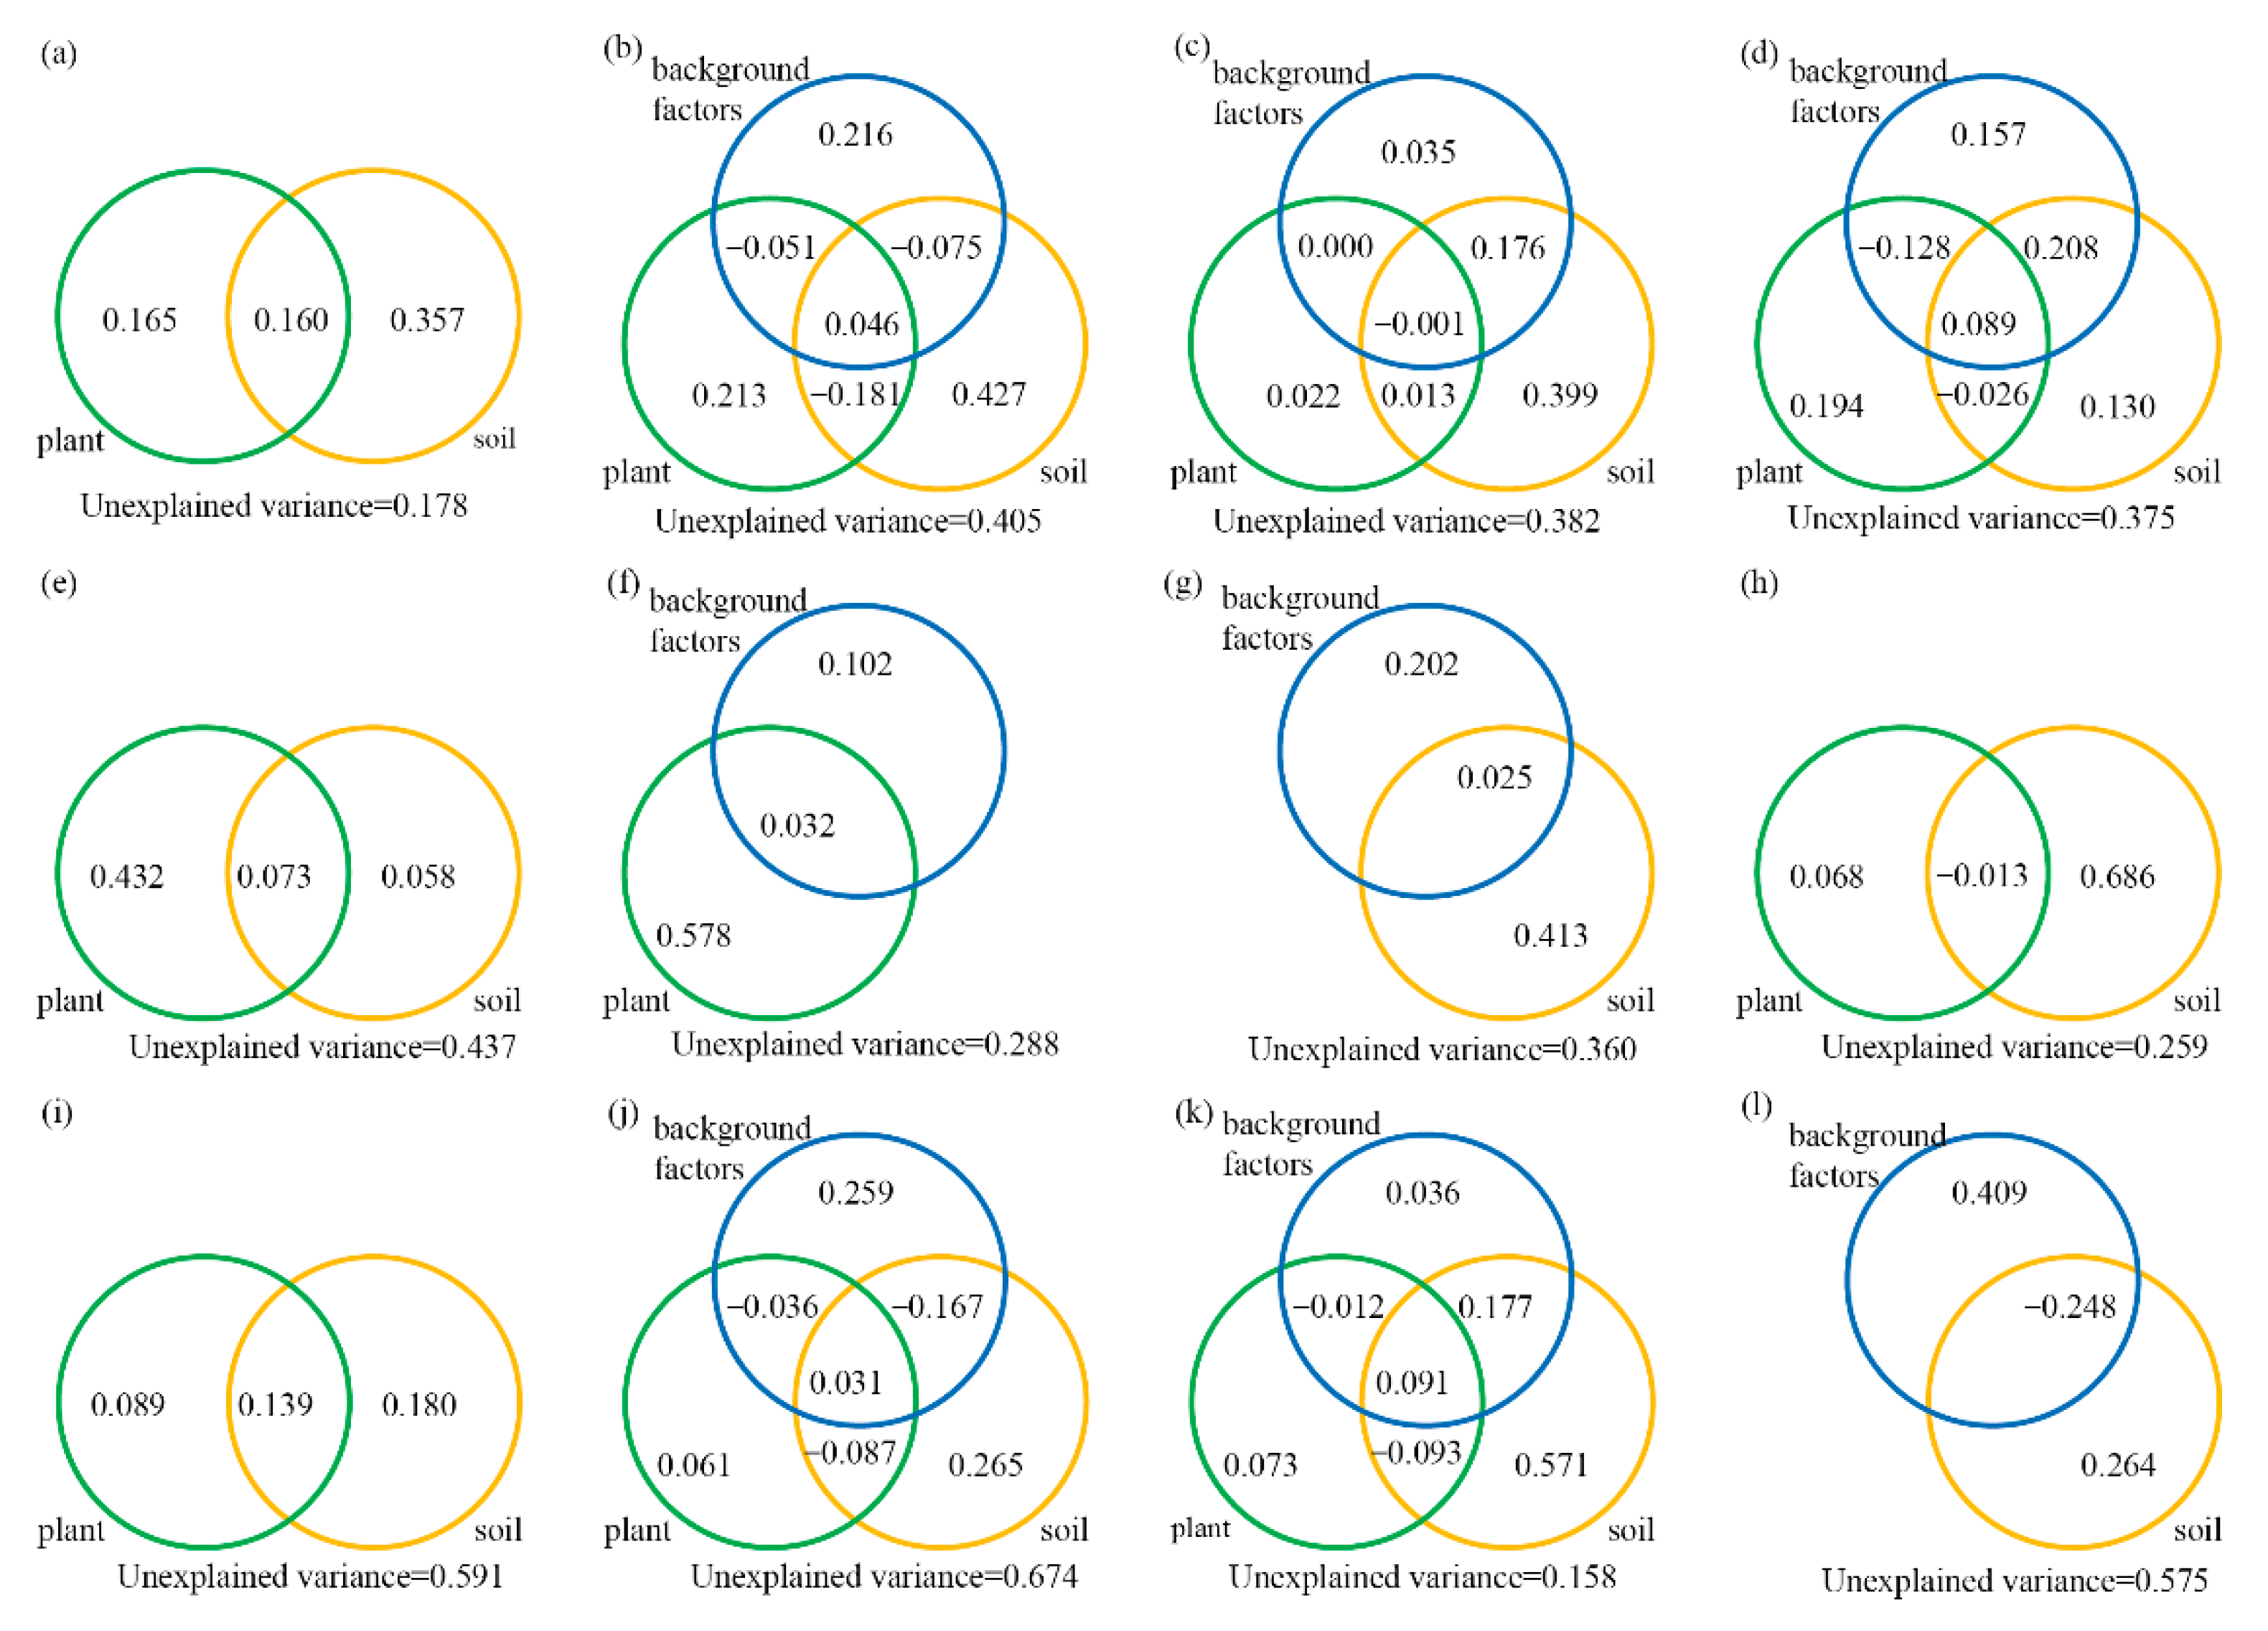
3.4. Combined Effects of Plant, Edaphic and Background Factors on Microbial Communities

Forward selection revealed that 36 of the 48 factors considered in the study were selected in the models, including background variables (MAT, elevation, sand), edaphic variables (BD, SWC, NH4+, NO3, pH, Ts, SOC, TN, TP, AP, AK, TK, Ca, Mg, C:N, C:P, N:P) and plant variables (herb biomass, woody biomass, J, S, leaf parameters (C, N, P, K, Ca, Mg, N:P) and litter parameters (litter biomass, P, Mg, C:N, C:P)) (Table S10). VPA further demonstrated that soil microbial PLFA profiles were mainly affected by edaphic factors, with data from all communities (Figure 4a–d).
Pure plant effects explained the largest amounts of variance in the six kinds of microbial PLFA content (general bacteria, G+, G−, fungi, eukaryote, actinomycete) (43.2%) (Figure 4e) and G+/G− and F/B (57.8%) (Figure 4f) in shallow–SDC. These were obviously higher than those in deep–SDC (8.9% and 6.1%) (Figure 4i,j). Similarly, pure soil effects explained 68.6% of the variance in microbial S and H in shallow–SDC (Figure 4h). This was obviously higher than that for deep–SDC (26.4%) (Figure 4l). Strong overlaps existed between edaphic and background factors for Cy/Pr and S/M in deep–SDC (26.8%), although the pure effect of background factors was small (3.6%), suggesting that background factors may indirectly affect Cy/Pr and S/M through edaphic factors (Figure 4k).

4. Discussion

4.1. Driving Factors of Microbial Biomass and Diversity

Although the environment of shallow–SDC, degraded karst ecosystems with serious soil erosion, is harsh [51], higher fungal PLFA and microbial S, H were observed in shallow–SDC than in deep–SDC. Further, the PLFA of general bacteria, G+, G−, eukaryote and actinomycete, did not differ significantly between these two communities (Figure 2). These findings do not support our first hypothesis that microbial biomass and species diversity would be lower in the shallow–SDC than in the deep–SDC. The possible explanations are as follows: (1) rock outcrops that occur in shallow–SDC provide sufficient rock weathering products [31,52]; (2) litter tends to collect on soil surfaces other than bare rock in shallow–SDC, resulting in more abundant litter supply on the soil surface of shallow–SDC than for deep–SDC. Both phenomena contribute to increased soil nutrients in shallow–SDC, and this was conducive to microbial biomass and diversity (Table 2). Thus, even though higher woody plant biomass and plant carbon form leaf C and litter C were found in deep–SDC, higher soil nutrient contents were found in shallow–SDC than in deep–SDC (Table 2).
In our study, edaphic factors were the main drivers for microbial biomass in all communities. Strong edaphic effects on soil microbial biomass were mainly associated with SWC, pH and soil C:N (Table S10). This was similar to the previous findings that SWC, pH and soil C:N were always considered to be the most significant factors affecting soil microbial community at the regional scale [9,18,35,53,54,55,56]. However, most studies support that SWC is positively correlated with microbial biomass [57,58,59]. In our study, SWC was negatively correlated with microbial biomass. A possibility is that an increase in SWC may not promote microbial biomass or even reduce it [54,60] because high–SWC–induced low soil oxygen might suppress microbial activity [61]. In our study, SWC (ranging from 18.21 to 46.07%, and averaging 32.57%) was generally higher than that in the study of Ma et al. [54] (SWC 3–35%), who found that higher G− and fungi levels were observed for drier soils; Yu et al. [62] also showed that soil microbial biomass in a typical karst landform area was higher in the dry than in the wet season. This conclusion is inconsistent with the common observation that soil water shortage in karst areas results from severe leakage loss and surface runoff [63]. Possibly, this is because we sampled during the rainy season. As soil microbial abundance, community structure and biomass vary with season [64], this conclusion may apply only to the rainy season. As another reason, a positive relationship has always been found between SWC and microbial biomass, mainly because water is essential for nutrient cycling in soil [65,66]. Higher SWC is conducive to dissolving more available nutrients, and this has a strong influence on the microbial community [67,68]. In our study, NO3 and AP are generally considered as major factors conducive to soil microbial biomass by providing food sources. This has been demonstrated in studies throughout the world [69,70] as being negatively correlated with SWC (Table S4). This phenomenon changes the connection between higher SWC and more nutrients, and this determined the positive correlation between SWC and microbial biomass in our study. Similarly, SOC was negatively correlated with microbial biomass, which is contrary to previous results that indicate that SOC plays an important role in shaping soil microbial communities at the regional and continental scales [9,71,72]. In brief, microbial biomass was not tightly and closely coupled to a single soil nutrient index for the complex fluctuations of various soil nutrients in this study. This result is consistent with the study of Ma et al. [54], which reported that microbial biomass was similar with different contents of mixed available nutrients. As previous studies have shown, no single biotic or abiotic factor is consistently the most important in determining soil microbial composition and biomass across global, regional and local scales. Essentially, it is mainly dependent on the gradients of factors influencing the sample, as the soil environment is so heterogeneous [73]. The effects of the complex interlacing among factors on microbial biomass, which we did not consider in our study, may account in part for the unexplained variation in biomass, which was a considerable component (43.7% in shallow–SDC and 59.1% in deep–SDC) (Table S10, Figure 4). Therefore, more attention should be paid to the combination of the effects of multiple factors on microbial biomass in karst areas.
The combined forward selection and VPA showed that microbial biomass and diversity in shallow–SDC were explained more by plant and edaphic factors than in deep–SDC (Figure 4). This supports our second hypothesis that the soil microbial community in shallow–SDC would be more strongly driven by plant and edaphic factors than that in deep–SDC. Microbial biomass in shallow–SDC could be primarily explained by plant variables (Figure 4, Table S10). The positive correlation between plant factors and microbial biomass in degraded ecosystems has been shown in previous studies [10,39]. Therefore, vegetation restoration should have an important role in improving microbial biomass in shallow–SDC karst areas. Background environmental factors (including soil texture, elevation, MAT and MAP) had no significant direct impact on microbial biomass as compared to plant and soil factors in our study (Figure 4a,e,i). It is always assumed that the ultimate “distal” control of microbial community composition is enacted through its effects on plant and soil [7,55].
Our study demonstrated that 68.6% of the variation in soil microbial S and H was explained by pure edaphic factors associated with soil TN in shallow–SDC (Figure 4h, Table S10). This finding is consistent with previous studies [74,75,76], as nutrient–rich communities often have higher microbial S and H [52,77]. In addition, rock outcrops in shallow–SDC resulted in high habitat heterogeneity, thus supporting higher microbial diversity. This is consistent with a previous report that microbial diversity was greater in the KRD areas than in the non–KRD areas [37]. Plant species diversity (S, H, D, J) had no significant effect on microbial S and H (Table S10). This agrees with a previous study that found that no clear relationships between plant species diversity and microbial diversity were found in a karst region [75]. Therefore, the soil recovery of shallow–SDC is the most effective way to improve microbial diversity.

4.2. Driving Factors of Microbial Community Structures

G+/G− and F/B have the ability to predict ecosystem functions by the method of PLFA [78]. Generally, G+/G− are described as having the capacity for resistance to nutritional stress [52], as G+ are considered as K–strategists that are better able to tolerate stress and grow more slowly on substrate–limited environments, while G− are considered as r–strategists that proliferate in soils with a large supply of nutrients [79,80,81]. Similarly, F/B is indicative of the prevalence of K–strategists, and increasing F/B can also indicate the increase in microbial community structure resistance [82]. In the present study, higher F/B was observed in shallow–SDC, supporting our third hypothesis that the microbial community would have stronger resistance to stress in shallow–SDC than in deep–SDC. This was because microbes adapt to their environment by adjusting the composition of different functional microorganisms, and fungi as K–strategists have a higher competitive advantage in harsh environments [83].
We found that G+/G− and F/B were positively correlated with MAT in both soil depth communities (Figure 3, Table S10). However, previous studies confirmed that high temperatures reduced fungal biomass, whereas bacterial biomass was almost unaffected, thus reducing F/B [84,85,86]. A possible explanation is that the climatic conditions of our study were different from those of previous studies, and that the resource–ecological and limiting conditions for each group of microbial communities were different, resulting in the different response of microorganisms to climate [87,88]. G+/G− and F/B were controlled by plant factors in shallow–SDC, whereas no significant edaphic factors were observed. However, other research has found that G+/G− and F/B are not only controlled by plant factors, such as vegetation types and litter characteristics, but are also strongly influenced by edaphic factors, such as moisture, C and N availability [52,78,89,90,91,92]. There are several possible interpretations. Firstly, as analyzed above, variable contents of water and the many nutrients in the communities studied weakened their relationship with G+/G− and F/B. In shallow–SDC, outcrop rocks were more susceptible to weathering to produce nutrients, and the greater presence of rock fissures in shallow–SDC led to severe nutrient loss, resulting in a complex correlation between nutrients. For example, no consistent trends were observed between NO3 and NH4+ in this study (coefficient = −0.18) (Table S4), as both of them had a strong positive effect on bacteria [93], and higher NO3 and NH4+ may support higher bacterial biomass and contribute to lower F/B [86,89]. Thus, the negative correlation between NO3 and NH4+ weekend their relationship with F/B. In addition, soil C:N in this study ranged from 5.58 to 11.63, averaging 9.20, which may not favor fungi or bacteria, given that fungi have soil C:N ratios that range from 10:1 to 15:1, while bacteria have C:N ratios ranging from 3.5:1 to 7:1 [94]. This resulted in a weak link between F/B and soil C:N. As such, the edaphic factors tested here did little to explain the variation in F/B and G+/G− in shallow–SDC. Plants serve as the main source of nutrients, such as C, but communities with shallow soil depth cannot support as many woody plants as communities with deep soil depth (Table 2), which support plants that provide more C required for soil microbial growth. Therefore, plant factors, such as woody biomass, litter C:N, and litter C:P, would be in greater demand and contribute more to microbial K–strategists in shallow–SDC.
Cy/Pr as well as S/M have been proposed as sensitive and valid indicators of stress conditions [95,96]. In our study, significantly higher Cy/Pr and S/M were found in shallow–SDC than in deep–SDC, suggesting higher stress for the microbial community of shallow–SDC. However, studies have confirmed that Cy/Pr and S/M can increase under situations such as acidic soil, low nutrient availability, high temperature, and low oxygen conditions [95,97,98,99,100,101,102]. This is contrary to our findings that higher pH, nutrients and SWC were found in shallow–SDC than in deep–SDC, and Ts did not differ significantly between these two communities. We interpret this as follows. SWC in this study (samples collected in rainy season) may cause a low oxygen condition, as mentioned in Section 4.1. Alternately, as the average value of pH in shallow–SDC was 7.45, its microbial community may be stressed more by alkaline soil than by acidic soil. In this study, soil was the major factor driving Cy/Pr and S/M in the two soil depth communities. This, as supported by the results in Table S4, was largely associated with pH, soil Ca and soil Mg, Ca and Mg being closely related to soil pH in karst areas. When multiple factors co–occur, predictors vary with dominant factors [101]. Thus, we prefer to believe that Cy/Pr and S/M were controlled by pH in the karst areas we studied. The soil microbial communities of the two soil depth communities were all subjected to environmental stress according to Cy/Pr > 0.1 [103], indicating poor soil conditions for soil microorganisms in karst areas [104]. Thus, further ecological restoration is still necessary for the karst areas we studied.

5. Conclusions

Soil nutrients are enriched in the limited soil volume of shallow–SDC, thus the microbial biomass and diversity of shallow–SDC in harsh habitats were not lower than those of deep–SDC. As soil microorganisms in shallow–SDC were more closely related to plant–soil factors than in deep–SDC, vegetation restoration and soil recovery can effectively improve soil microbial biomass, diversity and stress tolerance in degraded karst areas. Perhaps the alkaline soil in karst areas restricts the growth of microorganisms, so consequently, the soil microbial communities studied were all under environmental stress. Thus, more ecological restoration of plant communities on karst areas is recommended to provide better habitats for soil microorganisms.

Supplementary Materials

The following are available online at https://0-www-mdpi-com.brum.beds.ac.uk/2073-4395/11/1/173/s1, Table S1: Woody species type and biomass regression models; Table S2: Pearson correlation coefficients of soil PLFA indices; Table S3: Principal components analysis of soil PLFA indices; Table S4: Pearson correlation coefficients of edaphic factors; Table S5: Principal components analysis of soil PLFA indices; Table S6: Pearson correlation coefficients of environment background factors; Table S7: Principal components analysis of environment background factors; Table S8: Pearson correlation coefficients of plant factors; Table S9: Principal components analysis of plant factors; Table S10: Forward selection of soil microbial communities with background, edaphic and plant variables in two soil depth karst communities.

Author Contributions

Conceptualization, H.G. and J.F.; Methodology, H.G.; Software H.G.; Validation H.G., J.F., H.Z. and W.H. Formal Analysis H.G.; Investigation H.G.; Resources, H.G.; Data Curation, H.G.; Writing-Original Draft Preparation, H.G.; Writing-Review & Editing, W.H.; Visualization, H.G.; Supervision, H.Z.; Project Administration, J.F. and Funding Acquisition, J.F. All authors have read and agreed to the published version of the manuscript.

Funding

This work was supported by the National Key Research and Development Program (2017YFC0506505).

Institutional Review Board Statement

Not applicable.

Informed Consent Statement

Informed consent was obtained from all subjects involved in the study.

Acknowledgments

We are grateful to the economic plantation land–owners who allowed access to their properties. We also thank Qin Tian and Rongrong Hu of Guizhou University and Xinyuan Zhang of the Institute of Geographic Sciences and Natural Resources Research, Chinese Academy of Sciences for their considerable help in plant species identification and field sampling. We thank Li Huang of the Institute of Geographic Sciences and Natural Resources Research, Chinese Academy of Sciences for her guidance for PLFA tests.

Conflicts of Interest

The authors declare no conflict of interest.

References

  1. Grosso, F.; Iovieno, P.; Alfani, A.; De Nicola, F. Structure and activity of soil microbial communities in three Mediterranean forests. Appl. Soil Ecol. 2018, 130, 280–287. [Google Scholar] [CrossRef]
  2. Wang, X.H.; Yang, J.H.; Xie, X.F.; Chen, X.J.; Pu, L.J.; Zhang, X.W. Soil microbial succession with soil development since costal reclamation. Catena 2020, 187, 8. [Google Scholar] [CrossRef]
  3. Richter, A.; Schöning, I.; Kahl, T.; Bauhus, J.; Ruess, L. Regional environmental conditions shape microbial community structure stronger than local forest management intensity. For. Ecol. Manag. 2018, 409, 250–259. [Google Scholar] [CrossRef]
  4. Wang, J.M.; Wang, Y.; He, N.P.; Ye, Z.Q.; Chen, C.; Zang, R.G.; Feng, Y.M.; Lu, Q.; Li, J.W. Plant functional traits regulate soil bacterial diversity across temperate deserts. Sci. Total Environ. 2020, 715, 9. [Google Scholar] [CrossRef] [PubMed]
  5. Zhong, Z.K.; Zhang, X.Y.; Wang, X.; Fu, S.Y.; Wu, S.J.; Lu, X.Q.; Ren, C.J.; Han, X.H.; Yang, G.H. Soil bacteria and fungi respond differently to plant diversity and plant family composition during the secondary succession of abandoned farmland on the Loess Plateau, China. Plant. Soil 2020, 448, 183–200. [Google Scholar] [CrossRef]
  6. Bardgett, R.D.; Caruso, T. Soil microbial community responses to climate extremes: Resistance, resilience and transitions to alternative states. Philos. Trans. R. Soc. B Biol. Sci. 2020, 375, 13. [Google Scholar] [CrossRef] [Green Version]
  7. Deltedesco, E.; Keiblinger, K.M.; Piepho, H.P.; Antonielli, L.; Potsch, E.M.; Zechmeister-Boltenstern, S.; Gorfer, M. Soil microbial community structure and function mainly respond to indirect effects in a multifactorial climate manipulation experiment. Soil Biol. Biochem. 2020, 142, 12. [Google Scholar] [CrossRef]
  8. Baldrian, P.; Merhautova, V.; Cajthaml, T.; Petrankova, M.; Snajdr, J. Small-scale distribution of extracellular enzymes, fungal, and bacterial biomass in Quercus petraea forest topsoil. Biol. Fertil. Soils 2010, 46, 717–726. [Google Scholar] [CrossRef]
  9. Llado, S.; Lopez-Mondejar, R.; Baldrian, P. Drivers of microbial community structure in forest soils. Appl. Microbiol. Biotechnol. 2018, 102, 4331–4338. [Google Scholar] [CrossRef]
  10. Yang, Y.; Cheng, H.; Dou, Y.X.; An, S.S. Plant and soil traits driving soil fungal community due to tree plantation on the Loess Plateau. Sci. Total Environ. 2020, 708, 12. [Google Scholar] [CrossRef]
  11. Chen, X.L.; Henriksen, T.M.; Svensson, K.; Korsaeth, A. Long-term effects of agricultural production systems on structure and function of the soil microbial community. Appl. Soil Ecol. 2020, 147, 10. [Google Scholar] [CrossRef]
  12. Qiu, J.M.; Cao, J.H.; Lan, G.Y.; Liang, Y.M.; Wang, H.; Li, Q. The Influence of Land Use Patterns on Soil Bacterial Community Structure in the Karst Graben Basin of Yunnan Province, China. Forests 2020, 11, 15. [Google Scholar] [CrossRef] [Green Version]
  13. Santos, S.S.; Scholer, A.; Nielsen, T.K.; Hansen, L.H.; Schloter, M.; Winding, A. Land use as a driver for protist community structure in soils under agricultural use across Europe. Sci. Total Environ. 2020, 717, 11. [Google Scholar] [CrossRef]
  14. Aho, K.A.; Weber, C.F.; Christner, B.C.; Vinatzer, B.A.; Morris, C.E.; Joyce, R.; Failor, K.C.; Werth, J.T.; Bayless-Edwards, A.L.H.; Schmale, D.G. Spatiotemporal patterns of microbial composition and diversity in precipitation. Ecol. Monogr. 2020, 90, e01394. [Google Scholar] [CrossRef] [Green Version]
  15. Bernhard, A.E.; Chelsky, A.; Giblin, A.E.; Roberts, B.J. Influence of local and regional drivers on spatial and temporal variation of ammonia-oxidizing communities in Gulf of Mexico salt marshes. Environ. Microbiol. Rep. 2019, 11, 825–834. [Google Scholar] [CrossRef] [PubMed]
  16. Chen, D.; Mi, J.; Chu, P.; Cheng, J.; Zhang, L.; Pan, Q.; Xie, Y.; Bai, Y. Patterns and drivers of soil microbial communities along a precipitation gradient on the Mongolian Plateau. Landsc. Ecol. 2014, 30, 1669–1682. [Google Scholar] [CrossRef]
  17. Huang, Y.M.; Liu, D.; An, S.S. Effects of slope aspect on soil nitrogen and microbial properties in the Chinese Loess region. Catena 2015, 125, 135–145. [Google Scholar] [CrossRef]
  18. Yang, Y.; Cheng, H.; Gao, H.; An, S.S. Response and driving factors of soil microbial diversity related to global nitrogen addition. Land Degrad. Dev. 2019, 15, 190–204. [Google Scholar] [CrossRef]
  19. Nie, Y.P.; Ding, Y.L.; Zhang, H.L.; Chen, H.S. Comparison of woody species composition between rocky outcrops and nearby matrix vegetation on degraded karst hillslopes of Southwest China. J. For. Res. 2019, 30, 911–920. [Google Scholar] [CrossRef]
  20. Zhang, C.H.; Qi, X.K.; Wang, K.L.; Zhang, M.Y.; Yue, Y.M. The application of geospatial techniques in monitoring karst vegetation recovery in southwest China: A review. Prog. Phys. Geogr. 2017, 41, 450–477. [Google Scholar] [CrossRef]
  21. Wilhelm, R.C.; Cardenas, E.; Maas, K.R.; Leung, H.; McNeil, L.; Berch, S.; Chapman, W.; Hope, G.; Kranabetter, J.M.; Dube, S.; et al. Biogeography and organic matter removal shape long-term effects of timber harvesting on forest soil microbial communities. ISME J. 2017, 11, 2552–2568. [Google Scholar] [CrossRef] [PubMed] [Green Version]
  22. Neupane, J.; Guo, W.; Acosta-Martinez, V.; Zhang, F.; Lin, Z.; Cano, A. Assessing Spatial Pattern of Soil Microbial Community at Landscape Scale for Precision Soil Management. In Proceedings of the ASA, CSSA and SSSA International Annual Meetings, San Antonio, TX, USA, 10–13 November 2019. [Google Scholar]
  23. Wang, S.J.; Zhang, X.B.; Bai, X.Y. An outline of karst geomorphology zoning in the karst areas of southern China. Mt. Res. 2015, 33, 641–648. (In Chinese) [Google Scholar]
  24. Jiang, Z.C.; Lian, Y.Q.; Qin, X.Q. Rocky desertification in Southwest China: Impacts, causes, and restoration. Earth Sci. Rev. 2014, 132, 1–12. [Google Scholar] [CrossRef]
  25. Bai, Y.E.; Liu, Q.; Gu, Z.F.; Lu, Y.R.; Sheng, Z.P. The dissolution mechanism and karst development of carbonate rocks in karst rocky desertification area of Zhenfeng-Guanling-Huajiang County, Guizhou, China. Carbonates Evaporites 2019, 34, 45–51. [Google Scholar] [CrossRef]
  26. Yan, Y.J.; Dai, Q.H.; Yuan, Y.F.; Peng, X.D.; Zhao, L.S.; Yang, J. Effects of rainfall intensity on runoff and sediment yields on bare slopes in a karst area, SW China. Geoderma 2018, 330, 30–40. [Google Scholar] [CrossRef]
  27. Zhou, H.Y.; Pan, X.Y.; Zhou, W.Z. Assessing spatial distribution of soil erosion in a karst region in southwestern China: A case study in Jinfo Mountains. In International Conference on Energy Engineering and Environmental Protection; Huang, K.L., Kim, K.W., Liu, J., Eds.; IOP Publishing: Bristol, UK, 2017; Volume 52. [Google Scholar]
  28. Ma, T.S.; Deng, X.W.; Chen, L.; Xiang, W.H. The soil properties and their effects on plant diversity in different degrees of rocky desertification. Sci. Total Environ. 2020, 736, 1–8. [Google Scholar] [CrossRef]
  29. Cheng, J.Z.; Lee, X.Q.; Tang, Y.; Pan, W.J.; Gao, W.C.; Chen, Y.; Wang, B.; Cheng, H.G. Changes in above- and below-ground nitrogen stocks and allocations following the conversion of farmland to forest in rocky desertification regions. Agric. Ecosyst. Environ. 2016, 232, 9–16. [Google Scholar] [CrossRef]
  30. Liu, H.Y.; Liu, F. Recovery Dynamics of Vegetation and Soil Properties in Karst Rocky Desertification Areas in Guizhou, China. In Advances in Environmental Science and Engineering; Parts, 1–6; Iranpour, R., Zhao, J., Wang, A., Yang, F.L., Li, X., Eds.; Trans Tech Publications Ltd.: Zurich, Switzerland, 2012; Volume 518–523, pp. 4532–4544. [Google Scholar]
  31. Sheng, M.Y.; Xiong, K.N.; Wang, L.J.; Li, X.N.; Li, R.; Tian, X.J. Response of soil physical and chemical properties to Rocky desertification succession in South China Karst. Carbonates Evaporites 2018, 33, 15–28. [Google Scholar] [CrossRef]
  32. Vazquez, E.; Benito, M.; Espejo, R.; Teutscherova, N. Response of soil properties and microbial indicators to land use change in an acid soil under Mediterranean conditions. Catena 2020, 189, e104486. [Google Scholar] [CrossRef]
  33. Li, J.; Li, M.; Dong, L.; Wang, K.; Liu, Y.; Hai, X.; Deng, L. Plant productivity and microbial composition drive soil carbon and nitrogen sequestrations following cropland abandonment. Sci. Total Environ. 2020, 744, 1–10. [Google Scholar] [CrossRef]
  34. Liu, Y.P.; Lu, M.X.; Zhang, X.W.; Sun, Q.B.; Liu, R.L.; Lian, B. Shift of the microbial communities from exposed sandstone rocks to forest soils during pedogenesis. Int. Biodeterior. Biodegrad. 2019, 140, 21–28. [Google Scholar] [CrossRef]
  35. Zhang, J.; Wang, P.C.; Tian, H.M.; Xiao, Q.Q.; Jiang, H.K. Pyrosequencing-based assessment of soil microbial community structure and analysis of soil properties with vegetable planted at different years under greenhouse conditions. Soil Tillage Res. 2019, 187, 1–10. [Google Scholar] [CrossRef]
  36. Hu, N.; Li, H.; Tang, Z.; Li, Z.; Tian, J.; Lou, Y.; Hu, X. Community diversity, structure and carbon footprint of nematode food web following reforestation on degraded Karst soil. Sci. Rep. 2016, 6, 28138. [Google Scholar] [CrossRef] [PubMed] [Green Version]
  37. Hui, N.; Sun, N.X.; Du, H.M.; Umair, M.; Kang, H.Z.; Liu, X.X.; Romantschuk, M.; Liu, C.J. Karst rocky desertification does not erode ectomycorrhizal fungal species richness but alters microbial community structure. Plant. Soil 2019, 445, 383–396. [Google Scholar] [CrossRef]
  38. Song, M.; Peng, W.X.; Zeng, F.P.; Du, H.; Peng, Q.; Xu, Q.G.; Chen, L.; Zhang, F. Spatial Patterns and Drivers of Microbial Taxa in a Karst Broadleaf Forest. Front. Microbiol. 2018, 9, 13. [Google Scholar] [CrossRef]
  39. Yan, Y.J.; Dai, Q.H.; Hu, G.; Jiao, Q.; Mei, L.; Fu, W.B. Effects of vegetation type on the microbial characteristics of the fissure soil-plant systems in karst rocky desertification regions of SW China. Sci. Total Environ. 2020, 712, 11. [Google Scholar] [CrossRef]
  40. Zhao, C.; Long, J.; Liao, H.K.; Zheng, C.L.; Li, J.; Liu, L.F.; Zhang, M.J. Dynamics of soil microbial communities following vegetation succession in a karst mountain ecosystem, Southwest China. Sci. Rep. 2019, 9, 10. [Google Scholar] [CrossRef]
  41. Quideau, S.A.; McIntosh, A.C.S.; Norris, C.E.; Lloret, E.; Swallow, M.J.B.; Hannam, K. Extraction and Analysis of Microbial Phospholipid Fatty Acids in Soils. J. Vis. Exp. 2016, 9, e54360. [Google Scholar] [CrossRef] [Green Version]
  42. Ma, Q.; Wu, L.; Wang, J.; Ma, J.; Zheng, N.; Hill, P.W.; Chadwick, D.R.; Jones, D.L. Fertilizer regime changes the competitive uptake of organic nitrogen by wheat and soil microorganisms: An in-situ uptake test using C-13, N-15 labelling, and C-13-PLFA analysis. Soil Biol. Biochem. 2018, 125, 319–327. [Google Scholar] [CrossRef]
  43. Pasayat, M. PLFA Profiling of Microbial Community Structure Influencing Ecosystem Restoration in Chronosequence Iron Mine Overburden Spoil. Int. J. Innov. Eng. Technol. 2017, 8, 81–96. [Google Scholar]
  44. Veum, K.S.; Lorenz, T.; Kremer, R.J. Phospholipid Fatty Acid Profiles of Soils under Variable Handling and Storage Conditions. Agron. J. 2019, 111, 1090–1096. [Google Scholar]
  45. Zhang, J.D. Quantitative Ecology; Science Press: Beijing, China, 2004; pp. 20–23. (In Chinese) [Google Scholar]
  46. Guan, H.; Fan, J. Effects of vegetation restoration on soil quality in fragile karst ecosystems of southwest China. PeerJ 2020, 8, e9456. [Google Scholar] [PubMed]
  47. Ye, C.; Cheng, X.L.; Zhang, Q.F. Recovery approach affects soil quality in the water level fluctuation zone of the Three Gorges Reservoir, China: Implications for revegetation. Environ. Sci. Pollut. Res. 2014, 21, 2018–2031. [Google Scholar]
  48. Askari, M.S.; Holden, N.M. Indices for quantitative evaluation of soil quality under grassland management. Geoderma 2014, 230, 131–142. [Google Scholar] [CrossRef]
  49. Andrews, S.S.; Karlen, D.L.; Cambardella, C.A. The soil management assessment framework: A quantitative soil quality evaluation method. Soil Sci. Soc. Am. J. 2004, 68, 1945–1962. [Google Scholar]
  50. Bastida, F.; Moreno, J.L.; Hernandez, T.; Garcia, C. Microbiological degradation index of soils in a semiarid climate. Soil Biol. Biochem. 2006, 38, 3463–3473. [Google Scholar] [CrossRef]
  51. Pang, D.B.; Cao, J.H.; Dan, X.Q.; Guan, Y.H.; Peng, X.W.; Cui, M.; Wu, X.Q.; Zhou, J.X. Recovery approach affects soil quality in fragile karst ecosystems of southwest China: Implications for vegetation restoration. Ecol. Eng. 2018, 123, 151–160. [Google Scholar] [CrossRef]
  52. Wang, Y.; Dungait, J.A.J.; Xing, K.; Green, S.M.; Hartley, I.; Tu, C.; Quine, T.A.; Tian, J.; Kuzyakov, Y. Persistence of soil microbial function at the rock-soil interface in degraded karst topsoils. Land Degrad. Dev. 2019, 31, 251–265. [Google Scholar]
  53. Jatoi, M.T.; Lan, G.Y.; Wu, Z.X.; Sun, R.; Yang, C.; Tan, Z.H. Comparison of Soil Microbial Composition and Diversity Between Mixed and Monoculture Rubber Plantations in Hainan Province, China. Trop. Conserv. Sci. 2019, 12, 1–9. [Google Scholar]
  54. Ma, L.; Guo, C.; Lü, X.; Yuan, S.; Wang, R. Soil moisture and land use are major determinants of soil microbial community composition and biomass at a regional scale in northeastern China. Biogeosciences 2015, 12, 2585–2596. [Google Scholar]
  55. Waldrop, M.P.; Holloway, J.M.; Smith, D.B.; Goldhaber, M.B.; Drenovsky, R.E.; Scow, K.M.; Dick, R.; Howard, D.; Wylie, B.; Grace, J.B. The interacting roles of climate, soils, and plant production on soil microbial communities at a continental scale. Ecology 2017, 98, 1957–1967. [Google Scholar] [CrossRef] [PubMed] [Green Version]
  56. Zhalnina, K.; Dias, R.; de Quadros, P.D.; Davis-Richardson, A.; Camargo, F.A.O.; Clark, I.M.; McGrath, S.P.; Hirsch, P.R.; Triplett, E.W. Soil pH Determines Microbial Diversity and Composition in the Park Grass Experiment. Microb. Ecol. 2015, 69, 395–406. [Google Scholar] [CrossRef] [PubMed]
  57. Holden, S.R.; Berhe, A.A.; Treseder, K.K. Decreases in soil moisture and organic matter quality suppress microbial decomposition following a boreal forest fire. Soil Biol. Biochem. 2015, 87, 1–9. [Google Scholar] [CrossRef] [Green Version]
  58. Waring, B.G.; Hawkes, C.V. Short-Term Precipitation Exclusion Alters Microbial Responses to Soil Moisture in a Wet Tropical Forest. Microb. Ecol. 2015, 69, 843–854. [Google Scholar] [CrossRef] [PubMed]
  59. Wu, X.; Xu, H.; Tuo, D.F.; Wang, C.; Fu, B.J.; Lv, Y.H.; Liu, G.H. Land use change and stand age regulate soil respiration by influencing soil substrate supply and microbial community. Geoderma 2020, 359, 9. [Google Scholar] [CrossRef]
  60. Ren, C.; Zhao, F.; Shi, Z.; Chen, J.; Han, X.; Yang, G.; Feng, Y.; Ren, G. Differential responses of soil microbial biomass and carbon-degrading enzyme activities to altered precipitation. Soil Biol. Biochem. 2017, 115, 1–10. [Google Scholar] [CrossRef]
  61. Evans, S.E.; Wallenstein, M.D. Climate change alters ecological strategies of soil bacteria. Ecol. Lett. 2014, 17, 155–164. [Google Scholar] [CrossRef]
  62. Yu, S.F.; She, G.H.; Ye, S.M.; Zhou, X.G.; Yao, X.Y.; Li, Y.F. Characteristics of soil microbial biomass and community composition in Pinus yunnanensis var. Tenuifolia secondary forests. J. Sustain. For. 2018, 37, 753–770. [Google Scholar] [CrossRef]
  63. Peng, X.D.; Dai, Q.H.; Ding, G.J.; Li, C.L. Role of underground leakage in soil, water and nutrient loss from a rock-mantled slope in the karst rocky desertification area. J. Hydrol. 2019, 578, 10. [Google Scholar] [CrossRef]
  64. Zhang, L.; Wang, A.; Yang, W.; Xu, Z.; Wu, F.; Tan, B.; Liu, Y.; Chen, L. Soil microbial abundance and community structure vary with altitude and season in the coniferous forests, China. J. Soils Sediments 2016, 17, 2318–2328. [Google Scholar] [CrossRef]
  65. Preusser, S.; Poll, C.; Marhan, S.; Angst, G.; Mueller, C.W.; Bachmann, J.; Kandeler, E. Fungi and bacteria respond differently to changing environmental conditions within a soil profile. Soil Biol. Biochem. 2019, 137, 12. [Google Scholar] [CrossRef]
  66. Yan, N.; Marschner, P.; Cao, W.; Zuo, C.; Qin, W. Influence of salinity and water content on soil microorganisms. Int. Soil Water Conserv. Res. 2015, 3, 316–323. [Google Scholar] [CrossRef] [Green Version]
  67. Preusser, S.; Marhan, S.; Poll, C.; Kandeler, E. Microbial community response to changes in substrate availability and habitat conditions in a reciprocal subsoil transfer experiment. Soil Biol. Biochem. 2017, 105, 138–152. [Google Scholar] [CrossRef]
  68. Drenovsky, R.E.; Vo, D.; Graham, K.J.; Scow, K.M. Soil water content and organic carbon availability are major determinants of soil microbial community composition. Microb. Ecol. 2004, 48, 424–430. [Google Scholar] [CrossRef] [PubMed]
  69. Fan, Z.Z.; Lu, S.Y.; Liu, S.; Guo, H.; Wang, T.; Zhou, J.X.; Peng, X.W. Changes in Plant Rhizosphere Microbial Communities under Different Vegetation Restoration Patterns in Karst and Non-karst Ecosystems. Sci. Rep. 2019, 9, 12. [Google Scholar] [CrossRef] [PubMed]
  70. Huang, J.S.; Hu, B.; Qi, K.B.; Chen, W.J.; Pang, X.Y.; Bao, W.K.; Tian, G.L. Effects of phosphorus addition on soil microbial biomass and community composition in a subalpine spruce plantation. Eur. J. Soil Biol. 2016, 72, 35–41. [Google Scholar] [CrossRef]
  71. Bonner, M.T.L.; Herbohn, J.; Gregorio, N.; Pasa, A.; Avela, M.S.; Solano, C.; Moreno, M.O.M.; Almendras-Ferraren, A.; Wills, J.; Shoo, L.P.; et al. Soil organic carbon recovery in tropical tree plantations may depend on restoration of soil microbial composition and function. Geoderma 2019, 353, 70–80. [Google Scholar] [CrossRef]
  72. Chen, Y.-L.; Ding, J.-Z.; Peng, Y.-F.; Li, F.; Yang, G.-B.; Liu, L.; Qin, S.-Q.; Fang, K.; Yang, Y.-H. Patterns and drivers of soil microbial communities in Tibetan alpine and global terrestrial ecosystems. J. Biogeogr. 2016, 43, 2027–2039. [Google Scholar] [CrossRef]
  73. Fierer, N. Embracing the unknown: Disentangling the complexities of the soil microbiome. Nat. Rev. Microbiol 2017, 15, 579–590. [Google Scholar] [CrossRef]
  74. Du, Y.; Niu, W.; Zhang, Q.; Cui, B.; Gu, X.; Guo, L.; Liang, B. Effects of Nitrogen on Soil Microbial Abundance, Enzyme Activity, and Nitrogen Use Efficiency in Greenhouse Celery under Aerated Irrigation. Soil Sci. Soc. Am. J. 2018, 82, 606–613. [Google Scholar] [CrossRef] [Green Version]
  75. Peng, W.X.; Zhu, Y.F.; Song, M.; Du, H.; Song, T.Q.; Zeng, F.P.; Zhang, F.; Wang, K.L.; Luo, Y.Q.; Lan, X.; et al. The spatial distribution and drivers of soil microbial richness and diversity in a karst broadleaf forest. For. Ecol. Manag. 2019, 449, 8. [Google Scholar] [CrossRef]
  76. Xing, Y.W.; Li, C.Y.; Liu, J.; Wang, Y.; Jing, L.J.; Wang, C.R.; Xue, Y.L.; Dang, T.H. Effects of long-term fertilization on soil microbial abundance in farmland of the Loess Plateau, China. J. Appl. Ecol. 2019, 30, 1351–1358. [Google Scholar]
  77. Bickel, S.; Or, D. Climate and soil properties affect diversity and abundance of soil microbial life across scales--from grains to biomes. Egu Gen. Assem. Conf. Abstr. 2018, 20, 8486. [Google Scholar]
  78. Orwin, K.H.; Dickie, I.A.; Holdaway, R.; Wood, J.R. A comparison of the ability of PLFA and 16S rRNA gene metabarcoding to resolve soil community change and predict ecosystem functions. Soil Biol. Biochem. 2018, 117, 27–35. [Google Scholar] [CrossRef]
  79. Blagodatskaya, E.V.; Blagodatsky, S.A.; Anderson, T.H.; Kuzyakov, Y. Priming effects in Chernozem induced by glucose and N in relation to microbial growth strategies. Appl. Soil Ecol. 2007, 37, 95–105. [Google Scholar] [CrossRef]
  80. Drenovsky, R.E.; Steenwerth, K.L.; Jackson, L.E.; Scow, K.M. Land use and climatic factors structure regional patterns in soil microbial communities. Glob. Ecol. Biogeogr. 2010, 19, 27–39. [Google Scholar] [CrossRef] [Green Version]
  81. Fierer, N.; Schimel, J.P.; Holden, P.A. Variations in microbial community composition through two soil depth profiles. Soil Biol. Biochem. 2003, 35, 167–176. [Google Scholar] [CrossRef]
  82. De Vries, F.T.; Shade, A. Controls on soil microbial community stability under climate change. Front. Microbiol 2013, 4, 265. [Google Scholar] [CrossRef] [Green Version]
  83. Ananyeva, N.D.; Castaldi, S.; Stolnikova, E.V.; Kudeyarov, V.N.; Valentini, R. Fungi-to-bacteria ratio in soils of European Russia. Arch. Agron. Soil Sci. 2015, 61, 427–446. [Google Scholar] [CrossRef]
  84. Jing, Y.L.; Wang, Y.; Liu, S.R.; Zhang, X.D.; Wang, Q.K.; Liu, K.; Yin, Y.; Deng, J.F. Interactive effects of soil warming, throughfall reduction, and root exclusion on soil microbial community and residues in warm-temperate oak forests. Appl. Soil Ecol. 2019, 142, 52–58. [Google Scholar] [CrossRef]
  85. Li, Q.; Bai, H.H.; Liang, W.J.; Xia, J.Y.; Wan, S.Q.; van der Putten, W.H. Nitrogen Addition and Warming Independently Influence the Belowground Micro-Food Web in a Temperate Steppe. PLoS ONE 2013, 8, e60441. [Google Scholar] [CrossRef] [PubMed] [Green Version]
  86. Xiong, Q.L.; Pan, K.W.; Zhang, L.; Wang, Y.J.; Li, W.; He, X.J.; Luo, H.Y. Warming and nitrogen deposition are interactive in shaping surface soil microbial communities near the alpine timberline zone on the eastern Qinghai-Tibet Plateau, southwestern China. Appl. Soil Ecol. 2016, 101, 72–83. [Google Scholar] [CrossRef]
  87. Glassman, S.I.; Weihe, C.; Li, J.; Albright, M.B.N.; Looby, C.I.; Martiny, A.C.; Treseder, K.K.; Allison, S.D.; Martiny, J.B.H. Decomposition responses to climate depend on microbial community composition. Proc. Natl. Acad. Sci. USA 2018, 115, 11994–11999. [Google Scholar] [CrossRef] [PubMed] [Green Version]
  88. Peay, K.G.; von Sperber, C.; Cardarelli, E.; Toju, H.; Francis, C.A.; Chadwick, O.A.; Vitousek, P.M. Convergence and contrast in the community structure of Bacteria, Fungi and Archaea along a tropical elevation-climate gradient. FEMS Microbiol. Ecol. 2017, 93. [Google Scholar] [CrossRef] [Green Version]
  89. Carnovale, D.; Bissett, A.; Thrall, P.H.; Baker, G. Plant genus (Acacia and Eucalyptus) alters soil microbial community structure and relative abundance within revegetated shelterbelts. Appl. Soil Ecol. 2019, 133, 1–11. [Google Scholar] [CrossRef]
  90. Grosso, F.; Baath, E.; De Nicola, F. Bacterial and fungal growth on different plant litter in Mediterranean soils: Effects of C/N ratio and soil pH. Appl. Soil Ecol. 2016, 108, 1–7. [Google Scholar] [CrossRef]
  91. Six, J.; Frey, S.D.; Thiet, R.K.; Batten, K.M. Bacterial and fungal contributions to carbon sequestration in agroecosystems. Soil Sci. Soc. Am. J. 2006, 70, 555–569. [Google Scholar] [CrossRef]
  92. Zhou, Z.; Wang, C.; Jiang, L.; Luo, Y. Trends in soil microbial communities during secondary succession. Soil Biol. Biochem. 2017, 115, 92–99. [Google Scholar] [CrossRef]
  93. Philippot, L.; Spor, A.; Henault, C.; Bru, D.; Bizouard, F.; Jones, C.M.; Sarr, A.; Maron, P.A. Loss in microbial diversity affects nitrogen cycling in soil. ISME J. 2013, 7, 1609–1619. [Google Scholar] [CrossRef]
  94. Cleveland, C.C.; Liptzin, D. C: N: P stoichiometry in soil: Is there a “Redfield ratio” for the microbial biomass? Biogeochemistry 2007, 85, 235–252. [Google Scholar] [CrossRef]
  95. Bolscher, T.; Agren, G.I.; Herrmann, A.M. Land-use alters the temperature response of microbial carbon-use efficiency in soils—A consumption-based approach. Soil Biol. Biochem. 2020, 140, 107639. [Google Scholar] [CrossRef]
  96. Kieft, T.L.; Wilch, E.; Oconnor, K.; Ringelberg, D.B.; White, D.C. Survival and phospholipid fatty acid profiles of surface and subsurface bacteria in natural sediment microcosms. Appl. Environ. Microbiol. 1997, 63, 1531–1542. [Google Scholar] [CrossRef] [PubMed] [Green Version]
  97. Allison, V.J.; Miller, R.M.; Jastrow, J.D.; Matamala, R.; Zak, D.R. Changes in soil microbial community structure in a tallgrass prairie chronosequence. Soil Sci. Soc. Am. J. 2005, 69, 1412–1421. [Google Scholar] [CrossRef] [Green Version]
  98. Bossio, D.A.; Scow, K.M. Impacts of carbon and flooding on soil microbial communities: Phospholipid fatty acid profiles and substrate utilization patterns. Microb. Ecol. 1998, 35, 265–278. [Google Scholar] [CrossRef] [PubMed]
  99. Liu, X.; Zhang, B.; Zhao, W.; Wang, L.; Xie, D.; Huo, W.; Wu, Y.; Zhang, J. Comparative effects of sulfuric and nitric acid rain on litter decomposition and soil microbial community in subtropical plantation of Yangtze River Delta region. Sci. Total Environ. 2017, 601, 669–678. [Google Scholar] [CrossRef]
  100. Romaniuk, R.; Costantini, A.; Giuffre, L.; Nannipieri, P. Catabolic response and phospholipid fatty acid profiles as microbial tools to assess soil functioning. Soil Use Manag. 2016, 32, 603–612. [Google Scholar] [CrossRef]
  101. Sun, D.; Bi, Q.; Li, K.; Dai, P.; Yu, Y.; Zhou, W.; Lv, T.; Liu, X.; Zhu, J.; Zhang, Q.; et al. Significance of temperature and water availability for soil phosphorus transformation and microbial community composition as affected by fertilizer sources. Biol. Fertil. Soils 2018, 54, 229–241. [Google Scholar] [CrossRef]
  102. Wu, L.; Wu, H.; Chen, J.; Wang, J.; Lin, W. Microbial community structure and its temporal changes in Rehmannia glutinosa rhizospheric soils monocultured for different years. Eur. J. Soil Biol. 2016, 72, 1–5. [Google Scholar] [CrossRef]
  103. Carrasco, L.; Gattinger, A.; Fliessbach, A.; Roldan, A.; Schloter, M.; Caravaca, F. Estimation by PLFA of Microbial Community Structure Associated with the Rhizosphere of Lygeum spartum and Piptatherum miliaceum Growing in Semiarid Mine Tailings. Microb. Ecol. 2010, 60, 265–271. [Google Scholar] [CrossRef]
  104. Romaniuk, R.; Giuffre, L.; Costantini, A.; Nannipieri, P. Assessment of soil microbial diversity measurements as indicators of soil functioning in organic and conventional horticulture systems. Ecol. Indic. 2011, 11, 1345–1353. [Google Scholar] [CrossRef]
Figure 1. Study sites locations in Guizhou Province, China. Note: 1: Catalpa ovata; 2: Cryptomeria japonica var. sinensis; 4: Cupressus funebris; 7: Toona sinensis; 17: Liquidambar formosana; 20 Pinus massoniana; 1, 2, 4, 7, 17 and 20 are ecological forest. 5: Secondary forest; 13: Natural grassland; 19: Natural shrub tussock. 3, 6, 8, 16 and 21 are abandoned grassland; 9: Vitis vinifera; 10: Prunus salicina var.; 11: Hylocereus undatus; 12: Zanthoxylum bungeanum; 14: Prunus salicina var.; 15: Artificial grassland; 18: Eucalyptus robusta. 9, 10, 11, 12, 14, 15 and 18 are economic plantation. Sites 3, 4, 5, 6, 10, 11, 12, 13, 14 and 19 were on shallow soil depth, the others were on deep soil depth.
Agronomy 11 00173 g001
Figure 2. Soil microbial biomass and community structure indices for the two soil depth community categories. ** indicates significant difference at p < 0.01 level. Note—G+: Gram–positive bacterial PLFA; G−: Gram–negative bacterial PLFA; F: fungal PLFA; B: total bacterial PLFA, the sum of general bacterial PLFA, G+ and G−; Cy/Pr: ratio of cyclopropyl/precursors as calculated by (cy17:0 + cy19:0)/(16:1ω7 + 18:1ω7); S/M: ratio of saturated PLFA to monounsaturated PLFA. For the same parameter, histograms show the mean with SD bar, n = 30 in soil depth <100 cm community and n = 33 in soil depth ≥100 cm community ** indicates significant difference at p < 0.01 level. The same definitions apply below.
Agronomy 11 00173 g002
Figure 3. Pearson’s correlation analysis between environment factors and microbial PLFA indices in different soil depth communities. ** indicates significant difference at p < 0.01 level and * indicates significant difference at p < 0.05 level.
Agronomy 11 00173 g003
Figure 4. The variation partitioning analysis of microbial PLFA indices. The results of variation partitioning analysis were presented in a Venn diagram for 6 kinds of microbial PLFA content (general bacteria, G+, G−, fungi, eukaryote, actinomycete) (a), G+/G− and F/B (b), Cy/Pr and S/M (c), microbial S and H (d) for both soil depth communities, (e)–(h) for shallow soil depth community and (i)–(l) for deep soil depth community. Adjusted R2 values show the fraction of variation, as well as the shared contribution of each of the variables.
Agronomy 11 00173 g004
Table 1. Main phospholipid fatty acids used as biomarkers.
BiomarkersPLFAs in This Study
General bacterial11:0; 12:0; 13:0; 14:0; 15:0; 16:0; 17:0; 18:0; 20:0;
16:0 DMA; 17:0 DMA; 18:0 DMA; 18:1 ω7c DMA; 16:1ω7c DMA; 16:1ω9c DMA; 16:2 DMA; 18:2 DMA; cy19:0 9, 10 DMA
Gram–negative bacteria12:1ω8c; 13:1ω3c; 15:1ω7c; 15:1ω6c; 15:0 DMA; 16:0 N alcohol; 2OH 16:0; 16:1ω9c; 16:1ω7c; 16:1ω5c; 17:1ω8c; 17:1ω4c; 17:0 cyclo ω7c; 18:1ω7c; 18:1ω6c; 18:1ω5c; 19:0 cyclo ω7c; 19:1ω8c; 20:1ω8c; 20:1ω9c; 21:1ω3c; 21:1ω5c; 21:1ω8c; 21:1ω9c; 21:1ω6c; 22:1ω3c; 22:1ω8c; 24:1ω7c
Gram–positive bacteriaa11:0; a13:0; a14:0; a15:0; a16:0; a17:0; a19:0;
i13:0; i14:0; i15:0; i16:0; i17:0; i18:0; i19:0; i20:0; i22:0;
15:1 iso ω9c; 15:1 iso ω6c
Actinomycetes10Me 16:0; 10Me 17:0; 10Me18:0; 10Me 17:1ω7c; 10Me18:1ω7c
Fungi18:2ω6
Eucaryote15:4ω3c; 18:3ω6c; 19:3ω6c; 19:3ω3c; 19:4ω6c; 20:3ω6c; 20:4ω6c; 20:5ω3c; 21:3ω6c; 22:2ω6c; 22:5ω6c; 22:6ω3c; 22:5ω3c; 23:1ω4c; 24:3ω3c
Note: cyclo, cyclopropyl; a, anteiso; i, iso; Me, Methyl–branched; 0, saturated; :1, 1 unsaturated fatty acid, and so on; OH, hydroxyl; DMA, dimethylacetamide.
Table 2. Characteristics of plant–soil physical and chemical properties of the two soil depths.
Soil IndicesSoil DepthSignificancePlant IndicesSoil DepthSignificance
≥100 cm<100 cm≥100 cm<100 cm
SOC (g/kg)20.78 ± 1.5638.49 ± 2.81**S9.43 ± 0.677.69 ± 0.59
TN (g/kg)2.34 ± 0.113.83 ± 0.22**H1.97 ± 0.141.86 ± 0.16
TP (g/kg)0.68 ± 0.061.10 ± 0.11**D1.09 ± 0.081.12 ± 0.10
C:N8.67 ± 0.269.77 ± 0.26 J1.21 ± 0.101.23 ± 0.12
C:P33.65 ± 2.4142.70 ± 4.92**Woody biomass (kg/m2)23.89 ± 6.783.31 ± 0.73**
N:P3.88 ± 0.224.16 ± 0.40**Herb biomass (kg/m2)0.13 ± 0.020.14 ± 0.03
Ts (°C)23.60 ± 0.4924.81 ± 0.55 Litter (kg/m2)0.32 ± 0.060.20 ± 0.04
pH6.07 ± 0.187.45 ± 0.12**Leaf C (g/kg)465.93 ± 5.77440.01 ± 7.61
SWC (%)30.68 ± 1.1834.66 ± 1.94*Leaf N (g/kg)15.97 ± 1.4017.67 ± 1.43
BD (g/cm3)1.27 ± 0.021.16 ± 0.03 Leaf P (g/kg)1.76 ± 0.131.70 ± 0.14
NH4+ (mg/kg)12.90 ± 0.7722.02 ± 2.63**Leaf C:N34.87 ± 2.1932.43 ± 3.40**
NO3 (mg/kg)4.17 ± 1.135.95 ± 1.06 Leaf C:P335.47 ± 33.60337.32 ± 36.83
AP (mg/kg)6.01 ± 1.0912.61 ± 2.87**Leaf N:P9.95 ± 0.7011.59 ± 1.16
AK (mg/kg)122.64 ± 10.90203.92 ± 9.38 Litter C (g/kg)422.58 ± 9.56414.17 ± 6.70*
TK (g/kg)16.67 ± 1.1616.25 ± 1.81 Litter N (g/kg)10.68 ± 0.8111.76 ± 0.89
Ca (g/kg)5.44 ± 1.1226.13 ± 4.42**Litter P (g/kg)0.91 ± 0.081.17 ± 0.20
Mg (g/kg)6.78 ± 0.6810.90 ± 1.28 Litter C:N44.67 ± 2.7939.98 ± 2.47
Sand (%)39.29 ± 1.4453.25 ± 1.39 Litter C:P582.08 ± 58.27596.51 ± 86.68
Silt (%)59.33 ± 1.3845.33 ± 1.37 Litter N:P12.54 ± 0.5313.92 ± 1.30**
Clay (%)1.38 ± 0.171.45 ± 0.15 Litter K (g/kg)3.55 ± 0.323.15 ± 0.26*
Litter Ca (g/kg)15.89 ± 1.1321.97 ± 1.91**
Litter Mg (g/kg)2.78 ± 0.234.35 ± 0.77**
Leaf K (g/kg)10.66 ± 0.8413.91 ± 1.40
Leaf Ca (g/kg)12.02 ± 0.8921.46 ± 1.98**
Leaf Mg (g/kg)3.12 ± 0.173.96 ± 0.35**
Note: (1) soil depth ≥ 100 cm, n = 33; soil depth < 100 cm, n = 30; (2) C, N, P, K, Ca, Mg represent carbon, nitrogen, phosphorus, potassium, calcium and magnesium. T indicates total element, A indicates available element. Ts indicates soil temperature at 5 cm; SWC, soil water content; BD, bulk density; NH4+,ammonium nitrogen; NO3, nitrate nitrogen; sand (2~0.02 mm), silt (0.02~0.002 mm), clay (<0.002 mm); (3) S, H, D, J are abundance indices, Shannon–Winner index, Simpson index, Pielou index, respectively; (4) * indicates significant difference at p = 0.05 level by independent sample t-test; ** indicates significant difference at p = 0.01 level; red indicates value is significantly higher in soil depth ≥100 cm community than in soil depth <100 cm community, and the opposite is blue.
Publisher’s Note: MDPI stays neutral with regard to jurisdictional claims in published maps and institutional affiliations.

