Adaptation of Winter Barley Cultivars to Inversion and Non-Inversion Tillage for Yield and Rhynchosporium Symptoms


1
The James Hutton Institute, Invergowrie, Dundee DD25DA, UK
2
Biomathematics and Statistics Scotland, Invergowrie, Dundee DD25DA, UK
*
Author to whom correspondence should be addressed.
Agronomy 2021, 11(1), 30; https://0-doi-org.brum.beds.ac.uk/10.3390/agronomy11010030
Submission received: 18 November 2020
/
Revised: 10 December 2020
/
Accepted: 22 December 2020
/
Published: 25 December 2020
(This article belongs to the Section Innovative Cropping Systems)
Abstract
:Modern cereal cultivars are highly adapted to, and normally bred and trialled under, high input, high soil disturbance conditions. On-farm conditions are often suboptimal for high yield and frequently use minimal soil tillage, sometimes no-tillage, and therefore, cultivars may be differentially adapted to such conditions. We report a series of trials across 10 years comparing multiple cultivars within years and smaller numbers across years to identify stable cultivars showing preferential adaptation to different levels of soil tillage. Cultivars responded differentially to inversion and non-inversion tillage but were not affected by the level of cultivation within each of these tillage types. Yield declined over time but much more so in the non-inversion tillage treatment. Rhynchosporium symptoms were also increasingly suppressed in the non-inversion tillage type. Several cultivars were identified that showed strong adaptation to tillage type, and some of these were consistent across several trial years. These cultivars can be used to identify traits and genotypes associated with tillage adaptation to target breeding for on-farm conditions.
1. Introduction
There has been a trend towards reduced soil tillage in many arable systems and in England it was estimated that 46% of farms use some form of reduced tillage [1]. Importantly this trend towards reduced tillage results in varying degrees of disturbance to the upper soil horizons (5–15 cm), but lower horizons remain undisturbed. Reduced tillage takes many forms: the whole field may be cultivated or just some of it in strips (strip tillage) and even less disturbance is caused by direct drilling using tines, or least of all disturbance with discs. The soil physical, chemical and biological composition will increasingly differ from the ploughed and harrowed inversion tillage to the almost undisturbed along such a gradient of reducing tillage. However, most cereal breeding and cultivar testing programmes at least in temperate regions are carried out at the more disturbed extreme of this gradient.
Cereal breeding programmes carried out under inversion tillage and high input agronomy have successfully selected new cultivars with ever increasing yield potential. On farm, this cultivar performance can be realised in practice when similar agronomic conditions are used. The UK’s Agriculture and Horticulture Development Board (AHDB) Recommended List project carries out independent variety assessments mainly under similar inversion tillage with high agronomic inputs. ”Untreated” yield is reported also for cereals where no fungicides are used but otherwise the agronomy is the same.
There is some evidence that for specialised systems such as organic farms the adaptive traits may be lost during the conventional breeding selection process. Many elite cultivars selected by mainstream conventional breeders deliver higher yields under organic conditions than traditional organic cultivars, but there is evidence that the yield rankings of cultivars change according to the system [2]. The argument applies also to selection for non-inversion systems where it has been demonstrated that both elite and older cultivars of spring barley change yield rankings compared with the inversion tillage under which they were bred [3].
We know that genetic traits can be identified for tillage adaptation as quantitative trait loci in a population of elite cereal genotypes were found to be different in non-inversion tillage compared to conventional tillage for aspects of plant nutrition [4]. This suggests that different sets of traits are appropriate for the varying tillage conditions. However, whilst some cultivars gain a reputation as being adapted to particular on-farm agronomic conditions, these are seldom validated in controlled trials.
Tillage can have effects on disease in cereal crops, often associated with inoculum reservoirs in the enhanced crop debris left on or near the surface when inversion tillage is not practiced. A classic example is the enhanced risk factor when cereal crops follow maize where there is an inoculum build-up of Fusarium species, especially F. graminearum [5]. Therefore, in minimum tillage where more crop debris is left around the stem base or emerging seedlings, saprophytic growth of the fungal pathogen can produce enhanced levels of inoculum able to infect the crop. Another example is eyespot caused by Oculimacula yallundae on wheat which is greater on minimum tillage compared with ploughed [6,7,8]. However, in continuous minimum tillage infection this may decline probably due to development of balanced microbial populations attenuating the eyespot inoculum [8,9]. Another splash-dispersed pathogen able to sporulate as a saprophyte on crop debris and infect barley is Rhynchosporium commune, causal agent of ”scald” or ”rhynchosporium”, which can be more severe if it follows a previous barley crop, but there is no published evidence that it is affected by tillage method per se [10]. Nevertheless, conservation tillage farmers normally avoid two successive barley crops to avoid enhanced rhynchosporium problems (unpublished data and Doug Christie, Durie Farms, personal communication).
In spring barley, we were able to identify some cultivars that were consistently adapted to either inversion or non-inversion tillage across three or four contrasting seasons [3]. Traits associated with adaptation were not defined, but one cultivar showing non-inversion tillage adaptation, KWS Sassy, for example, is characterised by extensive rooting structure and was observed to perform better under reduced tillage in years with extreme weather conditions (drought and flooding) than under conventional plough or by comparison to other varieties where a greater yield penalty was evident (George, Hawes pers comm). A mutant of Optic with no root hairs showed non-inversion tillage adaptation, whilst the parental Optic line and other mutants did not [3]. Winter barley cultivars are like spring barley, another largely self-pollinated inbreeding crop, but exposed to a greater range of environmental stress, including disease, over a longer period, so we carried out a series of trials using different ranges of cultivars across several seasons to determine whether any cultivars showed consistent tillage adaptation. Furthermore, these trials spanned the conversion period from plough to non-inversion tillage over 10 years to identify how maturation of the soil in this process affected both yield and disease outcomes. For this work we used two sites or research platforms, ‘Mid Pilmore’ where tillage was the main factor, and the ‘Centre for Sustainable Cropping’ (CSC) where tillage was one of several cropping system factors being investigated.
The aim of this study was to (a) determine whether there were yield ranking changes between inversion and non-inversion tillage in winter barley, (b) whether this is affected by soil tillage maturity, and (c) how disease is affected by soil tillage status and any interaction with cultivar. We also compared four of the cultivars with their performance across four years in both the Mid Pilmore platform and the nearby CSC farming systems platform that contrasts inversion and non-inversion tillage-based management practices to assess the relative importance of tillage method within systems comparisons.
2. Materials and Methods
2.1. Trials and Cultivars
Trials were grown in the Mid Pilmore tillage platform, Mylnefield Farm at the James Hutton Institute near Dundee, Scotland (56°27′17.6″ N 3°04′55.3″ W) in every year from autumn 2003 until summer 2014 (11 growing seasons), and a core set of four cultivars was grown in each year except 2010, namely, Fanfare, Sumo, Pipkin and Pastoral. Yield data from these four cultivars together with all their 2-, 3- and 4-component mixtures at two nitrogen rates for the 2004–2008 seasons were reported previously, focussing on mixture efficacy [11]. Here, we used only the standard rate nitrogen (120 kg/ha) data from the monocultures in these trial years and extended the comparison by a further five seasons.
In the 2008 season, 52 additional cultivars were added to the core set. In 2009, 15 of the additional 52 cultivars and the core set were trialled again with the addition of Retriever. In 2011, the 2009 set was supplemented with 23 cultivars not previously trialled. In 2012, this supplemented set was reduced from 23 to 12 making a total of 35 cultivars. In both 2013 and 2014, the trials were also a subset of the 2011 trial, enabling a comparison of 18 cultivars from 2011 to 2014. Thus, a few cultivars are compared across many years, many cultivars within single trial years, and particular subsets of interest from the cultivars could be compared for up to 4 years (Table 1).
2.2. Trial Design
Five tillage treatments representing different levels of soil disturbance were established in autumn 2003: (T1) zero tillage and (T2) minimum or shallow non-inversion tillage to 7 cm depth were the non-inversion treatments. The inversion or ploughed treatments, followed by power harrowing, consisted of (T3) conventional plough to 20 cm depth, (T4) plough to 20 cm followed by compaction, and (T5) deep plough to 40 cm depth (full details in [11]). These treatments were designed to provide different physical constraints to root growth and should affect water and nutrient availability. These treatments were randomised within each of three replicates, each block measuring 33 × 33 m. Plots measured 1.55 m wide × 6.0 m long, reduced to 4.8 m harvested length by plot definition in all years except 2008, and were sown at a sowing rate of 360 seed/m2 with an eight-row Hege plot drill with five plots per bed. In 2008, to accommodate more cultivars, plots measured 1.55 × 2.0 m long. NPK 0-20-30 fertiliser was applied at a rate of 350 kg/ha at sowing, and NPK 30-0-0+19SO3 was applied as two top dressings in March and April at 170 and 230 kg/ha, respectively, with small deviations from these fertiliser formulations—rate combinations in individual years. Standard pre- and post-emergence herbicide treatments were applied, and all seed were treated but no fungicide treatments were used post-emergence. Straw was removed from all plots following harvest.
2.3. Seasonal Weather Data
Approximately 580 m to the east of the centre of the trial site a long-term weather station was situated providing local weather data spanning all 12 seasons. Mean monthly precipitation, days with >5.0 mm precipitation (rain), air temperature and total sun hours are presented in Supplementary Figures S1–S4 to aid interpretation of results and notable high and low values highlighted with arrows for the periods when these might be expected to affect spore dispersal or symptom development on the crop. These are summarised in Table 2 to enable comparisons of notable high and low values between years.
2.4. Assessments
Disease that occurred above trace levels was scored on a 1–9 whole plant severity scale [13] at approximately two-weekly intervals after the first observation. Scores were converted to percentage infection values on the same scale each year, and the area under the disease progress curve (%AUDPC) was calculated. Plots were harvested when ripe using a Wintersteiger plot combine, and the grain was dried to constant moisture and weighed.
2.5. Statistical Analysis
The yield and disease levels were analysed using ANOVA, first for each year separately and then for subsets of cultivars in a multiyear ANOVA. For a single year, a split-plot ANOVA was used, with treatment as the main plot effect and cultivar as the subplot effect. Year was also treated as a fixed effect in the multiyear analysis. The treatment term in each ANOVA was partitioned into two components or ”tillage types”, separating the comparison of the average of the inversion treatments with the average of the non-inversion treatments from comparisons within the inversion and non-inversion tillage types. The rankings of the cultivars based on the means of the inversion and non-inversion treatments were calculated, and also the change in rankings between these. A functional regression was carried out to model the relationship between yield under inversion and non-inversion tillage (taking into account that both yields are subject to error variation) and to identify cultivars that were particularly distinct from the fitted regression line.
2.6. Exploring Cultivar Ranking Changes
A simulation approach was used to explore how much cultivars can change in their rankings by chance, as developed for spring barley analysis [3]. A split-plot ANOVA of the yield data was conducted, with the treatment model cultivar × treatment (cultivar-treatment interaction), and the residuals were stored. Then, a second ANOVA, with treatment model cultivar + treatment (i.e., no interaction) was fitted. This gave fitted values that mimic the observed data in their structure and blocking and have the same means for the different levels of cultivar and tillage treatment, but no cultivar × treatment interaction; hence, any changes in cultivar rank within these treatments are assumed to be due to chance.
For each year, 200 simulated variables were constructed by forming 200 random permutations of the stored residuals for that year and adding these, in turn, to the fitted values from the model with no interaction for that year to give traits with a similar error variation to the observed data. The sets of simulated variables from each year were stacked to give 200 simulated variables: the simulated yields for all the years. Each simulated variable was analysed using ANOVA for all the years together, and means for the inversion and non-inversion tillage types were extracted from the table of cultivar × treatment means. Then, the difference in ranks between the inversion and non-inversion cultivar yields were calculated for each of the 200 simulated variables, giving a distribution of the change in ranks that could occur by chance in data of a similar structure to the observed set.
All statistical analyses were carried out using Genstat for Windows 20th edition [14].
2.7. Comparison with Data from the Centre for Sustainable Cropping, Balruddery
In 2011, the first rotation of a six-field large scale arable platform experiment was started at the CSC at Balruddery Farm, part of the James Hutton Institute and is located 4 km north-west of Mid Pilmore and approximately 90 m higher but with similar sandy-loam soil. This comprised six crop types grown under two different management practices, implemented at a half-field scale (ca. 3 hectares for each of the 12 treatment/crop combinations) in a rotation where all crops are grown in all years. The management treatments were a ”conventional” plough-based high-input system in one field half compared to a minimum-tillage system combining a number of other best-practice agronomic options as part of an integrated management treatment in the other half [15,16]. Data from a larger scale inversion and non-inversion-based system for the winter barley crops could, therefore, be compared with the Mid Pilmore plot-scale data. Full system details and summaries of the outcomes from the first full rotation at the CSC can be found at http://cscplatform.hutton.ac.uk and Hawes et al. [15,16]. In most years, the winter barley crop comprised four different cultivars—Saffron, Sequel, Cassata and Retriever— together with their equal proportion mixture. In 2011, Cassata was not sown, but apart from this, for the years 2011–2014, yield data from the half fields under inversion and non-inversion tillage management systems were available for comparison with the same cultivars from the same seed grown in the Mid Pilmore platform described above.
2.8. Analysis
Plots in Mid Pilmore were sown, treatments applied and harvested according to the same protocols in all years except 2006 and disease established every year and was assessed by the same person. The only disease that was recorded above trace levels was rhynchosporium or scald, causal agent Rhynchosporium commune. After the %AUDPC was calculated for each plot, the values were transformed using a square root transformation to normalise the distribution of the ANOVA residuals in each trial. In 2006, sowing of the inversion tillage treatments (plough, conventional and compaction) was delayed due to very wet conditions which will have affected crop development compared with the non-inversion treatments (minimum and zero). Therefore, for this year, disease epidemiology can be compared within the tillage groups, but comparisons between the groups must be qualified.
To compare yield differences within and between the different trials, cultivars are ranked by the mean over the tillage treatments. It became apparent in earlier work on spring barley [3] and throughout this work that significant treatment effects are predominantly due to the difference between inversion types. For some early years, there were statistically significant differences within the inversion types, with 0.001 < p < 0.05, usually associated with the zero tillage having lower yields than the minimum tillage, but from 2006 onwards, there was no significant interaction between differences within inversion type and cultivar.
Comparisons are, therefore, made by sorting cultivars in ascending order of the difference in yield ranking for inversion and non-inversion tillage. The inversion tillage mean was calculated from the mean of the plough, conventional and compaction inversion treatments, and the minimum and zero tillage mean was used for the non-inversion treatment. The rank difference inversion minus non-inversion gives negative values where non-inversion yield ranks higher, i.e., inversion adapted, and positive where inversion tillage ranks higher, i.e., non-inversion adapted.
3. Results
3.1. Core Set Cultivars 2004–2014
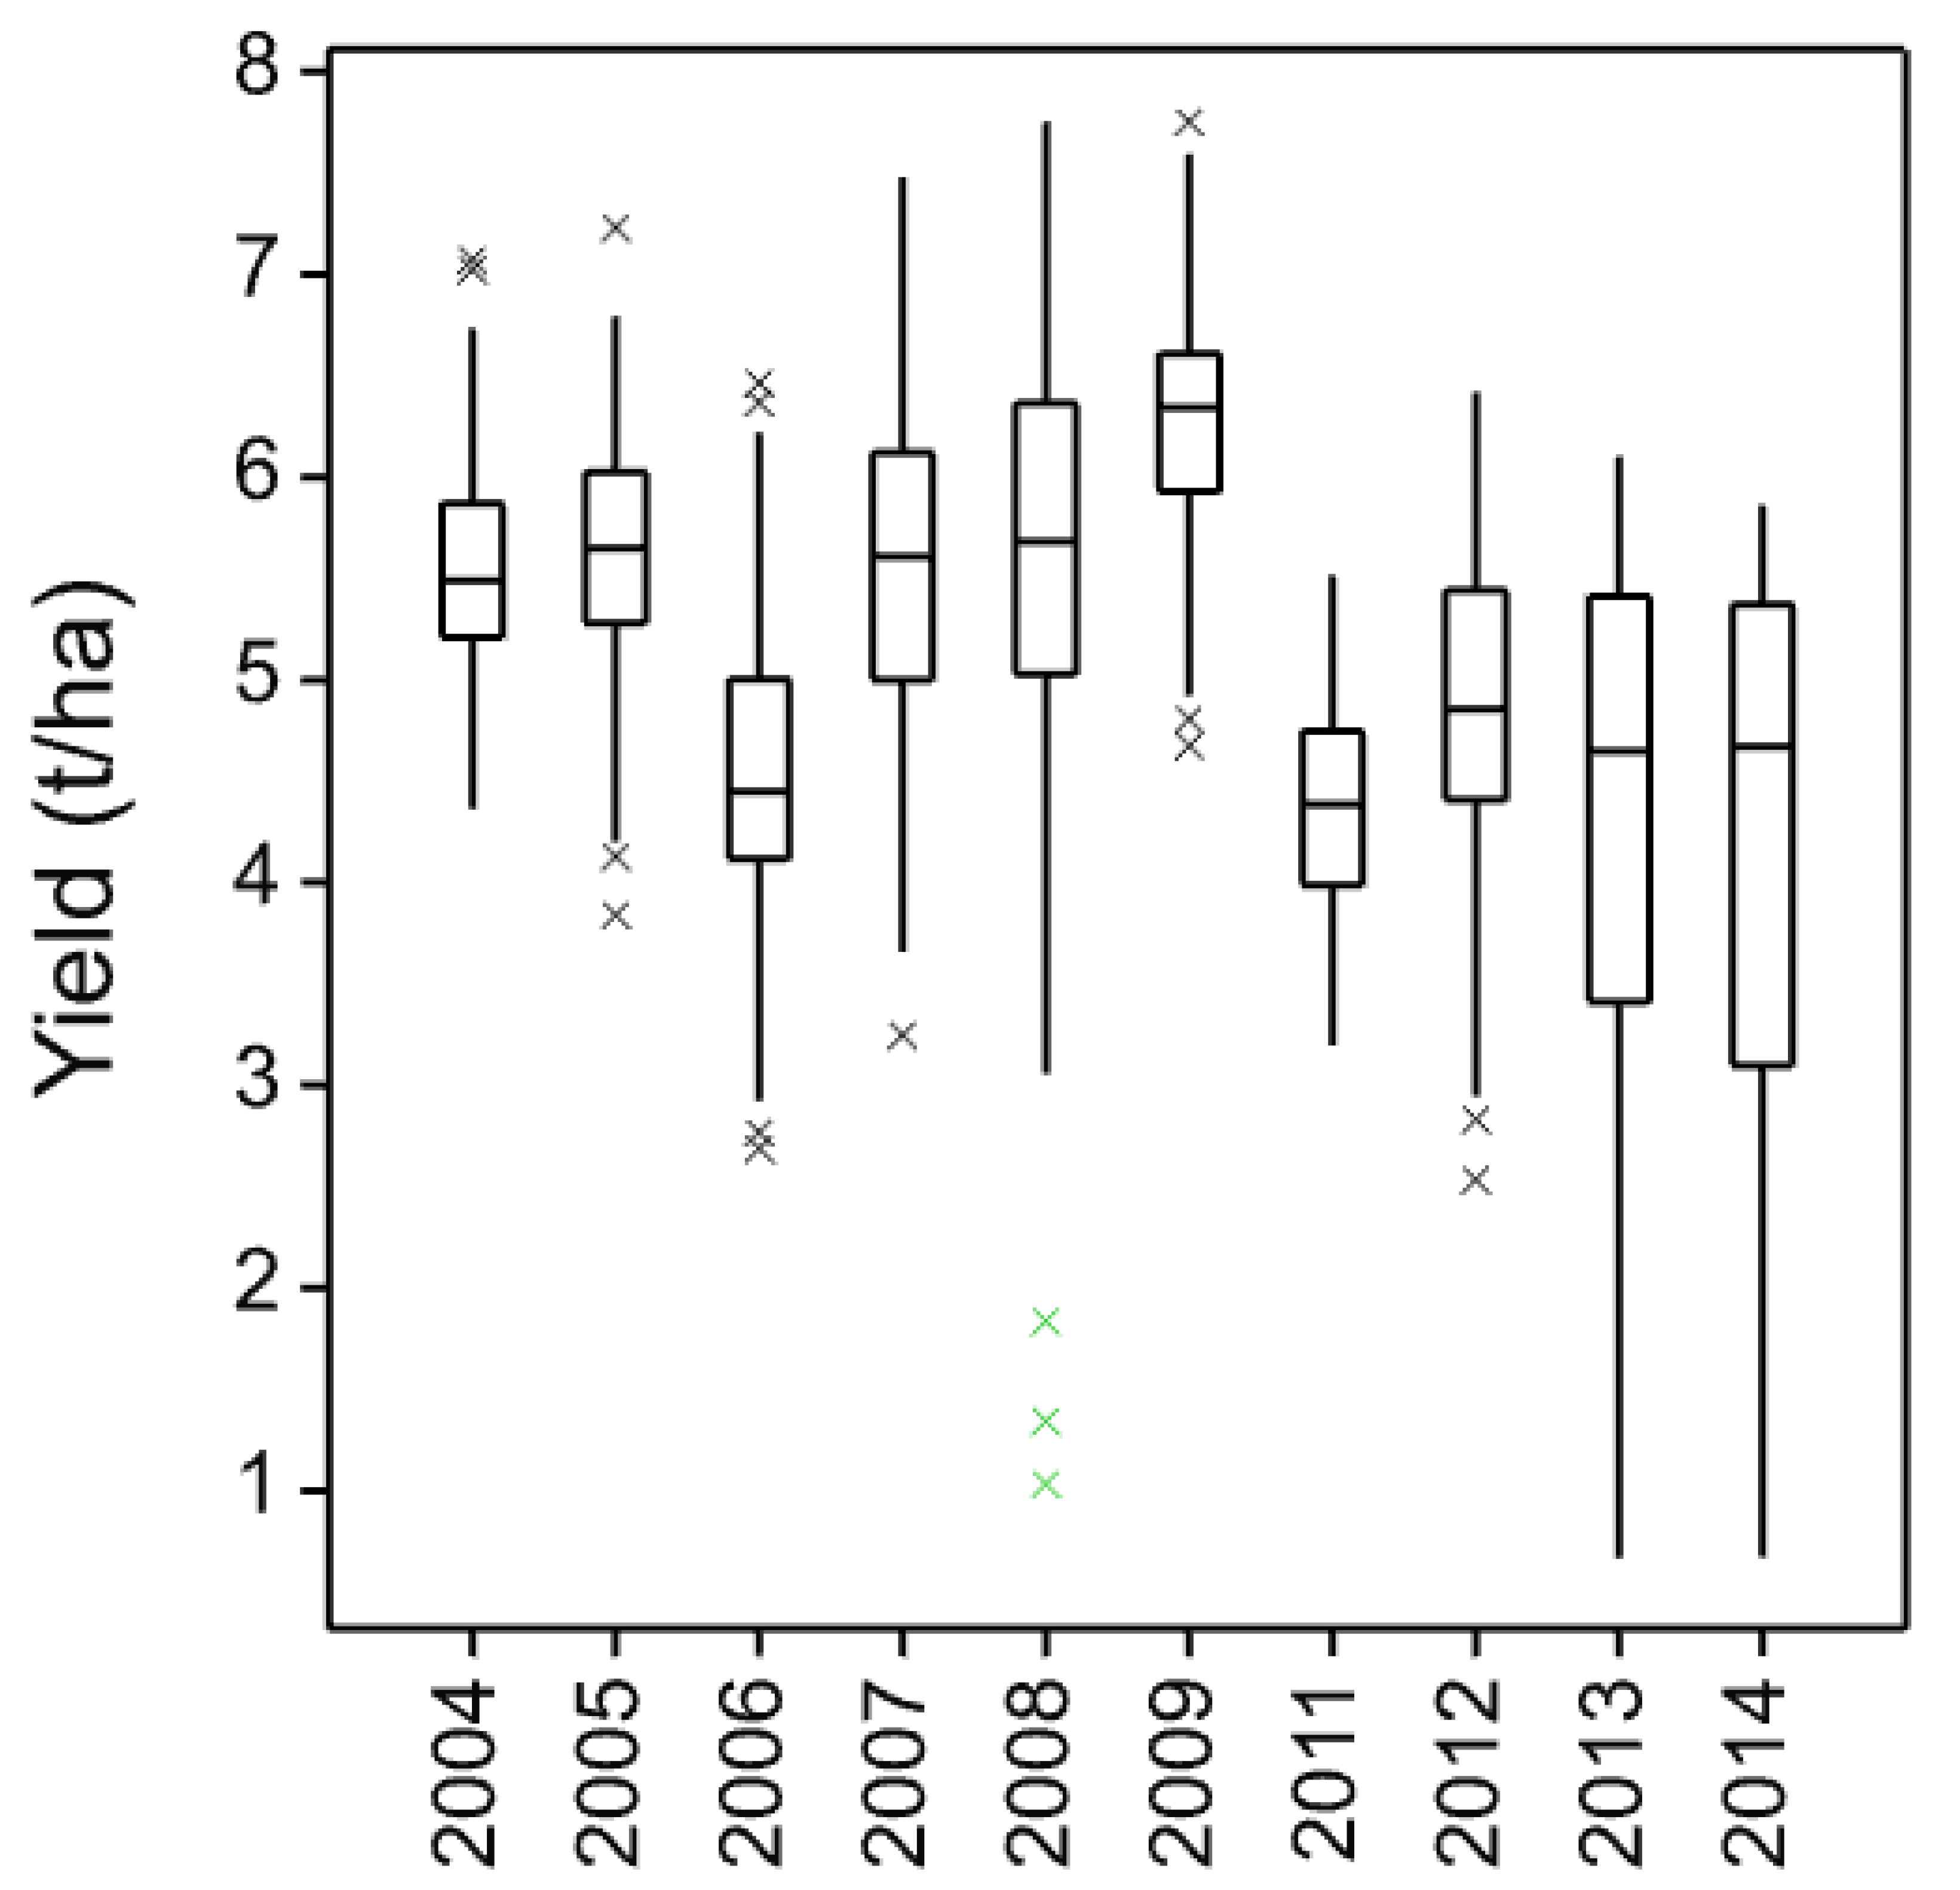
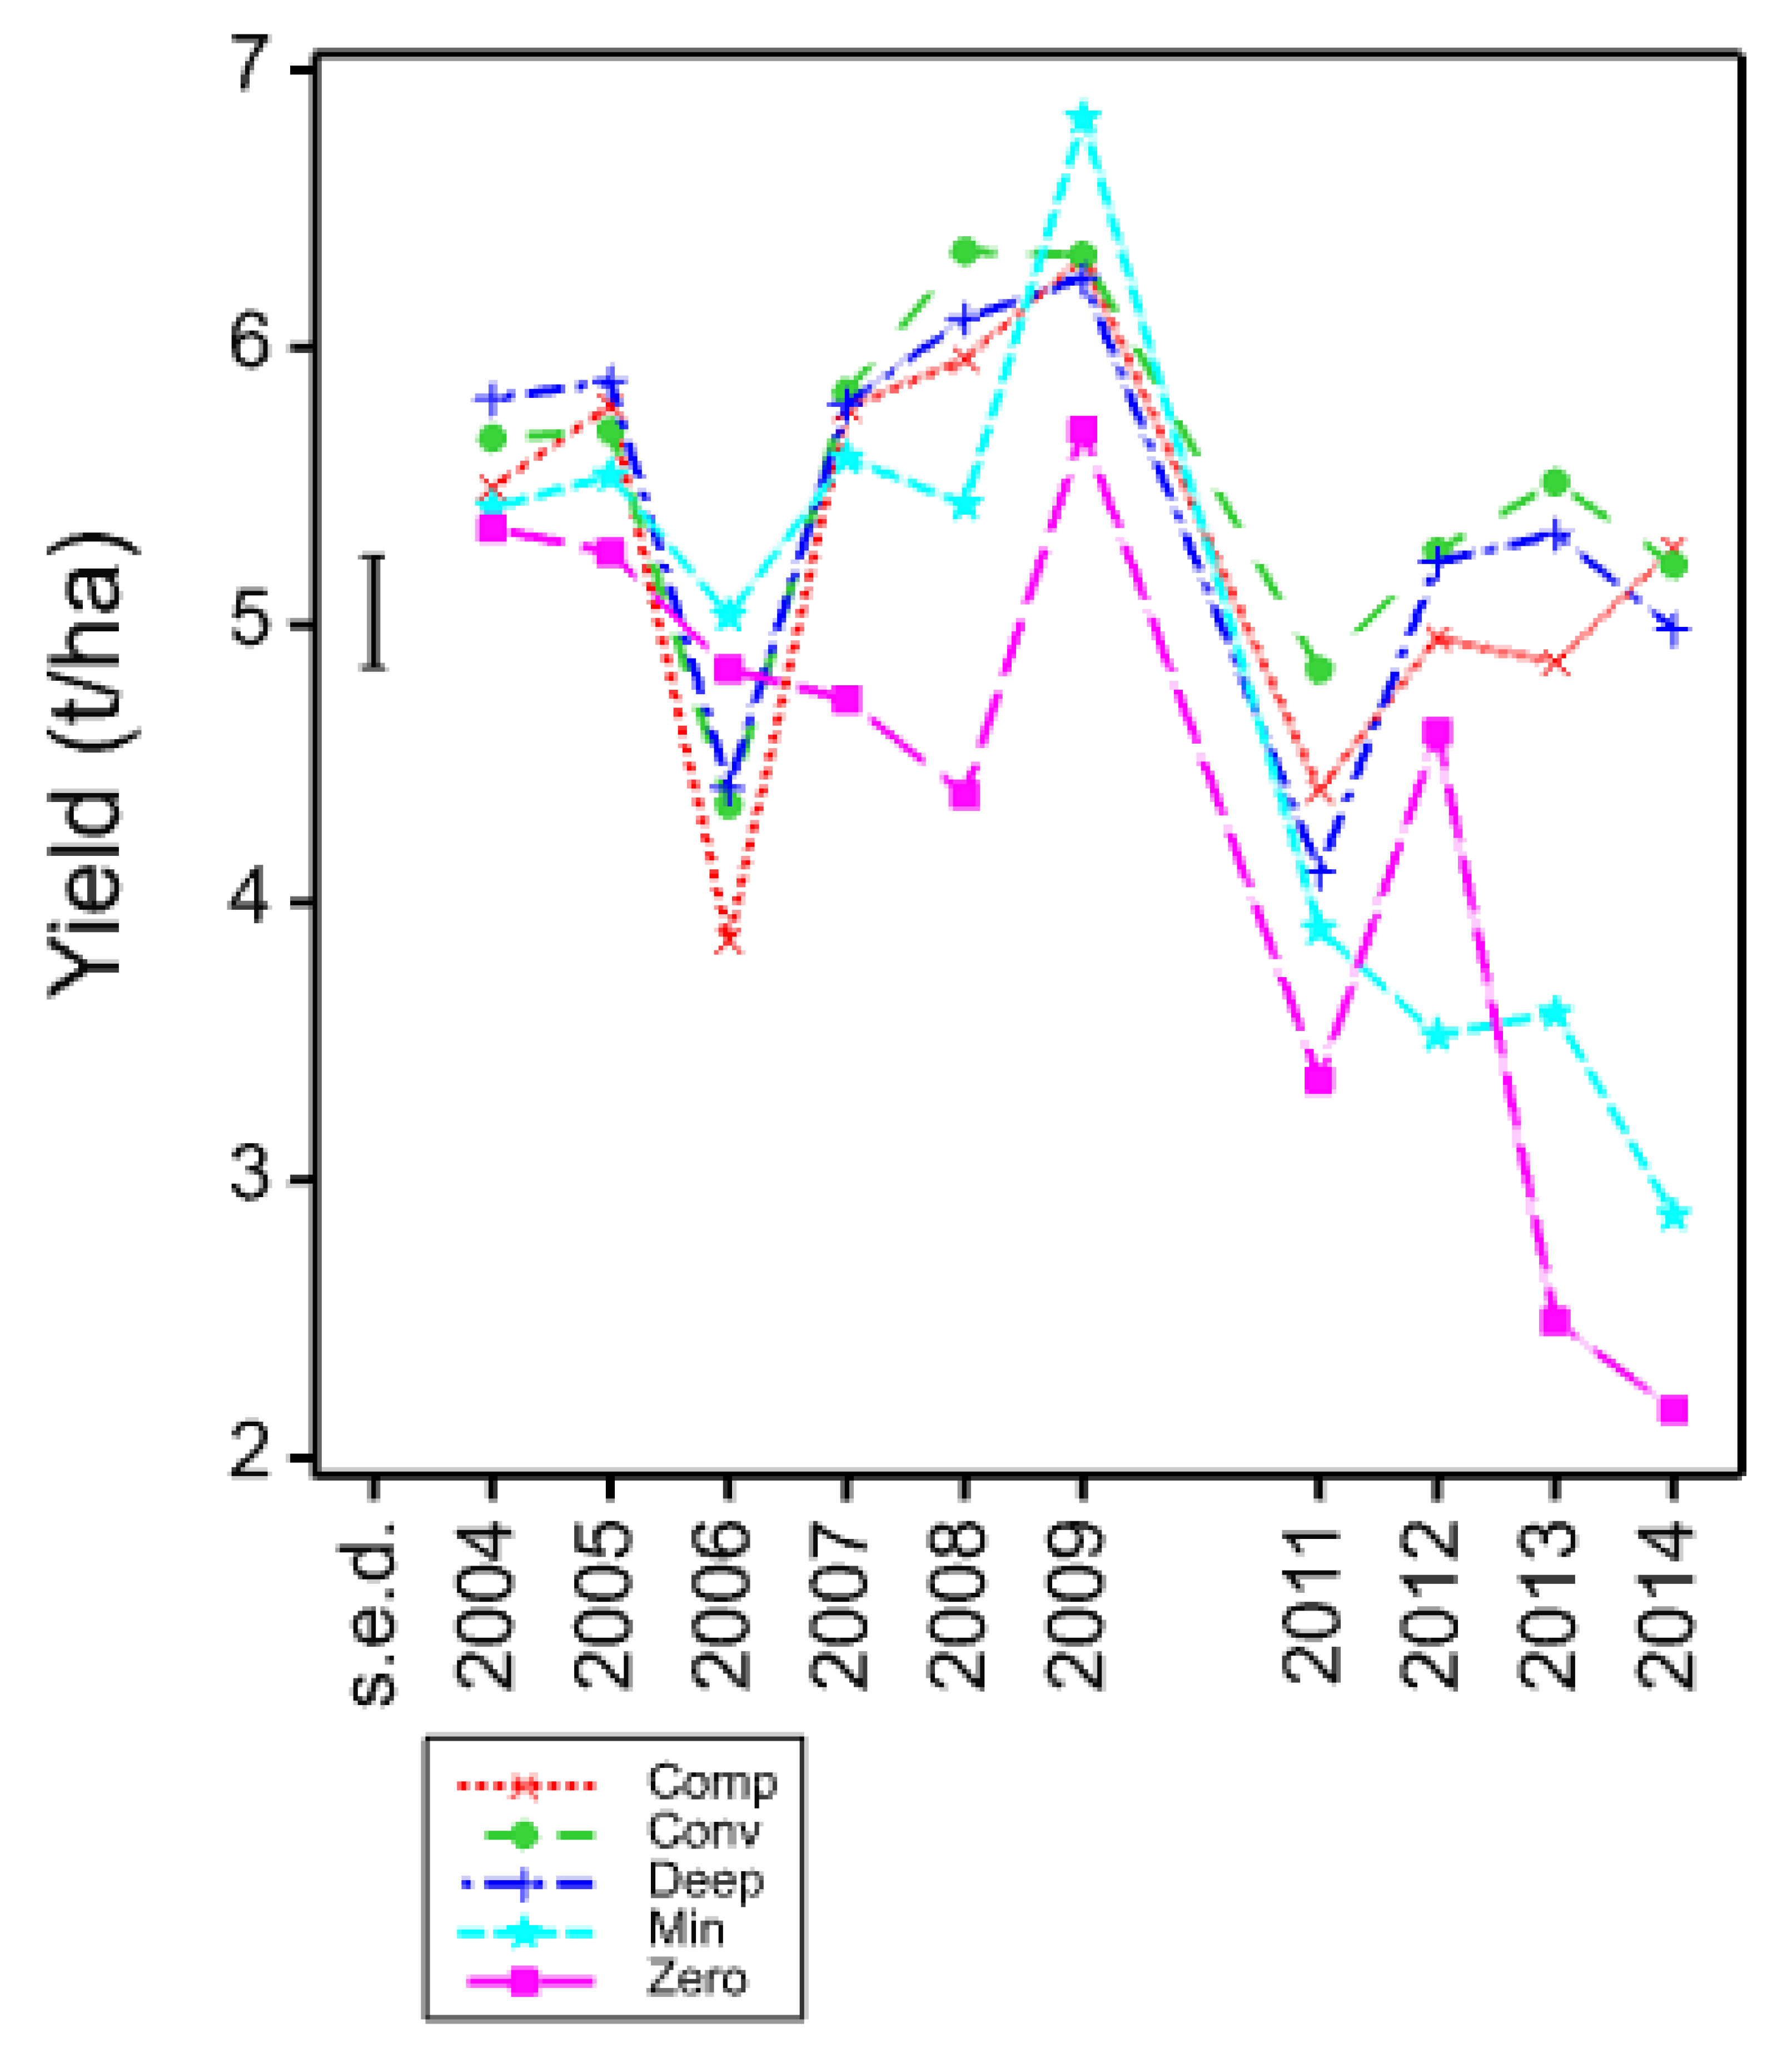
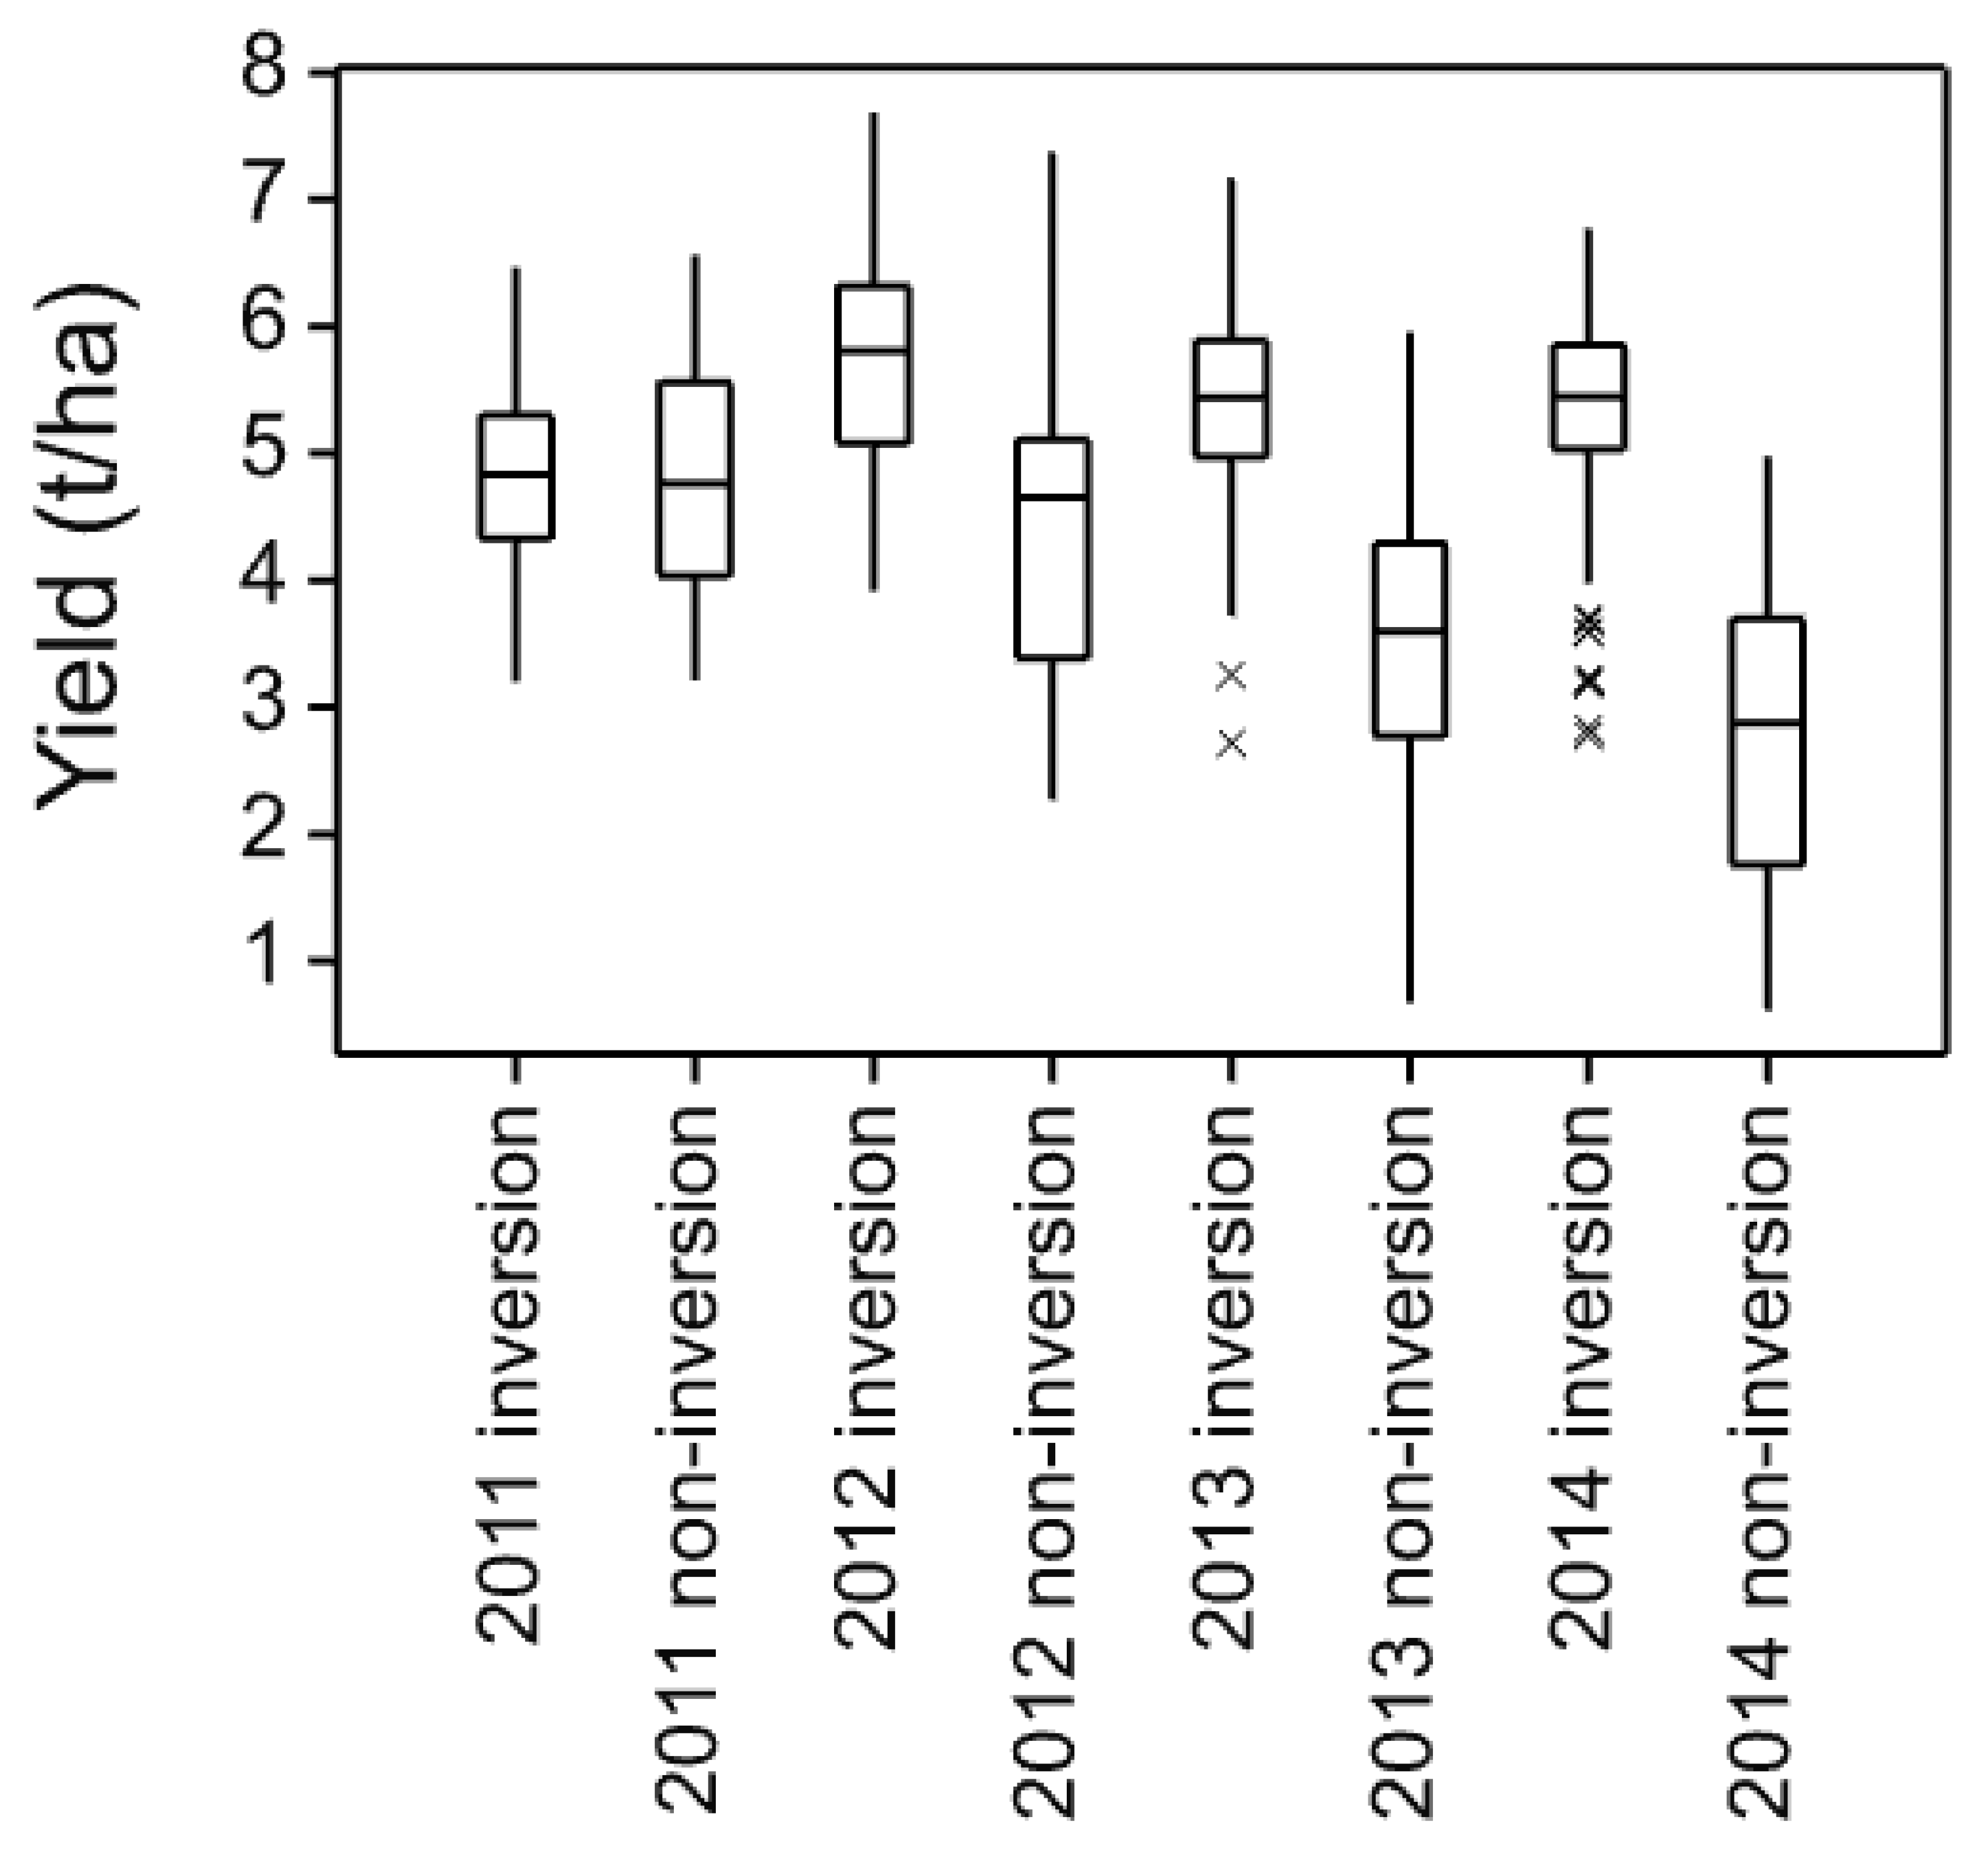
The core set of cultivars Fanfare, Sumo, Pipkin and Pastoral were present in all trial years and, therefore, will give an indication of both seasonal effects and maturity of the soil as the years progress. The mean yields across the years ranged between approximately 4.4 and 6.4 t/ha and were most variable in 2013 and 2014 (Figure 1). The multiyear ANOVA showed a significant interaction between year, treatment and cultivar (p = 0.004), which when partitioned showed that the interaction between year, cultivar and inversion type was significant with p < 0.001, but the remainder of the interaction term (involving comparisons within the inversion types) was not significant (p > 0.05). The trends of the cultivation treatments across the years are shown in Figure 2 where the similarity of the three inversion tillage treatments in most years is clear. The two non-inversion tillage treatments showed less similarity to each other, but with the exception of 2012, the zero tillage yielded less than the minimum tillage treatment. The exceptional years to the non-inversion tillage yield being lower than the inversion tillage yield were the delayed inversion treatment sowing 2006, where the non-inversion tillage yield was significantly higher than the inversion yield (p = 0.007) and 2009 where these were not significantly different.
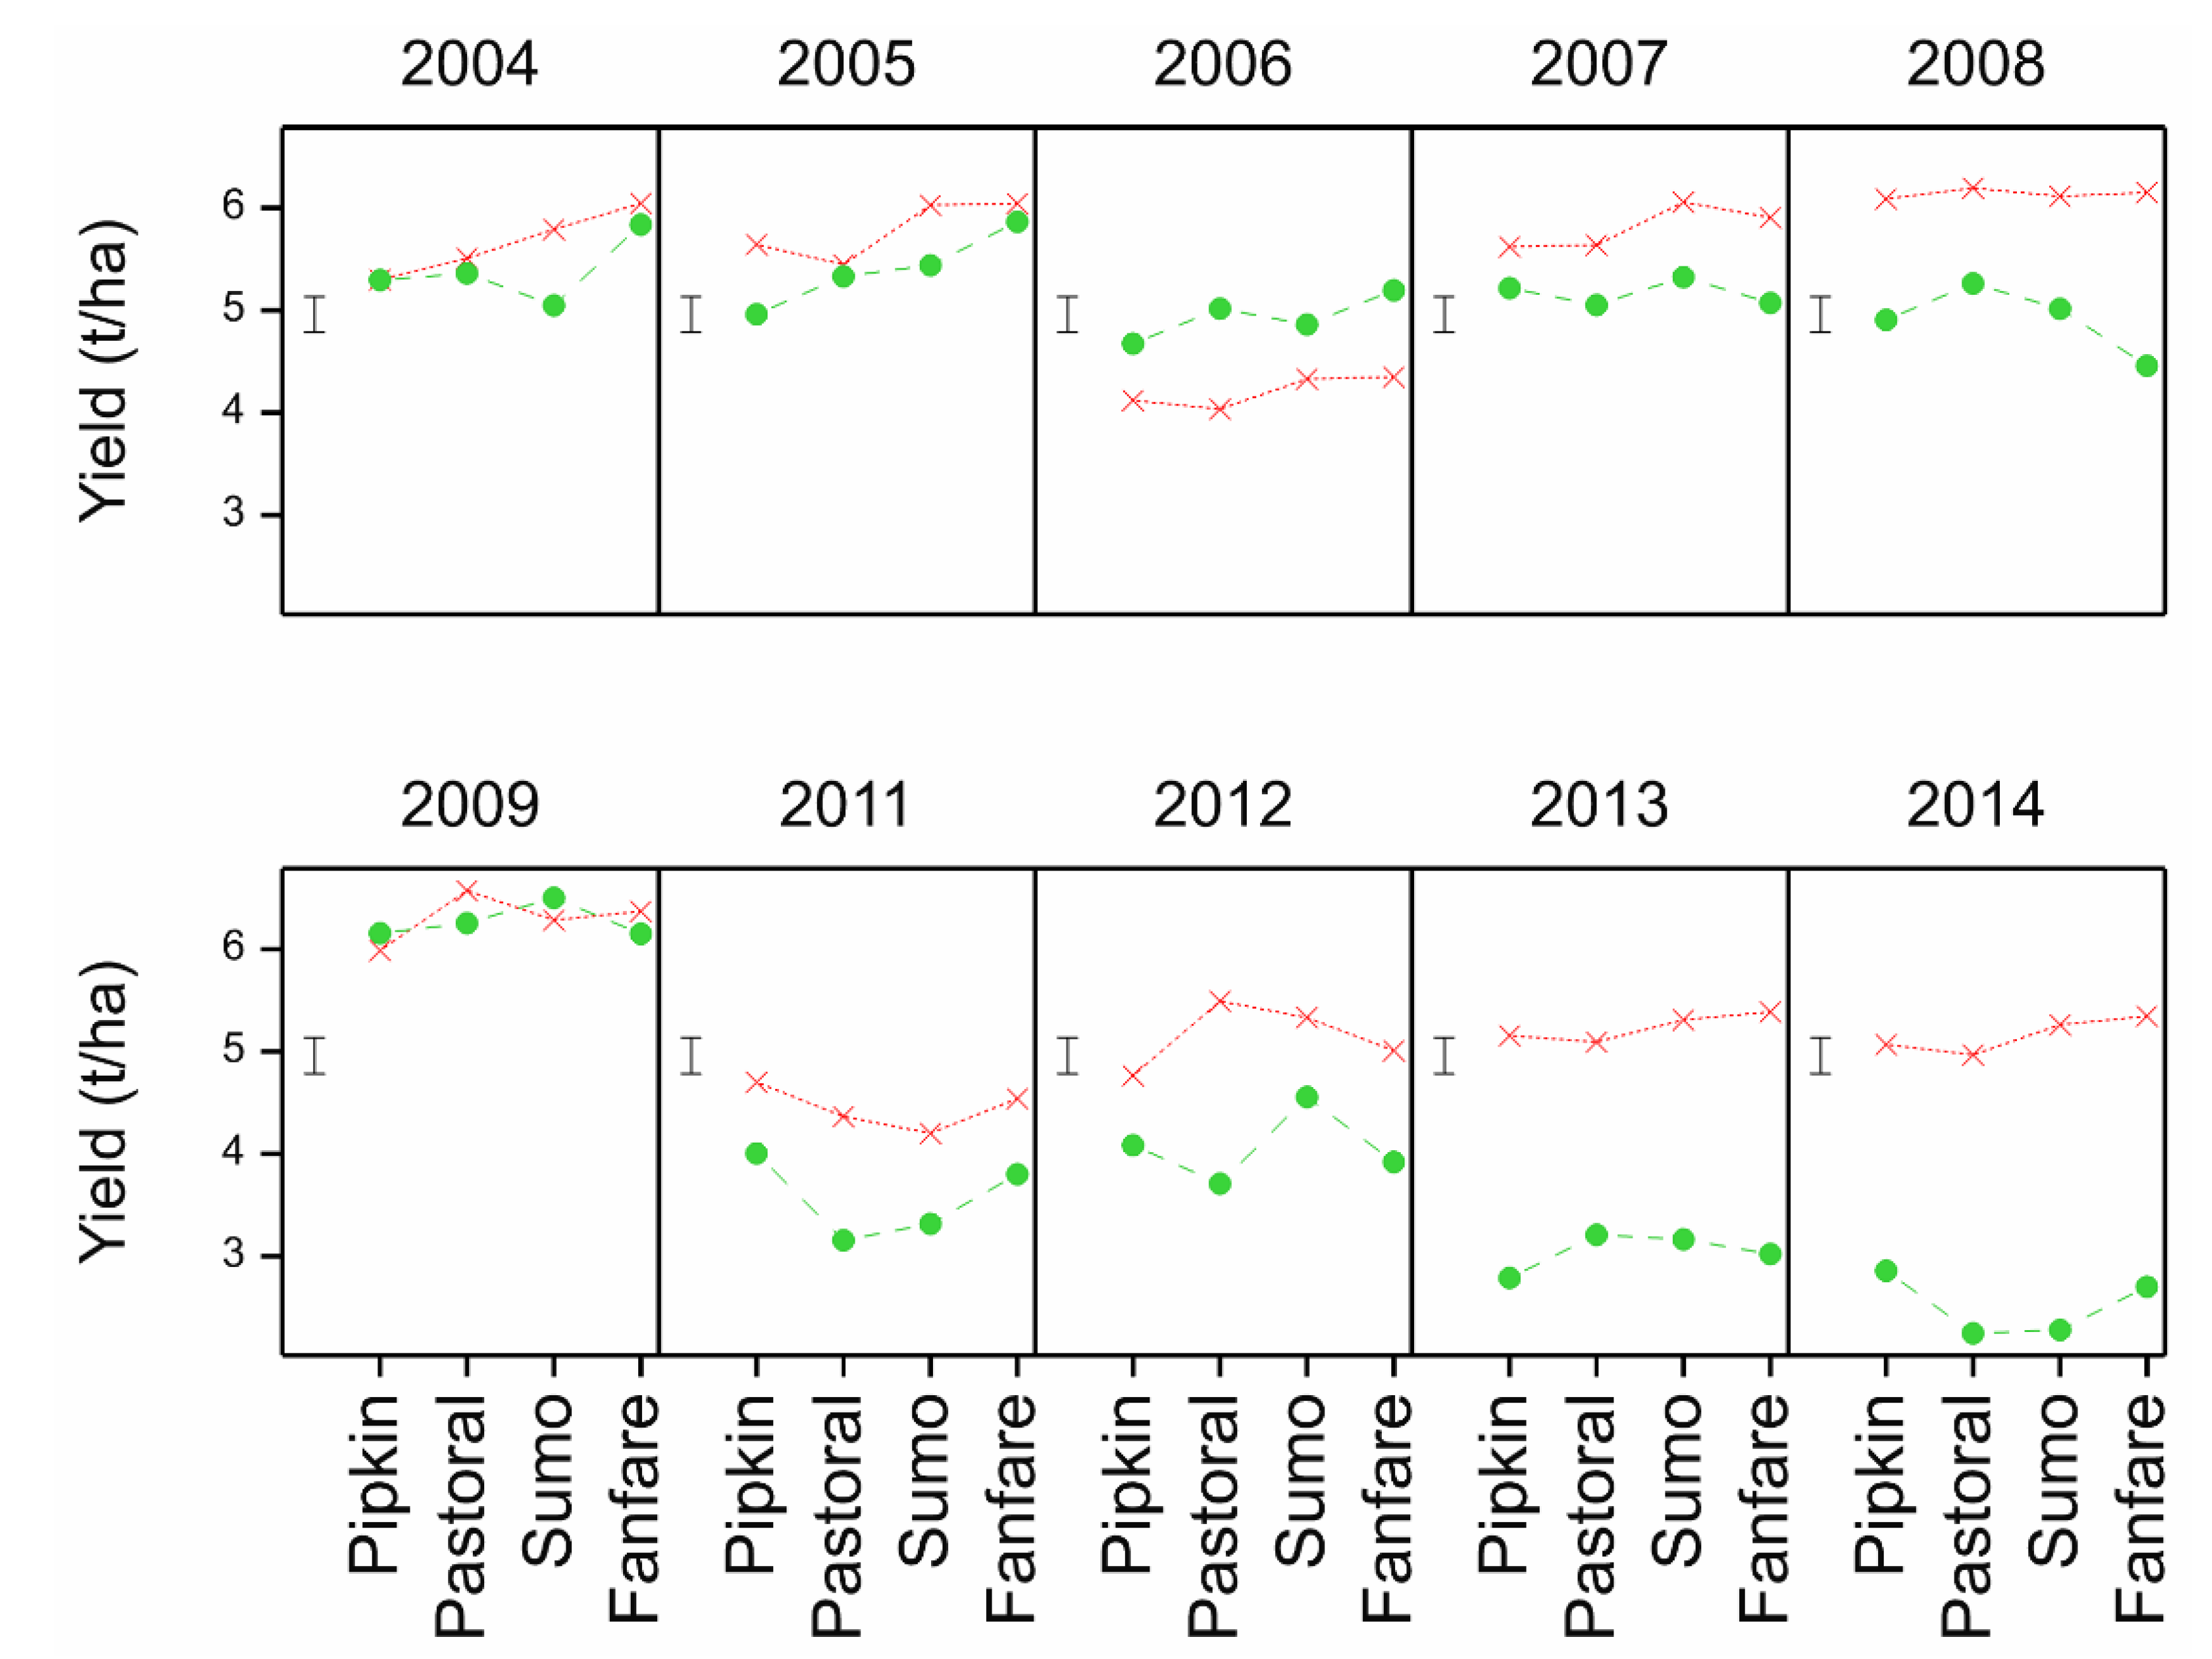
The four cultivars showed similar responses to the tillage treatment types; there is no difference in their yield ranking (Table 3). However, the yield of the cultivars declines generally as the years progress but much more so under non-inversion tillage in this continuous barley system (Figure 3).
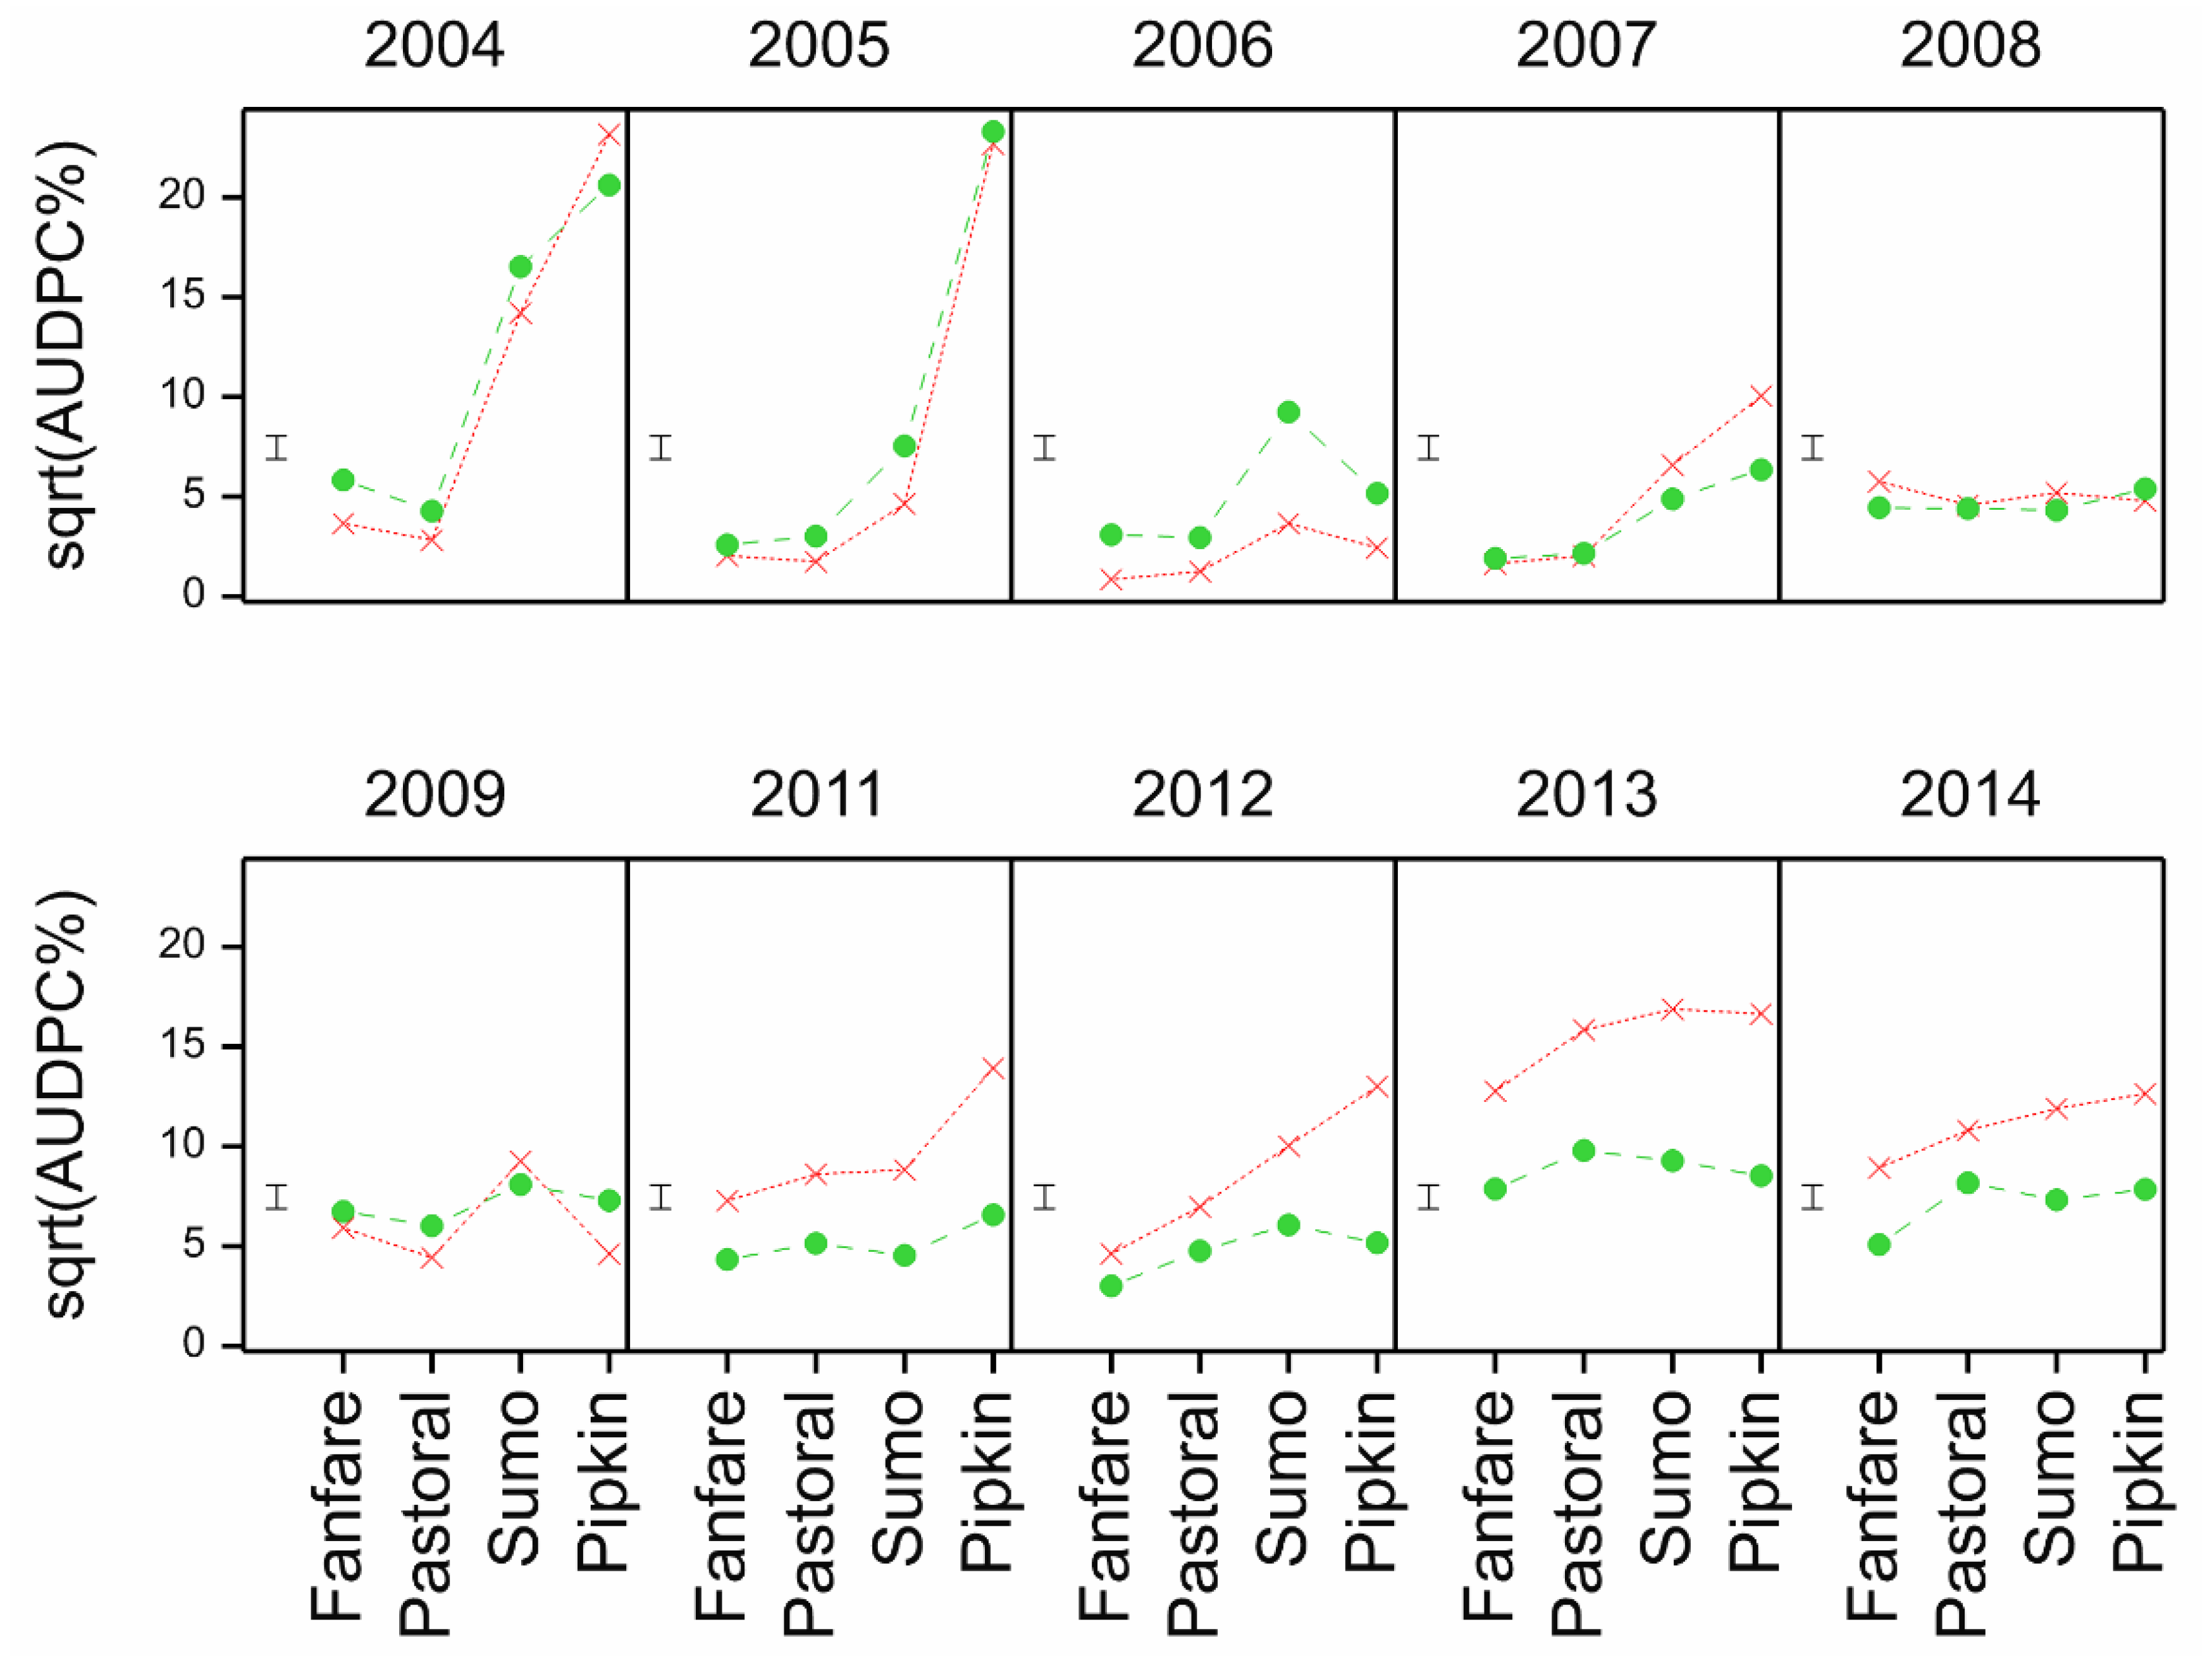
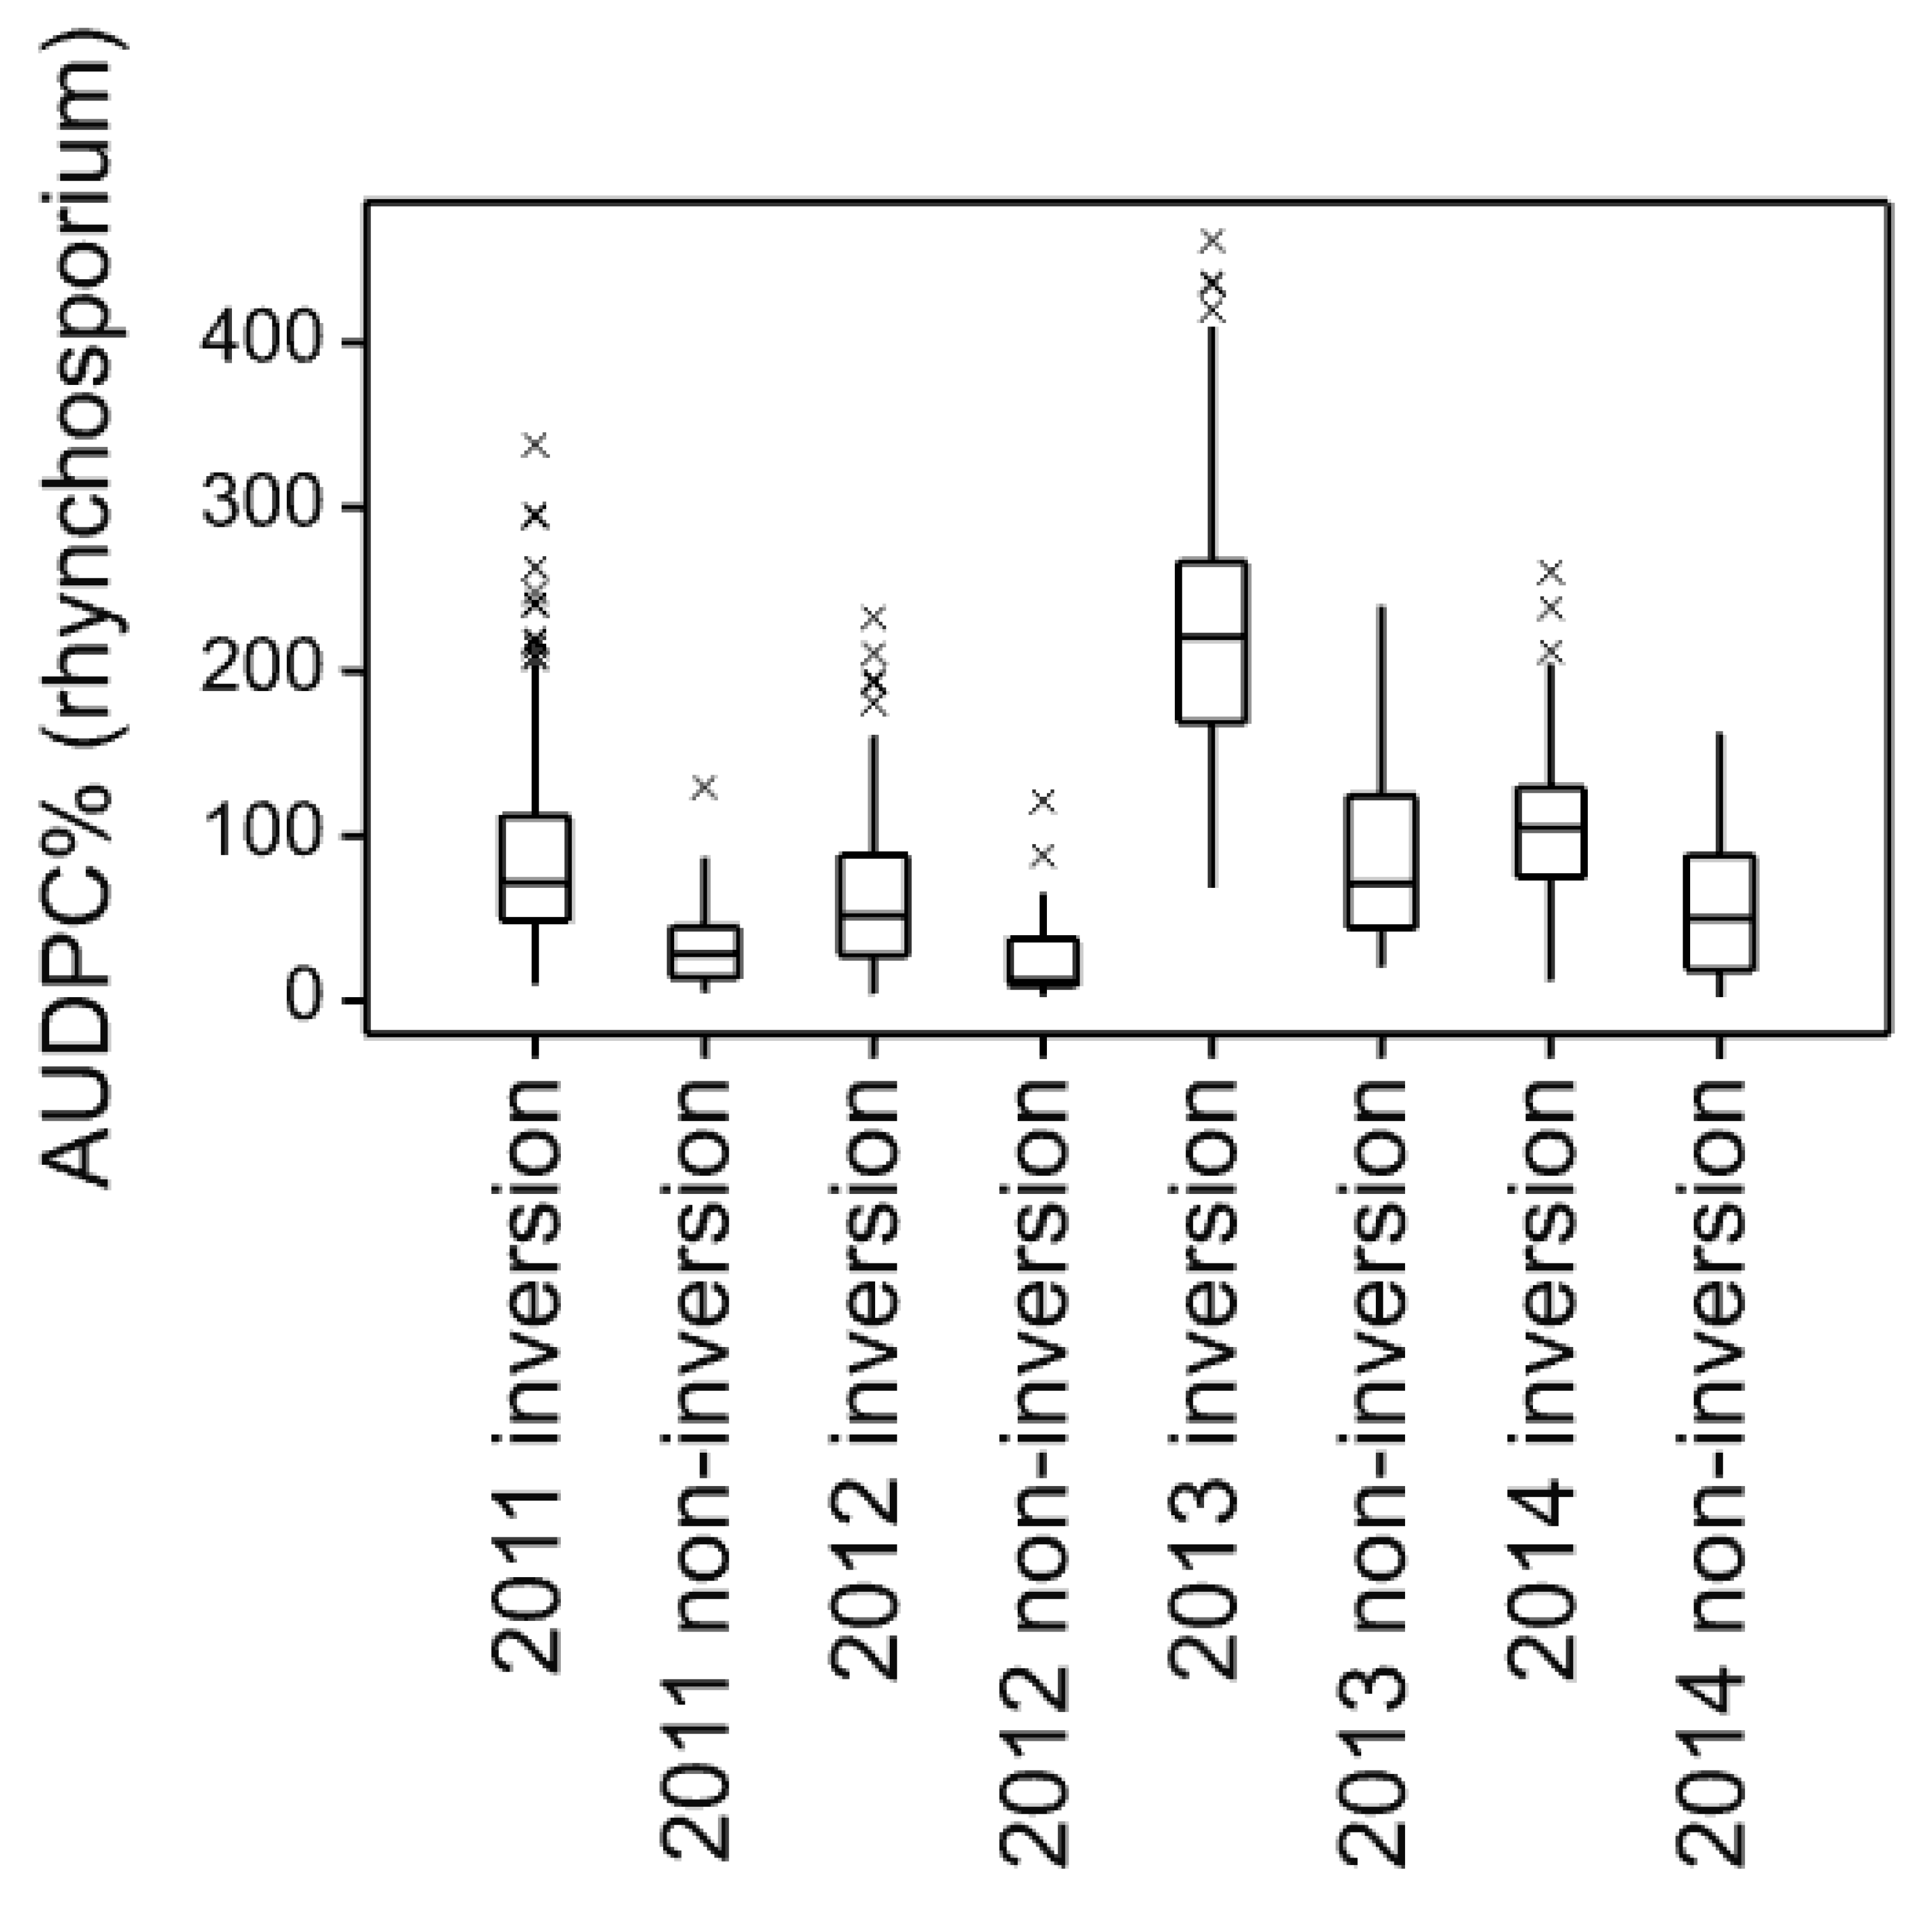
In the first three years of establishment of the cultivation platform, there was either little difference between inversion and non-inversion practices for rhynchosporium infection, or (in 2006) the non-inversion was more diseased. In the next three years (2007–2009), some of the cultivars showed the opposite effect. From 2011 to 2014 the non-inversion tillage showed consistently and substantially lower disease (p < 0.001) (Figure 4). The exceptional trend in 2006 with clearly greater disease on the non-inversion tillage is probably attributable to the sowing date issue with this trial again as in the delayed sowing of the inversion tillage treatments poor establishment and considerably delayed crop development was observed.
3.2. Comparison of 18 Cultivars 2011–2014
The four core cultivars were expanded by 14 additional cultivars comprising a subset from the ”Association Genetics of UK Elite Barley” (AGOUEB) project [17], two important cultivars not in that set and some newer cultivars (Table 1). These were all trialled across four consecutive years to assess the environmental robustness of any adaptation to tillage found. The yield depression of the non-inversion tillage treatments increased across these years (Figure 5), but several cultivars were identified as adapted to either inversion or non-inversion tillage (Figure 6).
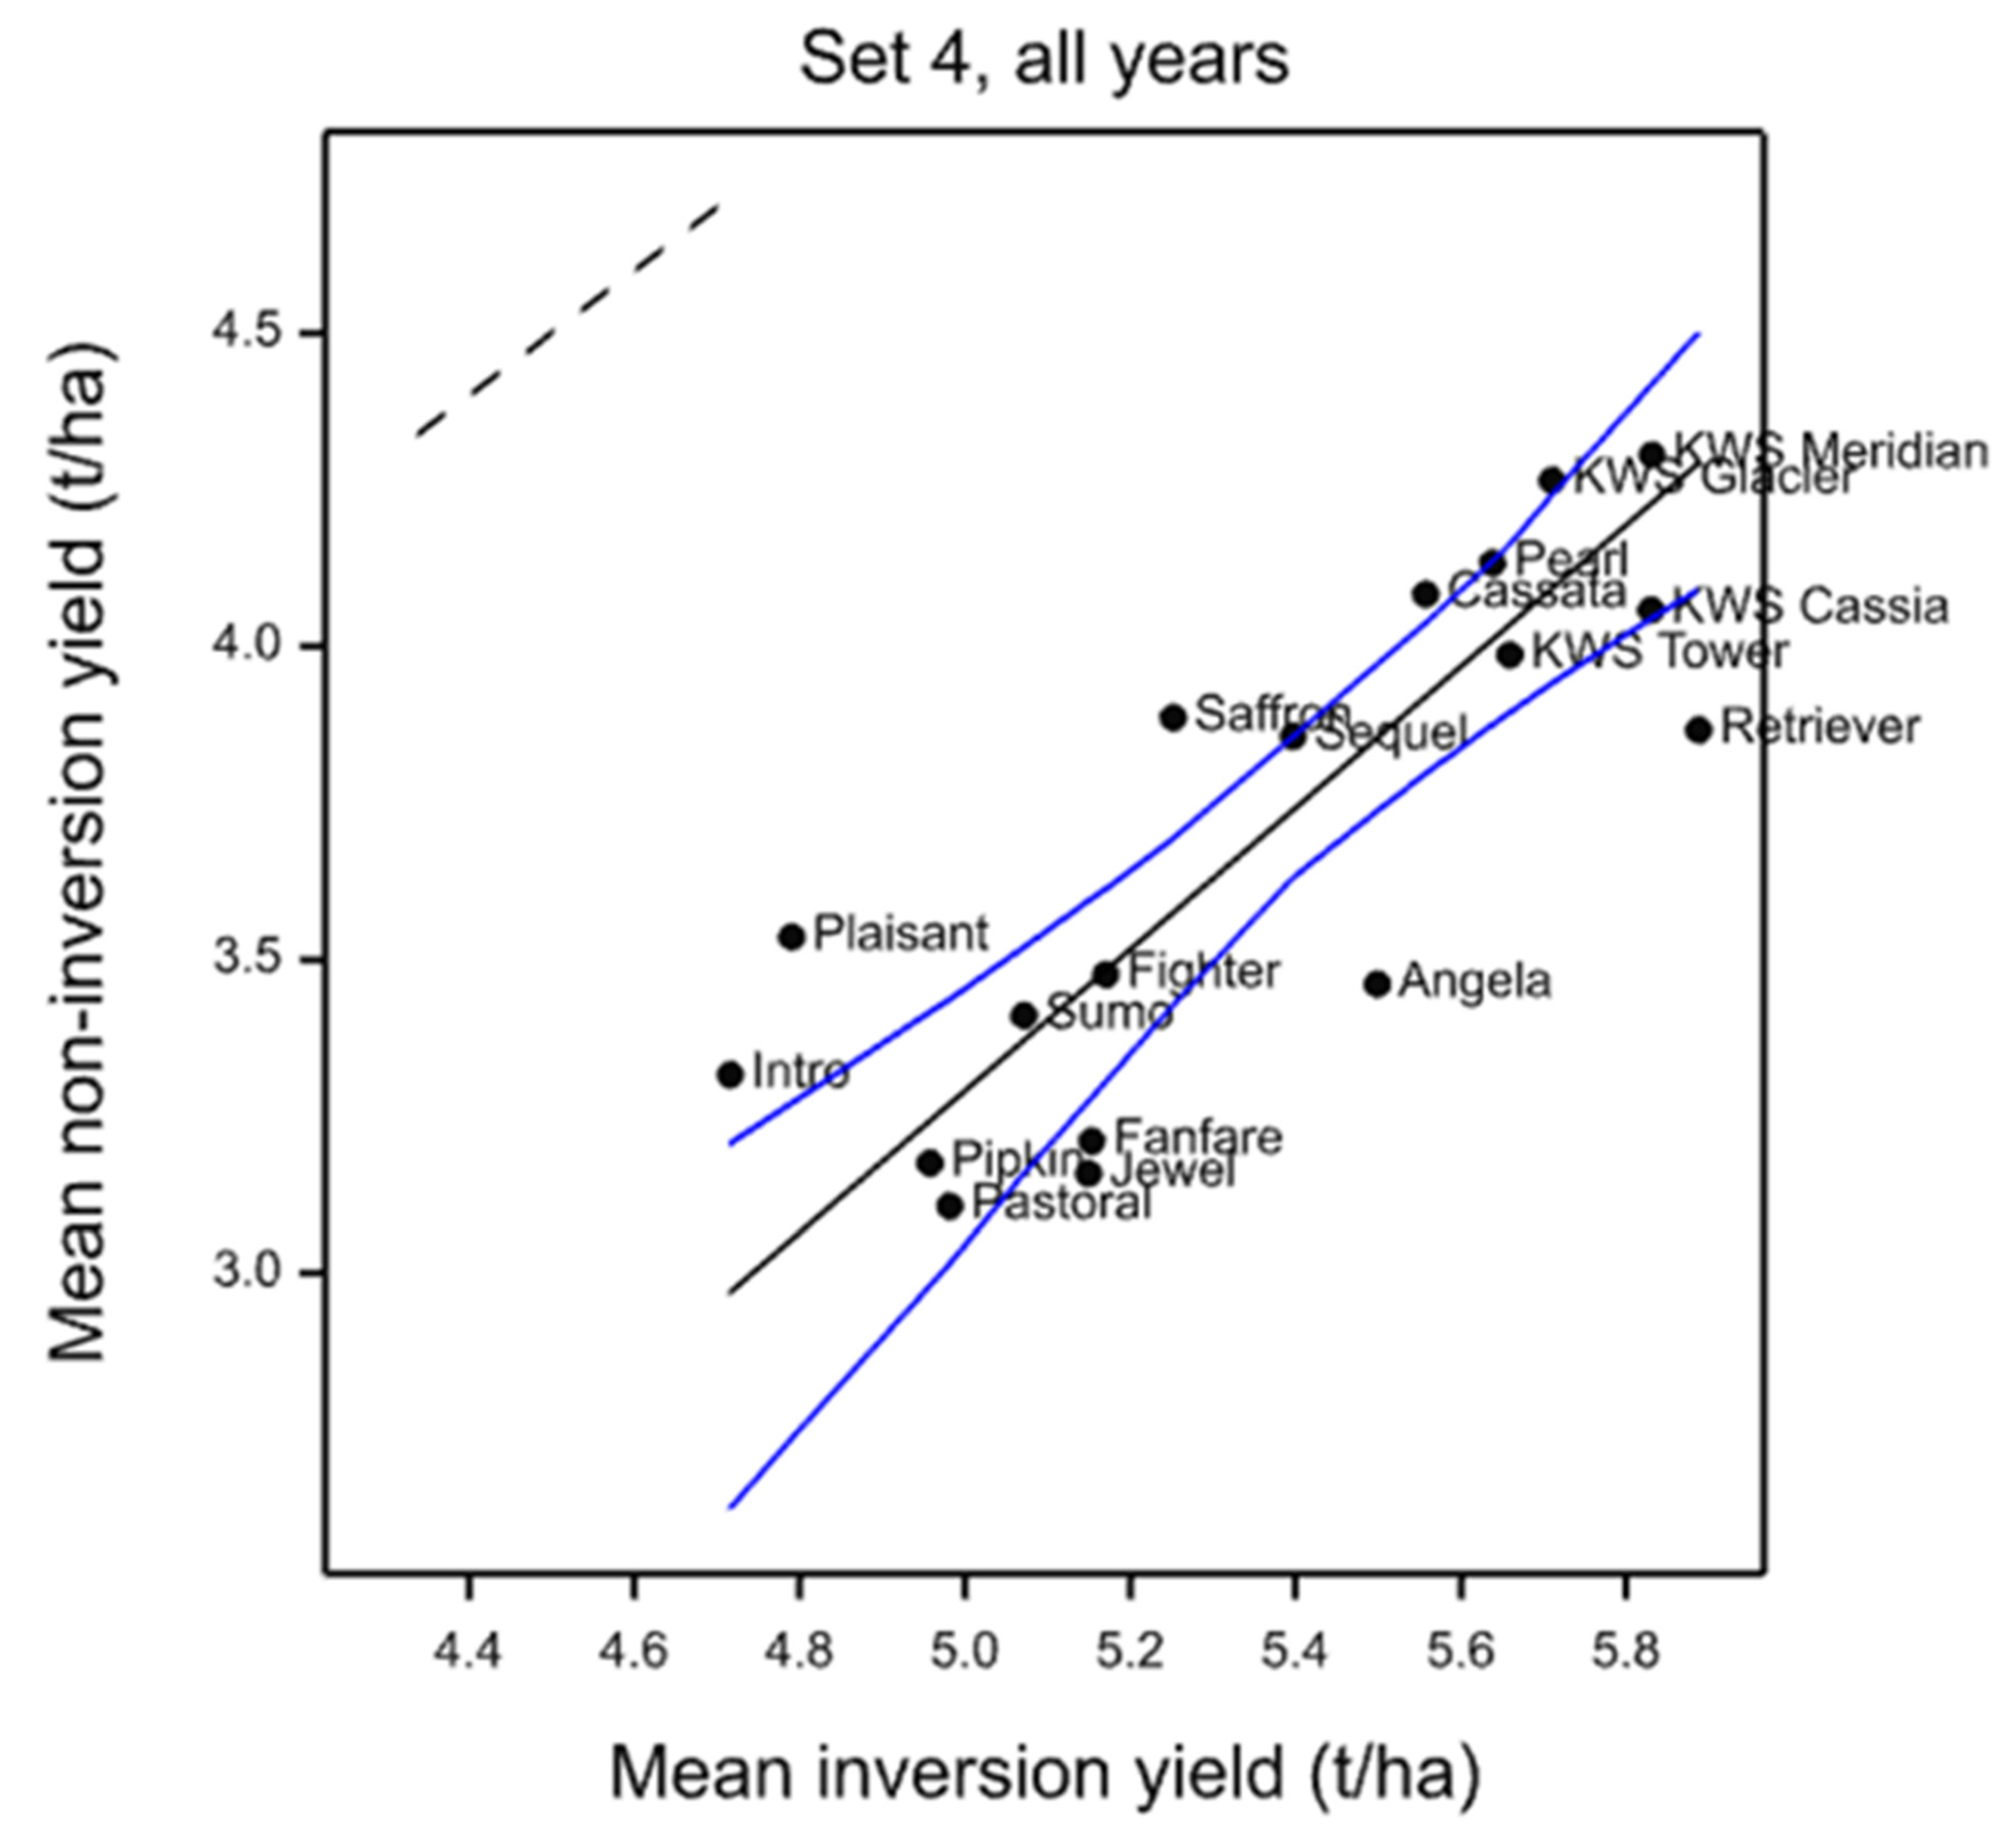
Overall, there were significant interactions between the cultivars and tillage type (p < 0.001), significant in 2011, 2012 and 2013 (p = 0.005; <0.001; 0.006) but not in 2014 (p = 0.168). In 2014, the main effects of cultivar and tillage type were both significant (p < 0.001). The interaction between cultivar and differences within the tillage type was not significant for any of these years. The functional regression of yield from non-inversion treatments on yield from inversion treatments, using mean yields from the multiyear analysis, shows most cultivars close to the fitted line but Intro, Plaisant and Saffron lie above the 95% confidence limits showing higher yield under non-inversion tillage and Angela, Retriever, Jewel and Fanfare lie below it, showing adaptation to inversion tillage (Figure 6). These all lie at the same tillage adapted extremes when the ranking change differences are calculated, although Cassata and Pearl also join the non-inversion adapted group and Pastoral the inversion adapted as all representing the top or bottom five cultivars with three or more rank change positions (Table 4). Based on the simulation study to look at the changes in absolute rank that can occur by chance in a data set of this structure [3], Table 5 shows that these are likely to be significant changes. Consider a change in absolute rank of three or more and the median number of cultivars in the simulation set that changed three places. The 90% point of the simulation distribution was six cultivars changing rank by three or more and the 95% point was seven cultivars. In the experimental data, ten cultivars changed rank by three or more positions. Overall, Table 5 shows that the number of changes in absolute rank in the experimental data exceeded the 95% point of the simulation set for rank changes from two places to the maximum observed of seven places.
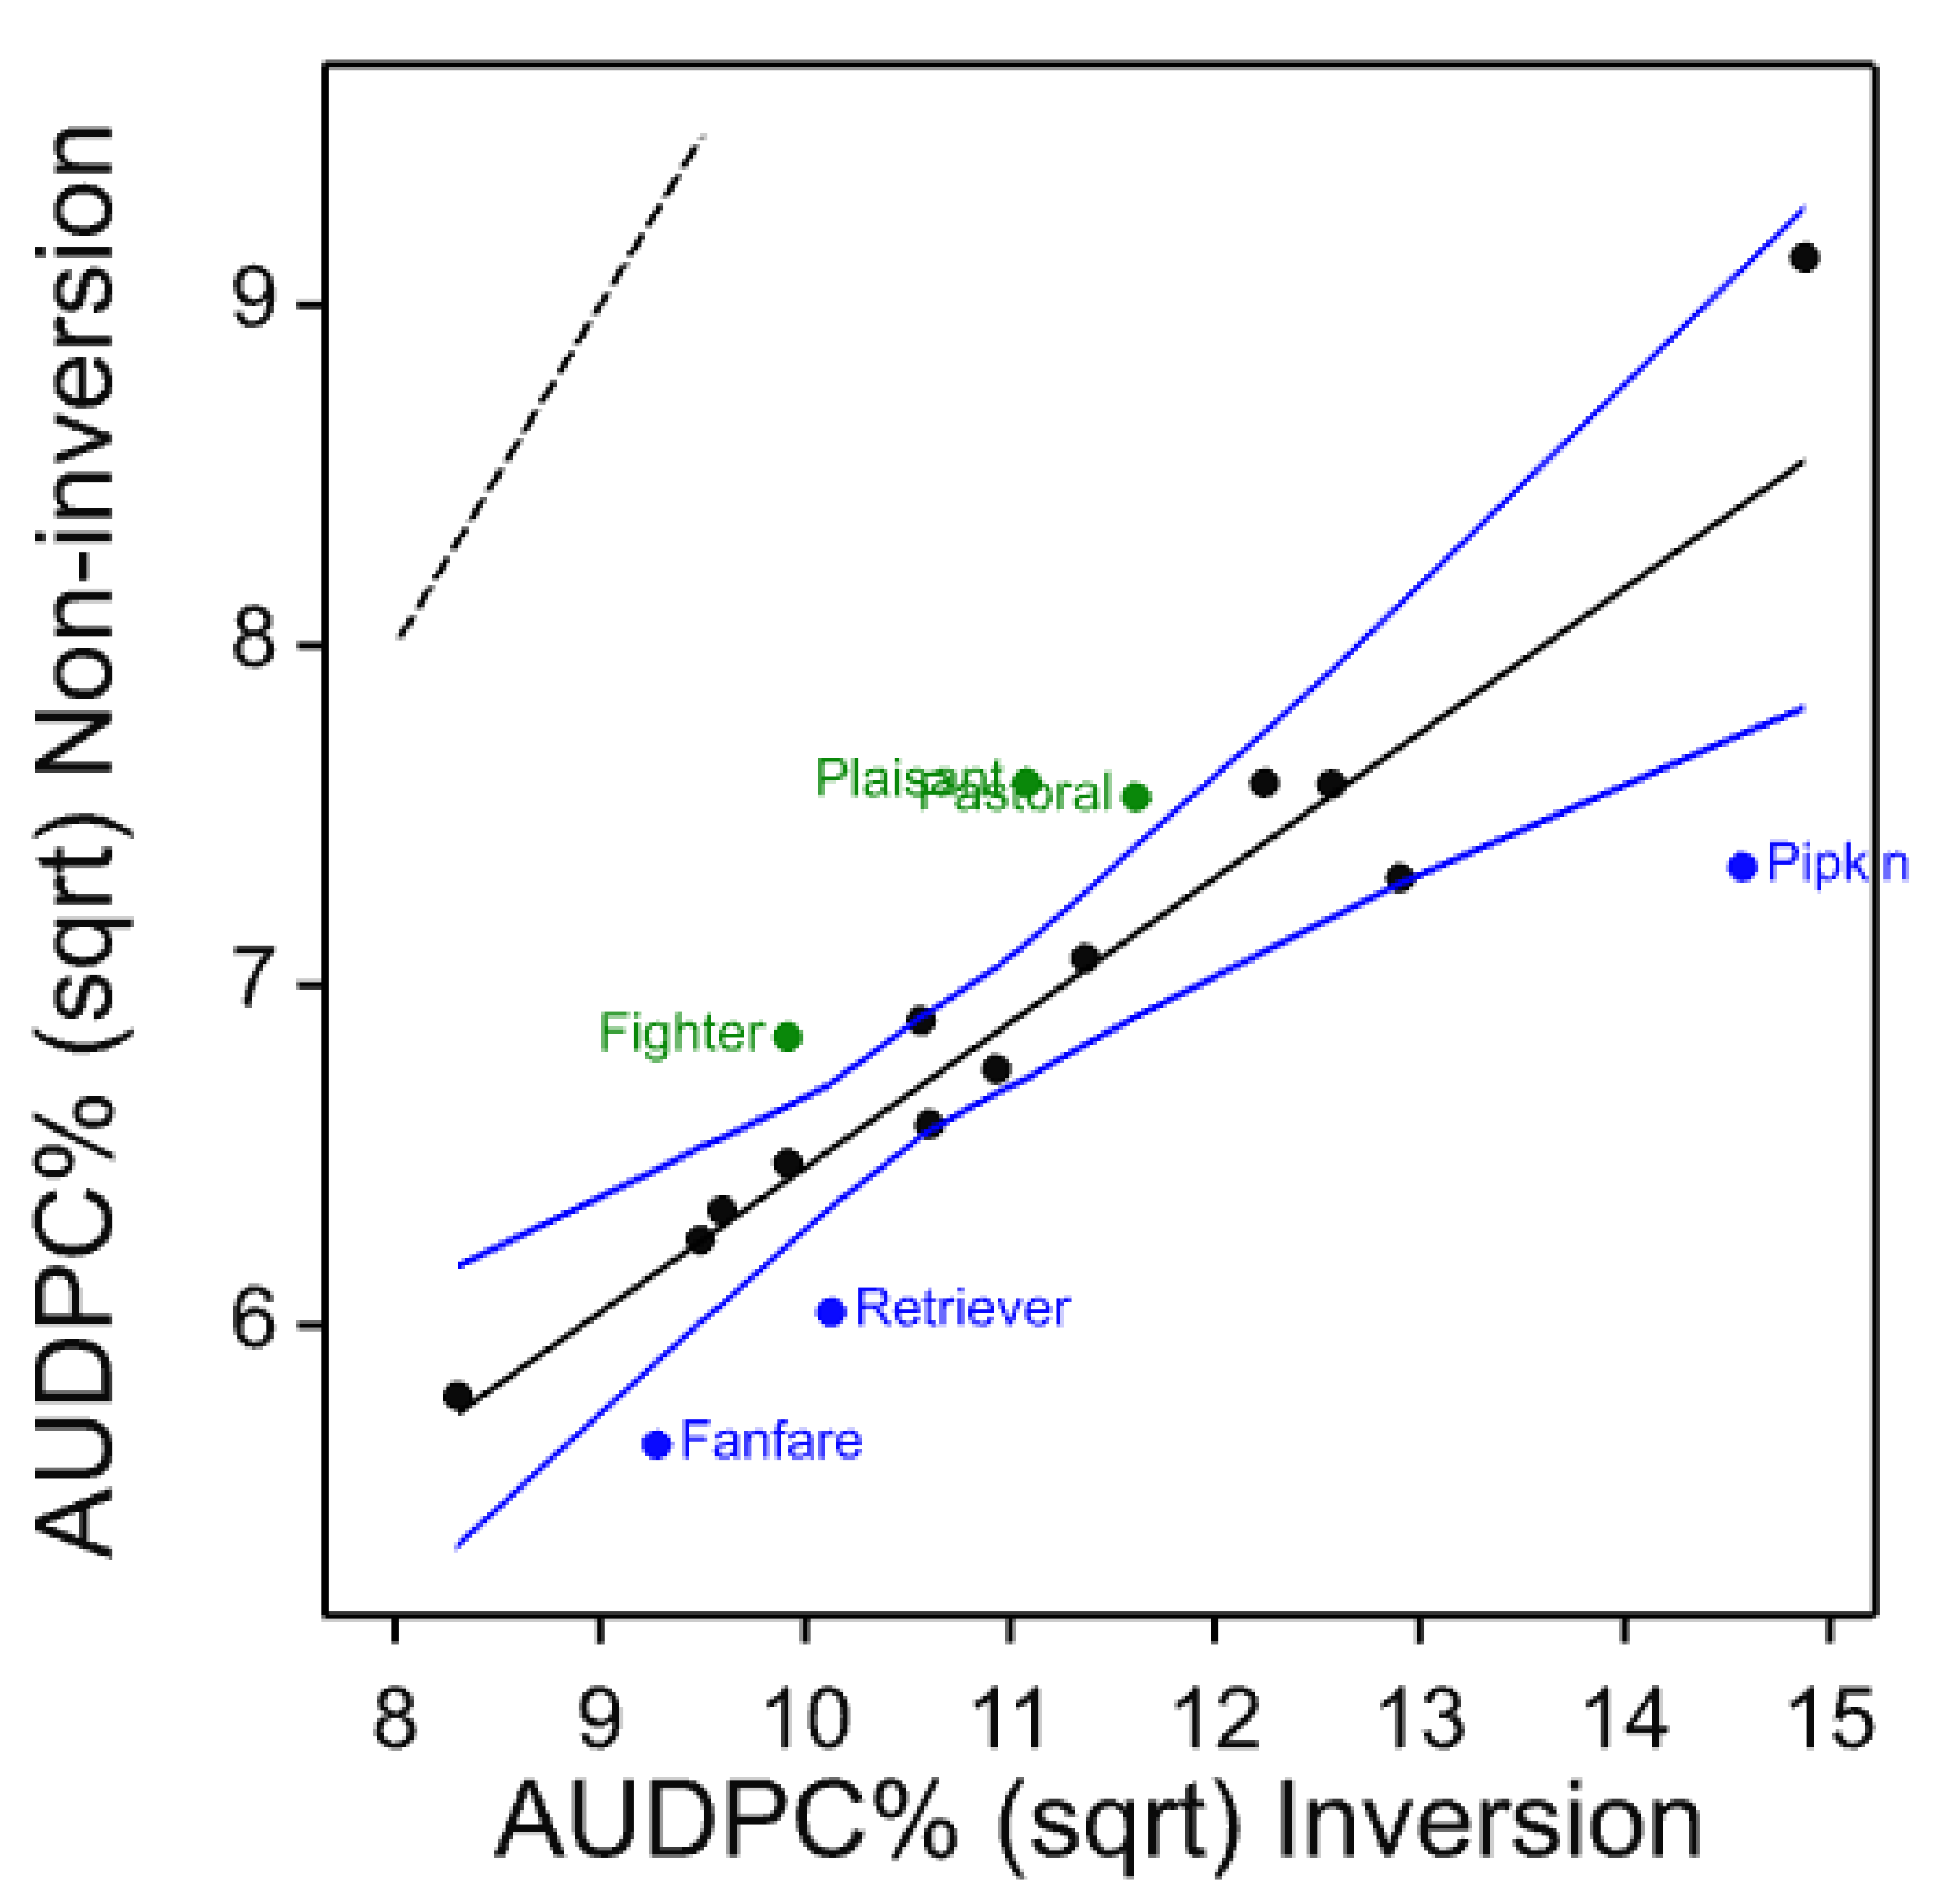
Rhynchosporium was again the only significant disease scored, and the data were analysed as for the core set. Disease levels were similar in 2011, 2013 and 2014 but lower in 2012 (Figure 7). In the multiyear analysis, there was a significant interaction between tillage type and cultivars (p < 0.001) and a weak three-way interaction between these and year (p = 0.038) but no significant interactions involving differences within the tillage types. The regression of non-inversion %AUDPC on inversion %AUDPC (on a square root scale)) from the multiyear analysis shows that most cultivars are close to the fitted line but Plaisant and Fighter lie above the confidence limits, showing more disease under non-inversion tillage, and Fanfare, Pipkin and Retriever lie below the confidence limits, showing relatively more disease under inversion tillage (Figure 8). Plaisant and Fighter have the largest decrease in rank from inversion to non-inversion tillage, while Pipkin and Retriever together with Sumo increase their ranking by four places, the largest upwards change. Fanfare is ranked second under inversion tillage and increases the rank to first under inversion tillage. (Table 6). As shown in Table 7, the observed number of changes in absolute rank is greater than the 95% point of the distribution in simulated data for rank changes from two to the maximum observation of six.
3.3. Some Comparisons of 77 Cultivars
The full ”AGOUEB” project set of 56 cultivars were trialled in 2008, a set of 45 in 2011 and 35 in 2012, with 20 cultivars being common to all three sets, to survey the breadth of adaptation potential whilst still assessing the environmental robustness from year to year.
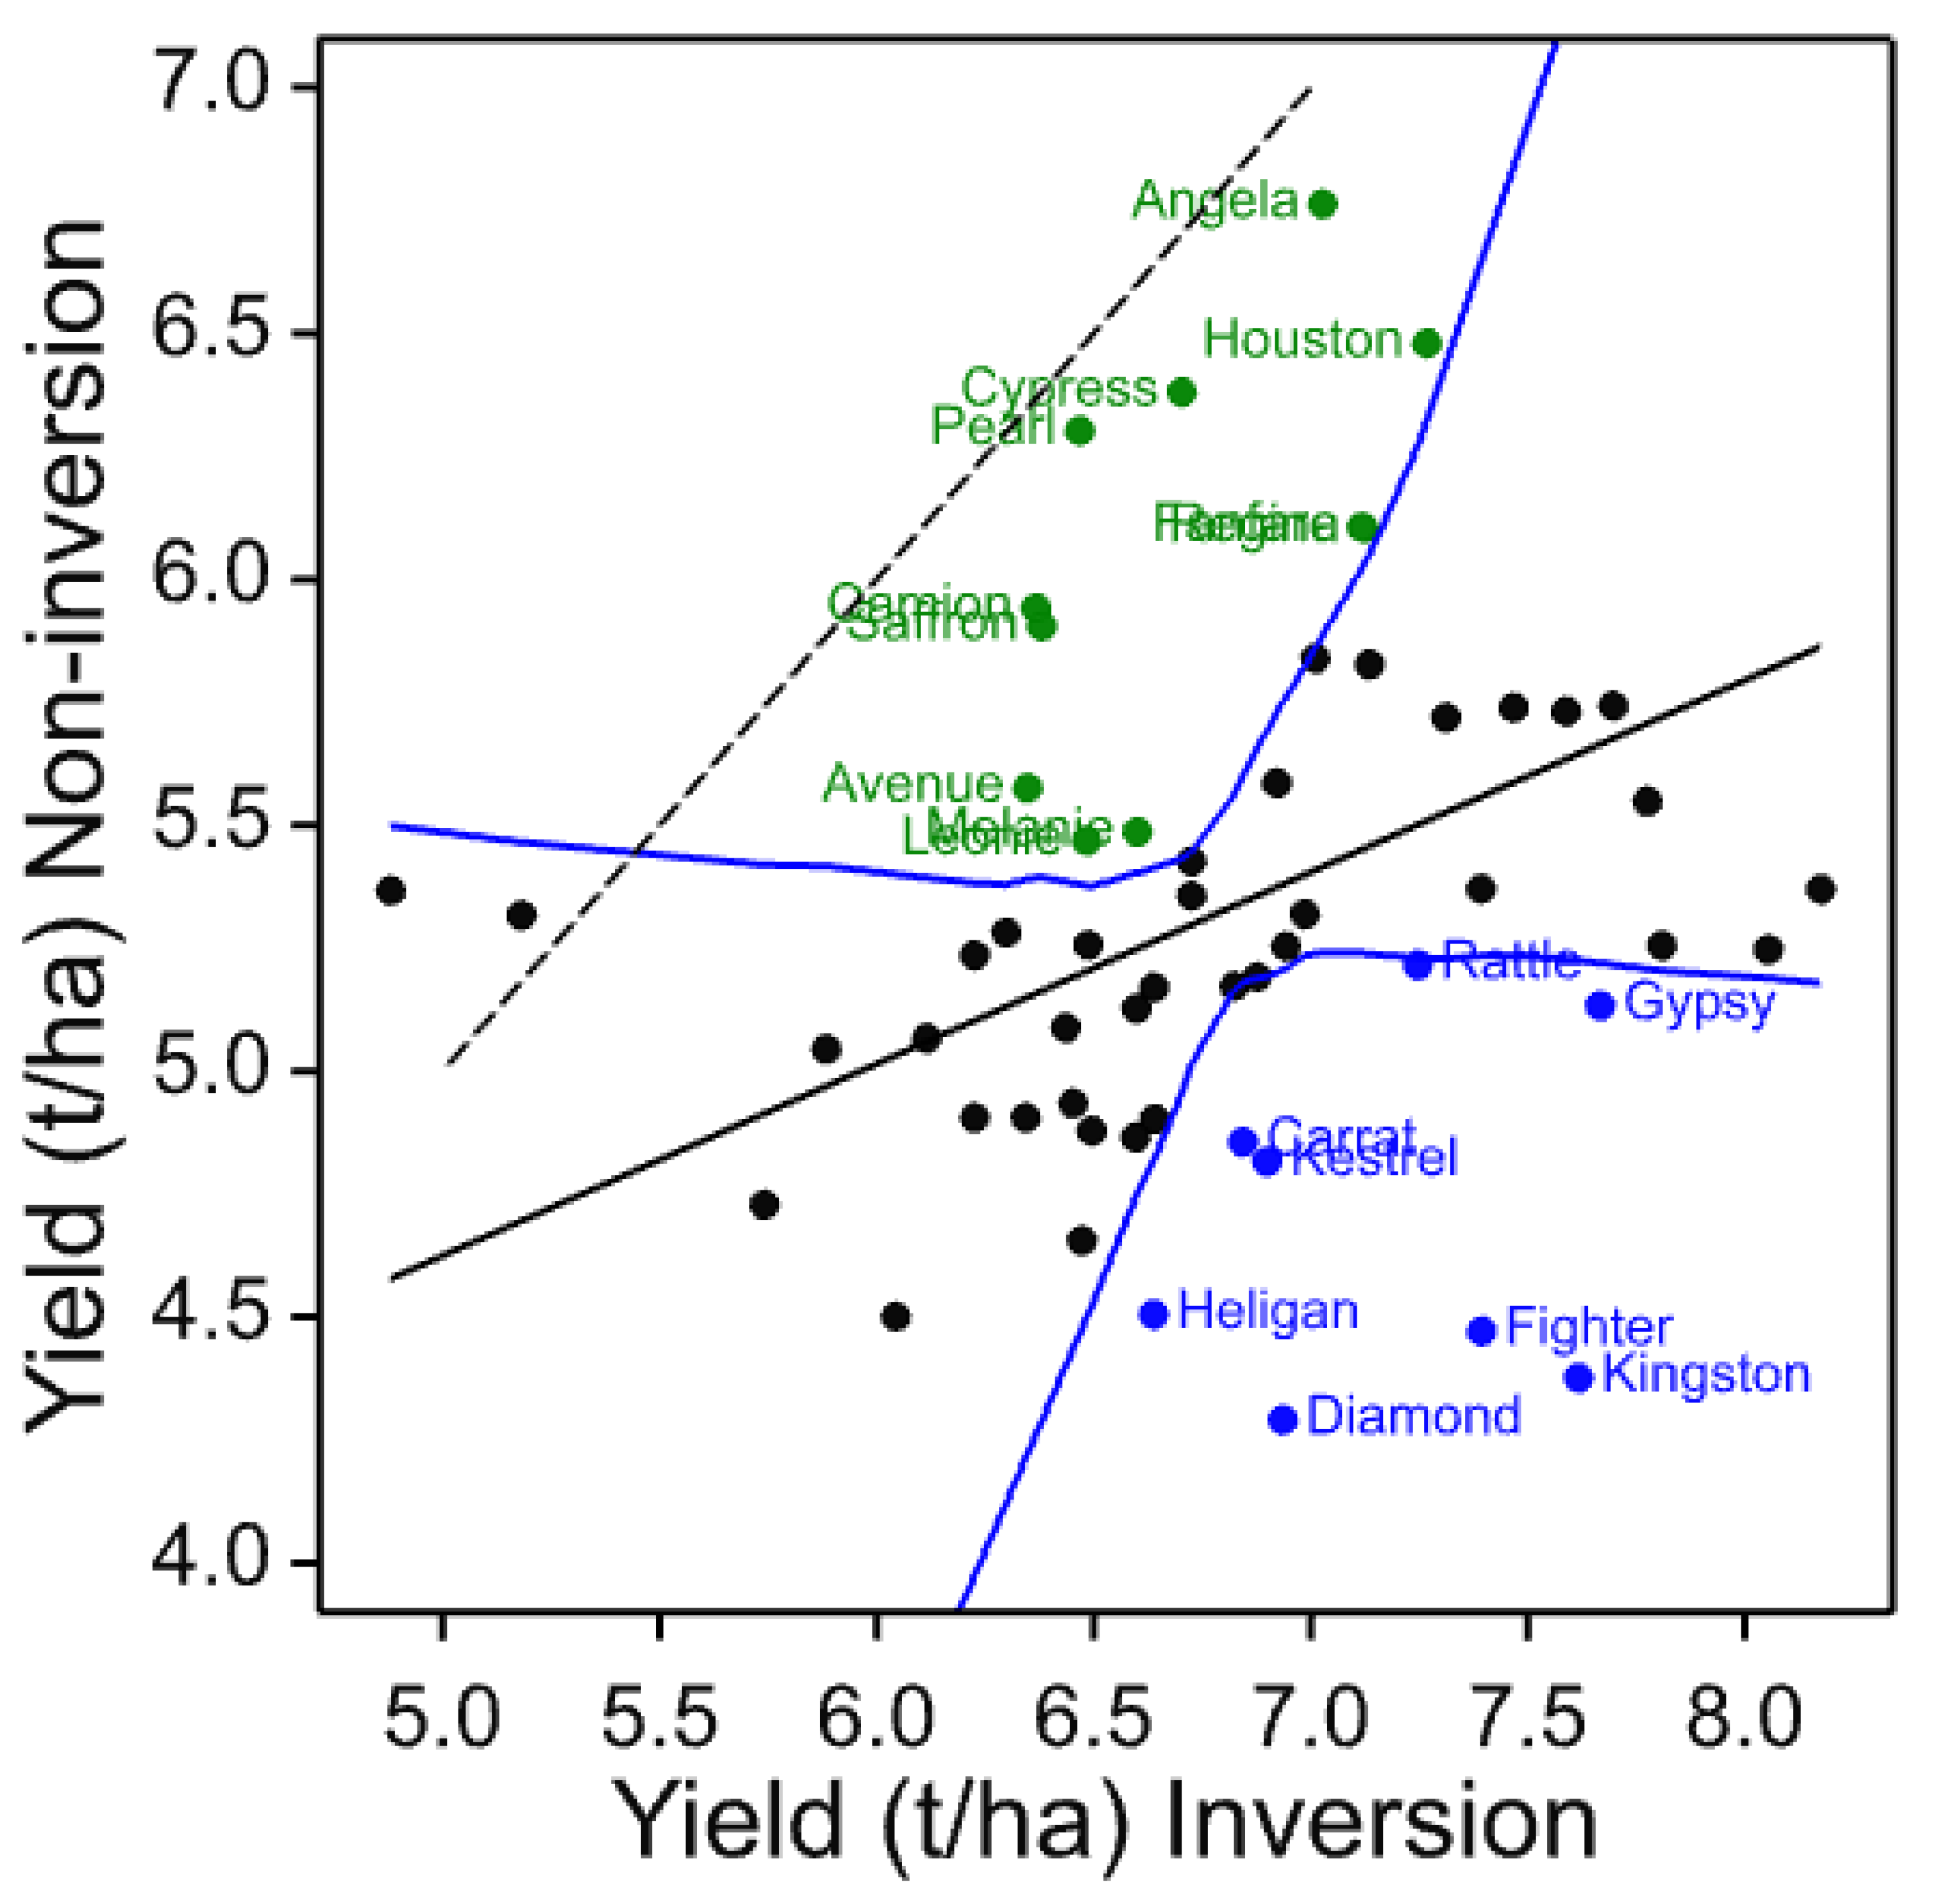
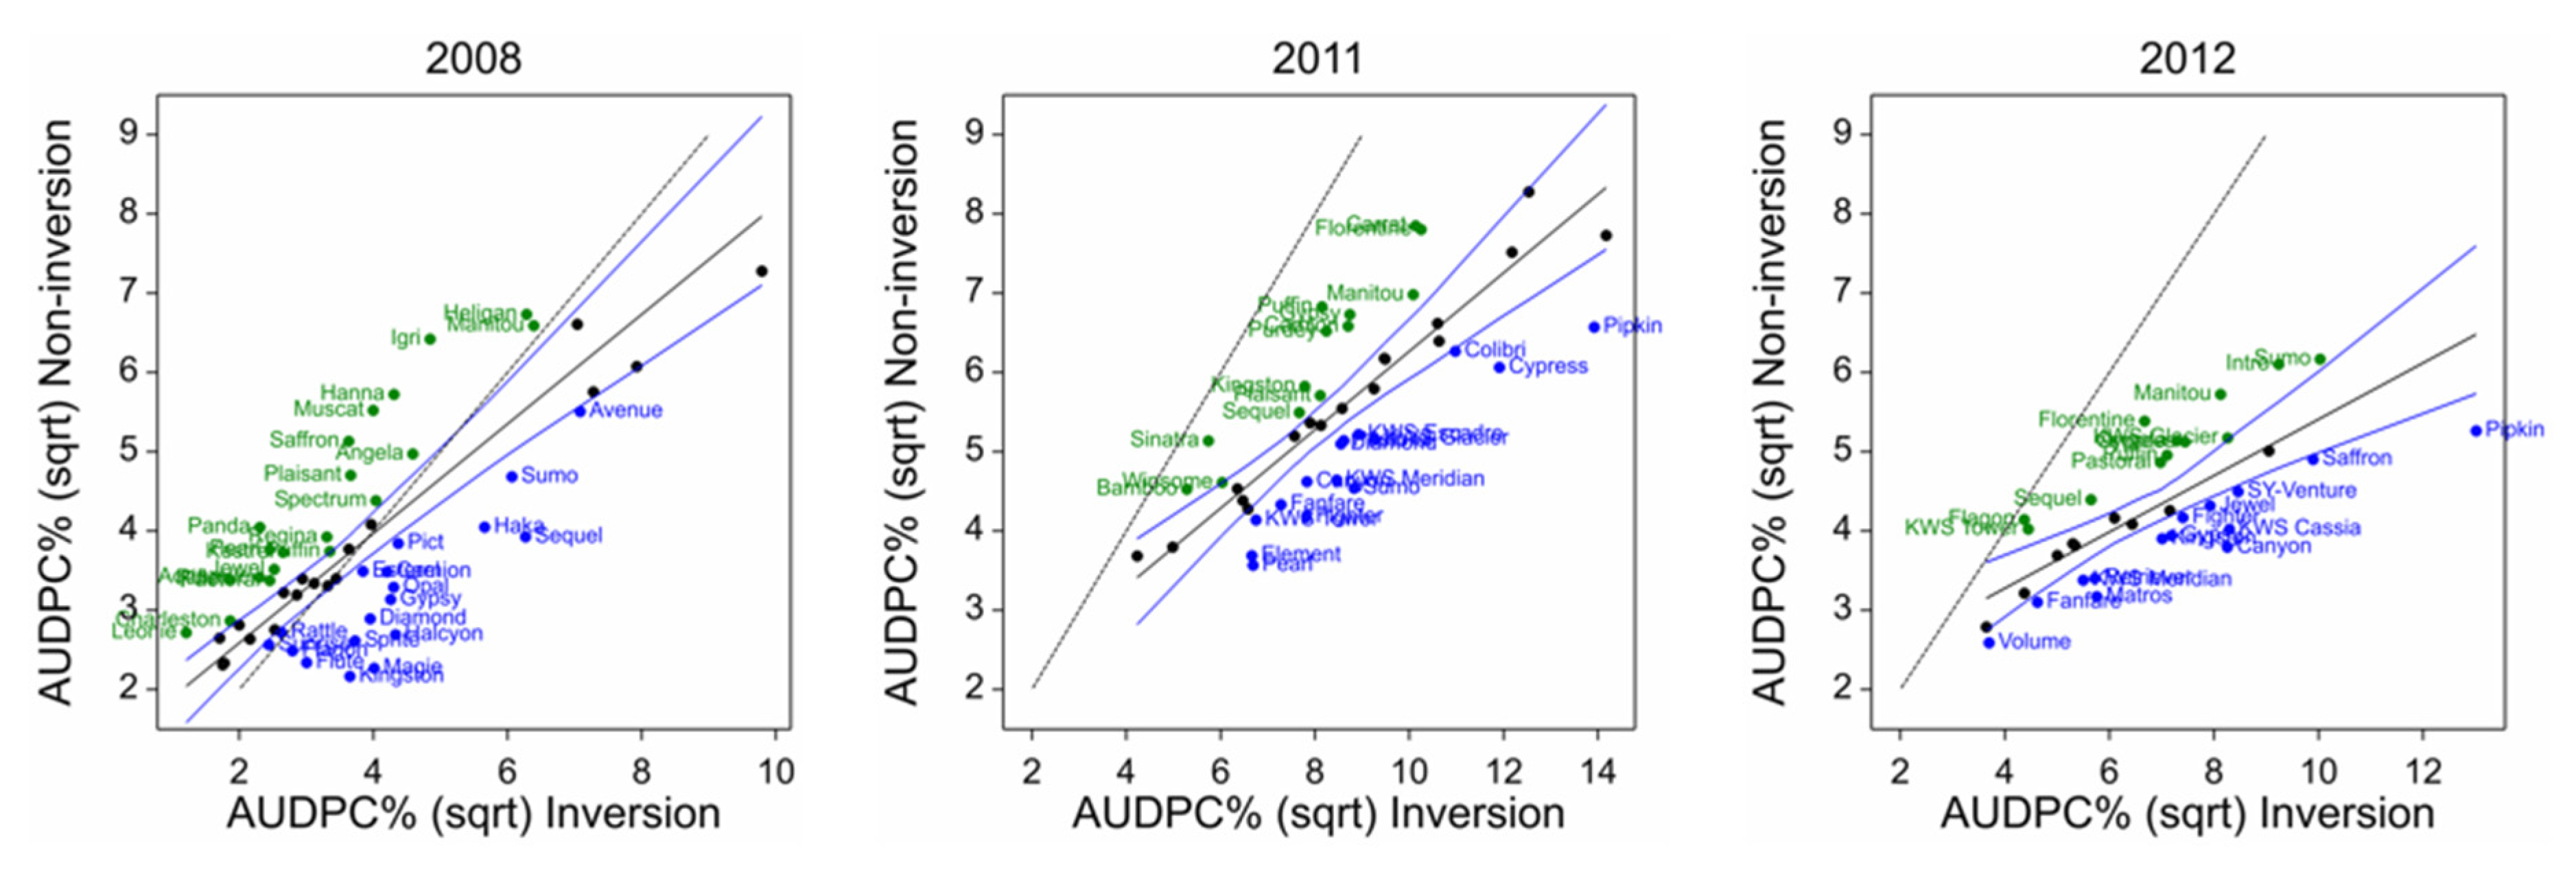
In 2008, there was a significant interaction between cultivar and tillage type (p < 0.001), but no significant yield differences within the tillage types. Some large changes in rank were found; the seven cultivars with the largest rank changes in each direction shifted at least 25 places. (Table 8). These all fall clearly outside the 95% confidence limits of the regression line of non-inversion yield on inversion yield (Figure 9) and are greater than the 95% point of rank changes in the simulation set (Table 9). Thus, Kingston, Fighter, Diamond, Gypsy, Manitou, Jewel and Kestrel are below the confidence limits and show inversion tillage adaptation, whilst Cypress, Puffin, Avenue, Plaisant, Saffron, Pearl and Camion all show non-inversion tillage adaptation.
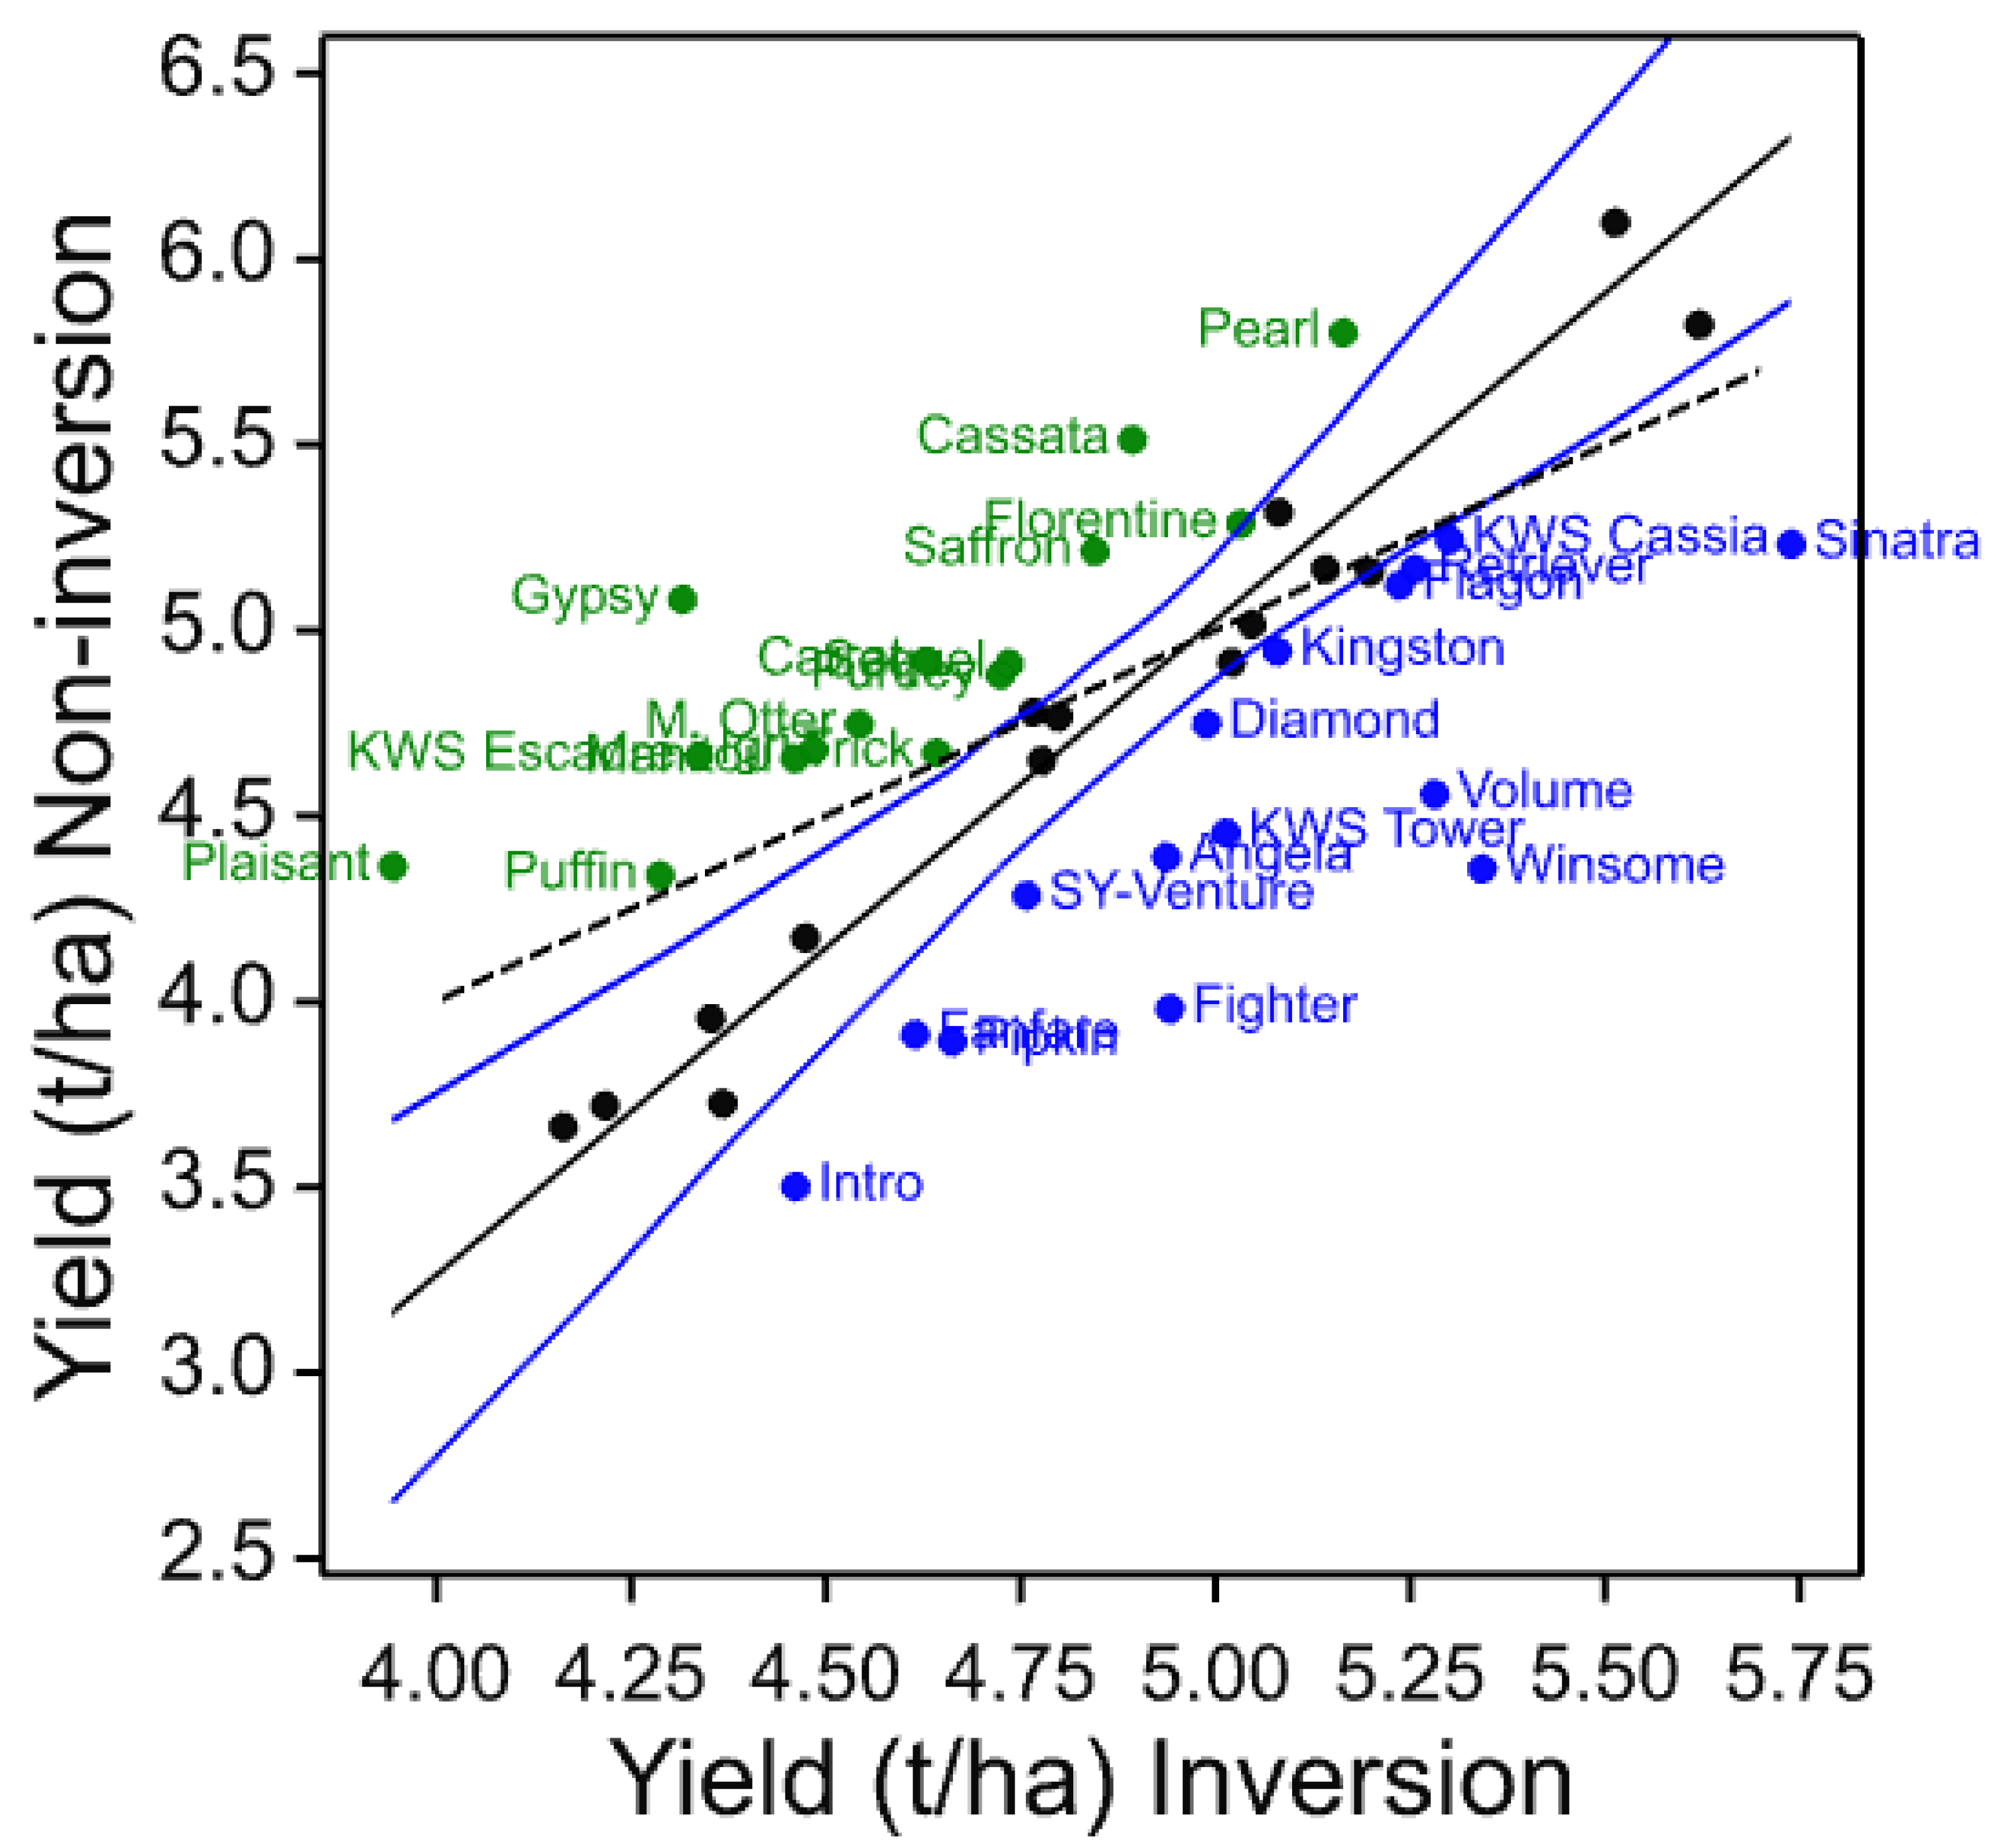
A highly significant interaction was also found between cultivar and tillage type in 2011 (p < 0.001), and again some large changes in rank. Taking the top and bottom six cultivars by rank difference yield changes, which represent a change in rank of at least 12 places for the 45 cultivars in the 2011 trial (Table 10), these all fall clearly outside the 95% confidence limits of the regression line of non-inversion yield on inversion yield (Figure 10) and are likely to be significant ranking changes (Table 11). Thus, Winsome, Volume, Fighter, KWS Tower, Pipkin and Angela all show inversion tillage adaptation, whilst Plaisant, KWS Escadre, Saffron, Carrat, Cassata and Gypsy all show non-inversion tillage adaptation. The same trend of yield difference percentage and tillage adaptation as in 2008 is observed again here, but nearly half of the cultivars show greater yield under non-inversion tillage as clearly shown by the dashed line of equal yields in Figure 10.
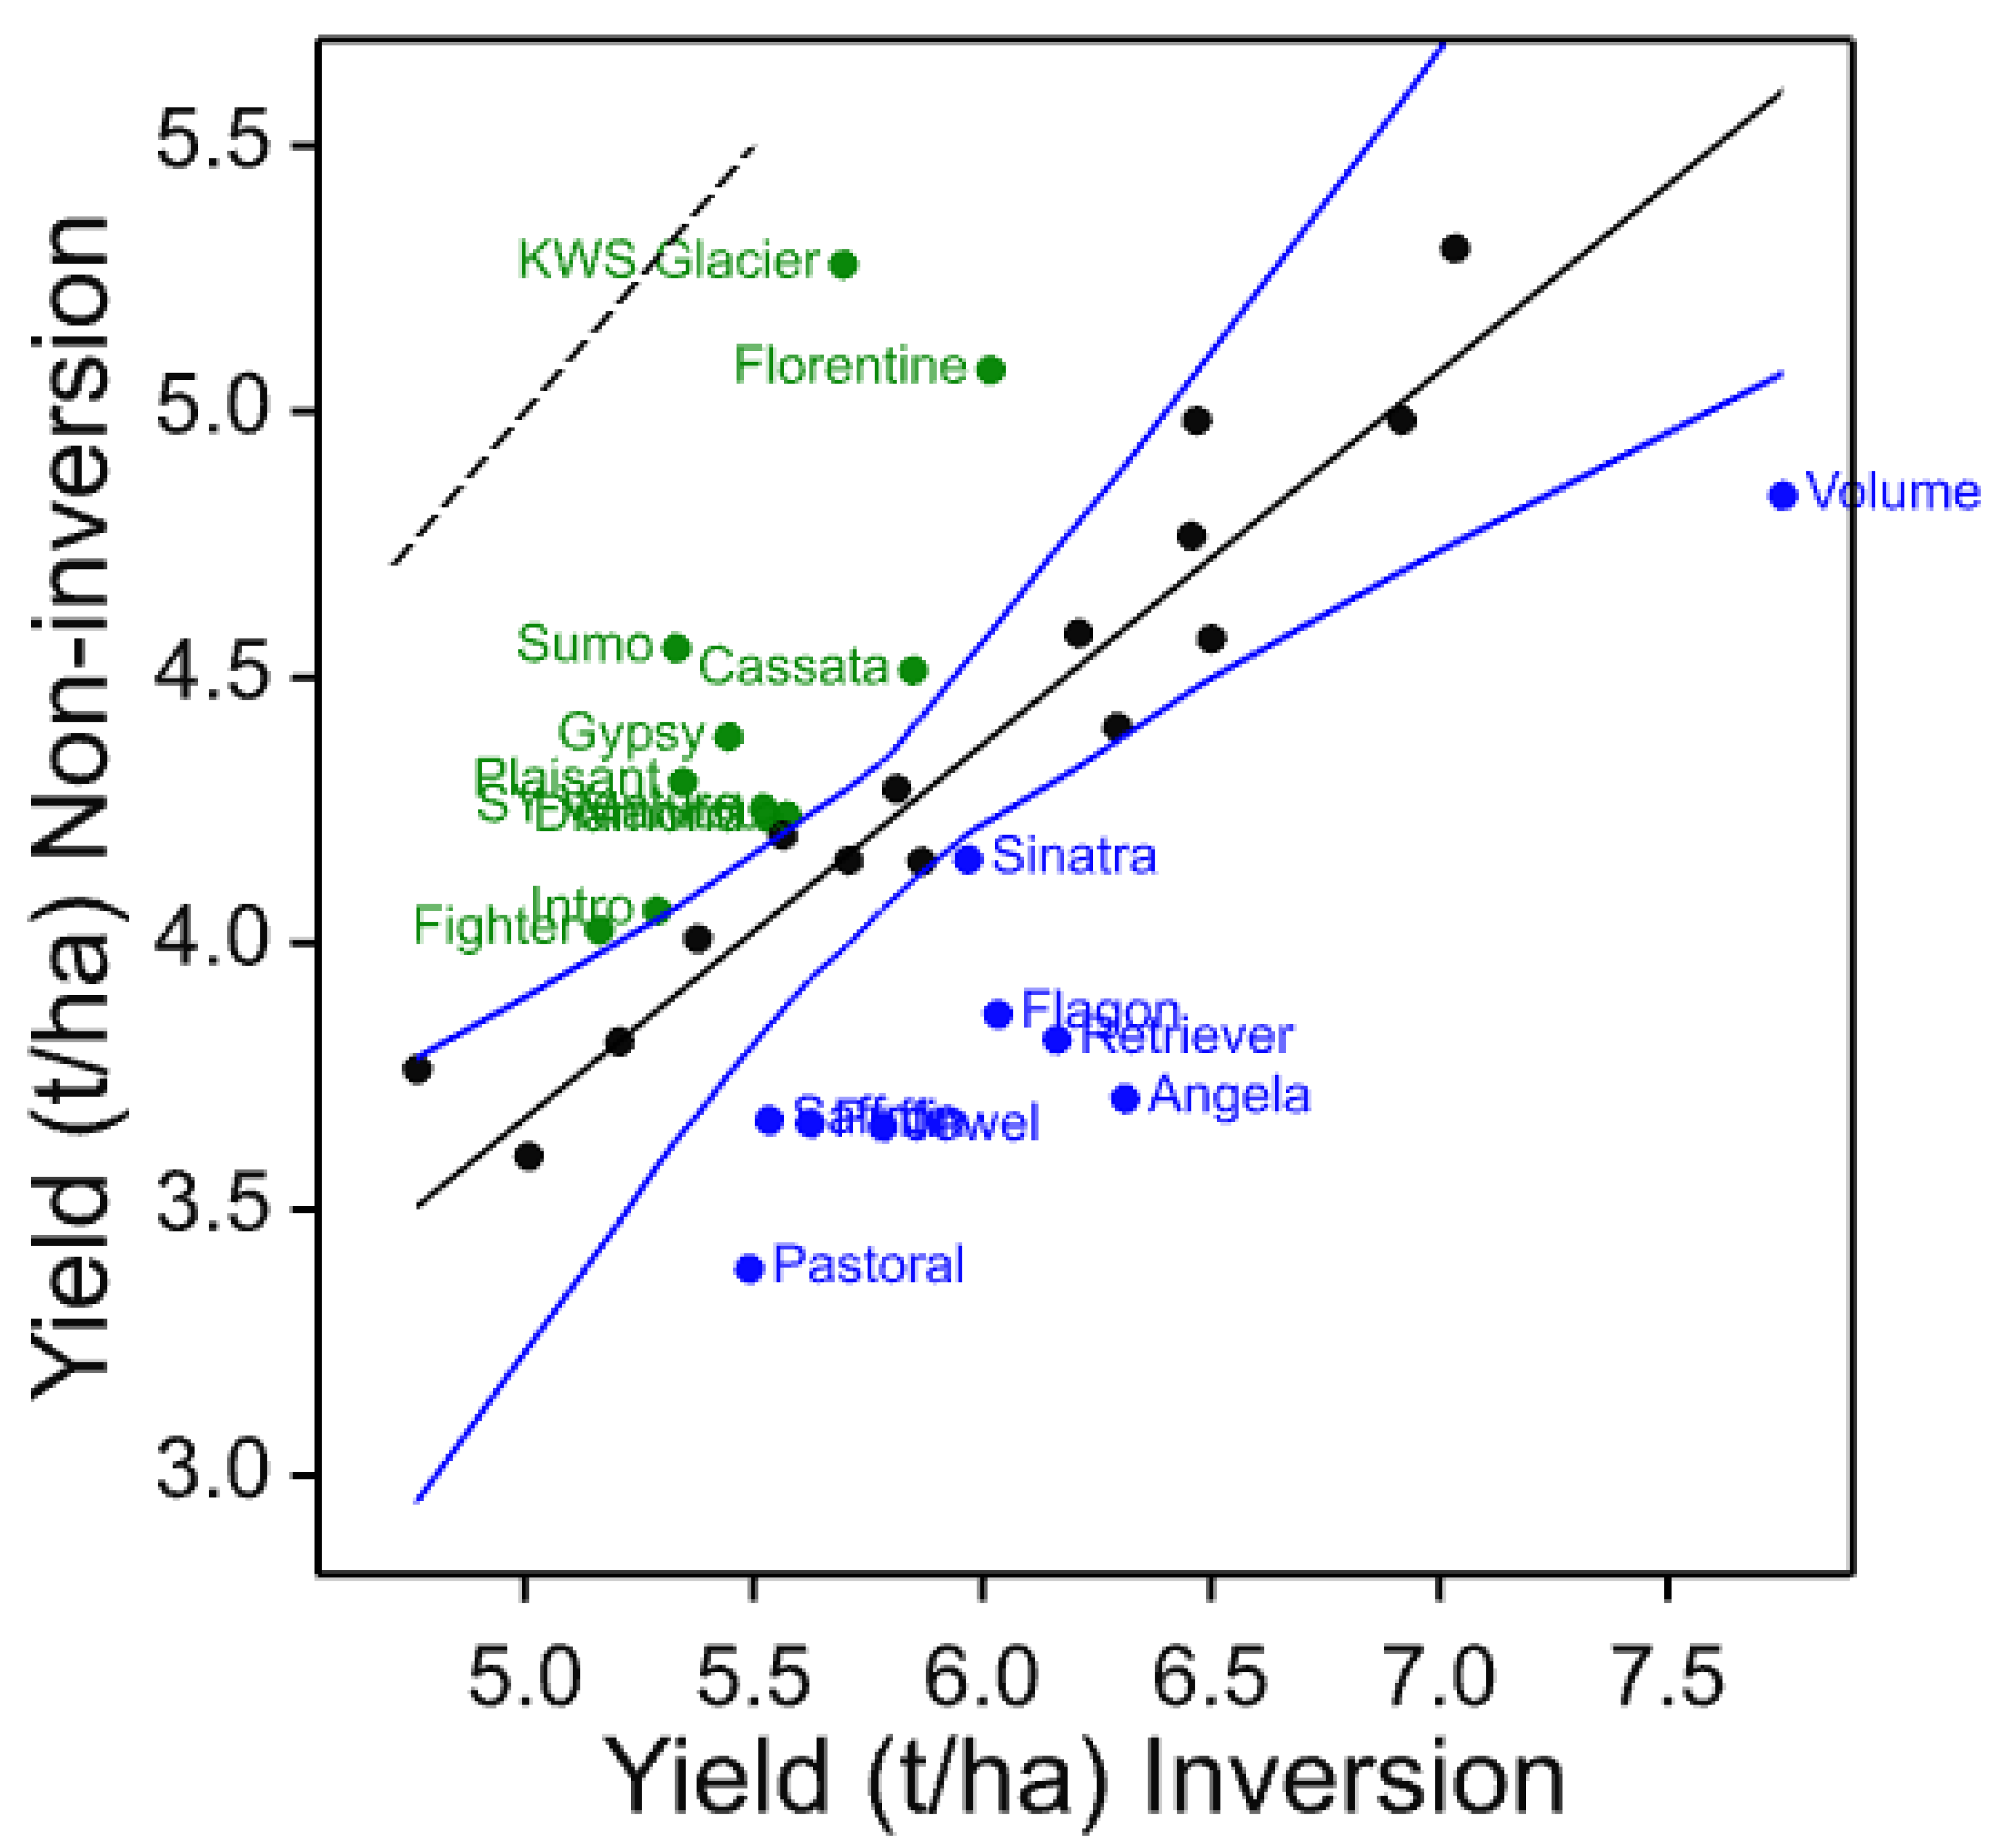
A highly significant interaction was also found between cultivar and tillage type in 2012 (p < 0.001), and again some large changes in rank. Taking the top and bottom four cultivars by rank difference yield changes, which represent at least 14 places for the 35 cultivars in this trial (Table 12), these all fall clearly outside the 95% confidence limits of the regression line of non-inversion yield on inversion yield (Figure 11) and are likely to be significant ranking changes (Table 13). Thus, Angela, Retriever, Jewel and Flagon all show inversion tillage adaptation whilst Sumo, KWS Glacier, Plaisant and Gypsy all show non-inversion tillage adaptation. The trend of yield difference percentage and tillage adaptation is less clear in this trial compared with 2008 and 2011.
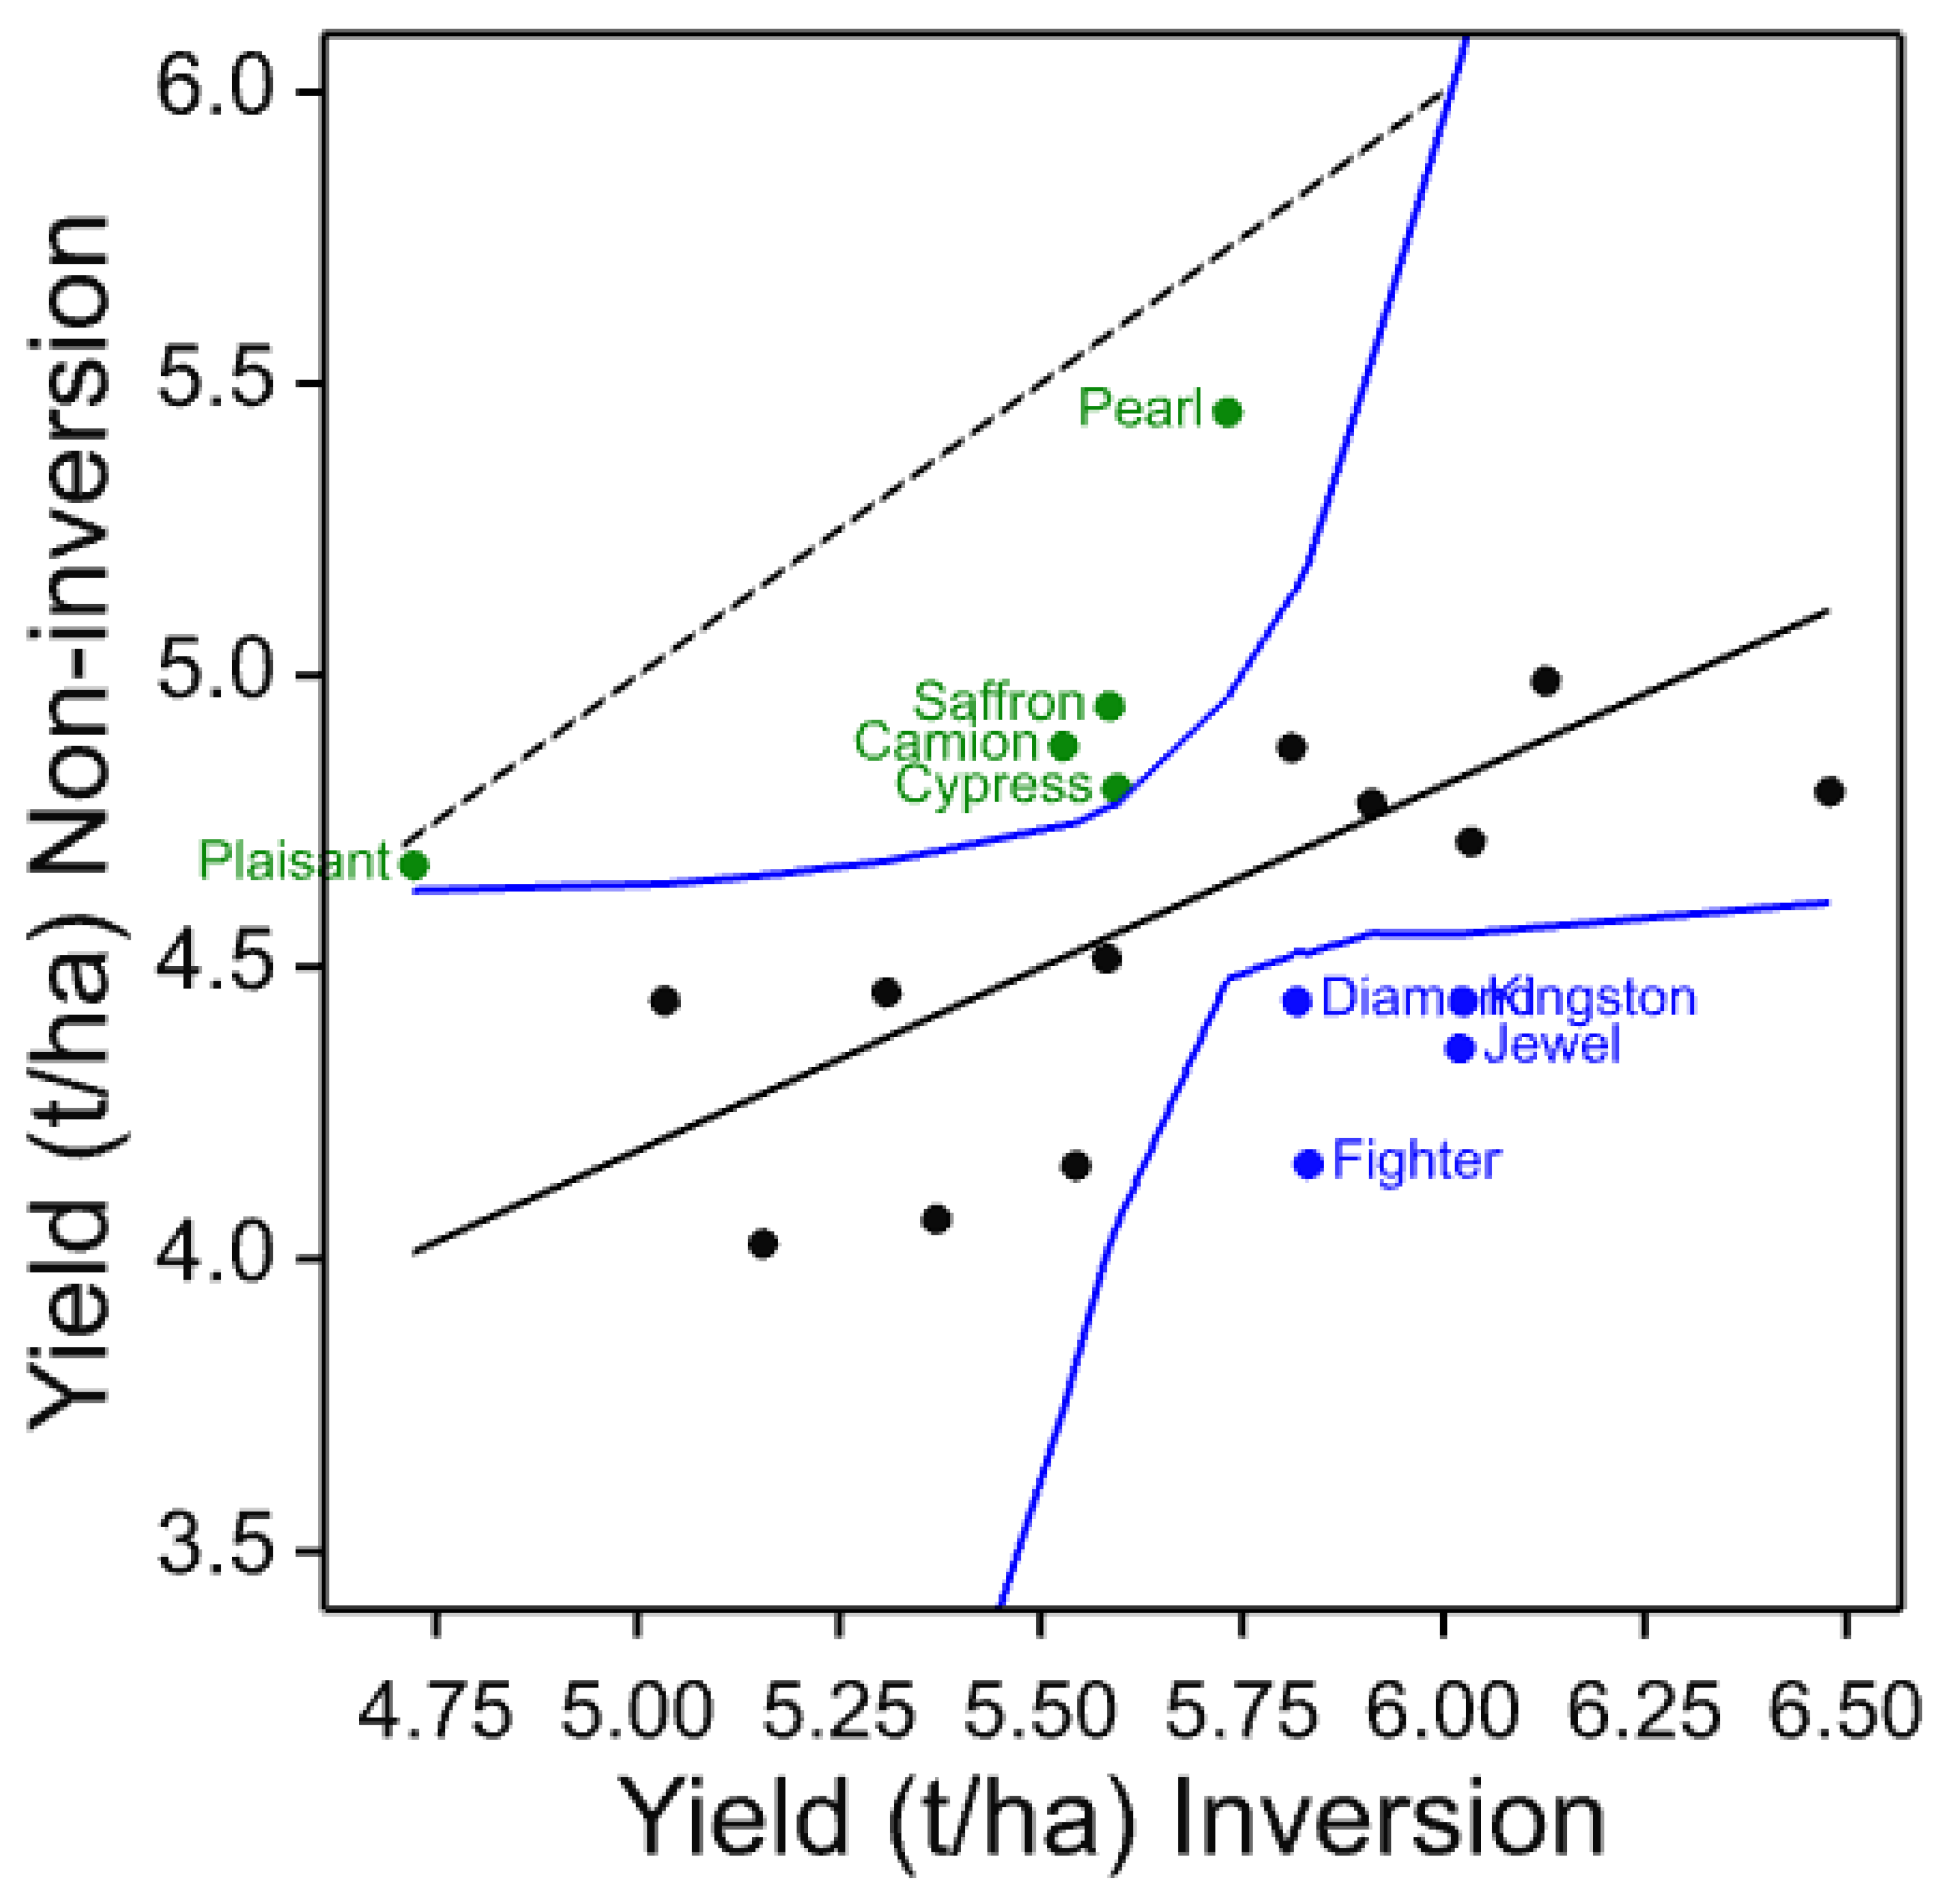
For the common 20 cultivars in 2008, 2011 and 2012 trials, taking the top and bottom four cultivars by rank difference yield changes, which represent at least 7 places (Table 14), these all fall clearly outside the 95% confidence interval of the regression line of inversion yield on non-inversion yield (Figure 12). Thus, Jewel, Fighter, Kingston and Diamond all show inversion tillage adaptation, whilst Camion, Plaisant, Pearl and Saffron all show non-inversion tillage adaptation. These eight cultivars were all present in the 2008 trial and were all in the set identified as strongly adapted to tillage (Table 8), whereas only three were identified as adapted in 2011 (Table 10) and three in 2012 (Table 12); indeed, Plaisant was the only variety identified as strongly non-inversion adapted in all these trials. In addition to the four most strongly adapted cultivars in the common analysis of all three trials (Table 15), Angela and Gypsy are identified as inversion and non-inversion adapted, respectively, in individual trials, and Fighter is noted as being inversion adapted in both of the trials where it was present.
Rhynchosporium was assessed for the 2008, 2011 and 2012 trials and analysed as previously. In 2008, the overall levels of disease were similar under the inversion and non-inversion treatment types, as seen for the set of four cultivars, but there was a significant interaction between cultivars and inversion type (p < 0.001). In 2011 and 2012, the overall levels of disease were higher under the tillage treatment than the non-inversion treatment, and again there were significant interactions with cultivar (p < 0.001). The regression of the %AUDPC (on a square root scale) from the non-inversion on the inversion treatment shows most cultivars close to the line but again several cultivars outside the confidence limits showing more disease under non-inversion or inversion tillage (Figure 13). Cultivars with disease ranking changes of at least 13 places are shown in Table 16, and whilst the absolute differences in ranking changes were again shown to be likely to be significant (data not shown) and there are only 20 cultivars in common across the three trials, there appears to be no consistency in changes in these rankings between years. Likewise, there is no consistency with cultivars identified in Table 6. There appears to be no correlation of tillage effect and susceptibility of cultivars, but in the 2011 and 2012 trials, there was an association of tillage effect with the %AUDPC percentage difference, with the most difference being associated with more disease under inversion tillage and vice versa (Table 16).
3.4. Comparison with Data from the Centre for Sustainable Cropping, Balruddery
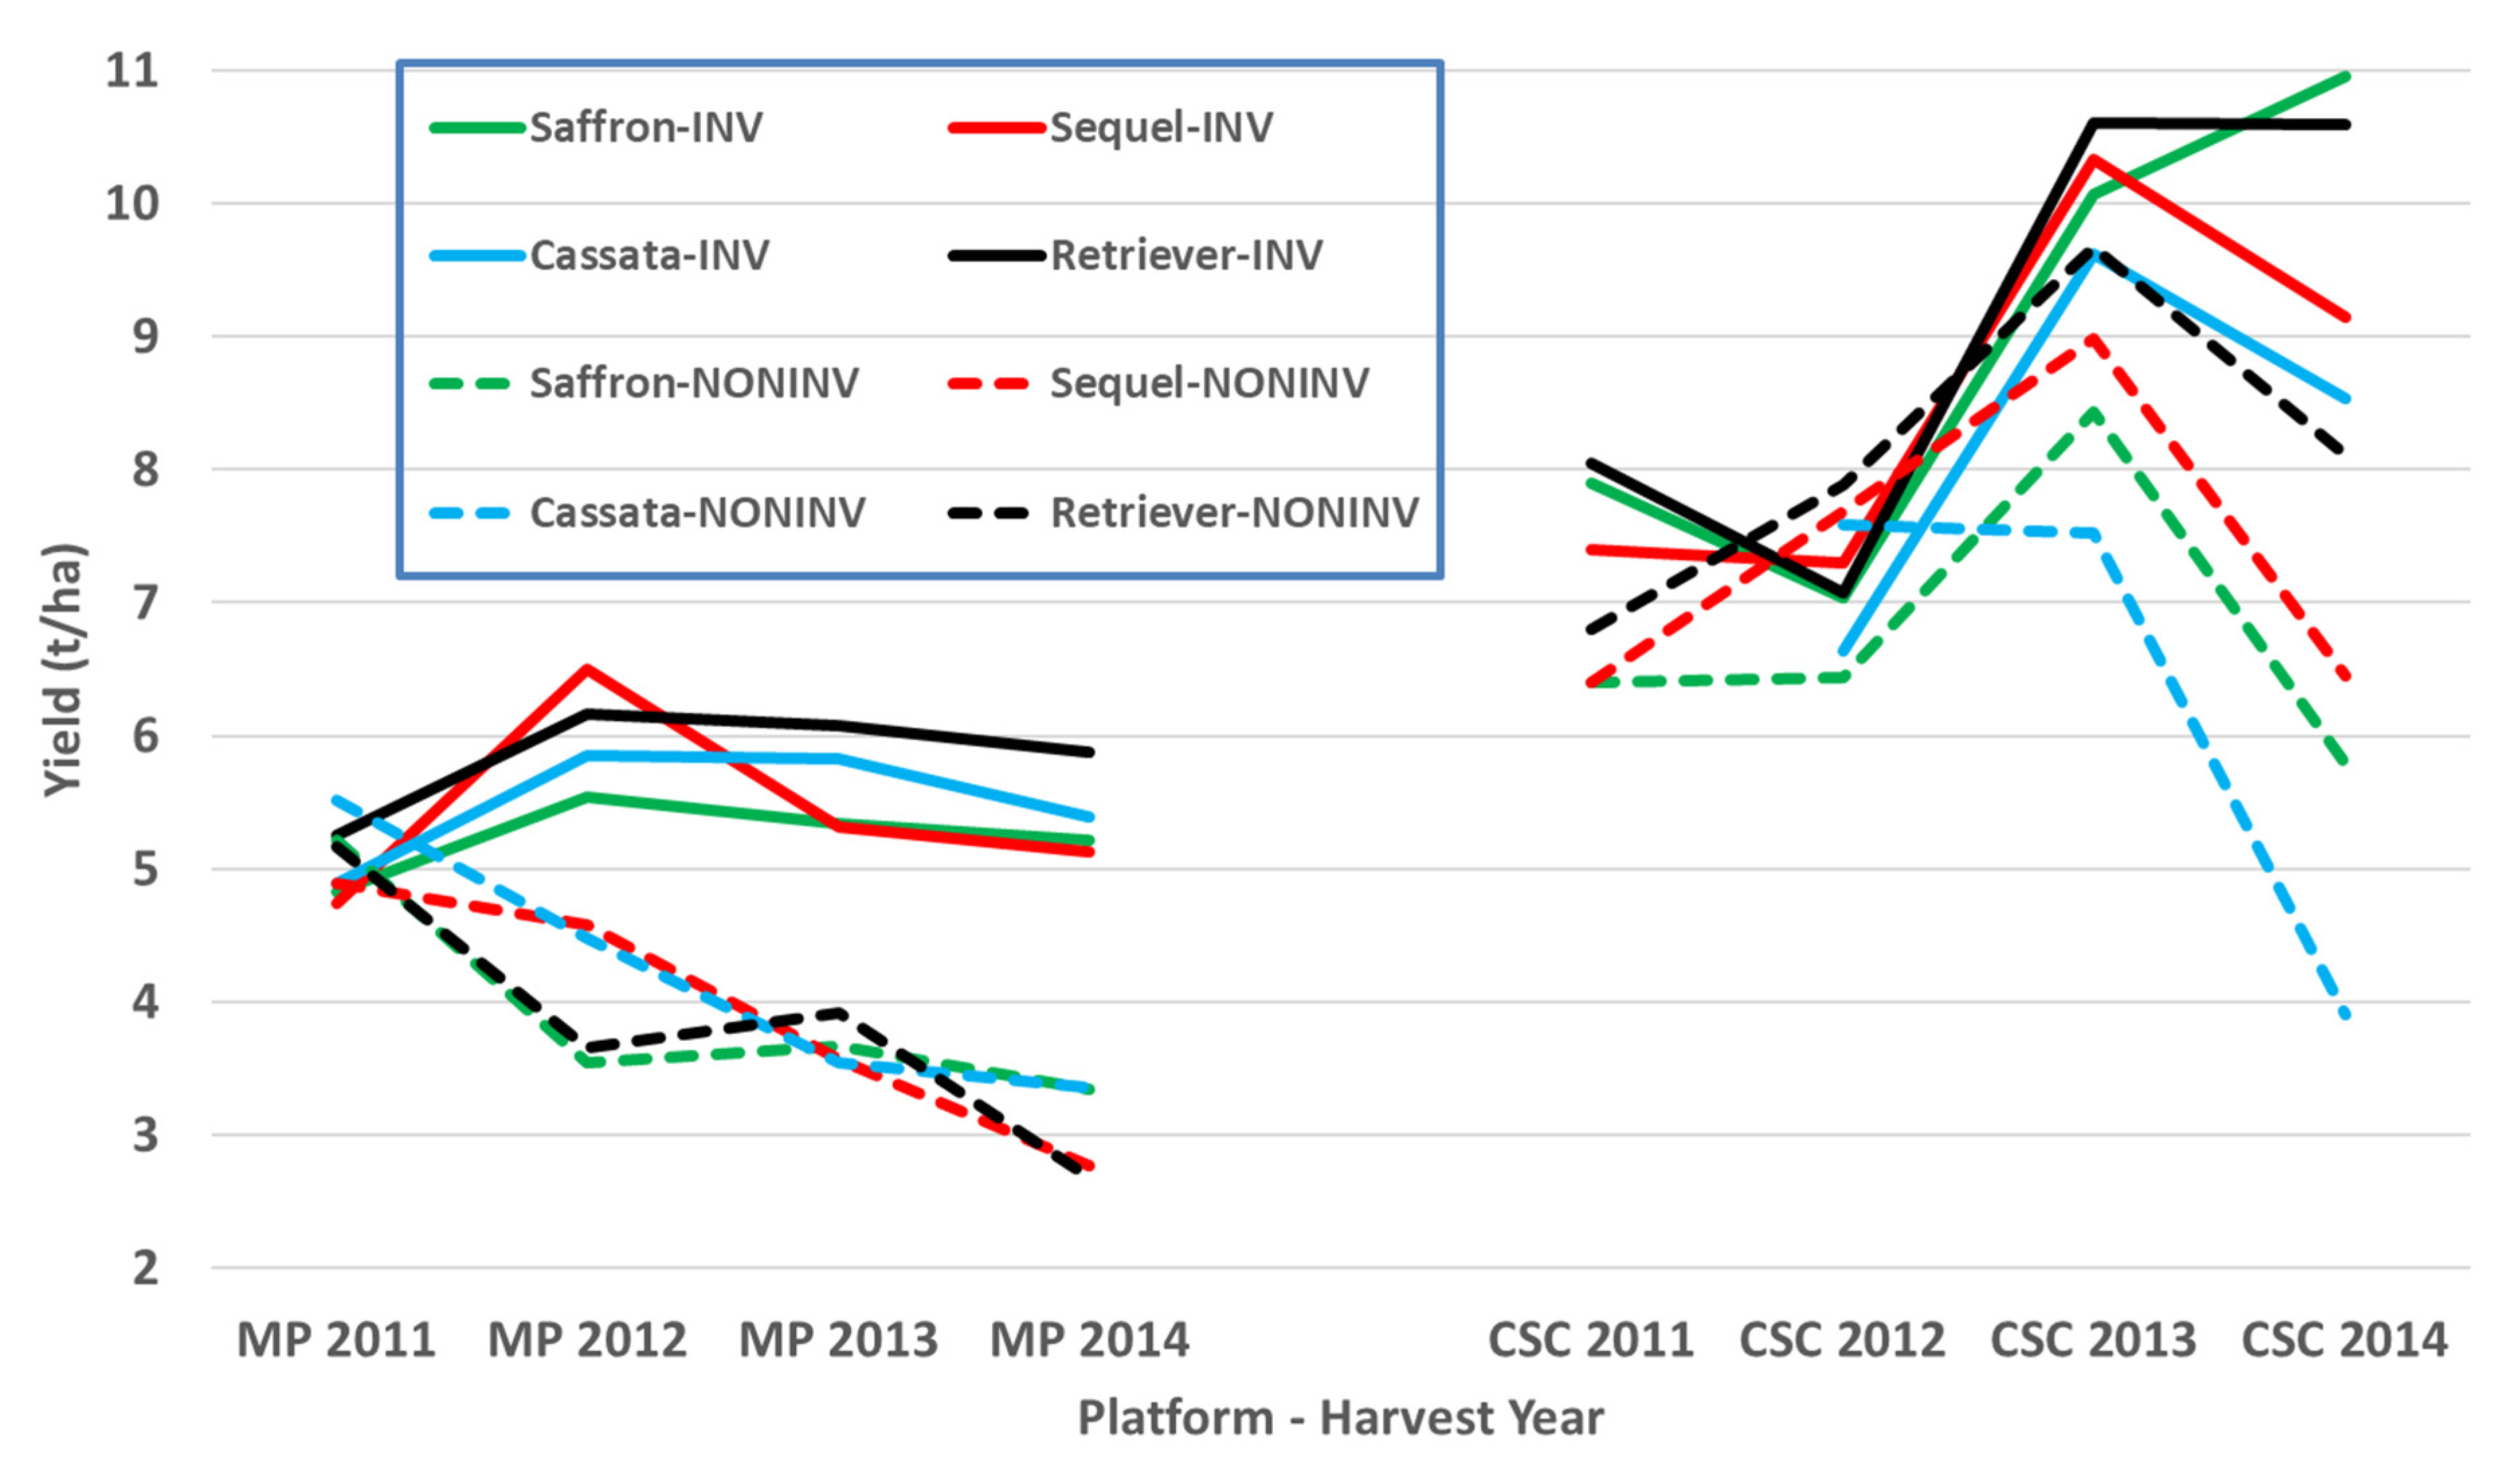
In the Mid Pilmore platform, all four cultivars responded similarly to year and tillage treatments, with no differences in 2011 but decreasing yield under non-inversion tillage from 2012 to 2014 (Figure 14). Retriever gave the highest yield in the inversion tillage (p < 0.05), but the high yield of Cassata in non-inversion tillage was not significantly different from the other cultivars. In the CSC platform, yields were higher overall and there were no statistically significant differences in yield responses to treatments or interaction with cultivar over the course of the first rotation [15]. However, there was a trend towards lower yields in the integrated treatment with non-inversion tillage compared to conventional management and these trends did vary (non-significantly) across varieties: Retriever and Sequel showed the least difference over the rotation between treatments at t/ha less in integrated than conventional; Saffron and Cassata were most negatively affected by cropping systems at closer to 2 t/ha less in integrated, non-inversion tillage than conventional. Whilst direct statistical comparisons cannot be made between the Mid Pilmore and CSC platforms, the differences in tillage response of Cassata and Saffron between the two platforms suggests that differential adaptation to factors in addition to tillage can occur.
4. Discussion
Several cultivars were identified as differentially adapted to either inversion or non-inversion tillage in individual trials, and some of these cultivars performed consistently across several trials. The trials reported here span 10 seasons with contrasting weather patterns and cover the transition from early establishment of the tillage practices through to maturity. In addition, the Mid Pilmore trials were all carried out under continuous barley cropping, so no interactions of other crops with tillage practice need be factored in. Thus, soil microbial populations may be skewed, but this is offset by minimising any effects of differences in previous cropping history. Furthermore, cropping of spring barley for several consecutive years by farmers in the region is not uncommon, but yield depression from continuous growth of the same crop should be considered in data interpretation. However, no differential interaction of different cultivars of barley with continuous barley growing has been detected [18]. Most of the cultivars used were commercially available and recently on the UK AHDB Recommended List at the time of the trial, although these were supplemented with a wider selection from the AGOUEB project [17] representing commercially important historic cultivars in the pedigrees of many current cultivars. Using these trial environments and winter barley cultivars, it is possible to determine whether differential adaptation to tillage occurs, which cultivars show contrasting adaptation and how environmentally robustly the adaptation is expressed with respect to yield and disease resistance.
To aid interpretation of results, the seasonal weather was presented as summary graphs for mean monthly precipitation, days with rain greater than 0.5 mm, sunshine hours and temperature. The first two of these are often correlated as might be expected, but high values of the latter might indicate more sustained or intense rain that may lead to more spore dispersal and infection and, therefore, disease [19]. The latter measurements are less likely to be correlated with disease expression, but more extreme values may have impacts on the general stress state of the plants and, therefore, together with the precipitation data their impact on yield. Notable high and low values for each of these parameters were highlighted for March to June in Table 2 and the precipitation values in particular might be expected to influence the epidemiology of rhynchosporium during these months. However, none of the values highlighted appear to correlate with the disease trends observed and other factors such as the impact of cultivar and cultivation show stronger effects. For more general stress that might impact the effects of cultivation, the exceptionally low level of April precipitation in 2011 is likely to be a factor in the relatively high non-inversion tillage yields in that year as the soil conditions were mature so any advantages of soil structure maintaining water and nutrient supplies to the crops would be realised.
The four core cultivars present in all years and, therefore, compared across them give a picture of both seasonal variation and maturing soil conditions in the cultivation treatments. In these data, the individual trials with more cultivars and in published work with spring barley [3], the three inversion tillage treatments behave very similarly as do the two non-inversion tillage treatments but there is frequently a large contrast between these two groups. This is clearly illustrated in Figure 3 where a clear trend can be noted. There is a general yield decline in the non-inversion tillage as the years progress, but the trend is much smaller and less progressive in the inversion tillage. This is probably due to several factors, some of which are specific to this platform rather than being attributes of non-inversion tillage per se. In this platform and others, soil carbon did not increase in the non-inversion tillage, although its distribution changed [20,21]. Where non-inversion tillage is a part of a systems-based approach, such as conservation agriculture or biodiversity-based cropping [22,23] in place at the CSC platform [16], the contribution of cover crops and other management interventions should lead to enhanced soil quality including carbon content, biophysical structure, microbial activity and related system processes such as litter decomposition and nutrient cycling [24].
Yield decline was not attributable to increased disease as this declined over time (Figure 4) but weed control became increasingly problematic so residual treatment effects may have contributed. However, the greatest effect is probably due to the effects of continuous barley production on this site without break crops. Although this will have affected both tillage types, the lack of soil disturbance has a strong effect on soil microbial community structure, and activity [25] is likely to have enhanced the microbial communities responsible for such effects [26]. The barley-specific yield-depressing effects of continuous barley production on subsequent barley crops have been demonstrated on a site with similar soil close to this tillage platform by direct comparison with a restored soil health rotation [15]. No differential interaction with different cultivars of barley was detected in that work, and we found no other evidence and, therefore, comparisons will be valid from all the years in the experimental series reported here.
The 2006 data appear to break with the overall response difference due to cultivation, but this is explained by the autumn being exceptionally wet. It was possible to access the land to sow the non-inversion tillage treatments at the optimum time, but the inversion tillage treatments were sown late under suboptimal conditions, and these then suffered poor establishment and a yield reduction that clearly explains this departure from the trend. The 2009 exception is in the high minimum tillage yield season, and six years after establishment we might expect any benefits of maturing soil structure to show most strongly. The meteorological data showed that in March and May 2009, the highest monthly sunshine hours were recorded which could have caused stress alleviated by benefits of this soil structure and biology maturity to crop development.
A strong trend in the rhynchosporium %AUDPC data is also seen with respect to inversion and non-inversion tillage over the years, with all four core set cultivars responding similarly. In the early years, there was either more disease on the non-inversion tillage or little difference between the tillage practices followed by a period of variable responses through to very clearly lower rhynchosporium levels in the non-inversion tillage treatments in later years. The lack of progression in 2006 is likely due to the late sowing of the inversion tillage plots that year affecting canopy development and thereby epidemiological conditions, but the progression is otherwise clear. The explanation for this progressive transformation is likely to be that much more rhynchosporium inoculum is retained on the surface plant debris in the non-inversion tillage ready to infect the developing plants, whereas this is buried in the inversion tillage treatments. Under favourable epidemiological conditions occurring early in the season, this factor has more impact than later in the season [27]. It is common knowledge that rhynchosporium can be a serious issue in second year barley in direct drill or conservation tillage (Doug Christie, Durie Farms; and unpublished data). However, as with other pathogens such as eyespot [8,9], antagonists are thought to build up, which attenuates the inoculum reservoir issue as the microbial ecology of the soil surface environment matures. However, non-inversion yield generally declined across the years too, affecting crop development, the microclimate of the canopy and the nutrient and defence primed status of the crop that may account for some of the differences too.
Rhynchosporium in other cultivars in the various trials from 2008 also showed little clear differential response to cultivation treatment. Although some ranking changes were significant, there was no consistency in the ranking between the common set from 2011 to 2014 or individual years (Table 6 and Table 16, Figure 8 and Figure 13). The cultivars at the disease-cultivation ranking extremes are not correlated with the yield or tillage adaptation for yield. Kingston and Flagon show positive rank difference in the 2008 trial but negative rank difference in the 2011 and 2012 trials, respectively. Therefore, we can conclude that there is no evidence of any direct link between cultivar and tillage with respect to tillage-disease interaction.
Both the Mid-Pilmore and CSC platforms compared inversion tillage with non-inversion tillage, but the former had only barley, whereas the CSC had a 6-course rotation. By the 2011–2014 period, the Mid Pilmore platform was starting to show yield depression in the non-inversion tillage, whereas the CSC platform was less mature in its development. Due to year-on-year replication of yield data in the CSC, no statistical comparison could be made between the two platforms. However, seed for both the Mid Pilmore and the CSC platforms for the same four cultivars used in four consecutive years was sourced from the same seed batch from the same merchant to that this was not a source of variation for comparing observations of cultivar performance in the two platforms. Similar differential response of the cultivars would indicate that tillage is likely to be the main factor influencing cultivar adaptation, whilst a difference in the differential response might also indicate the importance of interaction with other agronomic factors. However, there was no significant differential cultivar response to the treatments in the CSC platform, and only Retriever in the Mid Pilmore platform inversion tillage was significantly higher yielding than the other three cultivars. Nevertheless, this comparison indicates that cultivar comparisons are likely to be robust across systems contrasting in diversity due to rotation differences.
In individual trials, cultivars were identified that clearly show differential yield responses to inversion and non-inversion tillage that are very likely to represent significant yield ranking changes. However, there are also cultivars that are identified as strongly adapted in only individual trials. This is not unexpected if adaptation is attributable to multiple traits each with different environmental interactions as environmental stress was very different each year. Ranking change is dependent on both the number of entries in the trial, the absolute yield differences in each year, and the range represented by the entries chosen. Furthermore, year-to-year differential responses of each cultivar are compounded when trials are analysed together such as the core set and the 2011–2014 common set. Nevertheless, these results do indicate that some cultivars are differentially adapted to cultivation treatments. To identify the traits responsible for tillage adaptation, it is, therefore, necessary to identify cultivars showing differential responses under single or multiple environments and to characterise their trait responses. Thus, to those cultivars which respond most strongly and consistently across years could be added the most strongly adapted in individual years (Table 15). These represent a set of 11 cultivars of winter barley likely to express traits that contribute to tillage adaptation that can be characterised in more detailed trials and associated with mechanisms and heritable markers for breeding. Others might be included such as Volume as it is a hybrid cultivar claimed to have enhanced vigour, particularly in rooting, and therefore, might be expected to be more strongly interactive with cultivation. Volume was identified in the 2011 trial as inversion tillage adapted.
Previous work identified comparable cultivars of spring barley showing differential adaptation to tillage and limited data pointed to rooting traits such as root hairs as being amongst those potentially responsible such adaptation [3]. Early vigour is commonly suggested as another criterion, and we have evidence that pull-out force that might characterise several possible root structure traits correlates with possible tillage adaptation (Newton and Bengough, unpublished data). However, more comprehensive growth analyses associated with cultivation treatments and yield assessments on a limited number of cultivars expressing that clear tillage adaptation differences are needed to establish which trait combinations are desirable, and what the trade-offs might be.
As these trial data do not include cultivars that have come to market in recent years, none of the 11 cultivars highlighted are commonly grown currently. However, the results presented here have demonstrated the scope for testing varietal responses to non-standard, alternative and on-farm type of growing conditions. As non-inversion and low-input systems become more prevalent with the increased pressure for sustainable production, there is an urgent need for information on crop performance under these conditions. Screening of cultivars specifically for low-input reduced tillage systems will provide growers with a choice of material that would allow improved production efficiency and financial sustainability whilst minimising the negative effects of conventional high input systems on the environment. These might include not only current cultivars on recommended lists but also candidate, heritage and other novel cultivars. It could be argued that our non-inversion tillage treatment may equate to, or serve as a proxy for, suboptimal agronomy for some on-farm conditions. If the inversion tillage conditions used in these trials equate to near-optimal conditions of official national or Recommended List trials, then the data reported here provide evidence that choice of cultivars should also consider the level of inputs and agronomic treatments, at least for cultivations.
5. Conclusions
Clear significant ranking changes are reported for commercial cultivars of winter barley for yield response to non-inversion or inversion tillage. Cultivar responses varied from year to year, probably reflecting the weather differences that resulted in different stresses. Nevertheless, some cultivars showed consistent adaptation trends across trials and are likely to be valuable lines for identification of the range of traits responsible for tillage adaptation under a range of stress conditions. Rhynchosporium disease levels changed from being higher in non-inversion tillage to much lower as the tillage platform matured under continuous barley but showed no consistent cultivar differences.
Supplementary Materials
The following are available online at https://0-www-mdpi-com.brum.beds.ac.uk/2073-4395/11/1/30/s1, Figure S1: Mean monthly precipitation for Mid Pilmore from 2003 to 2014. Red and black arrows indicate notable high or low rainfall months–years, respectively. Figure S2. Mean monthly days with rain >5.0 mm for Mid Pilmore from 2003 to 2014. Red and black arrows indicate notable high or low rain >5.0 mm days–months–years, respectively. Figure S3. Mean monthly sunshine hours for Mid Pilmore from 2003 to 2014. Red and black arrows indicate notable high or low sunshine hours–months–years, respectively. Figure S4. Mean monthly air temperature maximum for Mid Pilmore from 2003 to 2014. Red and black arrows indicate notable high or low maximum value months–years, respectively.
Author Contributions
A.C.N. conceived and designed the experiments; C.H. managed the CSC platform, provided the yield data from this and reviewed the manuscript; C.A.H. carried out the statistical analysis reported and contributed substantially to writing the manuscript, A.C.N. coordinated the project and wrote most of the manuscript. All authors have read and agreed to the published version of the manuscript.
Funding
The research was funded by the Scottish Government Rural and Environment Science and Analytical Services (RESAS) Strategic Research funding to the James Hutton Institute.
Institutional Review Board Statement
Not applicable.
Informed Consent Statement
Not applicable.
Data Availability Statement
The data presented in this study are available on request from the corresponding author.
Acknowledgments
This study was made possible thanks to the Scottish Government funding the establishment of the Mid Pilmore Cultivation platform in previous years and continued funding under its Strategic Research Programme. We are grateful for the excellent technical input from Dave Guy across all these trials and the farm team, especially Derek Matthew. We also thank all the colleagues who worked on other aspects of the Mid Pilmore platform acknowledged in the cited papers below.
Conflicts of Interest
The authors declare no conflict of interest.
References
- Townsend, T.J.; Ramsden, S.J.; Wilson, P. How do we cultivate in England? Tillage practices in crop production systems. Soil Use Manag. 2016, 32, 106–117. [Google Scholar] [CrossRef] [PubMed] [Green Version]
- Newton, A.C.; Guy, D.; Preedy, K. Wheat cultivar yield response to some organic and conventional farming conditions and the yield potential of mixtures. J. Agric. Sci. 2017, 1045–1060. [Google Scholar] [CrossRef]
- Newton, A.C.; Valentine, T.A.; McKenzie, B.M.; George, T.S.; Guy, D.C.; Hackett, C.A. Identifying spring barley cultivars with differential response to tillage. Agronomy 2020, 10, 686. [Google Scholar] [CrossRef]
- George, T.S.; Brown, L.K.; Newton, A.C.; Hallett, P.D.; Sun, B.H.; Thomas, W.T.B.; White, P.J. Impact of soil tillage on the robustness of the genetic component of variation in phosphorus (P) use efficiency in barley (Hordeum vulgare L.). Plant Soil 2011, 339, 113–123. [Google Scholar] [CrossRef] [Green Version]
- Goswami, R.S.; Kistler, H.C. Heading for disaster: Fusarium graminearum on cereal crops. Mol. Plant Pathol. 2004, 5, 515–525. [Google Scholar] [CrossRef] [PubMed]
- Brooks, D.H.; Dawson, M.G. Influence of direct-drilling of winter wheat on incidence of take-all and eyespot. Ann. Appl. Biol. 1968, 61, 57–64. [Google Scholar] [CrossRef]
- Yarham, D.J.; Norton, J. Effects of cultivation methods on disease. In Strategies for the Control of Cereal Disease; Jenkyn, J.F., Plumb, R.T., Eds.; Blackwell Scientific Publications: Oxford, UK, 1981. [Google Scholar]
- Burnett, F.J.; Hughes, G. The Development of a Risk Assessment Method to Identify Wheat Crops at Risk from Eyespot; Home-Grown Cereals Authority: London, UK, 2004. [Google Scholar]
- Jalaluddin, M.; Jenkyn, J.F. Effects of wheat crop debris on the sporulation and survival of Pseudocercosporella herpotrichoides. Plant Pathol. 1996, 45, 1052–1064. [Google Scholar] [CrossRef]
- Turkington, T.K.; Xi, K.; Clayton, G.W.; Burnett, P.A.; Klein-Gebbinck, H.W.; Lupwayi, N.Z.; Harker, K.N.; O’Donocan, J.T. Impact of crop management on leaf diseases in Alberta barley fields, 1995–1997. Can. J. Plant Pathol. 2006, 28, 441–449. [Google Scholar] [CrossRef]
- Newton, A.C.; Guy, D.C.; Bengough, A.G.; Gordon, D.C.; McKenzie, B.M.; Sun, B.; Valentine, T.A.; Hallett, P.D. Soil tillage effects on the efficacy of cultivar and their mixtures in winter barley. Field Crop. Res. 2012, 128, 91–100. [Google Scholar] [CrossRef]
- AHDB. Agriculture and Horticulture Development Board Recommended Lists for Cereals and Oilseeds 2016/17; Agriculture and Horticulture Development Board: Stoneleigh, UK, 2016. [Google Scholar]
- Newton, A.C.; Hackett, C.A. Subjective components of mildew assessment on spring barley. Eur. J. Plant Pathol. 1994, 100, 395–412. [Google Scholar] [CrossRef]
- VSN International. Genstat for Windows, 20th ed.; VSN International: Hemel Hempstead, UK, 2019. [Google Scholar]
- Hawes, C.; Alexander, C.J.; Begg, G.S.; Iannetta, P.P.M.; Karley, A.J.; Squire, G.R.; Young, M. Plant responses to an integrated cropping system designed to maintain yield whilst enhancing soil properties and biodiversity. Agronomy 2018, 8, 229. [Google Scholar] [CrossRef] [Green Version]
- Hawes, C.; Young, M.W.; Banks, G.; Begg, G.S.; Christie, A.; Iannetta, P.P.M.; Karley, A.J.; Squire, G.R. Whole-Systems analysis of environmental and economic sustainability in arable cropping systems: A case study. Agronomy 2019, 9, 438. [Google Scholar] [CrossRef] [Green Version]
- Thomas, W.; Mackay, I.; Comadran, J.; Ramsay, L.; Shaw, P.; Marshall, D.; Newton, A.; O’Sullivan, D.; Cockram, J.; Bury, P.; et al. Association Genetics of UK Elite Barley (AGOUEB); HGCA Project Report No. 528; Agriculture and Horticulture Development Board: Kenilworth, UK, 2014. [Google Scholar]
- Newton, A.C.; Guy, D.C. Assessing effects of crop history and soil amendments on yields of subsequent crops. Agric. Sci. 2020, 11, 514–527. [Google Scholar] [CrossRef]
- Lovell, D.J.; Parker, S.R.; Hunter, T.; Welham, S.J.; Nichols, A.R. Position of inoculum in the canopy affects the risk of Septoria tritici blotch epidemics in winter wheat. Plant Pathol. 2004, 53, 11–21. [Google Scholar] [CrossRef] [Green Version]
- Brown, J.L.; Stobart, R.; Hallett, P.D.; Morris, N.L.; George, T.S.; Newton, A.C.; Valentine, T.A.; McKenzie, B.M. Variable impacts of reduced and zero tillage on soil carbon storage across 4–10 years of UK field experiments. J. Soils Sediments 2020. [Google Scholar] [CrossRef]
- Martinez, I.; Chervet, A.; Weisskopf, P.; Struny, W.G.; Etana, A.; Stettler, M.; Forkmane, J.; Keller, T. Two decades of no-till in the Oberacker long-term field experiment: Part I Crop yield soil organic carbon and nutrient distribution in the soil profile. Soil Tillage Res. 2016, 163, 141–151. [Google Scholar] [CrossRef]
- Altieri, M.A.; Nicholls, C.I.; Montalba, R. Technological approaches to sustainable agriculture at a crossroads: An agroecological perspective. Sustainability 2017, 9, 349. [Google Scholar] [CrossRef] [Green Version]
- Pearson, C.J. Regenerative semiclosed systems: A priority for twenty-first-century agriculture. BioScience 2007, 57, 409–418. [Google Scholar] [CrossRef] [Green Version]
- Postma-Blaauw, M.B.; de Goede, R.G.M.; Bloem, J.; Faber, J.H.; Brussaard, L. Soil biota community structure and abundance under agricultural intensification and extensification. Ecology 2010, 91, 460–473. [Google Scholar] [CrossRef]
- Mathew, R.P.; Feng, Y.; Githinji, L.; Ankumah, R.; Balkcom, K.S. Impact of no-tillage and conventional tillage systems on soil microbial communities. Appl. Environ. Soil Sci. 2012, 548620. [Google Scholar] [CrossRef] [Green Version]
- Olsson, S.; Gerhardson, B. Effects of long-term barley monoculture on plant-affecting soil microbiota. Plant Soil 1992, 143, 99–108. [Google Scholar] [CrossRef]
- Fitt, B.D.L.; Atkins, S.D.; Fraaije, B.A.; Lucas, J.A.; Newton, A.C.; Looseley, M.; Werner, P.; Harrap, D.; Ashworth, M.; Southgate, J.; et al. Role of Inoculum Sources in Rhynchosporium Population Dynamics and Epidemics on Barley; HGCA Project Report 2012, No. 486; University of Hertfordshire: Hatfield, UK, 2012; 46p. [Google Scholar]
Figure 1.
Distribution of yield of the core set cultivars across all trial years.

Figure 2.
Mean yield of the four core set cultivars—tillage treatment interactions for 2004–2014.

Figure 3.
Overall and yearly mean yields of core set cultivars for inversion (red) and non-inversion (green) tillage from 2004 to 2014. The bar shows the size of the SED for the interaction between cultivar and tillage type.
Figure 3.
Overall and yearly mean yields of core set cultivars for inversion (red) and non-inversion (green) tillage from 2004 to 2014. The bar shows the size of the SED for the interaction between cultivar and tillage type.

Figure 4.
Comparison of rhynchosporium infection between maturing inversion (red) and non-inversion (green) tillage from 2004 to 2014. The bar shows the size of the SED for the interaction between cultivar and tillage type.
Figure 4.
Comparison of rhynchosporium infection between maturing inversion (red) and non-inversion (green) tillage from 2004 to 2014. The bar shows the size of the SED for the interaction between cultivar and tillage type.

Figure 5.
Mean yield of 18 cultivars in inversion and non-inversion tillage from 2011 to 2014.

Figure 6.
Regression of non-inversion yield on inversion yield for 18 winter barley cultivars from 2011 to 2014. The blue lines show the 95% confidence interval of the functional regression line (solid black), while the dashed line shows the 1:1 yield ratio.
Figure 6.
Regression of non-inversion yield on inversion yield for 18 winter barley cultivars from 2011 to 2014. The blue lines show the 95% confidence interval of the functional regression line (solid black), while the dashed line shows the 1:1 yield ratio.

Figure 7.
Mean area under the rhynchosporium disease progress curve (square root transformed) of 18 cultivars in inversion and non-inversion tillage from 2011 to 2014.
Figure 7.
Mean area under the rhynchosporium disease progress curve (square root transformed) of 18 cultivars in inversion and non-inversion tillage from 2011 to 2014.

Figure 8.
Regression of non-inversion on inversion %AUDPC (sqrt) for 18 winter barley cultivars in the 2011–2014 trials. The blue lines show the 95% confidence interval of the regression line (solid black), while the dashed line shows the 1:1 yield ratio. Only cultivars outside the confidence limits are labelled for clarity.

Figure 9.
Regression of non-inversion yield on inversion yield for 56 winter barley cultivars in the 2008 trial. The blue lines show the 95% confidence interval of the regression line (solid black), while the dashed line shows the 1:1 yield ratio. Only cultivars outside the confidence limits are labelled for clarity, blue below and green above.

Figure 10.
Regression of non-inversion yield on inversion yield for 45 winter barley cultivars in the 2011 trial. The blue lines show the 95% confidence interval of the regression line (solid black), while the dashed line shows the 1:1 yield ratio. Only cultivars outside the confidence limits are labelled for clarity, blue below and green above.

Figure 11.
Regression of non-inversion yield on inversion yield for 35 winter barley cultivars in the 2012 trial. The blue lines show the 95% confidence interval of the regression line (solid black), while the dashed line shows the 1:1 yield ratio. Only cultivars outside the confidence limits are labelled for clarity, blue below and green above.

Figure 12.
Regression of non-inversion yield on inversion yield for 20 winter barley cultivars common to all 2008, 2011 and 2012 trials. The blue lines show the 95% confidence interval of the regression line (solid black), while the dashed line shows the 1:1 yield ratio. Only cultivars outside the confidence limits are labelled for clarity, blue below and green above, i.e., the most adapted cultivars highlighted in Table 14.

Figure 13.
Regression of non-inversion on inversion rhynchosporium %AUDPC (sqrt) for the 2008, 2011 and 2012 trials. The blue lines show the 95% confidence interval of the regression line (solid black), while the dashed line shows the 1:1 yield ratio. Only cultivars outside the confidence limits are labelled for clarity, blue below and green above.

Figure 14.
Comparison of cultivar yields under inversion (INV) and non-inversion (NONINV) tillage in two different cropping platforms, Mid Pilmore (MP) and the Centre for Sustainable Cropping (CSC).
Figure 14.
Comparison of cultivar yields under inversion (INV) and non-inversion (NONINV) tillage in two different cropping platforms, Mid Pilmore (MP) and the Centre for Sustainable Cropping (CSC).


Table 1.
Winter barley cultivars in trials 2004–2009 and 2011–2014 showing comparison groups. “Winter AGOUEB” indicates cultivars used in the ”Association Genetics of UK Elite Barleys BBSRC-Link project” (red shaded) (grant number RD-2004-3043). ”Core” is a set of 4 cultivars (green shaded) used across all trials. ”CSC” is the set of 4 cultivars used in the Centre for Sustainable Cropping, Balruddery in the first rotation cycle from 2011 to 2016. ”New comparison” (blue shaded) were cultivars sourced from UK Recommended List or breeders [12], some of which were trialled twice (grey shaded).
| Trial | Years | ||||||||||
|---|---|---|---|---|---|---|---|---|---|---|---|
| Cultivar | Cultivar Category | 2004 | 2005 | 2006 | 2007 | 2008 | 2009 | 2011 | 2012 | 2013 | 2014 |
| Fanfare | Winter AGOUEB + core | x | x | x | x | x | x | x | x | x | x |
| Sumo | Winter AGOUEB + core | x | x | x | x | x | x | x | x | x | x |
| Pipkin | Winter AGOUEB + core | x | x | x | x | x | x | x | x | x | x |
| Pastoral | Winter AGOUEB + core | x | x | x | x | x | x | x | x | x | x |
| Pearl | Winter AGOUEB | x | x | x | x | x | x | ||||
| Plaisant | Winter AGOUEB | x | x | x | x | x | x | ||||
| Intro | Winter AGOUEB | x | x | x | x | x | x | ||||
| Fighter | Winter AGOUEB | x | x | x | x | x | x | ||||
| Jewel | Winter AGOUEB | x | x | x | x | x | x | ||||
| Angela | Winter AGOUEB | x | x | x | x | x | x | ||||
| Flagon | Winter AGOUEB | x | x | x | x | ||||||
| Camion | Winter AGOUEB | x | x | x | x | ||||||
| Cypress | Winter AGOUEB | x | x | x | x | ||||||
| Diamond | Winter AGOUEB | x | x | x | x | ||||||
| Gypsy | Winter AGOUEB | x | x | x | x | ||||||
| Kingston | Winter AGOUEB | x | x | x | x | ||||||
| Manitou | Winter AGOUEB | x | x | x | x | ||||||
| Puffin | Winter AGOUEB | x | x | x | x | ||||||
| Saffron | Winter AGOUEB + CSC | x | x | x | x | x | x | ||||
| Sequel | Winter AGOUEB + CSC | x | x | x | x | x | |||||
| Retriever | New comparison + CSC | x | x | x | x | x | |||||
| Cassata | New comparison + CSC | x | x | x | x | ||||||
| KWS Cassia | New comparison | x | x | x | x | ||||||
| KWS Meridian | New comparison | x | x | x | x | ||||||
| KWS Tower | New comparison | x | x | x | x | ||||||
| KWS Glacier | New comparison | x | x | x | x | ||||||
| Volume | New comparison hybrid | x | x | ||||||||
| SY-Venture | New comparison | x | x | ||||||||
| Matros | New comparison | x | x | ||||||||
| Suzuka | New comparison | x | x | ||||||||
| KWS Escadre | New comparison | x | x | ||||||||
| Florentine | New comparison | x | x | ||||||||
| Canyon | New comparison | x | x | ||||||||
| Sinatra | New comparison | x | x | ||||||||
| Winsome | New comparison | x | |||||||||
| Purdey | New comparison | x | |||||||||
| Pelican | New comparison | x | |||||||||
| Colibri | New comparison | x | |||||||||
| Element | New comparison | x | |||||||||
| Trick | New comparison | x | |||||||||
| Archer | New comparison | x | |||||||||
| Carat | Winter AGOUEB | x | x | ||||||||
| Igri | Winter AGOUEB | x | x | ||||||||
| Leonie | Winter AGOUEB | x | x | ||||||||
| Maris Otter | Winter AGOUEB | x | x | ||||||||
| Antonia | Winter AGOUEB | x | |||||||||
| Aquarelle | Winter AGOUEB | x | |||||||||
| Avenue | Winter AGOUEB | x | |||||||||
| Cannock | Winter AGOUEB | x | |||||||||
| Charleston | Winter AGOUEB | x | |||||||||
| Dolphin | Winter AGOUEB | x | |||||||||
| Esterel | Winter AGOUEB | x | |||||||||
| Flute | Winter AGOUEB | x | |||||||||
| Gleam | Winter AGOUEB | x | |||||||||
| Haka | Winter AGOUEB | x | |||||||||
| Halcyon | Winter AGOUEB | x | |||||||||
| Hanna | Winter AGOUEB | x | |||||||||
| Heligan | Winter AGOUEB | x | |||||||||
| Houston | Winter AGOUEB | x | |||||||||
| Kestrel | Winter AGOUEB | x | |||||||||
| Magie | Winter AGOUEB | x | |||||||||
| Malta | Winter AGOUEB | x | |||||||||
| Marinka | Winter AGOUEB | x | |||||||||
| Melanie | Winter AGOUEB | x | |||||||||
| Muscat | Winter AGOUEB | x | |||||||||
| Opal | Winter AGOUEB | x | |||||||||
| Panda | Winter AGOUEB | x | |||||||||
| Pedigree | Winter AGOUEB | x | |||||||||
| Pict | Winter AGOUEB | x | |||||||||
| Rattle | Winter AGOUEB | x | |||||||||
| Regina | Winter AGOUEB | x | |||||||||
| Rifle | Winter AGOUEB | x | |||||||||
| Scylla | Winter AGOUEB | x | |||||||||
| Siberia | Winter AGOUEB | x | |||||||||
| Spectrum | Winter AGOUEB | x | |||||||||
| Sprite | Winter AGOUEB | x | |||||||||
| Sunrise | Winter AGOUEB | x |
Table 2.
Comparison of notable high or low precipitation, sunshine and air temperature maximum monthly figures from 2003 to 2014.
Table 2.
Comparison of notable high or low precipitation, sunshine and air temperature maximum monthly figures from 2003 to 2014.
| Mean Monthly Precipitation (Supplementary Figure S1) | ||||||||||||
|---|---|---|---|---|---|---|---|---|---|---|---|---|
| 2003 | 2004 | 2005 | 2006 | 2007 | 2008 | 2009 | 2010 | 2011 | 2012 | 2013 | 2014 | |
| March | H | L | ||||||||||
| April | L | L | H | L | H | |||||||
| May | L | L | ||||||||||
| June | H | H | H | |||||||||
| Mean monthly days rain >0.5 mm (Supplementary Figure S2) | ||||||||||||
| March | L | H | L | |||||||||
| April | L | L | L | H | ||||||||
| May | L | L | H | |||||||||
| June | L | H | H | L | H | L | ||||||
| Mean monthly sunshine hours (Supplementary Figure S3) | ||||||||||||
| March | L | H | H | H | L | |||||||
| April | L | H | H | H | ||||||||
| May | H | L | ||||||||||
| June | L | H | L | |||||||||
| Mean monthly air temp. max. (Supplementary Figure S4) | ||||||||||||
| March | H | L | ||||||||||
| April | H | H | L | L | ||||||||
| May | H | |||||||||||
| June | L | |||||||||||
Table 3.
Ranking of four winter barley cultivars grown from 2004 to 2014 by the difference between their inversion and non-inversion yield ranking.
Table 3.
Ranking of four winter barley cultivars grown from 2004 to 2014 by the difference between their inversion and non-inversion yield ranking.
| Cultivar | Yield Inv. | Yield Non-Inv. | Rank Inv. | Rank Non-Inv. | Rank Diff. | Yield Diff. Percent |
|---|---|---|---|---|---|---|
| Sumo | 5.59 | 4.84 | 2 | 2 | 0 | −13.42 |
| Fanfare | 5.63 | 4.91 | 1 | 1 | 0 | −12.79 |
| Pipkin | 5.32 | 4.73 | 4 | 4 | 0 | −11.09 |
| Pastoral | 5.39 | 4.82 | 3 | 3 | 0 | −10.58 |
Cultivars are ranked in order of yield (t/ha), 1 being the highest yielding. Column 6 is the rank difference between the mean of the plough, conventional and compaction inversion treatments and the minimum and zero tillage non-inversion treatment. Cultivars are ordered by the yield difference percentage.
Table 4.
Ranking of 18 winter barley cultivars grown from 2011 to 2014 by the difference between their inversion and non-inversion yield ranking.
Table 4.
Ranking of 18 winter barley cultivars grown from 2011 to 2014 by the difference between their inversion and non-inversion yield ranking.
| Cultivar | Yield Inv. | Yield Non-Inv. | Rank Inv. | Rank Non-Inv. | Rank Diff. | Yield Diff. Percent |
|---|---|---|---|---|---|---|
| Retriever | 5.89 | 3.87 | 1 | 8 | −7 | 34.3 |
| Jewel | 5.15 | 3.16 | 13 | 17 | −4 | 38.7 |
| Angela | 5.50 | 3.46 | 8 | 12 | −4 | 37.1 |
| Pastoral | 4.98 | 3.11 | 15 | 18 | −3 | 37.6 |
| Fanfare | 5.15 | 3.21 | 12 | 15 | −3 | 37.7 |
| KWS Cassia | 5.83 | 4.06 | 3 | 5 | −2 | 30.4 |
| KWS Tower | 5.66 | 3.99 | 5 | 6 | −1 | 29.6 |
| Pipkin | 4.96 | 3.18 | 16 | 16 | 0 | 36.0 |
| Fighter | 5.17 | 3.48 | 11 | 11 | 0 | 32.8 |
| Sequel | 5.40 | 3.86 | 9 | 9 | 0 | 28.6 |
| Sumo | 5.07 | 3.41 | 14 | 13 | 1 | 32.8 |
| KWS Meridian | 5.83 | 4.31 | 2 | 1 | 1 | 26.2 |
| KWS Glacier | 5.71 | 4.27 | 4 | 2 | 2 | 25.3 |
| Saffron | 5.25 | 3.89 | 10 | 7 | 3 | 26.0 |
| Cassata | 5.56 | 4.08 | 7 | 4 | 3 | 26.5 |
| Pearl | 5.64 | 4.13 | 6 | 3 | 3 | 26.7 |
| Intro | 4.72 | 3.32 | 18 | 14 | 4 | 29.7 |
| Plaisant | 4.79 | 3.54 | 17 | 10 | 7 | 26.2 |
Cultivars are ranked in order of yield (t/ha), 1 being the highest yielding. Column 6 is the rank difference between the mean of the plough, conventional and compaction inversion treatments and the minimum and zero tillage non-inversion treatment. Cultivars are ordered by the rank difference inversion minus non-inversion, which has negative values where non-inversion yield ranks higher and positive where inversion tillage ranks higher. Top and bottom 5 entries with 3 or more rank differences are shaded.
Table 5.
Absolute yield rank differences for combined 2011–2014 trials. Number of cultivars shows the number of cultivars with the given rank change and Cumulative shows the number with that rank change or greater. The 50%, 90% and 95% points are from the simulated variables and show the distribution of the number of cultivars that exhibited an absolute rank change at least as large as that specified due to random variation, as described in the text.
| Rank Change | No. Cultivars | Cumulative | 50% | 90% | 95% |
|---|---|---|---|---|---|
| 0 | 3 | 18 | 18 | 18 | 18 |
| 1 | 3 | 15 | 14 | 16 | 17 |
| 2 | 2 | 12 | 7 | 10 | 10 |
| 3 | 5 | 10 | 3 | 6 | 7 |
| 4 | 3 | 5 | 2 | 3 | 4 |
| 7 | 2 | 2 | 0 | 0 | 0 |
Table 6.
Ranking of 18 winter barley cultivars grown from 2011 to 2014 by the difference between their inversion and non-inversion area under their rhynchosporium disease progress curve (%AUDPC) (sqrt) ranking.
Table 6.
Ranking of 18 winter barley cultivars grown from 2011 to 2014 by the difference between their inversion and non-inversion area under their rhynchosporium disease progress curve (%AUDPC) (sqrt) ranking.
| Cultivar | %AUDPC Inv. | %AUDPC Non-Inv. | Rank Inv. | Rank Non-Inv. | Rank Diff. | %AUDPC Diff. Percent |
|---|---|---|---|---|---|---|
| Plaisant | 11.08 | 7.595 | 11 | 17 | −6.0 | 31.46 |
| Fighter | 9.91 | 6.849 | 5 | 9 | −4.0 | 30.92 |
| Jewel | 10.57 | 6.897 | 8 | 10 | −2.0 | 34.72 |
| KWS Cassia | 12.24 | 7.594 | 14 | 16 | −2.0 | 37.96 |
| KWS Tower | 8.30 | 5.79 | 1 | 2 | −1 | 30.2 |
| Sequel | 9.49 | 6.251 | 3 | 4 | −1.0 | 34.11 |
| Pearl | 9.60 | 6.339 | 4 | 5 | −1.0 | 33.94 |
| Pastoral | 11.62 | 7.554 | 13 | 14 | −1.0 | 34.97 |
| Cassata | 9.92 | 6.477 | 6 | 6 | 0.0 | 34.68 |
| Saffron | 12.57 | 7.591 | 15 | 15 | 0.0 | 39.6 |
| Intro | 14.88 | 9.139 | 18 | 18 | 0.0 | 38.58 |
| Fanfare | 9.28 | 5.65 | 2 | 1 | 1.0 | 39.1 |
| Angela | 11.37 | 7.079 | 12 | 11 | 1.0 | 37.72 |
| KWS Meridian | 10.61 | 6.591 | 9 | 7 | 2.0 | 37.86 |
| KWS Glacier | 10.93 | 6.754 | 10 | 8 | 2.0 | 38.22 |
| Retriever | 10.13 | 6.039 | 7 | 3 | 4.0 | 40.37 |
| Sumo | 12.90 | 7.315 | 16 | 12 | 4.0 | 43.31 |
| Pipkin | 14.58 | 7.348 | 17 | 13 | 4.0 | 49.59 |
Cultivars are ranked in order of %AUDPC, 1 being the lowest. Column 6 is the rank difference between the mean of the plough, conventional and compaction inversion treatments and the minimum and zero tillage non-inversion treatment. Cultivars are ordered by the rank difference inversion minus non-inversion, which has negative values where non-inversion %AUDPC ranks higher and positive where inversion tillage ranks higher.
Table 7.
Absolute %AUDPC (sqrt) rank differences for combined 2011–2014 trials. Number of cultivars shows the number of cultivars with the given rank change and Cumulative shows the number with that rank change or greater. The 50%, 90% and 95% points are from the simulated variables and show the distribution of the number of cultivars that exhibited an absolute rank change at least as large as that specified due to random variation, as described in the text.
| Rank Change | No. Cultivars | Cumulative | 50% | 90% | 95% |
|---|---|---|---|---|---|
| 0 | 3 | 18 | 18 | 18 | 18 |
| 1 | 6 | 15 | 10 | 13 | 14 |
| 2 | 4 | 9 | 4 | 7 | 8 |
| 3 | 0 | 1 | 3 | 4 | |
| 4 | 4 | 5 | 0 | 1 | 2 |
| 5 | 0 | 0 | 0 | 1 | |
| 6 | 1 | 1 | 0 | 0 | 0 |
Table 8.
Ranking of 56 winter barley cultivars grown in the 2008 trial by the difference between their inversion and non-inversion yield ranking.
Table 8.
Ranking of 56 winter barley cultivars grown in the 2008 trial by the difference between their inversion and non-inversion yield ranking.
| Cultivar | Yield Inv. | Yield Non-Inv. | Rank Inv. | Rank Non-Inv. | Rank Diff. | Yield Diff. Percent |
|---|---|---|---|---|---|---|
| Kingston | 7.617 | 4.376 | 7 | 55 | −48 | 42.55 |
| Fighter | 7.394 | 4.471 | 10 | 54 | −44 | 39.53 |
| Diamond | 6.936 | 4.29 | 22 | 56 | −34 | 38.14 |
| Gypsy | 7.668 | 5.133 | 6 | 37 | −31 | 33.06 |
| Manitou | 8.055 | 5.247 | 2 | 31 | −29 | 34.86 |
| Jewel | 7.809 | 5.255 | 3 | 29 | −26 | 32.7 |
| Kestrel | 6.9 | 4.816 | 24 | 49 | −25 | 30.2 |
| Carrat | 6.844 | 4.856 | 26 | 48 | −22 | 29.05 |
| Flagon | 8.175 | 5.37 | 1 | 22 | −21 | 34.32 |
| Heligan | 6.638 | 4.505 | 33 | 52 | −19 | 32.14 |
| Rattle | 7.247 | 5.216 | 14 | 33 | −19 | 28.03 |
| Hanna | 6.641 | 4.902 | 31 | 45 | −14 | 26.17 |
| Cannock | 7.776 | 5.549 | 4 | 17 | −13 | 28.64 |
| Haka | 6.474 | 4.655 | 40 | 51 | −11 | 28.09 |
| Flute | 6.597 | 4.865 | 36 | 47 | −11 | 26.26 |
| Scylla | 7.393 | 5.37 | 11 | 21 | −10 | 27.35 |
| Sequel | 6.496 | 4.878 | 37 | 46 | −9 | 24.9 |
| Magie | 6.877 | 5.191 | 25 | 34 | −9 | 24.51 |
| Pastoral | 6.943 | 5.254 | 21 | 30 | −9 | 24.33 |
| Marinka | 6.824 | 5.173 | 27 | 35 | −8 | 24.2 |
| Pedigree | 7.698 | 5.743 | 5 | 11 | −6 | 25.39 |
| Aquarelle | 6.987 | 5.319 | 20 | 25 | −5 | 23.87 |
| Siberia | 7.588 | 5.731 | 8 | 13 | −5 | 24.47 |
| Panda | 6.639 | 5.17 | 32 | 36 | −4 | 22.13 |
| Halcyon | 6.599 | 5.127 | 35 | 38 | −3 | 22.3 |
| Spectrum | 7.468 | 5.739 | 9 | 12 | −3 | 23.15 |
| Opal | 7.312 | 5.719 | 12 | 14 | −2 | 21.79 |
| Pipkin | 6.044 | 4.501 | 52 | 53 | −1 | 25.54 |
| Pict | 6.453 | 4.934 | 42 | 42 | 0 | 23.53 |
| Intro | 6.343 | 4.906 | 47 | 44 | 3 | 22.67 |
| Muscat | 5.742 | 4.728 | 54 | 50 | 4 | 17.66 |
| Sumo | 6.436 | 5.088 | 43 | 39 | 4 | 20.94 |
| Dolphin | 6.726 | 5.356 | 28 | 24 | 4 | 20.36 |
| Sprite | 7.136 | 5.827 | 15 | 10 | 5 | 18.34 |
| Rifle | 6.226 | 4.906 | 49.5 | 43 | 6.5 | 21.21 |
| Antonia | 6.922 | 5.586 | 23 | 15 | 8 | 19.31 |
| Charleston | 6.725 | 5.426 | 29 | 20 | 9 | 19.31 |
| Igri | 6.488 | 5.257 | 38 | 28 | 10 | 18.98 |
| Gleam | 7.011 | 5.839 | 19 | 9 | 10 | 16.72 |
| Regina | 7.122 | 6.105 | 16 | 6 | 10 | 14.28 |
| Sunrise | 6.115 | 5.067 | 51 | 40 | 11 | 17.14 |
| Houston | 7.268 | 6.48 | 13 | 2 | 11 | 10.84 |
| Malta | 5.884 | 5.045 | 53 | 41 | 12 | 14.27 |
| Fanfare | 7.117 | 6.106 | 17 | 5 | 12 | 14.2 |
| Melanie | 6.601 | 5.486 | 34 | 18 | 16 | 16.89 |
| Angela | 7.028 | 6.763 | 18 | 1 | 17 | 3.77 |
| Maris Otter | 6.226 | 5.236 | 49.5 | 32 | 17.5 | 15.91 |
| Leonie | 6.484 | 5.469 | 39 | 19 | 20 | 15.65 |
| Esterel | 6.299 | 5.282 | 48 | 27 | 21 | 16.15 |
| Cypress | 6.703 | 6.381 | 30 | 3 | 27 | 4.81 |
| Puffin | 5.182 | 5.317 | 55 | 26 | 29 | −2.59 |
| Avenue | 6.348 | 5.576 | 46 | 16 | 30 | 12.16 |
| Plaisant | 4.881 | 5.367 | 56 | 23 | 33 | −9.96 |
| Saffron | 6.381 | 5.905 | 44 | 8 | 36 | 7.46 |
| Pearl | 6.468 | 6.302 | 41 | 4 | 37 | 2.56 |
| Camion | 6.367 | 5.942 | 45 | 7 | 38 | 6.68 |
Cultivars are ranked in order of yield (t/ha), 1 being the highest yielding. Column 6 is the rank difference between the mean of the plough, conventional and compaction inversion treatments and the minimum and zero tillage non-inversion treatment. Cultivars are ordered by the rank difference inversion minus non-inversion, which has negative values where non-inversion yield ranks higher and positive where inversion tillage ranks higher. Top and bottom 7 entries with 25 or more rank differences are shaded.
Table 9.
Absolute yield rank differences for the 2008 trial. Number of cultivars shows the number of cultivars with the given rank change and Cumulative shows the number with that rank change or greater. The 50%, 90% and 95% points are from the simulated variables and show the distribution of the number of cultivars that exhibited an absolute rank change at least as large as that specified due to random variation, as described in the text.
| Rank Change | No. Cultivars | Cumulative | 50% | 90% | 95% |
|---|---|---|---|---|---|
| 0 | 1 | 56 | 56 | 56 | 56 |
| 1 | 1 | 55 | 53 | 55 | 56 |
| 2 | 1 | 54 | 49 | 52 | 53 |
| 3 | 3 | 53 | 45 | 49 | 50 |
| 4 | 4 | 50 | 41 | 45 | 47 |
| 5 | 3 | 46 | 38 | 43 | 44 |
| 6 | 1 | 43 | 35 | 39 | 40 |
Table 10.
Ranking of 45 winter barley cultivars grown in the 2011 trial by the difference between their inversion and non-inversion yield ranking.
Table 10.
Ranking of 45 winter barley cultivars grown in the 2011 trial by the difference between their inversion and non-inversion yield ranking.
| Cultivar | Yield Inv. | Yield Non-Inv. | Rank Inv. | Rank Non-Inv. | Rank Diff. | Yield Diff. Percent |
|---|---|---|---|---|---|---|
| Winsome | 5.343 | 4.357 | 4 | 34 | −30 | 18.444 |
| Volume | 5.282 | 4.558 | 6 | 30 | −24 | 13.692 |
| Fighter | 4.942 | 3.981 | 19 | 38 | −19 | 19.446 |
| KWS Tower | 5.014 | 4.454 | 17 | 31 | −14 | 11.16 |
| Pipkin | 4.662 | 3.893 | 29 | 41 | −12 | 16.51 |
| Angela | 4.937 | 4.389 | 20 | 32 | −12 | 11.101 |
| SY-Venture | 4.758 | 4.286 | 26 | 36 | −10 | 9.915 |
| Intro | 4.461 | 3.502 | 36 | 45 | −9 | 21.504 |
| Fanfare | 4.614 | 3.911 | 32 | 40 | −8 | 15.241 |
| Sinatra | 5.739 | 5.232 | 1 | 8 | −7 | 8.842 |
| Bamboo | 4.777 | 4.649 | 24 | 29 | −5 | 2.691 |
| Diamond | 4.989 | 4.748 | 18 | 23 | −5 | 4.831 |
| Flagon | 5.237 | 5.122 | 8 | 13 | −5 | 2.2 |
| Colibri | 4.368 | 3.726 | 38 | 42 | −4 | 14.703 |
| Kingston | 5.08 | 4.943 | 13 | 16 | −3 | 2.681 |
| KWS Glacier | 5.198 | 5.157 | 9 | 12 | −3 | 0.789 |
| Retriever | 5.256 | 5.165 | 7 | 10 | −3 | 1.73 |
| Jewel | 4.474 | 4.171 | 35 | 37 | −2 | 6.759 |
| Camion | 5.021 | 4.913 | 16 | 18 | −2 | 2.154 |
| KWS Cassia | 5.3 | 5.243 | 5 | 7 | −2 | 1.075 |
| Archer | 5.047 | 5.016 | 14 | 15 | −1 | 0.609 |
| Sumo | 4.163 | 3.662 | 44 | 44 | 0 | 12.039 |
| Pastoral | 4.216 | 3.719 | 43 | 43 | 0 | 11.789 |
| Cypress | 4.352 | 3.954 | 39 | 39 | 0 | 9.148 |
| Element | 5.141 | 5.165 | 11 | 11 | 0 | −0.451 |
| Matros | 5.621 | 5.823 | 2 | 2 | 0 | −3.59 |
| Suzuka | 4.798 | 4.767 | 23 | 22 | 1 | 0.657 |
| Canyon | 5.514 | 6.099 | 3 | 1 | 2 | −10.61 |
| Trick | 4.642 | 4.67 | 30 | 26 | 4 | −0.605 |
| Pelican | 4.766 | 4.779 | 25 | 21 | 4 | −0.272 |
| Puffin | 4.288 | 4.339 | 42 | 35 | 7 | −1.21 |
| KWS Meridian | 5.081 | 5.318 | 12 | 5 | 7 | −4.652 |
| Pearl | 5.164 | 5.801 | 10 | 3 | 7 | −12.342 |
| Purdey | 4.724 | 4.88 | 28 | 20 | 8 | −3.304 |
| Sequel | 4.735 | 4.91 | 27 | 19 | 8 | −3.683 |
| Manitou | 4.461 | 4.655 | 37 | 28 | 9 | −4.356 |
| Igri | 4.485 | 4.678 | 34 | 25 | 9 | −4.306 |
| M. Otter | 4.543 | 4.747 | 33 | 24 | 9 | −4.486 |
| Florentine | 5.033 | 5.287 | 15 | 6 | 9 | −5.051 |
| Plaisant | 3.944 | 4.363 | 45 | 33 | 12 | −10.631 |
| KWS Escadre | 4.337 | 4.661 | 40 | 27 | 13 | −7.47 |
| Saffron | 4.845 | 5.214 | 22 | 9 | 13 | −7.599 |
| Carrat | 4.629 | 4.917 | 31 | 17 | 14 | −6.229 |
| Cassata | 4.894 | 5.513 | 21 | 4 | 17 | −12.666 |
| Gypsy | 4.316 | 5.083 | 41 | 14 | 27 | −17.78 |
Cultivars are ranked in order of yield (t/ha), 1 being the highest yielding. Column 6 is the rank difference between the mean of the plough, conventional and compaction inversion treatments and the minimum and zero tillage non-inversion treatment. Cultivars are ordered by the rank difference inversion minus non-inversion, which has negative values where non-inversion yield ranks higher and positive where inversion tillage ranks higher. Top and bottom 6 entries with 12 or more rank differences are shaded.
Table 11.
Absolute yield rank differences for the 2011 trial. Number of cultivars shows the number of cultivars with the given rank change and Cumulative shows the number with that rank change or greater. The 50%, 90% and 95% points are from the simulated distribution variables and show the distribution of the number of cultivars that exhibited an absolute rank change at least as large as that specified due to random variation, as described in the text.
| Rank Change | No. Cultivars | Cumulative | 50% | 90% | 95% |
|---|---|---|---|---|---|
| 0 | 5 | 45 | 45 | 45 | 45 |
| 1 | 2 | 40 | 42 | 44 | 44 |
| 2 | 4 | 38 | 37 | 39 | 40 |
| 3 | 3 | 34 | 31 | 35 | 35.5 |
| 4 | 3 | 31 | 27 | 30 | 31 |
| 5 | 3 | 28 | 23 | 27 | 27.5 |
| 7 | 4 | 25 | 16 | 19.5 | 21 |
Table 12.
Ranking of 35 winter barley cultivars grown in the 2012 trial by the difference between their inversion and non-inversion yield ranking.
Table 12.
Ranking of 35 winter barley cultivars grown in the 2012 trial by the difference between their inversion and non-inversion yield ranking.
| Cultivar | Yield Inv. | Yield Non-Inv. | Rank Inv. | Rank Non-Inv. | Rank Diff. | Yield Diff. Percent |
|---|---|---|---|---|---|---|
| Angela | 6.313 | 3.708 | 7 | 30 | −23 | 41.27 |
| Retriever | 6.164 | 3.819 | 10 | 27 | −17 | 38.04 |
| Jewel | 5.78 | 3.66 | 17 | 33 | −16 | 36.8 |
| Flagon | 6.035 | 3.866 | 11 | 26 | −15 | 35.94 |
| Puffin | 5.62 | 3.66 | 20 | 32 | −12 | 34.9 |
| Pastoral | 5.49 | 3.39 | 26 | 35 | −9 | 38.3 |
| Saffron | 5.53 | 3.67 | 23 | 31 | −8 | 33.7 |
| Archer | 5.868 | 4.154 | 14 | 22 | −8 | 29.2 |
| Sinatra | 5.97 | 4.158 | 13 | 20 | −7 | 30.36 |
| Sequel | 6.502 | 4.573 | 4 | 9 | −5 | 29.68 |
| Volume | 7.753 | 4.842 | 1 | 6 | −5 | 37.55 |
| KWS Escadre | 6.296 | 4.407 | 8 | 12 | −4 | 30 |
| Cypress | 5.708 | 4.156 | 18 | 21 | −3 | 27.19 |
| KWS Tower | 6.458 | 4.766 | 6 | 7 | −1 | 26.21 |
| Matros | 6.919 | 4.983 | 3 | 4 | −1 | 27.97 |
| Fanfare | 5.01 | 3.60 | 34 | 34 | 0 | 28.1 |
| Canyon | 6.471 | 4.983 | 5 | 5 | 0 | 22.99 |
| Suzuka | 5.813 | 4.291 | 16 | 15 | 1 | 26.19 |
| KWS Cassia | 6.211 | 4.583 | 9 | 8 | 1 | 26.21 |
| KWS Meridian | 7.035 | 5.307 | 2 | 1 | 1 | 24.57 |
| Kingston | 5.38 | 4.01 | 28 | 25 | 3 | 25.5 |
| Pearl | 5.56 | 4.20 | 22 | 19 | 3 | 24.5 |
| Camion | 5.21 | 3.82 | 32 | 28 | 4 | 26.7 |
| Manitou | 5.57 | 4.24 | 21 | 17 | 4 | 23.9 |
| Cassata | 5.849 | 4.513 | 15 | 11 | 4 | 22.84 |
| Pipkin | 4.76 | 3.76 | 35 | 29 | 6 | 21.0 |
| Diamond | 5.53 | 4.24 | 24 | 18 | 6 | 23.4 |
| Intro | 5.29 | 4.06 | 31 | 23 | 8 | 23.2 |
| Fighter | 5.16 | 4.03 | 33 | 24 | 9 | 22.0 |
| SY-Venture | 5.52 | 4.25 | 25 | 16 | 9 | 23.0 |
| Florentine | 6.019 | 5.078 | 12 | 3 | 9 | 15.62 |
| Gypsy | 5.45 | 4.39 | 27 | 13 | 14 | 19.4 |
| Plaisant | 5.35 | 4.30 | 29 | 14 | 15 | 19.5 |
| KWS Glacier | 5.696 | 5.277 | 19 | 2 | 17 | 7.37 |
| Sumo | 5.33 | 4.56 | 30 | 10 | 20 | 14.6 |
Cultivars are ranked in order of yield (t/ha), 1 being the highest yielding. Column 6 is the rank difference between the mean of the plough, conventional and compaction inversion treatments and the minimum and zero tillage non-inversion treatment. Cultivars are ordered by the rank difference inversion minus non-inversion, which has negative values where non-inversion yield ranks higher and positive where inversion tillage ranks higher. Top and bottom 5 or 4 entries with 14 or more rank differences are shaded.
Table 13.
Absolute yield rank differences for the 2012 trial. Number of cultivars shows the number of cultivars with the given rank change and Cumulative shows the number with that rank change or greater. The 50%, 90% and 95% points are from the simulated variables and show the distribution of the number of cultivars that exhibited an absolute rank change at least as large as that specified due to random variation, as described in the text.
| Rank Change | No. Cultivars | Cumulative | 50% | 90% | 95% |
|---|---|---|---|---|---|
| 0 | 2 | 35 | 35 | 35 | 35 |
| 1 | 5 | 33 | 31 | 33 | 34 |
| 3 | 3 | 28 | 20 | 23 | 24 |
| 4 | 4 | 25 | 17 | 20 | 21 |
| 5 | 2 | 21 | 14 | 17 | 18 |
| 6 | 2 | 19 | 12 | 15 | 15 |
| 7 | 1 | 17 | 9 | 12.5 | 13 |
| 8 | 3 | 16 | 8 | 10 | 11.5 |
| 9 | 4 | 13 | 6 | 9 | 10 |
| 12 | 1 | 9 | 3 | 5 | 5 |
| 14 | 1 | 8 | 2 | 3 | 3 |
Table 14.
Ranking of the 20 common winter barley cultivars grown in the 2008, 2011 and 2012 trials by the difference between their inversion and non-inversion yield ranking.
Table 14.
Ranking of the 20 common winter barley cultivars grown in the 2008, 2011 and 2012 trials by the difference between their inversion and non-inversion yield ranking.
| Cultivar | Yield Inv. | Yield Non-Inv. | Rank Inv. | Rank Non-Inv. | Rank Diff. | Yield Diff. Percent |
|---|---|---|---|---|---|---|
| Jewel | 6.021 | 4.361 | 5 | 16 | −11 | 27.57 |
| Fighter | 5.833 | 4.162 | 7 | 17 | −10 | 28.64 |
| Kingston | 6.025 | 4.441 | 4 | 14 | −10 | 26.28 |
| Diamond | 5.818 | 4.441 | 8 | 15 | −7 | 23.67 |
| Manitou | 6.034 | 4.715 | 3 | 9 | −6 | 21.87 |
| Flagon | 6.48 | 4.80 | 1 | 7 | −6 | 25.9 |
| Pastoral | 5.54 | 4.16 | 14 | 18 | −4 | 25.0 |
| Intro | 5.37 | 4.07 | 16 | 19 | −3 | 24.3 |
| Pipkin | 5.16 | 4.03 | 18 | 20 | −2 | 21.9 |
| Sequel | 5.911 | 4.78 | 6 | 8 | −2 | 19.13 |
| Angela | 6.127 | 4.99 | 2 | 2 | 0 | 18.55 |
| Fanfare | 5.582 | 4.515 | 13 | 11 | 2 | 19.13 |
| Gypsy | 5.81 | 4.88 | 9 | 5 | 4 | 16.1 |
| Sumo | 5.31 | 4.46 | 17 | 12 | 5 | 16.1 |
| Cypress | 5.594 | 4.806 | 11 | 6 | 5 | 14.09 |
| Puffin | 5.034 | 4.442 | 19 | 13 | 6 | 11.75 |
| Saffron | 5.586 | 4.947 | 12 | 3 | 9 | 11.42 |
| Pearl | 5.732 | 5.451 | 10 | 1 | 9 | 4.91 |
| Plaisant | 4.722 | 4.674 | 20 | 10 | 10 | 1.02 |
| Camion | 5.528 | 4.879 | 15 | 4 | 11 | 11.75 |
Cultivars are ranked in order of yield (t/ha), 1 being the highest yielding. Column 6 is the rank difference between the mean of the plough, conventional and compaction inversion treatments and the minimum and zero tillage non-inversion treatment. Cultivars are ordered by the rank difference inversion minus non-inversion, which has negative values where non-inversion yield ranks higher and positive where inversion tillage ranks higher. Top and bottom 4 entries with 7 or more rank differences are shaded.
Table 15.
Cultivars selected as most likely to represent tillage adaptation traits.
| Inversion | Common20 | 2008 | 2011 | 2012 |
|---|---|---|---|---|
| Jewel | + | + | + | |
| Fighter | + | + | + | |
| Kingston | + | + | ||
| Diamond | + | + | ||
| Angela | + | + | ||
| Non-inversion | ||||
| Camion | + | + | + | |
| Plaisant | + | + | + | + |
| Pearl | + | + | ||
| Saffron | + | + | + | |
| Gypsy | + | + |
Table 16.
Ranking of winter barley cultivars grown in the 2008, 2011 and 2012 trials by the difference between their inversion and non-inversion area under their rhynchosporium disease progress curve (%AUDPC)(sqrt) ranking that change rank by more than 13 places.
Table 16.
Ranking of winter barley cultivars grown in the 2008, 2011 and 2012 trials by the difference between their inversion and non-inversion area under their rhynchosporium disease progress curve (%AUDPC)(sqrt) ranking that change rank by more than 13 places.
| Cultivar | %AUDPC Inv. | %AUDPC Non-Inv. | Rank Inv. | Rank Non-Inv. | Rank Diff. | %AUDPC Diff. Percent |
|---|---|---|---|---|---|---|
| 2008 | ||||||
| Panda | 2.307 | 4.045 | 10 | 39 | −29 | −75.35 |
| Pearl | 2.457 | 3.767 | 13 | 34 | −21 | −53.27 |
| Rifle | 1.84 | 3.393 | 5 | 25 | −20 | −84.36 |
| Aquarelle | 2.301 | 3.415 | 9 | 28 | −19 | −48.44 |
| Saffron | 3.632 | 5.131 | 28 | 46 | −18 | −41.28 |
| Jewel | 2.521 | 3.516 | 14 | 31 | −17 | −39.47 |
| Kestrel | 2.652 | 3.731 | 17 | 32 | −15 | −40.68 |
| Regina | 3.306 | 3.924 | 24 | 37 | −13 | −18.72 |
| Plaisant | 3.661 | 4.702 | 31 | 44 | −13 | −28.45 |
| Flagon | 2.793 | 2.488 | 19 | 6 | 13 | 10.91 |
| Flute | 3.005 | 2.339 | 22 | 5 | 17 | 22.15 |
| Diamond | 3.952 | 2.892 | 34 | 17 | 17 | 26.84 |
| Opal | 4.302 | 3.29 | 41 | 21 | 20 | 23.52 |
| Gypsy | 4.257 | 3.136 | 40 | 18 | 22 | 26.34 |
| Sprite | 3.727 | 2.613 | 32 | 8 | 24 | 29.89 |
| Kingston | 3.649 | 2.166 | 30 | 1 | 29 | 40.66 |
| Halcyon | 4.328 | 2.69 | 43 | 11 | 32 | 37.84 |
| Magie | 4.011 | 2.268 | 37 | 2 | 35 | 43.46 |
| 2011 | ||||||
| Puffin | 8.149 | 6.829 | 21 | 39 | −18 | 16.2 |
| Sinatra | 5.741 | 5.137 | 4 | 17 | −13 | 10.52 |
| Kingston | 7.784 | 5.825 | 15 | 28 | −13 | 25.16 |
| KWS Glacier | 9.27 | 5.163 | 32 | 19 | 13 | 44.31 |
| Sumo | 8.83 | 4.539 | 29 | 12 | 17 | 48.6 |
| 2012 | ||||||
| Florentine | 6.673 | 5.385 | 16 | 32 | −16 | 19.3 |
| Flagon | 4.371 | 4.143 | 3 | 17 | −14 | 5.22 |
| KWS Cassia | 8.296 | 4.021 | 29 | 14 | 15 | 51.53 |
| Canyon | 8.256 | 3.795 | 27 | 9 | 18 | 54.03 |
Cultivars are ranked in order of %AUDPC, 1 being the lowest. Column 6 is the rank difference between the mean of the plough, conventional and compaction inversion treatments and the minimum and zero tillage non-inversion treatment. Cultivars are ordered by the rank difference inversion minus non-inversion, which has negative values where non-inversion %AUDPC ranks higher and positive where inversion tillage ranks higher.
Publisher’s Note: MDPI stays neutral with regard to jurisdictional claims in published maps and institutional affiliations. |
© 2020 by the authors. Licensee MDPI, Basel, Switzerland. This article is an open access article distributed under the terms and conditions of the Creative Commons Attribution (CC BY) license (http://creativecommons.org/licenses/by/4.0/).
Share and Cite
MDPI and ACS Style
Newton, A.C.; Hawes, C.; Hackett, C.A. Adaptation of Winter Barley Cultivars to Inversion and Non-Inversion Tillage for Yield and Rhynchosporium Symptoms. Agronomy 2021, 11, 30. https://0-doi-org.brum.beds.ac.uk/10.3390/agronomy11010030
AMA Style
Newton AC, Hawes C, Hackett CA. Adaptation of Winter Barley Cultivars to Inversion and Non-Inversion Tillage for Yield and Rhynchosporium Symptoms. Agronomy. 2021; 11(1):30. https://0-doi-org.brum.beds.ac.uk/10.3390/agronomy11010030
Chicago/Turabian StyleNewton, Adrian C., Cathy Hawes, and Christine A. Hackett. 2021. "Adaptation of Winter Barley Cultivars to Inversion and Non-Inversion Tillage for Yield and Rhynchosporium Symptoms" Agronomy 11, no. 1: 30. https://0-doi-org.brum.beds.ac.uk/10.3390/agronomy11010030
Note that from the first issue of 2016, this journal uses article numbers instead of page numbers. See further details here.