Article

Biochemical and Physiological Responses of Thermostable Wheat Genotypes for Agronomic Yield under Heat Stress during Reproductive Stages

by
Fahad Alghabari
1,*,
Zahid Hussain Shah
2,
Abdalla Ahmed Elfeel
1 and
Jaber Hussain Alyami
3
1
Department of Arid Land Agriculture, Faculty of Meteorology, Environment and Arid Land Agriculture, King Abdulaziz University, Jeddah 21589, Saudi Arabia
2
Department of Plant Breeding and Genetics, PirMehr Ali Shah, Arid Agriculture University, Rawalpindi 46000, Pakistan
3
Department of Diagnostic Radiology, Faculty of Applied Medical Science, King Abdulaziz University, Jeddah 21589, Saudi Arabia
*
Author to whom correspondence should be addressed.
Submission received: 29 July 2021 / Revised: 28 September 2021 / Accepted: 15 October 2021 / Published: 18 October 2021
(This article belongs to the Special Issue Crop Physiological Responses to Abiotic Stress Factors)

Abstract

:
Wheat is a globally important crop used as a main staple food in various countries of the world. The current study was conducted with the objective to evaluate the effect of a high temperature (HT) on osmolytes (starch, sucrose, total soluble sugars, total soluble proteins and proline), physiological parameters (Chl-a, Chl-b, photosynthesis rate, transpiration rate and stomatal conductance), antioxidant enzymes (superoxide dismutase, catalase and peroxidase) and agronomic traits (flag leaf area, spike length, and thousand grain weight) during the grain filling and anthesis stages of wheat cultivars (Fakhr-e-Bhakar, Raj-3765, Jimai-22 and Bayraktar-2000) collected from different regions of the world. Separate experiments for both stages were conducted in a glasshouse and treated with two different temperature regimes, i.e., optimum (OT) (24 °C day; 14 °C night) and high temperature (HT) (32 °C day; 22 °C night) in RCBD for two weeks. The data for osmolytes, antioxidant enzymes and physiological contents were collected at days 3, 5, 7, 9 and 13 after the start of plant stress, while the agronomic traits were collected at maturity. The data obtained were subjected to a statistical analysis using the statistix8.1 and R-program. HT stress significantly reduced all the traits except for the membrane damage, transpiration rate, proline and total soluble sugars, whose values increased considerably in the genotype Bayraktar-2000. However, under both regimes of temperature Fakhr-e-Bhakkar showed a high tolerance against HT stress, as revealed by physiological, biochemical and agronomic evaluations. Moreover, correlation, PCA and heat map analyses indicated that all types of traits are significantly interconnected in determining the crop potential to sustain its growth under HT stress.

1. Introduction

Wheat is a globally important staple food crop that covers more than 220 million hectares throughout the world. More than 50% of the cultivated area experiences a high temperature (HT) stress leading to a dramatic loss in yield every year [1,2]. Moreover, Arora [3] predicted that, in the future, the recurrent events of high temperatures will trigger the detrimental impacts of temperature on the overall crop production [2]. A high temperature (HT) causes a remarkable decrease in wheat yield at the reproductive stages (anthesis and grain filling) compared to the vegetative stages [4]. The optimum temperature (OT) for wheat during the reproductive phases is from 15 to 20 °C, yet it exceeds 34 °C during daytime in wheat growing regions of the world [5]. The concurrence of an HT in the reproductive stages of wheat aggravates the harmful impacts on grain yield. Even an increase of 1 °C in the OT during the reproductive stages of wheat can reduce the grain yield by 21% [6].Moreover, it is forecasted that the worldwide production of wheat will become more variable and with every 1 °C increase in the seasonal mean temperature the production will decrease by 6% [7]. Therefore, for sustainable wheat production, it is mandatory to breed HT-tolerant wheat genotypes. In cereals, the HT stress dramatically decreases water use efficiency, flag leaf area, stomatal conductance and photosynthetic efficiency [8]. The increase in evapotranspiration due to HT stress imposes drought stress on plants leading to a severe disturbance in the plant–water relation [9]. Therefore, plants opt for varying strategies to cope with individual or combined stresses such as a reduced photosynthesis due to the unavailability of moisture, while stomatal closure occurs in response to drought stress [10,11,12]. Aside from these responses to alleviate the effect of HT stress, multiple types of osmoprotectants, for instance proline, and sugars accumulate in the cytoplasm [13]. The accumulation of proline and soluble sugars is not only an indicator of plant osmotic adjustment under severe environmental stresses, which leads towards the stabilization of the internal environment [14]. These components also do not interfere with the normal biochemical and physiological functioning of the crop, instead, by being perfect osmoprotectants, they enable the plant to endure the osmotic stress imposed by an HT [12,13]. In addition to this, an HT triggers the production of reactive oxygen species (ROS) that initiate lipid peroxidation, resulting in membrane damage due to the reduction in the activity of antioxidant enzymes such as catalase (CAT), peroxidase (POX) and superoxide dismutase (SOD) [10]. Various studies reveal that HT stress enhances membrane damage and reduces the antioxidant contents at the seedling, anthesis and grain-filling stages of wheat [15]. On the other hand, an HT during the reproductive stage leads to a reduced seed setting, seed number, grain-filling period, individual grain weight and grain-filling rate that collectively result in a decreased yield [4]. Similarly, Farooq et al. [16] noticed an increase in the transpiration rate in wheat genotypes under HT that substantially reduced the leaf water potential and eventually reduced photosynthetic productivity. Moreover, photosynthesis is the most important physiological event hampered by HT due to a reduction in the leaf area, an increase in leaf senescence and damage to the metabolic machinery [17]. In wheat, an HT affects the floret fertility at the anthesis stage that impairs pollen viability, resulting in poor fertilization and a reduced grain yield. On the whole, plant yield is an outcome of the plant architect, photosynthesis rate, CO2 fixation, reproductive success and the assimilation of carbohydrates to grain; however, all of these determinants are highly susceptible to HT stress in multiple ways [18]. The effect of HT stress on grain number and size varies in accordance with the type of growth stage. For example, a temperature exceeding 20 °C between the spike initiation and anthesis stage triggers the spike development but decreases the number of grains per spike [13]. In addition to this, an HT above 30 °C during the floret development of various wheat genotypes may lead to complete male sterility [19]. The day and night HTs of 31 and 20 °C, respectively, may alter the structural integrity of the wheat endosperm causing a shrinkage of the grain [20]. Moreover, at the grain-filling stage, wheat is highly vulnerable to HT stress that decreases the yield due to leaf senescence and a shorter grain-filling period. In general, HT stress accelerates the rate of grain filling by shortening the grain-filling duration in wheat. Yin et al. [21] reported that a temperature increase of 5 °C during the grain-filling stage can decrease the grain-filling duration by 12 days. Similarly, a decrease in reproductive success and seed set was reported in the main cereal crops, such as rice, millet and sorghum, due to an HT. The objective of the current study was to evaluate the effect of HT on the physiological, biochemical, metabolic and agronomic attributes of wheat cultivars collected from different countries at the anthesis and grain-filling stages. We assumed that all of these parameters were potentially correlated to some extent and unanimously determined the ultimate yield of a genotype under the condition of heat stress.

2. Materials and Methods

Two independent tri-replicate experiments were conducted in RCBD using four thermostable wheat cultivars, Bayraktar-2000 (Turkey), Jimai-22 (China), Raj-3765 (India) and Fakhr-e-Bhakar (Pakistan), at controlled environmental conditions available at the Department of Arid Land Agriculture, King Abdulaziz University, Jeddah, Saudi Arabia.

2.1. Crop Husbandry and Conditions

Wheat genotypes were grown following the method used by Djanaguiraman et al. [4] in 2 L pots (3 pots for each treatment) filled with potting soil (Basissubstrat, Germany) and 10 g of slow releasing NPK (20:20:20, Pioneers, Riyadh, KSA) fertilizer in each pot. Plants were grown in a large growth chamber kept at 24 and 14 °C day and night temperatures and supported with 14 h photoperiod and approximately 70% humidity, respectively. For the production of photosynthetically active radiations, cool white fluorescent lamps were used. Each pot was retained with three plants after 21 days of emergence. All pots were watered up to 100% capacity till they attained physiological maturity at heading stage. Moreover, water-soluble NPK fertilizer (20:20:20, Pioneers, Riyadh, KSA) was applied with irrigation water once every seven days from jointing stage (Feekes growth scale 6.0) to the stage of physiological maturity (Feekes growth scale 11.4) for keeping the plants healthy and vigorous. To minimize the positional errors, the randomly arranged pots within growth chamber were randomly moved on alternate days, while air temperature and humidity were monitored on daily basis till the plants attained physiological maturity. Finally, each plant was tagged for the calculation of data.

2.2. Temperature Treatment Imposition and Data Collection

Both anthesis (Feekes growth scale 10.5.1)and grain-filling stages (Feekes growth stage 10.5.4) were subjected to two temperature regimes, i.e., optimum (OT) (24 °C day; 14 °C night) and high temperature (HT) (32 °C day; 22 °C night) as used by Djanaguiraman et al. [4]. Both experiments were conducted separately in random arrangements and each temperature regime was imposed within separate growth chamber. During both anthesis and grain-filling stages the plants were kept in their respective temperature regimes of OT or HT for 14 days and, afterward, moved back to original growth chamber maintained at 24/14 °C. Data for physiological parameters, osmolytes and antioxidant enzymes were collected for both OT and HT on days 3, 5, 7,9, 11 and 13 after the imposition of temperature treatments in both experiments. However, the data for agronomic parameters were calculated at the stage of maturity.

2.3. Estimation of Biochemical Parameters

2.3.1. Osmolytes Determination

For the estimation of total soluble sugar (TSS) and sucrose contents at both temperature regimes, the leaf samples were ground to fine powder. The sample powder was added in 80% ethanol and treated according to the method used by Shi et al. [22]. The sample was centrifuged at 5000× g for 10 min and supernatant was collected. This procedure was repeated three times and pooled supernatant was diluted with 80% ethanol to 25 mL for the estimation of sucrose and TSS contents. Sucrose content was measured using the resorcinol method at standard curve and absorbance of 480 nm [23]. TSS was estimated using anthrone reagent method at standard curve and absorbance of 625 nm [24]. Total starch assay kit (Sigma-Aldrich, St. Louis, MO, USA, Product number SA20-1KT) was used to determine the starch content of the samples. The quantity of starch was calculated from the twice-washed pellet left after the extraction of total soluble sugars. Moreover, proline content of randomly selected samples was determined with the help of UV-Vis spectrophotometer (DeNovix, Wilmington, NC, USA, Product number DS-11FX) on the basis of its reaction with ninhydrin. Total soluble proteins (TSP) were determined from supernatant by following Bradford Assay and quantified using UV-Vis spectrophotometer (DeNovix, Wilmington, NC, USA, Product number DS-11FX).

2.3.2. Measurement of Antioxidant Enzymes Activity

For assays of enzymes SOD, CAT and POX, 1g frozen leaf samples were homogenized in 1 mL of ice-cold 0.1 M Tris-HCl buffer and centrifuged at 20,000× g for 15 min at 4 °C. The supernatant was collected and enzymatic activity was estimated following the protocol used by Djanaguiraman et al. [15]. The SOD activity was determined using superoxide dismutase assay kit (Sigma-Aldrich, St. Louis, MO, USA, Product number 19160-1KT-F) following the instructions given. Moreover, the activity of catalase was estimated with the help of catalase assay kit (Sigma-Aldrich, St. Louis, MO, USA, Product number 219265-1KIT) by following manufacturer’s instructions. Similarly, OxiSelect™ Hydrogen Peroxide/Peroxidase Assay Kit (Fluorometric) (Cell Biolabs Inc., San Diego, CA, USA, Product number STA-344) was used for measuring peroxidase activity according to set protocol.

2.4. Estimation of Physiological Parameters

Physiological parameters, such as chlorophyll a and chlorophyll b, were calculated by following the method used by Mahmood et al. [25]. Stomatal conductance (Gs), photosynthesis rate (Pn) and transpiration rate (Tr) were calculated from the attached flag leaf between 9:00 a.m. to 1:00 p.m. using apparatus, Syrus 3upgradedmodel SC-1(DecagonDevices, 2011). Furthermore, the cell membrane damage was estimated with the help of method followed by Sairam et al. [26]. For this purpose, leaf pieces weighing 100 mg were placed in each of two different test tubes containing 20 mL of deionized water. Furthermore, one tube was maintained at 40 °C for 30 min using water bath, and its conductivity X1 was recorded, while second tube was incubated in a water bath at 100 °C for 10 min, and conductivity X2 was measured. Finally, the cell membrane damage was calculated using the formula [1 − (X1/X2)] × 100.

2.5. Measurement of Agronomic Characteristics

The agronomic characteristics for instance flag leaf area were measured using a scale. The length and width were calculated, and flag leaf area was determined using the formula (Flag leaf area = Width × Length × correction factor). Similarly, spike length measured from basal fertile spikelet to the tip of spike excluding the awn while thousand grains weight from each cultivar was measured using electronic weighing balance.

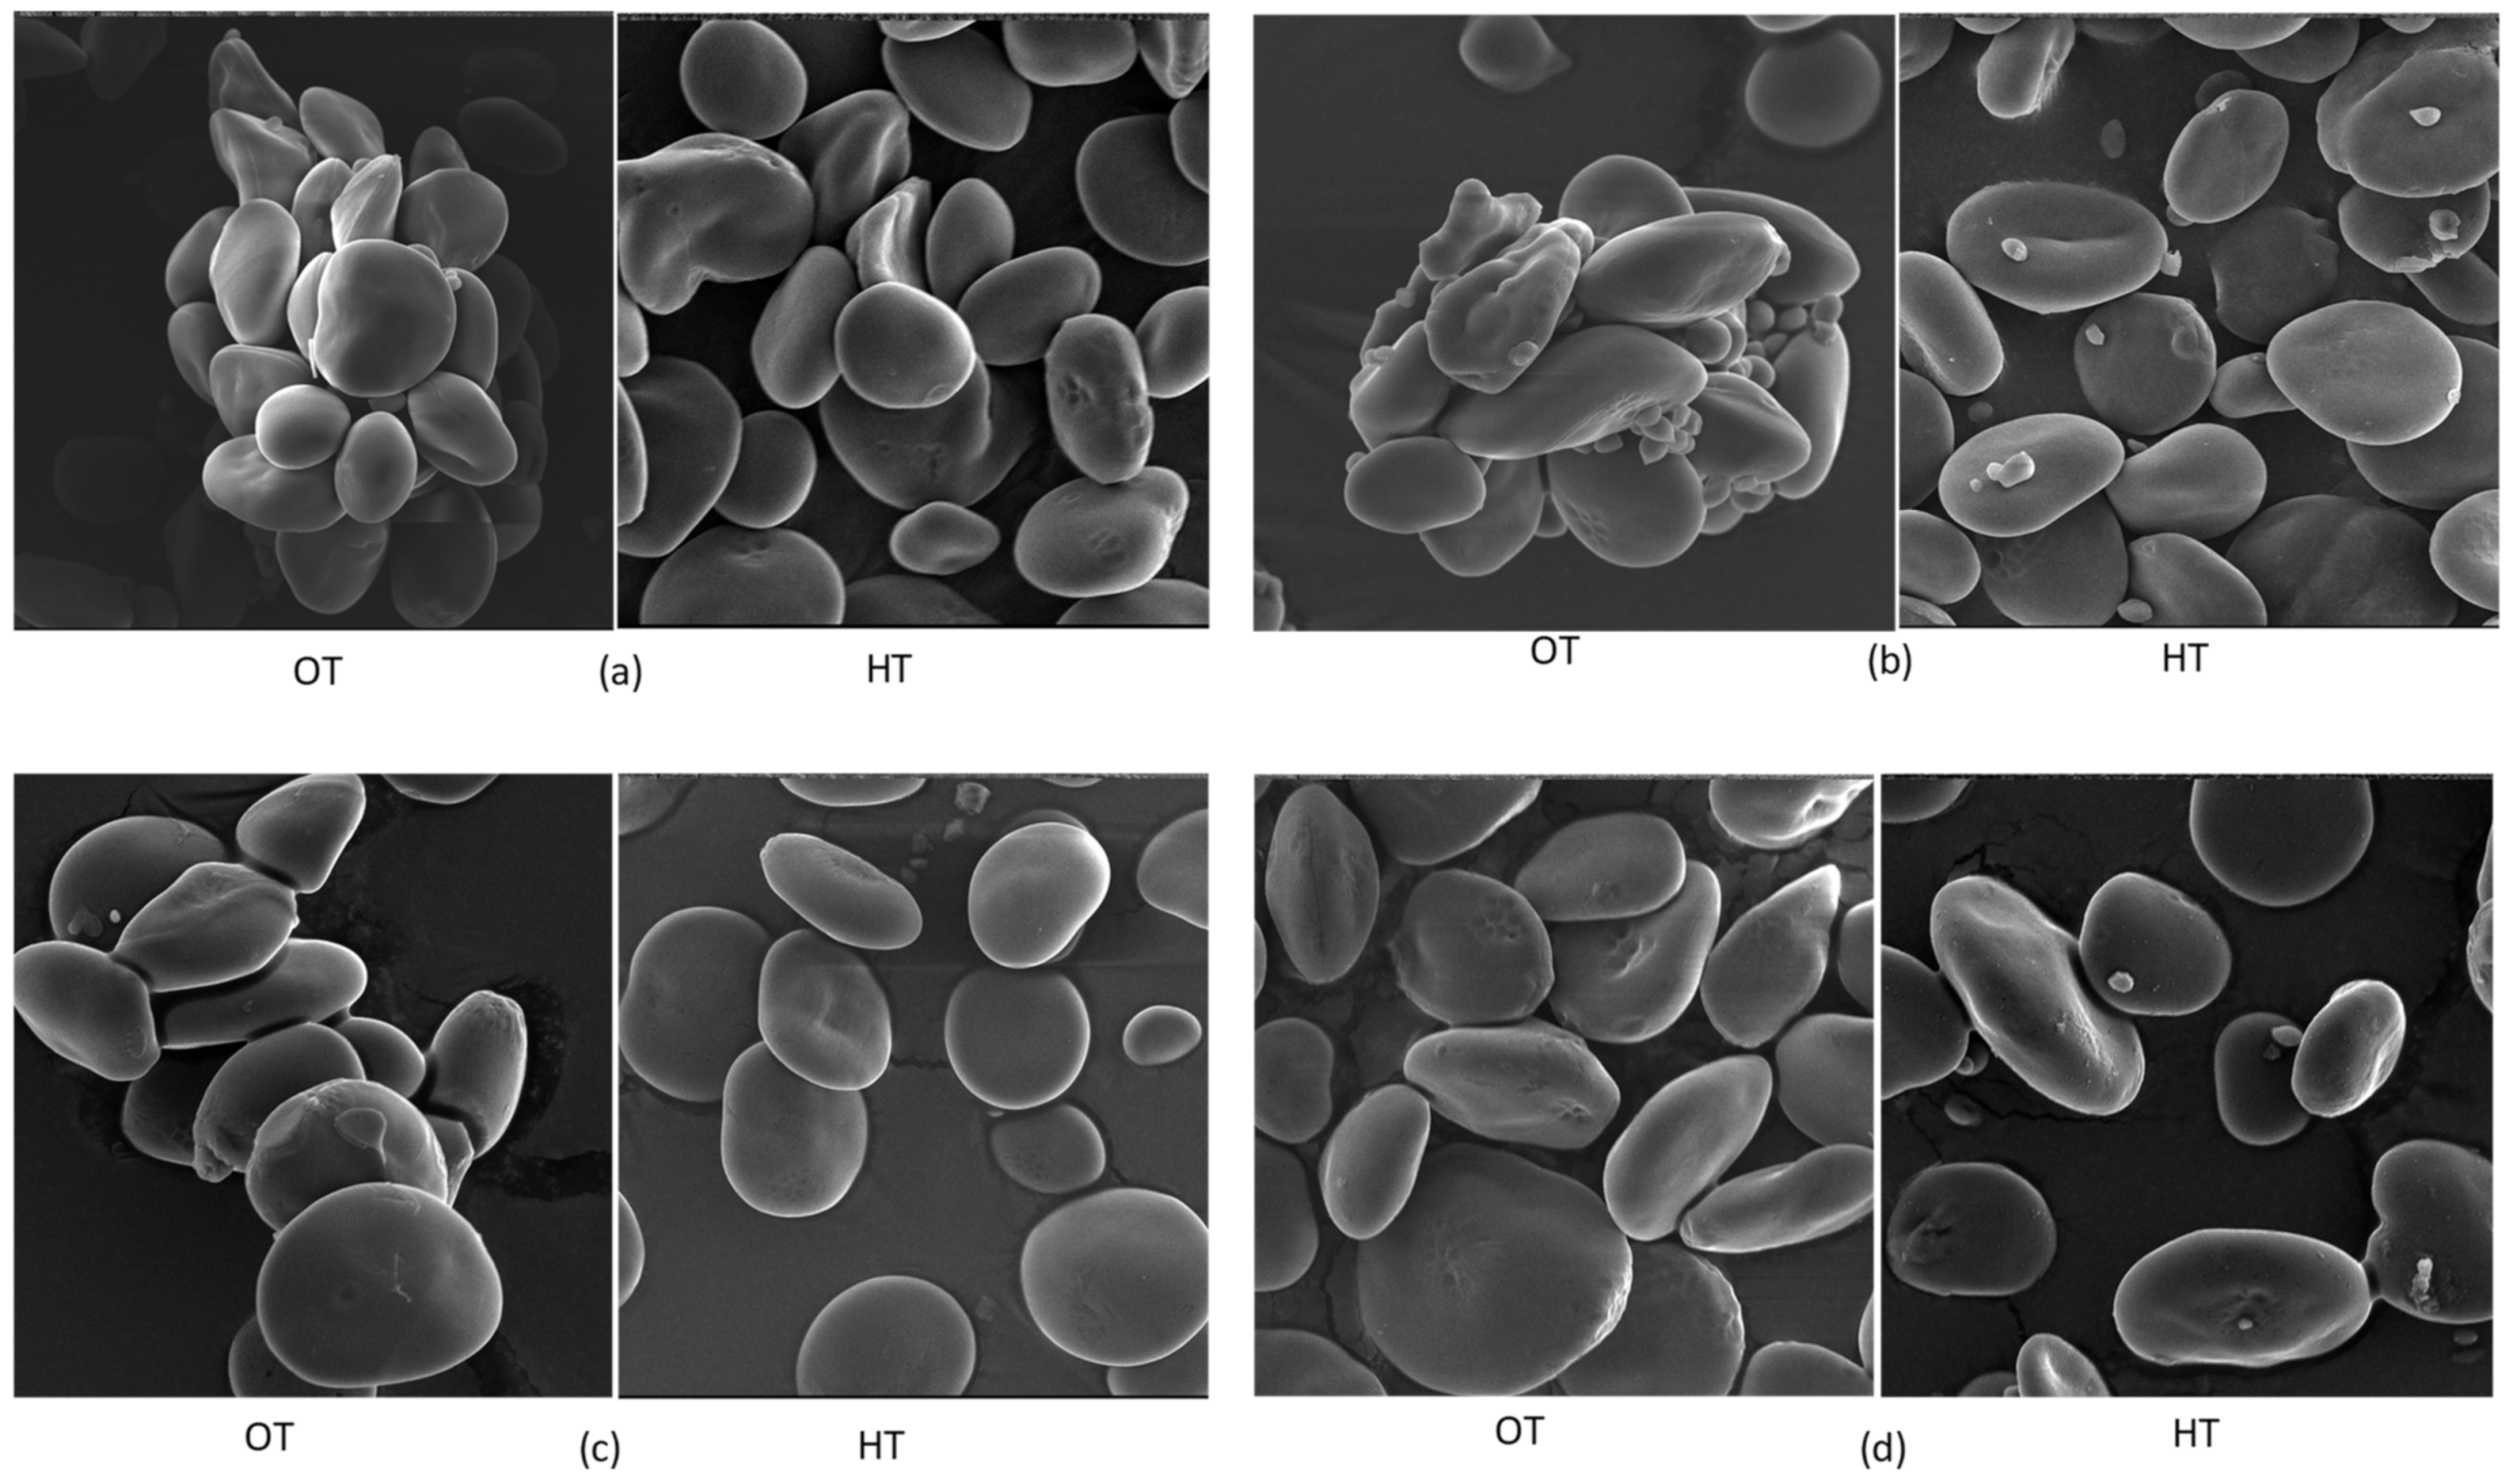
2.6. Scanning Electron Microscopy

Scanning electron microscopy of selected flag leaf samples was completed to investigate the effect of HT on the distribution of starch in leaves by following the procedure used by Alghabari [27].

2.7. Statistical Analysis

Data were analyzed by the application of analysis of variance (ANOVA) at 5% probability level, using Statistix ver. 8.1 software (McGraw-Hill 2008). Correlation, principal component analysis (PCA) and heatmap analyses were performed in RStudio version 1.3.959 (RStudio Team 2020), using the PerformaceAnalytics, FactoMineR, factoextra, devtools, ggplot2, ggpubr, gplots and pheatmap packages of R version 4.1.0 (R Core Team 2021).

3. Results

3.1. Biochemical Parameters
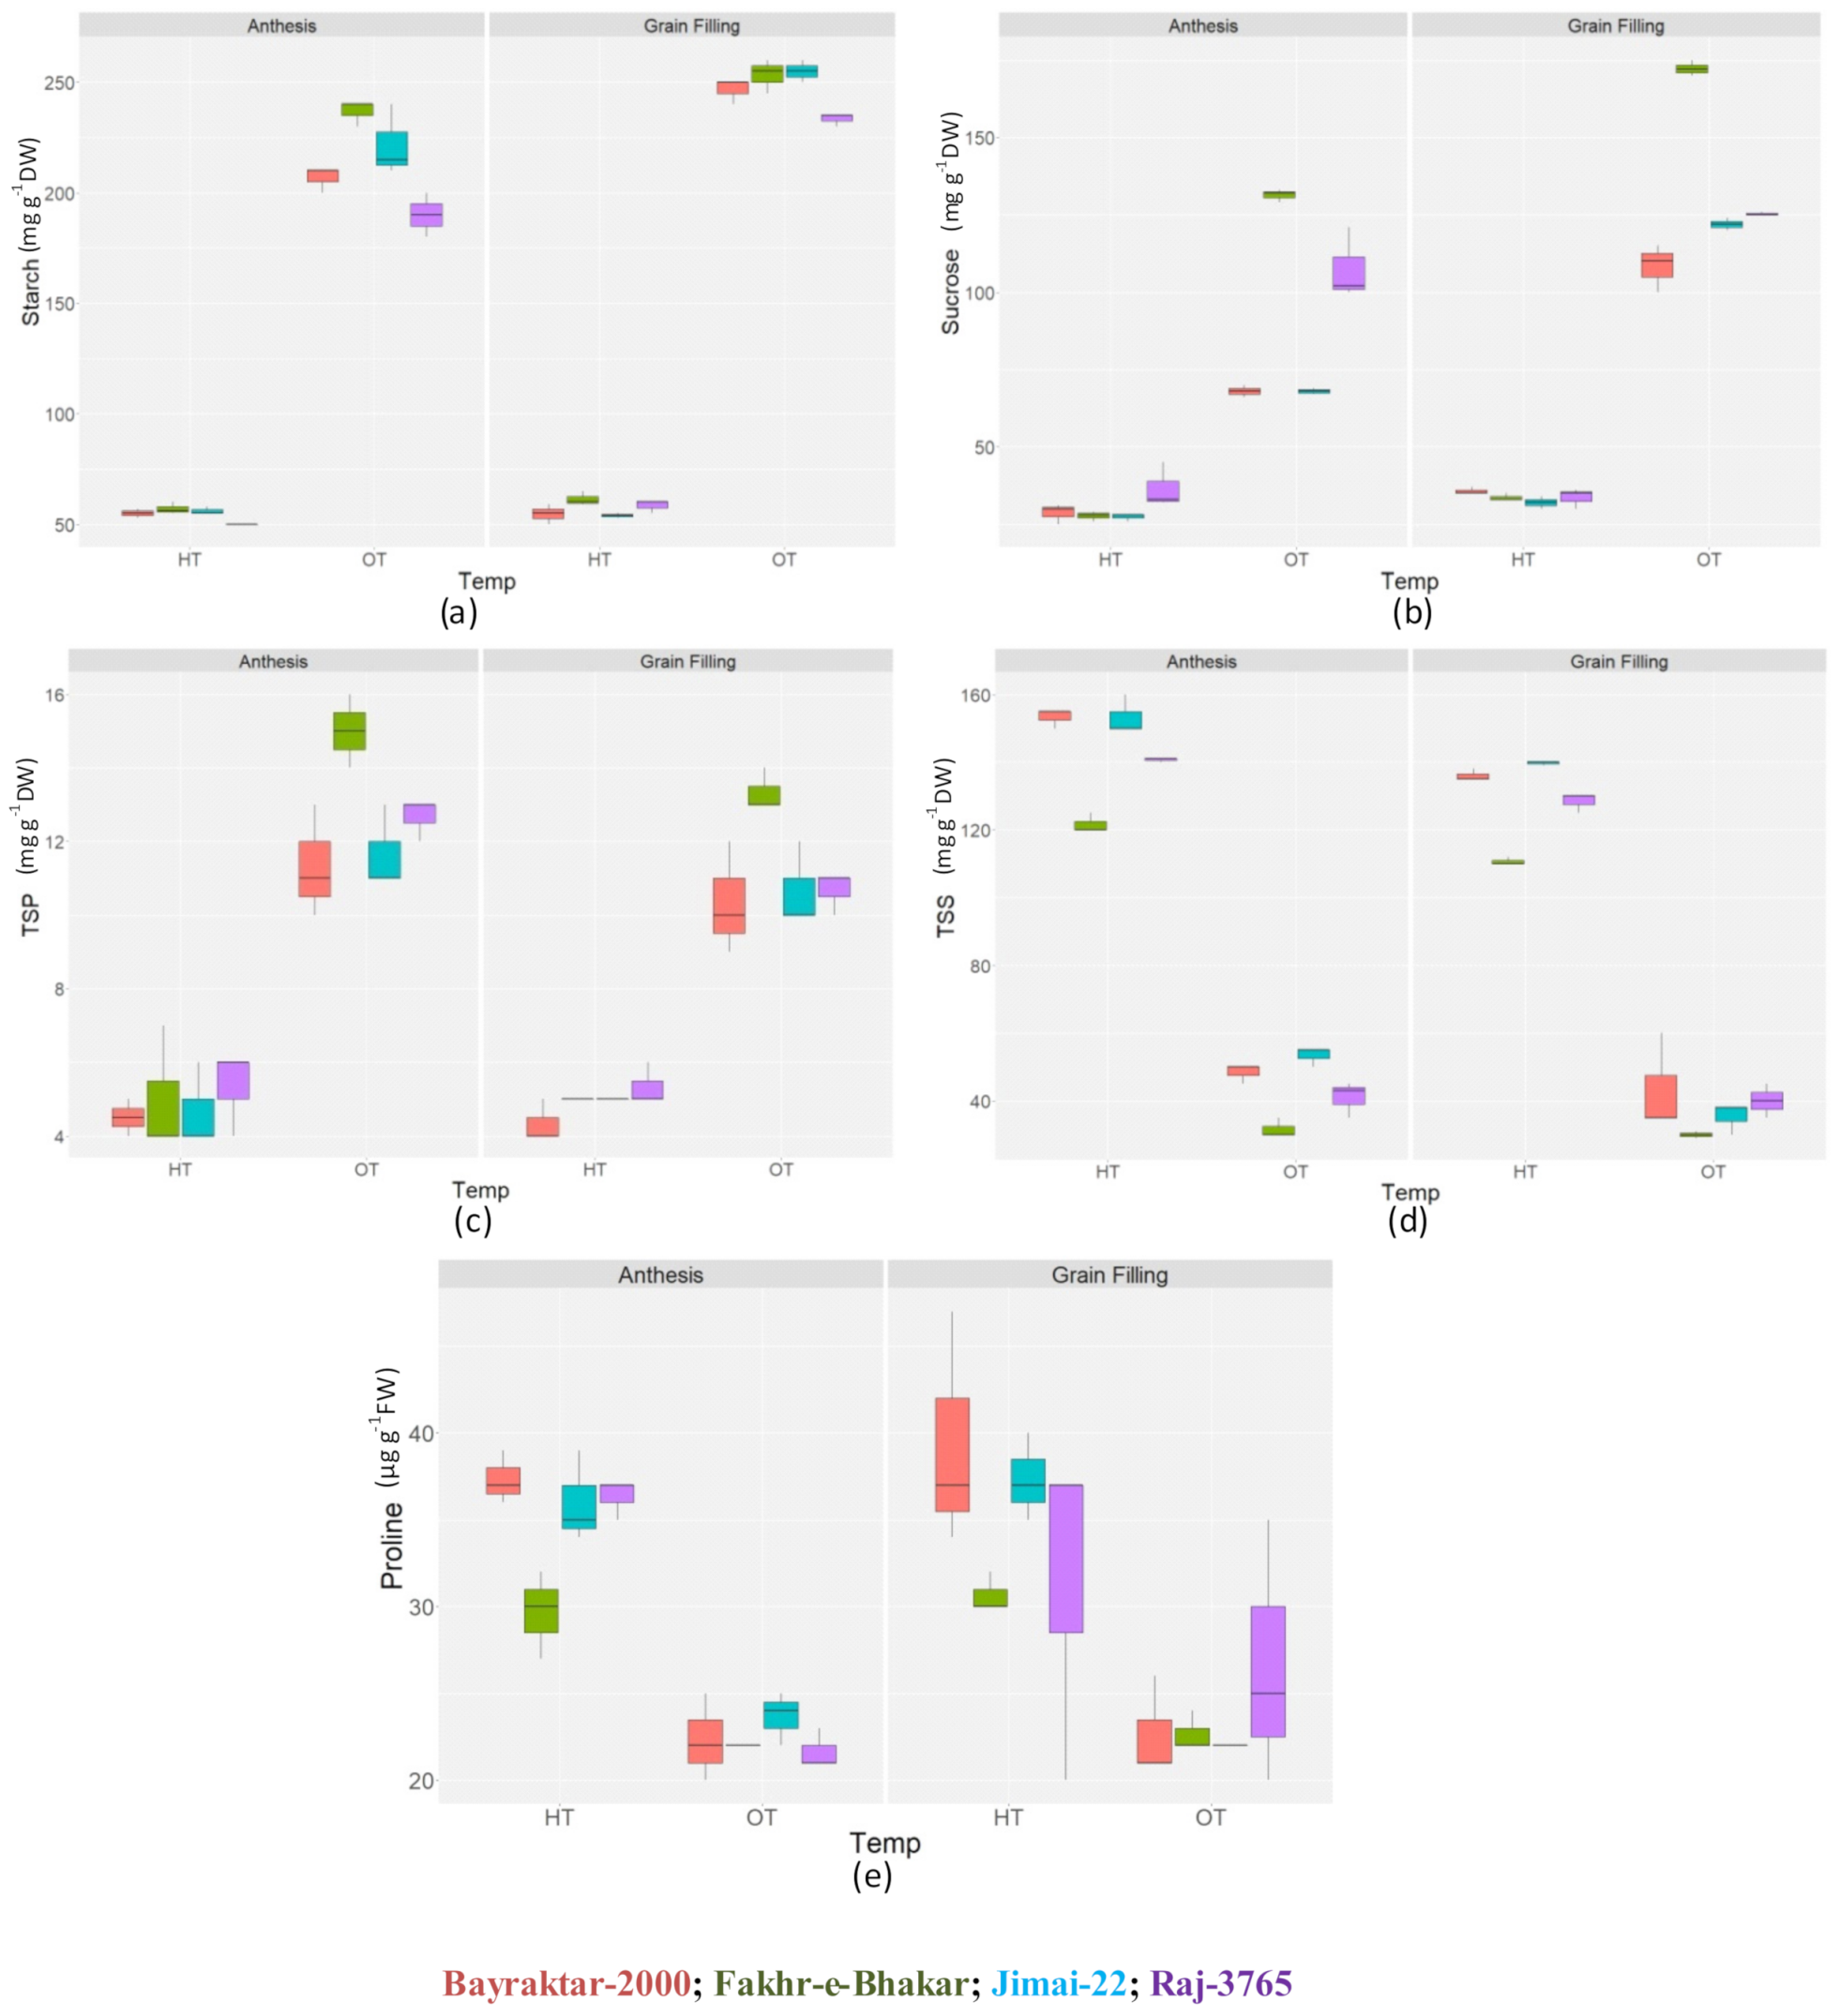
3.1.1. Osmolytes

Both temperature regimes showed significant (p ≤ 0.05) effects on the contents of leaf osmolytes, for instance starch, sucrose, TSP, TSS and proline, in all genotypes during both experiments. Starch, sucrose, and TSP illustrated a dramatic reduction in all genotypes at the HT compared to an OT during both the anthesis and grain-filling stages (Figure 1a–c). However, TSS and proline contents depicted a contrary trend with a significant (p ≤ 0.05) increase at the HT (Figure 1d,e). Among the genotypes, Fakhr-e-Bhakar revealed the maximum mean values of starch, sucrose and TSP content followed by Raj-3765, Jimai-22 and Bayraktar-2000 (Figure 1a–c). Besides, Bayraktar-2000 and Jimai-22 showed the highest TSS during the anthesis and grain-filling stages, while Fakhr-e-Bhakar illustrated the lowest TSS (Figure 1d). The TSS content in all the genotypes during the anthesis stage was slightly higher than in the grain-filling stage due to the HT. Moreover, under control conditions, Fakhr-e-Bhakar displayed the minimum value of TSS. Correspondingly, all the genotypes depicted a varying proline content at the HT, with Bayraktar-2000 with the highest value and Fakhr-e-Bhakar as the lowest value. On the contrary, the proline content revealed no significant difference at the OT (Figure 1e).

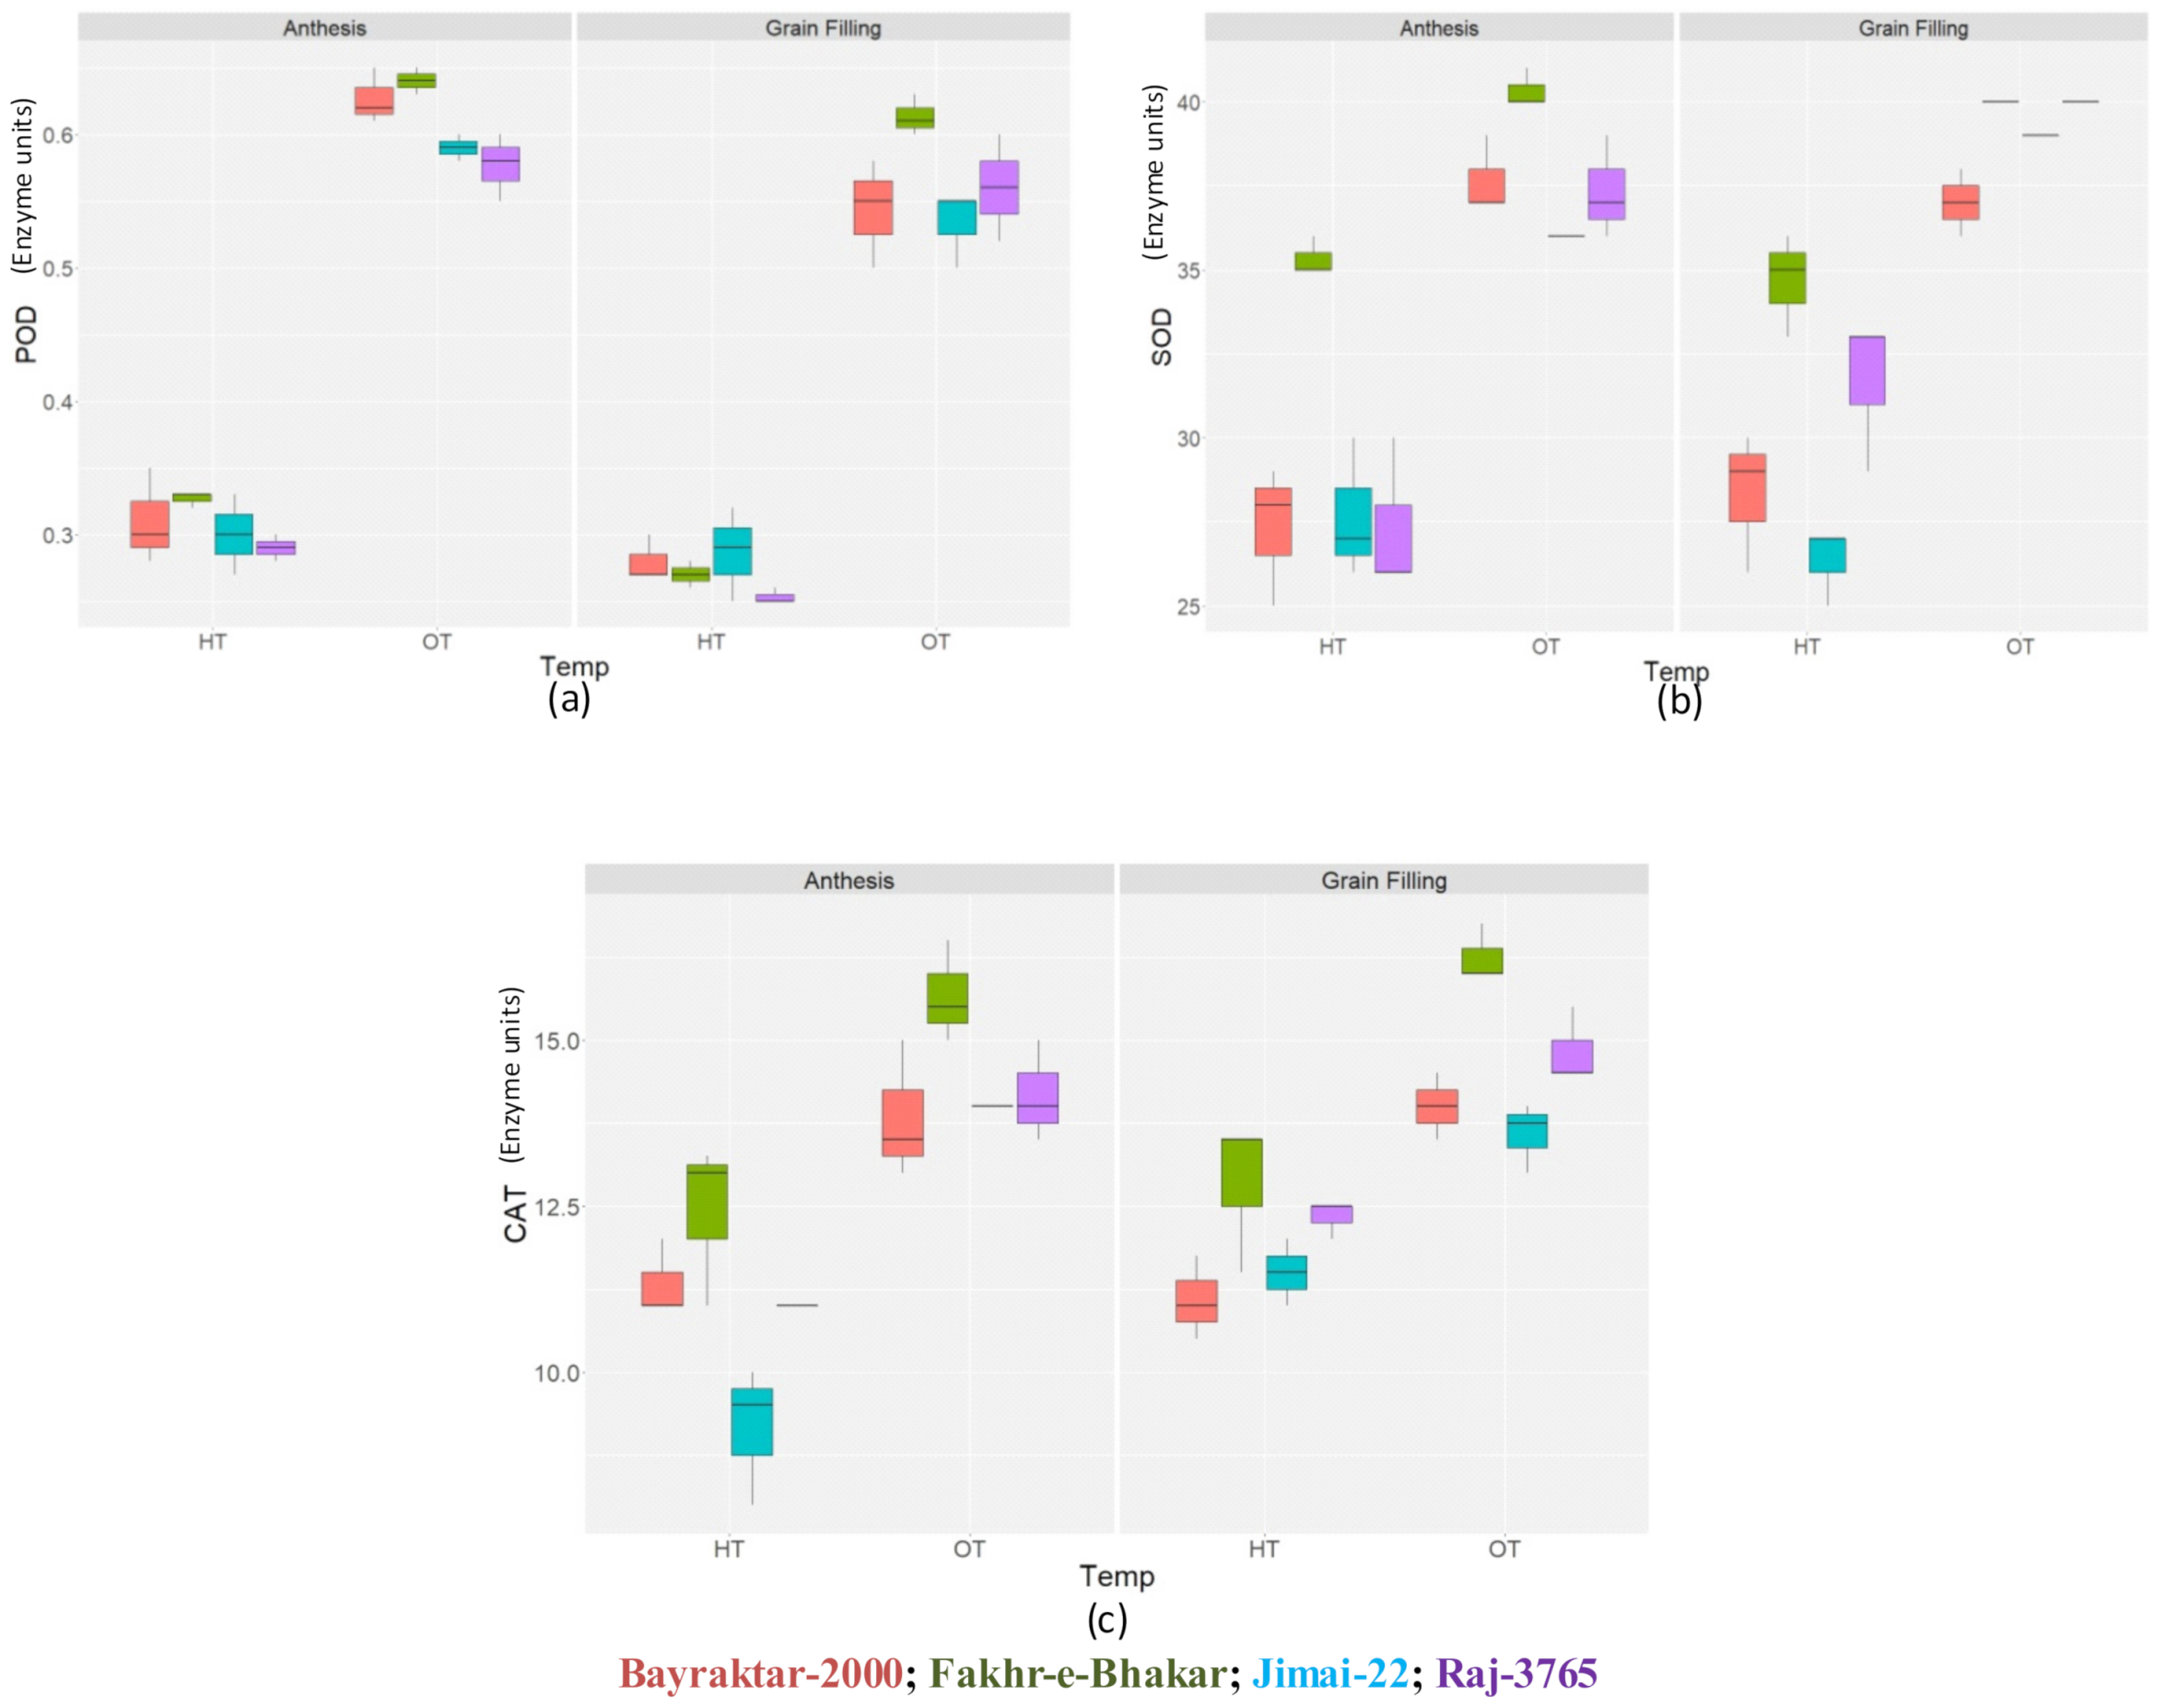
3.1.2. Antioxidant Enzymes

During both experimental phases, the antioxidant contents of CAT, SOD and POD illustrated significant (p ≤ 0.05) changes during both temperature treatments (Figure 2a–c).During both reproductive stages, the antioxidants revealed significant (p ≤ 0.05) reductions in all the genotypes at the HT in comparison to the OT. The enzyme POD did not exhibit a significant difference in activity among the genotypes at an HT during both the grain-filling and anthesis stages, although this difference was significant at the OT (Figure 2a). On the other hand, CAT and SOD revealed a maximum activity in Fakhr-e-Bhakar during the anthesis and grain-filling stages in both regimes of temperature. At the grain-filling stage, SOD recorded a minimum activity in Jimai-22 during the HT regime, while CAT recorded a minimum activity in Jimai-22 during anthesis stage at the HT compared to the other genotypes (Figure 2b,c). Besides, CAT showed the lowest activity in Bayraktar-2000 at the HT during the grain-filling stage (Figure 2c).

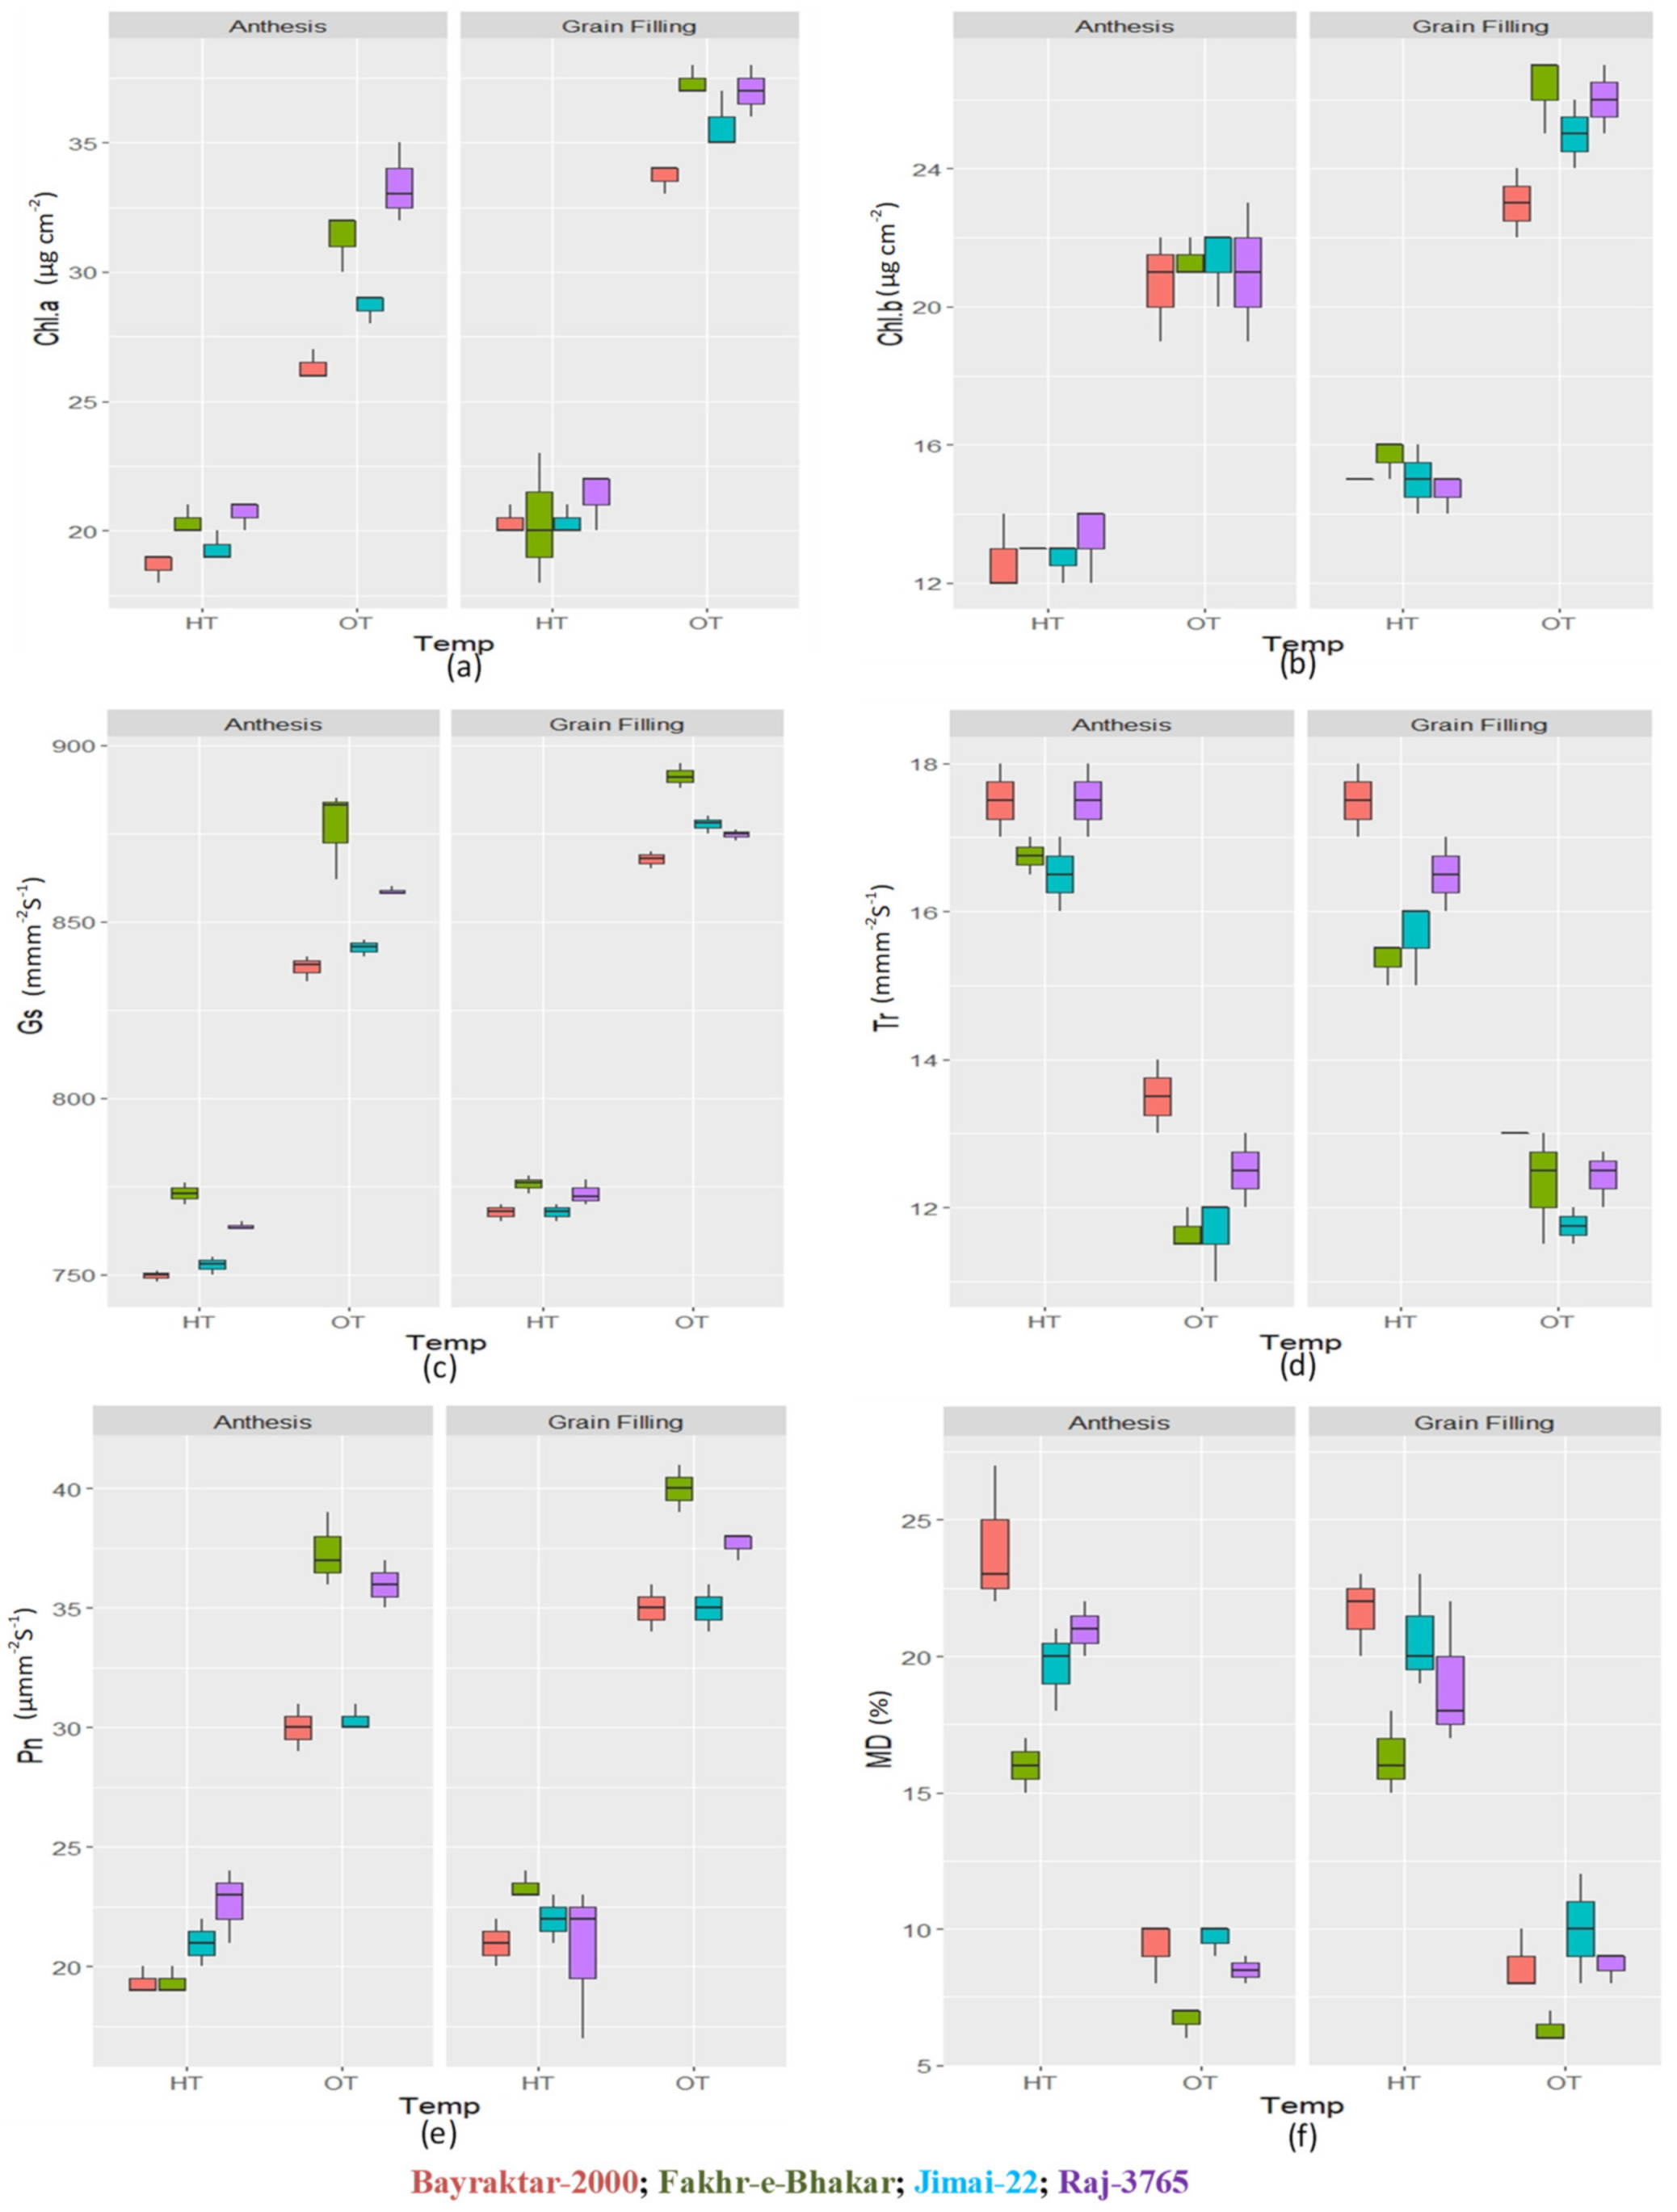
3.2. Physiological Parameters

All physiological parameters, such as Chl a, Chl b, Gs, Tr, Pn and MD, illustrated significant (p ≤ 0.05) variations during both regimes of temperature in both experiments. During both the anthesis and grain-filling stages, Chl a, Chl b, Gs and Pn illustrated a significant decline in all genotypes at the HT compared to the OT, while this reduction was more dramatic at the anthesis stage (Figure 3a–c,e). Among the genotypes, Bayraktar-2000 recorded the lowest quantity for all four of the physiological parameters, while Fakhr-e-Bhakar recorded the highest. Conversely, the HT conditions created a significant increase in Tr and MD compared to the OT during both phases of experiment (Figure 3d,f). Bayraktar-2000 depicted the maximum values of MD and Tr during the anthesis and grain-filling stages, while Fakhr-e-Bhakar showed the minimum (Figure 3). Moreover, the MD and Tr contents in all genotypes during the anthesis phase were comparatively greater than the grain-filling stage the HT. Overall, all the genotypes showed higher values of Chl a, Chl b, Gs and Pn at the grain-filling stage as compared to the corresponding regimes of temperatures at the anthesis stage. On the other hand, Gs and MD illustrated the higher values in all genotypes during the anthesis stage compared to the grain-filling stage under the corresponding temperature regimes.

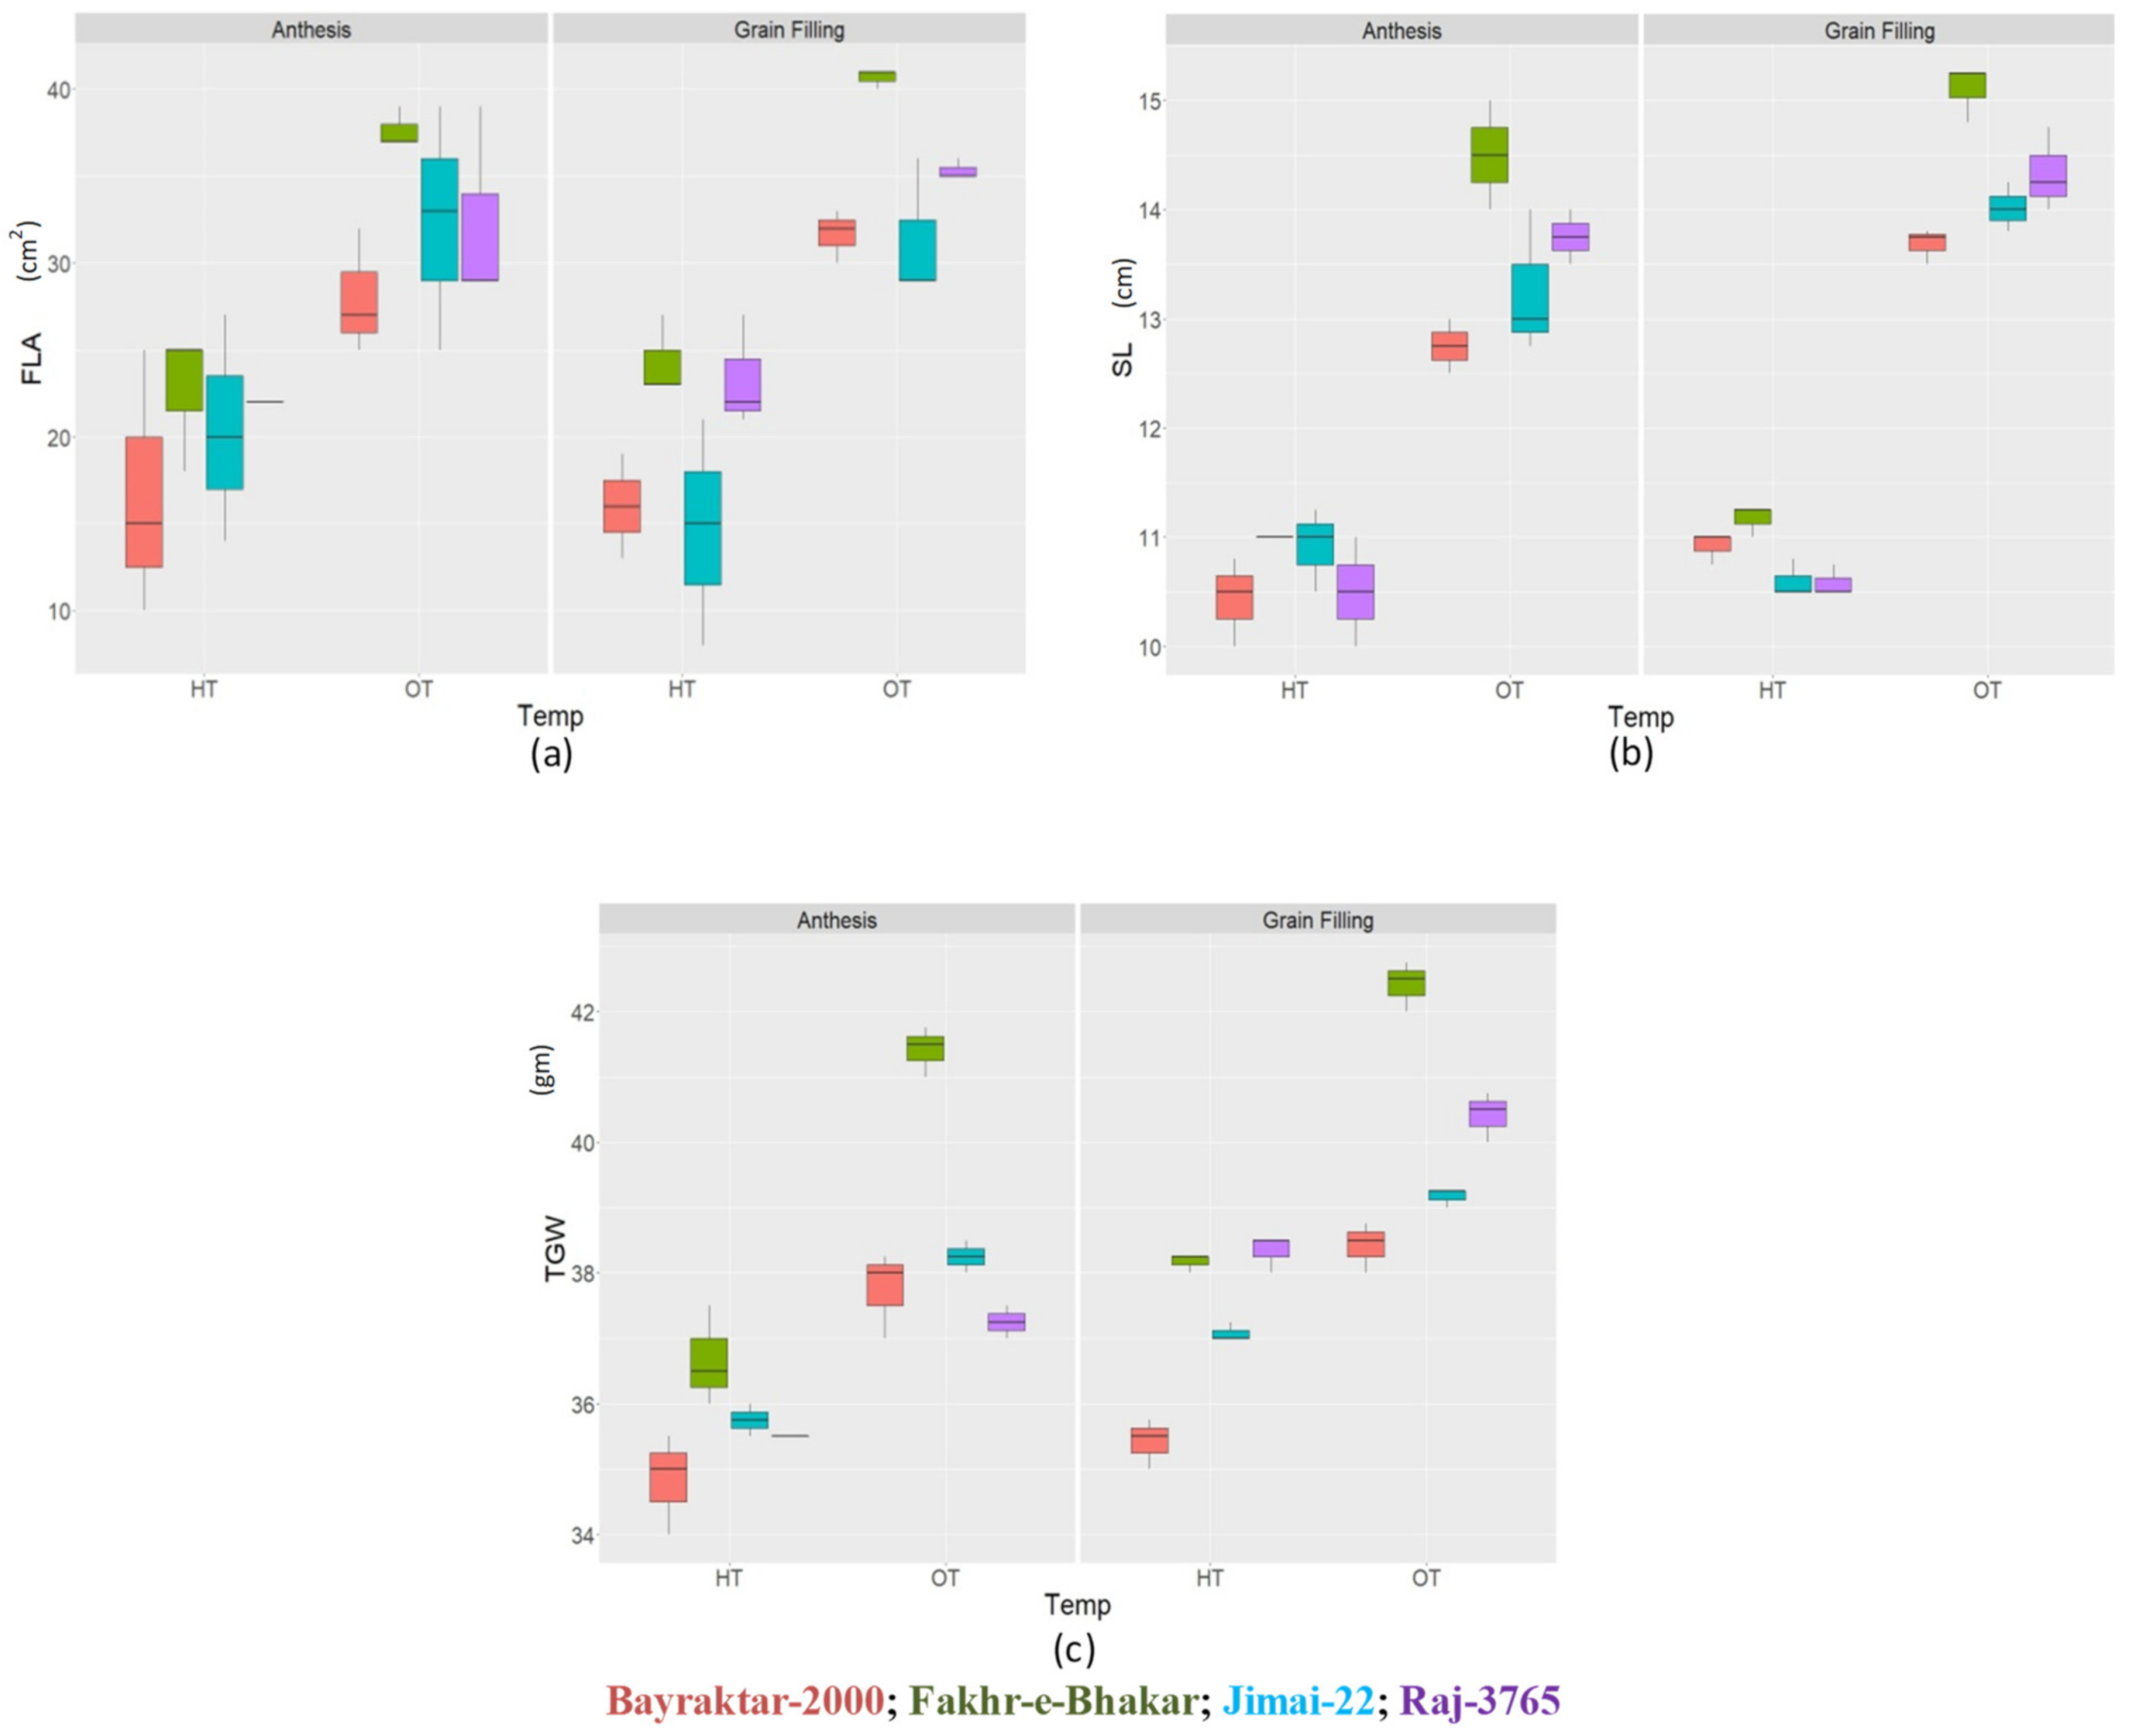
3.3. Agronomic Parameters

During both experiments, the agronomic traits such as FLA, SL, and TGW varied significantly (p ≤ 0.05) under both regimes of temperature (Figure 4a–c). At both the anthesis and grain-filling stages, the agronomic traits illustrated a significant decrease in all the genotypes during the HT as compared to the OT. The FLA displayed a significant (p ≤ 0.05) decline in all the genotypes at the HT during both experiments (Figure 4a). FLA showed a minimum reduction in Fakhr-e-Bhakar during both the anthesis and grain-filling stages at the HT compared to the other genotypes. However, FLA revealed a maximum decline in Bayraktar-2000 during the anthesis stage and in Jimai- 22 during the grain-filling stage. Moreover, at the OT, Fakhr-e-Bhakar illustrated the maximum FLA followed by Raj-3765. Furthermore, the SL and TGW showed a significant reduction in all the genotypes at the HT during both experiments. Among the genotypes, Fakhr-e-Bhakar revealed a minimum while Bayraktar-2000 showed a maximum reduction for these traits under the HT during the anthesis and grain-filling stages (Figure 4b,c). Meanwhile, at the OT, these contents recorded the highest mean values in Fakhr-e-Bhakar, followed by Raj-3765, during both experiments. Interestingly, during the grain-filling stage, all of the agronomic parameters of the genotypes demonstrated higher values as compared to the anthesis stage under the corresponding temperature regimes (Figure 4).

3.4. SEM Micrographs

SEM micrographs were generated for randomly selected flag leaf samples of all four genotypes from both regimes of temperature (Figure 5). The starch granulation displayed a clear difference in all the genotypes at both the OT and HT. Starch granules were highly integrated at the OT as compared to the HT. The high temperature dispersed the integrity of the starch granules in all genotypes; however, this dispersion reached a maximum in Bayraktar-2000 and a minimum in Fakhr-e-Bhakar (Figure 5).

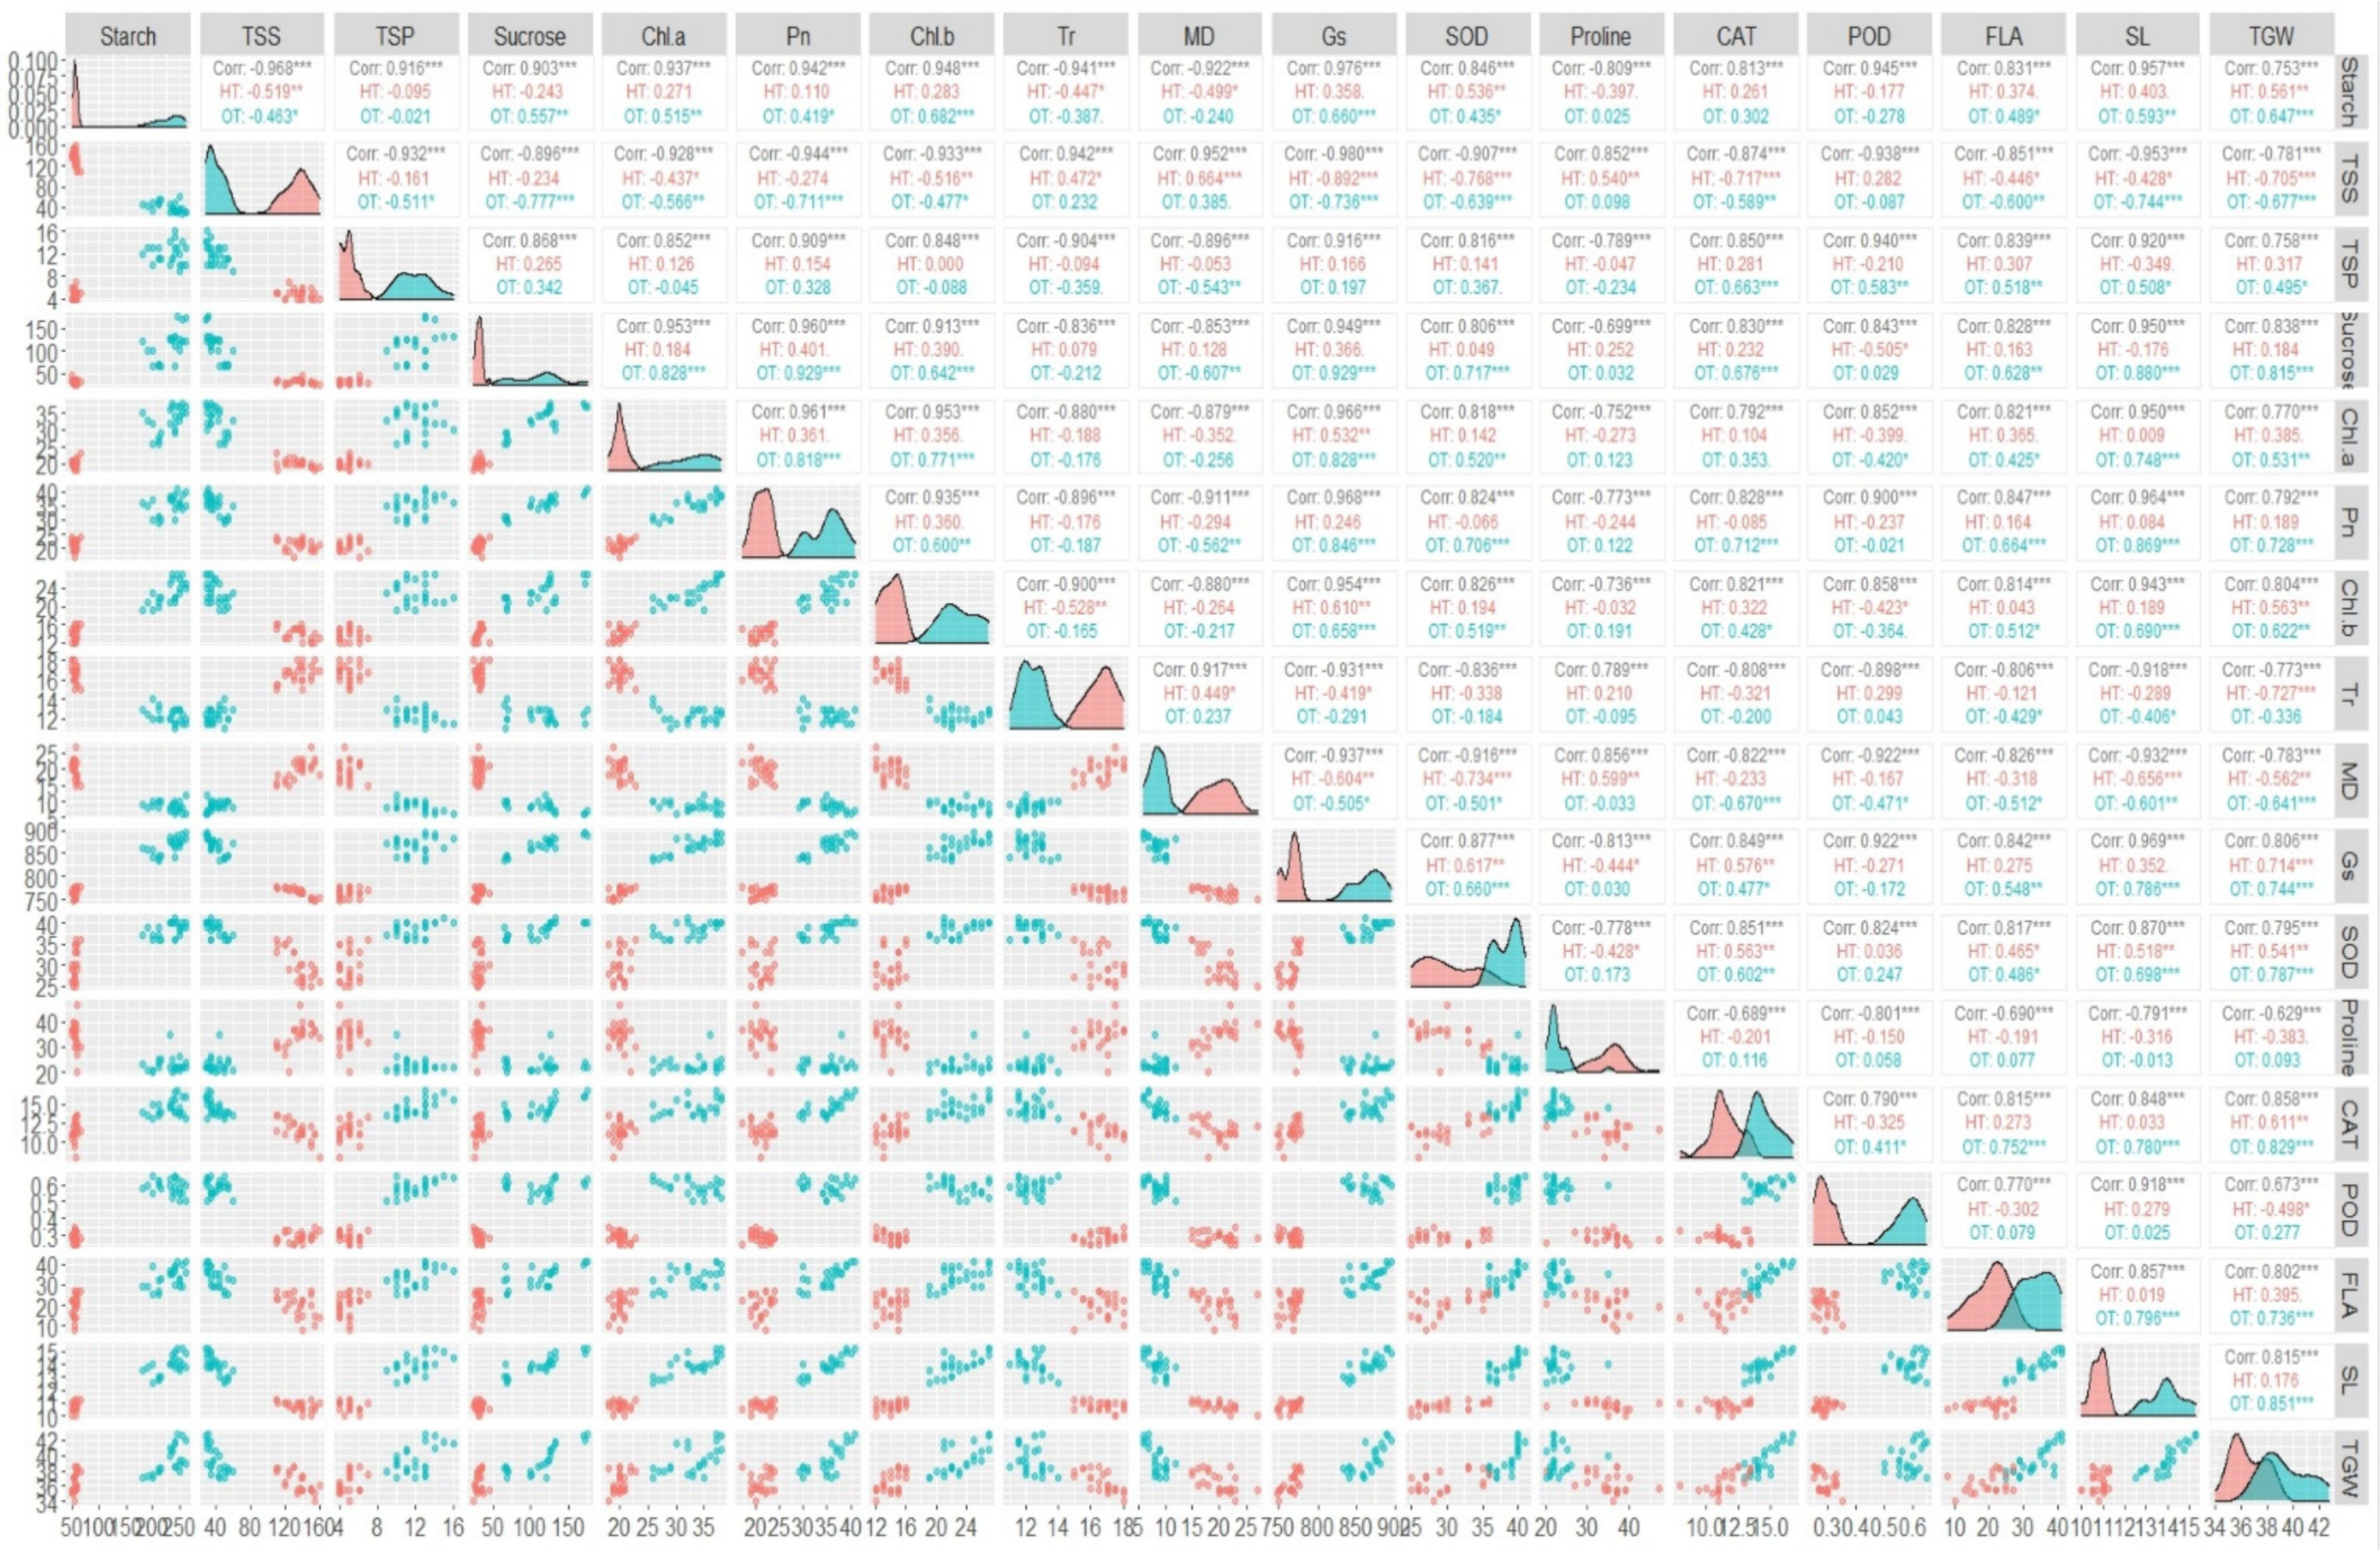
3.5. Correlation Analysis

The correlation analysis of all parameters depicted the significant effect of the treatments on the association between the pairs of different variables. The starch content varied in the opposite direction to TSS, Tr and MD, while it varied in same direction as SOD due to the HT, compared to the control (Figure 6). Moreover, the other parameters illustrated no significant correlation with starch. The TSS content exhibited a statistically significant correlation only with MD, Gs, SOD and TGW at HT, whereas it changed positively with MD and negatively with Gs, SOD and TGW, as illustrated in Figure 6.Furthermore, at the OT, TSS showed a significant converse relation with traits such as TGW, SL, FLA, CAT, SOD, Gs, Pn and sucrose, and a significant direct relation with MD (Figure 6). Some osmolytes, such as TSP and proline, illustrated no significant correlation with the other parameters at both regimes of temperature. The sucrose content demonstrated a noteworthy parallel change with Chl a, Pn, MD, Gs, SOD, CAT, FLA, SL and TGW at the OT. However, the sucrose content displayed a significant direct relation with Chl aat the HT (Figure 6).
Among the physiological parameters, Chl a depicted a significant correlation with Pn, Chl b and Gs for OT, as compared to HT (Figure 6).On the other hand, Pn made a positive improvement with Gs, SOD, CAT, FLA and SL at the OT compared to the HT. However, as compared to the HT, Gs showed a significant association with Chl b at the OT. Furthermore, TGW revealed a remarkable converse relationship with Tr at the HT compared to the OT (Figure 6). Increasing the MD at the HT significantly reduced SC, SOD, FLA and TGW, while at the OT the MD showed a significant negative association with proline, FLA and TGW (Figure 6).
Similarly, during both stages of reproductive growth, all the paired traits showed a statistically significant interaction (Figure 7). The traits such as MD, TSS and Tr showed a negative association while the rest of the traits exhibited a positive association during pairing. At the anthesis stage, the antioxidants SOD, CAT and POD demonstrated a maximum paired interaction with the other parameters as compared to the grain-filling stage (Figure 7). At the grain-filling stage, the physiological parameters, Chl a, Chl b, Pn and Gs, exhibited a relatively high significant association with the remaining parameters as compared to the anthesis stage (Figure 7). Among the osmolytes, the starch, sugar and TSP contents showed a higher significant pairing with the antioxidants, physiological parameters and agronomic traits at the grain-filling stage as compared to the anthesis stage. Moreover, as compared to the grain-filling stage, the TSS revealed a significantly higher negative correlation with the other parameters at the anthesis stage (Figure 7).

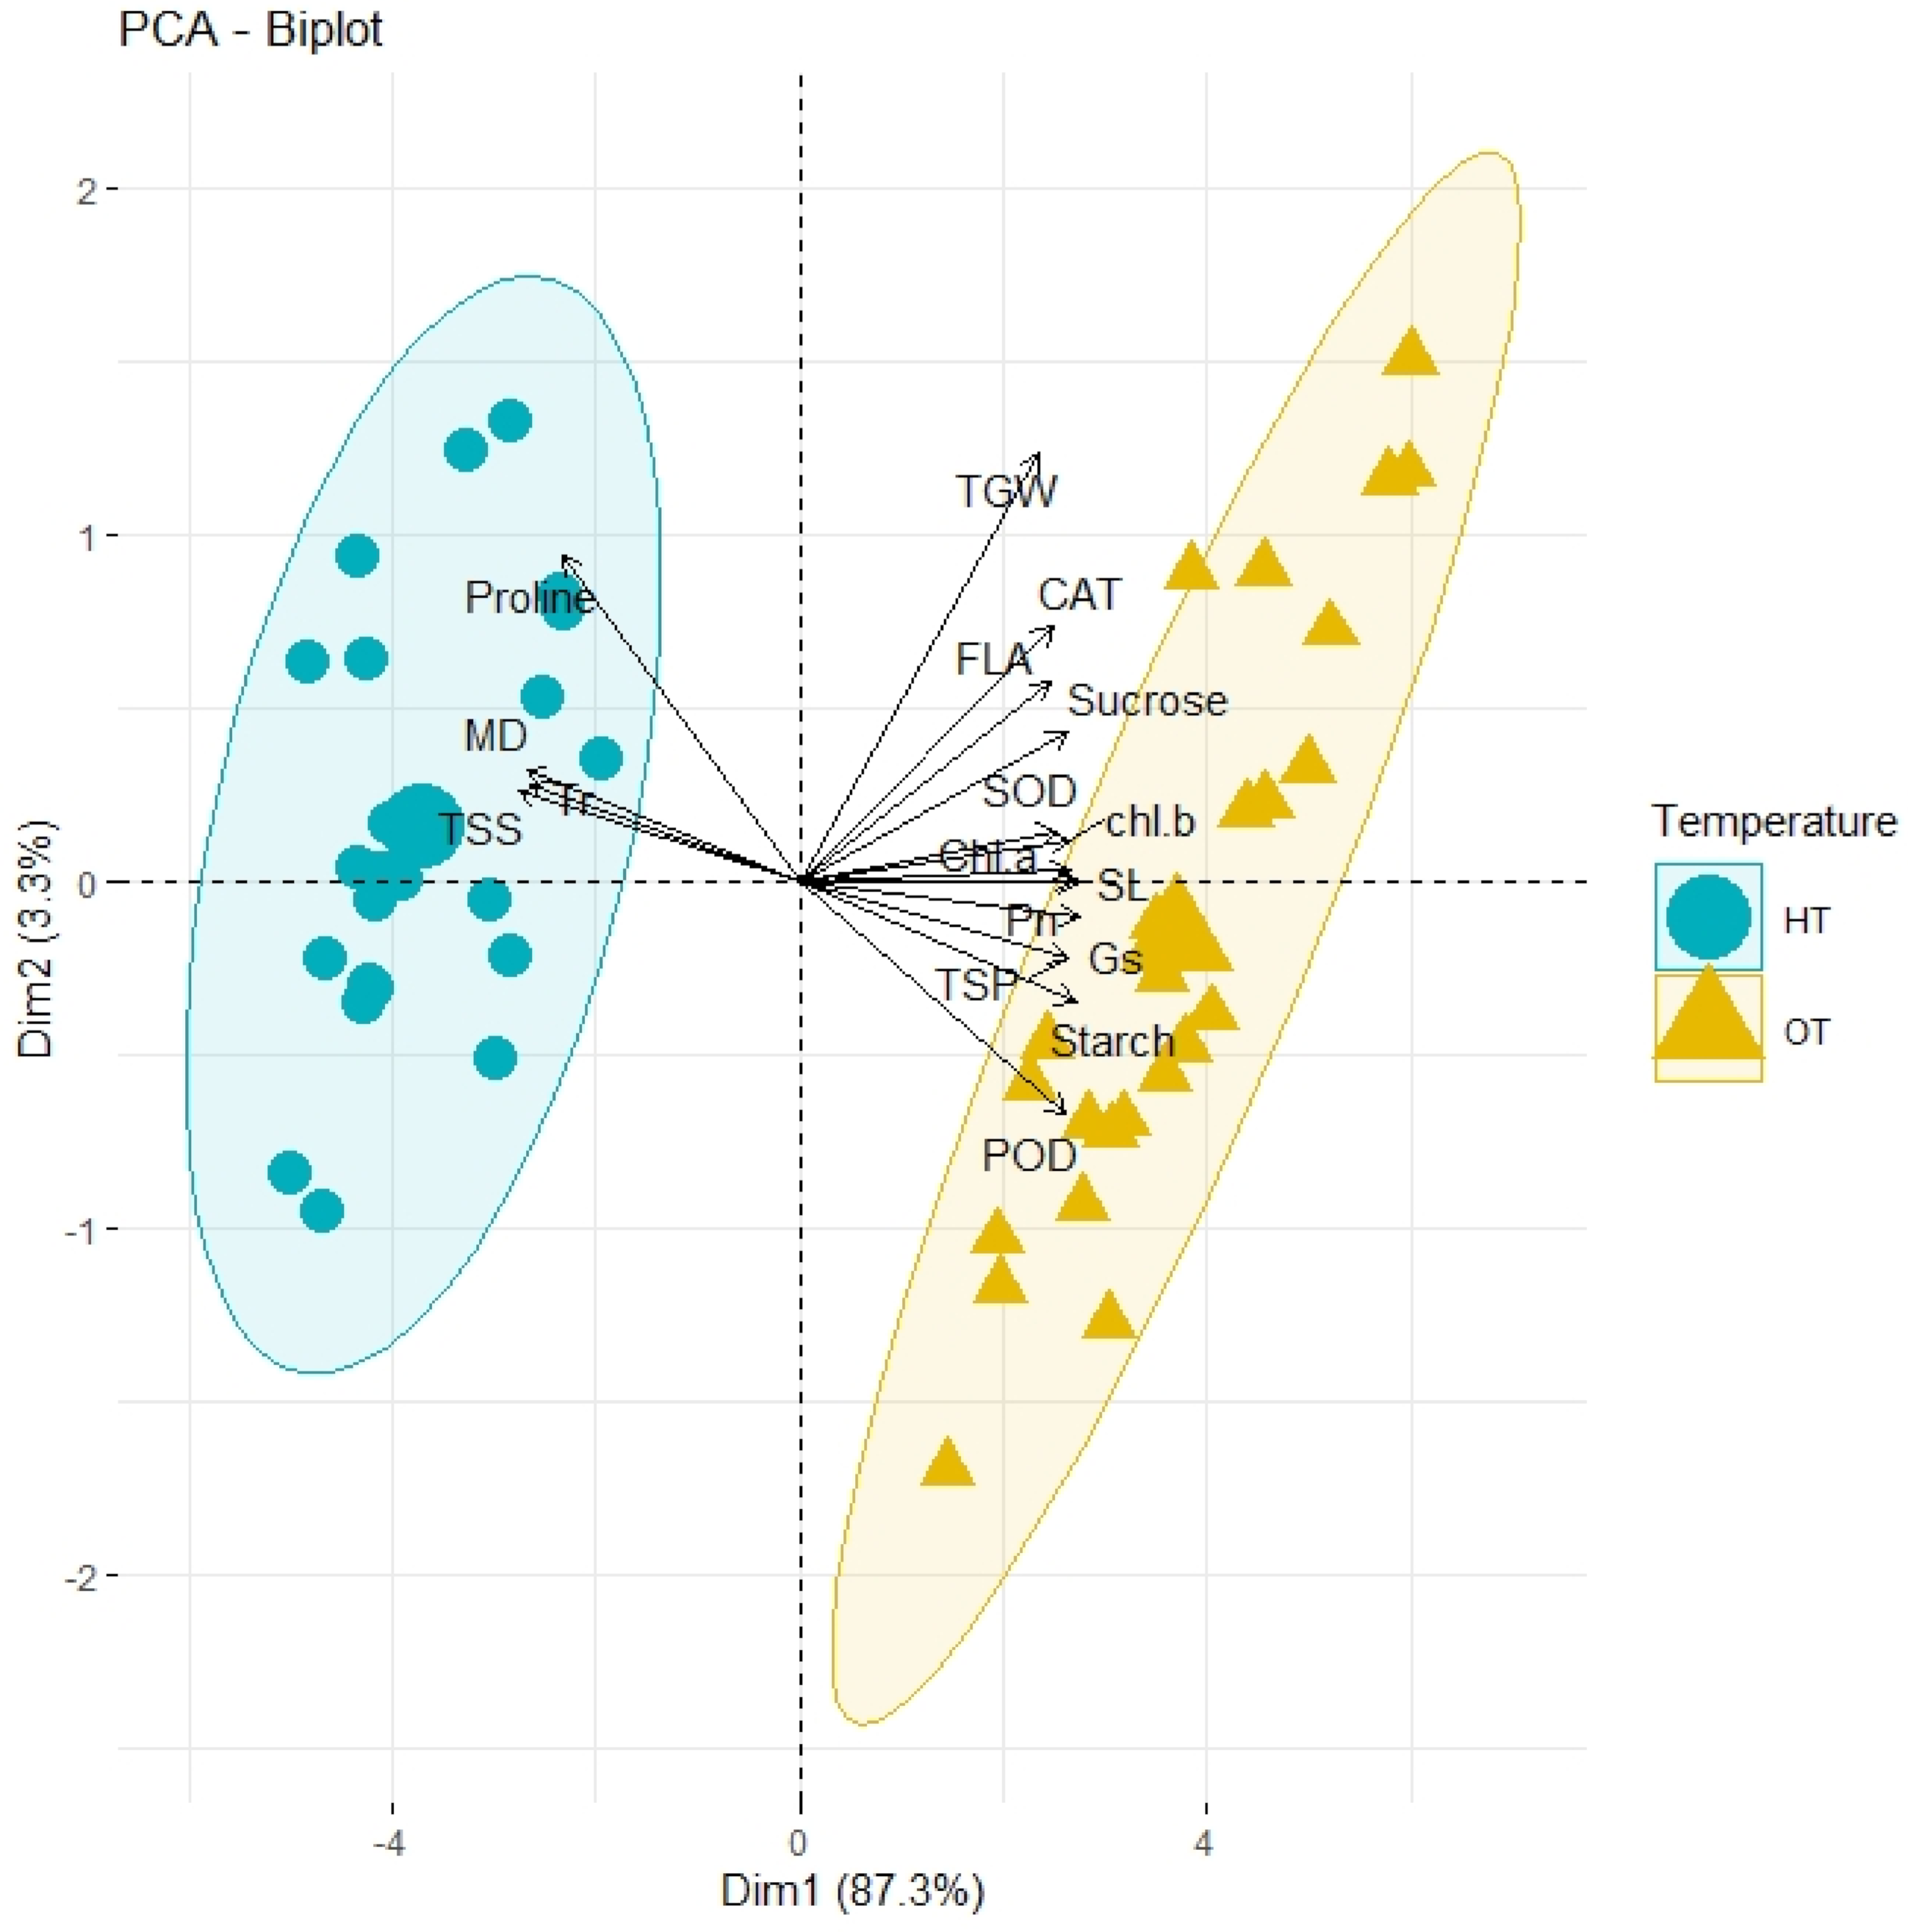
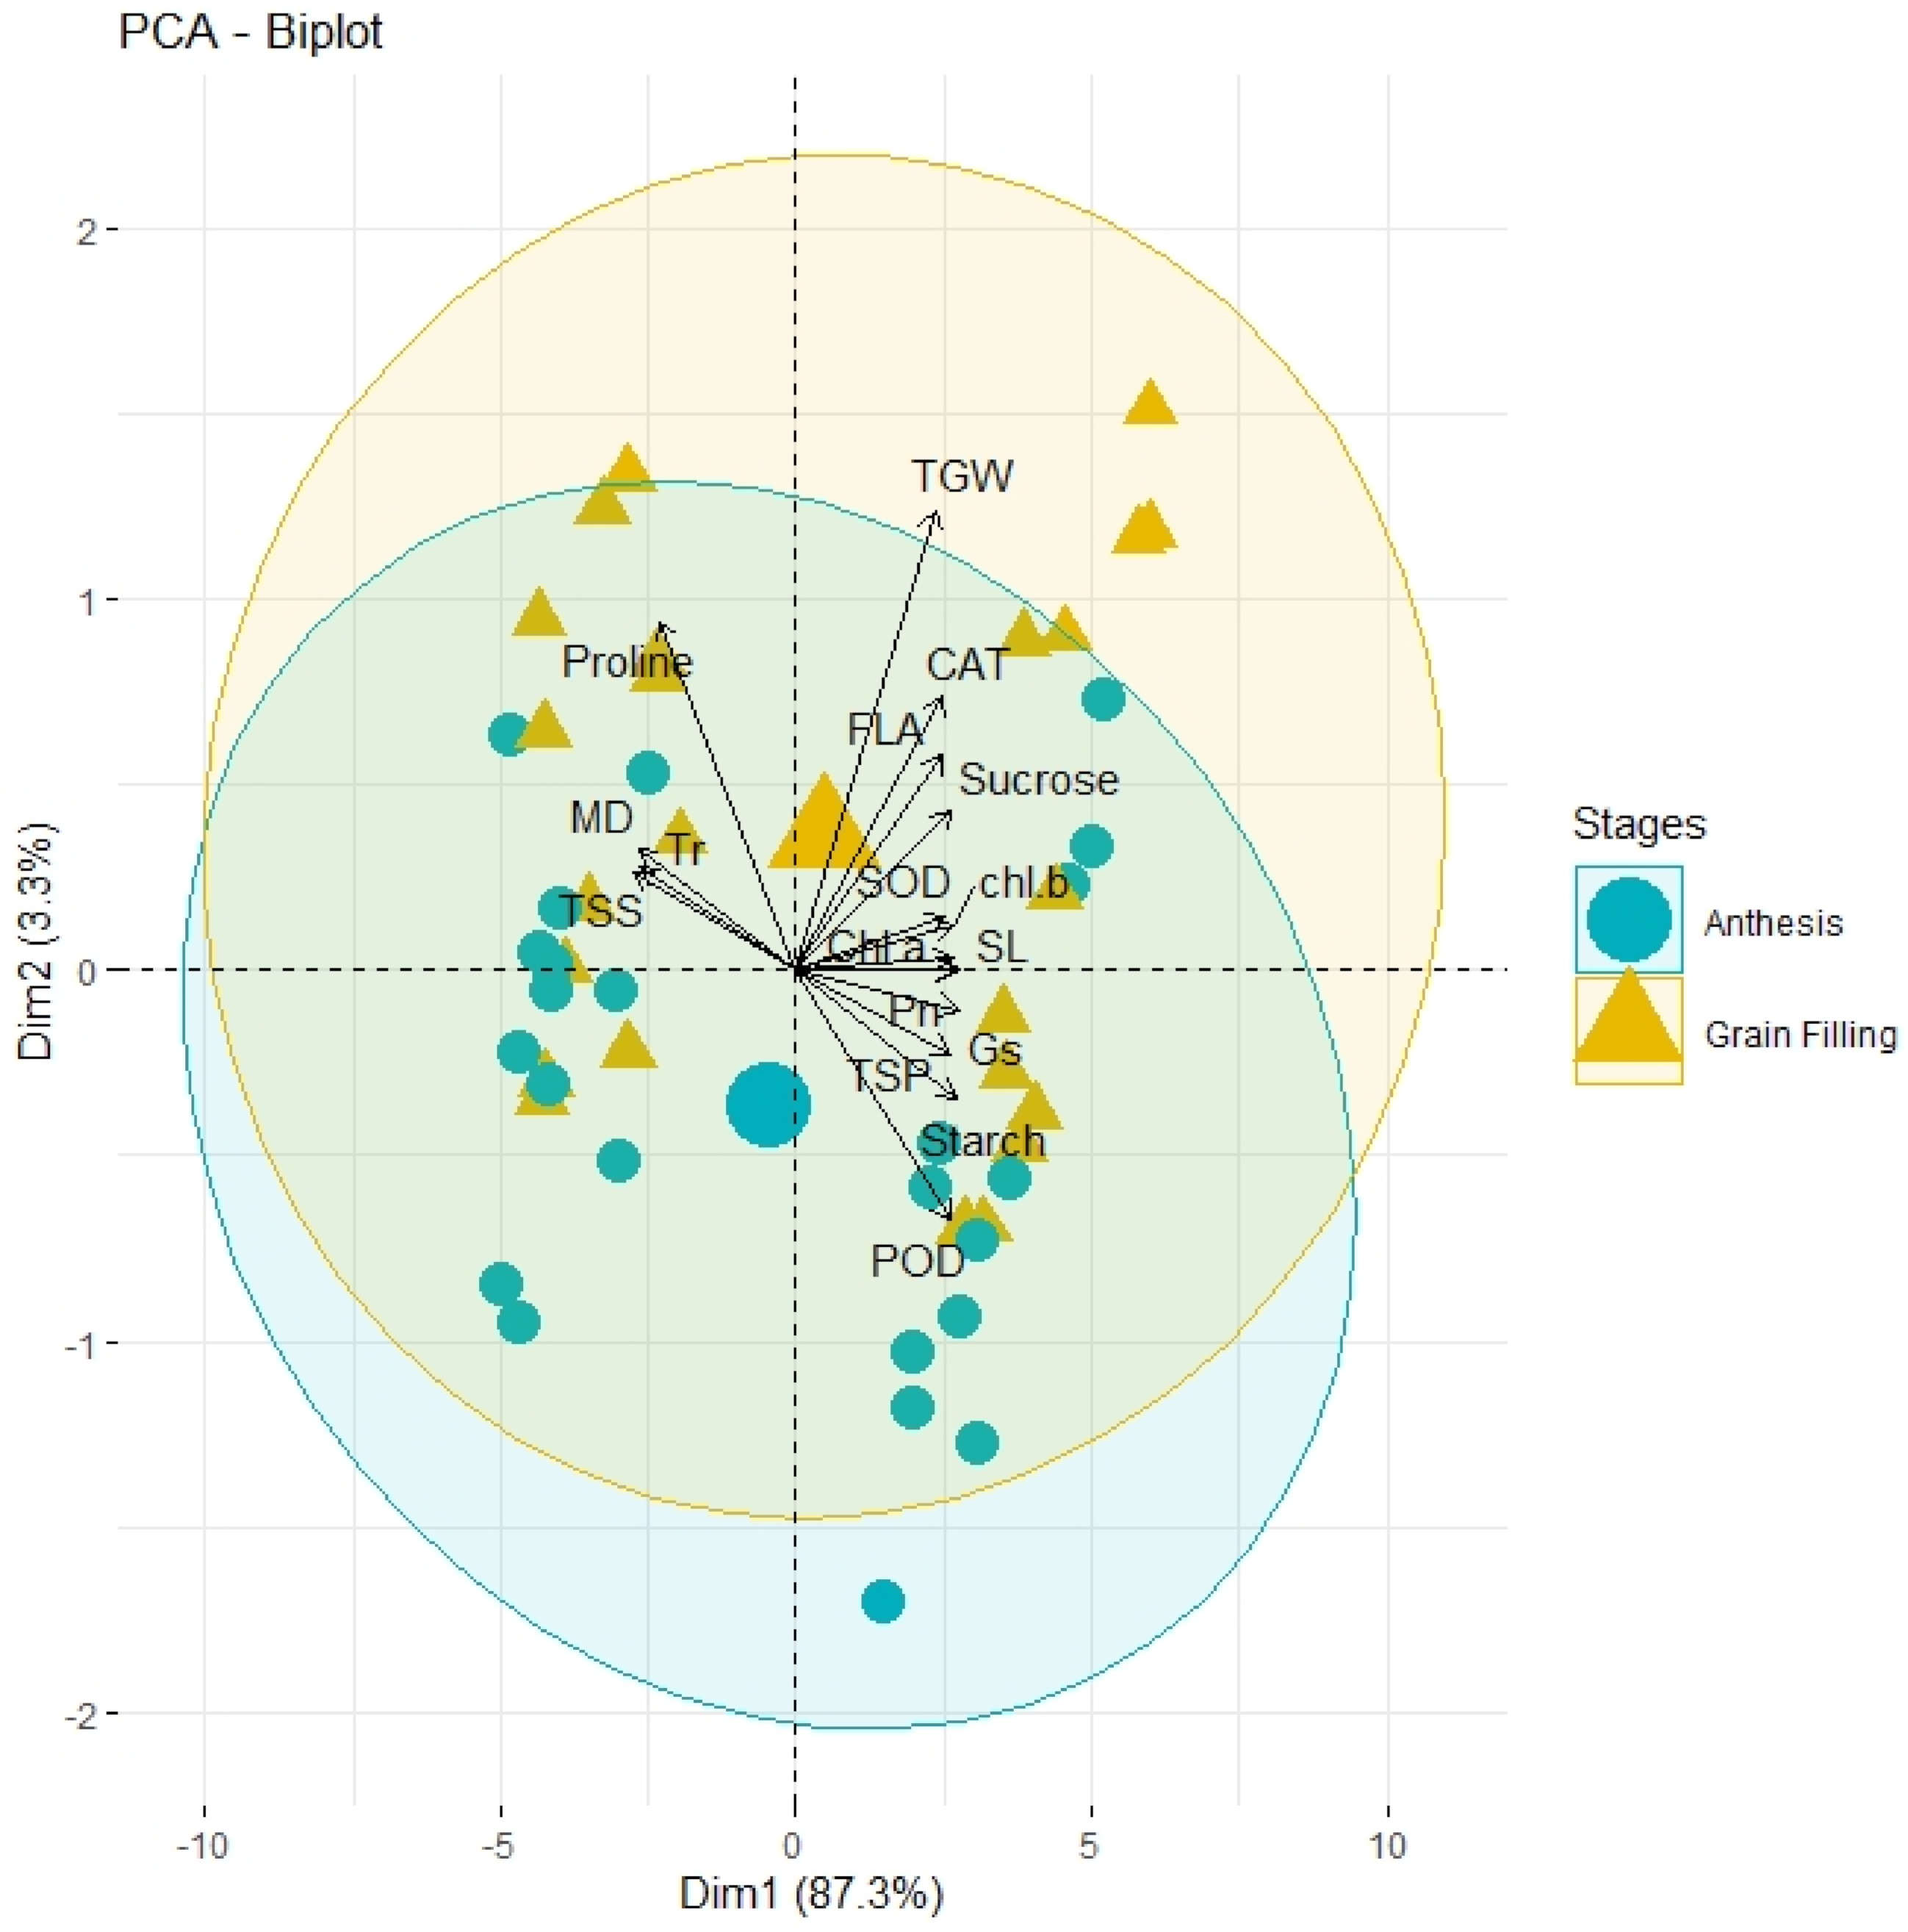
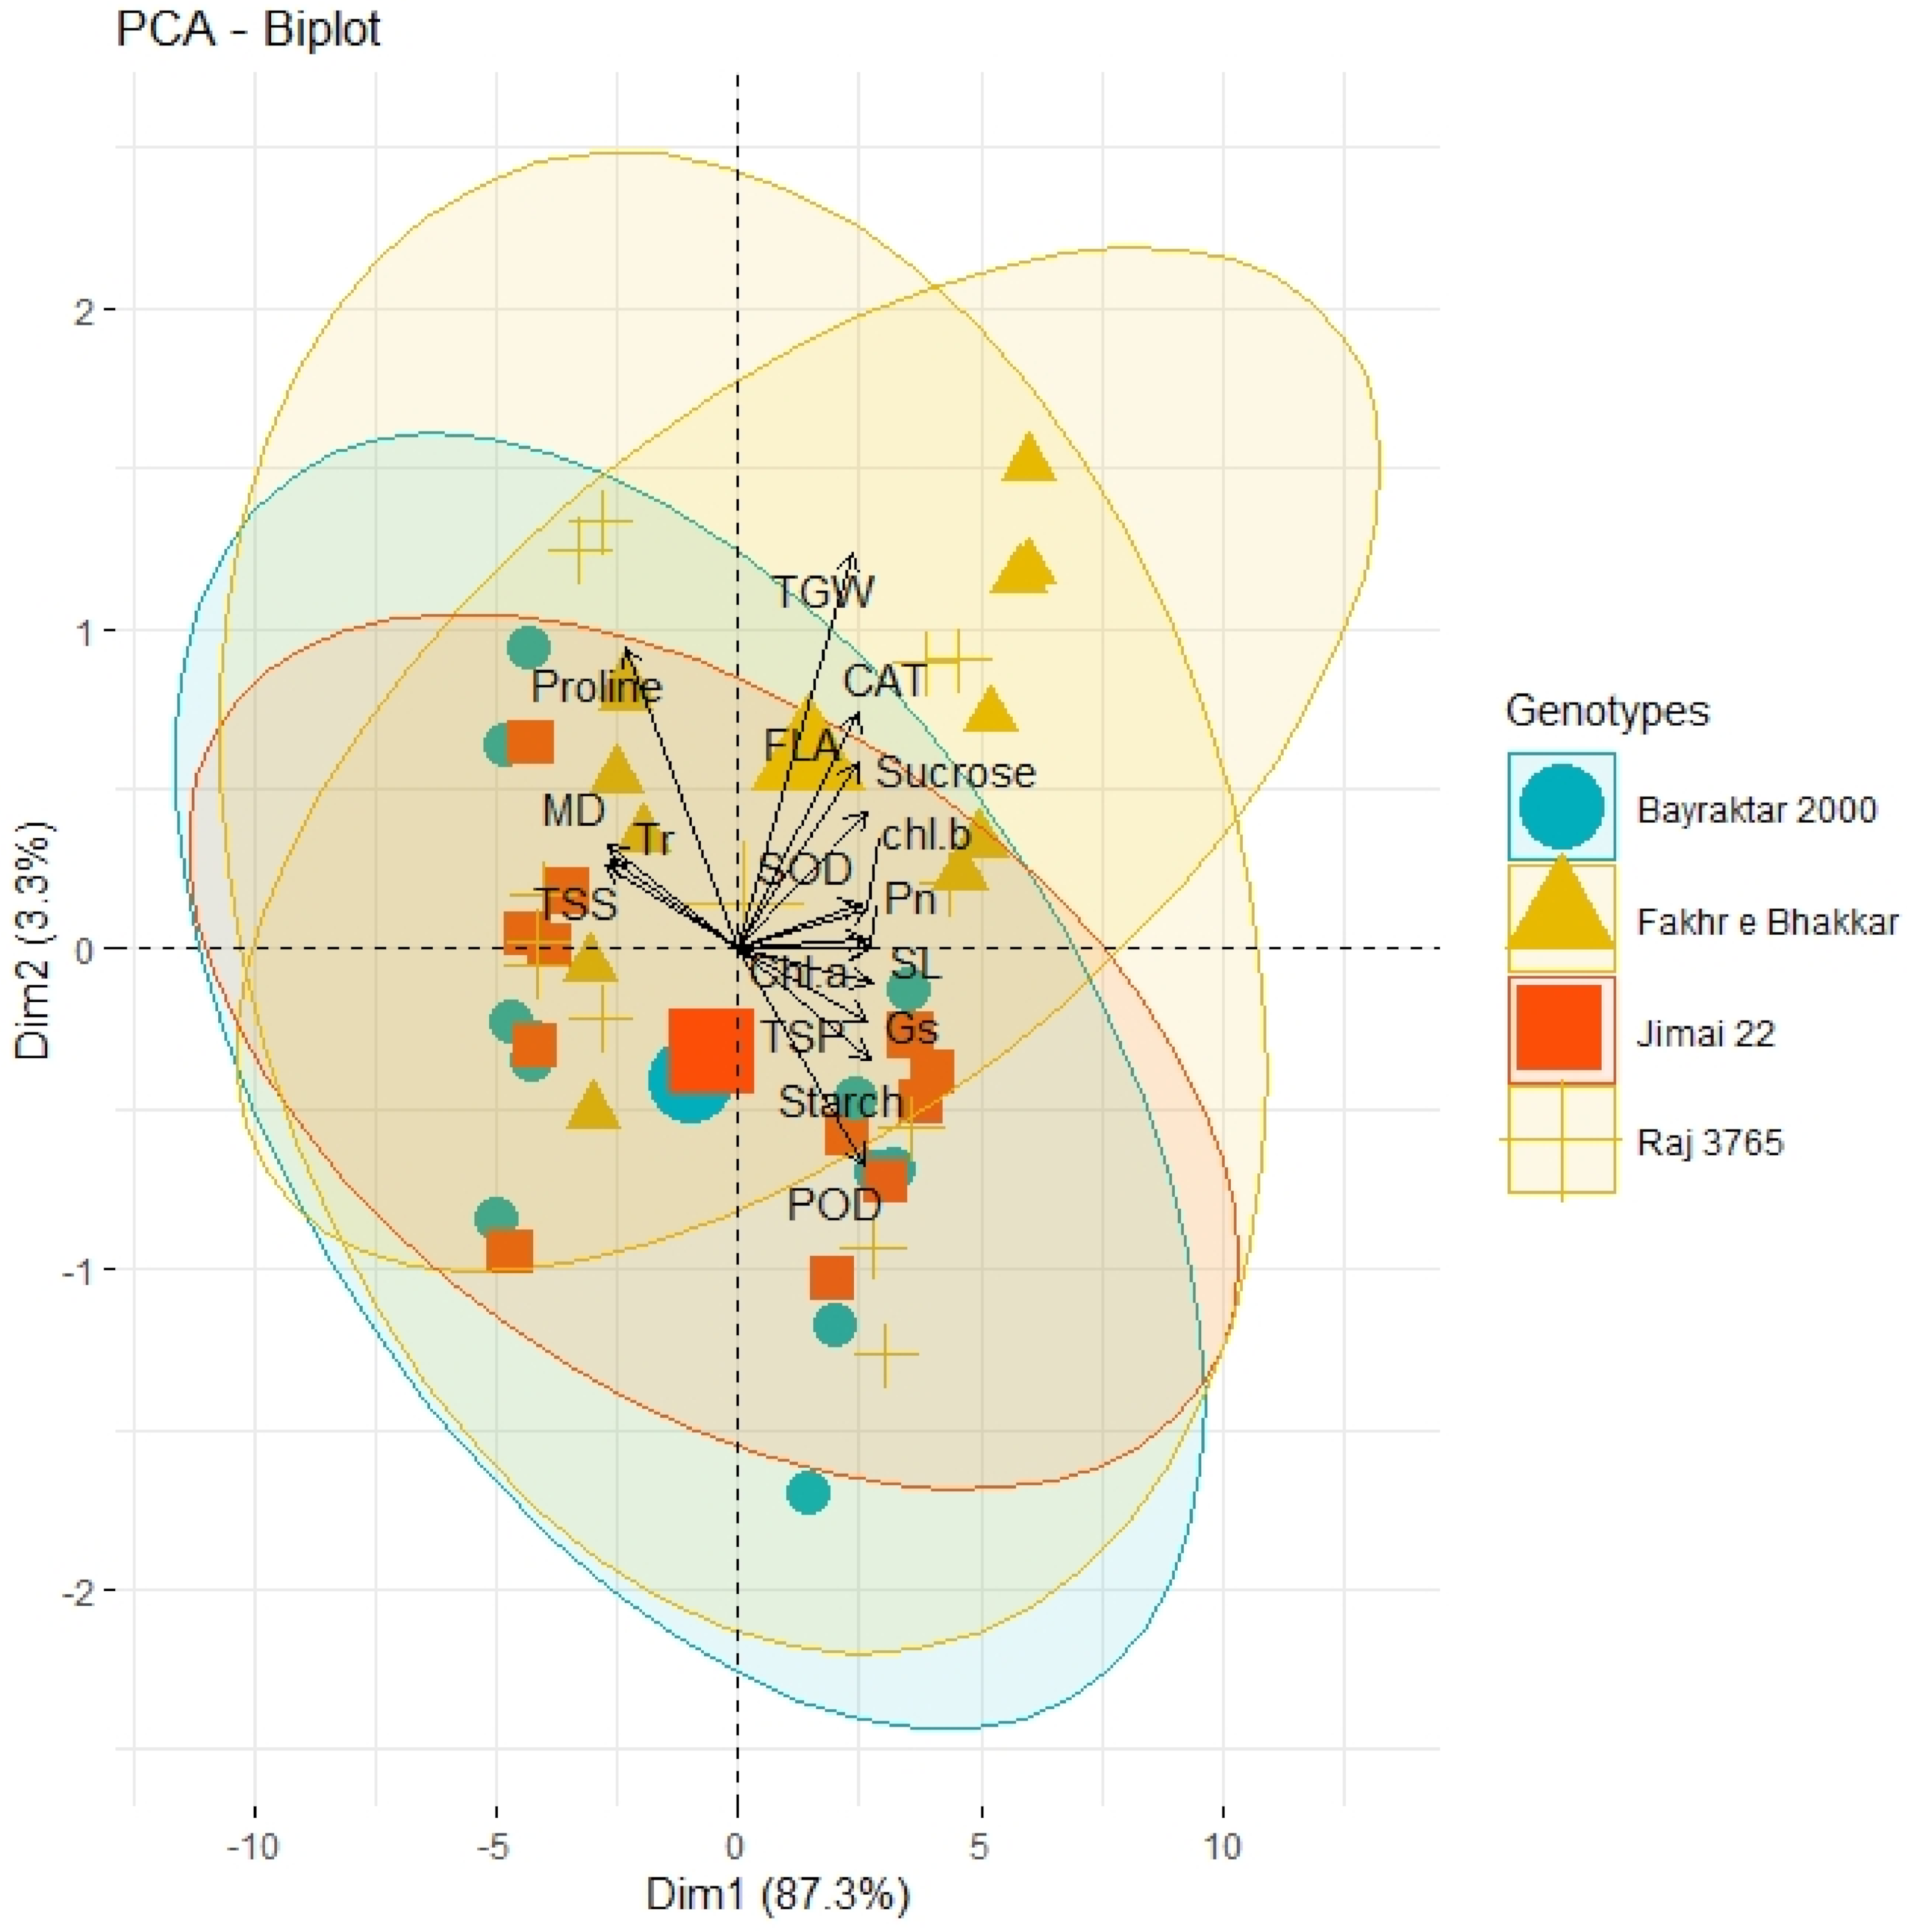
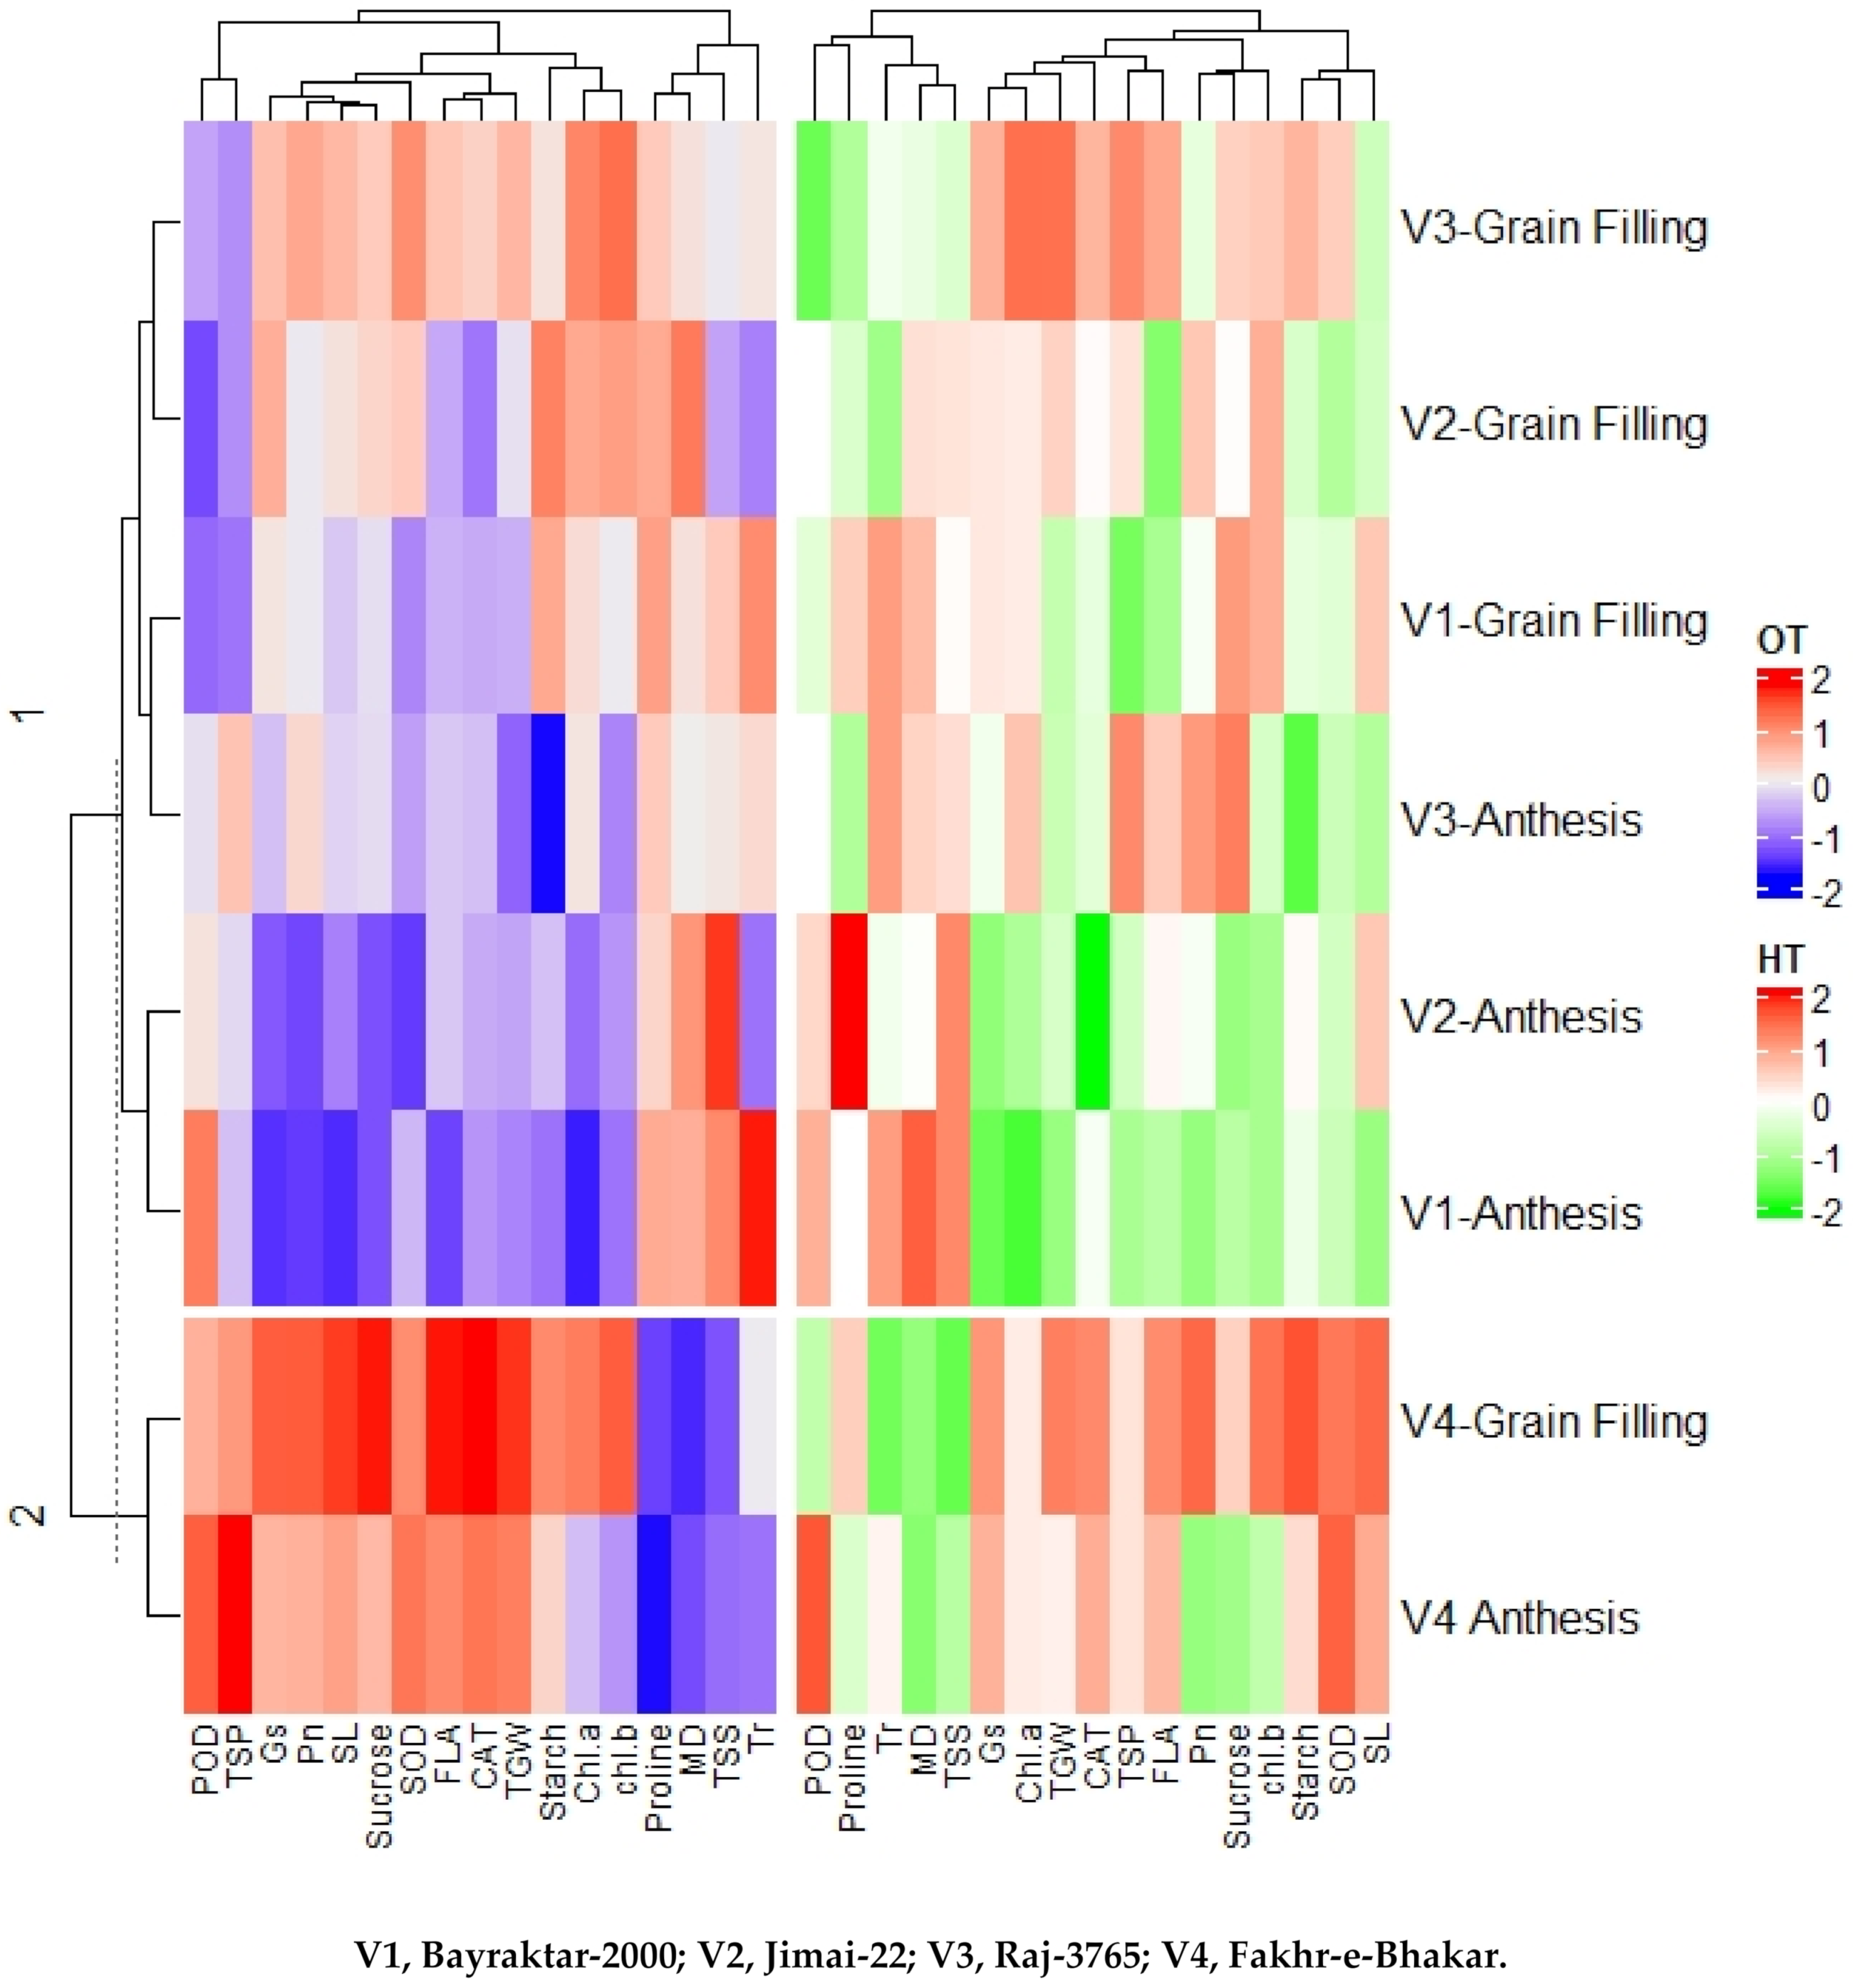
3.6. PCA and Heatmap Analysis

The PCA analysis of the temperature regimes revealed a prominent difference of traits at both levels of temperature, although the traits at OT illustrated a comparatively higher dispersion (Figure 8). On the other hand, the traits at the anthesis and grain-filling stages remained in proximity and did not illustrate a significant variation in the form of different groups (Figure 9). Furthermore, among the genotypes, Fakhr- e-Bhakar demonstrated a maximum divergence of traits as compared to the other genotypes (Figure 10).
The cluster heat map analysis summarized the responses of the osmolytes, physiological parameters, antioxidants and agronomic traits of the genotypes at the anthesis and grain-filling stages under both regimes of temperature (Figure 11). In the context of traits association, the heat map divided the genotypes into two main dendrograms with respect to their stages at each regime of temperature. At the OT, Fakhr-e-Bhakar marked one cluster, while Bayraktar-2000, Jimai-22 and Raj-3765 marked another separate cluster, in terms of the trait association and expression during the anthesis and grain-filling stages. Similarly, the genotypes showed an analogous trend of dendrograms formation at the HT. All the traits illustrated differential associations varying from positive to negative extremes in all the genotypes during both the reproductive stages and under the optimum and high temperature regimes, as demonstrated in Figure 11.

4. Discussion

The current study explicated the impact of different temperature regimes on the osmolytes, physiological parameters, antioxidant enzymes and agronomic traits of wheat genotypes during the anthesis and grain-filling stages (Figure 1, Figure 2, Figure 3 and Figure 4). The changes in the levels of osmolytes, such as carbohydrates, proteins and amino acids, during heat stress are an indicator of a plant’s homeostatic adjustment, as reviewed by Shah et al. [14]. Various studies validated the accumulation of the total soluble sugars (TSS) and proline in plants under abiotic stress [12,13]. In the current study, the plants showed an enhanced proline content at the HT compared to the OT during both experiments (Figure 1). Correspondingly, this increase was also reported by the other researchers who authenticated the role of proline as a stabilizer of the cell membrane, subcellular structures and redox potential by scavenging the free radicals [28,29]. Moreover, the increase in the TSS content was reported in plants subjected to an HT as compared to an OT during both the grain-filling and anthesis stages (Figure 1). The high TSS and proline content in a susceptible wheat genotype such as Bayraktar-2000, compared to the other genotypes during plant stress, ensured the role of TSS as an osmoprotectant [9] that accumulated because of a high sensitivity to HT stress. Conversely, the lowest concentration of proline and TSS in the genotype, Fakhr-e-Bhakar, indicates its low sensitivity to HT. In fact, the accumulation of osmolytes such as TSS is a consequence of starch breakdown (Figure 5) that takes place at an elevated temperature [30], which was correspondingly proven in the current study (Figure 1). Moreover, this may be the possible reason for the negative association of starch and sucrose content with TSS and proline (Figure 6 and Figure 7) at both reproductive stages. Moreover, SEM micrographs also confirmed the disruption of the starch content at the HT (Figure 5). Heat stress perturbs the accumulation of carbohydrates in leaf by disrupting their metabolic pathways; however, such changes vary with the nature of the crop [31]. The complementary results were reported in the present study in the context of starch and sucrose contents due to an HT as compared to an OT.
Under the conditions of heat stress, the growth and the development of a plant may decrease due to the source and sink limitations that restrict grain set and grain filling [32]. Photosynthesis is highly correlated with grain set; therefore, when it is inhibited by HT stress at the reproductive stages the stem reserves the start of mobilization for supporting grain filling [33]. In wheat, the grain-filling process is seriously impaired by heat stress due to the photosynthetic reduction in leaf and spike. In this context, plants mobilize the reserves of water soluble carbohydrates such as sucrose from the leaves to the reproductive organs for sustaining grain growth and development [34]. Perhaps this was the reason for the reduction in leaf sucrose content under HT stress during both the anthesis and grain-filling stage(Figure 1). The reduction in net Pn and Gs due to HT stress is somehow associated with enhanced non-photorespiratory processes [35]. The impediment of photosynthesis is also a consequence of reduced TSP, such as in Rubisco and Rubisco binding proteins [36,37]. Our study showed a complete agreement with their findings and proved the negative association of TSP with the physiological contents of Pn and Gs (Figure 6 and Figure 7). However, this association was more dramatic at the anthesis stage as compared to grain-filling stage (Figure 7). The most probable reason for this was the high sensitivity of membrane receptors that elicit the robust signaling crosstalk inside the cell [14].Furthermore, a high temperature during the anthesis and grain-filling phases reduced Pn and Gs by disrupting the membrane integrity (Figure 3). Furthermore, a high temperature also increased the damage to the thylakoid membrane because of its high sensitivity, as compared to other organelles [4]. The chlorophyll molecule is present in the thylakoid membrane as a part of PS-I and PS-II; therefore, the damage to the thylakoid membrane due to an HT can cause chlorophyll loss [17,38]. This strong negative correlation between MD and chlorophyll resulted in reduced Pn and Gs during both the anthesis and grain-filling stages (Figure 3, Figure 6 and Figure 7) and represented the failure of the membrane repair system leading to the net inhibition of Pn [39]. Although the increase in temperature decreased Pn and Gs during the anthesis and grain-filling stages (Figure 3 and Figure 7) due to a high MD, the latter decreased less at the OT than the former, contrary to the findings of Djanaguiraman et al. [4]. This could be attributed to the active leaf senescence and transpiration during the anthesis stage [40].In addition to the disruption of the physiological activities, the high temperature also caused a reduction in the yield parameters including the grain yield [13]. In wheat, the week before the anthesis and grain-filling stage is found to be more crucial in an HT [41]. Aliqing et al. [42] reported the decrease in spike length, grain number and grain weight due to an HT in post flowering plants more than pre flowering plants, because post flowering plants experienced an HT during gametogenesis; while pre flowering plants experienced an HT during flowering. On the other hand, during the HT oxidative damage to the thylakoid membrane and cristae led to an increase in ROS production [43] causing a continuous increase in oxidative damage, membrane damage and chlorophyll deterioration (Figure 2 and Figure 3). This revealed a significant correlation between the activity of the antioxidant enzymes and physiological contents, which caused an impediment in the activity of the antioxidant enzymes and disrupted the physiological processes directly at the HT during both the anthesis and grain-filling stages (Figure 6 and Figure 7). In fact, the HT perturbed the balance between ROS and the antioxidant enzymes [15]. Among the antioxidant enzymes, SOD served as the first line of defense against oxidative stress that actively removed the oxide ion (O−2), resulting in the generation of H2O2 and its efficient scavenging by CAT and POX [44]. Correspondingly, the current study recorded a decrease in the activity of the antioxidant enzymes, SOD, CAT and POD, at the HT compared to the OT (Figure 2). These outcomes proved that the HT downregulated the activity of antioxidant enzymes in the chloroplasts which exacerbated the deposition of ROS.
Correspondingly, the current study revealed a significant reduction in agronomic traits, namely TGW, SL, and FLA, during both the anthesis and grain-filling stages due to HT stress (Figure 4). The main physiological events occurring during the anthesis stage comprise anthers dehiscence, pollination, and pollen tube elongation through the formation of the style, fertilization and embryo. Various studies depicted that decreased seed numbers under the HT regime were the result of a reduced pollen functionality and abnormalities, as well as pistil deformities [5,45,46]. In the current study the grain weight under the HT during the anthesis stage was affected more than the grain weight during the grain-filling stage. The most probable reason for this is that Pn affected pollen tube development in the wheat [47], as Pn during the anthesis stage was highly significant in determining the reproductive success. Similarly, the present study proved a significant positive correlation between Pn and seed setting (Figure 6 and Figure 7). Furthermore, the HT during both the antithesis and grain-filling stage significantly altered TGW (Figure 4) by affecting FLA and SL (Figure 4, Figure 6 and Figure 7). In wheat, TGW and SL are linked with the assimilation of photosynthates, or their remobilization from vegetative parts, to developing reproductive parts [48]. The reduction in the yield due to the HT during the grain-filling stage could be due to the shortened growth cycle, leaf senescence and fast development [49] with a declined PR [50]. In general, in present study, the traits such as MD, Tr, proline and TSS showed a positive association with the HT; however the rest of the parameters showed an analogous behavior at the OT (Figure 8). Similarly, during both the anthesis and grain-filling stages, MD, Tr, proline and TSS depicted complementary trends compared to the rest of the parameters; however, the trait association remained comparatively firmed during the grain-filling stage rather than the anthesis stage (Figure 9). Besides, among the genotypes, Fakhr-e-Bhakar illustrated the maximum degree of association for the osmolytes, antioxidant enzymes, physiological traits and agronomic parameters (Figure 10), as compared to other genotypes such as Raj-3765, Jimai-22 and Bayraktar-2000. A heatmap analysis further authenticated the distinct behavior of Fakhr-e-Bhakar during both the anthesis and grain-filling stages under both temperature regimes (OT and HT) for the responses of the osmolytes, physiological parameters, antioxidants and agronomic traits in the form of separate clusters (Figure 11). In conclusion, crop productivity is the ultimate outcome of various connecting processes, such as biochemical, molecular and physiological processes; therefore, the disruption of this connection at the reproductive stages due to HT stress reduces the crop yield as proven by numerous studies [4,13,15]. In general, plants are not passive entities, they respond to the environment stresses via different kinds of biochemical, physiological and morphological adaptations [51]. Therefore, the wheat genotype with a tendency to protect its physiological and biochemical equilibrium has enough potential to counter the impacts of HT [14] as proven by Fakhr-e-Bhakar in the current study. Therefore, the current research recommends Fakhr-e-Bhakar for wheat breeding and acclimatization goals in the arid climate of Saudi Arabia where HT is a major problem.

Author Contributions

F.A. and Z.H.S. devised the idea and executed the research, F.A. and A.A.E. wrote the manuscript, while J.H.A. and Z.H.S. critically reviewed and proofread the manuscript. All authors have read and agreed to the published version of the manuscript.

Funding

The research work was funded by Institutional Fund Projects under grant no (IFPHI-314-155-2020).

Institutional Review Board Statement

Not applicable.

Informed Consent Statement

Not applicable.

Data Availability Statement

Not applicable.

Acknowledgments

The authors gratefully acknowledge the technical and financial support from the Ministry of Education and King Abdulaziz University, DSR, Jeddah, Saudi Arabia.

Conflicts of Interest

All authors declare no conflict of interest.

References

  1. Barkley, A.; Tack, J.; Nalley, L.; Bergtold, J.; Bowden, R.; Fritz, A. Weather, disease, and wheat breeding effects on Kansas wheat varietal yields, 1985–2011. Agron. J. 2014, 227–235. [Google Scholar] [CrossRef] [Green Version]
  2. Coffel, E.D.; Horton, R.M.; Sherbinin, A. Temperature and humidity based projections of a rapid rise in global heat stress exposure during the 21st century. Environ. Res. Lett. 2018, 13, 014001. [Google Scholar] [CrossRef] [PubMed]
  3. Arora, N.K. Impact of climate change on agriculture production and its sustainable solutions. Environ. Sustain. 2019, 2, 95–96. [Google Scholar] [CrossRef] [Green Version]
  4. Djanaguiraman, M.; Narayanan, S.; Erdayani, E.; Prasad, P.V. Effects of high temperature stress during anthesis and grain filling periods on photosynthesis, lipids and grain yield in wheat. BMC Plant Biol. 2020, 20, 268. [Google Scholar] [CrossRef]
  5. Shewry, P.R. Wheat. J. Exp. Bot. 2009, 60, 1537–1553. [Google Scholar] [CrossRef] [PubMed]
  6. Hatfield, J.L.; Boote, K.J.; Kimball, B.A.; Ziska, L.H.; Izaurralde, R.C.; Ort, D.; Thomson, A.M.; Wolfe, D.W. Climate impacts on agriculture: Implications for crop production. Agron. J. 2011, 103, 351–370. [Google Scholar] [CrossRef] [Green Version]
  7. Asseng, S.; Foster, I.A.N.; Turner, N.C. The impact of temperature variability on wheat yields. Glob. Chang. Biol. 2011, 17, 997–1012. [Google Scholar] [CrossRef]
  8. Zandalinas, S.I.; Mittler, R.; Balfagon, D.; Arbona, V.; Gomez-Cadenaz, A. Plant adaptations to the combination of drought and high temperatures. Physiol. Plant. 2018, 162, 2–12. [Google Scholar] [CrossRef] [PubMed] [Green Version]
  9. Lamaoui, M.; Jemo, M.; Datla, R.; Bekkaoui, F. Heat and drought stresses in crops and approaches for their mitigation. Front. Chem. 2018, 6, 26–30. [Google Scholar] [CrossRef] [PubMed]
  10. Suzuki, N.; Koussevitzky, S.H.A.I.; Mittler, R.O.N.; Miller, G.A.D. ROS and redox signalling in the response of plants to abiotic stress. Plant Cell Environ. 2012, 35, 259–270. [Google Scholar] [CrossRef]
  11. Prasch, C.M.; Sonnewald, U. Simultaneous application of heat, drought, and virus to Arabidopsis plants reveals significant shifts in signaling networks. Plant Physiol. 2013, 162, 1849–1866. [Google Scholar] [CrossRef] [PubMed]
  12. Rivero, R.M.; Mestre, T.C.; Mittler, R.O.N.; Rubio, F.; Garcia-Sanchez, F.; Martinez, V. The combined effect of salinity and heat reveals a specific physiological, biochemical and molecular response in tomato plants. Plant Cell Environ. 2014, 37, 1059–1073. [Google Scholar] [CrossRef] [PubMed]
  13. Sattar, A.; Sher, A.; Ijaz, M.; Ul-Allah, S.; Rizwan, M.S.; Hussain, M.; Jabran, K.; Cheema, M.A. Terminal drought and heat stress alter physiological and biochemical attributes in flag leaf of bread wheat. PLoS ONE 2020, 15, e0232974. [Google Scholar] [CrossRef] [PubMed]
  14. Shah, Z.H.; Rehman, H.M.; Akhtar, T.; Daur, I.; Nawaz, M.A.; Ahmad, M.Q.; Rana, I.A.; Atif, R.M.; Yang, S.H.; Chung, G. Redox and Ionic Homeostasis Regulations against Oxidative, Salinity and Drought Stress in Wheat (A Systems Biology Approach). Front. Genet. 2017, 8, 141. [Google Scholar]
  15. Djanaguiraman, M.; Boyle, D.L.; Welti, R.; Jagadish, S.V.K.; Prasad, P.V.V. Decreased photosynthetic rate under high temperature in wheat is due to lipid desaturation, oxidation, acylation, and damage of organelles. BMC Plant Biol. 2018, 8, 55. [Google Scholar]
  16. Farooq, M.; Wahid, A.; Kobayashi, N.; Fujita, D.; Basra, S.M.A. Plant drought stress: Effects, mechanisms and management. Agron. Sustain. Dev. 2009, 29, 185–212. [Google Scholar] [CrossRef] [Green Version]
  17. Mathur, S.; Agrawal, D.; Jajoo, A. Photosynthesis: Response to high temperature stress. J. Photochem. Photobiol. B Biol. 2014, 137, 116–126. [Google Scholar] [CrossRef]
  18. Chaudhary, S.; Devi, P.; Bhardwaj, A.; Jha, U.C.; Sharma, K.D.; Prasad, P.V.V.; Siddique, K.H.M.; Bindumadhava, H.; Kumar, S.; Nayyar, H. Identification and Characterization of Contrasting Genotypes/Cultivars for Developing Heat Tolerance in Agricultural Crops: Current Status and Prospects. Front. Plant Sci. 2020, 11, 587264. [Google Scholar] [CrossRef]
  19. Kaur, V.; Behl, R.K. Grain yield in wheat as affected by short periods of high temperature, drought and their interaction during pre- and post-anthesis stages. Cereal Res. Commun. 2010, 38, 514–520. [Google Scholar] [CrossRef]
  20. Dias, A.S.; Bagulho, A.S.; Lidon, F.C. Ultrastructue and biochemical traits of bread and durum wheat grains under heat stress. Brazz J. Plant Physiol. 2008, 20, 323–333. [Google Scholar] [CrossRef] [Green Version]
  21. Yin, X.Y.; Guo, W.; Spiertz, J.H. A quantitative approach to characterize sink-source relationships during grain filling in contrastingwheat genotypes. Field Crops Res. 2009, 114, 119–126. [Google Scholar] [CrossRef]
  22. Shi, H.; Wang, B.; Yang, P.; Li, Y.; Miao, F. Differences in Sugar Accumulation and Mobilization between Sequential and Non-Sequential Senescence Wheat Cultivars under Natural and Drought Conditions. PLoS ONE 2016, 11, e0166155. [Google Scholar]
  23. Wang, B.S.; Ma, M.Y.; Lu, H.G.; Meng, Q.W.; Li, G.; Yang, X.H. Photosynthesis, sucrose metabolism, and starch accumulation in two NILs of winter wheat. Photosynth. Res. 2015, 126, 363–373. [Google Scholar] [CrossRef] [PubMed]
  24. Sairam, R.K.; Deshmukh, P.S.; Shukla, D.S. Tolerance to drought and temperature stress in relation to increased antioxidant enzyme activity in wheat. J. Agron. Crop. Sci. 1997, 178, 171–178. [Google Scholar] [CrossRef]
  25. Mahmood, S.; Daur, I.; Al-Solaimani, S.G.; Ahmad, S.; Madkour, M.H.; Yasir, M.; Hirt, H.; Ali, S.; Ali, Z. Plant Growth Promoting Rhizobacteria and Silicon Synergistically Enhance Salinity Tolerance of Mung Bean. Front. Plant Sci. 2016, 7, 876. [Google Scholar] [CrossRef] [PubMed] [Green Version]
  26. Yemm, E.W.; Willis, A.J. The estimation of carbohydrates in plant extracts by anthrone. Biochem. J. 1954, 57, 508–514. [Google Scholar] [CrossRef] [Green Version]
  27. Alghabari, F. Evaluating Mungbean Performance under Different Types and Rates of Humic Acid Application in Arid Conditions of Saudi Arabia. Int. J. Agric. Biol. 2020, 24, 1273–1278. [Google Scholar]
  28. Ozturk, L.; Demir, Y. In vivo and in vitro protective role of proline. Plant Growth Regul. 2002, 38, 259–264. [Google Scholar] [CrossRef]
  29. Kishor, P.K.; Sangam, S.; Amrutha, R.N.; Laxmi, P.S.; Naidu, K.R.; Rao, K.S.; Rao, S.; Reddy, K.J.; Theriappan, P.; Sreenivasulu, N. Regulation of proline biosynthesis, degradation, uptake and transport in higher plants: Its implications in plant growth and abiotic stress tolerance. Curr. Sci. 2005, 88, 424–438. [Google Scholar]
  30. Darko, E.; Gierczik, K.; Hudak, O.; Forgó, P.; Pál, M.; Türkösi, E.; Kovács, V.; Dulai, S.; Majlath, I.; Molnar, I.; et al. Differing metabolic responses to salt stress in wheat-barley addition lines containing different 7H chromosomal fragments. PLoS ONE 2017, 12, e0174170. [Google Scholar] [CrossRef] [PubMed] [Green Version]
  31. Sehgal, A.; Sita, K.; Siddique, K.H.M.; Kumar, R.; Bhogireddy, S.; Varshney, R.K.; HanumanthaRao, B.; Nair, R.M.; Prasad, P.V.V.; Nayyar, H. Drought or/and Heat-Stress Effects on Seed Filling in Food Crops: Impacts on Functional Biochemistry, Seed Yields, and Nutritional Quality. Front. Plant Sci. 2018, 9, 1705. [Google Scholar] [CrossRef] [PubMed] [Green Version]
  32. Lipiec, J.; Doussan, C.; Nosalewicz, A.; Kondracka, K. Effect of drought and heat stresses on plant growth and yield: A review. Int. Agrophys. 2013, 27, 463–477. [Google Scholar] [CrossRef]
  33. Mohammadi, M.; Karimizadeh, R.A.; Naghavi, M.R. Selection of bread wheat genotypes against heat and drought tolerance on the base of chlorophyll content and stem reserves. J. Agric. Soc. Sci. 2009, 5, 119–122. [Google Scholar]
  34. Talukder, S.K.; Babar, M.A.; Vijaylakshmi, K.; Poland, J.; Prasad, P.V.V.; Bowden, R.; Fritz, A. Mapping QTL for the traits associated with heat tolerance in wheat (Triticum aestivum L.). BMC Genet. 2014, 15, 97. [Google Scholar] [CrossRef] [Green Version]
  35. Ainsworth, E.A.; Ort, D.R. How do we improve crop production in a warming world? Plant Physiol. 2010, 154, 526–530. [Google Scholar] [CrossRef] [Green Version]
  36. Parry, M.A.J.; Reynolds, M.; Salvucci, M.E.; Raines, C.; Andralojc, P.J.; Zhu, X.G.; Price, G.D.; Condon, A.G.; Furbank, R.T. Raising yield potential of wheat. II Increasing photosynthetic capacity and efficiency. J. Exp. Bot. 2011, 62, 453–467. [Google Scholar] [CrossRef]
  37. Hasanuzzaman, M.; Nahar, K.; Alam, M.M.; Roychowdhury, R.; Fujita, M. Physiological, biochemical, and molecular mechanisms of heat stress tolerance in plants. Int. J. Mol. Sci. 2013, 14, 9643–9684. [Google Scholar] [CrossRef] [PubMed]
  38. Chen, Y.E.; Su, Y.Q.; Zhang, C.M.; Ma, J.; Mao, H.T.; Yang, Z.H.; Yuan, M.; Zhang, Z.W.; Yuan, S.; Zhang, H.Y. Comparison of photosynthetic characteristics and antioxidant systems in different wheat strains. J. Plant Growth Regul. 2017, 37, 347–359. [Google Scholar] [CrossRef]
  39. Kirchhoff, H. Structural changes of the thylakoid membrane network induced by high light stress in plant chloroplasts. Philos. Trans. R. Soc. B Biol. Sci. 2014, 369, 20130225. [Google Scholar] [CrossRef] [Green Version]
  40. Zhang, C.J.; Chen, G.X.; Gao, X.X.; Chu, C.J. Photosynthetic decline in flag leaves of two field-grown spring wheat cultivars with different senescenceproperties. S. Afr. J. Bot. 2006, 72, 15–23. [Google Scholar] [CrossRef] [Green Version]
  41. Prasad, P.V.V.; Djanaguiraman, M. Response of floret fertility and individual grain weight of wheat to high temperature stress: Sensitive stages and thresholds for temperature and duration. Funct. Plant Biol. 2014, 41, 1261–1269. [Google Scholar] [CrossRef] [Green Version]
  42. Aliqing, S.; Somayanda, I.; Sebastian, S.V.; Singh, K.; Gill, K.; Prasad, P.V.V.; Jagadish, S.V.K. Heat stress during flowering affects time of day of flowering, seed set, and grain quality in spring wheat. Crop. Sci. 2018, 58, 380–392. [Google Scholar] [CrossRef]
  43. Noctor, G.; Foyer, C.H. Ascorbate and glutathione: Keeping active oxygen under control. Annu Rev. Plant Physiol. Plant Mol. Biol. 1998, 49, 249–279. [Google Scholar] [CrossRef]
  44. Mittler, R.; Vanderauwera, S.; Gollery, M.; Breusegem, F.V. Reactive oxygen gene network of plants. Trends Plant Sci. 2004, 9, 490–498. [Google Scholar] [CrossRef] [PubMed]
  45. Farooq, M.; Bramley, H.; Palta, J.A.; Siddique, K.H.M. Heat stress in wheat during reproductive and grain-filling phases. Crit. Rev. Plant Sci. 2011, 30, 491–507. [Google Scholar] [CrossRef]
  46. Fabian, A.; Safran, E.; Szabo-Eitel, G.; Barnabas, B.; Jager, K. Stigma functionality and fertility are reduced by heat and drought co-stress in wheat. Front. Plant Sci. 2019, 10, 244. [Google Scholar] [CrossRef] [PubMed]
  47. Campbell, A.W.; Griffin, W.B.; Burritt, D.J.; Conner, A.J. The importance of light intensity for pollen tube growth and embryo survival in wheat-maize crosses. Ann. Bot. 2001, 87, 517–522. [Google Scholar] [CrossRef] [Green Version]
  48. Laut, Z.; Butow, B.; Blumenthal, C.; Wrigley, C. Transport of dry matter into developing wheat kernels and its contribution to grain yield under postanthesis water deficit and elevated temperature. Field Crop. Res. 2004, 86, 185–198. [Google Scholar]
  49. Barlow, K.M.; Christy, B.P.; O’Leary, G.J.; Riffkin, P.A.; Nuttall, J.G. Simulating the impact of extreme heat and frost events on wheat crop production: A review. Field Crop. Res. 2015, 171, 109–119. [Google Scholar] [CrossRef] [Green Version]
  50. Prasad, P.V.V.; Pisipati, S.R.; Momcilovic, I.; Ristic, Z. Independent and combined effects of high temperature and drought stress during grain filling on plant yield and chloroplast EF-Tu expression in wheat. J. Agron. Crop. Sci. 2011, 197, 430–441. [Google Scholar] [CrossRef]
  51. Kumar, A.; Memo, M.; Mastinu, A. Plant behaviour: An evolutionary response to the environment? Plant Biol. 2020, 22, 961–970. [Google Scholar] [CrossRef] [PubMed]
Figure 1. Effects of different regimes of temperature: optimum temperature (OT); high temperature (HT) on different leaf osmolytes of wheat genotypes during grain filling and anthesis stages: (a). starch; (b). sucrose; (c). TSP, total soluble proteins; (d). TSS, total soluble sugars; (e). proline. Values shown are mean estimates averaged on 3, 5, 7, 9, 11 and 13 days of temperature treatment impositions during tri-replicate experiment at p ≤ 0.05.
Agronomy 11 02080 g001
Figure 2. Effect of different regimes of temperature: optimum temperature (OT); high temperature (HT) on antioxidant enzymes of wheat genotypes during the grain-filling and anthesis stages. (a). POD, peroxidase; (b). SOD, superoxide dismutase; (c). CAT, catalase. Values shown are mean estimates averaged on 3, 5, 7, 9, 11 and 13 days of temperature treatment impositions during tri-replicate experiment at p ≤ 0.05.
Agronomy 11 02080 g002
Figure 3. Effect of different regimes of temperature: optimum temperature (OT); high temperature (HT) on different physiological parameters of wheat genotypes during grain-filling and anthesis stage: (a). Chl-a; (b). Chl-b; (c). Gs, Stomatal conductance; (d) Tr, transpiration rate; (e). Pn, photosynthesis rate; (f) MD, membrane damage. Values shown are mean estimates averaged on 3, 5, 7, 9, 11 and 13 days of temperature treatment impositions during tri-replicate experiment at p ≤ 0.05.
Agronomy 11 02080 g003
Figure 4. Effect of different regimes of temperature, optimum temperature (OT); high temperature (HT), on agronomic parameters of wheat genotypes during grain-filling and anthesis stages: (a). FLA, flag leaf area; (b). SL, spike length; (c). TGW, thousand grain weight. Values shown are mean estimates averaged at ripening during tri-replicate experiment at p ≤ 0.05.
Agronomy 11 02080 g004
Figure 5. SEM (Scanning electron microscope) micrographs (randomly taken from both grain-filling and anthesis stage) showing the distribution of flag leaf starch in different wheat genotypes under different regimes of temperature. In general starch granules are intact at OT butdisperse at HT:(a). Fakhr-e-Bhakar; (b). Raj-3765; (c). Jimai-22; (d). Bayraktar-2000.
Agronomy 11 02080 g005
Figure 6. Significance of correlation among osmolytes, physiological parameters, antioxidants and agronomic traits at different regimes of temperature. *** = Significant at p ≤ 0.001; ** = Significant at p ≤ 0.01; * = Significant at p ≤ 0.05. TSS, total soluble sugar; TSP, total soluble proteins; Gs, stomatal conductance; Tr, transpiration rate; MD, membrane damage; Pn, photosynthesis rate; SOD, superoxide dismutase; CAT, catalase; POD, peroxidase; PH, FLA, flag leaf area; SL, spike length; TGW, thousand grain weight.
Agronomy 11 02080 g006
Figure 7. Significance of the correlation among osmolytes, physiological parameters, antioxidants and agronomic traits at anthesis and grain-filling stages of wheat genotypes. *** = Significant at p ≤ 0.001; ** = Significant at p ≤ 0.01. TSS, total soluble sugar; TSP, total soluble proteins; SC, stomatal conductance; TR, transpiration rate; MD, membrane damage; PR, photosynthesis rate; SOD, superoxide dismutase; CAT, catalase; POD, peroxidase; FLA, flag leaf area; SL, spike length; TGW, thousand grain weight.
Agronomy 11 02080 g007
Figure 8. PCA graphic scattered plot of osmolytes, physiological parameters, antioxidant enzymes and agronomic traits clustered according to their similarity and dissimilarity at different regimes of temperatures. The vectors derived from biplot origin represent positive and negative association among traits: TSS, total soluble sugar; TSP, total soluble proteins; Gs, stomatal conductance; Tr, transpiration rate; MD, membrane damage; Pn, photosynthesis rate; SOD, superoxide dismutase; CAT, catalase; POD, peroxidase; FLA, flag leaf area; SL, spike length; TGW, thousand grain weight.
Agronomy 11 02080 g008
Figure 9. PCA graphic scattered plot of osmolytes, physiological parameters, antioxidant enzymes and agronomic trait clustered according to their similarity and dissimilarity at anthesis and grain-filling stages of wheat genotypes. The vectors derived from biplot origin represent positive and negative association among traits: TSS, total soluble sugar; TSP, total soluble proteins; Gs, stomatal conductance; Tr, transpiration rate; MD, membrane damage; Pn, photosynthesis rate; SOD, superoxide dismutase; CAT, catalase; POD, peroxidase; FLA, flag leaf area; SL, spike length; TGW, thousand grain weight.
Agronomy 11 02080 g009
Figure 10. PCA graphic scattered plot of osmolytes, physiological parameters, antioxidant enzymes and agronomic trait clustered according to their similarity and dissimilarity among four different wheat genotypes. The vectors derived from biplot origin represent positive and negative associations among traits: TSS, total soluble sugar; TSP, total soluble proteins; Gs, stomatal conductance; Tr, transpiration rate; MD, membrane damage; Pn, photosynthesis rate; SOD, superoxide dismutase; CAT, catalase; POD, peroxidase; FLA, flag leaf area; SL, spike length; TGW, thousand grain weight.
Agronomy 11 02080 g010
Figure 11. Cluster heat map analysis summarizing the responses of osmolytes, physiological parameters, antioxidants and agronomic traits to genotypes at anthesis and grain-filling stages under optimum (OT) and high temperature (HT) regimes. The colour bands reveal the differential association of traits: TSS, total soluble sugar; TSP, total soluble proteins; Gs, stomatal conductance; Tr, transpiration rate; MD, membrane damage; Pn, photosynthesis rate; SOD, superoxide dismutase; CAT, catalase; POD, peroxidase; FLA, flag leaf area; SL, spike length; TGW, thousand grain weight.
Agronomy 11 02080 g011
Publisher’s Note: MDPI stays neutral with regard to jurisdictional claims in published maps and institutional affiliations.

