Article

Nutrient Release and Ammonia Volatilization from Biochar-Blended Fertilizer with and without Densification

by
Yit Leng Lee
1,2,
Osumanu Haruna Ahmed
2,3,4,*,
Samsuri Abdul Wahid
5,
Mohamadu Boyie Jalloh
6 and
Adiza Alhassan Muzah
7
1
Faculty of Mechanical Engineering Technology, Universiti Malaysia Perlis, Arau 02600, Perlis, Malaysia
2
Department of Forestry, Universiti Putra Malaysia Bintulu Campus Sarawak, Bintulu 97008, Sarawak, Malaysia
3
Institut Ekosains Borneo, Universiti Putra Malaysia Bintulu Campus Sarawak, Bintulu 97008, Sarawak, Malaysia
4
Institute of Tropical Agriculture and Food Security, Universiti Putra Malaysia, Serdang 43400, Selangor, Malaysia
5
Department of Land Management, Faculty of Agriculture, Universiti Putra Malaysia, Serdang 43400, Selangor, Malaysia
6
Crop Production Programme, Faculty of Sustainable Agriculture, Universiti Malaysia Sabah, Sandakan Branch, Locked Bag No. 3, Sandakan 90509, Sabah, Malaysia
7
Faculty of Business Management and Professional Studies, Management & Science University, University Drive, Off Persiaran Olahraga, Section 13, Shah Alam 40100, Selangor, Malaysia
*
Author to whom correspondence should be addressed.
Submission received: 31 August 2021 / Revised: 11 September 2021 / Accepted: 11 September 2021 / Published: 18 October 2021

Abstract

:
Blending fertilizer with biochar followed by densification to make it into a tablet can enhance the adsorption of fertilizer on the biochar surface and reduce the nutrient loss during handling. However, the nutrient release and ammonia volatilization from biochar-blended fertilizer with and without densification are not well understood. The objectives of this study were to determine the nutrient release and ammonia volatilization from an acid soil applied with biochar-blended NPK fertilizer with and without densification. The nutrient release of biochar-blended NPK was determined using water incubation for 30 days, whereas daily loss of ammonia was measured using a closed dynamic air flow system for 10 days. The densified biochar-blended NPK caused stronger physical binding of the nutrients within the tablet in addition to stronger chemical bondings between the nutrients with the biochar’s functional groups. As a result, nutrient release in the water incubation from the biochar-blended NPK fertilizer tablet was slower. However, blending the biochar with the NPK fertilizer increased soil ammonia volatilization relative to the NPK fertilizer alone. This demonstrates that the biochar-blended fertilizer tablet has the potential to serve as a slow release fertilizer for crop cultivation.

1. Introduction

With an increase in global demand for food, the current farm productivity levels rely heavily on fertilizer use. The major constraints against using conventional fertilizers are their low crop nutrient use efficiency (NUE) and high nutrient losses through surface runoff and leaching into water bodies. Subsequently, nutrient loss has prompted farmers to over fertilize, which can lead to excessive osmotic potential in the soil water and inhibit microbial growth in soils. Therefore, developing fertilizers with minimal nutrient losses and simultaneously supplying proper nutrition for plant growth are of importance for agronomic and environmental sustainability.
High nitrogen (N) loss via leaching and volatilization during application of nitrogenous fertilizer has been reported by Majeed et al. [1]. As high as 45% of N loss of urea was recorded after 30 days incubation in soil, whereas only 13% of N was lost from a slow release urea fertilizer [2]. Roshanravan et al. [3] reported that urea fertilizer granules released approximately 34% and 99% urea after 1 day and 30 days of incubation in water, respectively. The authors also found that approximately 69% of ammonia (NH3) loss from conventional urea fertilizer had been reported after fertilizing the soil over 10 weeks. Another mobile soil nutrient, potassium (K), can be extensively lost by leaching during intense rainfall events [4]. High nutrient losses from the soil can lead to low crop NUE, which decreases the crop yield. Phosphorus (P) is another essential plant nutrient that enhances plant growth but it is not readily available to plants because of its high immobility. A strong fixation of P by the highly acidic or alkaline soil limits available phosphate for plant use [5].
The potential of biochar to reduce nutrient loss and increase nutrient availability to plants has been widely reported [6,7]. Adsorption of cationic nutrients to the negatively charged O-containing surface functional groups in the biochar could reduce nutrient leaching by biochar [8]. Nevertheless, the adsorption ability of biochar relies on the age of biochar and its application rate [9,10]. The addition of poultry litter biochar in the soil treated with urea could reduce the soil NH3 volatilization by 71% [11]. However, inconsistent results had been reported on the effects of biochar addition on soil NH3 volatilization [12]. In addition, fine biochar particles can be easily lost during the handling and transportation for soil application. The use of compressive pressure and binder in densification can increase the density of biochar particles, thereby minimizing the voids between the particles [13] and therefore, can reduce the loss during handling. Nevertheless, Dunisch et al. [14] reported a higher nutrient release of fine particle size biochar pellets, despite the fact that the voids between the biochar particles had been reduced during the pelletizing process. Although a biochar tablet embedded with fertilizer has been suggested as a potential cost-effective slow-release fertilizer, there is no sufficient information on nutrient release and soil NH3 volatilization from the soil applied with this fertilizer product.
The objective of this study was to determine the nutrient release from biochar and NPK combination fertilizer with- and without-densification in the laboratory. In addition, the soil NH3 volatilization of biochar blended fertilizer with and without densification was also determined using a closed dynamic air flow system model. We hypothesized that less voids in the blended biochar and fertilizer into tablets would release the nutrients slowly ascribed to the close connection between the biochar particles and fertilizer.

2. Materials and Methods

2.1. Samples Preparation

Four treatments were prepared in this study and they were as follows: (i) Biochar tablet (B-T), (ii) combination of biochar and NPK fertilizer tablet (BF-T), (iii) biochar and NPK without tablet (BF-NT), as well as (iv) NPK fertilizer (F-NT). Rice husk, rice straw, and rubber twigs were used as feedstocks for biochar production. Biochar was produced using a stainless steel kiln fabricated locally at the Faculty of Mechanical Engineering Technology, Universiti Malaysia Perlis, Perlis, Malaysia. Throughout the charring process, the average temperature of the kiln was approximately 340 °C [15]. The charring was completed in two hours, after which the charred product was collected and weighed to determine the percentage yield of the charring process. The percentage yield of the char was approximately 34%. The charred materials were ground and sieved to pass a 1 mm sieve before the biochar tablets were produced. The B-T was prepared by blending a mixture of charred rice husk, charred rice straw, and charred rubber twigs at a ratio of 5:3:2, respectively with starch (20% by wt.), and water (30% by wt.) using a mixer. The ratio 5:3:2 used for blending a mixture of charred rice husk, charred rice straw, and charred rubber twigs into a tablet was based on the availability of the materials. Afterwards, the biochar mixture was densified using a single press tablet (MTB3, Micro-Tec, Brighton UK) with a punch weight of 0.4 tons. Tablets with dimensions of 6 mm in height and 10 mm in diameter were generated. For BF-T production, 5:3:3 NPK fertilizer was mixed with the biochar followed by densification into tablets. A fertilizer rate of 5:3:3 for the sweet corn followed the MARDI’s (Malaysia Agriculture Research Development Institute) recommendation. The mixture ratio of fertilizer to biochar was 1:2 to indicate less fertilizer being used for biochar-blended fertilizer. The same mixture ratio was used for BF-NT production but no densification was used for BF-NT. The NPK fertilizer (F-NT) used for this study was ammonium sulfate (AS), triple superphosphate (TSP), and muriate of potash (MOP).

2.2. Total Nitrogen, Phosphorus and Potassium Analysis

The content of total N in B-T, BF-T, and BF-NT was determined using a CNS analyzer (TruSpec, LECO Corporation, Michigan, USA), whereas the dry ashing method [16] was used to determine the total P and K. The F-NT was sent for total N, P, and K content determination based on the 955.04, 958.01, and 965.09 AOAC Official Methods, respectively.

2.3. Fourier Transform Infrared Spectra (FTIR) Analysis

The B-T, BF-T, BF-NT, and F-NT were analyzed using the Perkin–Elmer (Dresden, Germany) FTIR Spectrometer Spectrum 2000 with a Perkin–Elmer Universal Attenuated Total Reflectance (ATR) sampling accessory to obtain their FTIR spectra. Data collection and processing were performed using Spectrum version 6.2.0.0055 software.

2.4. Nutrient Release Analysis

To determine the controlled release nature of the B-T, BF-T, BF-NT, and F-NT, 1 g of each sample was put in a beaker with 200 mL distilled water. The beaker was covered with parafilm and kept for 30 days at room temperature (25 °C) [17] and all the measurements were done in triplicates. After 1, 5, 10, 15, 20, 25, and 30 days of incubation [18], approximately 20 mL of solution was extracted for ammonium (NH4+), nitrate (NO3), P, and K determination. The water-soluble P and K were analyzed using ICP-OES (Optima 8300, Perkin Elmer), whereas the NH4+ and NO3 were analyzed using the steam distillation method [19]. Ammonium was determined by pipetting 20 mL of the extractant into a distillation tube, which was added to 0.2 g of MgO and distilled for 5 min. Next, 10 mL of boric acid was used to trap NH4+. Afterwards, the distillation was continued by adding 0.2 g Devarda’s alloy to the sample and the distillation proceeded for another five minutes to determine NO3. The distillates of NH4+ and NO3 were titrated with 0.01 M hydrochloric acid (HCl). The percent nutrient release of the total amount was calculated as the following equation:
Percent of nutrient release (%) = (CV/TC) × 100%
where CV (mg/L) is the released amount and TC (mg/L) is total nutrient concentration.

2.5. Soil Ammonia Volatilization Analysis

A clayey mineral soil of Malacca series (Typic Hapludox) was used to determine NH3 volatilization from the biochar and fertilizers amendments. The specific soil was selected because it is the common acidic soil found in Malaysia and is used for agricultural cultivation. The soil sample was air dried and ground to pass a 2.0 mm sieve before analysis. The soil texture was analyzed using the hydrometer method [20] and the soil was found to be clayey (66.85% clay, 28.64% silt, and 5.85% sand). Chemical properties of the soil (pH, electrical conductivity (EC), ammonium (NH4+), and nitrate (NO3) contents) were also determined before and after the incubation. pH of the soil was determined using a pH meter (PB10, Sartorius, Taguig, Philippines), whereas EC of the soil was determined using a conductivity meter (EC3000, STEP Systems GmbH, Nurnberg, Germany). The soil pH and EC were determined in a soil:water mixture ratio of 1:5 (v/v). The method of Keeney and Nelson [21] was used to extract soil NH4+ and NO3 followed by steam distillation.
The treatments used to compare the percent of NH3 volatilization loss in the clayey soil were as follows:
(1)
Soil only (T1)
(2)
10.61 g Mineral NPK fertilizer [7.05 g AS + 2.08 g TSP + 1.48 g MOP] (T2)
(3)
21.81 g Biochar + 10.61 g NPK fertilizer (T3)
(4)
32.42 g Biochar tablet embedded with NPK fertilizer (T4).
The daily NH3 loss was measured using a closed dynamic air flow system model. The system consisted of an exchange chamber of a 500 mL conical flask and 250 mL conical flask containing 75 mL boric acid, which were both stopped and fitted with an inlet/outlet. Approximately 250 g soil was weighed into the chamber (500 mL conical flask), after which it was moistened with distilled water to achieve 60% field capacity. The chamber inlet was connected to an air pump and the outlet was connected by a silicon tubing which contained boric acid and an indicator solution to trap NH3 gas. Air was passed through the chamber at the rate of 4 L/min/chamber. This air flow rate was set and maintained throughout the incubation period using a Gilmont flow meter.
The NH3 (g) released was captured in a trapping solution which contained 75 mL boric acid with bromocresol green and methyl red indicators and titrated with 0.1 M HCl to estimate the amount of NH3 released. The entire incubation was conducted at room temperature. The boric acid indicator which was used to capture NH3 gas was replaced every 24 h during incubation for 10 days. Measurement was continued until the loss declined to 1% of the N added in the NPK. The experimental design was a completely randomized design with three replicates for each treatment.

2.6. Statistical Analysis

Analysis of variance was used to test for treatment effects and means of treatments were compared using Tukey’s test (SAS version 9.2).

3. Results

3.1. Total Nitrogen, Phosphorus, and Potassium Analysis

The total N, P, and K contents of B-T, BF-T, BF-NT, and F-NT are presented in Table 1. The B-T had the lowest total N, P, and K contents. Integration of NPK and biochar significantly increased the total N, P, K in BF-T and BF-NT. The NPK fertilizer used in this study had the highest N (13.73%), P (4.40%), and K (8.28%).

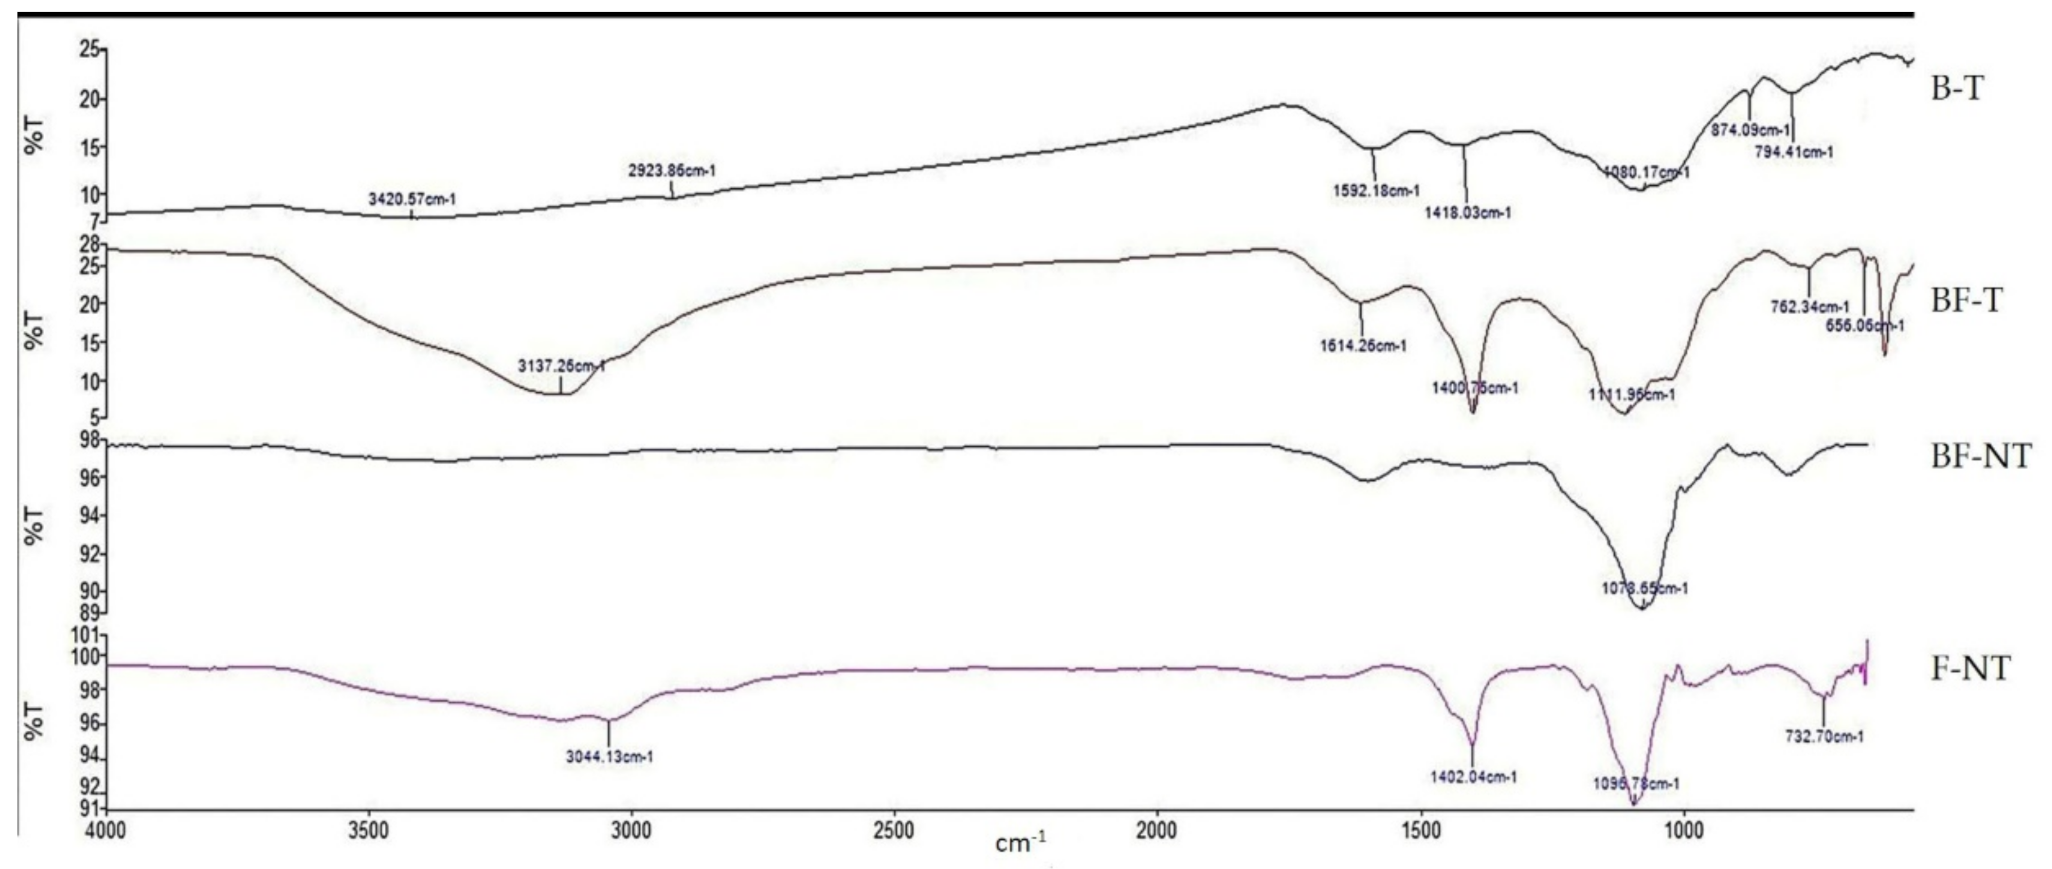
3.2. Fourier Transform Infrared Spectra (FTIR) Analysis

FTIR analysis was used to determine the changes of functional groups in B-T, BF-T, BF-NT, and F-NT. Figure 1 and Table 2 demonstrates the bands present in the spectra of B-T, BF-T, BF-NT, and F-NT. The absorption bands ranging from 1600 to 1475 cm−1 and from 900 to 690 cm−1 for aromatic C were observed in B-T, BF-T and BF-NT. Figure 1 with a broad absorption between 3400 and 3200 cm−1 in B-T suggests the presence of alcohol and phenolic groups in the charred rice residues and rubber tree twigs mixture tablets.
The absorbance band obtained between 3100 and 2700 cm−1 in BF-T was attributed to the presence of NH stretch, whereas the band between 3400 and 3200 cm−1 (alcohol and phenolic groups) disappeared in BF-T. Similar bands of NH stretch (3100–2700 cm−1), S=O (1420–1370 cm−1) and C-N (1350–1000 cm−1) were observed in BF-T and F-NT. The difference between BF-T and F-NT was the only presence of NH bending (1640–1550 cm−1) in BF-T. Despite the same biochar and NPK being used for BF-T and BF-NT production, bands of NH stretch (3100–2700 cm−1) and S=O (1420–1370 cm−1) disappeared in the BF-NT without densification.

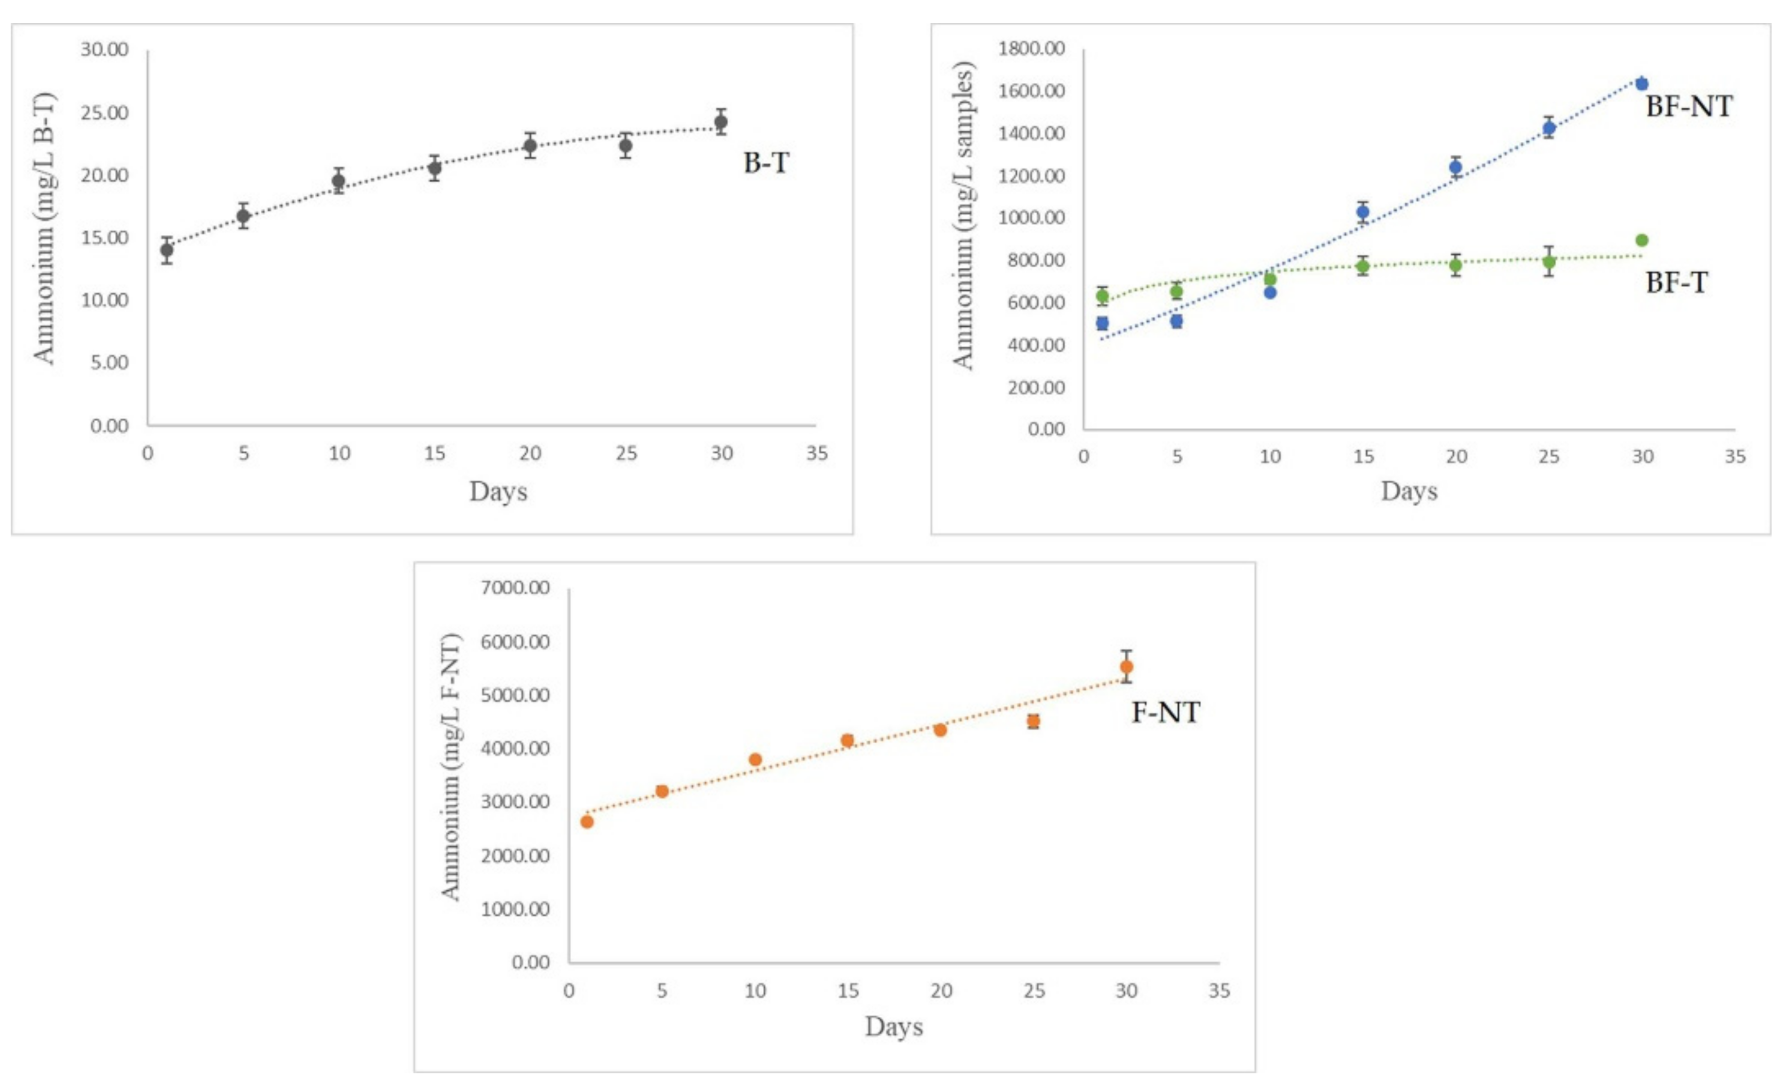
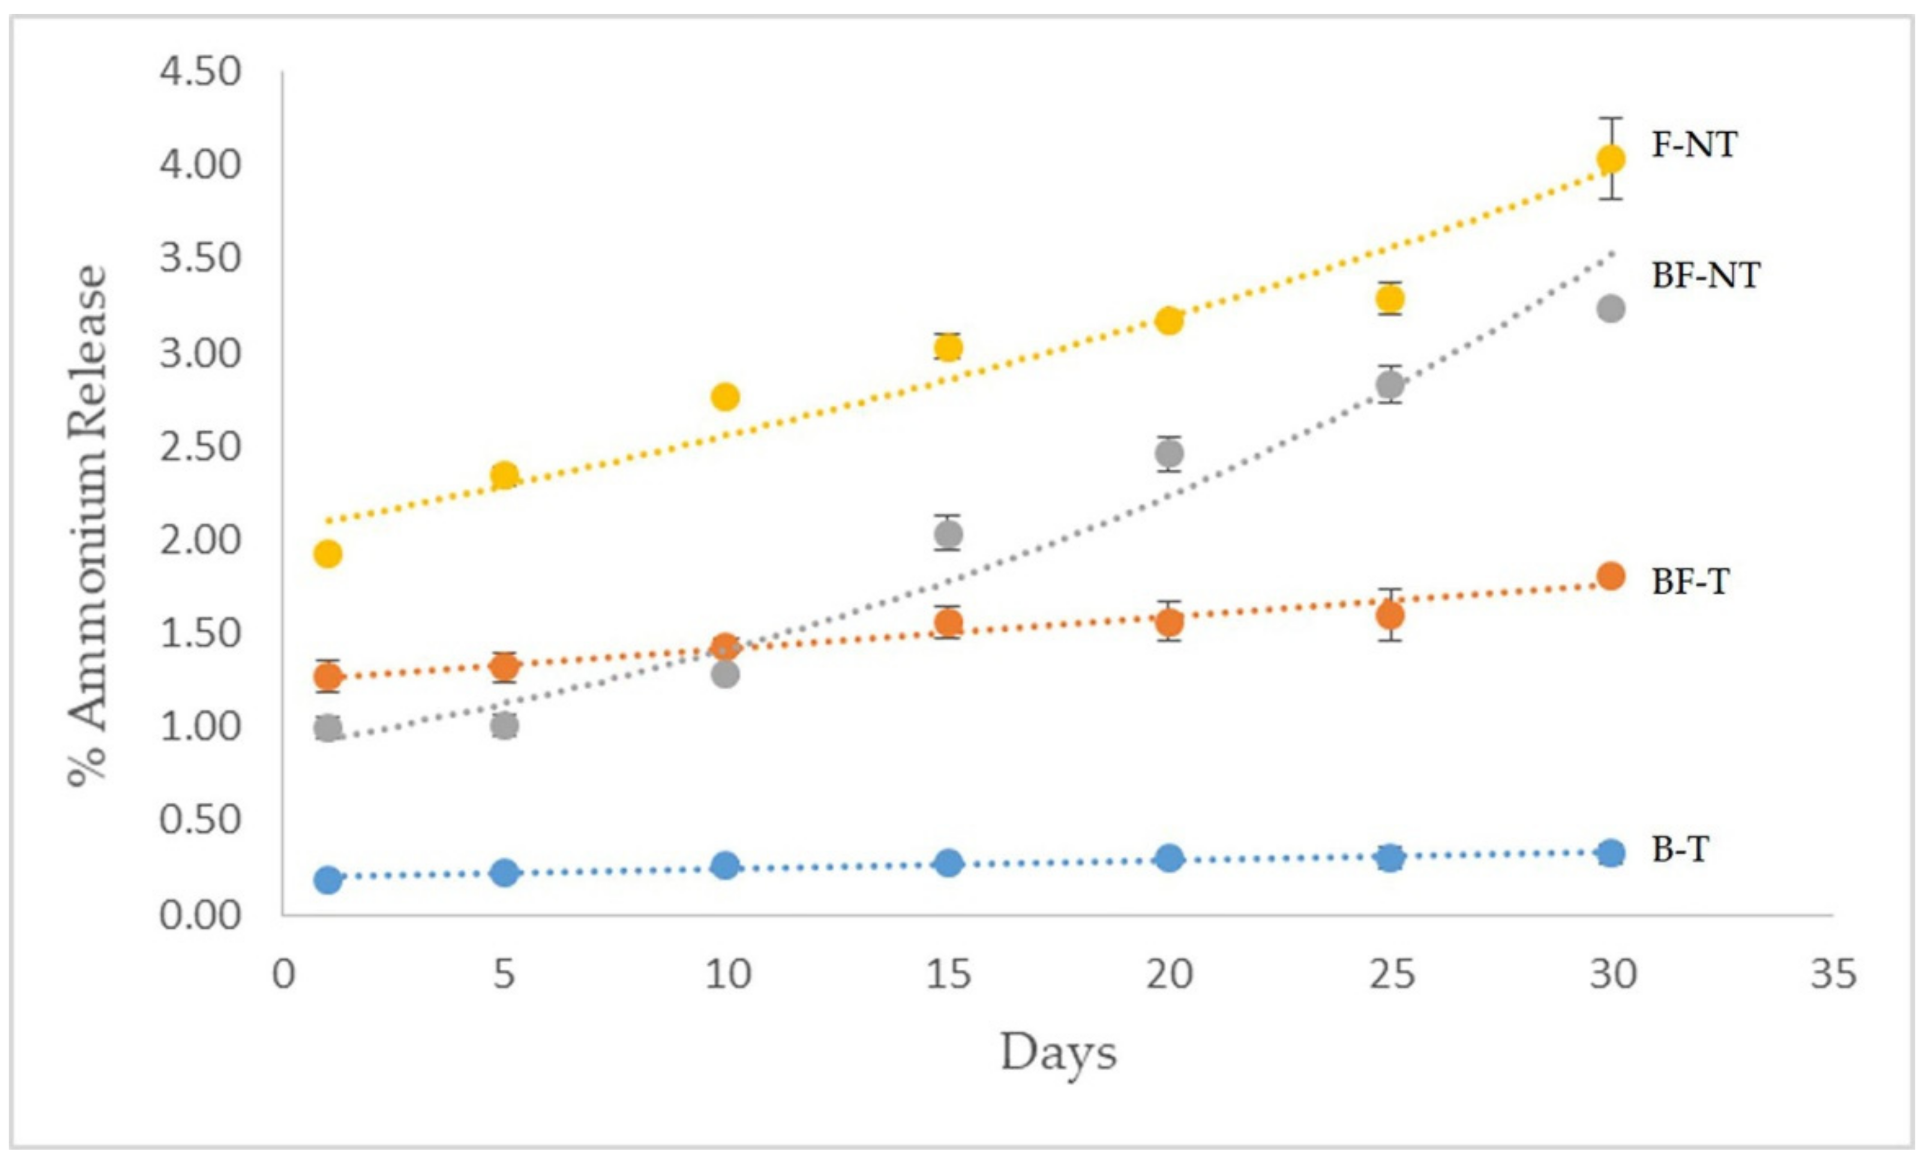
3.3. Ammonium Release Analysis

The release patterns of B-T, BF-T, BF-NT, and F-NT in water were determined using a water incubation test to check their potential application as slow release fertilizers. Figure 2 demonstrates 30 days of ammonium release studies in distilled water upon the addition of B-T, BF-T, BF-NT, and F-NT. The N fertilizer used in this study was ammonium sulfate. The highest NH4+ release was observed in F-NT, which ranged from 2645.07 mg/L to 5535.60 mg/L for 30 days of water incubation (Figure 2). Total N content of the F-NT in this study was 13.73%. This suggests that approximately 2% to 4% of total N applied was released in soluble NH4+ form for 30 days of water incubation (Figure 3).
Nevertheless, the lowest NH4+ release was observed in B-T which ranged from 14.00 mg/L to 24.27 mg/L for 30 days of water incubation (Figure 2). The NH4+ release of B-T was approximately 0.3% of the total N applied for 30 days of water incubation (Figure 3). The NH4+ release trend of BF-NT was similar to F-NT, for which NH4+ increased steeply for 30 days of water incubation. Nevertheless, a smaller amount of NH4+ was released with a combination of biochar and NPK fertilizer (BF-NT) compared with NPK only (F-NT). In contrast, the NH4+ release of BF-T increased gradually until the 10th day and after which remained constant in water incubation until the 30th day.
Compared with BF-NT, BF-T demonstrated lower NH4+ release during the 30 days of water incubation (Figure 2). The NH4+ release of BF-NT ranged from 502.13 mg/L to 1632.40 mg/L, whereas that of BF-T ranged from 630.93 mg/L to 897.87 mg/L. Figure 3 shows that the NH4+ released was approximately 1% to 3.5% of the total amount of the N applied for BF-NT, whereas that of BF-T was approximately 1% to 2% of the total amount of the N applied.

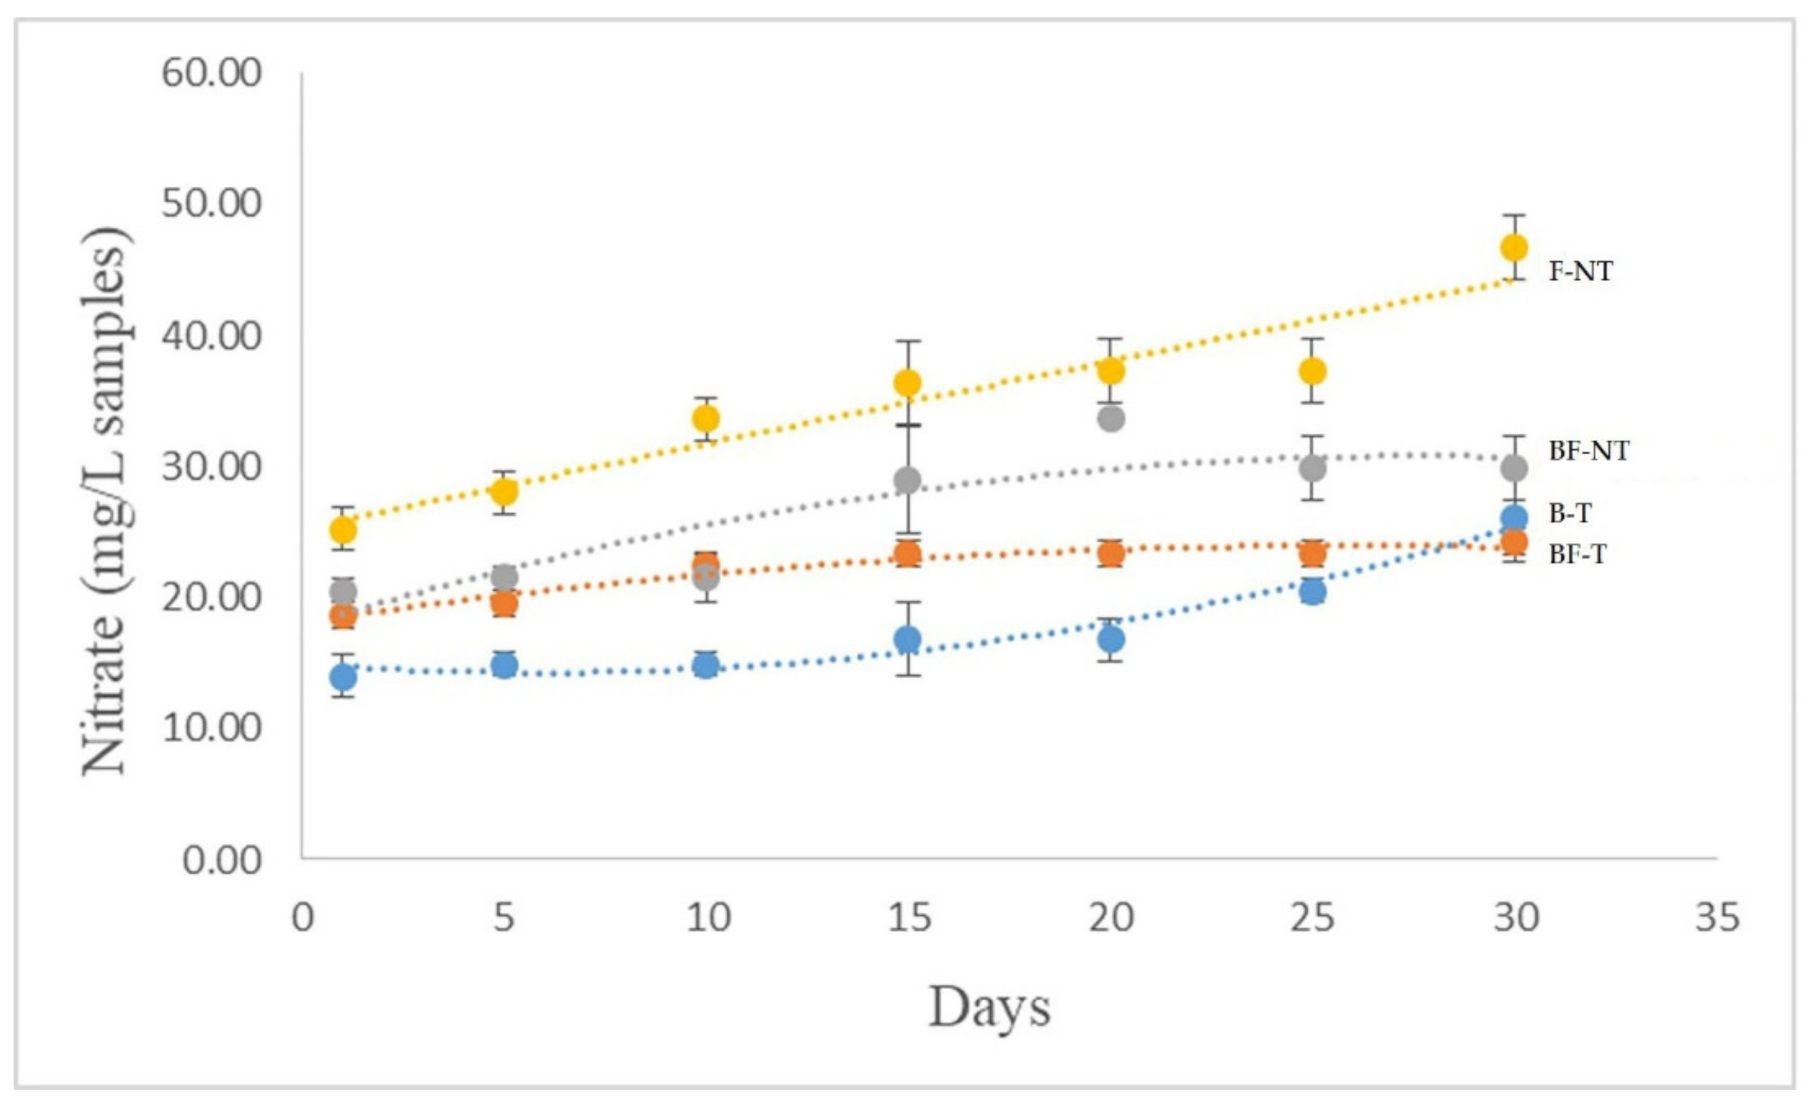
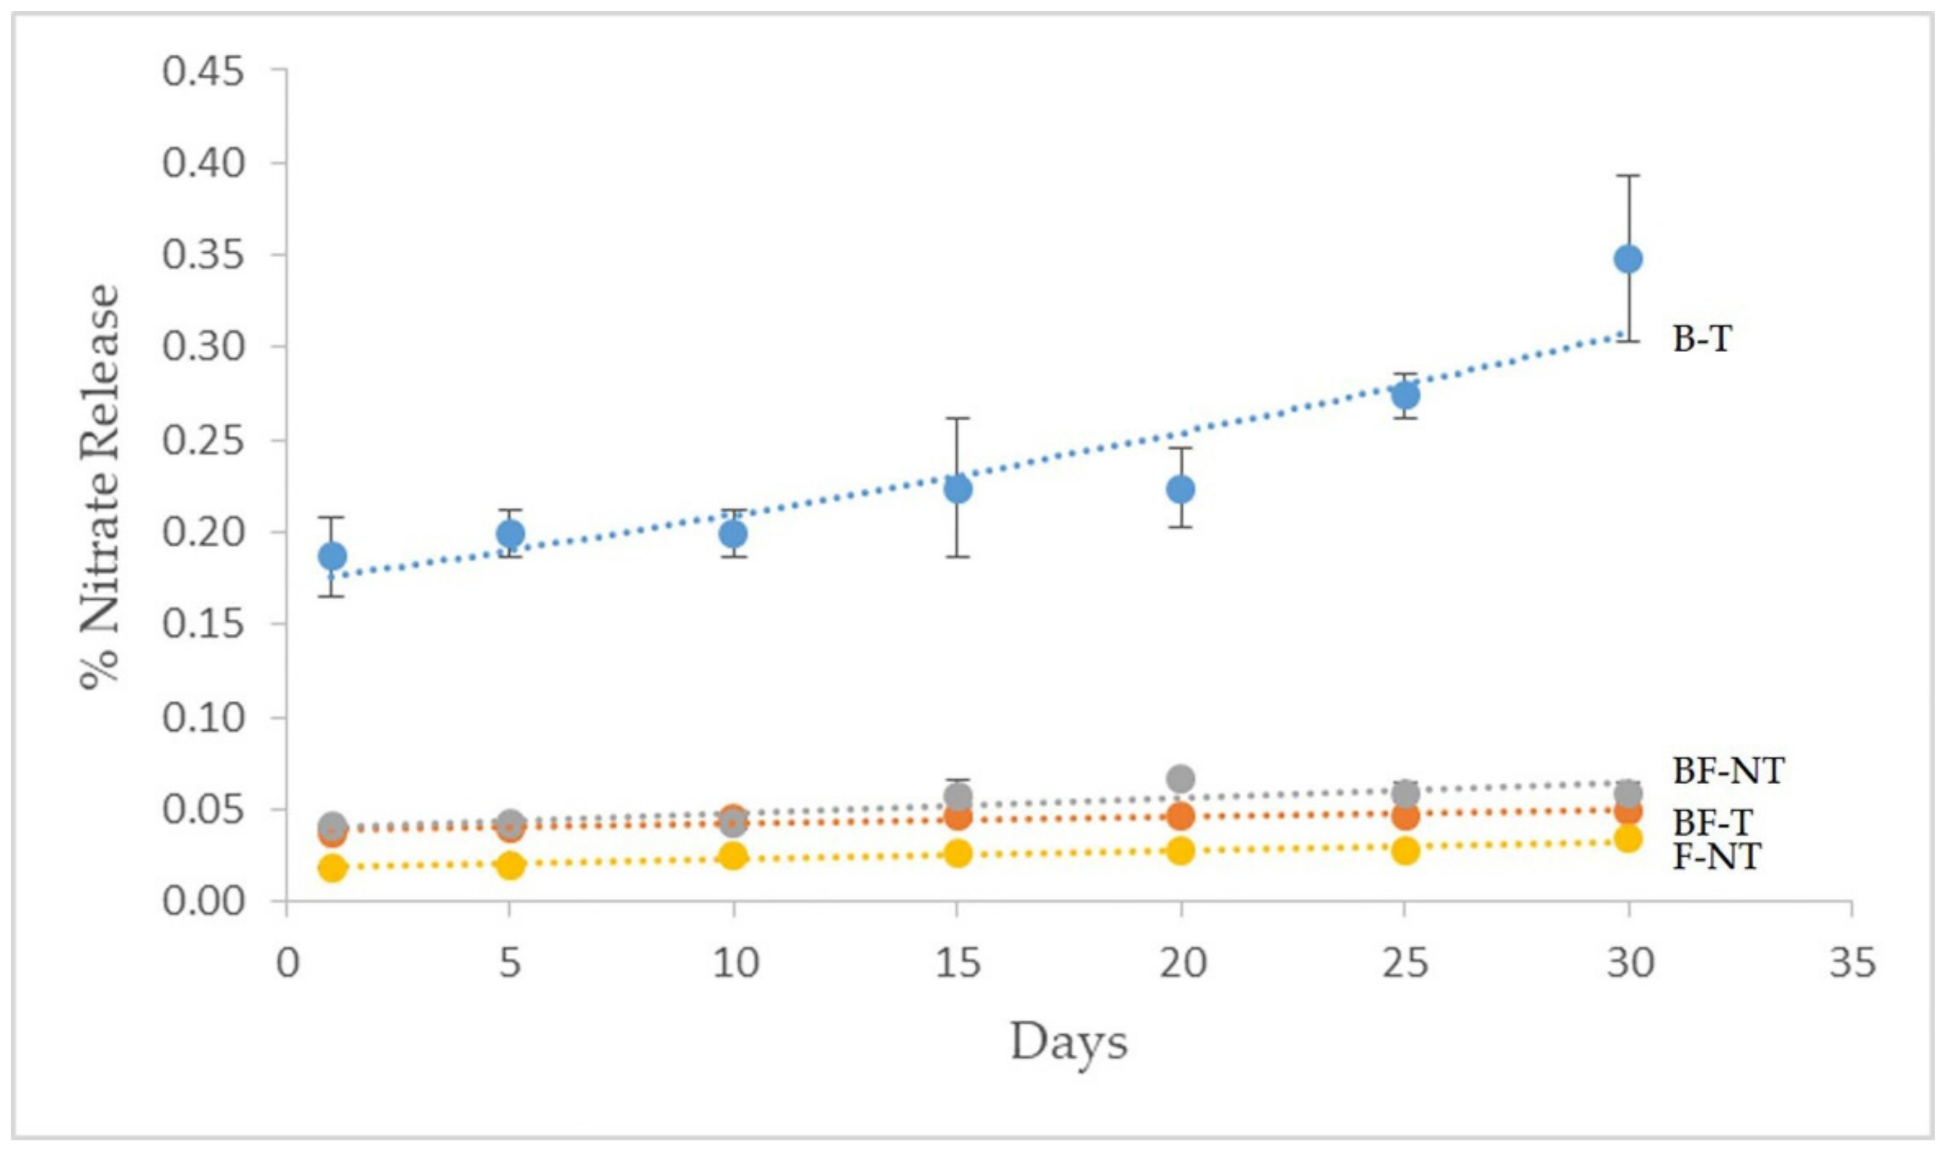
3.4. Nitrate Release Analysis

Figure 4 demonstrates the release trend of the soluble NO3 in distilled water upon the addition of B-T, BF-T, BF-NT, and F-NT over 30 days of water incubation. The F-NT released about 46.67 mg/L NO3, which accounted for approximately 0.03% of the total amount of N released from F-NT as NO3 (Figure 5). The BF-NT released approximately 29.87 mg/L NO3 (0.06% of the total amount of N), whereas BF-T released 24.27 mg/L NO3 (0.05% of the total amount of N). For B-T only, it released 26.13 mg/L NO3 (0.35% of the total amount of N).

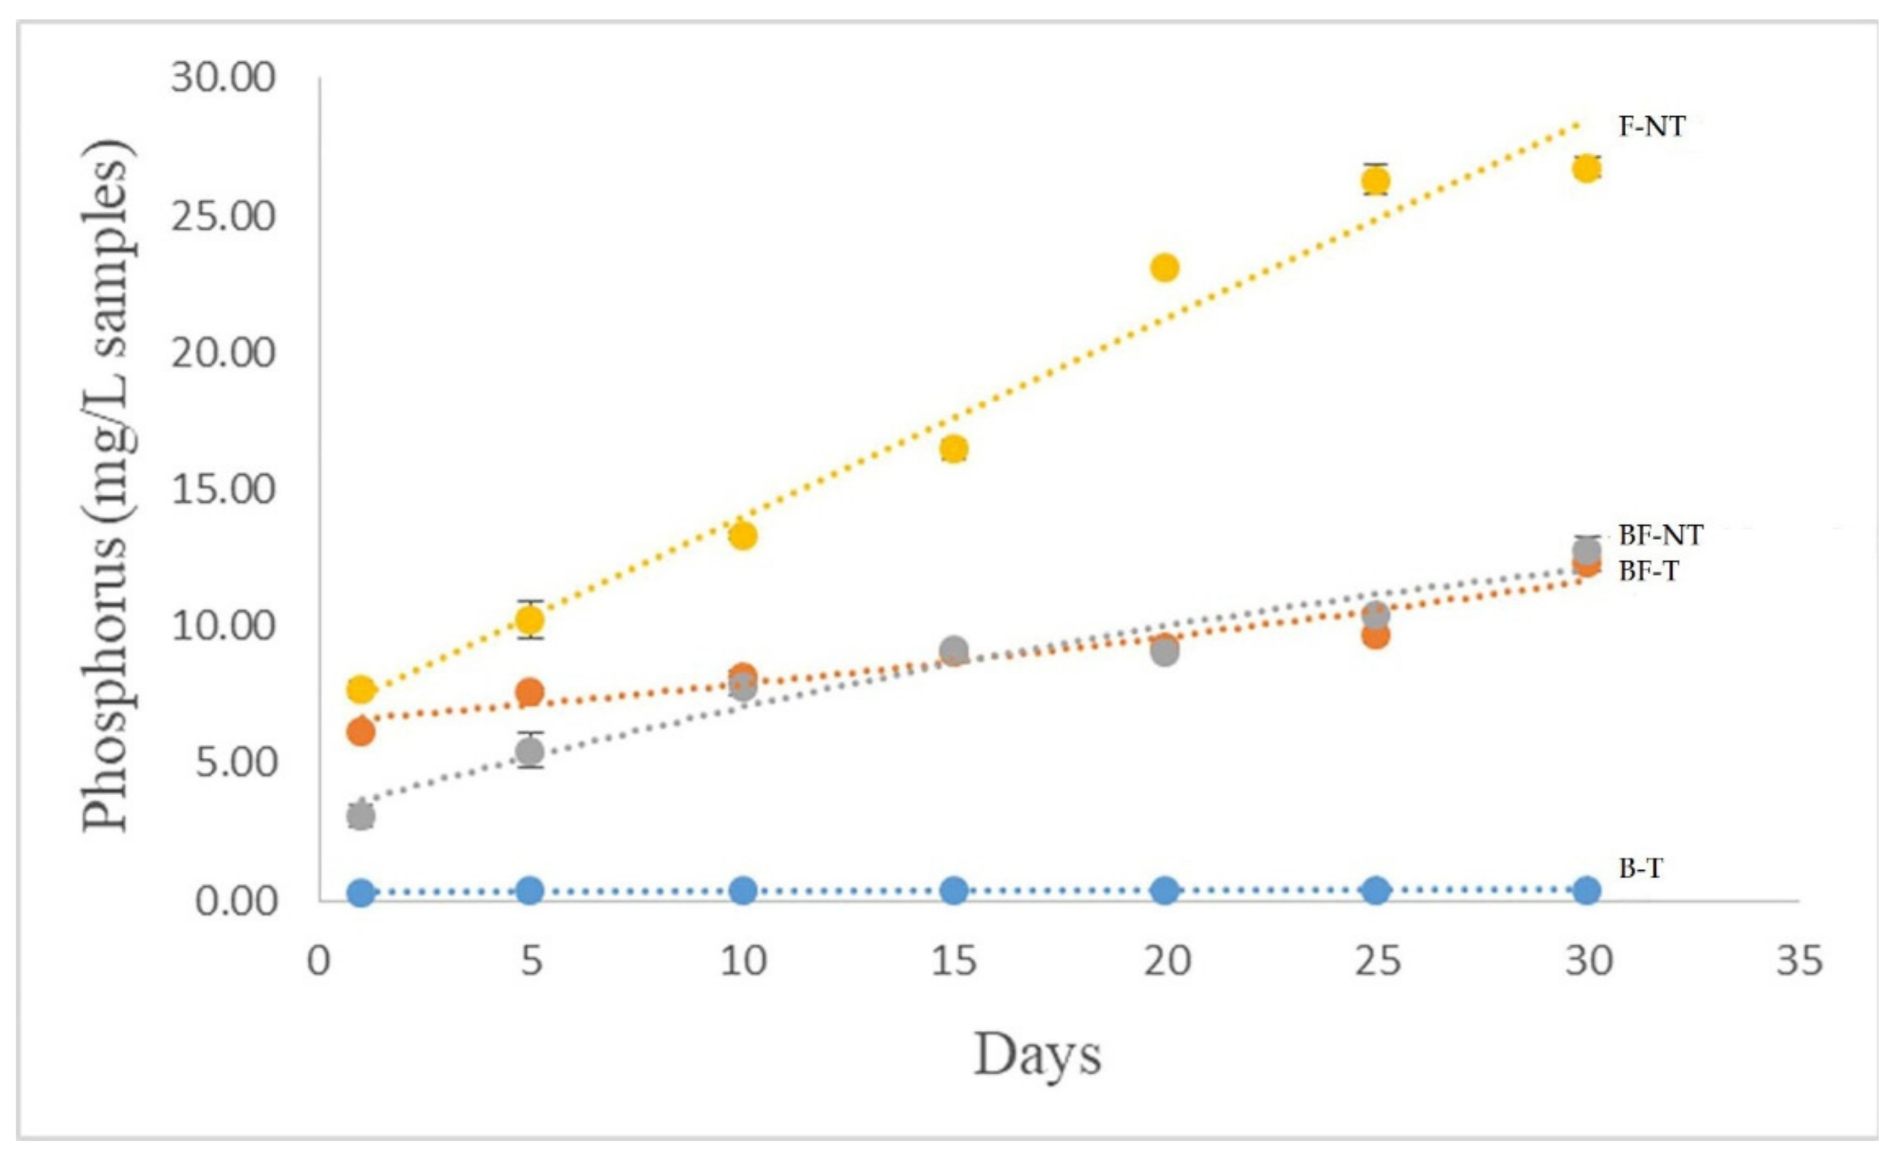
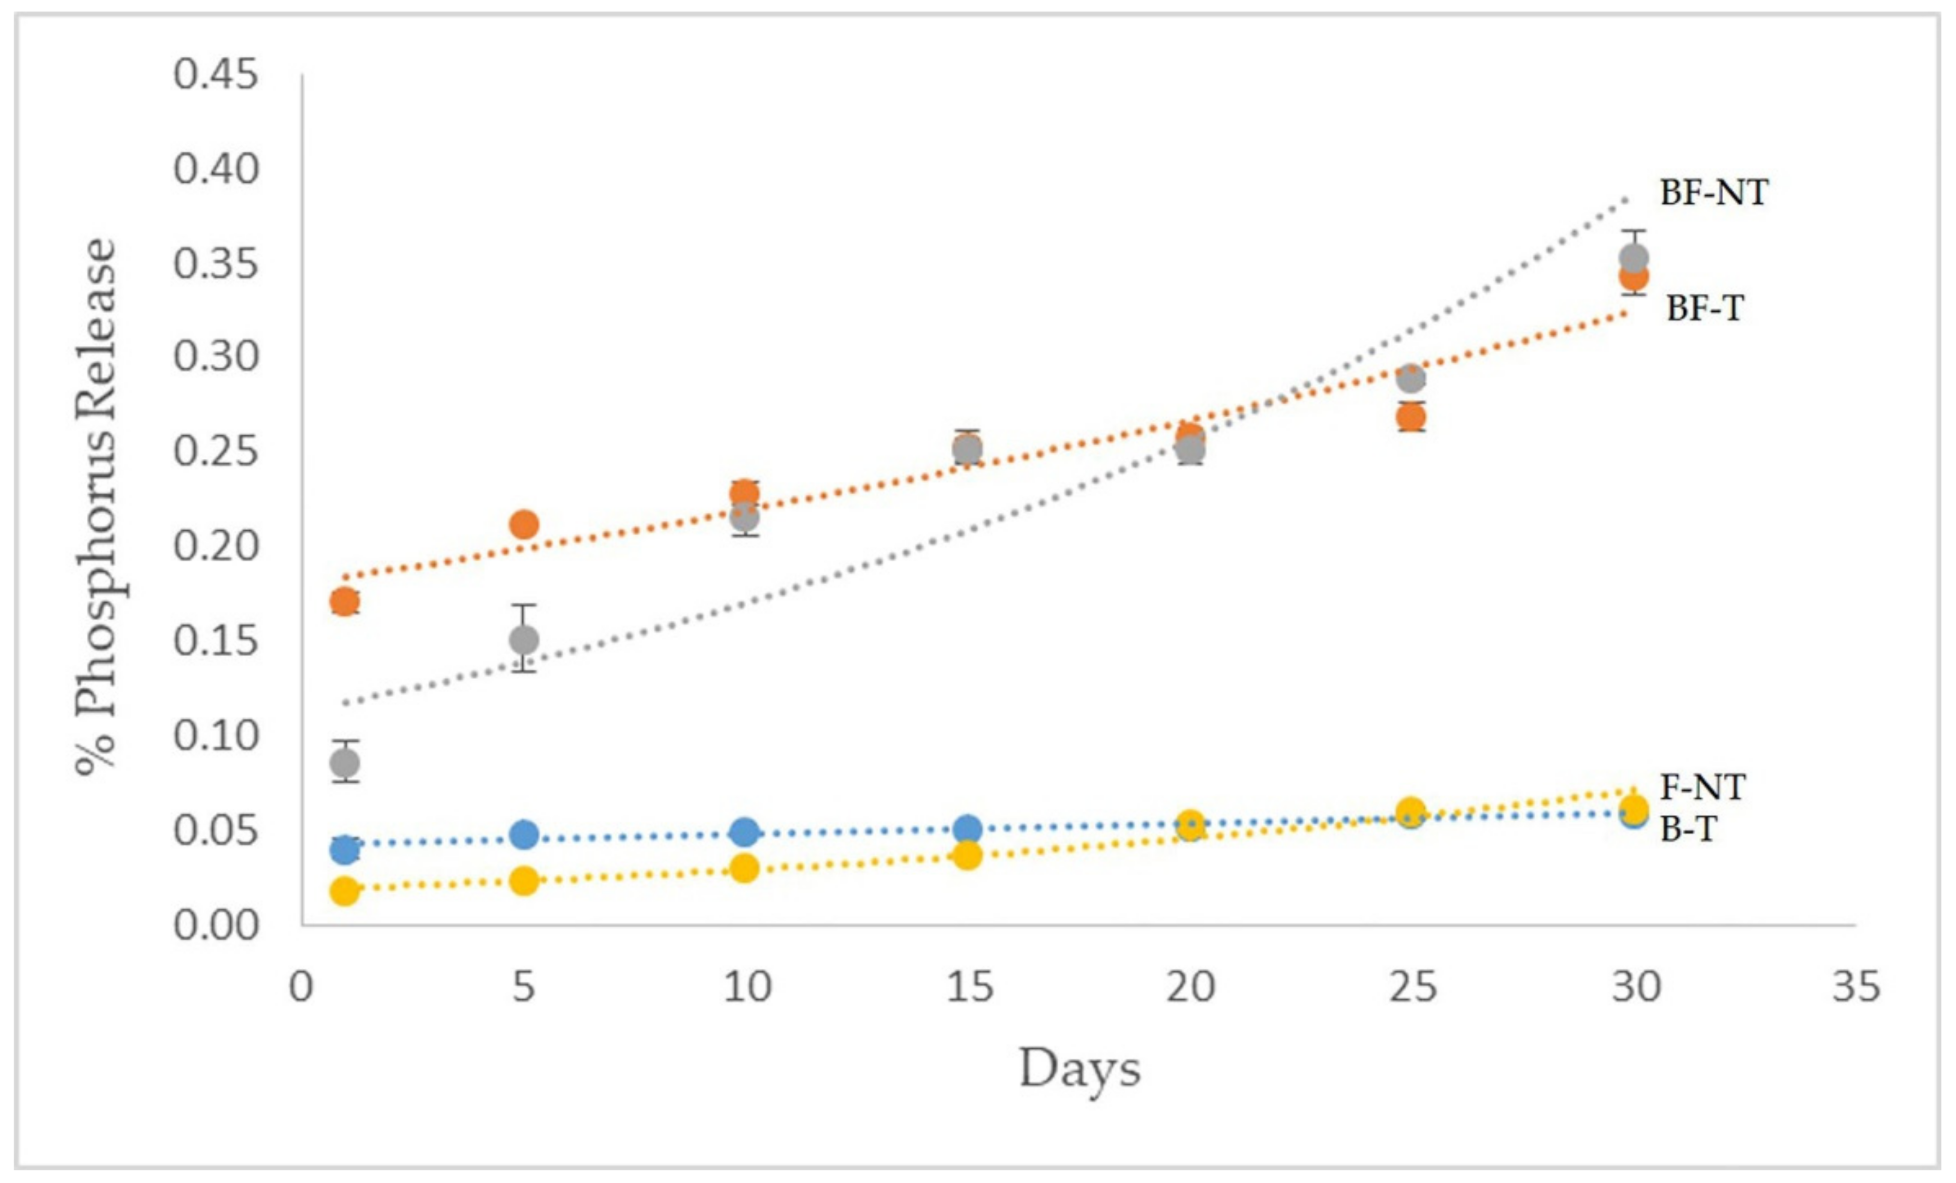
3.5. Phosphorus Release Analysis

Figure 6 demonstrates the P release patterns for B-T, BF-T, BF-NT, and F-NT. F-NT rapidly releases soluble P during the 30 days of water incubation (7.68 mg/L to 26.75 mg/L). Triple superphosphate was the P source in our study. Approximately 0.06% of the total P was leached from F-NT as soluble P (Figure 7). In contrast, the P release of B-T was stable. There was relatively small amounts of soluble P released from B-T (0.28 mg/L to 0.41 mg/L) and the amount which accounted for 0.06% of total P was leached from B-T (Figure 7). For BF-T and BF-NT, both increased the soluble P release gradually (Figure 6). The release accounted for 0.34% and 0.35% of total P leached from BF-T and BF-NT, respectively (Figure 7). Although there was a gradual increase of soluble P in both BF-T and BF-NT (Figure 6), a higher P release percentage was recorded in the treatments with the combination of biochar and fertilizer compared with F-NT (Figure 7).

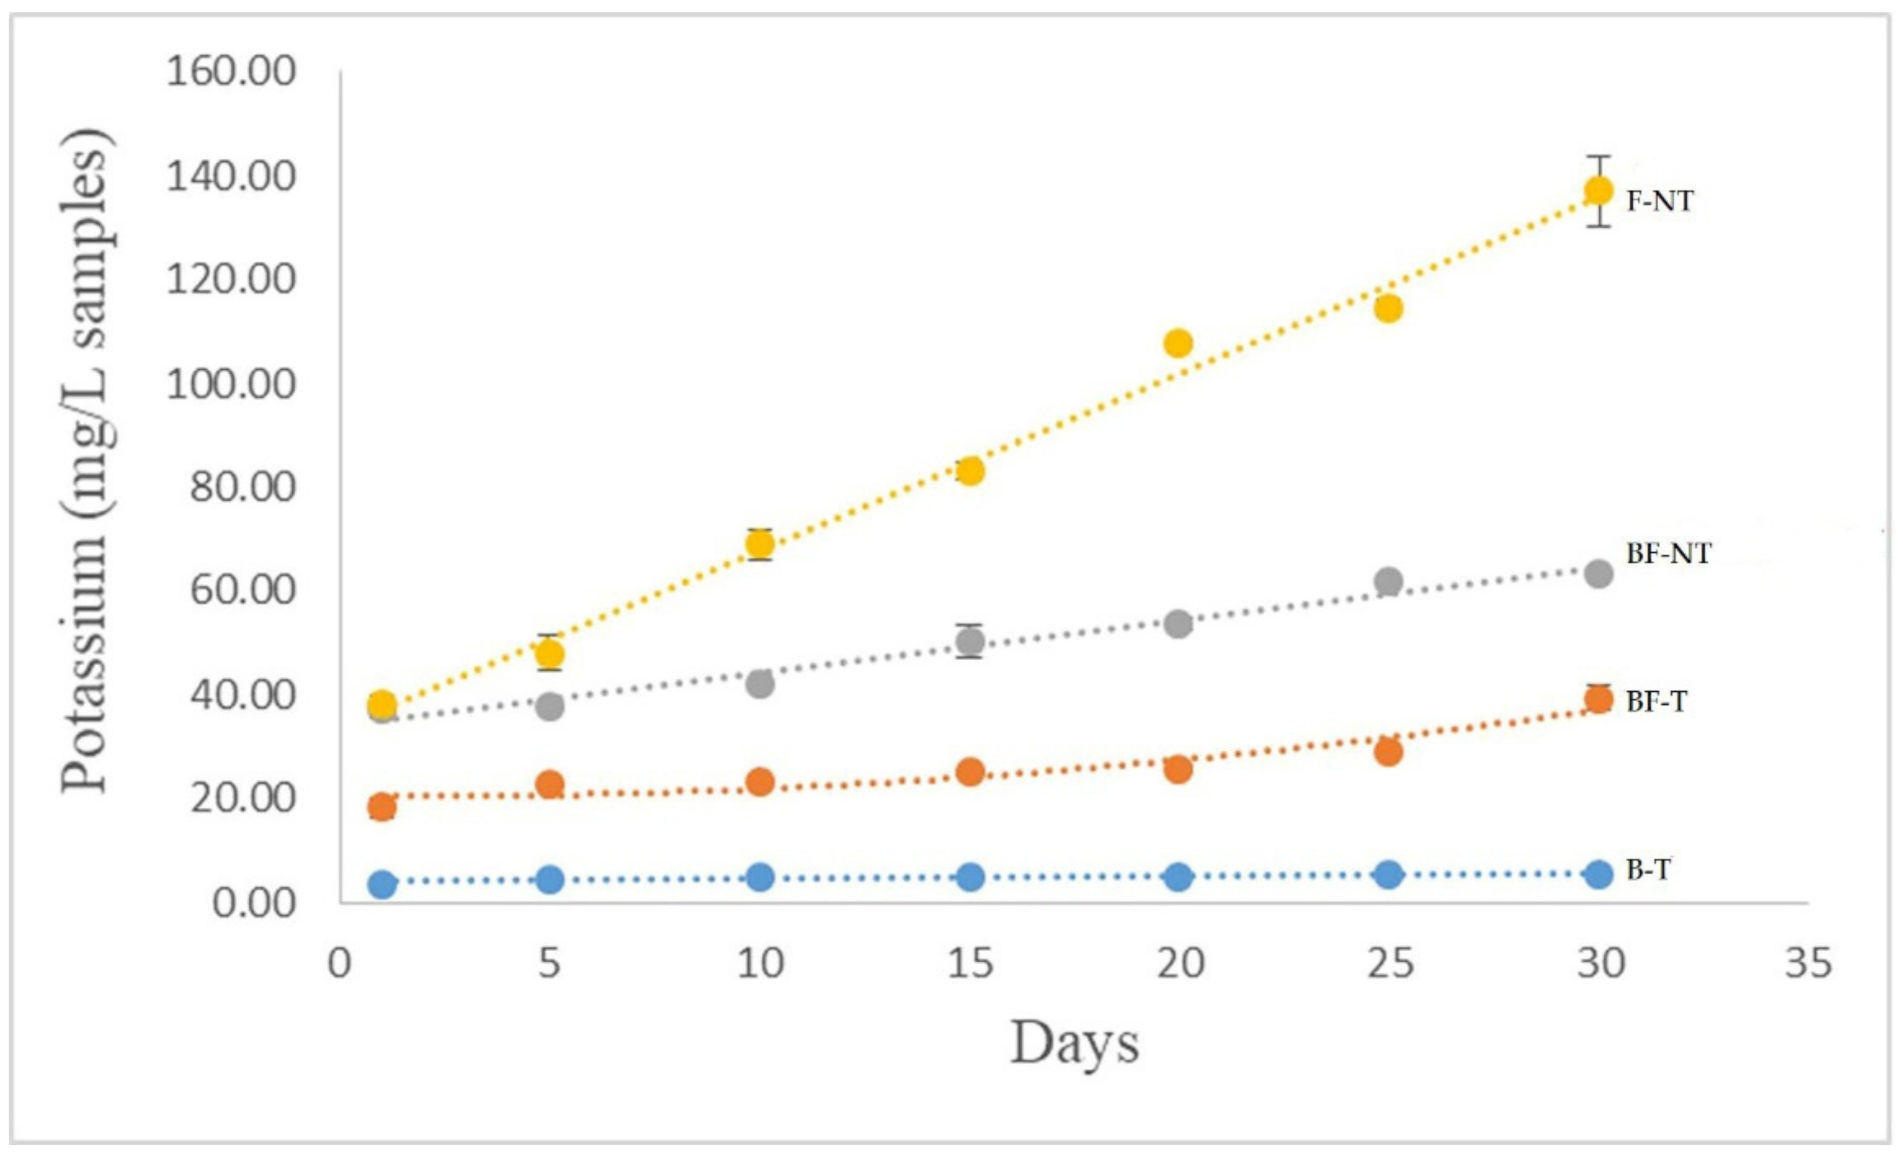
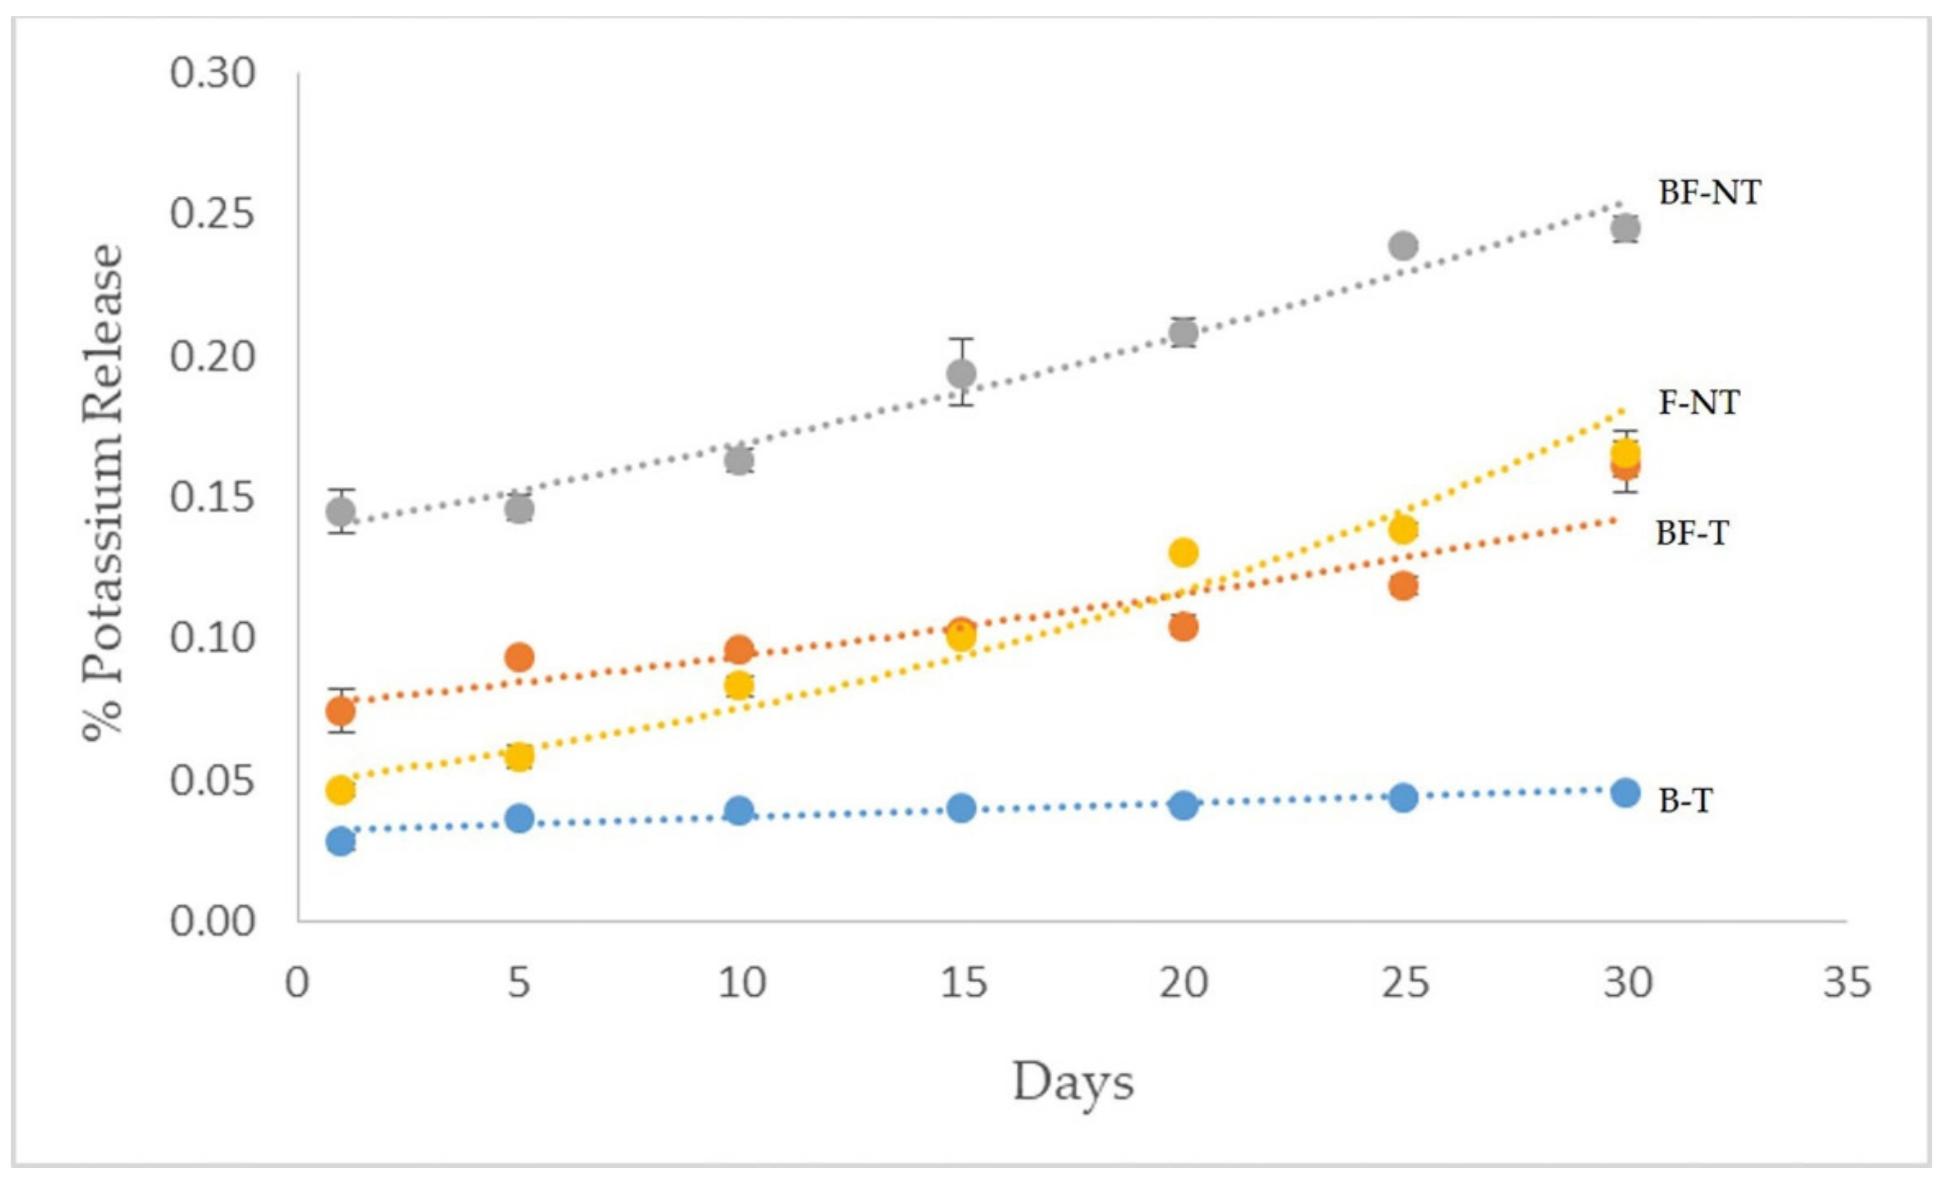
3.6. Potassium Release Analysis

Figure 8 illustrates differences of F-NT, BF-NT, BF-T, and B-T in their release of soluble K. The soluble K release of B-T remained unchanged over time (3.46 mg/L to 5.57 mg/L) (Figure 8) and the release accounted for 0.05% of the total K applied (Figure 9). Conversely, the K release of F-NT was rapid over time (38.23 mg/L to 137.12 mg/L). Muriate of potash was the source of K for F-NT in this study and approximately 0.16% of the total K applied was leached on the 30th day of the water incubation (Figure 9). In comparison to F-NT, the water soluble K release for BF-NT and BF-T moderately increased over time (Figure 8). Approximately 0.16% of the total K applied was leached for BF-T, whereas 0.24% of the total K applied was leached for BF-NT on the 30th day of the water incubation (Figure 9).

3.7. Percentage of Soluble Nutrient Release during Water Incubation Experiment

Overall, F-NT demonstrated the highest percent soluble NH4+ release of total N applied (Table 3). The percent soluble ammonium release declined in the order of BF-NT (3.23%) > BF-T (1.81%) > B-T (0.32%). In contrast, B-T showed the highest percent soluble nitrate release during water incubation on the 30th day. Compared with BF-NT, BF-T had a significantly lower percent soluble NH4+ (1.81%) and K (0.16%) release on the 30th day. Nevertheless, the lowest percent soluble NH4+, P and K release was recorded in B-T on the 30th day of the water incubation (Table 3).

3.8. Selected Soil Chemical Characteristics before the Soil Ammonia Volatilization Experiment

Table 4 presents the selected soil chemical characteristics before the soil NH3 volatilization experiment. pH and EC of soil used in this present study were 5.68 and 0.02 mS cm−1, respectively. The soil had low available NH4 (42.93 mg kg−1) and available NO3 (17.87 mg kg−1).

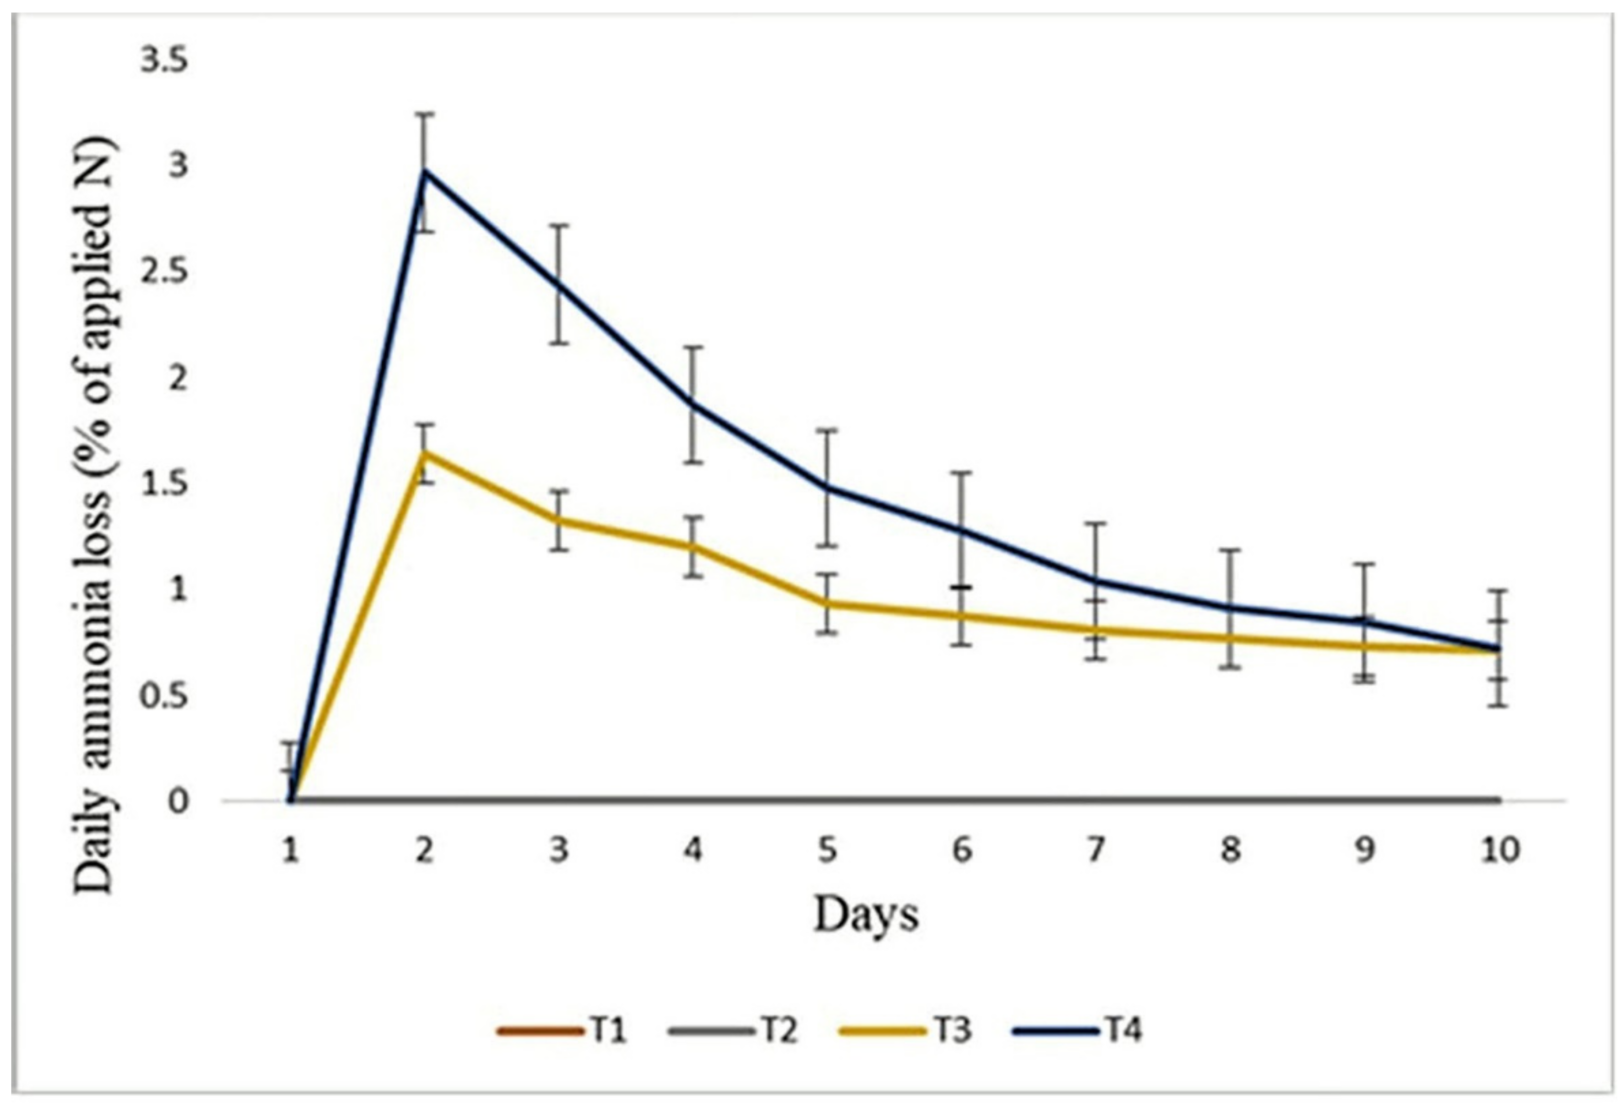
3.9. Daily Loss of Ammonia for Ten Days of Incubation

Soil only (T1) and T2 (F-NT) did not emit NH3 (Figure 10). Ammonia volatilization peaked on the second day for T3 (BF-NT) (1.5%) and T4 (BF-T) (3%), after which there was a rapid decrease until day 10th. The total NH3 loss for T3 and T4 were 8.98% and 13.52%, respectively (Table 5).

3.10. Effects of Treatments on Selected Soil Chemical Properties after at Ten Day of the Ammonia Volatilization Experiment

After 10 days of incubation of soil NH3 volatilization, soil pH of T3 (5.52) remained constant with T1 (5.68), while soil pH of T2 (4.95) and T4 (5.04) significantly declined (Table 6). Soil EC increased in the order of T1 < T3 < T2 < T4 after 10 days of incubation. Treatment T1 shows the lowest soil ammonium while T2 shows the highest ammonium concentration in soil. Meanwhile, soil NH4 concentrations in T3 and T4 were significantly lower than T2. T1 without any fertilizers input showed the lowest NO3 concentration, while other treatments showed no significant difference for NO3 concentration after 10 days of incubation.

4. Discussion

Biochar is an organic amendment which is used to improve soil productivity but low density biochar handling poses a challenge. Densification of biochar into tablet can address this problem. Table 1 provides a comparison among total N, P, and K contents of B-T, BF-T, BF-NT, and F-NT. The lowest total N, P, and K of B-T suggests that sole application of B-T only is not sufficient for plants to obtain sufficient N, P, and K for their growth and development. Therefore, it is essential to integrate NPK fertilizer with biochar for soil and crop quality enhancement. The total N, P, and K in BF-T and BF-NT were not significantly different because the same amount and type of materials were used for the production of BF-T and BF-NT. This also implies that the densification did not significantly impact on the nutrient content of BF-T.
The FTIR spectra revealed the changes of functional groups in B-T, BF-T, BF-NT, and F-NT. The aromatic C rings are typical chemical groups of biochar [27,28]. This indicates that the B-T, BF-T, and BF-NT consisted of aromatic C compounds which would be degraded slowly by microorganisms [29]. The alcoholic and phenolic groups in B-T enable adsorption of cations on the biochar surfaces [30]. However, the appearance of NH stretch (3100–2700 cm−1) in the BF-T and disappearance of a band (3400–3200 cm−1), suggest that adsorption sites of alcoholic and phenolic groups were exchanged with NH4+ substances after the addition of ammonium-based fertilizer into the biochar. Similar bands of NH stretch, S=O, and C-N in BF-T and F-NT, indicate that the fertilizers were well integrated into the biochar following densification. Similar findings were also reported by Zhang et al. [31], who found similar bands in the NH3 modified biochar. In comparison to F-NT, the NH bending was only present in BF-T, indicating that N compounds encrusted in the structure of BF-T [31] and this made it more stable against degradation. The absence of amine and organic sulfate in BF-NT without densification suggests weak binding and interaction of the fertilizer with the biochar surface groups.
Research to date focuses on the nutrient release pattern of blended biochar and fertilizer instead, comparing nutrient release patterns of blended biochar and fertilizer with and without densification. In our present study, the nutrient release patterns of B-T, BF-T, BF-NT, and F-NT were studied using a water incubation test conducted in the laboratory. Though it may not correspond to real conditions in the field, this method enabled us to compare the release pattern of the biochar and fertilizers under accelerated conditions. The N fertilizer used in this present study was ammonium sulfate. Compared with other ammonium-based fertilizers, ammonium sulfate has lower N content and a minimal N loss [32]. Ammonium sulfate is a soluble N fertilizer and this explains the rapid increase in the water soluble NH4+ for F-NT during 30 days of water incubation. The lowest NH4+ release in B-T is related to the volatilized N during combustion, after which the remaining N was transformed into a more stable form. This stable N which was relatively resistant to leaching [33]. Compared with F-NT, a smaller amount of NH4+ was released upon a combination of biochar and NPK fertilizer during the water incubation. One of the reasons for this finding could be the absorption of ammonium to the negatively charged surface functional groups (CO-stretching) in the biochar (Figure 1). This decreased the amount of NH4+ release for BF-NT. Our results suggest that the slow release of N- NH4+ in BF-T relates to the stronger binding of ammonium sulfate in the pores and functional groups in biochar followed by the densification. A negligible quantity of soluble NO3 released from the F-NT might be explained by the significant amount of ammonium sulfate used in the F-NT being made of NH4+-N [32]. The soluble NO3 release from the B-T was within the range of NO3 concentration in the soil amended with biochar [34].
The slowest P release recorded in B-T is related to the binding of P with multivalent metal cations in biochar that are not easily solubilized with water [35]. Similar findings were also reported by Novak et al. [35], who found less than 1% soluble P was released of the total P for the biochar alone. A higher percent P release was observed in the treatments with biochar and fertilizer compared with F-NT. Higher P solubility after combining biochar and NPK was mainly regulated by the interaction of P with mineral ash (particularly Ca2+ and Mg2+) in the biochar. This reaction neutralized the water solution to increase the P availability. This suggests that combined use of biochar and NPK can increase P availability for plants because P is immobile due to adsorption, precipitation, and conversion into an organic form. Minimal release of water soluble K likely occurred from B-T, because of its relatively lower total K content (1.23%) and K was likely bound in the aromatic structural forms. These compounds are less soluble in water. The highest percentage of water soluble K leached from BF-NT indicates that the fine ash biochar without densification has a higher surface area and this enables water to solubilize more nutrients, including K [36].
On day 30 of the water incubation experiment, a high percentage of water-soluble ammonium in F-NT was consistent with the soluble fertilizer sources. This water-soluble ammonium suggests short term availability for the plant uptake. High leaching of NH4 in the short term could acidify the soil to impede the nutrient uptake efficiency of the plants. Additionally, the plants might not be able to uptake the sufficient nutrients efficiently because of the rapid release of the nutrients. In comparison to BF-NT, the BF-T had a significantly lower percentage of soluble nutrient release and this suggests that the BF-T could serve as a slow release fertilizer because tableting it increased the bonding between these mobile nutrients and biochar structural forms. However, too low nutrient release from B-T will result in poor nutrient uptake, which could limit a plant’s growth and development.
Soil NH4+ and NO3 are not only susceptible to leaching but they are also lost through ammonia volatilization. Ammonia volatilization is mainly affected by soil texture, NH4+ concentration, and soil pH [37]. Mineral clay soil (Malacca series, Oxisol) was used in our soil NH3 volatilization study. The pH of this soil is typical of Oxisols [38]. Apparently, soil available NH4+ and NO3 were too low to meet plant demand [39]. Ammonia loss is generally considered as one of the major N loss pathways from agricultural land. Soil NH3 loss after N application commonly lasts for 10 days [40]. In this present study, soil alone did not emit NH3. Likewise, no NH3 loss was observed in the fertilized soil (T2). The NPK fertilizers used in this present study were AS, TSP, and MOP. Mixing these fertilizers creates a very low pH in fertilizer microsites [15] because it comprises acidic sulfate and phosphate anions. This interaction retarded the AS hydrolysis, which ended up inhibiting the ammonia emission.
Co-application of fertilizer and biochar, regardless of whether there was tableting or not, caused significantly higher NH3 loss compared with the unfertilized control (T1) and F-NT treatments (T2). The soil NH3 emission was relatively rapid after day one of the co-application of fertilizer and biochar, regardless of whether there was tableting or not, because base salts of the biochar increased the soil pH to trigger hydrolysis of the nitrogen fertilizers. Rapid NH3 emission after N application has been reported by Wang et al. [40]. Ammonia volatilization peaked on the second day for BF-NT (T3) and BF-T (T4) followed by a rapid decrease because of hydrolysis of the N fertilizer to NH4, particularly when the initial soil water is high. With time, the soil water and NH4 contents decreased within five days after fertilization. This was accompanied by a gradual NH3 loss decline. Our findings contrasted with that of Mencaroni et al. [41] who reported that mixing organic and mineral fertilizer reduces NH3 volatilization. The high pH of the biochar used in our study might have caused a favorable condition for NH3 volatilization and this observation is consistent with that of Sha et al. [12], who reported that soil NH3 volatilization depends on the characteristics of the input material. Compared with T4, the lower soil NH3 emitted from T3 could be associated with the higher surface area and porosity of the biochar and fertilizer without tableting enhanced NH3 absorption.
Soil pH is generally the main factor affecting NH3 emissions [41]. The biochar in T3 did not significantly change the soil pH after on the 10th day of the ammonia volatilization experiment and this was possibly because of the higher surface area of the biochar without tableting and the counteracting effects of biochar and fertilizer on soil pH [42]. This contributed to the stability (buffering capacity) of soil pH. In contrast, BF-T (T4) significantly decreased soil pH at 10 days of the incubation study because of the slow breakdown of the tablets followed by H ions release from the fertilizer during the nitrification. This might have acidified the soil with T4. The low soil pH with T2 is associated with the acidity of the NPK fertilizer. Soil EC has also been implicated in ammonia emission [43]. In comparison with T2, the lower NH4 concentrations in T3 and T4 were ascribed to the intense NH3 volatilization during the soil incubation study. This caused less NH4 retention in the soil (Table 5). Because of the acidic nature of the soil with T2, a significant amount of the NH3 converted to NH4 were not significantly volatilized. NH3 volatilization depends on nitrification because its onset marked the end of volatilization [44]. T1 without the fertilizers has the lowest NO3 concentration. The low NO3 concentrations in the soils with fertilizer and biochar could be attributed to the composition of ammonium sulfate used in the NPK fertilizer dominated by NH4+-N [32].

5. Conclusions

The slowest nutrient release in B-T is associated with its relatively lower total nutrient contents and the nutrients were likely bound in aromatic structural forms. Conversely, a rapid increase in the water soluble ammonium for F-NT was because F-NT is a soluble fertilizer. Combined use of biochar and NPK can increase P availability for plants because P is immobile due to adsorption, precipitation, and conversion into an organic form. The blending of biochar and NPK fertilizer into tablets caused a stronger physical binding of the nutrients within the tablet in addition to stronger chemical bondings between the nutrients with the biochar’s functional groups. This contributes to BF-T slowing the release of nutrients (particularly N and K) in the water incubation. Nevertheless, co-application of fertilizer and biochar, regardless of whether there was tableting or not, increased soil NH3 volatilization compared with the F-NT. Mixing NPK fertilizers creates a very low pH in the F-NT microsite, which could inhibit the NH3 emission. The results demonstrated that the lower soil NH3 emitted from T3 could be associated with a higher surface area and porosity of the biochar and fertilizer without tableting enhanced NH3 absorption. Although blending of biochar and NPK fertilizer into tablets showed the slowest nutrient release in the water incubation, it had the highest soil NH3 volatilization among the treatments. This laboratory incubation experiment may not correspond to real conditions in the field but this method allows us to accurately compare the release patterns of the blended biochar and fertilizer with- and without-tableting under accelerated conditions. Thus, a long-term field study is required to confirm the findings obtained.

Author Contributions

Conceptualization, Y.L.L. and O.H.A.; methodology, Y.L.L. and S.A.W.; investigation, Y.L.L.; resources, M.B.J. and A.A.M.; writing—original draft preparation, Y.L.L.; writing—review and editing, O.H.A. and S.A.W.; visualization, A.A.M.; supervision, O.H.A., S.A.W. and M.B.J.; project administration, Y.L.L. and A.A.M.; funding acquisition, O.H.A. and M.B.J. All authors have read and agreed to the published version of the manuscript.

Funding

This research was funded by Universiti Putra Malaysia (Putra Grant Vote No. 9622000) and the APC was funded by Universiti Putra Malaysia.

Data Availability Statement

Not applicable.

Acknowledgments

The authors would like to acknowledge the financial support provided through Putra Grant UPM. Also, we acknowledge colleagues and staff at Universiti Malaysia Perlis, Universiti Putra Malaysia, Universiti Malaysia Sabah and Management & Science University for their technical support and collaboration.

Conflicts of Interest

The authors declare no conflict of interest.

References

  1. Majeed, Z.; Ramli, N.K.; Mansor, N.; Man, Z. A comprehensive review on biodegradable polymers and their blends used in controlled-release fertilizer processes. Rev. Chem. Eng. 2015, 31, 69–96. [Google Scholar] [CrossRef]
  2. Wen, P.; Han, Y.; Wu, Z.; He, Y.; Ye, B.C.; Wang, J. Rapid synthesis of a corncob-based semi-interpenetrating polymer network slow-release nitrogen. Arab. J. Chem. 2017, 10, 922–934. [Google Scholar] [CrossRef]
  3. Roshanravan, B.; Soltani, S.M.; Rashid, S.A.; Mahdavi, F.; Yusop, M.K. Enhancement of nitrogen release properties of urea–kaolinite fertilizer with chitosan binder. Chem. Spec. Bioavailab. 2015, 27, 44–51. [Google Scholar] [CrossRef]
  4. Sharma, V.; Sharma, K.N. Influence of Accompanying Anions on Potassium Retention and Leaching in Potato Growing Alluvial Soils. Pedosphere 2013, 23, 464–471. [Google Scholar] [CrossRef]
  5. Sim, D.H.H.; Tan, I.A.W.; Lim, L.L.P.; Hameed, B.H. Encapsulated biochar-based sustained release fertilizer for precision agriculture: A review. J. Clean. Prod. 2021, 303, 127018. [Google Scholar] [CrossRef]
  6. Liu, Z.; He, T.; Cao, T.; Yang, T.; Men, J.; Chen, W. Effects of biochar application on nitrogen leaching, ammonia volatilization and nitrogen use efficiency in two distinct soils. J. Soil Sci. Plant. Nutr. 2017, 17, 515–528. [Google Scholar] [CrossRef] [Green Version]
  7. Cheng, C.H.; Lin, T.P.; Lehmann, J.; Fang, L.J.; Yang, Y.W.; Menyailo, O.V.; Chang, K.H.; Lai, J.S. Sorption properties for black carbon (wood char) after long term exposure in soils. Org. Geochem. 2014, 70, 53–61. [Google Scholar] [CrossRef]
  8. Hale, S.E.; Alling, V.; Martinsen, V.; Mulder, J.; Breedveld, G.D.; Cornelissen, G. The sorption and desorption of phosphate-P, ammonium-N and nitrate-N in cacao shell and corn cob biochars. Chemosphere 2013, 91, 1612–1619. [Google Scholar] [CrossRef]
  9. Yao, Y.; Gao, B.; Zhang, M.; Inyang, M.; Zimmerman, A.R. Effect of biochar amendment on sorption and leaching of nitrate, ammonium, and phosphate in a sandy soil. Chemosphere 2012, 89, 1467–1471. [Google Scholar] [CrossRef]
  10. Lehmann, J.; daSilva, J.P., Jr.; Steiner, C.; Nehls, T.; Zech, W.; Glaser, B. Nutrient availability and leaching in an archaeological Anthrosol and a Ferralsol in the Central Amazon basin: Fertiliser, manure and charcoal amendments. Plant Soil 2003, 249, 343–357. [Google Scholar] [CrossRef]
  11. Mandal, S.; Thangarajan, R.; Bolan, N.S.; Sarkar, B.; Khan, N.; Yong, S.O.; Naidu, R. Biochar-induced concomitant decrease in ammonia volatilization and increase in nitrogen use efficiency by wheat. Chemosphere 2016, 142, 120–127. [Google Scholar] [CrossRef]
  12. Sha, Z.; Li, Q.; Lv, T.; Misselbrook, T.; Liu, X. Response of ammonia volatilization to biochar addition: A meta-analysis. Sci. Total Environ. 2019, 655, 1387–1396. [Google Scholar] [CrossRef] [PubMed]
  13. Hu, Q.; Yang, H.; Yao, D.; Zhu, D.; Wang, X.; Shao, J.; Chen, H. The densification of bio-char: Effect of pyrolysis temperature on the qualities of pellets. Bioresour. Technol. 2015, 200, 521–527. [Google Scholar] [CrossRef]
  14. Dunisch, O.; Lima, V.C.; Seehann, G.; Donath, J.; Montoia, V.R.; Schwarz, T. Retention properties of wood residues and their potential for soil amelioration. Wood Sci. Technol. 2007, 41, 169–189. [Google Scholar] [CrossRef]
  15. Lee, Y.L.; Ahmed, O.H.; Samsuri, A.W.; Zakry, F.A.A. Biochar Tablets with and without Embedded Fertilizer on the Soil Chemical Characteristics and Nutrient Use Efficiency of Zea mays. Sustainability 2021, 13, 4878. [Google Scholar] [CrossRef]
  16. Cottenie, A. Soil testing and plant testing as a basis of fertilizer recommendation. FAO Soil Bulletin 1980, 38, 3–70. [Google Scholar]
  17. Trenkel, M.E. Slow- and Controlled-Release and Stabilized Fertilizers: An Option for Enhancing Nutrient Use Efficiency in Agriculture; International Fertilizer Industry Association (IFA): Paris, France, 2010. [Google Scholar]
  18. Lan, W.; Mingzhu, L. Preparation and Properties of Chitosan-Coated NPK Compound Fertilizer with Controlled-Release and Water-Retention. Carbohydr. Polym. 2008, 72, 240–247. [Google Scholar]
  19. Mulvaney, R.L. Nitrogen-Inorganic Forms. In Methods of Soil Analysis Part 3—Chemical Methods; Sparks, D.L., Page, A.L., Helmke, P.A., Loeppert, R.H., Eds.; The Soil Science Society of America, Inc.; American Society of Agronomy, Inc.: Madison, WI, USA, 1996; pp. 1123–1184. [Google Scholar]
  20. Bouyoucos, G.J. Hydrometer meter improved for making particle size analysis of soils. Agronomy 1962, 54, 464–465. [Google Scholar] [CrossRef]
  21. Keeney, D.R.; Nelson, D.W. Nitrogen-inorganic forms. In Method of Soil Analysis, Part 2, 2nd ed.; Page, A.L., Keeney, D.R., Baker, D.E., Miller, R.H., Ellis, R., Rhoades, J.D., Eds.; Agronomy Monographs, 9; American Society of Agronomy, Inc.: Madison, WI, USA, 1982; pp. 643–698. [Google Scholar]
  22. Wan, C.; Li, H.; Zhao, L.; Li, Z.; Zhang, C.; Tan, X.; Liu, X. Mechanism of removal and degradation characteristics of dicamba by biochar prepared from Fe-modified sludge. J. Environ. Manage. 2021, 299, 113602. [Google Scholar] [CrossRef]
  23. Campos, P.; Knicker, H.; Miller, A.Z.; Velasco-Molina, M.; La Rosa, J.M.D. Biochar ageing in polluted soils and trace elements immobilisation in a 2-year field experiment. Environ. Pollut. 2021, 290, 118025. [Google Scholar] [CrossRef]
  24. Li, X.; Fang, G.; Qian, X.; Tian, Q. Z-scheme heterojunction of low conduction band potential MnO2 and biochar-based g-C3N4 for efficient formaldehyde degradation. Chem. Eng. J. 2022, 428, 131052. [Google Scholar] [CrossRef]
  25. Liu, X.; Liao, J.; Song, H.; Yang, Y.; Guan, C.; Zhang, Z. A Biochar-Based Route for Environmentally Friendly Controlled Release of Nitrogen: Urea-Loaded Biochar and Bentonite Composite. Sci. Rep. 2019, 9, 9548. [Google Scholar] [CrossRef] [PubMed]
  26. Nandiyanto, A.B.D.; Oktiani, R.; Ragadhita, R. How to Read and Interpret FTIR Spectroscope of Organic Material. Indones. J. Sci. Technol. 2019, 4, 97–118. [Google Scholar] [CrossRef]
  27. Adhikari, S.; Gascó, G.; Méndez, A.; Surapaneni, A.; Jegatheesan, J.; Shah, K.; Paz-Ferreiro, J. Influence of pyrolysis parameters on phosphorus fractions of biosolids derived biochar. Sci. Total Environ. 2019, 695, 133846. [Google Scholar] [CrossRef]
  28. Yu, H.; Zou, W.; Chen, J.; Chen, H.; Yu, Z.; Huang, J.; Tang, H.; Wei, X.; Gao, B. Biochar amendment improves crop production in problem soils: A review. J. Environ. Manage. 2019, 232, 8–21. [Google Scholar] [CrossRef]
  29. Kuzyakov, Y.; Subbotina, I.; Chen, H.; Bogomolova, I.; Xu, X. Black carbon decomposition and incorporation into soil microbial biomass estimated by 14C labelling. Soil Biol. Biochem. 2009, 41, 210–219. [Google Scholar] [CrossRef]
  30. Nartey, O.D.; Zhao, B. Biochar Preparation, Characterization, and Adsorptive Capacity and Its Effect on Bioavailability of Contaminants: An Overview. Adv. Mater. Sci. Eng. 2014, 2014, 1–12. [Google Scholar] [CrossRef] [Green Version]
  31. Zhang, X.; Zheng, H.; Li, G.; Gu, J.; Shao, J.; Zhang, S.; Yang, H.; Chen, H. Ammoniated and activated microporous biochar for enhancement of SO2 adsorption. J. Anal. Appl. Pyrolysis 2021, 156, 105119. [Google Scholar] [CrossRef]
  32. Chien, S.H.; Gearhart, M.M.; Villagarcia, S. Comparison of ammonium sulfate with other nitrogen and sulfur fertilizers in increasing crop production and minimizing environmental impact: A review. Soil Sci. 2011, 176, 327–335. [Google Scholar] [CrossRef]
  33. Cheng, H.; Jones, D.L.; Hill, P.; Bastami, M.S.; Tu, C.L. Influence of biochar produced from different pyrolysis temperature on nutrient retention and leaching. Arch. Agron. Soil Sci. 2017, 64, 1–11. [Google Scholar] [CrossRef]
  34. Liao, X.; Liu, D.; Niu, Y.; Chen, Z.; He, T.; Ding, W. Effect of field-aged biochar on fertilizer N retention and N2O emissions: A field microplot experiment with 15N-labeled urea. Sci. Total Environ. 2021, 773, 145645. [Google Scholar] [CrossRef]
  35. Novak, J.M.; Johnson, M.G.; Spokas, K.A. Concentration and release of phosphorus and potassium from lignocellulosic- and manure-based biochars for fertilizer reuse. Front. Sustain. Food Syst. 2018, 2, 1–9. [Google Scholar] [CrossRef]
  36. Kim, P.; Hensley, D.; Labbe, N. Nutrient release from switchgrass-derived biochar pellets embedded with fertilizers. Geoderma 2014, 232–234, 341–351. [Google Scholar] [CrossRef]
  37. Schraml, M.; Gutser, R.; Maier, H.; Schmidhalter, U. Ammonia loss from urea in grassland and its mitigation by the new urease inhibitor 2-NPT. J. Agric. Sci. 2016, 154, 1453–1462. [Google Scholar] [CrossRef] [Green Version]
  38. Ndzana, G.M.; Huang, L.; Zhang, Z.; Zhu, J.; Liu, F.; Bhattacharyya, R. The transformation of clay minerals in the particle size fractions of two soils from different latitude in China. Catena 2019, 175, 317–328. [Google Scholar] [CrossRef]
  39. El-Ramady, H.R.; Alshaal, T.A.; Amer, M.; Domokos-Szabolcsy, E.; Elhawat, N.; Prokisch, J.; Fari, M. Soil Quality and Plant Nutrition. Sustain. Agric. Rev. 2014, 14, 345–447. [Google Scholar]
  40. Wang, Y.; Li, M.; Yan, H. Ammonia volatilization from urea in alfalfa field with different nitrogen application rates, methods and timing. Agric. Ecosyst. Environ. 2021, 312, 107344. [Google Scholar] [CrossRef]
  41. Mencaroni, M.; Dal Ferro, N.; Furlanettoa, J.; Longoa, M.; Lazzarob, B.; Sartoric, L.; Grantd, B.B.; Smithd, W.N.; Morari, F. Identifying N fertilizer management strategies to reduce ammonia volatilization: Towards a site-specific approach. J. Environ. Manage. 2021, 277, 111445. [Google Scholar] [CrossRef] [PubMed]
  42. Chathurika, J.A.S.; Kumaragamage, D.; Zvomuya, F.; Akinremi, O.O.; Flaten, D.N.; Indraratne, S.P.; Dandeniya, W.S. Woodchip biochar with or without synthetic fertilizers affects soil properties and available phosphorus in two alkaline, chernozemic soils. Can. J. Soil Sci. 2016, 96, 472–484. [Google Scholar] [CrossRef]
  43. Li, Y.; Huang, L.; Zhang, H.; Wang, M.; Liang, Z. Assessment of Ammonia Volatilization Losses and Nitrogen Utilization during the Rice Growing Season in Alkaline Salt-Affected Soils. Sustainability 2017, 9, 132. [Google Scholar] [CrossRef] [Green Version]
  44. Kumar, P.; Aggarwal, R.K. Interdependence of ammonia volatilization and nitrification in arid soils. Nutr. Cycling Agroecosyst. 1998, 51, 201–207. [Google Scholar] [CrossRef]
Figure 1. FTIR spectra of biochar tablets (B-T), biochar and fertilizer with (BF-T) and without tableting (BF-NT) as well as NPK fertilizer (F-NT).
Agronomy 11 02082 g001
Figure 2. Ammonium release at five day intervals for 30 days of a water incubation experiment.
Agronomy 11 02082 g002
Figure 3. Percent ammonium release of total N applied at five day intervals for 30 days of a water incubation experiment.
Agronomy 11 02082 g003
Figure 4. Nitrate release at five day intervals for 30 days of a water incubation experiment.
Agronomy 11 02082 g004
Figure 5. Percent nitrate release of total N applied at five day intervals for 30 days of a water incubation experiment.
Agronomy 11 02082 g005
Figure 6. Phosphorus release at five day intervals for 30 days of a water incubation experiment.
Agronomy 11 02082 g006
Figure 7. Percent phosphorus release of total P applied at five day intervals for 30 days of a water incubation experiment.
Agronomy 11 02082 g007
Figure 8. Potassium release at five day intervals for 30 days of a water incubation experiment.
Agronomy 11 02082 g008
Figure 9. Percent potassium release of total K applied at five day intervals for 30 days of a water incubation experiment.
Agronomy 11 02082 g009
Figure 10. Daily loss of ammonia for 10 days of incubation. T1: Soil only, T2: F-NT, T3: BF-NT, T4: BF-T.
Agronomy 11 02082 g010
Table 1. Total N, P, and K contents of biochar tablets (B-T), biochar and fertilizer with (BF-T) and without tableting (BF-NT) in addition to NPK fertilizer (F-NT).
SamplesTotal Nutrient Content
N (%)P (%)K (%)
B-T0.75c ± 0.010.07c ± 0.011.23c ± 0.09
BF-T4.96b ± 0.110.36b ± 0.012.45b ± 0.06
BF-NT5.05b ± 0.090.36b ± 0.012.58b ± 0.04
F-NT13.73a ± 0.274.40a ± 0.108.28a ± 0.23
Means in the same column with the same letters were not found to be significantly different by Tukey’s test (p ≥ 0.05).
Table 2. FTIR wavenumber identification of biochar tablets (B-T), biochar and fertilizer with (BF-T) and without tableting (BF-NT) as well as NPK fertilizer (F-NT).
SamplesCorresponding Characteristic VibrationFunctional GroupsReferences
B-TO-H (3400–3200), C-O (1300–1000)
C=C (1600–1475), =C-H (900–690)
Alcohol and phenolic
Aromatic
[22]
[23]
BF-TN-H (3100–2700), NH bending (1640–1550), C-N (1350–1000)
C=C (1600–1475), =C-H (900–690)
S=O (1420–1370)
Amine
Aromatic
Organic sulfate
[24,25]
[23]
[26]
BF-NTC=C (1600–1475), =C-H (900–690)
C-O (1300–1000)
Aromatic
Alcohol
[23]
[22]
F-NTN-H (3100–2700), C-N (1350–1000)
S=O (1420–1370)
Amine
Organic sulfate
[24,25]
[26]
Table 3. Percent soluble nutrient release from different treatments during water incubation on the 30th day.
SamplesPercent Nutrient Release (%)
AmmoniumNitratePhosphorusPotassium
B-T0.32d ± 0.050.35a ± 0.040.06b ± 0.010.05c ± 0.01
BF-T1.81c ± 0.030.05b ± 0.010.34a ± 0.010.16b ± 0.01
BF-NT3.23b ± 0.040.06b ± 0.010.35a ± 0.010.24a ± 0.01
F-NT4.03a ± 0.220.03b ± 0.010.06b ± 0.010.17b ± 0.01
Means in the same column with the same letters were not found to be significantly different by Tukey’s test (p ≥ 0.05).
Table 4. Selected soil chemical characteristics before the soil ammonia volatilization experiment.
Chemical CharacteristicsSoil
pH5.68 ± 0.07
Electrical conductivity (mS cm−1)0.02 ± 0.01
Available ammonium (mg kg−1)42.93 ± 4.94
Available nitrate (mg kg−1)17.87 ± 1.94
Values are means of three replicates followed by ± standard error of means (n = 3).
Table 5. Accumulation of ammonia volatilization for 10 days of incubation.
TreatmentsTotal Ammonia Volatilization (%)
T10
T20
T38.98b ± 0.22
T413.52a ± 0.25
Means in the same column with the same letters were not found to be significantly different by Tukey’s test (p ≥ 0.05).
Table 6. Selected soil chemical characteristics at 10 days of an ammonia volatilization experiment.
TreatmentsSoil Chemical Properties
pHECAmmonium (mg/kg)Nitrate (mg/kg)
T15.68a ± 0.070.02c ± 0.0142.93c ± 4.9417.87b ± 1.94
T24.95b ± 0.046.95ab ± 0.142251.2a ± 64.4836.4ab ± 2.80
T35.52a ± 0.086.45b ± 0.201770.53b ± 9.4742.93ab ± 6.53
T45.04b ± 0.187.02a ± 0.061936.67b ± 35.1346.67ab ± 8.14
Means in the same column with the same letters were not found to be significantly different by Tukey’s test (p ≥ 0.05). T1: Soil only, T2: F-NT, T3: BF-NT, T4: BF-T.
Publisher’s Note: MDPI stays neutral with regard to jurisdictional claims in published maps and institutional affiliations.

