
The Role of Cover Crop Types and Residue Incorporation in Improving Soil Chemical Properties


 and
and
Abstract
:1. Introduction
2. Materials and Methods
2.1. The Greenhouse Trial
2.2. The Field Trial
2.3. Statistical Analysis
3. Results
3.1. The Greenhouse Trial
3.2. The Field Trial
4. Discussion
5. Conclusions
Author Contributions
Funding
Institutional Review Board Statement
Informed Consent Statement
Data Availability Statement
Acknowledgments
Conflicts of Interest
References
- Martinez-Sabater, E.; Bustamante, M.A.; Marhuenda-Egea, F.C.; El-Khattabi, M.; Moral, R.; Lorenzo, E.; Paredes, C.; Galvez, L.N.; Jorda, J.D. Study of the Evolution of Organic Matter During Composting of Winery and Distillery Residues by Classical 305 and Chemometric Analysis. J. Agric. Food Chem. 2009, 57, 9613–9623. [Google Scholar] [CrossRef]
- Wulanningtyas, H.S.; Gong, Y.; Li, P.; Sakagami, N.; Nishiwaki, J.; Komatsuzaki, M. A cover crop and no-tillage system for enhancing soil health by increasing soil organic matter in soybean cultivation. Soil Tillage Res. 2021, 205, 104749. [Google Scholar] [CrossRef]
- Kauer, K.; Pärnpuu, S.; Talgre, L.; Eremeev, V.; Luik, A. Soil Particulate and Mineral-Associated Organic Matter Increases in Organic Farming under Cover Cropping and Manure Addition. Agriculture 2021, 11, 903. [Google Scholar] [CrossRef]
- Stegarescu, G.; Escuer-Gatius, J.; Soosaar, K.; Kauer, K.; Tõnutare, T.; Astover, A.; Reintam, E. Effect of Crop Residue Decomposition on Soil Aggregate Stability. Agriculture 2020, 10, 527. [Google Scholar] [CrossRef]
- Blesh, J.; Vandusen, B.M.; Brainard, D.C. Managing Ecosystem Services with Cover Crop Mixtures on Organic Farms. Agron. J. 2019, 111, 826–840. [Google Scholar] [CrossRef]
- Teasdale, J.R. Contribution of Cover Crops to Weed Management in Sustainable Agricultural Systems. J. Prod. Agric. 1996, 9, 475–479. [Google Scholar] [CrossRef]
- Lu, Y.C.; Watkins, K.B.; Teasdale, J.R.; Abdul-Baki, A.A. Cover Crops in Sustainable Food Production. Food Rev. Int. 2000, 16, 121–157. [Google Scholar] [CrossRef]
- Haruna, S.I.; Nkongolo, N.V. Tillage, Cover Crop and Crop Rotation Effects on Selected Soil Chemical Properties. Sustainability 2019, 11, 2770. [Google Scholar] [CrossRef] [Green Version]
- Gattullo, C.E.; Mezzapesa, G.N.; Stellacci, A.M.; Ferrara, G.; Occhiogrosso, G.; Petrelli, G.; Castellini, M.; Spagnuolo, M. Cover Crop for a Sustainable Viticulture: Effects on Soil Properties and Table Grape Production. Agronomy 2020, 10, 1334. [Google Scholar] [CrossRef]
- Pokhrel, S.; Kingery, W.L.; Cox, M.S.; Shankle, M.W.; Shanmugam, S.G. Impact of Cover Crops and Poultry Litter on Selected Soil Properties and Yield in Dryland Soybean Production. Agronomy 2021, 11, 119. [Google Scholar] [CrossRef]
- Macdonald Potatoes: A Billion Industry for P.E.I|Local|News|The Guardian. Available online: https://www.theguardian.pe.ca/news/local/potatoes-a-billion-dollar-industry-for-pei-95098/ (accessed on 17 April 2020).
- Agriculture and Agri-Food Canada (AAFC). Potato Market Information Review, 2018–2019. Available online: http://www.agr.gc.ca/eng/horticulture/horticulture-sector-reports/potato-market-information-review-2018-2019/?id=1578663511988 (accessed on 17 April 2020).
- Seyedbagheri, M.M. Influence of Humic Products on Soil Health and Potato Production. Potato Res. 2010, 53, 341–349. [Google Scholar] [CrossRef]
- Nyiraneza, J.; Thompson, B.; Geng, X.; He, J.; Jiang, Y.; Fillmore, S.; Stiles, K. Changes in soil organic matter over 18 y in Prince Edward Island, Canada. Can. J. Soil Sci. 2017, 97, 745–756. [Google Scholar] [CrossRef]
- Government of Canada. Agriculture and Agri Food Canada. Available online: https://www.agr.gc.ca/eng/agriculture-and-agri-food-canada/?id=1395690825741 (accessed on 5 March 2021).
- Sculte, E.E.; Hopkins, B.G. Estimation of Soil Organic Matter by Weight Loss-on-Ignition. Am. Soc. Agron. 2015, 049, 21–31. [Google Scholar]
- Government of Prince Edward Island. Prince Edward Island Analytical Laboratories (PEIAL). Available online: https://www.princeedwardisland.ca/en/information/agriculture-and-land/pei-analytical-laboratories-peial (accessed on 5 March 2021).
- Titration Analysis Systems|Multi-Parameter Testing Equipment. Available online: https://mantech-inc.com/analysis-systems/automated-titration-analysis/ (accessed on 17 December 2020).
- Inductively Coupled Plasma-Optical Emission Spectrometry (ICP-OES)—CA. Available online: //www.thermofisher.com/ca/en/home/industrial/spectroscopy-elemental-isotope-analysis/trace-elemental-analysis/inductively-coupled-plasma-optical-emission-spectrometry-icp-oes.html (accessed on 17 December 2020).
- Konen, M.E.; Jacobs, P.M.; Burras, C.L.; Talaga, B.J.; Mason, J.A. Equations for Predicting Soil Organic Carbon Using Loss-on-Ignition for North Central U.S. Soils. Soil Sci. Soc. Am. J. 2002, 66, 1878–1881. [Google Scholar] [CrossRef]
- Minitab® 19. Minitab. In Minitab. Rel. 12 for Windows; Minitab: State College, PA, USA, 1998. [Google Scholar]
- Barrett, R. Keeping Your Soils Covered: Environmental and Economic Benefit! Available online: http://peipotatoagronomy.com/wp-content/uploads/2018/04/Cover-Crop-Factsheet-Apr18.pdf (accessed on 10 August 2021).
- Mann, K.K.; Schumann, A.W.; Obreza, T.A.; Harris, W.G.; Shukla, S. Spatial Variability of Soil Physical Properties Affecting Florida Citrus Production. Soil Sci. 2010, 175, 487–499. [Google Scholar] [CrossRef]
- Ding, G.; Liu, X.; Herbert, S.; Novak, J.; Amarasiriwardena, D.; Xing, B. Effect of Cover Crop Management on Soil Organic Matter. J. Geoderma. 2006, 130, 229–239. [Google Scholar] [CrossRef]
- Ramos, F.T.; Dores, E.F.D.C.; Weber, O.L.D.S.; Beber, D.C.; Campelo, J.H., Jr.; Maia, J.C.D.S. Soil organic matter doubles the cation exchange capacity of tropical soil under no-till farming in Brazil. J. Sci. Food Agric. 2018, 98, 3595–3602. [Google Scholar] [CrossRef]
- Mcleod, M.K.; Schwenke, G.D.; Cowie, A.L.; Harden, S. Soil Carbon is Only Higher in the Surface Soil under Minimum Tillage in Vertosols and Chormosols of New South Wales North-West Slopes and Plains, Australia. Soil Res. 2013, 51, 680–694. [Google Scholar] [CrossRef]
- Nascente, A.S.; Li, Y.C.; Crusciol, C.A.C. Cover crops and no-till effects on physical fractions of soil organic matter. Soil Tillage Res. 2013, 130, 52–57. [Google Scholar] [CrossRef]
- De Souza, G.P.; de Figueiredo, C.C.; de Sousa, D.M.G. Soil organic matter as affected by management systems, phosphate fertilization, and cover crops. Pesqui. Agropecu. Bras. 2016, 51, 1668–1676. [Google Scholar] [CrossRef] [Green Version]
- Chng, H.Y.; Ahmed, O.H.; Majid, N.M.A.; Jalloh, M.B. Reducing Soil Phosphorus Fixation to Improve Yield of Maize on a Tropical Acid Soil Using Compost and Biochar Derived from Agro-Industrial Wastes. Compos. Sci. Util. 2017, 25, 82–94. [Google Scholar] [CrossRef]
- Tan, K.; Keltjens, W.G. Interaction between Aluminium and Phosphorus in Sorghum Plants—II. Studies with the Aluminium Tolerant Sorghum Genotype SC0283. Plant Soil 1990, 124, 25–32. [Google Scholar] [CrossRef]
- Obi, M.E. The Physical and Chemical Responses of a Degraded Sandy Clay Loam Soil to Cover Crops in Southern Nigeria. J. Plant Soil 1999, 211, 165–172. [Google Scholar] [CrossRef]
- Wissem, H.; Noura, Z.; Ernest, K.; Didier, B.; Frederic, G.; Mongi, S. Effect of the soil properties on the sorption capacity of phosphorus and ammonium by alkaline soils of the semi-arid areas. Appl. Chem. 2005, 8, 2278–5736. [Google Scholar]
- Fageria, N.K.; Baligar, V.C.; Bailey, B.A. Role of cover crops in improving soil and row crop productivity. Commun. Soil Sci. Plant Anal. 2005, 36, 2733–2757. [Google Scholar] [CrossRef]
- Hallama, M.; Pekrun, C.; Lambers, H.; Kandeler, E. Hidden miners—The roles of cover crops and soil microorganisms in phosphorus cycling through agroecosystems. Plant Soil 2019, 434, 7–45. [Google Scholar] [CrossRef] [Green Version]
- Dean, L.A. Fixation of soil phosphorus. Adv. Agron. 2008, 1, 391–411. [Google Scholar]
- Eric, D.R.; Peter, D.R.; Luiz, A.M.; Luciana, D.C.; Silvia, R.L.; Felipe, F.V.; Edwin, W.; Stephanie, A.S.; Leah, K.V.; Stephen, P. The phosphorus cost of agriculture intensification in the tropics. Nat. Plants 2016, 2, 16043. [Google Scholar]
- USDA/NRCS. Soil ph. Soil Quality Kit—Guides for Educators. Available online: https://www.nrcs.usda.gov/Internet/FSE_DOCUMENTS/nrcs142p2_053293.pdf (accessed on 3 October 2021).
- Waterer, D. Impact of high soil pH on potato yields and grade losses to common scab. Can. J. Plant. Sci. 2002, 82, 583–586. [Google Scholar] [CrossRef] [Green Version]
- Understanding the Effect of Soil pH on Crop Productivity. Available online: http://www.agricura.co.zw/understanding-the-effects-of-soil-ph-on-crop-productivity/ (accessed on 17 June 2021).
- Whalley, H.J.; Knight, M.R. Calcium Signatures are decoded by plants to give Specific Gene Responses. New Phytol. 2013, 197, 690–693. Available online: www.newphytologist.com (accessed on 24 February 2021). [CrossRef] [PubMed]
- Groffman, P.M.; Hendrix, P.F.; Crossley, D.A. Effects of a Winter Legume on Phosphorus, Potassium, Calcium and Magnesium Cycling in a Humid Subtropical Agro Ecosystem. Agric. Ecosyst. Environ. 1987, 18, 281–289. [Google Scholar] [CrossRef]
- Koch, M.; Naumann, M.; Pawelzik, E. The Importance of Nutrient Management for Potato Production Part I. J. Plant Nutr. Yield 2020, 63, 97–119. [Google Scholar] [CrossRef] [Green Version]
- Chen, R.; Zhang, F.; Zhang, Q.; Sun, Q.; Dong, X.; Shen, R.F. Aluminium-phosphorus interactions in plants growing on acid soils: Does phosphorus always alleviate aluminium toxicity? J. Sci. Food Agr. 2012, 92, 995–1000. [Google Scholar] [CrossRef] [PubMed]


| Major Protocols | Greenhouse Trial | Field Trial |
|---|---|---|
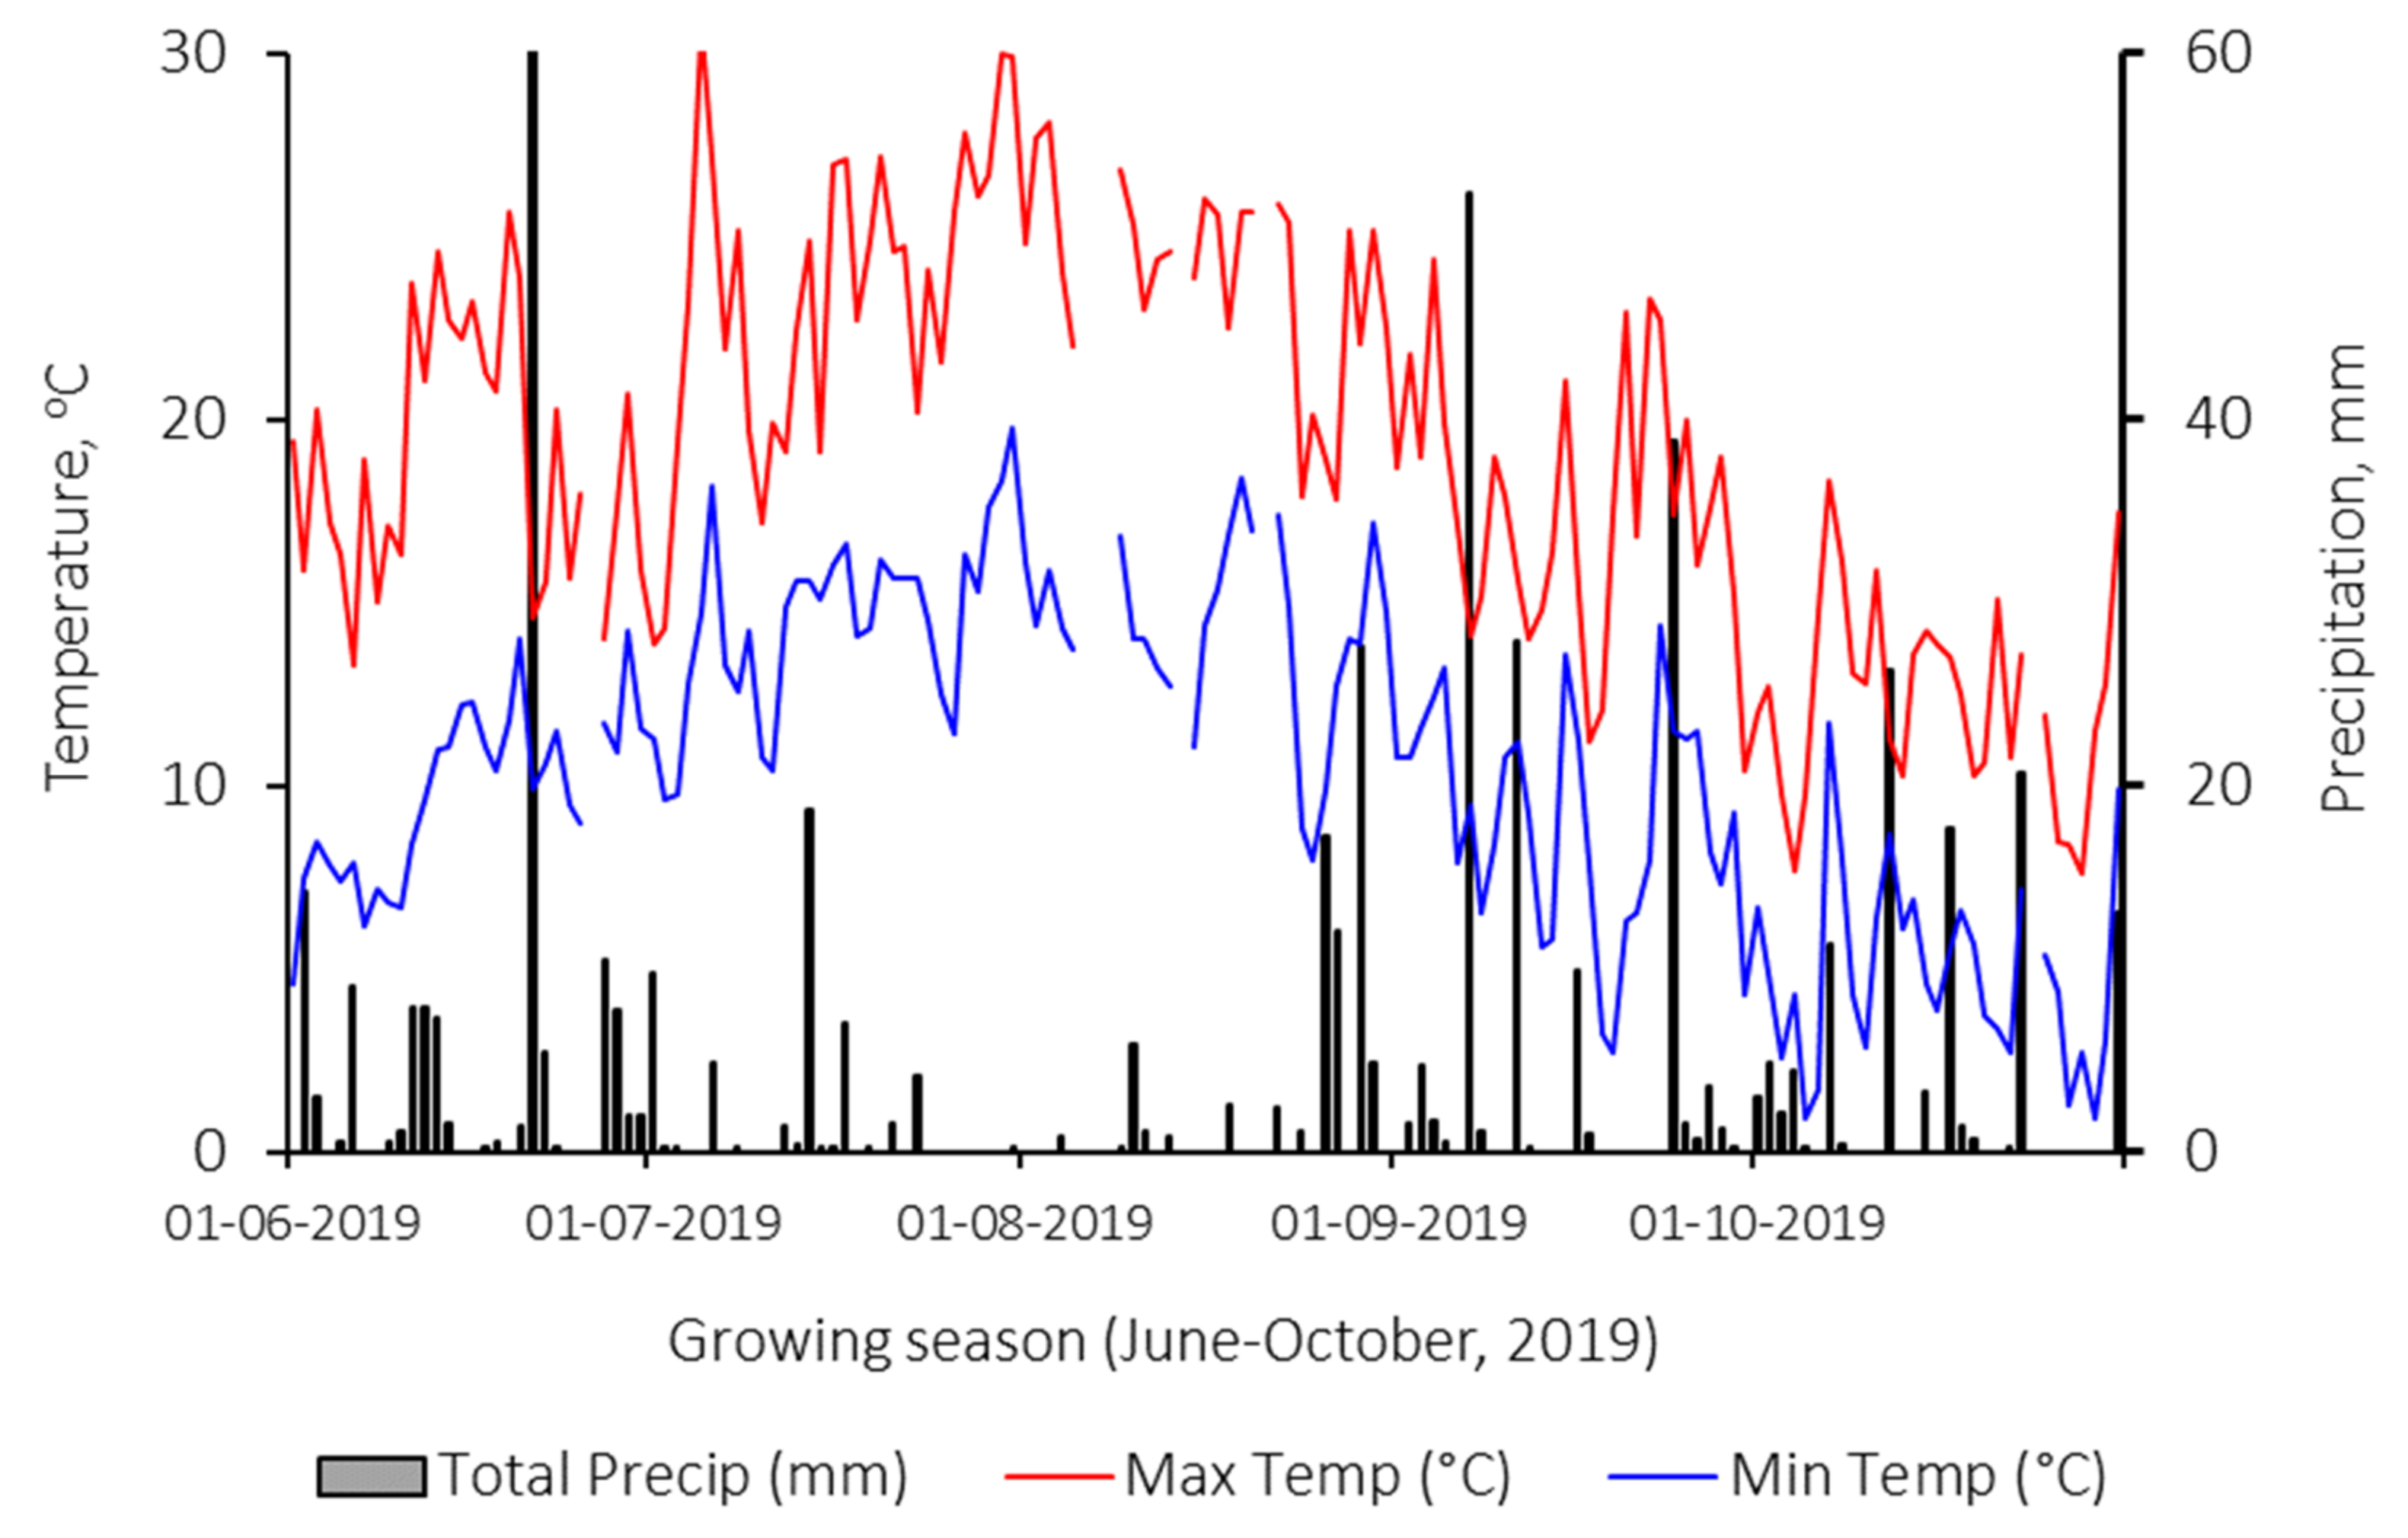
| Date | 25 February 2018 to 30 April 2019 | 25 June 2019 to 10 October 2019 |
| Temperature (minimum, maximum, mean), °C | −20.1, 30.8, 5.94 | −20.3, 29.9, 5.97 |
| Total annual precipitation, mm | 1149 | 1101 |
| Environmental conditions | Controlled conditions under a greenhouse of Agriculture and Agri-Food Canada’s (AAFC) Charlottetown Research and Development Centre at Harrington, PEI Canada. | The uncontrolled natural environment of an agricultural field of the AAFC Charlottetown Research and Development center at Harrington, PEI Canada. |
| Nature of the trial | Greenhouse trial arranged on a benchtop where 28 clay pots (14 cm diameter, 20 cm deep) were placed 1.5 m apart on four 8 m wide and 19 m long wooden benches. | Field trial with forty-eight (48) 4 m × 4 m treatment plots arranged in 16 m wide and 69 m long strips with a 1 m buffer zone between and around the strips. |
| Experimental design | Randomized complete block design. | Strip plot design. |
| Treatments and replications | Four replications of three cover crops and their three combinations and control (7 treatments) including T1 (brown mustard), T2 (buckwheat), T3 (phacelia), T4 (brown mustard + Pea), T5 (buckwheat + pea), T6 (phacelia + pea), and T7: control/no cover crop. | Four replications of the four cover crops treatments including C1 (timothy), C2 (buckwheat), C3 (brown mustard), and C4 (mix of hairy vetch, annual rye (winter rye), crimson clover). |
| Irrigation | Automated irrigation @ 150 mL/day to each pot. | No irrigation was provided at all as the crops were grown under rainfed conditions. |
| Light | Lights of photosynthetic photon flux density below 2000 µmol m−2 s−1 managed for 16 h/8 h light/dark periods. | Natural light conditions. |
| Crop husbandry | Weeding, disease symptom monitoring/control, and irrigation scheduling were under standard practices. | Standard practices of weeding, hoeing, disease symptom monitoring/control, nutrient management. |
| Methods of residue incorporation | Manual | Four methods of residue incorporation, namely, M1 (mow + disc), M2 (mow), M3 (roller crimper), and M4 (glyphosate). |
| Previous crop and fertilization | No synthetic fertilizer was used. | In 2018 of the cover crop year the previous crop was potatoes, which received fertilizer by banding with N rate of 170 kg N ha−1 as 17-17-17 Nitrogen–Phosphorus–Potassium (NPK). In 2019 of the cover crop year, the previous crop was buckwheat, and no fertility was applied. |
| Treatments Cover Crops | Sowing Rate kg/ha | Treatments and Cover Crops | Sowing Rate kg/ha |
|---|---|---|---|
| T1: Brown mustard | 11.0 | T4: Brown mustard + Pea | 5.50 + 78.5 |
| T2: Buckwheat | 45.0 | T5: Buckwheat + Pea | 22.5 + 78.5 |
| T3: Phacelia | 10.0 | T6: Phacelia + Pea | 5.00 + 78.5 |
| T7: Control/no cover crop | N/A |
| Methods | Termination Technique | Description of Incorporation and Equipment Used for the Specific Purpose |
|---|---|---|
| M1 | Mow + Disc | Cover crops were mowed with a flail mower and incorporated into the soil with the help of a tractor-mounted disc plow. |
| M2 | Mow only | Cover crops were mowed with a flail mower. |
| M3 | Roller crimper | Roller crimper—front-mounted roller crimper bar (manufactured at Rodale Institute in Pennsylvania) was used for the plowing of cover crops. |
| M4 | Glyphosate | Glyphosate applied @ 2.33 L/ha to terminate cover crop into the soil. |
| Soil Properties | Greenhouse Trial | Field Trial | ||
|---|---|---|---|---|
| Mean ± S.D. 1 | Min–Max | Mean ± S.D. | Min–Max | |
| Soil organic matter, % | 2.32 ± 0.31 | 2.20–3.40 | 2.71 ± 0.22 | 2.20–3.00 |
| Phosphorus, mg/kg 2 | 366 ± 41.5 | 289–399 | 260 ± 21.2 | 233–305 |
| Potassium, mg/kg | 196 ± 53.1 | 100–289 | 182 ± 25.1 | 116–269 |
| pH | 6.62 ± 0.30 | 5.80–7.00 | 6.60 ± 0.26 | 6.00–6.90 |
| Calcium, mg/kg | 1007 ± 194 | 823–1400 | 960 ± 11.9 | 725–1149 |
| Copper, mg/kg | 0.99 ± 0.24 | 0.70–1.60 | 0.47 ± 0.19 | 0.14–0.66 |
| Zinc, mg/kg | 1.66 ± 0.70 | 1.00–4.80 | 0.91 ± 0.47 | 0.60–1.80 |
| P/Al 3 | 10.4 ± 1.10 | 7.87–12.0 | 8.20 ± 1.11 | 5.80–9.90 |
| Soil Properties | Brown Mustard | Buckwheat | Phacelia | Brown Mustard + Pea | Buckwheat + Pea | Phacelia + Pea | Control |
|---|---|---|---|---|---|---|---|
| Soil organic matter, % | 3.07 A± 0.20 | 3.12 A± 0.20 | 3.12 A± 0.20 | 3.00 A± 0.10 | 3.02 A± 0.20 | 3.02 A± 0.10 | 2.32 B± 0.10 |
| pH | 6.82 A± 0.10 | 6.80 AB± 0.30 | 6.77 AB± 0.30 | 6.75 AB± 0.08 | 6.52 AB± 0.10 | 6.35 AB± 0.20 | 6.30 B± 0.20 |
| Phosphorous, mg/kg | 372 NS± 51.5 | 366 NS± 41.5 | 366 NS± 43.2 | 366 NS± 48.7 | 367 NS± 43.1 | 356 NS± 45.8 | 368 NS± 52.5 |
| Potassium, mg/kg | 186 NS± 56.9 | 202 NS± 64.3 | 230 NS± 72 | 180 NS± 48.2 | 184 NS± 47.3 | 201 NS± 67.8 | 189 NS± 35.3 |
| Calcium, mg/kg | 964 A± 236 | 1003 AB± 219 | 981 B± 188 | 965 B± 214 | 974 B± 193 | 1028 B± 249 | 1133 B± 161 |
| Copper, mg/kg | 1.10 AB± 0.19 | 1.13 AB± 0.35 | 0.80 AB± 0.08 | 1.30 A± 0.2 | 1.30 A± 0.2 | 0.93 AB± 0.93 | 0.78 B± 0.02 |
| Zinc, mg/kg | 2.40 NS± 1.50 | 1.30 NS± 0.20 | 1.50 NS± 0.40 | 1.30 NS± 0.10 | 1.80 NS± 0.08 | 1.80 NS± 0.30 | 1.30 NS± 0.20 |
| P/Al 1 | 11.2 NS± 1.14 | 10.9 NS± 0.80 | 10.8 NS± 1.00 | 10.1 NS± 1.0 | 9.90 NS± 1.0 | 9.30 NS± 1.00 | 10.5 NS± 1.30 |
| Soil Health Indicators | Post-Harvest Values | p-Values for Treatments and Interactions 4 | |||
|---|---|---|---|---|---|
| Mean ± S.D. 1 | Range | Tillage | Crop | Tillage × Crop | |
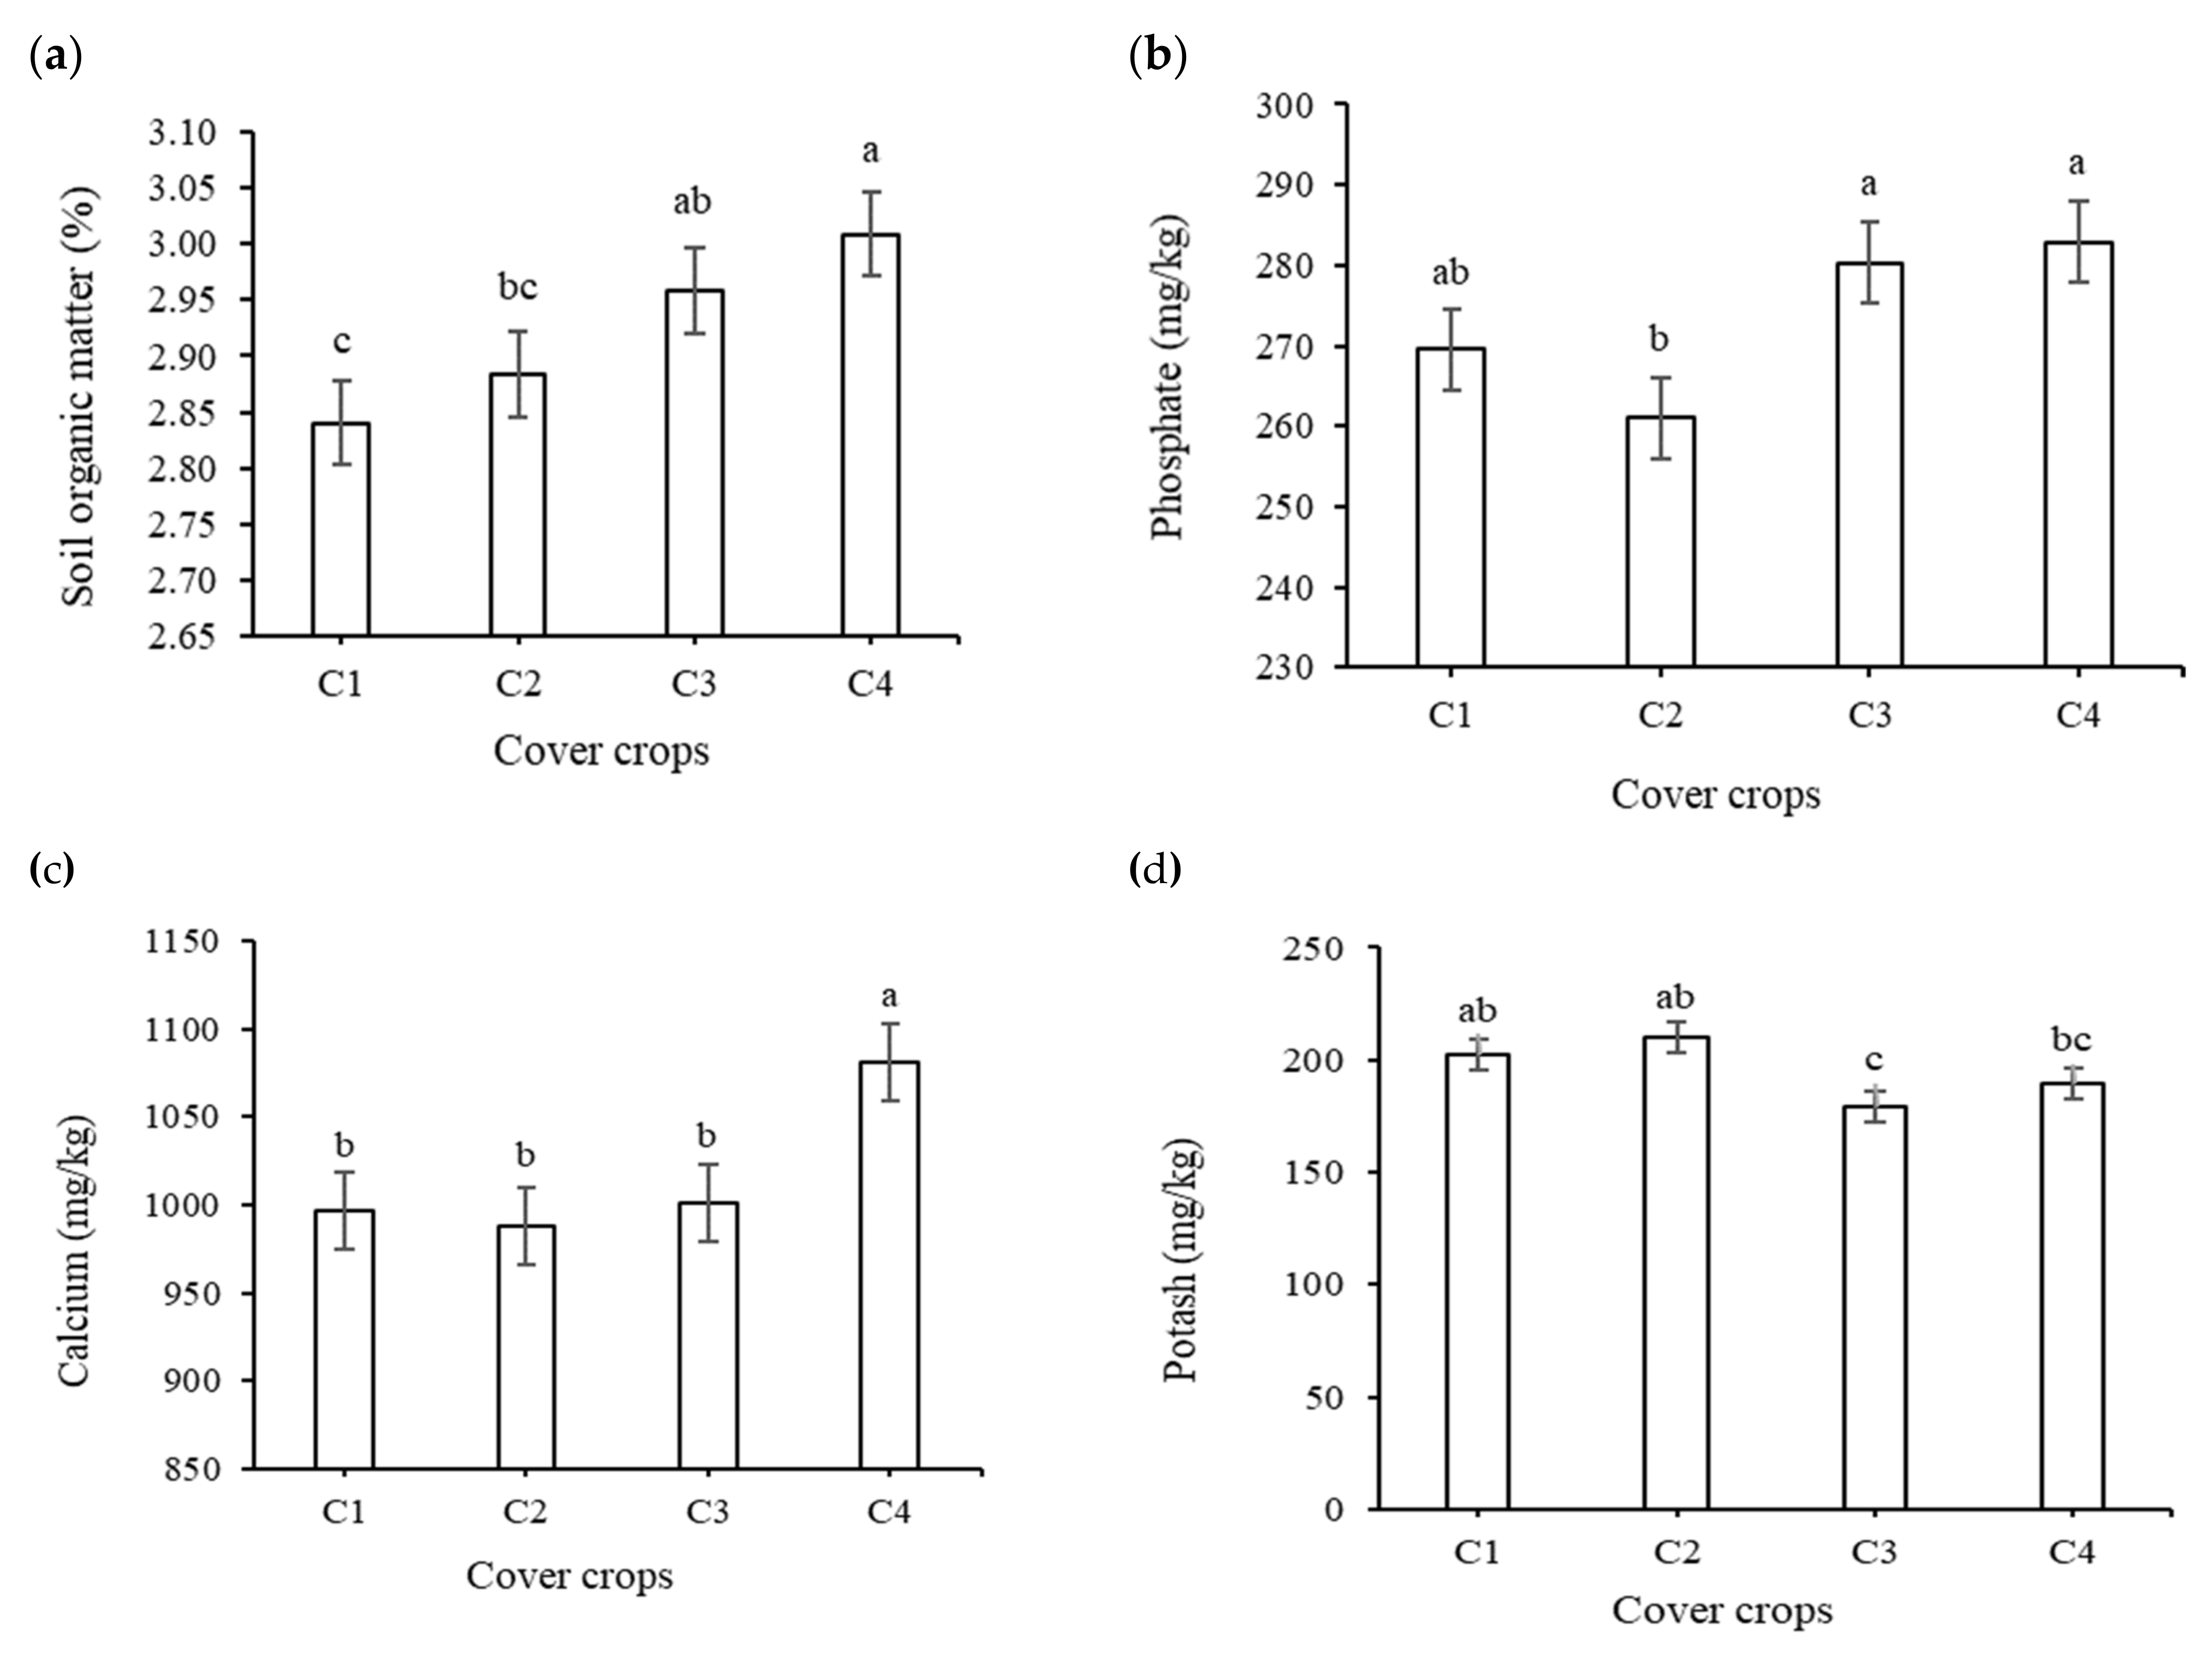
| Soil organic matter, % | 2.92 ± 0.14 | 2.70–3.30 | 0.473 NS | 0.015 * | 0.572 NS |
| pH | 6.66 ± 0.26 | 6.00–7.00 | 0.971 NS | 0.211 NS | 0.896 NS |
| Phosphorus, mg/kg 2 | 273 ± 22.2 | 234 -315 | 0.832 NS | 0.029 * | 0.205 NS |
| Potassium, mg/kg | 195 ± 25.7 | 158–291 | 0.654 NS | 0.016 * | 0.633 NS |
| Calcium, mg/kg | 1016 ± 94.1 | 748–1189 | 0.795 NS | 0.049 * | 0.281 NS |
| Copper, mg/kg | 0.50 ± 0.21 | 0.10–0.90 | 0.386 NS | 0.117 NS | 0.699 NS |
| Zinc, mg/kg | 0.95 ± 0.37 | 0.10–1.80 | 0.726 NS | 0.217 NS | 0.094 NS |
| P/Al 3 | 8.15 ± 1.10 | 5.76–10.1 | 0.234 NS | 0.741 NS | 0.004 NS |
| Tillage × Crops | MeanLSD Letters | Tillage × Crops | MeanLSD Letters |
|---|---|---|---|
| Glyphosate brown mustard | 9.28 a | Mow mix | 8.33 abc |
| Mow disk timothy | 9.18 a | Mow buckwheat | 8.28 abc |
| Mow brown mustard | 9.03 a | Glyphosate buckwheat | 8.14 abc |
| Mow disk mix | 8.74 ab | Mow timothy | 7.83 abcd |
| Mow disk brown mustard | 8.54 abc | Roller crimper mix | 7.37 bcd |
| Roller crimper timothy | 8.43 abc | Mow disk buckwheat | 7.17 cd |
| Roller crimper buckwheat | 8.42 abc | Glyphosate timothy | 6.62 d |
| Glyphosate mix | 8.39 abc | Roller crimper brown mustard | 6.60 d |
Publisher’s Note: MDPI stays neutral with regard to jurisdictional claims in published maps and institutional affiliations. |
© 2021 by the authors. Licensee MDPI, Basel, Switzerland. This article is an open access article distributed under the terms and conditions of the Creative Commons Attribution (CC BY) license (https://creativecommons.org/licenses/by/4.0/).
Share and Cite
Khan, R.; Farooque, A.A.; Brown, H.C.P.; Zaman, Q.U.; Acharya, B.; Abbas, F.; McKenzie-Gopsill, A. The Role of Cover Crop Types and Residue Incorporation in Improving Soil Chemical Properties. Agronomy 2021, 11, 2091. https://0-doi-org.brum.beds.ac.uk/10.3390/agronomy11102091
Khan R, Farooque AA, Brown HCP, Zaman QU, Acharya B, Abbas F, McKenzie-Gopsill A. The Role of Cover Crop Types and Residue Incorporation in Improving Soil Chemical Properties. Agronomy. 2021; 11(10):2091. https://0-doi-org.brum.beds.ac.uk/10.3390/agronomy11102091
Chicago/Turabian StyleKhan, Rimsha, Aitazaz A. Farooque, Helen Carolyn Peach Brown, Qamar U. Zaman, Bishnu Acharya, Farhat Abbas, and Andrew McKenzie-Gopsill. 2021. "The Role of Cover Crop Types and Residue Incorporation in Improving Soil Chemical Properties" Agronomy 11, no. 10: 2091. https://0-doi-org.brum.beds.ac.uk/10.3390/agronomy11102091